factor analysis and the cerebral hemispheres: temporal, occipital and frontal functions
TRANSCRIPT
Nnmpsychohgm, Vol. 30, No 1 I, pp. 963-988. 1992. Printed in Great Bntain.
0028-3932/92 S5.00+000 0 1992 Pergamon Press Ltd
FACTOR ANALYSIS AND THE CEREBRAL HEMISPHERES: TEMPORAL, OCCIPITAL AND FRONTAL FUNCTIONS
DAVID B. BOLES*
Rensselaer Polytechnic Institute, Troy, New York, USA
(Receioed 22 November 1991; accepted 21 July 1992)
Abstract-Three experiments are reported that use a number of lateralized tasks believed to draw on processes localized to the temporal, occipital or frontal lobes. Oblique factor analyses of the resultant asymmetries indicate the existence of nine lateralized functions, characterized as auditory lexical, facial figural, facial motive, spatial attentive, spatial positional, spatial quantitative, tactile tigural, visual lexical, and visual phonetic in nature. Most functions are uncorrelated, but as in an earlier report (BOLES, Neuropsycholoyia 29, 59991, 1991), both positive and negative correlations are observed. These outcomes continue to be consistent with neurodevelopmental theory, and inconsistent with lateralization strength, hemisphericity, and independence views of individual differences in lateralization.
INTRODUCTION
IN A RECENT MULTITASK INVESTIGATION of lateral differences in perception [lo], data were reported from a pilot study and two experiments that supported several major conclusions concerning (a) common functions underlying lateralized tasks, (b) relationships among those functions, and (c) individual differences in lateralization.
Turing first to common functions, factor analyses of the lateral differences produced by 11 tasks indicated the existence of seven lateralized functions. These were characterized as auditory lexical, spatial attentive, spatial positional, spatial quantitative, tactile figural, visual emotional and visual lexical in nature. As is evident from the naming of the functions, it was concluded that asymmetry of function shows at least some modality specificity.
Next, with respect to functional interrelationships and models of individual differences, it was found that the inferred functions were largely uncorrelated even though the possibility of correlation was permitted through the use of oblique rotation in the factor analyses. Thus another major conclusion was that hemispheric asymmetry of function is polypartite and (within a given individual) cannot be characterized as being of similar degree across different functions. In other words, the same individual might be either strongly or weakly lateralized depending on the brain function.
The general rule of independence between functions was, however, violated in certain instances. Specifically, four pairings were found to show nonzero correlations. First, the auditory lexical function produced lateral differences that were negatively related to those resulting from the visual lexical function. For example, a subject with a strong right ear advantage (REA) for the dichotic recognition of digits typically showed only a small right visual field (RVF) advantage for the recognition of words, and vice versa.
*Address for correspondence: David B. Boles, Department of Psychology, Rensselaer Polytechnic Institute, Troy, NY 12065, U.S.A., or via BITNET to USERBWWL@RPITSMTS.
963
964 D. B. BOLES
This and the other three significant correlations were interpreted as consistent with the neurodevelopmental theory of GESCHWIND and GALABURDA [31]. As part of their theory they suggested that retarded development of one cortical area can influence adjacent, homologous, or highly interconnected areas. Specifically it was proposed that adjacent and homologous areas will show relatively increased development, while interconnected areas will show decreased development. Interpreted from a behavioral viewpoint, these relationships could result in correlations between lateral differences produced by functions localized to the areas.
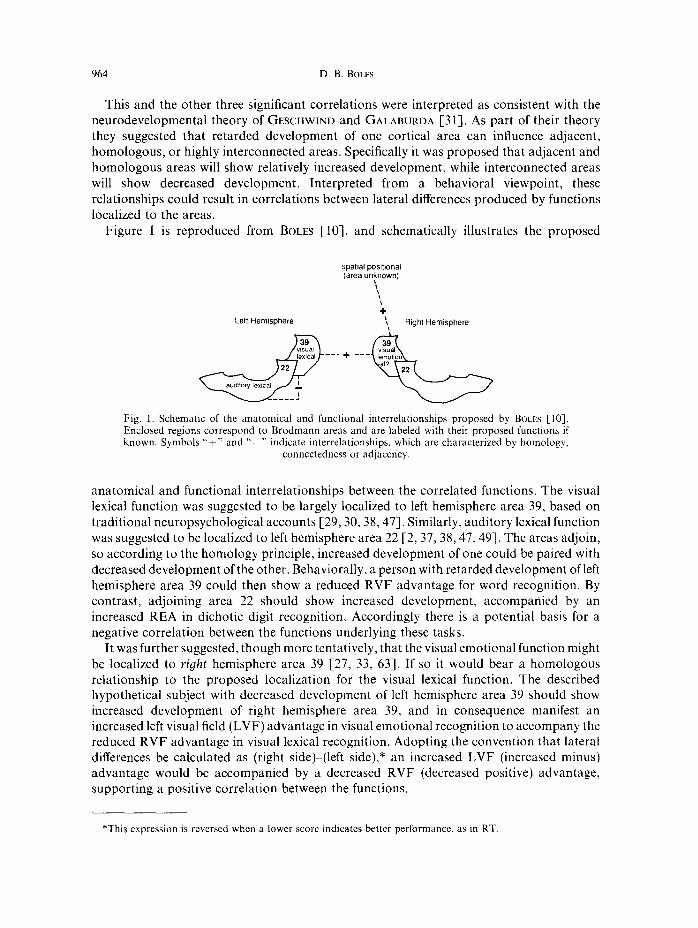
Figure 1 is reproduced from BOLES [lo], and schematically illustrates the proposed
spatial positional (area unyIown)
Left Hemisphere + ’ Rtght Hemisphere \ ,
&---+ ---($&_
Fig. 1. Schematic of the anatomical and functional interrelationships proposed by BOLES [IO]. Enclosed regions correspond to Brodmann areas and are labeled with their proposed functions if known. Symbols “+” and “-” indicate interrelationships, which are characterized by homology.
connectedness or adjacency.
anatomical and functional interrelationships between the correlated functions. The visual lexical function was suggested to be largely localized to left hemisphere area 39, based on traditional neuropsychological accounts [29,30,38,47]. Similarly, auditory lexical function was suggested to be localized to left hemisphere area 22 [2,37,38,47,49]. The areas adjoin, so according to the homology principle, increased development of one could be paired with decreased development of the other. Behaviorally, a person with retarded development of left hemisphere area 39 could then show a reduced RVF advantage for word recognition. By contrast, adjoining area 22 should show increased development, accompanied by an increased REA in dichotic digit recognition. Accordingly there is a potential basis for a negative correlation between the functions underlying these tasks.
It was further suggested, though more tentatively, that the visual emotional function might be localized to right hemisphere area 39 [27, 33, 631. If so it would bear a homologous relationship to the proposed localization for the visual lexical function. The described hypothetical subject with decreased development of left hemisphere area 39 should show increased development of right hemisphere area 39, and in consequence manifest an increased left visual field (LVF) advantage in visual emotional recognition to accompany the reduced RVF advantage in visual lexical recognition. Adopting the convention that lateral differences be calculated as (right side)-(left side),* an increased LVF (increased minus) advantage would be accompanied by a decreased RVF (decreased positive) advantage, supporting a positive correlation between the functions.
*This expression is reversed when a lower score indicates better performance, as in RT.
FACTOR ANALYSIS OF TEMPORAL, OCCIPITAL AND FRONTAL FUNCTIONS 965
Not illustrated in Fig. 1 is a negative correlation found between the auditory lexical and
visual emotional functions. Though significant in BOLES [lo], not much was made of the relationship because it was not completely reliable across experiments. Nevertheless the negative correlation is potentially consistent with the anatomical relationships proposed in Fig. 1. The hypothetical subject under discussion would show an increased REA (increased positive advantage) for the auditory lexical function, paired with an increased LEA (increased negative advantage) for the visual emotional function, resulting in a negative correlation.
The last significant functional intercorrelation was a positive one between the visual emotional and spatial positional functions, both apparently localized to the right hemisphere (Fig. 1). Thus a subject with a large LVF advantage for a visual emotional task also tended to show a large LVF advantage for a spatial positional task. The relationship of this correlation to the neurodevelopmental theory was somewhat unclear because a specific localization for the spatial positional function (other than grossly to the parietal lobe) has not been established in the literature. Nevertheless it was proposed to be due to the connectedness principle under the assumption that the function underlying judgments of visual emotion depends heavily on the function that accurately maps spatial positions. Thus retarded development of the anatomical substrate of one could be accompanied by retarded development of the other, with concomitant covariation of behavioral asymmetries.
The lateralized tasks examined in the earlier report [lo] were largely those believed to involve parietal lobe localization. The purpose of the present research was to expand coverage to tasks thought to rely on temporal, occipital, or frontal functions. Specifically, lateralized tasks covered in an integrative review of the clinical and experimental literature [ 123, and believed to involve localization largely to one of the lobes of interest, were included in the present experiments. It was hoped that factor analytic evidence of new functions would be found, and that relationships among new and old functions would be addressed. A major aim, as in the previous research, was to work incrementally toward identifying all lateralized functions.
EXPERIMENT 1
Oueruiew
Eleven lateralized tasks were selected. Six were “old” tasks taken from the earlier research. representing a reference set to which others could potentially be related in a factor analytic solution. These tasks. dichotic digits, visual lines, locations, tactile forms, facial emotions (previously called “faces”), and visual word numbers, have previously been described at length [lo] and are only briefly described below. The five remaining tasks, dichotic words, visual digits, rhymes, dichotic melodies and visual forms, were the “new” tasks and are described in greater detail. All of the latter were selected because they are believed to involve temporal lobe functions.
METHOD Subjects
Fifty-one subjects participated from undergraduate classes at Rensselaer Polytechnic Institute and received class credit. No restriction was placed on gender. but the predominantly male character of the institution resulted in the selection of 41 males and nine females (with the gender of one subject not recorded). Each was a self-classified right-hander, and with the exception of two subjects who did not finish a questionnaire, also scored as right-handed on the lo-item Edinburgh handedness inventory 1561.
966 D. B. BOLES
Two of the tasks, visual lines and facial emotions, used paper-and-pencil instruments. The Edinburgh handedness inventory was also used, and written questions were given concerning familial handedness.
Five tasks were run on an Apple IIe microcomputer with a color monitor, on a “blue” setting, with the AppleePsych system of experimental control [I]. Depending on the task, responses were made on the console keyboard (locations, visual digits, visual forms) or on a two-key external board (visual word numbers, rhymes).
Three tasks were run using an Aiwa HS-PI2 stereo cassette player with stereo headphones (dichotic digits, dichotic words, dichotic melodies). The remaining task (tactile forms) used nine shapes cut from floor tile as previously described in detail [lo].
Stimuli und procedure
The 11 tasks were administered to subjects following orders specified by four complete, different Latin squares, plus 7 orders from a fifth square. Latin squares were used to balance possible carryover effects that might distort the lateral differences found for each task. For each subject the task set was split into three sessions, approx. 1 to 2 days apart, divided as evenly as possible by approximate running time.
The precise procedures involved in the first six tasks, as well as relationships to previous literature, have been described at length elsewhere [lo]. Brief descriptions and approximate run times are as follows.
(1) Dichotic di<&.s (14 min). The subject heard dichotic digit pairs and repeated them in a percent correct task. In addition, an ear-order-of-report measure was taken and included in the analyses.
(2) Visual lines (5 min). As evenly as possible, and without external aid, the subject attempted to bisect printed lines staggered down a sheet of paper. Displacement relative to the true midpoint was the dependent measure.
(3) Locations (15 min). The subject viewed a lateralized dot presented on a computer screen, and subsequently located it on a grid, typing a letter code into the computer console in a percent correct task.
(4) Tactikforms (20 min). The subject felt a complex form with one hand and attempted to match it to a visual array, as quickly and accurately as possible.
(5) Facial emotions (6 min). The subject saw pairs of chimeric faces in free vision, each member of which was composed of a happy right half and neutral left half, or vice versa. The subject chose the member of each pair that appeared happier.
(6) Visual word numbrrs (12 min). The subject saw the lateralized word names of numbers (e.g. “ONE”) and responded oddeven on a labeled keyboard. with RT and percent correct the dependent measures.
The five “new” tasks are described at greater length. (7) Dichotic words (6 min). The subject heard words presented dichotically and attempted to immediately recall
them. A commercially-available tape was used (DK Consultants, 152 Albert Street, Unit 12, London, Ontario. Canada), consisting of 10 trials of four dichotic pairs each. The words were all of one syllable (e.g. pick, could keen). After each trial the subject named as many as possible, in any order. After the IO trials, the headphones were reversed and the tape replayed for an additional 10 trials. Percent correct was the dependent measure. The tape used has been found to result in a REA 1451. The most common localization of lesions causing deficient auditory verbal comprehension is widely acknowledged to be Wernicke’s area (posterior Brodmann area 22) in the temporal lobe of the left hemisphere [Z, 37, 38, 47, 497.
(8) Visuul digits (9 min). The subject viewed a number on a computer screen and attempted to type it into the computer console. Three-digit numbers were employed, selected at random from the set 100-999. They were presented in a column. In this and some other tasks, bilateral displays were used because they have been found to produce large, significant and reliable field differences 14.6.9.1 I]. A simultaneous arrowhead (” <” or” > “) at fixation cued the proper field for report, with the other field to be ignored. Individual digits subtended 0.4 by 0.7’ horizontally and vertically, and were at 3.5 minimum eccentricity. A column of three digits subtended 2.5” vertically. A trial involved a 750 msec fixation box. followed by a 133 msec blank, a 133 msec stimulus display, a 100 msec blank, and then a I33 msec masking display of Xs. The subject next typed the cued number into the console at his or her own pace. No practice or feedback was given. The task involved 72 trials. 36 per VF, fully randomized. In this and other bilateral tasks, the distractor stimulus was chosen at random. Percent correct was the dependent measure. There is evidence that visual digit recognition produces a RVF advantage. particularly ifmultiple digits are used [3,23,35,40]. It has been suggested that the visual recognition ofdigits is disrupted by lesions of the left temporal lobe 147, 511.
(9) Rhymes (13 min). The subject saw a single letter at the fixation pomt, and three letters on one side in a vertical column. The task was to match the letter at fixation to the center one of the three, as to whether the names rhymed (e.g. KA. PD) or not (c.g. KC, PA). Thirty-six sets of four letters were used. In one-third ofthe sets, the central letter rhymed with the middle letter of the peripheral subset (e.g. “.I” rhyming with “K” in the subset “GKP”). In the other two-thirds of the sets it did not (e.g. “J” not rhyming vvith “C” in the subset “ICI”). This imbalance in rhyming and nonrhyming trials simply duplicates the experiment on which the task was modeled [S]. Displays involved simultaneous presentation of the central letter with the three peripheral letters (stacked vertically). Stimuli subtended 0.4” horizontally and 0.7” vertically, at 2.0’ minimum eccentricity. A column of three letters subtended 2.5’ vertically. The trial involved a 750 msec fixation box, followed by a 100 msec blank and a 150 msec stimulus display. The subject pressed one of two keys to indicate a rhyming or nonrhyming
(10)
(11)
FACTOR ANALYSIS OF TEMPORAL, OCCIPITAL AND FRONTAL FUNCTIONS 967
response, and brief feedback was given as to the RT and correctness of the response. The keys were placed one away from the other in the midline, and one hand was on each key. The key mapping was balanced over subjects. After 36 practice trials, 144 experimental trials were given, consisting of 2 VFs x 36 stimuli x 2 replications, crossed and randomized. RT and accuracy were the dependent measures. A RVF advantage has been found in this task [S]. It is thought that disorders of phonetic decoding, for example in “word deafness”, are primarily due to left temporal lesions [Z, 38,471, although the relevant data are largely from the auditory modality. A recent positron emission tomography (PET) study supports this localization for the visual modality in that the same temporoparietal area was activated by a rhyming words task as was activated by an auditory word task 1603. Dichotic melodies (21 min). The subject heard a dichotic pair of melodies and attempted to identify them. A commercially-available tape was used (DK Consultants), consisting of 12 dichotic trials. Each trial first presented a pair of melodies dichotically for approx. 3.7 set, followed by four successive melodies presented binaurally for approx. 3.7 set each. Two ofthese four melodies matched the dichotic pair, and the subject’s task was to select the proper two. After the 12 trials, the headphones were reversed and the trials repeated. Percent correct was the dependent measure. The tape used was apparently one previously found to produce a LEA [44].* Lesions causing deficits in the recognition of melodies are generally right temporal in nature 138,471. !‘isualforms (15 min). The subject saw a visual form on the screen and subsequently attempted to select it from a visual array, typing in a letter corresponding to the choice. Nine complex random forms were employed. those ihustrated in Ref. 1361, and used as well in the tactile forms task. Seven of the nine were of 20-point complexity (vertices plus inflections), the other two being of 18 and 24 points. All sides of the block-like forms were either horizontal or vertical. A trial began with a 750 msec fixation cross, followed by a 100 msec blank and then a 100 msec bilateral display. A form was shown in each VF accompanied by a central arrowhead cueing the form to be recognized. Forms subtended approx. 4.3” x 4.8” horizontally and vertically, at 2.0’ minimum eccentricity. A response array was displayed a half-second afterward. This consisted of a 3 x 3 array of all nine forms, each form accompanied by a response letter. The subject’s task was to type the appropriate letter into the console. No practice or feedback was given. A block consisted of 54 trials (2 VF x 9 stimuli x 3 replications). After the first block, all forms were rotated 180” in the display plane to create “new” forms, and another block of 54 trials was given. Percent correct was the dependent measure. The forms have previously been reported to result in a LVF advantage [36]. It is claimed that right temporal damage impairs the recognition of abstract visual forms [42, 43. 50, 611, although the temporal localization is not universally accepted 1691.
After the last task of the third session, subjects were given a questionnaire that included the Edinburgh handedness inventory, and questions concerning familial handedness and the subject’s gender.
Following previous procedures [lo], a convention was adopted for scoring the results: (a) VF or ear difference scores were used for measures reflecting independent events in the VFs or ears, and (b) laterality coefficients (LCs) were used for measures reflecting lateral presentations that were dependent on one another. For example, since VF presentations were independent of one another, VF difference scores were calculated, but since the facial emotions task and handedness questionnaire involved a forced choice of one side or the other, LCs were calculated.
The scoring of the visual word numbers, tactile forms and rhymes tasks were handled similarly. Median correct RTs and error percentages were calculated for each side, and subtracted to produce a difference score for each dependent measure. One difference between tasks, however, was that on an a priori basis, a minimum of 60% correct in the word task was required for a subject’s data to be used; in the tactile forms task the required minimum was 29%; and in the rhymes task the required minimum was 74%. The difference derives from the fact that a hypothetical subject pressing a single key on all trials (i.e. not attempting to make discriminations) would achieve 50% correct in the words task, but as much as 67% (if the “nonrhyming” key was pressed) in the rhymes task. The tactile forms task involved picking a palpated form from a visual array of nine choices, so constant selection of a single choice would yield 11% accuracy. The required minimum performances guaranteed a margin of acceptable performance (defined as chance plus 20% of the difference between 100% and chance) that would allow interpretations to be made of the RT data. Most subjects, however, produced accuracies well above the minimums.
For the dichotic digits, locations, dichotic words, visual digits, dichotic melodies, and visual forms tasks, the percentage of stimuli correct was calculated for each field or ear and subtracted (e.g. right ear-left ear). All three digits had to be correct in the visual digits task. As in the previous research, order-of-report was also scored for the dichotic digits task and converted to an LC; details are elsewhere [lo]. An order-of-report measure was attempted for dichotic words, but was abandoned because subjects correctly recalled words on most trials from only one and not both ears (unlike all scored trials in the dichotic digits task, in which digits were recalled from both ears). It did not make sense to derive an order-of-report measure under these conditions because it would be almost perfectly confounded with the ear difference measure. An order-of-report measure was also not practical for dichotic
*However, Kimura’s study used 18 rather than 24 trials. No reason is offered for this discrepancy in materials accompanying the commercial tape.
968 D. B. BOLES
melodies, because the binaural choices were presented sequentially and subjects generally gave their selections in the presented order.
As before [lo], visual lines were scored using a deviation measure, expressed as a percentage of total line length, and given a negative sign if the deviation was to the left of the true midpoint, or a positive sign if to the right. Finally, an LC was calculated for the facial emotions task, as follows: (number of right-face choicessnumber of left-face choices) divided by 36. Side is here defined from the viewer’s perspective, not that of the poser.
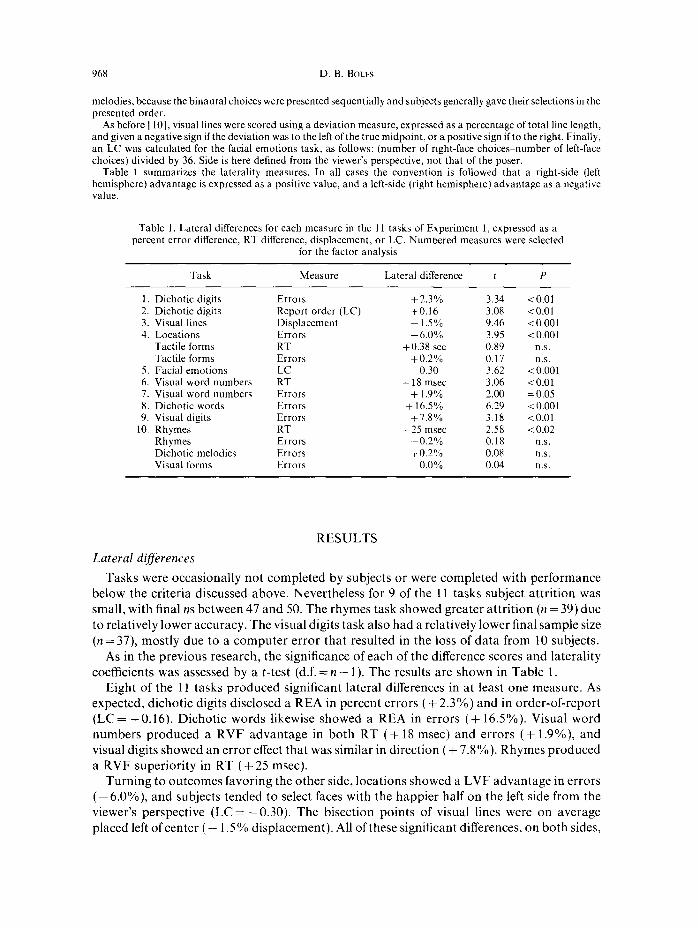
Table 1 summarizes the laterality measures. In all cases the convention is followed that a right-side (left hemisphere) advantage is expressed as a positive value, and a left-side (right hemisphere) advantage as a negative value.
Table 1. Lateral differences for each measure in the 11 tasks of Experiment 1, expressed as a percent error difference, RT difference, displacement, or LC. Numbered measures were selected
for the factor analysis
Task Measure Lateral difference t P
1. Dichotic digits 2. Dichotic digits 3. Visual lines 4. Locations
Tactile forms Tactile forms
5. Facial emotions 6. Visual word numbers 7. Visual word numbers 8. Dichotic words 9. Visual digits
10. Rhymes Rhymes Dichotic melodies Visual forms
Errors Report order (LC) Displacement Errors RT Errors LC RT Errors Errors Errors RT Errors Errors Errors
+2.3% +0.16 - 1.5% - 6.0%
+ 0.38 set +0.2% PO.30
+ 18 msec + 1.9%
+ 16.5% + 7.8%
+ 25 msec -0.2% + 0.2%”
0.0%
3.34 <O.Ol 3.08 <O.Ol 9.46 <O.OOl 3.95 <O.OOl 0.89 ns. 0.17 n.s. 3.62 <O.OOl 3.06 <O.Ol 2.00 =0.05 6.29 < 0.001 3.18 to.01 2.58 <0.02 0.18 n.s. 0.08 ns. 0.04 n.s.
RESULTS
Lateral difleerences
Tasks were occasionally not completed by subjects or were completed with performance below the criteria discussed above. Nevertheless for 9 of the 11 tasks subject attrition was small, with final ns between 47 and 50. The rhymes task showed greater attrition (n = 39) due to relatively lower accuracy. The visual digits task also had a relatively lower final sample size (n = 37), mostly due to a computer error that resulted in the loss of data from 10 subjects.
As in the previous research, the significance of each of the difference scores and laterality coefficients was assessed by a t-test (d.f. = n - 1). The results are shown in Table 1.
Eight of the 11 tasks produced significant lateral differences in at least one measure. As expected, dichotic digits disclosed a REA in percent errors ( + 2.3%) and in order-of-report (LC= +0.16). Dichotic words likewise showed a REA in errors (+ 16.5%). Visual word numbers produced a RVF advantage in both RT (+ 18 msec) and errors ( + 1.9%), and visual digits showed an error effect that was similar in direction (+ 7.8%). Rhymes produced a RVF superiority in RT (+25 msec).
Turning to outcomes favoring the other side, locations showed a LVF advantage in errors (-6.0%) and subjects tended to select faces with the happier half on the left side from the viewer’s perspective (LC = -0.30). The bisection points of visual lines were on average placed left of center (- 1.5% displacement). All of these significant differences, on both sides,
FACTOR ANALYSIS OF TEMPORAL, OCCIPITAL AND FRONTAL FUNCTIONS 969
were in the directions anticipated. No significant differences, however, were found for dichotic melodies, tactile forms, or visual forms.
Factor analysis of lateral dzrerences
Following prior practice [lo], all of the significant lateral differences were included in the factor analysis. The data were arrayed for analysis by the “FACTOR” procedure of SPSS-X [55, 651, with pairwise deletion of missing cases. Extraction of factors was by principal components analysis, with acceptance of all factors having eigenvalues greater than one. Four factors were extracted, respectively, comprising 23.6, 15.0, 13.7 and 12.1% of the variance (64.4% total).
The factors were next rotated using oblique (oblimin) rotation, with delta (a parameter that controls the degree of obliqueness) varied systematically until convergence on a solution was reached in a minimum number of iterations. Again, this followed prior procedure. The final solution used a delta of 0.43 and converged in seven iterations.
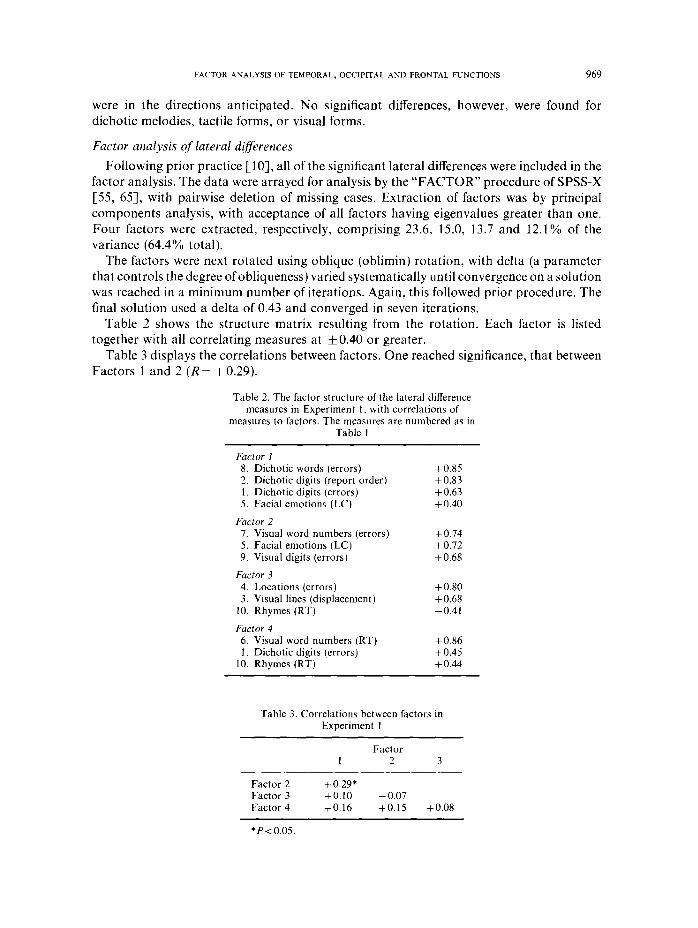
Table 2 shows the structure matrix resulting from the rotation. Each factor is listed together with all correlating measures at f 0.40 or greater.
Table 3 displays the correlations between factors. One reached significance, that between Factors 1 and 2 (R= +0.29).
Table 2. The factor structure of the lateral difference measures in Experiment 1, with correlations of
measures to factors. The measures are numbered as in Table 1
Factor 1 8. Dichotic words (errors) 2. Dichotic digits (report order) 1. Dichotic digits (errors) 5. Facial emotions (LC)
Factor 2 7. Visual word numbers (errors) 5. Facial emotions (LC) 9. Visual digits (errors)
Factor 3 4. Locations (errors) 3. Visual lines (displacement)
10. Rhymes (RT)
Factor 4 6. Visual word numbers (RT) 1. Dichotic digits (errors)
10. Rhymes (RT)
+0.85 +o.s3 +0.63 f0.40
+0.74 +0.72 +0.68
+o.so +0.68 -0.41
+0.86 +0.45 +0.44
Table 3. Correlations between factors in Experiment 1
Factor 1 2 3
Factor 2 +0.29* Factor 3 +0.10 -0.07 Factor 4 +0.16 +0.15 + 0.08
*p<o.o5
970 D. B. BOLES
Subject variables and factor scores
Factor scores were calculated for subjects and correlated to three subject variables: gender, handedness and familial handedness. Dummy-coded as 0 = female and 1 = male, gender had a mean of 0.82 (S.D. =0.39, n= 50). Handedness from the Edinburgh inventory was expressed as an LC as follows: (number of right-hand marks-number of left-hand marks)/total choices (mean= +0.70, S.D. =0.18, n=49). Familial handedness was also expressed as an LC, based on numbers of lst-degree relatives: (number right-handed- number left-handed)/total number (mean = + 0.85, S.D. =0.38, n = 49).
Two correlations of subject variables to factor scores were significant. Factor 4 was correlated with both gender (R= +0.70, P<O.OOl) and handedness (R= -0.48, PcO.01).
DISCUSSION
Experiment 1 succeeded in replicating many of the significant asymmetries as well as some of the factors found in the earlier work [lo]. With the exception of tactile forms, all of the “old” tasks produced significant asymmetries in the expected directions. Furthermore, the first three factors, at least, are interpretable in terms of lateralized functions previously identified.
Factor 1 (see Table 2) is clearly identifiable as the auditory lexical function. Both dichotic digits measures loaded on it, and the new dichotic words measure did as well. Although the facial emotions measure also loaded on the factor, its loading was quite low (+ 0.40), and in any case, as a left-sided superiority it can hardly be due to the same underlying lateralized function as is responsible for the right-sided dichotic superiorities.
Factor 2 also seems identifiable, as the visual lexical function. Both a visual word numbers measure and a visual digits measure loaded on the factor. Visual digits, it might be expected, would have lexical entries similar to words. Note that the failure of the auditory lexical measures to load on the visual lexical factor, and vice versa, is an indication of modality specificity. Also note that while the facial emotions measure loaded on Factor 2, the same argument applies as for Factor 1: this left-sided advantage cannot be due to the same lateralized process underlying the right-sided superiorities otherwise represented on the factor.
The highest loading on Factor 3 was attained by the locations measure, suggesting that this is the previously identified spatial positional factor. The loading of the visual lines measure on the factor is probably a fluke, as it has not done so in any other prior or present experiment.
The identity of Factor 4 is more ambiguous. The highest loading was achieved by a visual word numbers measure, which did not, however, load on Factor 2 as well. It is tempting to interpret Factor 4 in terms of phonetic processing, because both a visual word numbers measure and the rhymes measure loaded on it. However, there are two reasons to discount a phonetic interpretation. First, the rhymes loading is quite low (+ 0.44), and second, it will be shown in Experiments 2 and 3 that measures from the two tasks do not generally load together in any manner consistent with a common function. For the present the identity of Factor 4 is unclear.
Apparently two of the three “new” tasks included in the factor analysis of Experiment 1 tapped into lateralized functions that have been previously identified. The dichotic words task involves the auditory lexical function, and the visual digits task the visual lexical function. The status of the third new task, rhymes, is more ambiguous due to its low loading
FACTOR ANALYSIS OF TEMPORAL, OCCIPITAL AND FRONTAL FUNCTIONS 971
on an unidentified factor (Factor 4). Thus while Experiment 1 supported the existence of some of the previously identified functions, it did not contribute in a clear manner to the identification of new ones.
The largely replicative role of Experiment 1 is also apparent when attention turns to relationships between lateralized functions. The prior conclusion was that most are independent of one another, showing null or nonsignificant intercorrelations. The results of Experiment 1 concur in general outline, with 5 of 6 possible factor pairings resulting in nonsignificant correlations (Table 3). However, while prior work supported the existence of a significant positive correlation between the auditory and visual lexical functions, Experiment 1 found the opposite. This contrary outcome must be considered in light of the full body of current and prior evidence, a matter that will be evaluated in the general discussion section.
The other significant factor correlations found in the previous work all involved the visual emotional function, as described in the introduction. Since this function did not emerge as a separate factor in Experiment 1, its role in factor intercorrelations cannot be determined.
Finally, the ambiguous nature of Factor 4 makes equally ambiguous the two significant correlations between this factor and the subject variables of gender (R= +0.70) and handedness (R= -0.48). There is no indication of a correlation between the subject variables and any of the three identifiable factors.
In summary, the primary value of Experiment 1 lies in its replication of three lateralized functions identified in earlier work, and of the general picture of independence among functions. Two “new” tasks were found to rely on previously identified functions.
Experiment 2 built on the outcomes of Experiment 1 by employing two “new” tasks in conjunction with nine “old” tasks. The new tasks were thought on an a priori basis to involve lateralized processes localized in the occipital lobe.
EXPERIMENT 2
Overview
The “old” tasks were dichotic digits, visual lines, locations, tactile forms, facial emotions, visual word numbers, visual digits, rhymes and visual forms. Seven of these produced significant asymmetries in Experiment 1. Of the other two, the tactile forms task was included because of asymmetries found previously [lo], and the visual forms task was included because it used essentially the same stimuli. The “new” tasks were facial resemblances and colors.
METHOD Subjects
Sixty right-handed subjects participated from the same source as Experiment 1. Forty-seven were male and 13 female.
Apparatus
The old tasks employed the same apparatus as in Experiment 1. The facial resemblances task used a paper-and-pencil instrument, and the colors task used the Apple IIe system with the color monitor.
Stimuli and procedure
The 11 tasks were administered using five complete, different Latin squares, plus five orders from a sixth square. The tasks were split into three sessions as evenly as possible by approximate running time. Because the new tasks involved different stimuli and procedures, each is described separately:
972 D. B. BOLES
(1)
(21
Facial resemblances (6 min). The subject viewed three photographs of expressionless faces, one an original frontal view and the others composites made up either of two mirror-imaged left halves or two mirror-imaged right halves. The task was to select one composite as more resembling the original view. Expressionless photographs of 16 models of mixed race and sex were used. The pictures were mounted in a booklet in one column per page, with the original at the top and the two composites below in random order. In addition each original was printed in reversed orientation and was likewise mounted on a page with two composites, a procedure intended to eliminate any influence of asymmetry in the original face. The full booklet therefore consised of 32 triplets. A previous study with similar stimuli found a predominance of left-composite choices 1321. Disorders offace recognition are most often due to lesions of the occipital lobe, with a predominant though perhaps not exclusive role of the right occipital lobe 119. 22, 38, 667. Colors (14 min). The subject observed a pair of color patches and decided whether they were the same or different in an RT task in which accuracy was also assessed. Members of same pairs were identical, while members of different pairs were from the same color category (e.g. two shades of green). Under such conditions a LVF advantage has usually been obtained [21,34,58]. Six “different” color pairs were used. All were available from the AppleePsych system of experimental control [ 11 and in that system bear the names DBLUE/MBLUE, LBLUEIMBLUE, AQLJAILBLUE, DGREENILGREEN, GREYl/GREYZ and BROWN/ORANGE. Sub- jectively, all pairs appeared to be different shades within the same category, with BROWN resembling a dark orange. All of the colors were also used in “same” pairs (e.g. DBLUE/DBLUE). Color patches subtended 1.4 by 2.2” horizontally by vertically, appeared at 2.6’ minimum eccentricity, and were stacked vertically. A stack subtended 4.9” vertically. Bilateral presentations were used, with a central arrowhead pointing to the pair to be matched. A trial consisted of a 750 msec central fixation cross. a 100 msec blank, and a 150 msec stimulus display. The subject pressed one of two keys to indicate a “same” or “different” response, with key placement and hand mapping as in the rhymes task. Brief feedback was shown. After 48 practice trials, 144 experimental trials were given, consisting of 2 VFs x 2 pair types x 6 stimuli x 2 pair orders x 3 replications. (Pair order refers to which patch was on the top and which on the bottom; it is meaningful only with respect to “different” pairs.) Disordered color perception most often is due to lesions of the right occipital lobe [lS, 47, 641.
As m Experiment 1, subjects were admmlstered a questlonnalre at the completion ot the last session
Scoring
Scoring for “old” tasks was as in Experiment 1. An LC was calculated for the facial resemblances task, as: (number of right-composite choices-number ofleft-composite choices) divided by 32. VF difference scores were calculated for the colors task, separately for RT (based on the median RT in each VF) and percent errors. A minimum of 60% correct performance was adopted as the criterion for the colors task.
RESULTS
Lateral d@erences
Nine of the 11 tasks resulted in minimal attrition of subjects and had final sample sizes between 56 and 60. The exceptions were rhymes, with greater attrition due to the difficulty of the task (n=50), and colors, whose reduced sample size (n=52) was largely due to a computer error resulting in the loss of data from seven subjects.
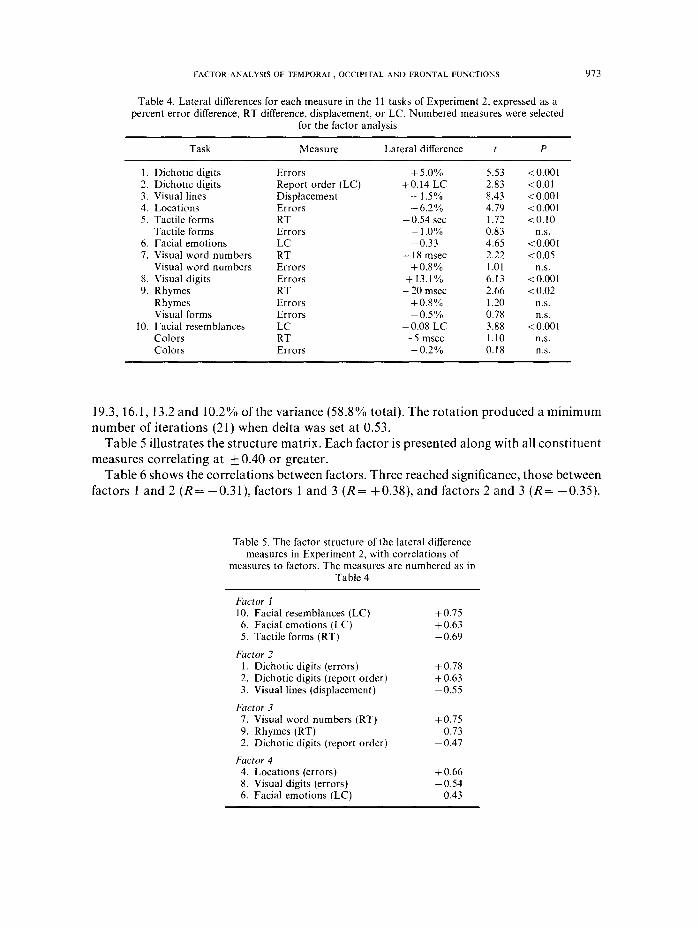
Table 4 displays the lateral differences from all measures as well as their significance by t- test. Nine of the tasks showed at least marginal significance in one or more measures, all in the expected directions. Outcomes favoring the right side included REAs in dichotic listening errors (+ 5.0%) and report order (+ 0.14 LC); and RVF advantages in visual word numbers RT (+ 18 msec), visual digits errors (+ 13.1%), and rhymes RT ( + 20 msec). Those favoring the left side included the displacement measure for visual lines (- 1.5%); a LVF advantage for lcoations errors (- 6.2%); a left hand advantage in tactile forms RT (- 0.54 set); and preponderances of left-side choices in facial emotions (-0.33 LC) and facial resemblances (-0.08 LC). No significant differences were found for the visual forms or colors tasks.
Factor analysis of lateral differences
All of the significant and marginally significant measures were subjected to factor analysis, following the same procedures as Experiment 1. Four factors were extracted, accounting for
FACTOR ANALYSIS OF TEMPORAL, OCCIPITAL AND FRONTAL FUNCTIONS
Table 4. Lateral differences for each measure in the 11 tasks of Experiment 2, expressed as a percent error difference, RT difference, displacement, or LC. Numbered measures were selected
for the factor analysis
Task Measure Lateral difference t P
1. 2. 3. 4. 5.
6. 7.
8. 9.
10.
Dichotic digits Errors +5.0% 5.53 <O.OOl Dichotic digits Report order (LC) +0.14 LC 2.83 <O.Ol Visual lines Displacement - 1.5% 8.43 <O.OOl Locations Errors -6.2% 4.19 <O.OOl Tactile forms RT -0.54 set 1 .I2 <O.lO Tactile forms Errors - I .O% 0.83 ns. Facial emotions LC -0.33 4.65 <O.OOl Visual word numbers RT + 18 msec 2.22 <0.05 Visual word numbers Errors +0.8% 1.01 ns. Visual digits Errors + 13.1% 6.13 <O.OOl Rhymes RT + 20 msec 2.66 < 0.02 Rhymes Errors +0.8% 1.20 n.s. Visual forms Errors -0.5% 0.78 ns. Facial resemblances LC -0.08 LC 3.88 <O.OOl Colors R-T - 5 msec 1.10 n.s. Colors Errors -0.2% 0.18 n.s.
913
19.3, 16.1, 13.2 and 10.2% of the variance (58.8% total). The rotation produced a minimum number of iterations (21) when delta was set at 0.53.
Table 5 illustrates the structure matrix. Each factor is presented along with all constituent measures correlating at & 0.40 or greater.
Table 6 shows the correlations between factors. Three reached significance, those between factors 1 and 2 (R= -0.31) factors 1 and 3 (R= +0.38), and factors 2 and 3 (R= -0.35).
Table 5. The factor structure of the lateral difference measures in Experiment 2, with correlations of
measures to factors. The measures are numbered as in Table 4
Factor 1 10. Facial resemblances (LC) 6. Facial emotions (LC) 5. Tactile forms (RT)
Factor 2 1. Dichotic digits (errors) 2. Dichotic digits (report order) 3. Visual lines (displacement)
Factor 3 7. Visual word numbers (RT) 9. Rhymes (RT) 2. Dichotic digits (report order)
Factor 4 4. Locations (errors) 8. Visual digits (errors) 6. Facial emotions (LC)
+0.75 +0.63 -0.69
+0.78 +0.63 -0.55
+0.75 -0.73 -0.47
+0.66 -0.54 -0.43

914 D. B. BOLES
Table 6. Correlations between factors in Experiment 2
Factor I 2 3
Factor 2 -0.31* Factor 3 +0.38** -0.35** Factor 4 +0.03 +0.17 +0.22
*p<o.o5. **p<o.o1.
Subject variables and factor scores
Factor scores were again calculated for subjects and correlated to the three subject variables of gender (mean = 0.78, S.D. =0.42, n = 60), handedness (mean= +0.76, S.D. = 0.19, n = 60), and familial handedness (mean = + 0.79, S.D. = 0.39, IZ = 60). Two correlations were significant, those between factor 3 and gender (R = -0.30, P~0.05) and factor 4 and handedness (R= $0.48, P<O.OOl).
DISCUSSION
Experiment 2 produced evidence for six of the seven lateralized functions identified in the earlier research [lo]. Factor 1 is largely comprised of the two facial measures, but a high negative loading was also achieved by a tactile forms measure. Thus Factor 1 combines the two functions previously labeled visual emotional and tactile figural, with opposite loadings of the left-superior measures indicating that separate functions are involved. Note that an important conclusion emerging from the factor is that what had been designated the “visual emotional” function might more properly be labeled the “facial figural” function. That is, the loading of the facial resemblances task, involving expressionless faces, with the facial emotions task, may suggest the existence of a lateralized function that concerns facial perception generally.
Factor 2 is plainly identifiable with the auditory lexical function in that the two dichotic dights measures yielded the highest loadings. There is again a negative loading, however, this time by the visual lines measure, from which the existence of the previously identified spatial attentive function may also be inferred. The same lateralized function cannot underlie both tasks because dichotic digits involves a right-side advantage while the visual lines measure involves a left-side advantage (i.e. an overestimation of the left side; see Ref. [lo] for a discussion).
Factor 3 is primarily the visual lexical function, represented by the visual word numbers RT measure. A high negative loading was also achieved by the rhymes RT measure. Since both are right-side advantages, the opposite loading shows that these asymmetries are not due to the same lateralized function. To an extent this conclusion conflicts with the low positive (+0.44) loading of rhymes RT with a visual word numbers measure in Experiment 1. It will be further clarified in Experiment 3, so interpretation of the function represented by the rhymes task is deferred until that time.
Finally, factor 4 is largely comprised of the locations errors measure, and represents a replication of the spatial positional function.
The only previously identified lateralized function not accounted for in these results is the
FACTOR ANALYSIS OF TEMPORAL. OCCIPITAL AND FRONTAL FUNC’TIONS 975
spatial quantitative function. However, its absence is not surprising given that its representative tasks were not included in Experiment 2.
A very interesting outcome of Experiment 2 is the three significant correlations among factors. That between factors 2 and 3 (R= -0.35) is a clear replication of the formerly obtained negative correlation between the auditory and visual lexical functions [lo]. Thus given this and the formerly obtained results, the positive correlation found in Experiment 1 appears to have been an aberration in an otherwise negative pattern. The present negative correlation is leant particular strength by the negative loading of one of the dichotic digits measures on the visual lexical factor (see.Table 5).
A second significant correlation was that between factors 1 and 3 (R= +0.38). This relationship was likewise found before [lo] and represents a positive correlation between the facial figural (previously designated visual emotional) and visual lexical functions.
The third correlation was between factors 1 and 2 (R = -0.31) or between the facial figural and auditory lexical functions. This negative relationship was also found earlier [lo].
It is worth noting that all three significant correlations are consistent with the neuroanatomical model disussed in the introduction and illustrated in Fig. 1. A fuller description and reconsideration of the implications is deferred until the general discussion, however.
Two correlations between subject variables and factors were significant. One was between gender and factor 3 (R= -0.30). Although such correlations can usually be safely interpreted in terms of the laterlaized function represented by the highest-loading measure on the factor, in this instance there were two loadings that were nearly equal in magnitude (to.75 and -0.73). Accordingly the raw correlations between gender and the tasks loading on factor 3 were examined. It was determined that the gender-factor correlation was supported by the raw correlation between gender and rhymes RT (R= +0.23) and not that between gender and visual word numbers RT (R = + 0.03). The nature of the correlation is such that males showed larger RVF advantages on the rhymes task than did females, consistent with the general trend reported in the literature toward greater male lateralization of function [ 161.
The second correlation was that between handedness and factor 4 (R= +0.48). The nature of the correlation is such that stronger right-handers showed weaker lateralization of the spatial positional function. Thus the relationship is supported by the raw correlation between handedness and the locations errors measure (R= +0.31). The finding is in opposition to the trend in the literature toward greater lateralization in stronger right- handers [16].
In summary, Experiment 2 provided evidence of six lateralized functions characterized as facial figural, tactile figural, auditory lexical, spatial attentive, visual lexical and spatial positional. Some indication also existed ofa seventh function represented by the rhymes task, but a characterization is deferred pending further clarification. Also, correlations were found among factors representing the auditory lexical, visual lexical and facial figural functions that were consistent with the neuroanatomical model described in the introduction. Finally, two correlations were found between subject variables and factor scores, with one of these (gender to factor 3) consistent with greater male lateralization.
Experiment 3 introduced three entirely “new” tasks along with two others used in the prior work [lo] but not employed in the first two experiments of the present research. Eight “old” tasks were also used. The “new” tasks were thought on a a priori basis to involve lateralized functions localized to the frontal lobe.
976 D. B. BOLES
Overview
EXPERIMENT 3
The “old” tasks were dichotic digits, visual lines, locations, tactile forms, facial emotions, visual word numbers, visual digits and rhymes. The two tasks previously used [lo] but not in the current research were typing and bargraphs. The entirely new tasks were Stroop naming, posed emotions and facial mobility.
METHOD Suhjrc,ls
Sixty-five right-handed subjects participated, from the same source as the first two experiments. Fifty were male and 15 female.
Appuratus
The old tasks used the same apparatus as Experiments 1 and 2. The typing, bar-graphs and Stroop naming tasks all used the Apple Be microcomputer system, with the addition of an IntroVoice I voice recognition board in the case of the Stroop naming task. This device recognizes spoken responses and returns vocal RTs, with acceptable temporal precision 171. The posed emotions and facial mobility tasks involvrcd color photographs taken uith a 35 mm camera with hash attachment.
Stimuli und prowdure
The 13 tasks were administered using five complete different Latin squares, with the tasks split as evenly as possible (by approximate running time) into three sessions. Stimuli and procedures for the typing and bargraphs tasks have been described elsewhere [lo] and are only briefly summarized here. (I ) Typimq (13 min). The subject viewed lateralized near-threshold words and typed them into the computer
console in an untimed percent correct paradigm. (2) Btrryraph (I 5 min). The subject saw laterahzed bargraphs representing whole numbers of I X and responded
odd even on a labeled keyboard in a RT task. Details of the three “new” tasks are as follows: (3) Stump namiq (18 min). The subject saw the word names of colors (e.g. “RED”) written in the SHDIC <jr ditferent
monitor colors. and responded by naming the monitor color in a RT task. The colors red. blue and green vverc employed both for the word names of colors and for the monitor colors in which the names vvcrc printed. Consistent stimuli were the words RED. GREEN and BLUE printed on the momtor screen in the same color. Conflicting stimuli were RED printed in blue, RED in green. BLUE in green, BLUE rn red, GREEN in red and GREEN in blue. Stimuli subtended I.1 horizontally and 5.1-9.5 vertically, at a minimum eccentricity of 2.3 Bilateral displays were used, with an arrowhead at fixatton indicating the stimulus to respond to. The task was run by first training the voice recognition board to recognize the subject’s color name utterances. and then starting the experimental program. A trial showed a 750 msec fixation cross, a 100 msec blank and a 100 msec stimulus display. The subject’s task was to name the monitor color in which the word was printed (not the word itself) as quickly and accurately as possible. after which brief feedback uas shown. After 24 practice trials. 144 experimental trials were given. consisting of 2 VFs x 2 stimulus types x 6 stimuli x 6 replications. (For the consistent stimulus type there wcrc only three sttmuh. so each was shown tutce as frequently as the conthcting stimuli.) Typically there is interference when the word name and monitor color arc drlferent. and some evidence suggests that the interference is greater rn the RVF [2X. 41. 671. P~KKET [S9] observed increased Stroop interference in patients with left frontal lesions. and suggested that it is due to reduced suppression of the verbal code.
(4) Posutl wm)tions (4 mln). The subject posed happy and disgusted emotions and was photographed for later scoring of asymmetry of expression. Subjects were photographed twice in full-face vita agamst a neutral background. once after instructions to “look happy” and then after instructions to “look disgusted” In general there is a tendency toward greater expressiveness on the left side of the face (from the poser’s vienpoint ). supporting a right hemisphere role in emotional expression [l3. 26. 52. 721. Frontal lobe lesions disrupt factal expression, and right frontal lesions are more disruptive than left [IS, 33. 717.
(5) Facitrl mhility (4 mm). The subject was photographed while making urnlateral eye winks and whrle unilaterally drawing back the corner of the mouth. for later scoring of asymmetry. Photographs wcrc taken as in the posed emotions task, but after instructions (a) to mov’c one corner of the mouth outward and upward toward the eye. as far as possible. and (b) to wink with onecye. These unilateral movsemcnts were performed succe5sivel~ on each side, in counterbalanced order across subjects. However. the mouth movements were always performed before the winks. Typically the left side of the face (from the poser’s viewpoint) shows greater mobilrty. suggesting a
FACTOR ANALYSIS OF TEMPORAL, OCCIPITAL AND FRONTAL FUNCTIONS 977
larger right than left hemisphere role in facial mobility [14,26,52]. Lesions causing facial apraxia are frontal in nature 138, 46, 711.
As before, subjects received a questionnaire following completion of the third session.
“Old” tasks were scored as in Experiments 1 and 2. For the typing task, the percentage of stimuli correct was calculated for each field and subtracted. For the bargraphs task, a difference score was calculated not only for the percentage correct but also for the median RT in each field. For the Stroop naming task, median RTs and errors were scored separately in the four conditions resulting from a crossing of the design factors VF (left vs right) and conflict condition (conflicting vs congruent).
“Happy” pictures from the posed emotions task were cut evenly down the medial axis of the face, and the two halves were mounted one above the other on heavy paper, in random order. Each page was numbered and placed in a looseleaf binder. A second such book was also constructed using second copies of the same pictures, with the reverse order of mounting (e.g. a page with the left half on top in one book would have a corresponding page in the other book with the left half on the bottom). The order ofsubjects within each book was random. Two other books were similarly constructed for the “disgusted” pictures.
The “mouth movement” and “winking” pictures from the facial mobility task were mounted in books in a similar manner except that only the expressive halves of pictures were used. For example, the left half of a “winking” photo in which the subject was winking on that side, was combined on a page with the right half winking from a different photo of the same subject.
The face books were subsequently scored for asymmetry by 16 naive subjects who served as judges. Each judge scored four books, one for each emotion or facial movement, with all books scored equally often. The order of scoring was counterbalanced with a Latin square design. For a given book a judge was given a scoring sheet with a numbered blank for each page, as well as task-appropriate instructions to make a forced choice for each page, of the half-face that appeared happier. or more disgusted, or showed greater movement of muscles controlling the eye- wink or mouth.
For each of the 16 judges choices were tallied, and the results were used as an index of asymmetry. For example, if all I6 chose the left half of a subject’s face as happier, this was taken as an extreme asymmetry. The assumption is that a face with no asymmetry should result in a roughly equal distribution ofchoices (i.e. eight choices ofeach side). It is also assumed that the splitting of the faces and their top-bottom mounting militates against contamination of the scoring by the judges’ own perceptual asymmetries. In this regard, (a) previous studies have been able to find expressive asymmetries using scoring by judges [17, 241, and (b) any contamination by judges’ perceptual asymmetries should operate ugainst finding expressive asymmetries, because perceptual asymmetries favor the right side of the face from the poser’s perspective (the left side from the judges’ perspective), not the other side as supported by the aforementioned literature.
Tallies were converted to an LC as follows: (number of right-side choicessnumber of left-side choices) divided by 16. Again, for expressive asymmetries “side” is from the poser’s perspective, so a negative LC indicates greater right hemisphere expressiveness.
RESULTS
Lateral differrwces
Eleven of the 13 tasks showed minimal attrition of subjects and had final sample sizes of 61-65. The two exceptions were the rhymes task with 56 subjects due to relatively lower accuracy, and the facial mobility task with 48 subjects due to experimental error in following the protocol, that resulted in one or both of the movements not being tested.
Table 7 shows the lateral differences and their significance. Most were statistically analyzed as before, but three of the new tasks, namely Stroop naming, posed emotions and facial mobility, had factorial designs requiring more complex analyses.
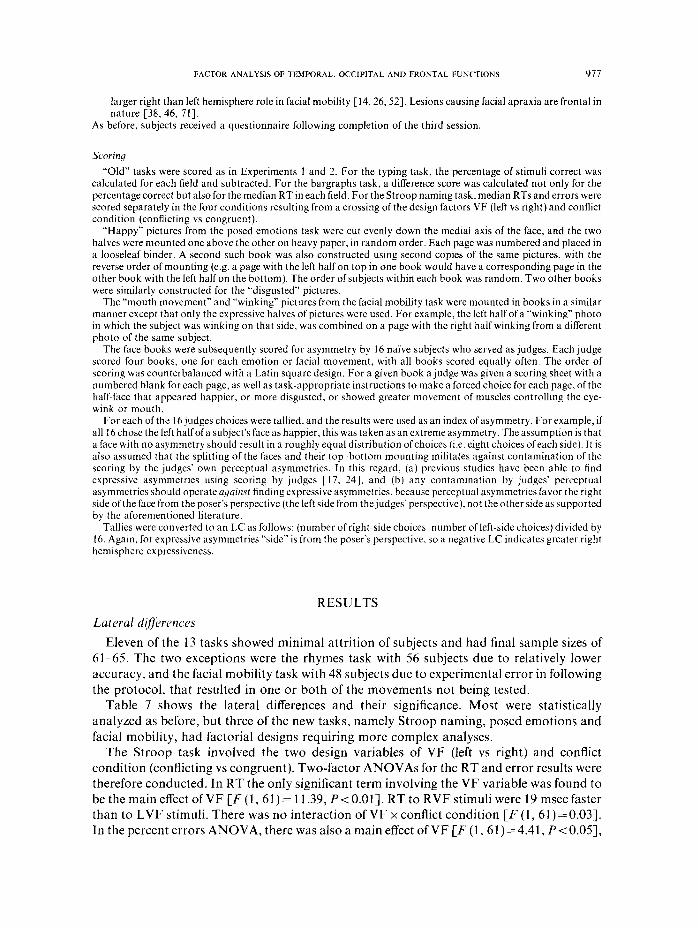
The Stroop task involved the two design variables of VF (left vs right) and conflict condition (conflicting vs congruent). Two-factor ANOVAs for the RT and error results were therefore conducted. In RT the only significant term involving the VF variable was found to be the main effect of VF [F (1, 61) = 11.39, P-cO.011. RT to RVF stimuli were 19 msec faster than to LVF stimuli. There was no interaction of VF x conflict condition [F (1, 61) = 0.033. In the percent errors ANOVA, there was also a main effect of VF [F (1, 61) = 4.41, P < 0.05],

978 D. B. BOLES
Table 7. Lateral differences for each measure in the 13 tasks of Experiment 3, expressed as a percent error difference, RT difference, displacement, or LC. Numbered measures were selected
for the factor analysis
Task
1. Dichotic digits 2. Dichotic digits 3. Visual lines 4. Locations 5. Tactile forms
Tactile forms 6. Facial emotions 7. Visual word numbers
Visual word numbers 8. Visual digits 9. Rhymes
Rhymes 10. Typing 11. Bargraphs 12. Bargraphs
Stroop naming 13. Stroop naming
Stroop naming Stroop naming Posed emotions Posed emotions Facial mobility
14. Facial mobility
Measure
Errors Report order (LC) Displacement Errors RT Errors LC RT Errors Errors RT Errors Errors RT Errors Conflicting RT Congruent RT Conflicting errors Congruent errors
Happy LC Disgusted LC Mouth movement LC Eye-wink LC
Lateral difference
f1.4% +0.10 LC
- 1.3% -3.4%
-0.50 set 0.0%
-0.22 + 20 msec
-0.7% +8.2%
+15msec + 1.0% +6.9%
- 30 msec -2.4%
+ 20 msec + 18 msec
-2.1% +o.l%
-0.02 LC -0.07 LC
-0.03 LC -0.19 LC
I P
3.38 <O.Ol 2.01 10.05 8.60 <O.OOl 3.08 10.01 1.74 10.10 0.09 IIS.
3.67 <o.oot
2.60 10.02 1.10 ns. 3.28 co.01 1.64 n.s. 1.17 n.s. 2.65 <0.02 3.40 <O.Ol 3.22 <O.Ol 2.24 <0.05 2.81 <O.Ol 2.64 <0.02 0.11 ns. 0.36 n.s. 1.52 ns.
0.40 n.s. 2.48 <0.02
but the difference was opposite to that in RT: errors were 1 .O% lower in the LVF than in the RVF. There was also a VF x conflict condition interaction [F (1,61) = 4.49, P < 0.05]. The nature of this was such that the LVF advantage in errors applied only to conflicting stimuli (- 2.1%) and not to congruent stimuli (+ 0.1%). Taking the results overall it appears that conflicting stimuli showed a speed-accuracy trade-off in which responses were faster in the RVF (+20 msec) but more accurate in the LVF (-2.1%). In contrast, congruent stimuli produced a true asymmetry in that RTs were faster in the RVF (+ 18 msec), a difference that was not offset in errors (+O.l %).
The posed emotions task involved two emotions, happy and disgusted. Results were analyzed separately for the two, and as shown in Table 7, neither produced significant asymmetry, Nor was there an asymmetry when the scores were summed across emotions [t (61)= 1.231.
The facial mobility task involved two movements, eye-winking and mouth movement. These were also analyzed separately. As Table 7 indicates, there was significant asymmetry for eye-winking (LC= -0.19) but not for mouth movement (LC= -0.03).
All other significant asymmetries were as expected. Right-sided (left hemisphere) advantages included those for dichotic digits errors ( + 1.4%) and report order ( + 0.10 LC), visual word numbers RT (+20 msec), visual digits errors (+8.2%) and typing errors (+ 6.9%). Left-sided (right hemisphere) advantages were found for visual lines displacement (- 1.3%), locations errors (-3.4%), facial emotions LC (-0.22 LC), bargraphs RT (- 30 msec), and bargraphs errors (-2.4%). There was also a marginally significant asymmetry for tactile forms RT (-0.50 set).
FACTOR ANALYSIS OF TEMPORAL, OCCIPITAL AND FRONTAL FUNCTIONS 979
Factor analysis of lateral difSerences
All significant and marginally significant measures were included in the factor analysis, with the exception of the two Stroop naming “conflicting” measures. As indicated, these showed evidence of speeddaccuracy trade-off and were excluded for that reason. Also included in the factor analysis was the rhymes RT measure. Although this did not reach significance [t (55) = 1.641, it was not far off (P= 0.1 l), the absolute level of the asymmetry was fairly large (+ 15 msec), and it did reach significance in Experiments 1 and 2. Fourteen measures were therefore included, numbered as in Table 7.
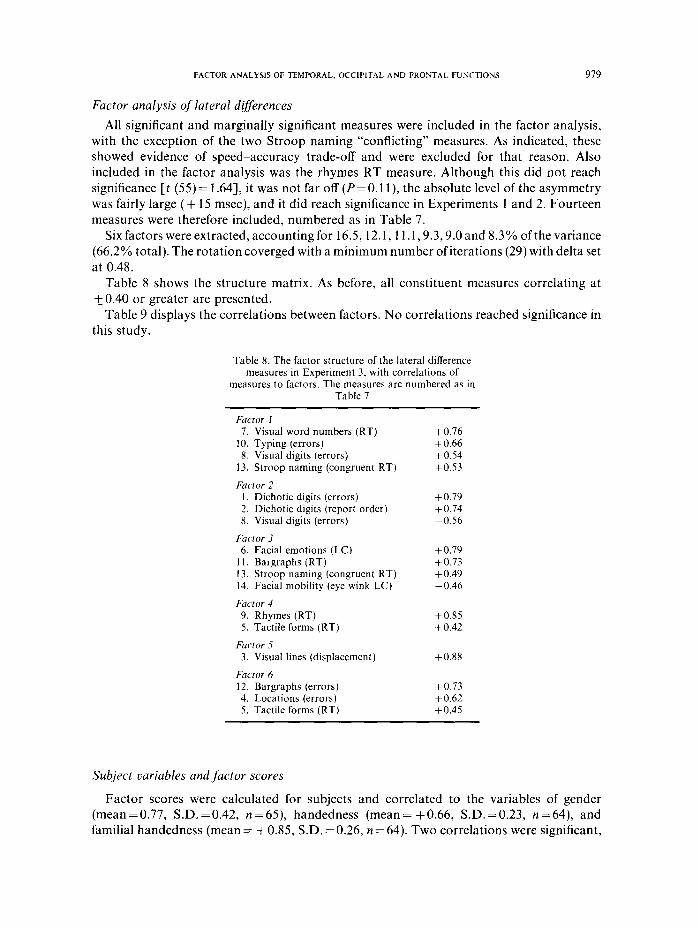
Six factors were extracted, accounting for 16.5, 12.1,ll.l) 9.3,9.0 and 8.3% of the variance (66.2% total). The rotation coverged with a minimum number of iterations (29) with delta set at 0.48.
Table 8 shows the structure matrix. As before, all constituent measures correlating at + 0.40 or greater are presented.
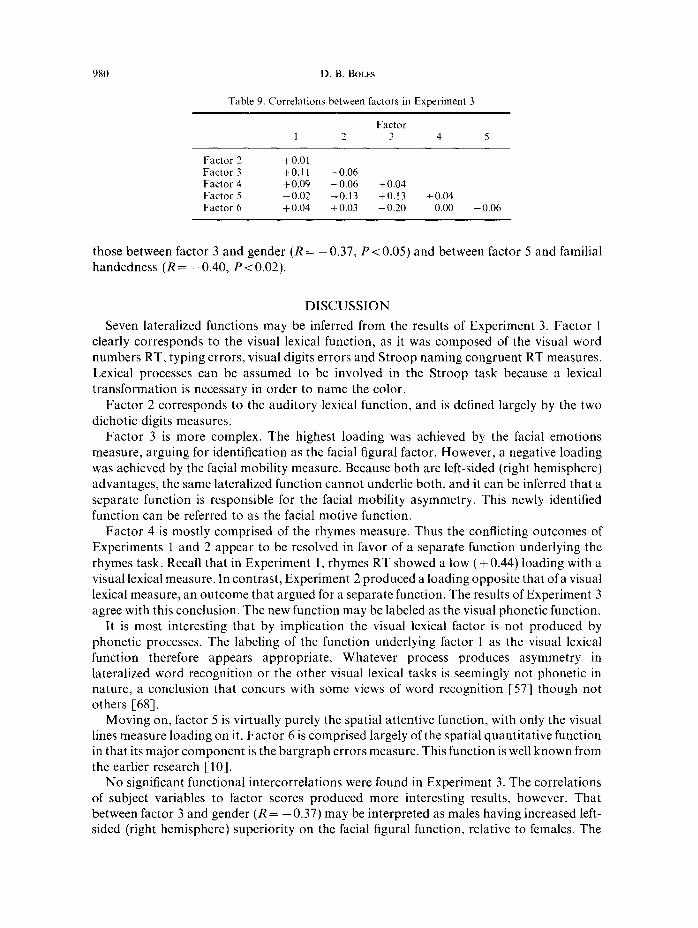
Table 9 displays the correlations between factors. No correlations reached significance in this study.
Table 8. The factor structure of the lateral difference measures in Experiment 3, with correlations of
measures to factors. The measures are numbered as in Table 7
Factor 1 7. Visual word numbers (RT)
10. Typing (errors) 8. Visual digits (errors)
13. Stroop naming (congruent RT)
Factor Z 1. Dichotic digits (errors) 2. Dichotic digits (report order) 8. Visual digits (errors)
Factor 3 6. Facial emotions (LC)
11. Bargraphs (RT) 13. Stroop naming (congruent RT) 14. Facial mobility (eye wink LC)
Factor 4 9. Rhymes (RT) 5. Tactile forms (RT)
Factor 5 3. Visual lines (displacement)
Factor 6 12. Bargraphs (errors) 4. Locations (errors) 5. Tactile forms (RT)
+0.76 f0.66 +0.54 +0.53
+0.79 +0.74 -0.56
+0.79 +0.73 f0.49 -0.46
+0.85 +0.42
+0.88
+0.73 +0.62 +0.45
Subject variables and factor scores
Factor scores were calculated for subjects and correlated to the variables of gender (mean = 0.77, S.D. = 0.42, n = 65), handedness (mean = + 0.66, SD. = 0.23, n = 64), and familial handedness (mean = + 0.85, S.D. = 0.26, IZ = 64). Two correlations were significant,
980 D. B. BOLES
Table 9. Correlations between factors in Experiment 3
Factor 1 2 3 4 5
Factor 2 -to.01 Factor 3 +0.11 -0.06 Factor 4 +0.09 -0.06 +0.04 Factor 5 -0.02 -0.13 +0.13 +0.04 Factor 6 + 0.04 +0.03 +0.20 0.00 -0.06
those between factor 3 and gender (R = - 0.37, P < 0.05) and between factor 5 and familial handedness (R = -0.40, P < 0.02).
DISCUSSION
Seven lateralized functions may be inferred from the results of Experiment 3. Factor 1 clearly corresponds to the visual lexical function, as it was composed of the visual word numbers RT, typing errors, visual digits errors and Stroop naming congruent RT measures. Lexical processes can be assumed to be involved in the Stroop task because a lexical transformation is necessary in order to name the color.
Factor 2 corresponds to the auditory lexical function, and is defined largely by the two dichotic digits measures.
Factor 3 is more complex. The highest loading was achieved by the facial emotions measure, arguing for identification as the facial figural factor. However, a negative loading was achieved by the facial mobility measure. Because both are left-sided (right hemisphere) advantages, the same lateralized function cannot underlie both, and it can be inferred that a separate function is responsible for the facial mobility asymmetry. This newly identified function can be referred to as the facial motive function.
Factor 4 is mostly comprised of the rhymes measure. Thus the conflicting outcomes of Experiments 1 and 2 appear to be resolved in favor of a separate function underlying the rhymes task. Recall that in Experiment 1, rhymes RT showed a low (+ 0.44) loading with a visual lexical measure. In contrast, Experiment 2 produced a loading opposite that of a visual lexical measure, an outcome that argued for a separate function. The results of Experiment 3 agree with this conclusion. The new function may be labeled as the visual phonetic function.
It is most interesting that by implication the visual lexical factor is not produced by phonetic processes. The labeling of the function underlying factor 1 as the visual lexical function therefore appears appropriate. Whatever process produces asymmetry in lateralized word recognition or the other visual lexical tasks is seemingly not phonetic in nature, a conclusion that concurs with some views of word recognition 1571 though not others [68].
Moving on, factor 5 is virtually purely the spatial attentive function, with only the visual lines measure loading on it. Factor 6 is comprised largely of the spatial quantitative function in that its major component is the bargraph errors measure. This function is well known from the earlier research [lo].
No significant functional intercorrelations were found in Experiment 3. The correlations of subject variables to factor scores produced more interesting results, however. That between factor 3 and gender (R = - 0.37) may be interpreted as males having increased left- sided (right hemisphere) superiority on the facial figural function, relative to females. The
FACTOR ANALYSlS OF TEMPORAL, OCCIPITAL AND FRONTAL FUNCTIONS 981
finding is consistent with the trend in the literature toward increased male lateralization of function [ 161. Equally consistent with the literature [ 161 is the negative correlation between familial handedness and factor 5, interpretable as subjects with strong right-handed families showing increased left-sided (right hemisphere) asymmetry on the visual lines task.
GENERAL DISCUSSION
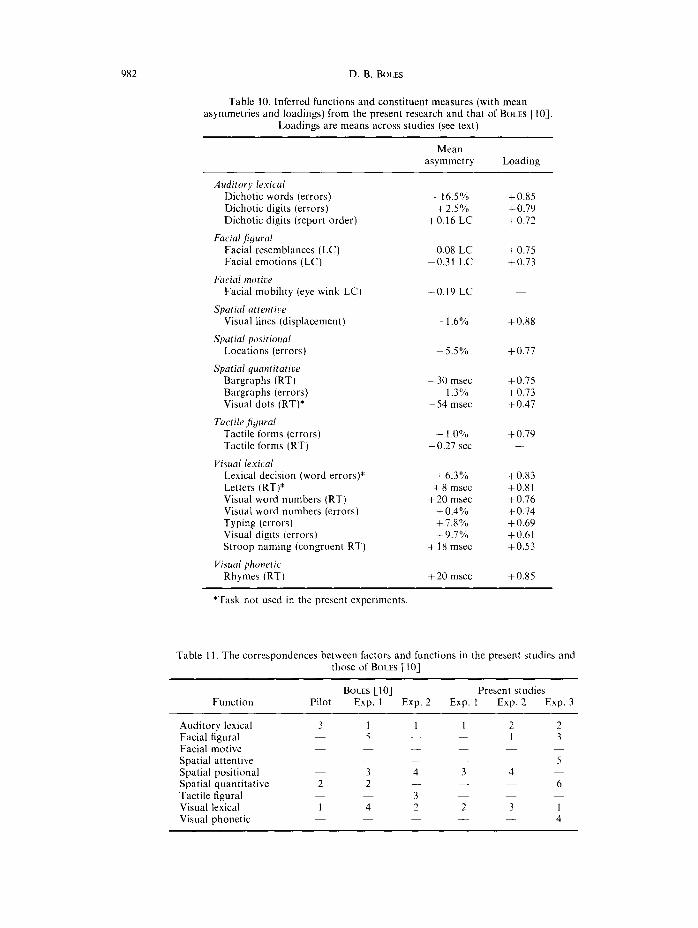
Together Experiments l-3 support the existence of nine lateralized functions, two of these representing new findings. Table 10 names all along with their constituent measures. For convenience and to provide a cumulation of all results, measures not used in the present research but verified previously [lo] are also included. The measures are ordered under their parent functions according to their mean loadings across all experiments (past and present) on factors representing the parent functions.*
It can be seen that four of the nine functions are represented by measures from more than one task: auditory lexical (2 tasks), facial figural (2) spatial quantitative (2), and visual lexical (6). One additional function (tactile figural) is represented by more than one measure from the same task. Thus a picture emerges ofcommon lateralized functions underlying more than one task and measure, which was one of the original assumptions of this factor analytic research.
Another aspect of the emerging picture is that there is at least some modality specificity of lateralized functions. Most notably, visual and auditory lexical tasks load on separate factors. This is not an artifact of methodology in that there are several largely independent factors involving visual tasks. Indeed, there are even two separate factors involving visual presentations of alphabetic stimuli (visual lexical and visual phonetic). Thus the modality specificity of the visual and auditory lexical factors cannot be attributed to the loading together of all visual (or visual alphabetic) vs all auditory measures. The implication is that lateralized functions themselves can be modality specific.
For the most part the functions in Table 10 are independent from one another in the sense that the degree of lateralization of one does not correlate to the degree of lateralization of another. Important exceptions, however, have been found in both the present and prior work.
In order to assess correlations between functions and across studies, a meta-analytic approach was taken. First, correspondences between factors and functions were defined. In general, the highest-loading measure on a factor (in a particular study) was used to identify the function underlying the factor. Table 11 shows the correspondences defined in this manner. All functions had a corresponding factor in at least one study, with one exception. The exception was the facial motive function, inferred in Experiment 3 from an opposite loading on a factor otherwise dominated by another function.
Meta-analyses were next conducted on the correlations between the functions, across all six studies, using the Stouffer method [62]. The method requires that one-tailed significance levels of comparisons (here, the significance of correlations between functions) be assessed, converted to z-scores, summed and divided by the square root of the number of studies (e.g.
*A measure was sometimes used in an experiment but did not not produce evidence of its parent function (for example, in Experiment 3, tactile forms RT did not produce an identifiable tactile figural function). A measure also sometimes resulted in an inferred function but loaded on a factor dominated by another function (e.g. the facial mobility measure in Experiment 3). In neither case were loadings of such measures used for purposes of Table 10. Also note that mean loadings were calculated using the R-to-z transformation and back-transformation.
982 D. B. BOLES
Table 10. Inferred functions and constituent measures (with mean asymmetries and loadings) from the present research and that of BOLES [IO].
Loadings are means across studies (see text)
Mean asymmetry Loading
Auditory lelicul Dichotic words (errors) Dichotic digits (errors) Dichotic digits (report order)
Fucial ,jyural Facial resemblances (LC) Facial emotions (LC)
Facial motire
Facial mobility (eye wink LC)
Spatial attentiw
Visual lines (displacement)
Spatial positional Locations (errors)
Spatial quanritatioe Bargraphs (RT) Bargraphs (errors) Visual dots (RT)*
Tuctile,fiyural
Tactile forms (errors) Tactile forms (RT)
Visual lrxical Lexical decision (word errors)* Letters (RT)* Visual word numbers (RT) Visual word numbers (errors) Typing (errors) Visual digits (errors) Stroop naming (congruent RT)
Visual phonetic
Rhymes (RT)
+ 16.5% +2.5%
+0.16 LC
-0.08 LC -0.31 LC
-0.19 LC
- 1.6%
5.5%
- 30 msec - 1.3%”
- 54 msec
- 1.0% -0.27 set
+6.30/o + 8 mscc
+ 20 msec +0.40/u + 7.8% + 9.7%
+18 msec
+ 20 msec
+o.n5 f0.79 +0.72
+0.75 +0.73
+0.88
+0.77
+0.75 +0.73 +0.47
+0.79
+0.83 +0.81 +0.76 +0.74 +0.69 +0.61 +0.53
+0.x5
*Task not used in the present experiments
Table I I. The correspondences between factors and functions in the present studies and those of BOLES [ 101
Function Pilot BOLES [IO]
Exp. 1 Exp. 2 Present studies
Exp. 1 Exp. 2 Exp. 3
Auditory lexical 3 Facial figural Facial motive Spatial attentive Spatial positional Spatial quantitative 2 Tactile figural Visual lexical 1 Visual phonetic
1 1 5
_
3 4 2
3 4 2
-
I 2 2 1 3
5 3 4
6 -
2 3 1 4
FACTOR ANALYSlSoFTEMPORAL,OCClPlTAL ANDFRONTALFUNCTIONS 983
n = 6). The result is a score here denoted as z’, whose significance (here denoted as P’) is evaluated as with any z-value.
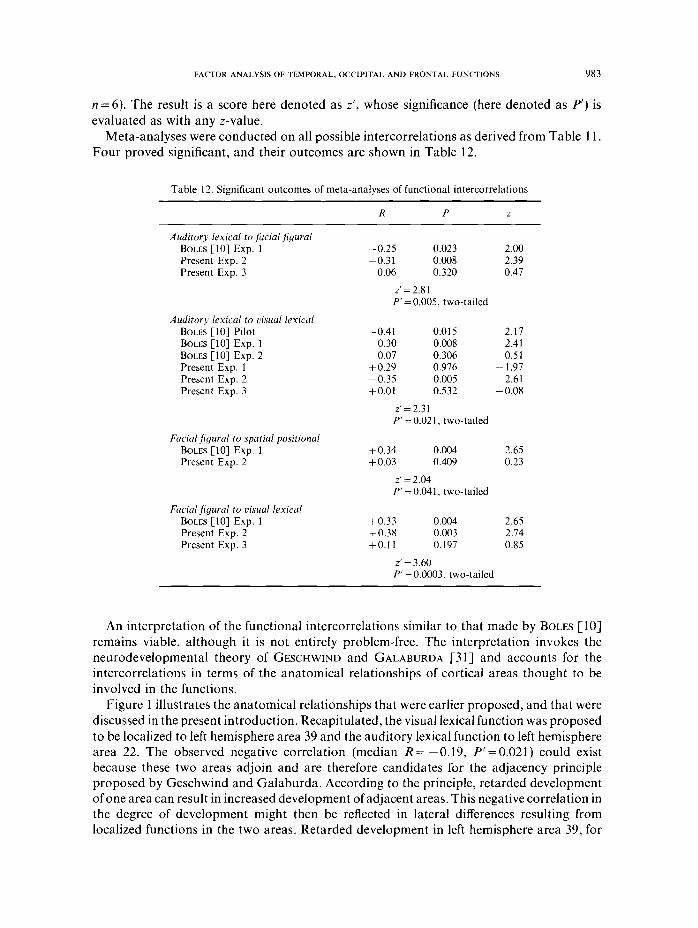
Meta-analyses were conducted on all possible intercorrelations as derived from Table 11. Four proved significant, and their outcomes are shown in Table 12.
Table 12. Significant outcomes of meta-analyses of functional intercorrelations
R P z
Auditory lexical to facial Jigural BOLES [lo] Exp. 1 Present Exp. 2 Present Exp. 3
Auditory lexical to kwa/ lexical
BOLES [IO] Pilot
BOLES [lo] Exp. 1 BOLES [lo] Exp. 2 Present Exp. 1 Present Exp. 2 Present Exp. 3
Facial ,jiyural to spatial positional BOLES [lo] Exp. 1 Present Exp. 2
Facial ,jyurul to risuul lexical
BOLES [lo] Exp. 1 Present Exp. 2 Present Exp. 3
-0.25 0.023 2.00 -0.31 0.008 2.39 -0.06 0.320 0.47
z’=2.81 P’ = 0.005. two-tailed
-0.41 0.015 2.17 -0.30 0.008 2.41 -0.07 0.306 0.51 +0.29 0.976 - I .97 -0.35 0.005 2.61 f0.01 0.532 -0.08
z’=2.31 P’=O.O21, two-tailed
f0.34 0.004 2.65 + 0.03 0.409 0.23
2’ = 2.04 P’=O.O41, two-tailed
+0.33 0.004 2.65 10.38 0.003 2.74 +0.11 0.191 0.85
z’=3.60 P’=O.O003, two-tailed
An interpretation of the functional intercorrelations similar to that made by BOLES [lo]
remains viable, although it is not entirely problem-free. The interpretation invokes the neurodevelopmental theory of GESCHWIND and GALABURDA [31] and accounts for the intercorrelations in terms of the anatomical relationships of cortical areas thought to be involved in the functions.
Figure 1 illustrates the anatomical relationships that were earlier proposed, and that were discussed in the present introduction. Recapitulated, the visual lexical function was proposed to be localized to left hemisphere area 39 and the auditory lexical function to left hemisphere area 22. The observed negative correlation (median R= -0.19, P’=O.O21) could exist because these two areas adjoin and are therefore candidates for the adjacency principle proposed by Geschwind and Galaburda. According to the principle, retarded development of one area can result in increased development of adjacent areas. This negative correlation in the degree of development might then be reflected in lateral differences resulting from localized functions in the two areas. Retarded development in left hemisphere area 39, for
984 D. B. BOLES
example, could result in a reduced RVF advantage in visual lexical tasks, paired with increased development in left hemisphere area 22 and an increased REA in auditory lexical tasks.
Furthermore, if the “visual emotional” function, now labeled the facial figural function, is localized to right hemisphere area 39, then a positive correlation might be obtained to the visual lexical function (median R= $0.33, P'=O.O003) because of Geschwind and Galaburda’s homology principle. This states that retarded development in one area is accompanied by increased development of the homologous area. A positive correlation between lateral differences is obtained because a reduced RVF (reduced positive) advantage for visual lexical tasks is paired with increased left-sided (increased negative) advantages for facial figural tasks, or vice versa.
The proposed anatomical relationships also can account for the negative correlation between the auditory lexical and facial figural functions (median R = -0.25, P' =0.005), because of the mutual relationships of left hemisphere area 22 and right hemisphere area 39, to left hemisphere area 39. Retarded development of left hemisphere area 39 would result in increased development of the other areas, producing increased right ear (positive) advantages for auditory lexical tasks as well as increased left-sided (negative) advantages for facial figural tasks.
The remaining significant functional intercorrelation, that between the facial figural and spatial positional functions (median R = + 0.19, P' = 0.041), is of uncertain relationship to the neurodevelopmental theory, because the literature provides no clear localization for the latter function (other than grossly to the parietal lobe). Accordingly it acts neither to support nor to refute the anatomical scheme outlined in Fig. 1.
Although the foregoing account is largely consistent with the data, a potential problem is raised by the relabeling of the “visual emotional” function as facial figural. One of the foundations of the original anatomical scheme was research suggesting that the visual perception of facial emotions might well be localized to right hemisphere area 39 [27,33,63]. However, if the identified function is not specific to the perception of visual emotions and instead concerns facial perception more generally, an area 39 localization is more difficult to defend in light of current knowledge. There is widespread agreement that the localization of lesions causing prosopagnosia (the inability to recognize faces) is occipital and not parietal in nature. Reports of localized lesions in cases of prosopagnosia appear to converge on occipital areas 18 and 19, with a predominant though perhaps not exclusive role of the right hemisphere [20, 22, 381.
Localization to areas 18 and 19 is difficult to reconcile with the constellation of significant functional intercorrelations (Table 12) at least if the neurodevelopmental theory is to form the basis. On one hand, it might be possible to account for the facial figural-visual lexical correlation in light of a recent assertion that occipital areas are the principle focus in visual word recognition [60]. Thus the two functions could be localized to homologous areas of the occipital lobes and produce a positive correlation due to the homology principle. However, at best this would be only a partial explanation, because an occipital localization of the visual lexical function would not easily account for the negative correlation with the presumably temporal auditory lexical function. In any case the occipital localization must be regarded as controversial. For example, it may be that the blood flow methodology on which the assertion is based picked up metabolic activity related not to word recognition per se but to the transfer of visual word information from the occipital lobes to left hemisphere area 39; i.e. in accordance with the classical interpretation of pure alexia put forward by DEJERINE [39].

FACTOK ANALYSIS OF TEMPORAL, OCCIPITAL AND FRONTAL FUNCTIONS 985
In this regard it should be noted that following the visual presentation of words, the blood flow study reported lateralized foci of activity in both the left and right occipital lobes [60]. It
therefore remains an open question as to whether those foci account for the RVF (left hemisphere) advantages consistently found for lateralized visual lexical tasks. Evidence against an occipital localization has been found in other studies using not only measures of blood flow [53] but also event-related potentials [53,.54] and magnetic resonance imaging of dyslexics [2.5], all of which are consistent with the involvement of the left angular gyrus in
word recognition. An interpretation that more fully resolves the difficulties with the correlational results
requires only a slight modification of the original anatomical model. This view leaves intact
assumptions regarding the localization of the visual and auditory lexical functions (left
hemisphere areas 39 and 22, respectively) but regards what has been called the “facial figural” function as an amalgam of separate facial recognition and visual emotional functions. By this view the tasks underlying the facial recognition function (the facial resemblances task) and the facial emotions function (the facial emotions task) produce correlated asymmetries and
load on the same factor not because they involve the same lateralized function, but because the two functions they represent are themselves strongly interconnected. Anatomically they
could reside in different areas (i.e. areas 18 or 19 vs area 39). Functionally, however, they may be strongly interconnected because both are specific to the processing of faces and constitute parts of the same functional system. If so, then according to Geschwind and Galaburda’s
connectedness principle, they could also be developmentally related in that retarded
development of one area could lead to retarded development of the other. Behaviorally the result would be positively correlated asymmetries.
Although this model accounts for the observed factor correlations, it should be
emphasized that the correlational methodology really only provides hypotheses as to
anatomical relationships. The real value of the methodology is in (a) identifying specific lateralized functions underlying different tasks, and (b) pointing to specific constellations of functions worth investigating in terms of brain anatomy. Clearly the visual lexical, auditory lexical and facial figural (or facial recognition plus facial emotional) functions are those identified thus far that are most interesting in terms of their interrelationships. Bringing
anatomically-oriented methods to bear on them in a correlational approach could be productive.
Finally, it is important to make explicit what has only been implicit about individual differences in lateralization. The range of positive, negative and null intercorrelations
between functions indicate that traditional views of individual differences are incorrect. For example, it cannot be the case that an individual who is strongly lateralized for one function is
likely to be strongly lateralized for another. This lateralization strength viewpoint cannot among other things account for the predominance of null correlations between functions.
The same is true of the hemisphericity viewpoint stating that individuals tend to show a shift either to the left or to the right in lateral differences. On the other hand, the independence view predicts that all intercorrelations should be zero, and this is also not the case. Whatever model is proposed to account for the results, it most allow for the full range of positive, negative and null correlations. To date the only theory that appears capable ofdoing so is the neurodevelopmental theory of GESCHWIND and GALABURDA [31].
Acknowledgements-1 would like to thank Jeff Baker, Todd Barlow, Michael Hochlerin, Linda Jaynes, James
986 D. B. BOLES
Kelliher and Mark Law for running subjects in the experiments, and Jerre Levy for generously contributing a copy of the facial emotions test.
1. 2
3
4. 5.
6.
I.
8. 9.
10.
11.
12.
13.
14. 15.
16. 17.
18.
19.
20.
21.
22.
23.
24.
25.
BARNES, S. and BUKKE, R. S. What is Apple-Psych? Behaa. Res. Meth. Instrum. Comput. 20, 15&154, 1988. BENSON, D. F. Aphasia. In Clinical Neuropsychology, K. M. HEILMAN and E. VALENS~EIN (Editors), pp. 1747. Oxford University Press, New York, 1985. BESNER, D., GKIMSELL, D. and DAVIS, R. The mind’s eye and the comparative judgment of number. Neuropsycholoyia 17, 373--380, 1979. BOLES, D. B. Hemispheric interaction in visual field asymmetry. Cortex 19, 99-l 13, 1983. BOLES, D. B. Confusion and visual field effects in rhyme and name letter matching. Percept. Ps~choph~s. 39, 123-128, 1986. BOLES, D. B. Reaction time asymmetry through bilateral vs unilateral stimulus presentation. Brain Cognit. 6, 321-333, 1987. BOLES, D. B. Voice recognition with the AppleePsych system. Behao. Res. Meth. Insrrum. Comput. 20, 158 163. 1988. BOLES, D. B. Do visual field asymmetries intercorrelate? Neuropsychologia 27, 697-704, 1989. BOLES, D. B. What bilateral displays do. Brain Cognit. 12, 2055228, 1990. BOLES, D. B. Factor analysis and the cerebral hemispheres: Pilot study and parietal functions. Neurops~choloyia 29, 59-91, 1991. BOLES, D. B. Parameters of the bilateral effect. To be published. In Hemispheric Transfer: Data und Theory, F. L. KIT~EKLE (Editor). Erlbaum, Hillsdale, NJ, 1993. BOLES, D. B. The localization of lateralized function: An integrative review of experimental and clinical hemispheric research. Unpublished manuscript. BOKOD, J. C., KENT, J., KOFF, E., MARTIN, C. and ALPERT, M. Facial asymmetry while posing positive and negative emotions: Support for the right hemisphere hypothesis. Neuropsycholoyia 26, 759 -764, 1988. BOROD, J. C. and KOFF, E. Hemiface mobility and facial expression asymmetry. Cortrx 19, 327-332, 1983. BOROD, J. C., KOFF, E., LORCH, M. P. and NICHOLAS, M. The expression and perception of facial emotion in brain-damaged patients. Neuropsycholoyia 24, 169-180, 1986. BKYDEX, M. P. Laterulity: Functional Asymmetry in the Human Brain. Academic Press, New York, 1982. CACIOPPO, J. T. and PETTY, R. E. Lateral asymmetry in the expression of cognition and emotion. J. exp. Psychol.: Hum. Percept. Per@m. 7, 333-341, 1981. CAPITANI, E., SCOTTI, G. and SPINNLER, H. Colour imperception in patients with focal excisions of the cerebral hemispheres. Neuropsychologia 16, 491 496, 1978. DAMASIO, A. R. and DAMASIO, H. The anatomical substrate of prosopagnosia. In The Neuropsychology oj’Face Perception and Facial Expression, R. BKUVER (Editor), pp. 31-38. Erlbaum, Hillsdale, NJ, 1986. DAMASIO, A., YAMADA, T., DAMASIO, H., CORBETT, J. and MCKEE, J. Central achromatopsia: Behavioral, anatomic, and physiologic aspects. Neuroloyy 30, 1064 1071, 1980. DAVIDOFF, J. Hemispheric sensitivity differences in the perception of colour. Q. J. exp. Psycho/. 28, 387-394, 1976.
26.
21. 28.
29.
30. 31.
DE RENZI, E. Prosopagnosia in two patients with CT scan evidence ofdamage confined to the right hemisphere. Neurops~choloyia 24, 385 389, 1986. DIMOND, S. and BEAUMONT, G. Use of two cerebral hemispheres to increase brain capacity. Nature 232, 27@271, 1971. DOPSON, W. G., BECKWITH, B. E., TUCKER, D. M. and BULLARD-BATES, P. C. Asymmetry of facial expression in spontaneous emotion. Cortex 20, 243-25 1, 1984. DUARA, R., KUSHCH, A., GROSS-GLENN, K., BARKER, W. W., JALLAD, B.. PASCAL. S., LOEWENSTEIN, D. A., SHELDON, J., RABIN, M., LEVIN, B. and Luas, H. Neuroanatomic differences between dyslexic and normal readers on magnetic resonance imaging scans. Arch. Neural. 48, 41@416, 1991. EKMAN, P., HAGEK, J. C. and FKIESEN, W. V. The symmetry of emotional and deliberate facial actions. Psychophysioloyy 18, 101~106, 1981. E~co~F, N. L. Selective attention to facial identity and facial emotion. NeuropsyL~hologia 22, 281-295, 1984. FRANZON, M. and HUGDAHL, K. Effects of speed vs accuracy in vocal reaction time to visual half-field presentations of incongruent (Stroop) color-words. Cortex 23, 615-629, 1987. FRIEDMAN, R. B. and ALBERT, M. L. Alexia. In Clinicul Neuropsychology, K. M. HE~LMAN and E. VALENSTEIN (Editors), pp. 49-73. Oxford University Press, New York, 1985. GESCHWIND, N. Language and the brain. Scientijic American 226, 76-83, 1972. GESCHWIND, N. and GALABURDA, A. M. Cerebral Lateralization: Biological Mechanisms, Associations, and Pathology. MIT, Cambridge, MA, 1987.
32. GILBERT, C. and BAKAX, P. Visual asymmetry in perception of faces. Nruropsyhologia 11, 355- 362, 1973. 33. GORELICK, P. B. and Ross, E. D. The aprosodias: Further functional-anatomical evidence for the organisation
REFERENCES
FACTOK ANALYSIS OF TtMPOKAI., OCCIPITAL ANI) tKONIAL FUNCTIOUS 987
of affective language in the right hemisphere. Journ~tl o$Nrurolog~, Namowyery. und Psychiatry 50, 553 560, 1987.
34. HANNAY. H. J. Asymmetry in reception and retention of colors. Brcrin Lung. 8, 191-201, 1979. 35. HATTA, T. Visual field differences in semantic comparative judgments with dlgits and Kanji stimulus materials.
N~urops~choloyiu 21, 669 678, 1983. 36. HAT~A, T. and DIMOYLI, S. J. Comparison of lateral difference for digit and random form recognition in
Japanese and Westerners. J. rzp. Psycho/.: Hum. Prrc~ept. Prrform. 6, 368-374. 1980. 37. HAYWAKI), R. W.. NAESCK. M. A. and Z~rz. L. M. Cranial computer tomography in aphasia. Rndioloyy 123,
653 660, 1977. 38. HI-c~ru, H. nnd ALwKr, M. L. Nurnc~? ,Yeurop.s?‘c’h”lo~/~. John Wiley & Sons, New York. 1978. 39. HI-~)I.Kso\. V. W. Anatomy of posterior pathways in reading: A reassessment. Brrrin Lang. 29, I19 133, 1986. 40. Hw:s, D. ;md S~TZ, P. Cross-modal asymmetries in perception related to asymmetry in cerebral function.
,Vcurop.~~c,ho/ogirr 12, 239 247. 1974. 41. HUGIIAHL. K. and FKANLON. M. Visual half-field presentations of incongruent color-words reveal
mirror-reversal of language lateralization in dextral and sinistral subjects. C‘orfru 21, 359-374, 1985. 42. JONES-GOTIIAN. M. Memory for designs: The hippocampal contribution. ,V~~lrop.s?‘c’lloloyiu 24, 193 203, 1986. 43. KIML,KA, D. Right temporal-lobe damage: Perception of unfamiliar stimuli after damage. Awh. ,Yruro/. 8,
264 271. 1963. 44. KIML,KA, D. Left right differences in the perception of melodies. p. J. cup. Ps!~ho/. 16, 355-~358, 1964. 45. KIMUKA. D. Functional asymmetry of the brain in dichotic listening. Corteu 3, 163 17X. 1967. 46. KOLB. B. nnd MILNLK. B. Observations on spontaneous facial expression after focal cerebral excisions and after
intracarotld injection of sodium amytal. N~lrrr,ps~~ho/oyin 19, 505 514. 1981. 47. KOLH. B. and WHISHAW. 1. Q. Fund~~wnruls of Huv~~n ,~lir~urop,s?c,ho/o(/~. W. H. Freeman. New York, 19X5. 4X. KLMAK. S. ‘The right and left of being internally different. Impcrcr of Scirwcr on Society 23, 53~63. 1973. 49. MAZ~O(.(.HI. F. and VIG~LO, L. A. Localisation of lesions in aphasia: Clinical-CT scan correlations in stroke
patients. (‘,wru\- 15, 627~654. 1979. 50. MILNI:K. B. Some effects of frontal lobectomy in man. In Tile Fron~ul Grmuhr Cortr.y mu/ Behuvior. J. M.
WAKKFN and K. AKFK~ (Editors), pp. 313 334. McGraw-Hill, New York. 1964. 5 I. MILKI-K. B. Brain mechanisms suggested by studies of temporal lobes. In Bruin .Mrchuni.vm G’nderlyiny Sperch
nm/ I,anqrrr!g~. C. H. MILLIRAU and F. L. DAKLFY (Editors). pp. I22 145. Grune& Stratton. New York. 1967. 52. Mos<‘o~I~~.H. M. and 0~1)s. J. Asymmetries in spontaneous facial expressions and their possible relation to
hemispheric specialization. Nrlrr[)p.\~,~~~~/~)~~icl 20, 7 1 8 1. 1982. 53. NLNO~. V. I.. HAL(;KEN, E., S~IITH. M. E.. BAUI~K, J.-M., ROIJ(.HA~. J., BLAHD. W. H. and MANIIELUKN, M.
Localized brain metabolic response correlated with potentials evoked by words. &hut-. Bruin Re. 44, 101~ 104. 1991.
54. NI:VILL.L. H. J.. KLTAS, M. and SCHMIIIT, A. Event-related potential studies of cerebral spccialiration during reading. Brtrirl Lnmq. 16, 300 3 15, 1982.
55. NOKUSIS. M. J. SPSS-X Arlwwrtl Sftrti.stics Guide. SPSS Inc., Chicago, 1985. 56. OLI)I:ILLII. R. C. The assessment and analysis of handedness: The Edinburgh Inventory. Neurops~~ho/o(/irr 9,
97 113. 1971. 57. PAAI’, K. R.. N~WSOM~. S. L.. MCDON.~LU. J. E. and SCHVANEVI‘LUT. R. W. An activation verification model for
letter and hard recognition: the word-superiority effect. fcwltol. RN. 89, 573~594, 1982. 5X. PENNAL. B. E. Human cerebral asymmetry in color discrin&tion. Nruropc~c,ho/oyicl IS, 563%56X. 1977. 59. PLKKI-T. E. The left frontal lobe of man and the suppression of habitual responses in verbal categorical
behavlour. .‘Vrfrrop.s~c,hr)/o(litr 12, 323 330, 1974. 60. PF:~FKSI.%. S E.. Fox. P. T., POSNEK. M. I.. MINTLN. M. and RAI(.HLJ:. M. E. Positron emission tomographic
htudies of the processing of single words. J. Cm/nit. Nrurosci. I, 153 170. 1989. 61. PFTKII)ES, M. and MILVEK, B. Deficits on subject-ordered tasks after frontal- and temporal-lobe lesions in man.
Nrurop.s~c,hcl/nHia 20, 249 262. 19x7. 62. ROSI;%THAL. R. Combining results of independent studies. Psycho/. Bull. 85, I85 193, 1978. 63. Ross. E. D. The aprosodias: Functional-anatomic organization of the affective components of language in the
right hemisphere. Arch. Neurd. 38, 561 569, 1981. 64. SU)~~I. G. and SPIV~~L~.K, H. Colour imperccption in unilateral hemisphere-damaged patients. J. Nrurol.
Neurrhurcq. l'srchinr 33, 22 7X. 1970. 65. SPSS Inc. SPAS-X (:.wr’s G~idr. SPSS Inc., Chicago, 1986. 66. TIBEKGHJEN. G. and CLEK(., I. The cognitive locus ofprosopagnosia. In 7%~ N~urops)choloy!(~~ Fucc Perception
cud FUCXI/ Expression. R. BKUYEK (Editor), pp. 39-62. Erlbaum. Hillsdale. NJ. 1986. 67. TSAO. Y.. FI:LST~L. T. and SOSFOS, C. Stroop interference in the left and right visual fields. Brain Lump. 8,
367 371, 1979. 6X. VAY OKIIFN, G. C., JOHNSTON, J. C. and HALL. B. L. Word identification in reading proceeds from spelling to
sound to meaning. J. r’xp. Ps~c/w/.: Learn. Mern. Cognit. 14, 371 386, 1988.
988 D. B. BOLES
69. WAKRINGTON, E. K. and JAMES, M. Disorders of visual perception in patients with localised cerebral lesions Nrurops~chokxqia 5, 253 266, 1967.
70. WEIXIELL, R. A., MILLER, J. D. and TREVAKTHEN, C. Voluntary emotional facial expressions in patients witt focal cerebral lesions. Neuropsychologia 28, 49 60, 1990.
71. WEULXLL, R. A., TKEVAKTHEN, C. and MILLER. J. D. Reactions ofpatients with focal cerebral lesions to succes! or failure. Neuropsyc/toloUia 26, 373-385, 1988.
72. WYLIE, D. R. and G~UALL, M. A. Left-sided oral asymmetries in spontaneous but not posed smiles Neuropsycholoyia 26, 823~-832, 1988.