using mathematical transmission modelling to investigate drivers of respiratory syncytial virus...
TRANSCRIPT

Using Mathematical Transmission Modelling toInvestigate Drivers of Respiratory Syncytial VirusSeasonality in Children in the PhilippinesStuart Paynter1*, Laith Yakob1, Eric A. F. Simoes2,7, Marilla G. Lucero3, Veronica Tallo3, Hanna Nohynek4,
Robert S. Ware1,6, Philip Weinstein5, Gail Williams1, Peter D. Sly6
1 School of Population Health, University of Queensland, Brisbane, Queensland, Australia, 2 University of Colorado School of Medicine, Aurora, Colorado, United States of
America, 3 Research Institute for Tropical Medicine, Department of Health, Muntinlupa City, Metro Manila, Philippines, 4 Department of Vaccines and Immune Protection,
National Institute for Health and Welfare, Helsinki, Finland, 5 Barbara Hardy Institute, University of South Australia, Adelaide, South Australia, Australia, 6 Queensland
Children’s Medical Research Institute, University of Queensland, Brisbane, Queensland, Australia, 7 Colorado School of Public Health, University of Colorado, Aurora,
Colorado, United States of America
Abstract
We used a mathematical transmission model to estimate when ecological drivers of respiratory syncytial virus (RSV)transmissibility would need to act in order to produce the observed seasonality of RSV in the Philippines. We estimated thata seasonal peak in transmissibility would need to occur approximately 51 days prior to the observed peak in RSV cases(range 49 to 67 days). We then compared this estimated seasonal pattern of transmissibility to the seasonal patterns ofpossible ecological drivers of transmissibility: rainfall, humidity and temperature patterns, nutritional status, and schoolholidays. The timing of the seasonal patterns of nutritional status and rainfall were both consistent with the estimatedseasonal pattern of transmissibility and these are both plausible drivers of the seasonality of RSV in this setting.
Citation: Paynter S, Yakob L, Simoes EAF, Lucero MG, Tallo V, et al. (2014) Using Mathematical Transmission Modelling to Investigate Drivers of RespiratorySyncytial Virus Seasonality in Children in the Philippines. PLoS ONE 9(2): e90094. doi:10.1371/journal.pone.0090094
Editor: Steven Riley, Imperial College London, United Kingdom
Received July 19, 2013; Accepted January 31, 2014; Published February 27, 2014
Copyright: � 2014 Paynter et al. This is an open-access article distributed under the terms of the Creative Commons Attribution License, which permitsunrestricted use, distribution, and reproduction in any medium, provided the original author and source are credited.
Funding: The RSV admissions data and weight for age data were collected as part of the ARIVAC project, which was supported by the European Commission DGResearch INCO program (contracts IC18-CY97-2019, ICA4-CT-1999-10008, ICA4-CT-2002-10062); Academy of Finland (contracts: 206283, 106974, 108873, and108878); Finnish Ministry of Foreign Affairs (bilateral contracts 75502901 and 327/412/2000); Finnish Physicians for Social Responsibility; GAVI ADIP Pneumo;Sanofi Pasteur; Research Institute for Tropical Medicine of the Philippines; National Public Health Institute Finland; University of Queensland; University ofColorado; National Health and Medical Research Council of Australia; and Programme for Appropriate Technology in Health (PATH). The views expressed by theauthors do not necessarily reflect the views of PATH. The funders had no role in study design, data collection and analysis, decision to publish, or preparation ofthe manuscript.
Competing Interests: Sanofi Pasteur contributed towards direct research costs related to data management for the PCV trial. The authors do not believe thisconstitutes a conflict of interest related to this manuscript. This does not alter the authors’ adherence to all the PLOS ONE policies on sharing data and materials.
* E-mail: [email protected]
Introduction
Acute lower respiratory infection (ALRI) is responsible for 20%
of deaths in post neonatal infants globally, with one third of these
deaths due to respiratory syncytial virus (RSV) [1]. In most settings
ALRI in young children follows striking seasonal patterns,
including in the tropics, where ALRI generally occurs during the
rainy season [2,3]. Relatively little emphasis has been placed on
systematically investigating the drivers of seasonality in tropical
settings, despite the fact that most ALRI deaths in children occur
in the tropics. Seasonal variations in transmission are required to
amplify the inherent oscillations in infection incidence, which
would otherwise remain damped, and to dictate the timing of
seasonal epidemics, which are generally consistent in similar
climates. Possible ecological drivers of respiratory infection
seasonality include increased pathogen survival (possibly due to
variations in temperature, humidity or sunlight); reduced host
immunity (possibly due to variations in nutrition, sunlight, or co-
infections); and increased host mixing due to seasonal variations in
behavioural patterns (such as increased time spent indoors during
rainy or cold periods, and school terms) [4,5]. Identifying the
drivers of seasonality has potential benefit beyond improving the
understanding of disease transmission. As well as improving the
prediction of disease burdens in the context of global change, host
factors such as poor nutrition are amenable to intervention, which
may prove more effective if timed correctly [4].
In previous studies in the Philippines, we have found that
seasonal variations in child nutrition, as well as in meteorological
factors (rainfall, sunshine and relative humidity) were associated
with the seasonality of ALRI admissions in children [6,7]. The lag
time between the seasonal peaks in these potential driving factors
and the peaks in the yearly ALRI epidemics varied considerably.
High rainfall and relative humidity, and low levels of sunshine all
occurred within a few weeks before or after the seasonal peak in
ALRI. In contrast nutritional status was poorest 10 weeks before
the seasonal peak in ALRI. In this setting in the Philippines the
seasonal peaks in ALRI admission are coincident with the peaks in
cases of microbiologically confirmed RSV [6]. From a modelling
perspective, drivers of transmission act by altering the transmission
coefficient (b) which is a measure of the transmissibility of the
infection (the rate at which an infectious person in the population
infects susceptible people in the population) at any point in time.
Note that transmissibility differs from transmission – although
PLOS ONE | www.plosone.org 1 February 2014 | Volume 9 | Issue 2 | e90094

transmissibility may be high at a particular point in time, the
number of infections actually occurring will also depend on the
number of infectious and susceptible individuals at the time [4,8].
Previous modelling suggests the lag between the yearly peak in band the yearly peak in the incidence of infections may be in the
order of one to three months for RSV infection [9]. With this in
mind we have used an RSV transmission model to estimate when
the seasonal scale variations in b would need to occur in order to
reproduce the observed seasonality in RSV admissions in our
study population. We have then compared this seasonal pattern of
b to the seasonal patterns of potential environmental drivers of
transmission: rainfall, humidity, and temperature patterns, nutri-
tional status, and school holidays, in order to better assess their
epidemiological plausibility.
Ethics StatementThe trial ‘‘Effectiveness of an 11-valent pneumococcal conju-
gate vaccine against pneumonia in Philippine children: A double-
blind, placebo-controlled, randomised, multicentre, effectiveness
study’’ was approved and monitored by the Ethical and
Institutional Review Board of the Research Institute for Tropical
Medicine (RITM), the Philippines. Written informed consent was
obtained from parents/guardians prior to enrolling infants into the
trial. In a small minority of cases both parents were illiterate. In
these instances a witness independent of the research team (a
relative or neighbour) attested to (1) that the information provided
to the parent was from the information sheet, (2) that the parent
was given the opportunity to ask questions, and (3) that the parent
provided verbal consent for the child to participate in the study.
The witness then signed the consent form on behalf of the parent.
The Ethical and Institutional Review Board of the RITM
approved the consent protocol and information sheets. This
retrospective analysis used de-identified data collected during the
trial. Ethical approval for the analysis in this paper was granted
without the need to seek additional consent, by the University of
Queensland School of Population Health Research Ethics
Committee in June 2011 (Ethics approval SP070711).
Methods
ALRI admissions data were collected during a randomised
controlled trial to investigate the efficacy of pneumococcal
conjugate vaccine (PCV) in Bohol Province in the Philippines,
between 2000 and 2004 [10,11]. Study personnel were perma-
nently assigned to hospitals involved with case ascertainment, and
respiratory infections were assessed and recorded in all children
living in the trial municipalities who were admitted to local health
care facilities over the course of the trial. Nasal wash specimens
were collected from children admitted to the Bohol Regional
Hospital with ALRI, and from 1 in 3 children diagnosed with
ALRI at the outpatient clinic. Children with a positive RSV
polymerase chain reaction (PCR) result were included in this
study.
A. Model StructureFigure 1 shows the structure of our RSV model. The rates of
movement between the different epidemiological categories are
given by the following differential equations (parameter definitions
are given in Table 1):
dS1
dt~mS{mS1{lS1
dE1
dt~lS1{sE1{mE1
Figure 1. RSV model schematic. S1 are susceptible individualsbefore their first RSV infection. E1 are individuals infected for the firsttime but not yet infectious. I1 are individuals infected for the first timeand now infectious. R are individuals recovered from infection andtemporarily resistant to reinfection. S2 are partially susceptibleindividuals before later RSV infections. E2 are individuals withsubsequent infections but not yet infectious. I2 are individuals withsubsequent infections and now infectious.doi:10.1371/journal.pone.0090094.g001
Table 1. Parameter estimates used in the model.
Parameter Notation Model estimates
Force of infection l Mean = 0.0022 to 0.0037 day21
Mean latent period 1/s 4 to 6 days
Mean duration of infection in category I1 1/n1 5 to 6 days
Mean duration of infection in category I2 1/n2 4 days
Degree of infectiousness (I2/I1) d 0.5 to 0.8
Rate of loss of short term immunity (RRS2) c 0.012 to 0.024 day21
Susceptibility in category S2 a 0.68 to 0.84
doi:10.1371/journal.pone.0090094.t001
Modelling RSV Seasonality in the Philippines
PLOS ONE | www.plosone.org 2 February 2014 | Volume 9 | Issue 2 | e90094
dI1
dt~sE1{n1I1{mI1
dR
dt~n1I1zn2I2{mR{cR
dS2
dt~cR{mS2{lS2a
dE2
dt~lS2a{sE2{mE2
dI2
dt~sE2{n2I2{mI2
The model was integrated over daily time steps using Runge-
Kutta 4 integration. The model is frequency dependent (all the
model compartments sum to 1). Fully susceptible individuals (S1)
are infected at rate l (the force of infection) which is dependent on
the transmission coefficient (b) and the proportion of infectious
individuals (categories I1 for primary infection and I2 for
subsequent infections):
l~b I1zdI2ð Þ
d allows for variable transmission from subsequent infections
and a allows for a variable level of susceptibility to subsequent
infections when in category S2. For both primary and subsequent
infections, there is a latent period of infection during which time
individuals are exposed but not yet infectious (respectively, E1 and
E2). Following the infectious period (respectively, I1 and I2),
individuals move to the recovered, non-susceptible (R) category at
rate n1 and n2 respectively. The recovered, non-susceptible state is
temporary, with individuals moving from this category to the S2
category at rate c. The transmission coefficient (b) takes into
account host, pathogen and environmental factors that influence
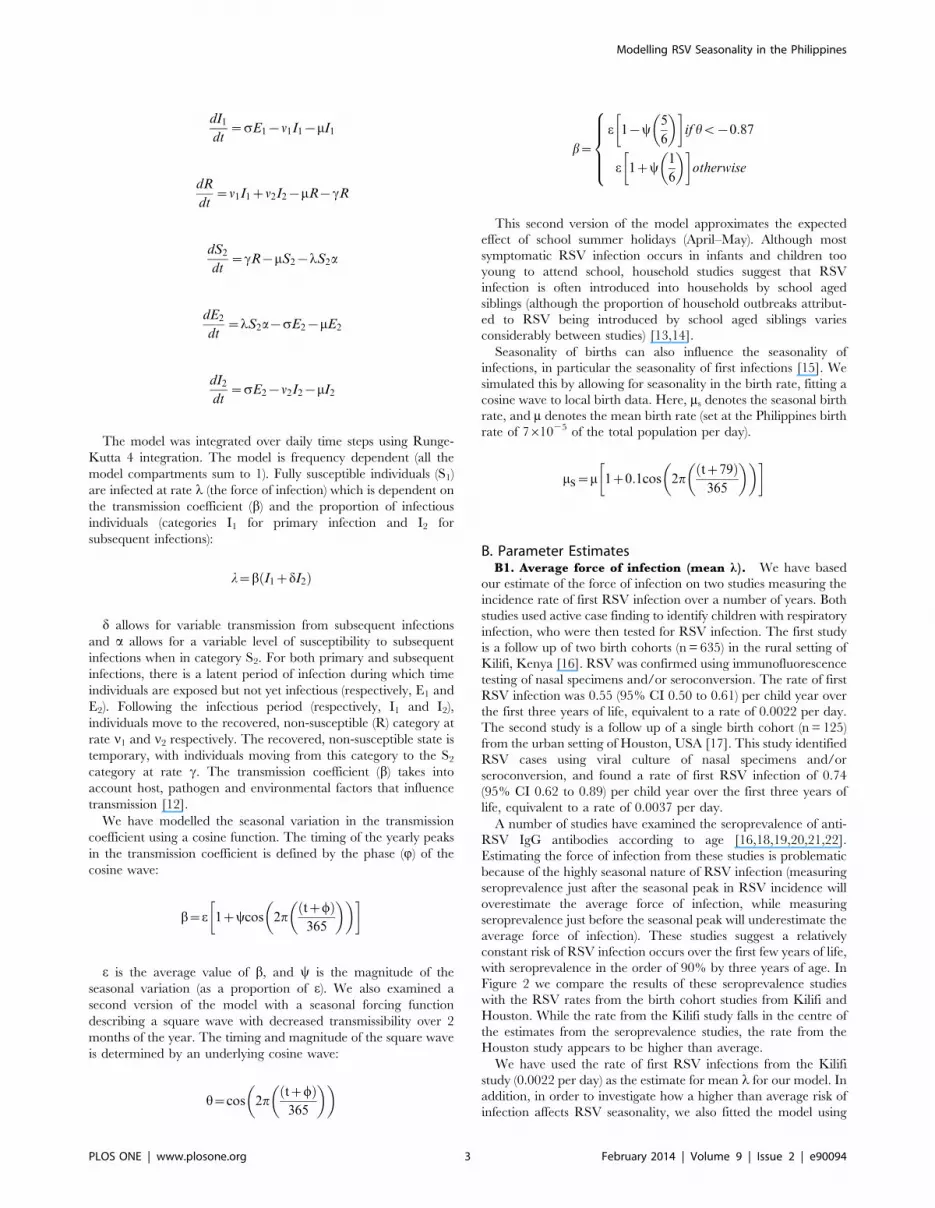
transmission [12].
We have modelled the seasonal variation in the transmission
coefficient using a cosine function. The timing of the yearly peaks
in the transmission coefficient is defined by the phase (Q) of the
cosine wave:
b~e 1zycos 2ptzwð Þ365
� �� �� �
e is the average value of b, and y is the magnitude of the
seasonal variation (as a proportion of e). We also examined a
second version of the model with a seasonal forcing function
describing a square wave with decreased transmissibility over 2
months of the year. The timing and magnitude of the square wave
is determined by an underlying cosine wave:
h~cos 2ptzwð Þ365
� �� �
b~
e 1{y5
6
� �� �if hv{0:87
e 1zy1
6
� �� �otherwise
8>>><>>>:
This second version of the model approximates the expected
effect of school summer holidays (April–May). Although most
symptomatic RSV infection occurs in infants and children too
young to attend school, household studies suggest that RSV
infection is often introduced into households by school aged
siblings (although the proportion of household outbreaks attribut-
ed to RSV being introduced by school aged siblings varies
considerably between studies) [13,14].
Seasonality of births can also influence the seasonality of
infections, in particular the seasonality of first infections [15]. We
simulated this by allowing for seasonality in the birth rate, fitting a
cosine wave to local birth data. Here, ms denotes the seasonal birth
rate, and m denotes the mean birth rate (set at the Philippines birth
rate of 761025 of the total population per day).
mS~m 1z0:1cos 2ptz79ð Þ365
� �� �� �
B. Parameter EstimatesB1. Average force of infection (mean l). We have based
our estimate of the force of infection on two studies measuring the
incidence rate of first RSV infection over a number of years. Both
studies used active case finding to identify children with respiratory
infection, who were then tested for RSV infection. The first study
is a follow up of two birth cohorts (n = 635) in the rural setting of
Kilifi, Kenya [16]. RSV was confirmed using immunofluorescence
testing of nasal specimens and/or seroconversion. The rate of first
RSV infection was 0.55 (95% CI 0.50 to 0.61) per child year over
the first three years of life, equivalent to a rate of 0.0022 per day.
The second study is a follow up of a single birth cohort (n = 125)
from the urban setting of Houston, USA [17]. This study identified
RSV cases using viral culture of nasal specimens and/or
seroconversion, and found a rate of first RSV infection of 0.74
(95% CI 0.62 to 0.89) per child year over the first three years of
life, equivalent to a rate of 0.0037 per day.
A number of studies have examined the seroprevalence of anti-
RSV IgG antibodies according to age [16,18,19,20,21,22].
Estimating the force of infection from these studies is problematic
because of the highly seasonal nature of RSV infection (measuring
seroprevalence just after the seasonal peak in RSV incidence will
overestimate the average force of infection, while measuring
seroprevalence just before the seasonal peak will underestimate the
average force of infection). These studies suggest a relatively
constant risk of RSV infection occurs over the first few years of life,
with seroprevalence in the order of 90% by three years of age. In
Figure 2 we compare the results of these seroprevalence studies
with the RSV rates from the birth cohort studies from Kilifi and
Houston. While the rate from the Kilifi study falls in the centre of
the estimates from the seroprevalence studies, the rate from the
Houston study appears to be higher than average.
We have used the rate of first RSV infections from the Kilifi
study (0.0022 per day) as the estimate for mean l for our model. In
addition, in order to investigate how a higher than average risk of
infection affects RSV seasonality, we also fitted the model using
Modelling RSV Seasonality in the Philippines
PLOS ONE | www.plosone.org 3 February 2014 | Volume 9 | Issue 2 | e90094

mean l equal to the rate of first RSV infections from the Houston
study (0.0037 per day).
B2. Susceptibility to reinfection. Previous infection with
RSV provides incomplete immunity [23,24,25]. Natural immunity
to RSV appears to have two aspects. Firstly, there appears to be a
long term partial immunity following first infection, which we have
modelled with a reduced susceptibility in the S2 category. This
may be due to specific immunity following first RSV exposure,
and/or the maturing of the infant immune system with age [16].
For the purposes of the model the distinction is not crucial.
Secondly, there appears to be additional short term immunity
following any RSV infection, which we have modelled by using
the SEIRS (susceptible, exposed, infectious, recovered, susceptible)
structure (as shown in Figure 1) rather than an SEIS structure. In
the SEIRS model, individuals in the R category are resistant to
infection, thus c (the rate that these individuals transition from the
R category to the S2 category) determines the duration of their
short term immunity.
We estimated the susceptibility in the S2 category (a) as follows.
It is generally accepted that susceptibility to first RSV infection is
100% (once protection from maternal antibody is lost). Infants in
high exposure settings such as child care show RSV incidence
approaching 100% during their first RSV season [26,27]. Bearing
this in mind, we considered that the attack rate following
experimental infection of young adult volunteers should give an
estimate of the susceptibility to infection in category S2. We
identified four such studies [24,28,29,30] (Table 2). Pooling the
results of these studies gives a = 0.77 (95% CI 0.68 to 0.84). We
also found four observational studies in children where the relative
risk of subsequent infection a year or more after first RSV
infection was able to be calculated from the published data
[16,17,26,27] (Table 2). We pooled the results from these studies
(weighted according to the number of children at risk of
reinfection in each study) and the result (RR = 0.76) was consistent
with the adult infection studies. In the model we use 0.68 to 0.84
for a.
We estimated the rate of loss of short term immunity to
reinfection (c) as follows. We could not use data from observa-
tional studies to assess the short term risk of reinfection because
these will be prone to bias due to the highly seasonal nature of
RSV infection (as most people are infected with RSV during the
seasonal epidemics, their risk from naturally occurring infection in
the months following this will be low regardless of their degree of
susceptibility). For this reason we have based our estimate of short
term immunity on data from the single study investigating
experimental reinfection of volunteers soon after confirmed
Figure 2. Cumulative incidence of first RSV infection according to age. Mean RSV incidence from birth cohorts in Kilifi and Houston (lines)compared to results from anti-RSV IgG seroprevalence surveys (data points with 95% CIs).doi:10.1371/journal.pone.0090094.g002
Table 2. Data used to estimate susceptibility in S2 category inthe model.
Setting Study typeSusceptibility inS2 category
UK [29] Experimental infection in adults 0.74 (0.49 to 0.91)a
USA [24] Experimental infection in adults 0.76 (0.58 to 0.89)a
USA [28] Experimental infection in adults 0.78 (0.62 to 0.89)a
USA [30] Experimental infection in adults 0.77 (0.60 to 0.90)a
Kenya [16] Observation study in children 0.93 (0.69 to 1.24)b
USA [17] Observation study in children 0.71 (0.61 to 0.84)b
USA [26] Observation study in children 0.72 (0.62 to 0.84)b
USA [27] Observation study in children 0.67 (0.55 to 0.81)b
aProportion (infected/challenged).bRR (second infection/first infection, where second infection 12 or more monthsafter first infection).doi:10.1371/journal.pone.0090094.t002
Modelling RSV Seasonality in the Philippines
PLOS ONE | www.plosone.org 4 February 2014 | Volume 9 | Issue 2 | e90094

natural RSV infection [23]. In this study 47% (95% CI 21% to
73%) of the subjects were infected upon experimental exposure to
RSV two months after natural infection. We calculated c by fitting
a function:
dY
dt~c 100{Y½ �
where Y is the population level susceptibility to reinfection, and t
is the time following infection, to pass though the data point from
this experimental study (47% susceptible at 2 months after
previous infection) and then reach our estimate for a (77%
susceptible at 12 or more months after first infection). This gave c= 0.016 per day. For the model we have used a range from 0.012
per day to 0.024 per day. The lower limit of the range is the lowest
rate that will result in 100% of individuals having moved to
category S2 within 1 year following infection. The upper limit of
the range is 50% above the 0.016 estimate.
B3. Latent period (1/s). Studies of household RSV spread
have found the serial interval to be approximately six to seven days
[13,14]. In four studies of experimental infection of adult
volunteers, shedding was found to start at a mean of 6 days, 4.4
days, 4.4 days, and 4.0 days after inoculation (respective study sizes
were 15, 30, 22 and 35) [23,24,28,30]. In one of these studies it
was noted that the latent period depended on the size of the
infective dose, which may explain the differences between these
three studies [24]. Standard texts estimate the mean incubation
period to be 5 days [31]. The latent period is likely to be similar, as
infectiousness will increase with the onset of symptoms, even if
virus can be isolated prior to this [28]. In the model we use a mean
latent period of 4 to 6 days. For the purpose of fitting the model to
the observed RSV cases, we assume the latent period and
incubation period are equal.
B4. Duration of infectiousness (1/n1 and 1/n2). We have
assumed the infectious period is the same as the duration of RSV
shedding. Data from community studies are summarised in Table 3
(we excluded two studies measuring shedding in hospitalised
children because more severe disease increases shedding duration
[32,33]). The Kenyan study summarised in Table 3 indicates that
shedding duration varies according to the history of previous RSV
infection [34]. In this study the mean duration of RSV shedding in
those having had a previous RSV infection was 4.0 days, which is
consistent with the results from four experimental infection studies
in adults [23,24,30,35]. Shedding appears longer in young
children (approximately 5 to 6 days) consistent with the increased
shedding duration during first RSV infection in the Kenyan study
(5.1 days) [32,34,36]. In the model we use a mean duration of
infectiousness of 5 to 6 days for individuals is category I1, and 4
days for individuals in category I2.
B5. Relative degree of infectiousness between categories
I2 and I1 (d). In a series of studies the degree of RSV shedding
was found to be lower in adults (mean 3.0 log10TCID50/ml,
n = 29) [23,35], compared to hospitalised children aged less than 3
years (4.3 log10TCID50/ml, n = 19 ) [32]. This limited evidence
suggests that individuals in category I2 are 0.7 times as infectious
(in addition to having a shorter duration of infection) than those in
category I1. A recently published RSV model with lifelong partial
immunity following first infection used a relative degree of
infectiousness between individuals in category I2 compared to
category I1 of 0.6, and achieved good fitting to incidence data from
a number of settings with varied seasonal patterns [37]. In the
model we use 0.5 to 0.8 for d.
C. Model FittingWe have fitted the incidence of I1 to the observed RSV cases, as
the risk of severe disease and hospital admission is highest upon
first infection [17,26]. To fit the model to the observed monthly
RSV cases, we first scaled up the cumulative incidence of I1 for
each month to calculate the predicted monthly number of RSV
cases (we derived the scaling factor from the mean number of
observed RSV cases per year divided by the yearly cumulative
incidence of I1 in the model at equilibrium). The seasonal forcing
parameters e, y and Q were derived from fitting the predicted
number of RSV cases to the observed RSV cases, while at the
same time fitting the model to the estimated average force of
infection (mean l) in the population. As the latent and incubation
periods are the same in our model, the seasonal pattern of disease
incidence will be coincident with the seasonal pattern of the
incidence of I1. A formal least squares approach was used for
model fitting. The parameter estimates used in the model are
summarised in Table 1. Parameters were varied in a stepwise
manner to maximise and minimise the time lag between the
seasonal peak in b and the seasonal peak in RSV incidence, in
order to form a range of epidemiologically plausible lag periods.
D. Assessing Potential Drivers of RSV SeasonalityAfter using the model to estimate the seasonal pattern of b, we
then compared this to the seasonal patterns of candidate drivers of
RSV seasonality (meteorological factors, school holidays, and the
seasonality of nutritional status). Meteorological factors examined
were the number of days per week with rainfall .5 mm (chosen to
incorporate both rainfall frequency and intensity) and mean
relative humidity and mean temperature. In addition we estimated
the dew point temperature (a measure of absolute humidity) from
the mean relative humidity and mean temperature [38]. Meteo-
rological data were recorded at the Philippine Atmospheric,
Geophysical and Astronomical Services Administration (PA-
GASA) offices in Tagbilaran. All trial municipalities were within
25 km of Tagbilaran. The number of rainy days per week also
serves as a proxy measure of sunshine hours, as these variables are
negatively correlated in this tropical setting [7]. The seasonality of
infant nutritional status was depicted using a time series of
estimated birth weight in the PCV trial participants [6]. While
birth weight is dependent on maternal nutrition, we have
previously shown in our study setting that birth weights are lowest
when rice production in lowest, and the seasonal trough in birth
Table 3. Data on the duration of RSV shedding used toestimate the infectious period.
Setting n AgeMean duration of RSVshedding
Kenya [34] 96 First infection 5.1 days (95% CI 4.2 to6.2 days)
96 Previouslyinfected
4.0 days (95% CI 3.3 to4.9 days)
USA [24] 22 Adults 3.5 days
USA [23] 12 Adults 4.7 days
USA [35] 118 Adults 3.9 days
USA [30] 35 Adults 3.6 days
USA [36] 44 Less than 4 years 5 to 6 days
USA [32] 12 Less than 2 years 9.0 days (95% CI 2.0 to16.0 days)
doi:10.1371/journal.pone.0090094.t003
Modelling RSV Seasonality in the Philippines
PLOS ONE | www.plosone.org 5 February 2014 | Volume 9 | Issue 2 | e90094

weight is coincident with a seasonal trough in infant growth [6].
Similarly, a study from Bangladesh found that the seasonality of
birth weight was correlated both with nutrition in children aged
less than five years, and with rice availability [39]. The seasonal
scale variations of these environmental exposures were calculated
using locally weighted regression scatter plot smoothing (lowess)
using a five month bandwidth, before being compared to our
estimate of the seasonal pattern of b.
Results
Modelling the seasonality in births alone without additional
seasonal variation in b could not reproduce the observed
seasonality in RSV admissions, with the modelled incidence of
RSV cases varying by less than 10% over the calendar year.
Table 4 shows the results of the cosine b model, including the
results for the parameter combinations resulting in the best model
fit to the observed data, as well as the longest and shortest lag
between the seasonal peak in b and the seasonal peak in RSV
cases predicted by the model. While there is little difference in the
model fit between the different parameter combinations (as
demonstrated by the similarly sized residuals) the lag between
the seasonal peak in b and the seasonal peak in RSV cases
predicted by the model varies considerably. For the scenarios with
a mean l of 0.0022 this lag ranges from 67 days to 49 days. For
the scenarios with a mean l of 0.0037 (above average force of
infection) the range of this lag is much wider, from 43 days to 6
days. Table 5 shows the results of the square wave b model,
including the results for the parameter combinations resulting in
the best model fit to the observed data, as well as the longest and
shortest lag between the seasonal peak in RSV cases predicted by
the model and the start of the square wave. The square wave bmodel does not fit the observed data as well as the cosine b model,
as demonstrated by the larger residuals. For the scenarios with a
mean l of 0.0022 the lag between the seasonal peak in RSV cases
predicted by the model and the start of the square wave ranges
from 31 days to 68 days. For the scenarios with a mean l of 0.0037
(above average force of infection) the range of this lag is from 80
days to 129 days. Figure 3 shows the cosine b and square wave bmodels fitted to the observed RSV cases, for the scenario with a
mean l of 0.0022 and the parameter combinations resulting in the
best model fit to the observed data.
Figure 4 shows the seasonal pattern of b estimated from the
cosine b model with mean l of 0.0022, compared to the seasonal
scale variations in the potential environmental drivers. The
environmental data are plotted relative to the centre of the yearly
RSV epidemics, which occurred at slightly different times each
year. The nutrition index (estimated weight for age z-score at
birth) is consistently at its minimum 10 weeks before the centre of
the yearly epidemics, compared to the seasonal peak in b, which
occurred 7 weeks (51 days) before the peak in RSV cases.
Although rainfall does not show a consistent seasonal peak, the
seasonal trough in rainfall occurs consistently 17 to 18 weeks after
the centre of the yearly RSV epidemics, compared to the seasonal
trough in b, which occurred 19 weeks (131 days) after the peak in
RSV cases. In contrast, relative humidity, dew point and
temperature do not show clear relationships with the seasonal
pattern of b. Performing a similar analysis for school terms
indicates that school holidays begin after the predicted square
wave. This can be seen in Figure 3 (summer school holidays in the
Philippines begin in late March to early April).
Discussion
We have found that the observed seasonality of RSV admissions
in our study setting can be replicated by an RSV transmission
Table 4. Results from the cosine b model.
Mean l c a s n1 n2 d e y Q Res Lag
0.0022 Longest lag 0.024 0.68 0.17 0.17 0.25 0.5 0.72 0.20 140 24.9 67
Best fit 0.012 0.84 0.25 0.17 0.25 0.5 0.64 0.13 123 24.6 51
Shortest lag 0.012 0.84 0.25 0.17 0.25 0.8 0.42 0.13 122 24.6 49
0.0037 Longest lag 0.024 0.68 0.17 0.17 0.25 0.5 0.78 0.14 116 26.0 43
Best fit 0.012 0.84 0.25 0.17 0.25 0.8 0.47 0.12 81 24.1 9
Shortest lag 0.012 0.84 0.25 0.17 0.25 0.5 0.72 0.11 77 24.4 6
The lag is from the seasonal peak in b to the seasonal peak in RSV cases predicted by the model. Lag and Q are in days. The values of l, c, s, n1 and n2 are rates per day.Res is the residuals following fitting the model to the observed RSV data (the square root of the sum of the squares of the difference between the monthly number ofobserved RSV cases and the monthly number of RSV cases predicted by the model).doi:10.1371/journal.pone.0090094.t004
Table 5. Results from the square wave b model.
Mean l c a s n1 n2 d e y Q Res Lag
0.0022 Shortest lag 0.024 0.68 0.17 0.17 0.25 0.5 0.72 0.48 164 29.3 31
Best fit/longest lag 0.012 0.84 0.25 0.17 0.25 0.5 0.65 0.47 156 26.9 68
0.0037 Shortest lag 0.024 0.68 0.17 0.17 0.25 0.5 0.79 0.55 143 28.5 80
Best fit/longest lag 0.012 0.84 0.25 0.17 0.25 0.5 0.73 0.51 100 25.7 129
The lag is from the seasonal peak in RSV cases predicted by the model to the start of the square wave. Lag and Q are in days. The values of l, c, s, n1 and n2 are rates perday. Res is the residuals following fitting the model to the observed RSV data (the square root of the sum of the squares of the difference between the monthly numberof observed RSV cases and the monthly number of RSV cases predicted by the model).doi:10.1371/journal.pone.0090094.t005
Modelling RSV Seasonality in the Philippines
PLOS ONE | www.plosone.org 6 February 2014 | Volume 9 | Issue 2 | e90094

model with a transmission coefficient (b) following a seasonal
cosine wave that is maximal 51 days (range 67 days to 49 days)
before the yearly peak in RSV admissions. This is consistent with
the findings from previous modelling of RSV infection, which
suggests that peak RSV transmissibility precedes yearly RSV
epidemics by one to three months [9]. Seasonal malnutrition in
our study setting (as measured by seasonal variation in birth weight
and infant growth) is consistently at its worst 10 weeks before the
yearly RSV epidemics [6]. This lag is slightly longer than the 51
days predicted by the model, however there are three mechanisms
we have not modelled which would lead to an additional delay
between peak seasonal malnutrition and peak RSV admissions.
Firstly, we have not factored in health care seeking delays: the
children with RSV in our study had an average delay of 5 days
between the onset of cough and admission. Secondly, the immune
effects of malnutrition may lag behind the anthropometric effects:
studies of the treatment of malnutrition in children indicate that
immune recovery lags up to a month behind anthropometric
recovery [40,41,42]. Thirdly, not all children suffer from
malnutrition in our study setting, thus successive generations of
infection are required before seasonal forcing in the malnourished
subgroup could drive RSV incidence in the wider population.
Rainfall is high most of the year in our study setting, and shows a
consistent trough 17 to 18 weeks after the yearly RSV epidemics.
This is also consistent with our model, which predicts the seasonal
trough in b occurring 131 days (19 weeks) after the yearly peak in
RSV cases. Factoring the health care seeking delay discussed
above would mean the seasonal trough in b actually occurs 18
weeks after the yearly peak in RSV cases, precisely coincident with
the observed trough in rainfall. The seasonal patterns of
temperature, dew point and relative humidity are not consistent
with the predicted seasonal pattern of b. The small magnitude of
the seasonal variation in these exposures (mean temperature and
dew point vary by approximately 2uC through the year, while
mean relative humidity varies by approximately 5% through the
year) also suggests that these exposures are unlikely to be playing a
major role in driving the seasonality of RSV in this setting. School
summer holidays appear to occur too late to play a dominant role
in driving RSV incidence in infants in this setting. In addition, the
timing of school holidays relative to yearly RSV epidemics is very
different in other tropical climates, suggesting school holidays do
not play a dominant role in RSV seasonality in the tropics. For
example in northern Australia and in southeast Florida RSV
incidence is highest soon after school summer holidays [43,44].
Seasonal malnutrition is a biologically plausible driver of RSV
seasonality: poor infant growth leaves children weakened and
vulnerable to infection [45], and is a known risk factor for RSV
associated ALRI [46,47,48,49]. If rainfall is driving RSV
Figure 3. Results of the RSV model. RSV case estimates derived from the model were fitted to the observed number of RSV cases. Mean l= 0.0022 per day. Data from Bohol, the Philippines, 2001 to 2004.doi:10.1371/journal.pone.0090094.g003
Modelling RSV Seasonality in the Philippines
PLOS ONE | www.plosone.org 7 February 2014 | Volume 9 | Issue 2 | e90094

Figure 4. Timing of the estimated seasonal variation in the transmission coefficient (b) relative to observed seasonal exposures. Thered line shows the estimated variation in b. The black lines show the variation in the observed exposures. Data from Bohol, the Philippines, 2001 to2004.doi:10.1371/journal.pone.0090094.g004
Modelling RSV Seasonality in the Philippines
PLOS ONE | www.plosone.org 8 February 2014 | Volume 9 | Issue 2 | e90094

transmission in this setting, the mechanism of action is less clear.
Although high rainfall is linked to high humidity, our results
suggest that changes in humidity are not the principle mechanism
of action. It is hypothesised that adverse weather conditions such
as increased rainfall could lead to increased indoor crowding,
increasing respiratory virus transmission [5,50]. There are little
empirical data available to test this hypothesis. One study from the
tropical setting of Bangladesh found an increased risk of
respiratory infection following rainy days only occurred in
households with three or more people per room, suggesting that
the increased risk of RSV infection in crowded households is more
pronounced during rainy days [51]. Cloud cover is increased
during the rainy season. In tropical latitudes the amount of
sunshine is dictated more by cloud cover than day length, with the
lowest amount of sunshine during the rainy season. Low levels of
25-hydroxyvitamin D appear to be a risk factor for ALRI due to
RSV in infants [52]. If children have higher vitamin D levels
during the dry, sunny season this could reduce transmissibility by
increasing innate defences in susceptible children. Whether
vitamin D deficiency occurs in children in this tropical setting is
unknown, as is the timing of any seasonal deficiency (in temperate
settings, variations in vitamin D levels appear to lag 1 to 2 months
behind variations in sunshine levels [53,54], however the temporal
relationship may be different in the tropics). These questions could
be addressed directly by studies measuring the seasonal variation
in Vitamin D levels in children in tropical settings. Increased
sunshine may also act to directly kill pathogens in the environment
[5].
It is possible that seasonal variations in both nutrition and
rainfall could act synergistically to drive RSV transmission in this
setting. According to our model, either exposure could potentially
drive seasonality alone; however it is not clear if variations in either
nutrition of rainfall patterns are large enough to drive the
transmission coefficient to the necessary amplitude. If more than
one mechanism was acting, each need only be responsible for part
of the variation in the transmission coefficient.
Our model is based on a previous RSV model developed by
Weber et al [9], however our model differs in several aspects. A
central issue with RSV models is modelling partial immunity to
reinfection. The previous model by Weber et al used stepwise
reductions in susceptibility to reinfection following first, second
and later infection cycles. In our model, after the first RSV
infection, individuals have the same (reduced) susceptibility to any
subsequent infections. Individual level studies examining this have
not found a significant difference between the susceptibility to
second and third RSV infection, indicating that our simplification
is reasonable [16,17,26]. In addition, susceptibility to RSV
infection appears similar in adults who have had many previous
RSV infections, as well as in children who have had only one
previous RSV infection (Table 2). Our second simplification to the
Weber model is we do not include an epidemiological compart-
ment for infants with maternal anti-RSV antibodies (i.e. all infants
are born fully susceptible). This simplification has been used
previously [37,55]. Some of our parameter estimates differ from
those used by Weber et al, in particular our estimates for the rate
of loss of short term immunity (c) and the duration of
infectiousness (n1 and n2). In our model we chose a minimum
value of c = 0.012 per day, compared to c = 0.005 per day in
Weber et al. We limited c to values above 0.012 per day as this is
the lowest rate that will result in all infected subjects losing their
partial immunity by one year following infection. This appears to
be a reasonable assumption: data from Kenya and the USA
suggest short term immunity lasts no more than a year [16,17]. In
contrast to our estimates for the duration of infectiousness (5 to 6
days for first infections and 4 days for later infections), Weber at al
used 10 days. Our estimates were based on data from 7 studies
examining RSV shedding, the two largest of which were published
after the Weber model was developed. In addition, we specifically
excluded studies examining RSV shedding in hospitalised
children, as shedding duration is prolonged in children with
RSV associated ALRI [32,33], who make up only a small fraction
the RSV cases occurring in the general population.
Our results show that the lag between the seasonal peak in band the seasonal peak in RSV cases is substantially shorter if the
mean force of infection (l) is higher. We have used the average
rate of first RSV infection in Kilifi (0.0022 per day) [16] as the
mean force of infection for our primary analysis, while we have
used the average rate of first RSV infection in Houston (0.0037 per
day) [17] to give an indication of the effect of a particularly high
force of infection. We used the Kilifi data to derive our primary
force of infection estimate for two reasons. Firstly, Kilifi is similar
to our study setting of Bohol in that both are rural, coastal settings
in the tropics. Secondly, the average rate of first infection in Kilifi
appears to be more consistent with the results from the
seroprevalence studies in the literature than the rate of first
infection in Houston (Figure 2). The authors of the Houston paper
note that the cumulative incidence of infection in their study was
similar to that found in child care settings in other similar studies,
which suggests a particularly high risk of infection over the two
years of the Houston study. While using the average rate of first
RSV infection in Kilifi as the mean force of infection for our
primary analysis appears valid, it is clear that for the best precision
when estimating the seasonal pattern of b, precise measurement of
the local force of infection is desirable.
In Figure 4 we plotted the environmental data relative to the
centre of the actual yearly RSV epidemics, because epidemics
occurred at slightly different times each year (the 2002/2003
epidemic occurred 56 weeks after the 2001/2002 epidemic, while
the 2003/2004 epidemic occurred 50 weeks after the 2002/2003
epidemic). In doing so we have implicitly assumed year to year
differences in the timing of the epidemics are due to differences in
the timing of seasonal drivers, rather than due to differences from
year to year in the amplitude of the seasonal forcing. However, as
discussed in the previous paragraph, a higher force of infection is
associated with a shorter lag between the seasonal peak in b and
the seasonal peak in RSV cases. Thus a year with particularly
intense seasonal increase in b would be expected to have an earlier
RSV epidemic. Further modelling incorporating year to year
differences in the amplitude of seasonal forcing may shed
additional light on seasonality, particularly if modelling incidence
during extreme rainfall events, or during poor harvests.
Our findings contribute to the current epidemiologic under-
standing of RSV, the most common cause of ALRI in infants and
children [56]. We have shown that seasonal scale drivers of
transmissibility can act several weeks before and/or after the
seasonal peaks in RSV incidence, and thus it is important to
incorporate the non-linear dynamics of infectious disease trans-
mission when examining potential drivers of infectious disease
seasonality. Our results indicate that the timing of seasonal
variations in nutrition and rainfall patterns in this tropical study
setting are epidemiologically consistent with them being plausible
drivers of RSV seasonality.
Acknowledgments
This study is part of the research of the ARIVAC Consortium. The
ARIVAC Consortium thanks and acknowledges the participation of the
infants, parents, staff, Local Government of the Province of Bohol and
Local Government Units (LGUs) of Baclayon, Balilihan, Cortes, Dauis,
Modelling RSV Seasonality in the Philippines
PLOS ONE | www.plosone.org 9 February 2014 | Volume 9 | Issue 2 | e90094

Panglao and Tagbilaran City; staff of the Pathology and Pediatric
Departments of the BRH, and the private hospitals Tagbilaran
Community Hospital, Borja Family Clinic, Medical Mission Group of
Hospitals, Ramiro Community Hospital, St. Jude Hospital, Englewood
Hospital, and Tagbilaran Puericulture Center. We thank PAGASA for
access to meteorological data from Tagbilaran.
Author Contributions
Conceived and designed the experiments: SP LY PW RSW GW PDS.
Analyzed the data: SP LY RSW GW. Contributed reagents/materials/
analysis tools: EAFS MGL VT HN GW. Wrote the paper: SP. Designed
the models: SP LY. Revised the manuscript: LY EAFS MGL VT HN
RSW PW GW PDS. Conceived the study: SP. Designed the study: SP LY
PW RSW GW PDS.
References
1. Lozano R, Naghavi M, Foreman K, Lim S, Shibuya K, et al. (2012) Global and
regional mortality from 235 causes of death for 20 age groups in 1990 and 2010:
a systematic analysis for the Global Burden of Disease Study 2010. The Lancet
380: 2095–2128.
2. Weber MW, Mulholland EK, Greenwood BM (1998) Respiratory syncytial virus
infection in tropical and developing countries. Tropical Medicine & Interna-
tional Health 3: 268–280.
3. Shek LP-C, Lee B-W (2003) Epidemiology and seasonality of respiratory tract
virus infections in the tropics. Paediatric Respiratory Reviews 4: 105–111.
4. Grassly N, Fraser C (2006) Seasonal infectious disease epidemiology. Proc R Soc B
273: 2541–2550.
5. Tamerius J, Nelson MI, Zhou SZ, Viboud C, Miller MA, et al. (2011) Global
influenza seasonality: reconciling patterns across temperate and tropical regions.
Environmental health perspectives 119: 439.
6. Paynter S, Ware R, Lucero M, Tallo V, Nohynek H, et al. (2013) Poor Growth
and Pneumonia Seasonality in Infants in the Philippines: Cohort and Time
Series Studies. PLOS ONE 8: e67528.
7. Paynter S, Weinstein P, Ware R, Lucero M, Tallo V, et al. (2013) Sunshine,
rainfall, humidity and child pneumonia in the tropics: time-series analyses.
Epidemiology and Infection 141: 1328–1336.
8. Anderson R, May R (1991) Infectious disease of humans. Dynamics and control.
9. Weber A, Weber M, Milligan P (2001) Modeling epidemics caused by
respiratory syncytial virus (RSV). Mathematical biosciences 172: 95–113.
10. Lucero MG, Nohynek H, Williams G, Tallo V, Simoes EAF, et al. (2009)
Efficacy of an 11-Valent Pneumococcal Conjugate Vaccine Against Radiolog-
ically Confirmed Pneumonia Among Children Less Than 2 Years of Age in the
Philippines A Randomized, Double-Blind, Placebo-Controlled Trial. Pediatric
Infectious Disease Journal 28: 455–462.
11. Simoes EA, Patel C, Sung W-K, Lee CW, Loh KH, et al. (2013) Pathogen Chip
for Respiratory Tract Infections. Journal of clinical microbiology 51: 945–953.
12. Dietz K (1976) The incidence of infectious disease under the influence of
seasonal fluctuations. Lecture notes in biomathematics 11: 1–15.
13. Crowcroft N, Zambon M, Harrison T, Mok Q, Heath P, et al. (2008)
Respiratory syncytial virus infection in infants admitted to paediatric intensive
care units in London, and in their families. European journal of pediatrics 167:
395–399.
14. Hall CB, Geiman JM, Biggar R, Kotok DI, Hogan PM, et al. (1976) Respiratory
syncytial virus infections within families. The New England journal of medicine
294: 414.
15. Altizer S, Dobson A, Hosseini P, Hudson P, Pascual M, et al. (2006) Seasonality
and the dynamics of infectious diseases. Ecology Letters 9: 467–484.
16. Ohuma E, Okiro E, Ochola R, Sande C, Cane P, et al. (2012) The natural
history of respiratory syncytial virus in a birth cohort: the influence of age and
previous infection on reinfection and disease. American journal of epidemiology
176: 794–802.
17. Glezen WP, Taber LH, Frank AL, Kasel JA (1986) Risk of primary infection and
reinfection with respiratory syncytial virus. Archives of Pediatrics & Adolescent
Medicine 140: 543.
18. Colocho-Zelaya E, Pettersson C, Forsgren M, Orvell C, Strannegard O (1994)
Respiratory syncytial virus infection in hospitalized patients and healthy children
in El Salvador. American Journal of Tropical Medicine and Hygiene 51: 577–
584.
19. Cox M, Azevedo R, Cane P, Massad E, Medley G (1998) Seroepidemiological
study of respiratory syncytial virus in Sao Paulo State, Brazil. Journal of medical
virology 55: 234–239.
20. Bhattarakosol P, Pancharoen C, Mungmee V, Thammaborvorn R, Semboonlor
L (2003) Seroprevalence of anti-RSV IgG in Thai children aged 6 months to 5
years. Asian Pacific Journal of Allergy and Immunology 21: 269–271.
21. Zhang Q, Yang X, Zhao Y, Zhao X (2008) High seroprevalence of human
metapneumovirus infection in children in Chongqing, China. Chinese Medical
Journal (English Edition) 121: 2162.
22. Lu G, Gonzalez R, Guo L, Wu C, Wu J, et al. (2011) Large-scale seroprevalence
analysis of human metapneumovirus and human respiratory syncytial virus
infections in Beijing, China. Virol J 8: 62.
23. Hall CB, Walsh EE, Long CE, Schnabel KC (1991) Immunity to and frequency
of reinfection with respiratory syncytial virus. Journal of Infectious Diseases 163:
693–698.
24. Mills J, Van Kirk JE, Wright PF, Chanock RM, Fishburne IE (1971)
Experimental respiratory syncytial virus infection of adults Possible mechanisms
of resistance to infection and illness. The Journal of Immunology 107: 123–130.
25. Mufson M, Belshe R, Orvell C, Norrby E (1987) Subgroup characteristics ofrespiratory syncytial virus strains recovered from children with two consecutive
infections. Journal of clinical microbiology 25: 1535–1539.
26. Henderson FW, Collier AM, Clyde Jr WA, Denny FW (1979) Respiratory-syncytial-virus infections, reinfections and immunity. A prospective, longitudinal
study in young children. The New England journal of medicine 300: 530.
27. Kapikian AZ, Bell JA, Mastrota FM, Johnson KM, Huebner RJ, et al. (1961) Anoutbreak of febrile illness and pneumonia associated with respiratory syncytial
virus infection. American journal of epidemiology 74: 234–248.
28. Kravetz H, Knight V, Chanock R, Morris J, Johnson K, et al. (1961)Respiratory syncytial virus. III. Production of illness and clinical observations in
adult volunteers. JAMA: the journal of the American Medical Association 176:
657.
29. Watt P, Robinson B, Pringle C, Tyrrel D (1990) Determinants of susceptibility tochallenge and the antibody response of adult volunteers given experimental
respiratory syncytial virus vaccines. Vaccine 8: 231–236.
30. DeVincenzo JP, Wilkinson T, Vaishnaw A, Cehelsky J, Meyers R, et al. (2010)Viral load drives disease in humans experimentally infected with respiratory
syncytial virus. American journal of respiratory and critical care medicine 182:1305.
31. Hawker J, Begg N, Blair I, Reintjes R, Weinberg J (2005)Communicable Disease
Control Handbook. Blackwell Publishing.
32. Hall CB, Douglas RG, Geiman JM (1976) Respiratory syncytial virus infectionsin infants: quantitation and duration of shedding. The Journal of Pediatrics 89:
11–15.
33. Waris M, Meurman O, Mufson MA, Ruuskanen O, Halonen P (1992) Shedding
of infectious virus and virus antigen during acute infection with respiratorysyncytial virus. Journal of medical virology 38: 111–116.
34. Okiro EA, White LJ, Ngama M, Cane PA, Medley GF, et al. (2010) Duration of
shedding of respiratory syncytial virus in a community study of Kenyan children.BMC Infectious Diseases 10: 15.
35. Hall CB, Long CE, Schnabel KC (2001) Respiratory syncytial virus infections in
previously healthy working adults. Clinical infectious diseases 33: 792–796.
36. Frank A, Taber L, Wells C, Wells J, Glezen W, et al. (1981) Patterns of sheddingof myxoviruses and paramyxoviruses in children. Journal of Infectious Diseases
144: 433–441.
37. White L, Mandl J, Gomes M, Bodley-Tickell A, Cane P, et al. (2007)Understanding the transmission dynamics of respiratory syncytial virus using
multiple time series and nested models. Mathematical biosciences 209: 222–239.
38. Lawrence MG (2005) The relationship between relative humidity and thedewpoint temperature in moist air: A simple conversion and applications.
Bulletin of the American Meteorological Society 86: 225–233.
39. Hort KP (1987) Seasonal variation of birth weight in Bangladesh. Annals of
Tropical Paediatrics 7: 66–71.
40. Chevalier P, Sevilla R, Sejas E, Zalles L, Belmonte G, et al. (1998) Immune
recovery of malnourished children takes longer than nutritional recovery:
implications for treatment and discharge. Journal of tropical pediatrics 44: 304–307.
41. Nassar M, Younis N, Tohamy A, Dalam D, El Badawy M (2007) T-lymphocyte
subsets and thymic size in malnourished infants in Egypt: a hospital-based study.Eastern Mediterranean Health Journal 13: 1031–1042.
42. Castillo-Duran C, Heresi G, Fisberg M, Uauy R (1987) Controlled trial of zinc
supplementation during recovery from malnutrition: effects on growth andimmune function. The American journal of clinical nutrition 45: 602–608.
43. O’Grady K-AF, Torzillo PJ, Chang AB (2010) Hospitalisation of Indigenous
children in the Northern Territory for lower respiratory illness in the first year of
life. Medical Journal of Australia 192: 586.
44. Yusuf S, Piedimonte G, Auais A, Demmler G, Krishnan S, et al. (2007) Therelationship of meteorological conditions to the epidemic activity of respiratory
syncytial virus. Epidemiology and Infection 135: 1077–1090.
45. Katona P, Katona-Apte J (2008) The interaction between nutrition andinfection. Clinical Infectious Diseases 46: 1582–1588.
46. Okiro EA, Ngama M, Bett A, Cane PA, Medley GF, et al. (2008) Factors
associated with increased risk of progression to respiratory syncytial virusassociated pneumonia in young Kenyan children. Tropical Medicine &
International Health 13: 914–926.
47. Cilla G, Sarasua A, Montes M, Arostegui N, Vicente D, et al. (2006) Risk factorsfor hospitalization due to respiratory syncytial virus infection among infants in
the Basque Country, Spain. Epidemiology and infection 134: 506–513.
48. Leader S, Kohlhase K (2003) Recent trends in severe respiratory syncytial virus
(RSV) among US infants, 1997 to 2000. The Journal of pediatrics 143: 127–132.
Modelling RSV Seasonality in the Philippines
PLOS ONE | www.plosone.org 10 February 2014 | Volume 9 | Issue 2 | e90094

49. Paynter S, Ware R, Lucero M, Tallo V, Nohynek H, et al. (2014)Malnutrition: a
risk factor for severe respiratory syncytial virus infection and hospitalization.
Pediatric Infectious Disease Journal. (In press).
50. Lofgren E, Fefferman N, Naumov Y, Gorski J, Naumova E (2007) Influenza
seasonality: underlying causes and modeling theories. Journal of Virology 81:
5429–5436.
51. Murray E, Klein M, Brondi L, McGowan J, Van Mels C, et al. (2012) Rainfall,
household crowding, and acute respiratory infections in the tropics. Epidemi-
ology and Infection 140: 78–86.
52. Belderbos ME, Houben ML, Wilbrink B, Lentjes E, Bloemen EM, et al. (2011)
Cord blood vitamin D deficiency is associated with respiratory syncytial virus
bronchiolitis. Pediatrics 127: e1513–e1520.
53. Zhu Z, Zhan J, Shao J, Chen W, Chen L, et al. (2012) High prevalence of
vitamin D deficiency among children aged 1 month to 16 years in Hangzhou,China. BMC Public Health 12: 126.
54. Rajakumar K, de las Heras J, Chen TC, Lee SJ, Holick MF, et al. (2011)
Vitamin D status, adiposity, and lipids in black American and Caucasianchildren. Journal of Clinical Endocrinology & Metabolism 96: 1560–1567.
55. White L, Waris M, Cane P, Nokes D, Medley G (2005) The transmissiondynamics of groups A and B human respiratory syncytial virus (hRSV) in
England & Wales and Finland: seasonality and cross-protection. Epidemiology
and Infection 133: 279–289.56. Nair H, Nokes DJ, Gessner BD, Dherani M, Madhi SA, et al. (2010) Global
burden of acute lower respiratory infections due to respiratory syncytial virus inyoung children: a systematic review and meta-analysis. The Lancet 375: 1545–
1555.
Modelling RSV Seasonality in the Philippines
PLOS ONE | www.plosone.org 11 February 2014 | Volume 9 | Issue 2 | e90094