supplement to global sinusoidal seasonality in precipitation
TRANSCRIPT

Supplement to Global sinusoidal seasonality in precipitation isotopes (in review for HESS)
S. T. Allen, S. Jasechko, W. R. Berghuijs, J. M. Welker, G. R. Goldsmith, J. W. Kirchner
Table S1. Multiple regression coefficients and fit statistics for models describing the spatial variations in sine
parameters that capture seasonal precipitation isotope cycles (amount-weighted fitted δ18O, robust-fitted δ2H, and
amount-weighted fitted δ2H; see Table 2 for robust-fitted δ18O). Dashes mark predictors that were excluded by the
stepwise-regression model selection.
* referring to amount-weighted sine curve fits a referring to sites in latitudes > 30° (N or S) b referring to sites in latitudes < 30° (N or S)
|Latitude|
(° from
equator)
Elevation
(m asl)
Dist. from
coast (km)
Temp.
range (°C)
Mean Annual
Temp. (°C)
Mean Annual
Precip. (mm yr-1)
Intercept
RMSE
R2
Amplitude
(‰ δ18O)* -0.07 0.0002 0.0013 0.07 -0.1 — 5.2 1.2 0.56
Phase (days)*a 0.39 0.0091 — — — — -1.2 13.5 0.24
Phase (days)*b -1.15 — — — — — -92.2 35.1 0.23
Offset
(‰ δ18O)* 0.10 — — -0.11 0.5 -0.0006 -15.5 1.9 0.79
Amplitude
(‰ δ2H) -0.48 0.0024 0.0105 0.55 -1.1 — 39.1 9.5 0.61
Phase (days)a 0.31 0.0089 -0.0044 — — — 9.3 13.9 0.19
Phase (days)b -1.07 — — 0.74 — — -105.6 24.7 0.19
Offset
(‰ δ2H) 0.87 0.0027 — -0.90 4.7 -0.0054 -123.5 17.6 0.81
Amplitude
(‰ δ2H)* -0.56 0.0013 0.0099 0.49 -1.1 — 43.2 9.8 0.53
Phase (days)*a — 0.0072 — — -0.4 — -21.1 15.5 0.23
Phase (days)*b — — — — — 0.0454 -130.8 151.9 0.06
Offset
(‰ δ2H)* 0.68 — — -0.80 4.0 -0.0052 -110.8 17.0 0.78
Supplement to Global sinusoidal seasonality in precipitation isotopes (in review for HESS)
S. T. Allen, S. Jasechko, W. R. Berghuijs, J. M. Welker, G. R. Goldsmith, J. W. Kirchner
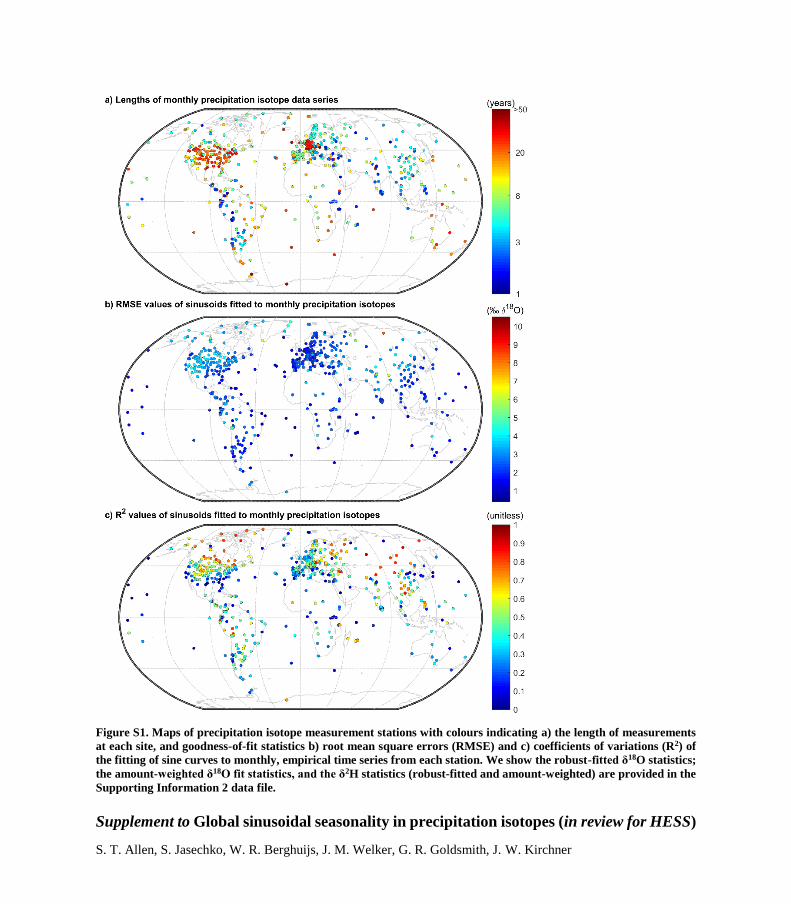
Figure S1. Maps of precipitation isotope measurement stations with colours indicating a) the length of measurements
at each site, and goodness-of-fit statistics b) root mean square errors (RMSE) and c) coefficients of variations (R2) of
the fitting of sine curves to monthly, empirical time series from each station. We show the robust-fitted δ18O statistics;
the amount-weighted δ18O fit statistics, and the δ2H statistics (robust-fitted and amount-weighted) are provided in the
Supporting Information 2 data file.

Supplement to Global sinusoidal seasonality in precipitation isotopes (in review for HESS)
S. T. Allen, S. Jasechko, W. R. Berghuijs, J. M. Welker, G. R. Goldsmith, J. W. Kirchner
Figure S2. Scatter plots of fitted sine parameters describing precipitation δ18O seasonal cycles – a-f) amplitude, g-l)
phase, m-r) offset – versus site characteristics. Phase refers to day of peak temperature or precipitation amount, relative
to the summer solstice. Precip ampl. refers to seasonal amplitude of precipitation amount. Seasonality metrics are
calculated as the temperature or precipitation amplitude multiplied by 1.0 if they peak in the summer, and -1.0 if they
peak in winter. Colours indicate absolute latitude (high latitudes in blue, low latitudes in red) as shown in Figure 2.
Supplement to Global sinusoidal seasonality in precipitation isotopes (in review for HESS)
S. T. Allen, S. Jasechko, W. R. Berghuijs, J. M. Welker, G. R. Goldsmith, J. W. Kirchner
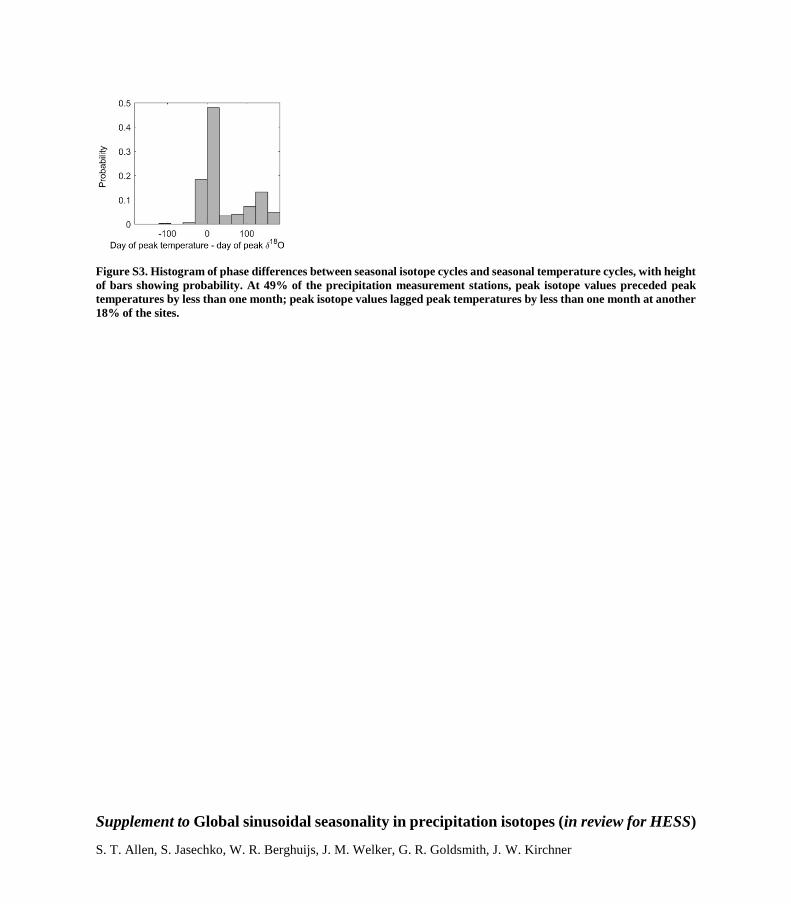
Figure S3. Histogram of phase differences between seasonal isotope cycles and seasonal temperature cycles, with height
of bars showing probability. At 49% of the precipitation measurement stations, peak isotope values preceded peak
temperatures by less than one month; peak isotope values lagged peak temperatures by less than one month at another
18% of the sites.
Supplement to Global sinusoidal seasonality in precipitation isotopes (in review for HESS)
S. T. Allen, S. Jasechko, W. R. Berghuijs, J. M. Welker, G. R. Goldsmith, J. W. Kirchner
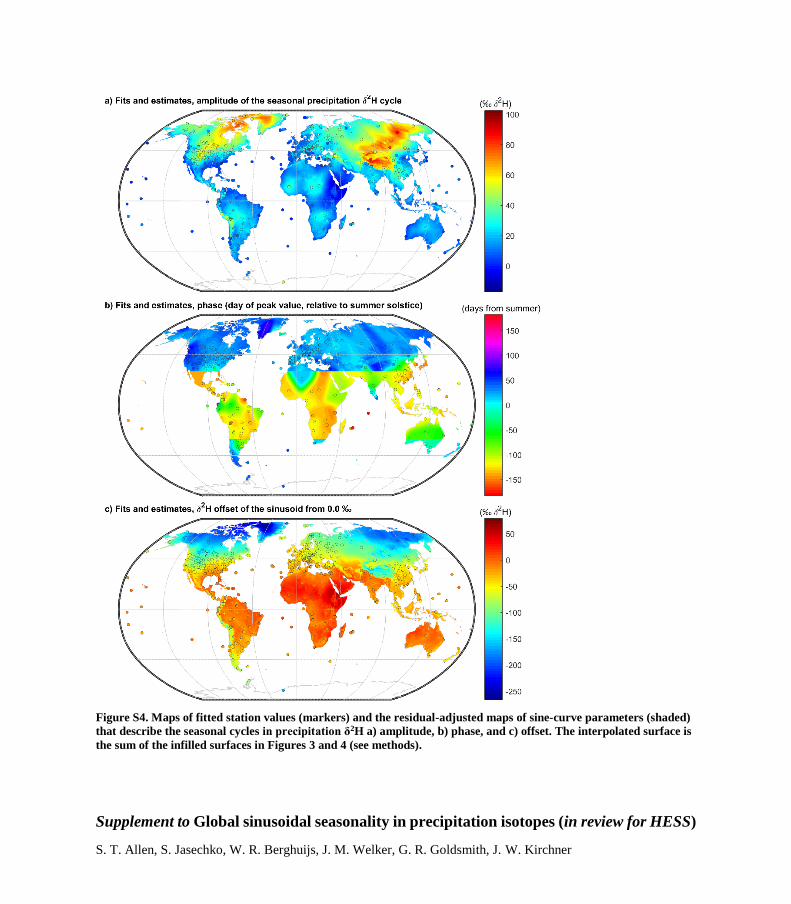
Figure S4. Maps of fitted station values (markers) and the residual-adjusted maps of sine-curve parameters (shaded)
that describe the seasonal cycles in precipitation δ2H a) amplitude, b) phase, and c) offset. The interpolated surface is
the sum of the infilled surfaces in Figures 3 and 4 (see methods).

Supplement to Global sinusoidal seasonality in precipitation isotopes (in review for HESS)
S. T. Allen, S. Jasechko, W. R. Berghuijs, J. M. Welker, G. R. Goldsmith, J. W. Kirchner
Figure S5. Elevations reported for sites regressed against gridded predictions of elevations of pixels containing those
sites. Mismatches likely occur because grid-averaged values poorly capture small-scale variations in elevation.
7
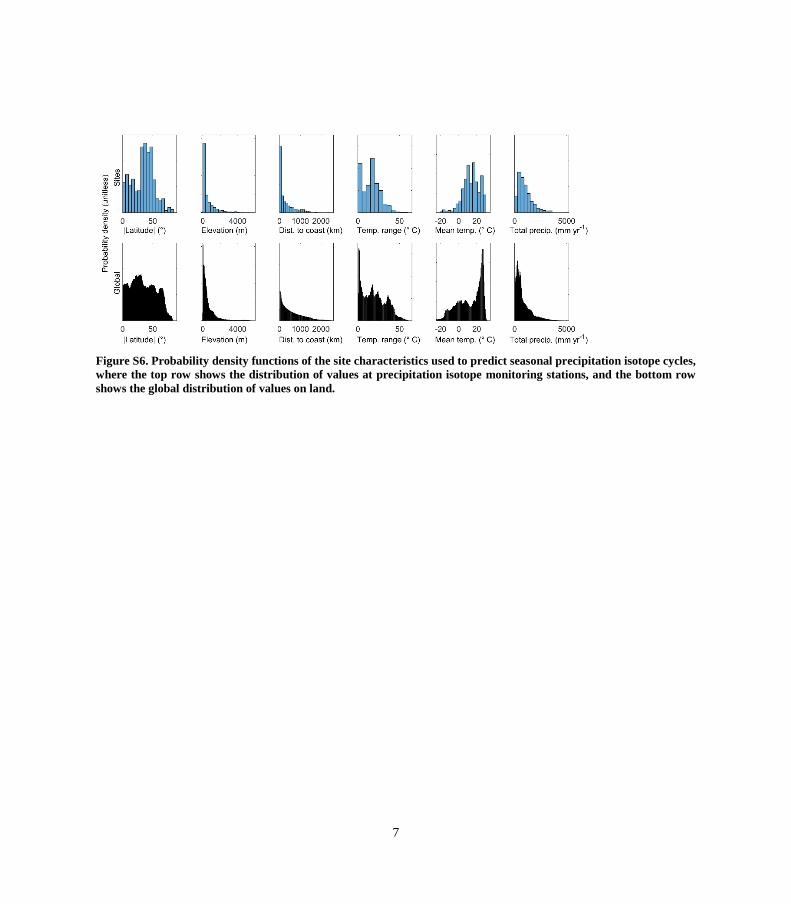
Figure S6. Probability density functions of the site characteristics used to predict seasonal precipitation isotope cycles,
where the top row shows the distribution of values at precipitation isotope monitoring stations, and the bottom row
shows the global distribution of values on land.

8
Figure S7. Elevation versus latitude of precipitation isotope monitoring sites. Very high elevation precipitation isotope
monitoring sites are almost exclusively located in the intra-tropical zone (specifically, in the Andes mountains). High
latitude sites are mostly in low elevation regions.