seasonality of arbuscular mycorrhizal hyphae and glomalin in
TRANSCRIPT
Plant and Soil 257: 71–83, 2003.© 2003 Kluwer Academic Publishers. Printed in the Netherlands.
71
Seasonality of arbuscular mycorrhizal hyphae and glomalin in a westernMontana grassland
Emily R. Lutgen1, Deborah Muir-Clairmont2, Jon Graham3 & Matthias C. Rillig1,4
1Microbial Ecology Program, Division of Biological Sciences, The University of Montana, Missoula, MT 59812,USA. 2Salish Kootenai College, P.O. Box 117, Pablo, MT 59855, USA. 3Department of Mathematical Sciences,The University of Montana, Missoula, MT 59812, USA. 4Corresponding author∗
Received 19 November 2002. Accepted in revised form 17 June 2003
Key words: AMF hyphal products, root colonization, root length, soil moisture
Abstract
In order to more fully understand the basic biology of arbuscular mycorrhizal fungi (AMF), and their role in naturalecosystems, it is necessary to document seasonal changes of various aspects of the life history of these fungi. Dueto their unique position at the root-soil interface, AMF have been described as ‘keystone mutualists’ in ecosystems.Despite the importance of AMF in ecosystems, few studies exist that examine the seasonality of external hyphaeand their exuded products (e.g. glomalin), the AMF variables directly related to ecosystem function through theircontributions to soil aggregation. This study examined seasonal dynamics of several soil variables, with a specificinterest in the seasonality of external hyphae and glomalin, a glycoprotein produced by AMF, which is correlatedwith soil aggregate stability. Here we measured glomalin concentrations and external AMF and non-AMF hyphallength, as well as soil moisture, percent fungal root colonization (AMF and non-AMF), and root length in soilin an intermountain grassland in western Montana over one growing season (13 time points). Of the glomalinpools and hyphal lengths measured, significant seasonal changes occurred for total glomalin (TG; 24.5% change),immunoreactive easily extractable glomalin (IREEG; 53.8% change), and AM hyphal length (107% change). Priorstudies on glomalin in natural systems have not considered seasonal effects. The small seasonal change in glomalinpools lends further support to the hypothesis that glomalin is relatively stable in soils, and suggests that one-time sampling may be sufficient to satisfactorily capture this response variable. However, the generality of thisobservation has yet to be tested in a wider range of ecosystems.
Introduction
AMF are obligately biotrophic fungi that are closelyassociated with both host plants and the soil envir-onment, function as an extension of the root systeminto the soil, and have numerous effects on plantphysiology and plant communities (e.g. Allen, 1991;Smith and Read, 1997; van der Heijden et al., 1998).AMF play an integral role in the translocation of car-bon to soil, having direct access to root carbon (Smithand Read, 1997). Due to their unique position atthe root-soil interface, AMF have been described as
∗ FAX No: 406-243-4184. E-mail: [email protected]
‘keystone mutualists’ in ecosystems (O’Neill et al.,1991).
In order to more fully comprehend the role of AMFin natural ecosystems, as well as their basic biology,it is important to document seasonal changes of vari-ous aspects of the life history of these fungi. Whilenumerous studies have examined seasonality of AMFspore production and root colonization (e.g., Andersonet al., 1984; Gay et al., 1982; Johnson et al., 1991;Mullen and Schmidt, 1993; Sanders and Fitter, 1992),studies examining the seasonality of AMF extraradicalhyphae and their exuded products are sparse. Althoughfungal spore production and root colonization are im-portant for elucidating fungal life histories (Hart andReader, 2002), neither of these characteristics directly
72
relate to an ecosystem process or state variable. Con-versely, extraradical hyphae and their products, suchas glomalin, can be directly related to ecosystem pro-cesses, e.g. by virtue of their contributions to soilaggregate stability (Jastrow and Miller, 1997; Wrightand Upadhyahya, 1998). More specifically, AMF con-tribute to soil aggregation through the hyphal entan-glement process, assisting in soil aggregate formation(Jastrow and Miller, 1997). AMF produce extracellu-lar polymeric compounds on hyphal surfaces, whichcan adhere to inorganic materials, helping to stabil-ize soil aggregates (Jastrow and Miller, 1997). As anexample, extraradical hyphae of all AMF genera pro-duce glomalin, a glycoprotein that is highly correlatedwith the percentage of water-stable aggregates (WSA)in soil (Wright and Upadhyahya, 1998; Rillig et al.,2001). Glomalin is not produced by other groups ofsoil fungi so far tested (Wright et al., 1996).
Few studies have examined the seasonality of ex-traradical hyphae in the field, and sampling intensitywas generally low. Kabir et al. (1997) examined theseasonal changes of extraradical and intraradical ar-buscular mycorrhizal hyphae affected by tillage andfertilization in an agricultural soil over a growingseason (n=4). Abundance of AM hyphae fluctuatedsignificantly within a growing season, with lowesthyphal densities found in the spring. Seasonal vari-ation in mycorrhizal root colonization followed cornplant development, increasing up to silking and de-creasing thereafter. Miller et al. (1995) examinedexternal hyphal production and its relation to grossroot morphology (specific root length: SRL) over aseason in two temperate grassland communities (n=4).SRL was strongly associated with external hyphallengths, where root systems with low SRL had greaterlengths of external hyphae. Staddon et al. (2003) foundchanges in extraradical hyphal length (over a growingseason from April to November; n=4) in a pasture, ran-ging almost across an order of magnitude as a functionof treatment and sampling time. From these studies, itis clear that important seasonal patterns in extraradicalhyphal length may exist, but the database is too smallto draw firm conclusions. Seasonal dynamics of AMFhyphal products, such as glomalin, are unknown.
The field study described herein examines the sea-sonality of AMF extraradical hyphae and glomalin ina grassland invaded by spotted knapweed. We also re-late these values to intraradical colonization. Total rootlength and the root length of two root diameter sizeclasses were also measured to examine the relationshipof hyphae and their products to plant root morphology.
Table 1. Physical and chemical properties of soils∗ at theNorth Hills field site, Missoula, MT
Percent
Organic matter 5.72
Sand 63.50
Silt 21.50
Clay 14.50
Kjeldahl N 0.32
mg/g
Nitrate-N 10.80
Olsen P 12.25
K 358.2
Fe 39.1
CEC (meq/100 g) 13.50
∗ determined by South Dakota State University Soil TestingLaboratory.
Materials and methods
Site description
This research site was located in a grassland with aninitial invasion of spotted knapweed approximately1 km north of Missoula, Montana, in the North Hillsarea. The plant community of this area is an Idaho fes-cue/bluebunch wheatgrass community type (Festucaidahoensis/Agropyron spicatum) (Mueggler and Stu-art, 1980). The soil at this site is a sandy loam with pH6.6 (Table 1).
Field experiment and sampling
Soil samples (n=5) were collected along a 5-m tran-sect. A soil sample consisted of 3–4 soil cores (2 cmdiameter) taken within a 15 × 15 cm area and pooledtogether. Samples were taken beginning on May 13,2001, and then approximately bi-weekly until the lastsampling date, November 30, 2001, for a total of 13time points. Samples were repeatedly taken within thesame 15 × 15 cm area and 5-m transect through time.Gravimetric soil moisture was determined on a sub-sample of soil (5 g) from each sample at each timepoint. All soil samples were dried overnight at 70 ◦C.Soil samples were sealed in polyethylene bags andstored at –20 ◦C until analysis.
Monthly precipitation and temperature data wereobtained from the Missoula International Airportweather station, approximately 11 km southwest of
73
the study site (Western Regional Climate Center andNational Climatic Data Center).
Extraradical hyphal and glomalin measurements
Extraradical hyphae were extracted from soil samples(4 g) using an aqueous extraction and filtration method(Rillig et al., 1999). Arbuscular mycorrhizal (AM)hyphae were distinguished from non-mycorrhizalhyphae at 200× magnification using similar criteria toMiller et al. (1995). Hyphal length was determined us-ing the line intersect method as described in Jakobsenet al. (1992) and Tennant (1975).
Two detection methods are used to quantify glom-alin: the Bradford protein assay, yielding the eas-ily extractable glomalin (EEG) and the total glom-alin (TG) fractions, and an ELISA assay (employingthe monoclonal antibody developed against crushedspores of Glomus intraradices; Wright and Upad-hyahya, 1998), yielding the immunoreactive easily ex-tractable glomalin (IREEG) and immunoreactive totalglomalin (IRTG) fractions. These glomalin fractionsare operationally defined based on their extractabil-ity/solubility and detection methods (much like othersoil fractions, such as humic acids). While the ELISAassay is a very specific detection method for glom-alin, the more general Bradford protein assay is alsoutilized. This protein assay may capture glomalinprotein that has undergone small (perhaps microbially-mediated) changes, possibly resulting in the destruc-tion or concealment of the epitope for the monoclonalantibody. Because of well-documented and strong cor-relations with soil aggregate stability (e.g., Wright andUpadhyahya, 1998), these glomalin fractions continueto be quantified. Although the Bradford protein as-say is generally utilized to measure total protein, ithas been shown by SDS–PAGE that glomalin crudeextract from soil (as measured in the Bradford assay)has similar banding patterns to glomalin extracts fromsingle-species AMF sand cultures (Rillig et al., 2001).
Glomalin extractions from soil (1 g) were carriedout as described by Wright and Upadhyahya (1998).The EEG fraction was extracted with 20 mM sodiumcitrate, pH 7.0 at 121 ◦C for 30 min. Following theEEG extraction, the TG fraction was extracted with50 mM sodium citrate, pH 8.0 at 121 ◦C for 60 mincycles until the supernatant showed none of the red-brown color typical of glomalin. Both fractions ofglomalin were analyzed using the Bradford ProteinAssay (Bio-Rad, Melville, NY). The glomalin frac-tions were further analyzed using an enzyme-linked
immunosorbent assay (ELISA) using the monoclonalantibody MAb32B11. Thus, after all glomalin ana-lyses were completed, four fractions of glomalinvalues were obtained: EEG, TG, IREEG, and IRTG.
Root extraction and quantification
Roots were removed from the soil samples by a handflotation and sieving method modified from Cook et al.(1988) and Miller et al. (1995). A 10 g subsample fromeach soil sample was soaked in 100 mL of tap waterand 20 mL sodium hexametaphosphate (35 g L−1) for30 min. The soil suspension was then added to 880mL tap water (total volume: 1000 mL), manually agit-ated to suspend roots, and poured through 212 µmand 0.5 mm sieves to retain roots. This process wasrepeated five times with all soil samples to maximizeretrieval of roots. Separated roots were washed withtap water several times to remove any attached soil.No attempt was made to distinguish between currentand previous year’s growth. Obvious organic materialand other debris were removed. Extracted roots weredried in a drying oven at 70 ◦C overnight and storedat room temperature until analysis. Total root lengthand root lengths of two root diameter size classes,fine roots (>0.25 mm diameter) and very fine roots(<0.25 mm diameter), were measured using the Win-Rhizo V. 5.0A root image analysis system (RégentInstruments Inc, Québec, Canada). Total root lengthcolonized by AM hyphae was calculated by multiply-ing root length by percent AM hyphal colonization foreach sample. The efficiency of the root extraction pro-cedure was determined by re-extracting soils (n=3).Any visible roots were removed from the dried soiland measured using the Win-Rhizo root image ana-lysis system. Extraction efficiency was determined tobe 98%.
Percent AM root colonization
Roots were cleared in 10% KOH for 1 h at 80 ◦C, acid-ified with 1% HCl for 15 min, and then stained withtrypan blue in lactoglycerol (0.05%). Roots were leftin clear lactoglycerol overnight, and then 1 cm pieceswere placed on microscope slides for analysis. Percentcolonization was measured by the gridline intersectmethod as described by Rillig et al. (1999).
Data analysis
All response variables were analyzed first using re-peated measures multivariate analysis of variance by
74
Table 2. Monthly mean temperature and precipitation data forMissoula, MT for 2001 and long-term (LT) averages
Month Temperature (◦C) Precipitation (cm)
2001 LT average 2001 LT average
January –5.5 –5.2 1.78 3.15
February –5.1 –1.6 1.70 2.01
March 2.9 2.1 2.03 2.46
April 6.0 6.8 2.92 2.44
May 12.6 11.0 1.02 4.52
June 14.6 15.6 9.93 4.52
July 19.2 19.3 3.99 2.31
August 21.2 18.8 0.23 3.05
September 16.3 13.2 0.79 2.84
October 6.8 6.8 5.38 1.88
November 2.2 0.2 1.12 2.06
December –3.4 –4.8 2.84 2.95
GLM procedures of SPSS statistical software (SPSSInc., version 11.0.1, 2001) since these variables cannotreasonably be assumed to be independent (Scheinerand Gurevitch, 1993). The effect of time on each re-sponse variable was then determined using univariaterepeated measures analysis of variance in the pro-cedure of SPSS (SPSS Inc., version 11.0.1, 2001).All response variables were tested with the adjustedHuynh and Feldt (1976) F-test (P< 0.05). Pearsonproduct-moment correlations (r) on the means (n=13)were determined in the procedure of JMP (version3.1.6.2, 1996). The coefficient of variation (cov) wascalculated by dividing the standard deviation of meansby the grand mean for each response variable. Thepercent change for response variables was calculatedas ((mean Xmax – mean Xmin) / mean Xmin)∗100.
Results
Repeated measures multivariate analysis of the re-sponse variables measured revealed a significant dif-ference (RM-MANOVA: F180,118: 2.413, P<0.001),justifying further analysis of individual response vari-ables.
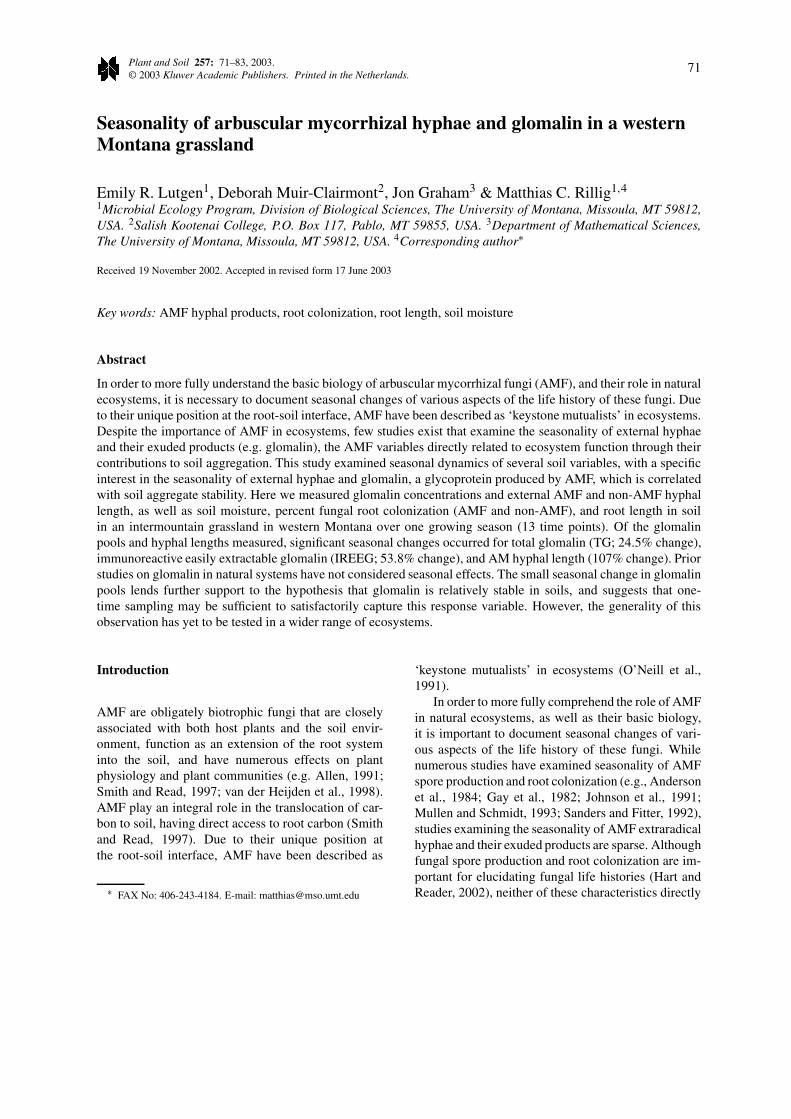
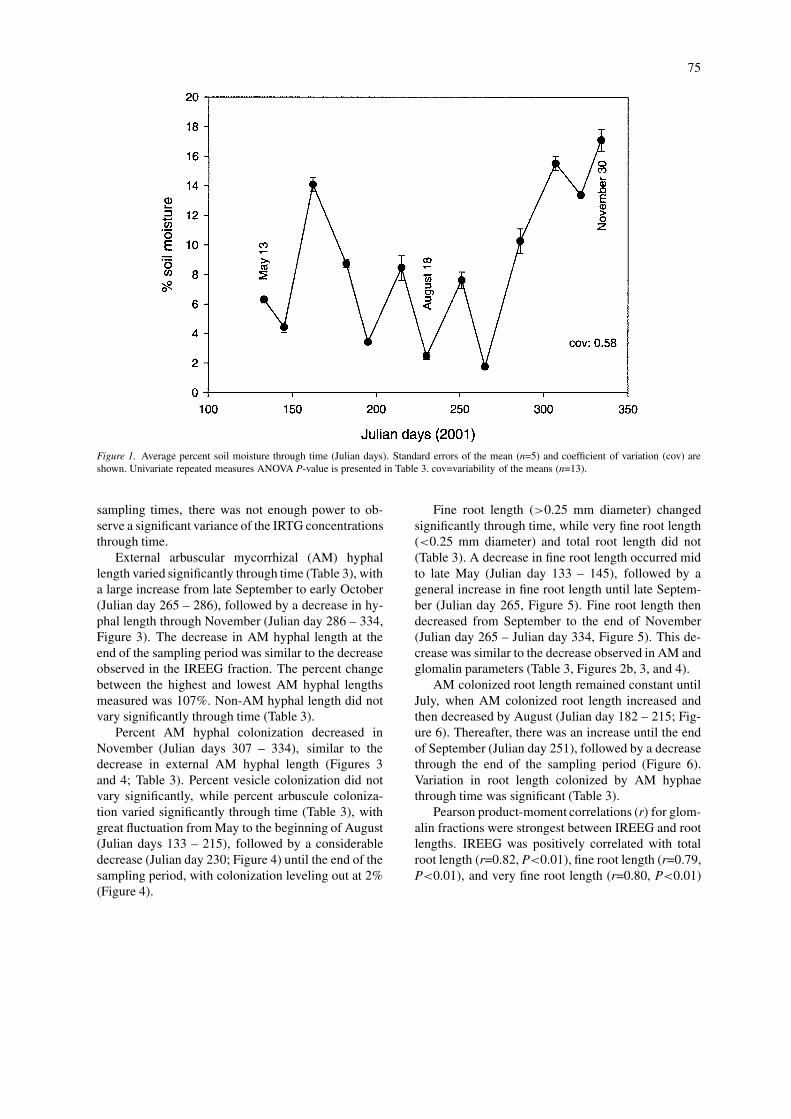
Monthly mean temperature and precipitation datafor Missoula, MT in the year 2001 and long-term aver-ages are presented in Table 2. In 2001, Montana exper-ienced severe drought conditions (Montana DroughtMonitoring, 2001). The mean percent soil moisturefor the study site at each sampling time is presented in
Table 3. F- and P- values from univariate repeated measuresanalysis of variance for glomalin, arbuscular mycorrhizal (AM),and root parameters. P-values <0.05 are bolded. All responsevariables were tested with the adjusted Huynh and Feldt F-test
Variable F P
Percent soil moisture 109.2 <0.001Easily extractable glomalin (EEG) 0.942 0.515
Total glomalin (TG) 2.405 0.016Immunoreactive easily extractable 2.097 0.047glomalin (IREEG)
Immunoreactive total glomalin (IRTG) 0.494 0.259
AM hyphal length 2.416 0.033Non-AM hyphal length 1.697 0.097
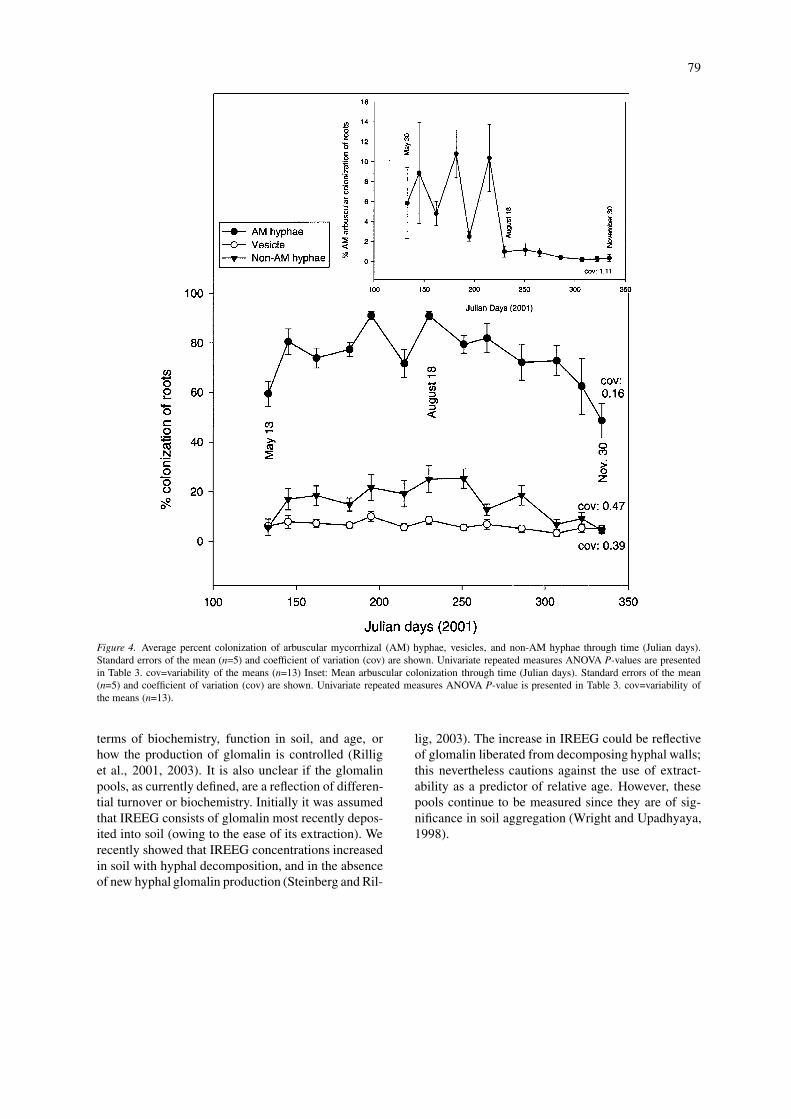
Percent AM hyphal colonization 4.678 0.001Percent AM vesicle colonization 1.459 0.227
Percent AM arbuscule colonization 3.414 0.009Percent non-AM hyphal colonization 3.361 0.003Total root length 1.398 0.200
Fine root length (>0.25 mm diameter) 3.037 0.003Very fine root length (<0.25 mm 1.299 0.250
diameter)
AM colonized root length 2.576 0.028
Figure 1. Variation in the mean percent soil moisturethrough time was significant (Table 3).
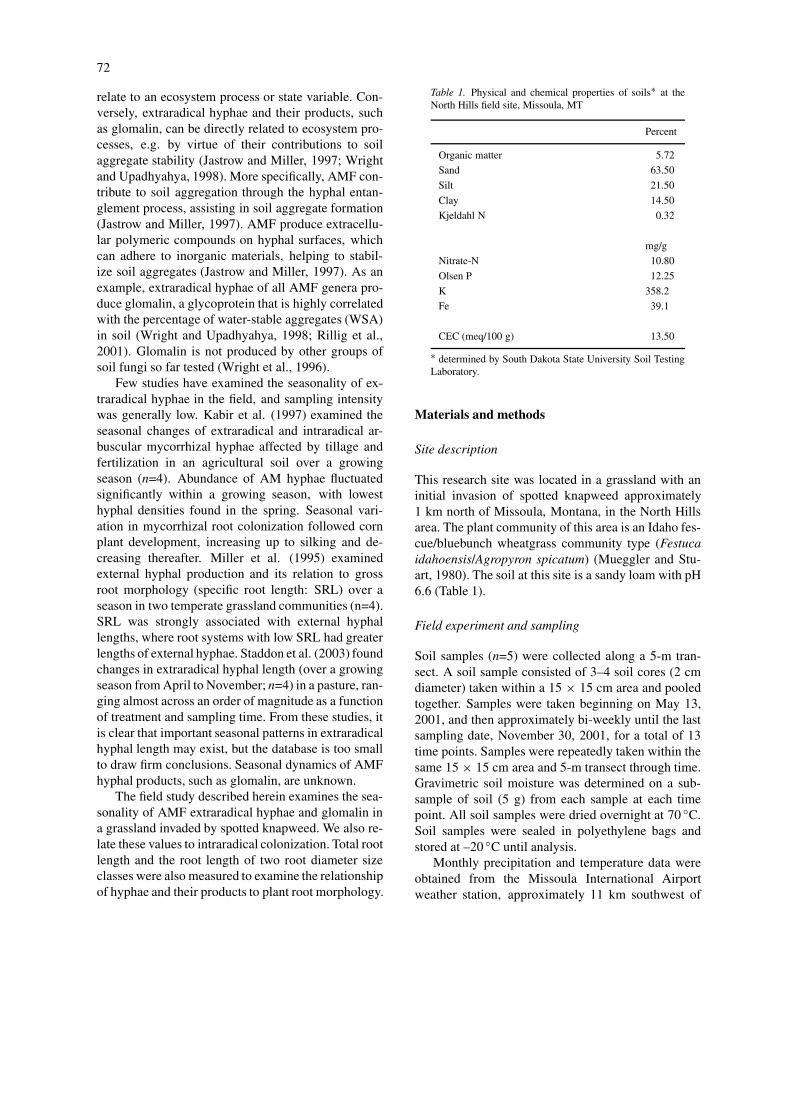
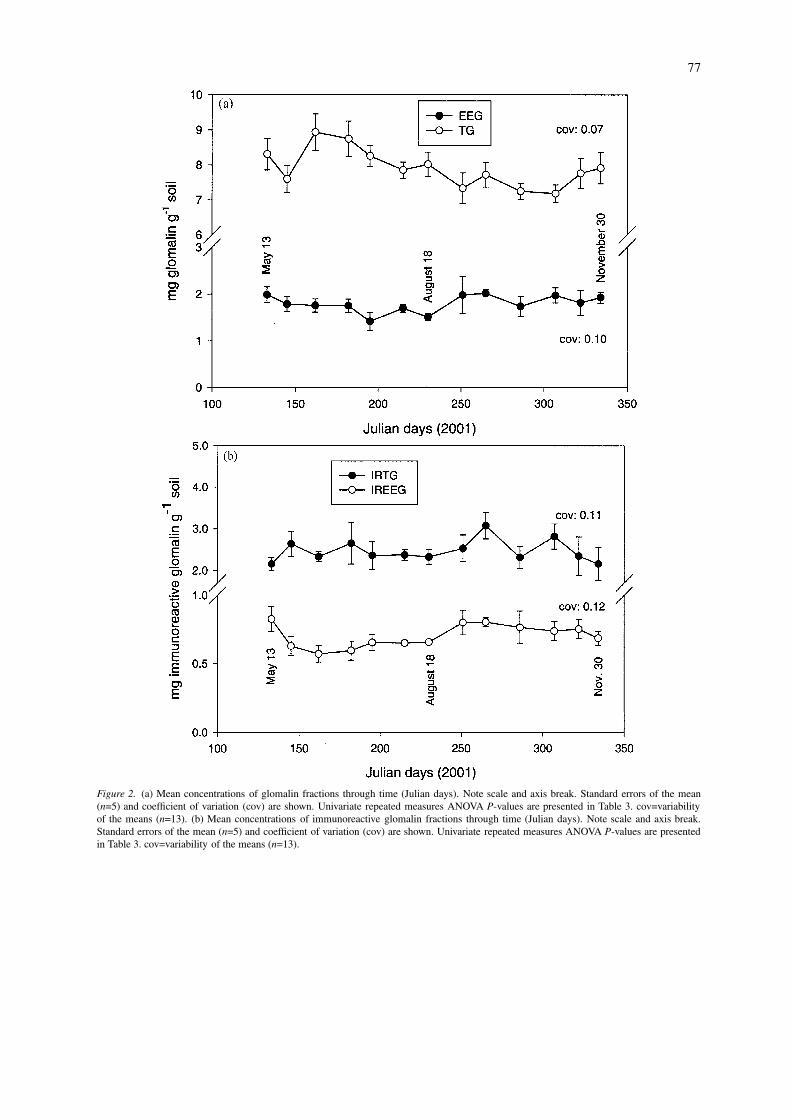
The concentration of TG fluctuated significantlythrough time (Table 3), with a 24.5% change betweenthe lowest and highest average concentrations. Thelow coefficient of variation indicates that individualsamples did not vary greatly from the overall mean.There was an increase in TG concentration from lateMay to June (Julian day 145 – 162), followed by ageneral downward trend until early November (Julianday 307; Figure 2a). In November, TG concentra-tions increased until the end of the sampling period(Figure 2a). Conversely, there were no significantdifferences in the EEG fraction (Table 3).
Variation in the IREEG fraction, but not the IRTGfraction, was significant through time (Table 3), andalso had a low coefficient of variation (Figure 2b).There was a 53.8% change between the lowest andhighest average concentrations of IREEG. An initialdecrease in the concentration of IREEG occurred fromMay to June (Julian day 133 – 162), with IREEG con-centrations generally rising thereafter until October(Julian day 286). After October, the concentration ofIREEG again decreased (Figure 2b). The IRTG patternthrough time was similar to that of the IREEG fraction(Figure 2b). However, due to large variation at some
75
Figure 1. Average percent soil moisture through time (Julian days). Standard errors of the mean (n=5) and coefficient of variation (cov) areshown. Univariate repeated measures ANOVA P-value is presented in Table 3. cov=variability of the means (n=13).
sampling times, there was not enough power to ob-serve a significant variance of the IRTG concentrationsthrough time.
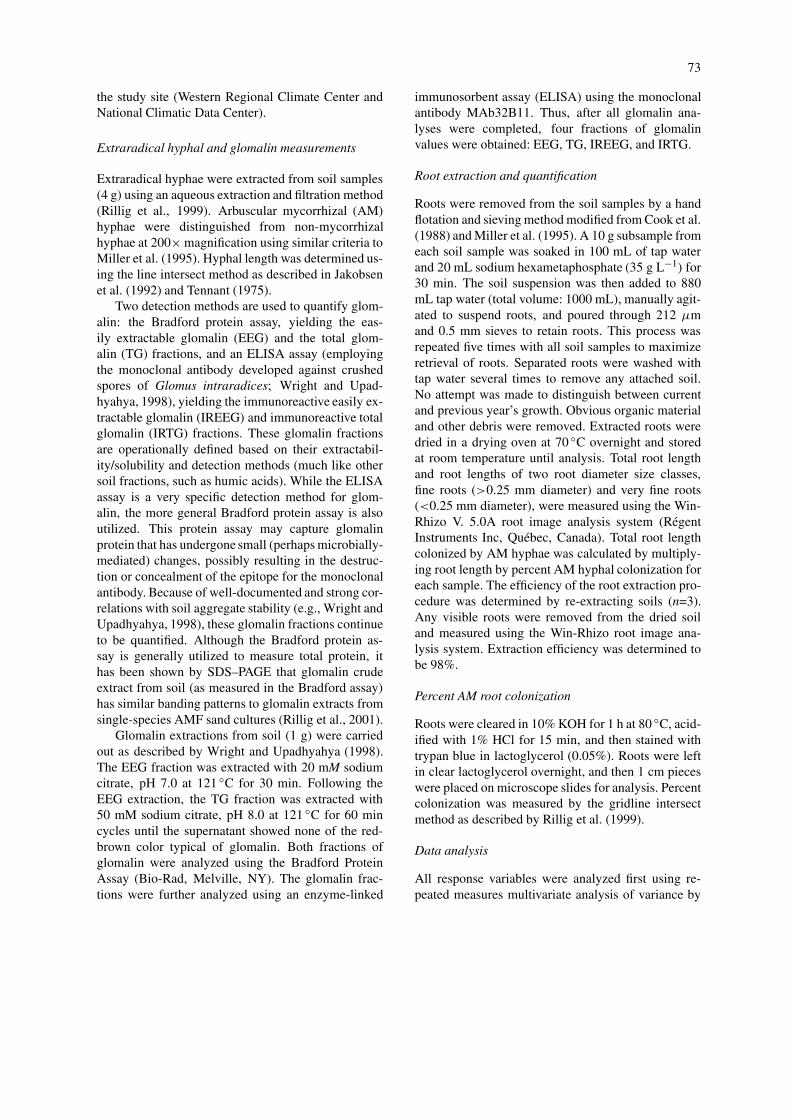
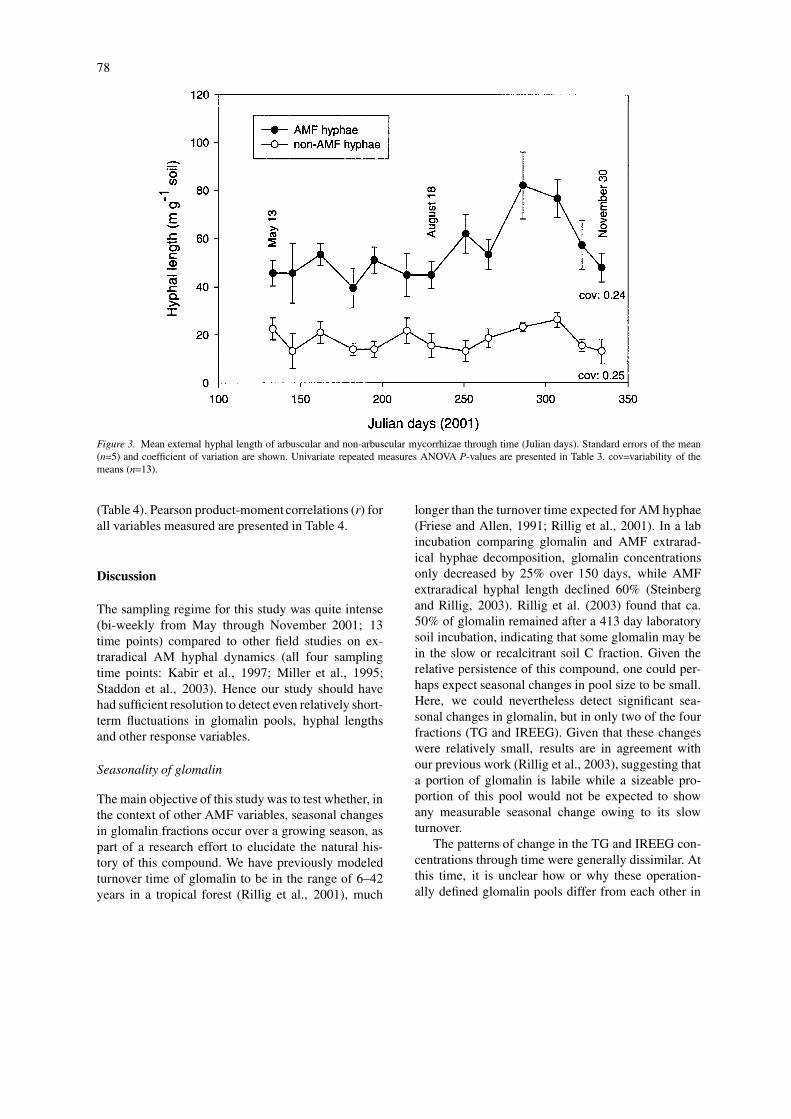
External arbuscular mycorrhizal (AM) hyphallength varied significantly through time (Table 3), witha large increase from late September to early October(Julian day 265 – 286), followed by a decrease in hy-phal length through November (Julian day 286 – 334,Figure 3). The decrease in AM hyphal length at theend of the sampling period was similar to the decreaseobserved in the IREEG fraction. The percent changebetween the highest and lowest AM hyphal lengthsmeasured was 107%. Non-AM hyphal length did notvary significantly through time (Table 3).
Percent AM hyphal colonization decreased inNovember (Julian days 307 – 334), similar to thedecrease in external AM hyphal length (Figures 3and 4; Table 3). Percent vesicle colonization did notvary significantly, while percent arbuscule coloniza-tion varied significantly through time (Table 3), withgreat fluctuation from May to the beginning of August(Julian days 133 – 215), followed by a considerabledecrease (Julian day 230; Figure 4) until the end of thesampling period, with colonization leveling out at 2%(Figure 4).
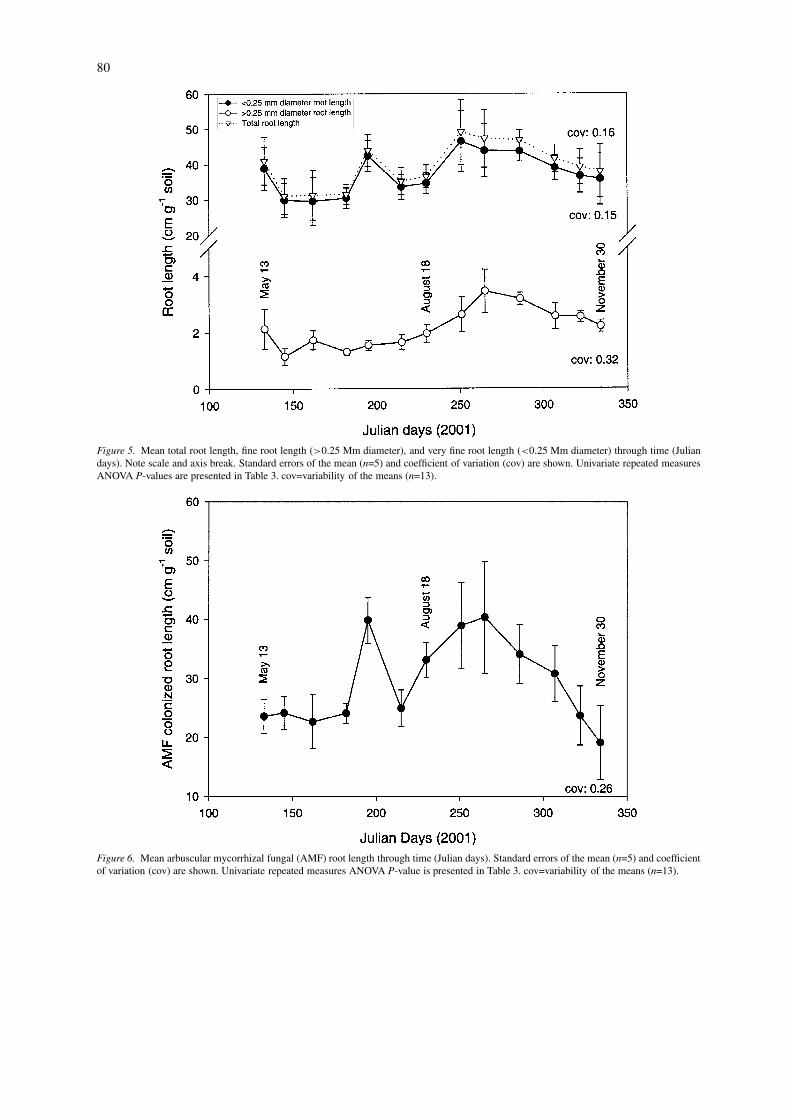
Fine root length (>0.25 mm diameter) changedsignificantly through time, while very fine root length(<0.25 mm diameter) and total root length did not(Table 3). A decrease in fine root length occurred midto late May (Julian day 133 – 145), followed by ageneral increase in fine root length until late Septem-ber (Julian day 265, Figure 5). Fine root length thendecreased from September to the end of November(Julian day 265 – Julian day 334, Figure 5). This de-crease was similar to the decrease observed in AM andglomalin parameters (Table 3, Figures 2b, 3, and 4).
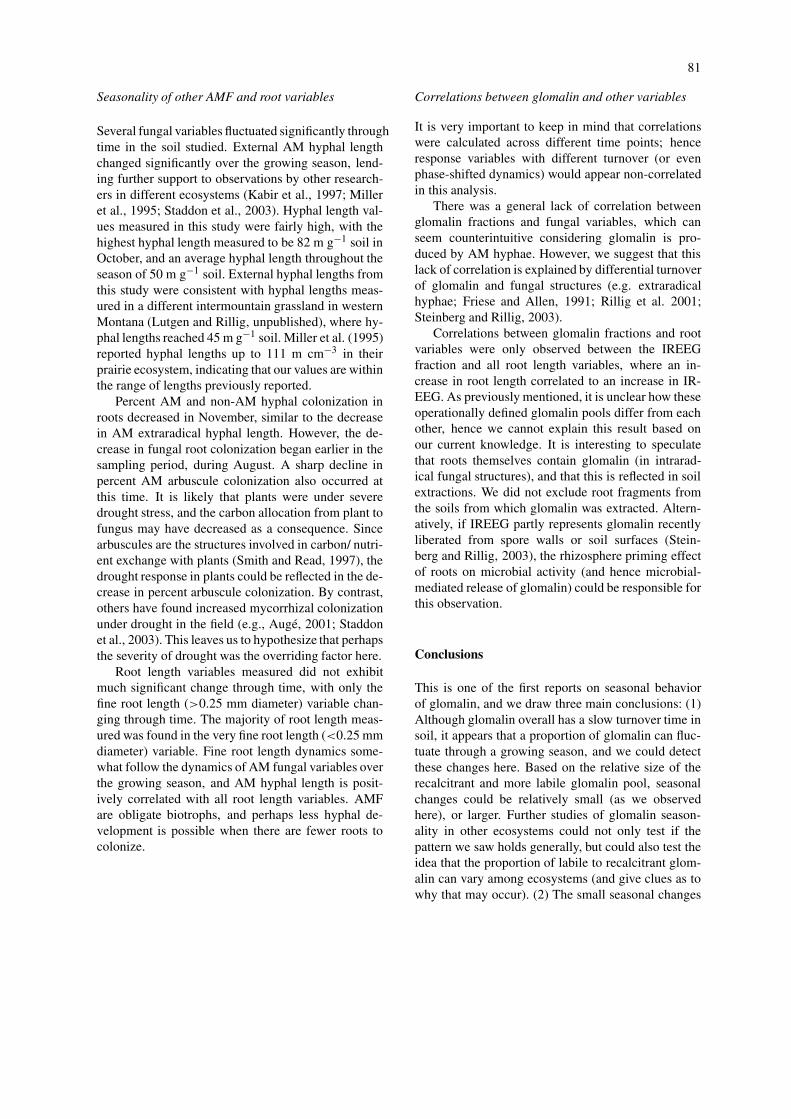
AM colonized root length remained constant untilJuly, when AM colonized root length increased andthen decreased by August (Julian day 182 – 215; Fig-ure 6). Thereafter, there was an increase until the endof September (Julian day 251), followed by a decreasethrough the end of the sampling period (Figure 6).Variation in root length colonized by AM hyphaethrough time was significant (Table 3).
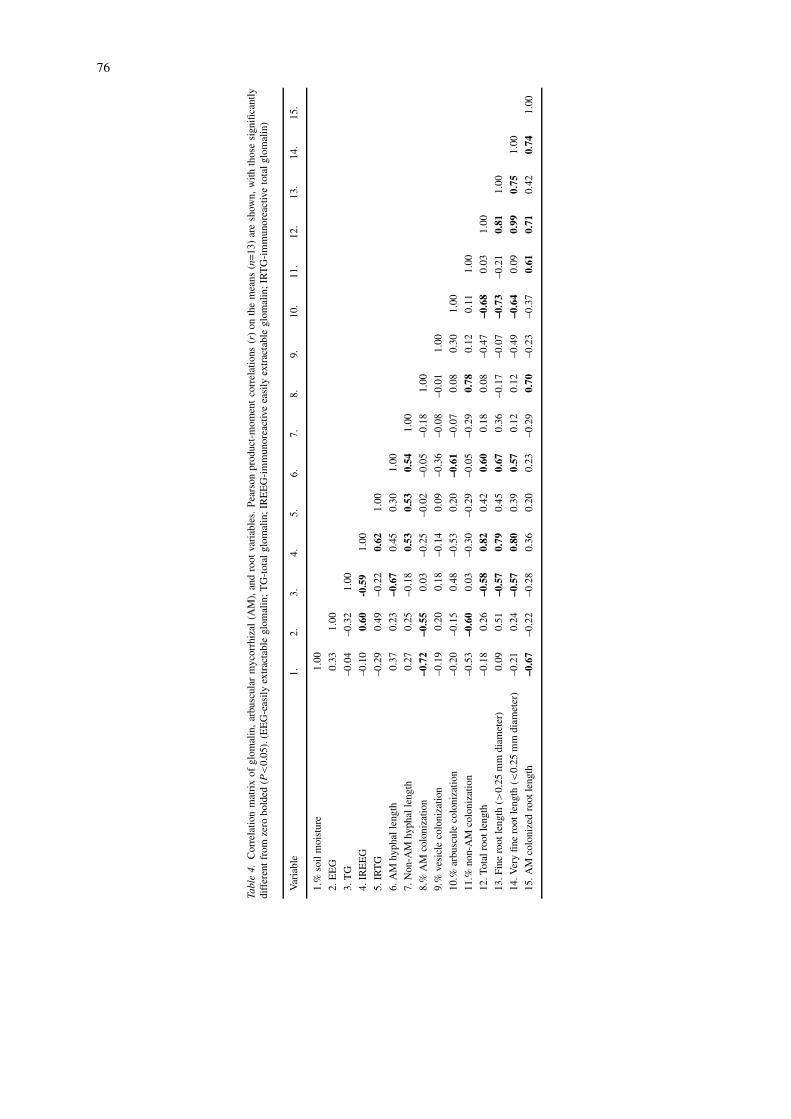
Pearson product-moment correlations (r) for glom-alin fractions were strongest between IREEG and rootlengths. IREEG was positively correlated with totalroot length (r=0.82, P<0.01), fine root length (r=0.79,P<0.01), and very fine root length (r=0.80, P<0.01)
76
Tabl
e4.
Cor
rela
tion
mat
rix
ofgl
omal
in,
arbu
scul
arm
ycor
rhiz
al(A
M),
and
root
vari
able
s.Pe
arso
npr
oduc
t-m
omen
tco
rrel
atio
ns(r
)on
the
mea
ns(n
=13
)ar
esh
own,
with
thos
esi
gnifi
cant
lydi
ffer
entf
rom
zero
bold
ed(P
<0.
05).
(EE
G-e
asily
extr
acta
ble
glom
alin
;TG
-tot
algl
omal
in;I
RE
EG
-im
mun
orea
ctiv
eea
sily
extr
acta
ble
glom
alin
;IR
TG
-im
mun
orea
ctiv
eto
talg
lom
alin
)
Var
iabl
e1.
2.3.
4.5.
6.7.
8.9.
10.
11.
12.
13.
14.
15.
1.%
soil
moi
stur
e1.
00
2.E
EG
0.33
1.00
3.T
G–0
.04
–0.3
21.
00
4.IR
EE
G–0
.10
0.60
-0.5
91.
00
5.IR
TG
–0.2
90.
49–0
.22
0.62
1.00
6.A
Mhy
phal
leng
th0.
370.
23–0
.67
0.45
0.30
1.00
7.N
on-A
Mhy
phal
leng
th0.
270.
25–0
.18
0.53
0.53
0.54
1.00
8.%
AM
colo
niza
tion
–0.7
2–0
.55
0.03
–0.2
5–0
.02
–0.0
5–0
.18
1.00
9.%
vesi
cle
colo
niza
tion
–0.1
90.
200.
18–0
.14
0.09
–0.3
6–0
.08
–0.0
11.
00
10.%
arbu
scul
eco
loni
zatio
n–0
.20
–0.1
50.
48–0
.53
0.20
–0.6
1–0
.07
0.08
0.30
1.00
11.%
non-
AM
colo
niza
tion
–0.5
3–0
.60
0.03
–0.3
0–0
.29
–0.0
5–0
.29
0.78
0.12
0.11
1.00
12.T
otal
root
leng
th–0
.18
0.26
–0.5
80.
820.
420.
600.
180.
08–0
.47
–0.6
80.
031.
00
13.F
ine
root
leng
th(>
0.25
mm
diam
eter
)0.
090.
51–0
.57
0.79
0.45
0.67
0.36
–0.1
7–0
.07
–0.7
3–0
.21
0.81
1.00
14.V
ery
fine
root
leng
th(<
0.25
mm
diam
eter
)–0
.21
0.24
–0.5
70.
800.
390.
570.
120.
12–0
.49
–0.6
40.
090.
990.
751.
00
15.A
Mco
loni
zed
root
leng
th–0
.67
–0.2
2–0
.28
0.36
0.20
0.23
–0.2
90.
70–0
.23
–0.3
70.
610.
710.
420.
741.
00
77
Figure 2. (a) Mean concentrations of glomalin fractions through time (Julian days). Note scale and axis break. Standard errors of the mean(n=5) and coefficient of variation (cov) are shown. Univariate repeated measures ANOVA P-values are presented in Table 3. cov=variabilityof the means (n=13). (b) Mean concentrations of immunoreactive glomalin fractions through time (Julian days). Note scale and axis break.Standard errors of the mean (n=5) and coefficient of variation (cov) are shown. Univariate repeated measures ANOVA P-values are presentedin Table 3. cov=variability of the means (n=13).
78
Figure 3. Mean external hyphal length of arbuscular and non-arbuscular mycorrhizae through time (Julian days). Standard errors of the mean(n=5) and coefficient of variation are shown. Univariate repeated measures ANOVA P-values are presented in Table 3. cov=variability of themeans (n=13).
(Table 4). Pearson product-moment correlations (r) forall variables measured are presented in Table 4.
Discussion
The sampling regime for this study was quite intense(bi-weekly from May through November 2001; 13time points) compared to other field studies on ex-traradical AM hyphal dynamics (all four samplingtime points: Kabir et al., 1997; Miller et al., 1995;Staddon et al., 2003). Hence our study should havehad sufficient resolution to detect even relatively short-term fluctuations in glomalin pools, hyphal lengthsand other response variables.
Seasonality of glomalin
The main objective of this study was to test whether, inthe context of other AMF variables, seasonal changesin glomalin fractions occur over a growing season, aspart of a research effort to elucidate the natural his-tory of this compound. We have previously modeledturnover time of glomalin to be in the range of 6–42years in a tropical forest (Rillig et al., 2001), much
longer than the turnover time expected for AM hyphae(Friese and Allen, 1991; Rillig et al., 2001). In a labincubation comparing glomalin and AMF extrarad-ical hyphae decomposition, glomalin concentrationsonly decreased by 25% over 150 days, while AMFextraradical hyphal length declined 60% (Steinbergand Rillig, 2003). Rillig et al. (2003) found that ca.50% of glomalin remained after a 413 day laboratorysoil incubation, indicating that some glomalin may bein the slow or recalcitrant soil C fraction. Given therelative persistence of this compound, one could per-haps expect seasonal changes in pool size to be small.Here, we could nevertheless detect significant sea-sonal changes in glomalin, but in only two of the fourfractions (TG and IREEG). Given that these changeswere relatively small, results are in agreement withour previous work (Rillig et al., 2003), suggesting thata portion of glomalin is labile while a sizeable pro-portion of this pool would not be expected to showany measurable seasonal change owing to its slowturnover.
The patterns of change in the TG and IREEG con-centrations through time were generally dissimilar. Atthis time, it is unclear how or why these operation-ally defined glomalin pools differ from each other in
79
Figure 4. Average percent colonization of arbuscular mycorrhizal (AM) hyphae, vesicles, and non-AM hyphae through time (Julian days).Standard errors of the mean (n=5) and coefficient of variation (cov) are shown. Univariate repeated measures ANOVA P-values are presentedin Table 3. cov=variability of the means (n=13) Inset: Mean arbuscular colonization through time (Julian days). Standard errors of the mean(n=5) and coefficient of variation (cov) are shown. Univariate repeated measures ANOVA P-value is presented in Table 3. cov=variability ofthe means (n=13).
terms of biochemistry, function in soil, and age, orhow the production of glomalin is controlled (Rilliget al., 2001, 2003). It is also unclear if the glomalinpools, as currently defined, are a reflection of differen-tial turnover or biochemistry. Initially it was assumedthat IREEG consists of glomalin most recently depos-ited into soil (owing to the ease of its extraction). Werecently showed that IREEG concentrations increasedin soil with hyphal decomposition, and in the absenceof new hyphal glomalin production (Steinberg and Ril-
lig, 2003). The increase in IREEG could be reflectiveof glomalin liberated from decomposing hyphal walls;this nevertheless cautions against the use of extract-ability as a predictor of relative age. However, thesepools continue to be measured since they are of sig-nificance in soil aggregation (Wright and Upadhyaya,1998).
80
Figure 5. Mean total root length, fine root length (>0.25 Mm diameter), and very fine root length (<0.25 Mm diameter) through time (Juliandays). Note scale and axis break. Standard errors of the mean (n=5) and coefficient of variation (cov) are shown. Univariate repeated measuresANOVA P-values are presented in Table 3. cov=variability of the means (n=13).
Figure 6. Mean arbuscular mycorrhizal fungal (AMF) root length through time (Julian days). Standard errors of the mean (n=5) and coefficientof variation (cov) are shown. Univariate repeated measures ANOVA P-value is presented in Table 3. cov=variability of the means (n=13).
81
Seasonality of other AMF and root variables
Several fungal variables fluctuated significantly throughtime in the soil studied. External AM hyphal lengthchanged significantly over the growing season, lend-ing further support to observations by other research-ers in different ecosystems (Kabir et al., 1997; Milleret al., 1995; Staddon et al., 2003). Hyphal length val-ues measured in this study were fairly high, with thehighest hyphal length measured to be 82 m g−1 soil inOctober, and an average hyphal length throughout theseason of 50 m g−1 soil. External hyphal lengths fromthis study were consistent with hyphal lengths meas-ured in a different intermountain grassland in westernMontana (Lutgen and Rillig, unpublished), where hy-phal lengths reached 45 m g−1 soil. Miller et al. (1995)reported hyphal lengths up to 111 m cm−3 in theirprairie ecosystem, indicating that our values are withinthe range of lengths previously reported.
Percent AM and non-AM hyphal colonization inroots decreased in November, similar to the decreasein AM extraradical hyphal length. However, the de-crease in fungal root colonization began earlier in thesampling period, during August. A sharp decline inpercent AM arbuscule colonization also occurred atthis time. It is likely that plants were under severedrought stress, and the carbon allocation from plant tofungus may have decreased as a consequence. Sincearbuscules are the structures involved in carbon/ nutri-ent exchange with plants (Smith and Read, 1997), thedrought response in plants could be reflected in the de-crease in percent arbuscule colonization. By contrast,others have found increased mycorrhizal colonizationunder drought in the field (e.g., Augé, 2001; Staddonet al., 2003). This leaves us to hypothesize that perhapsthe severity of drought was the overriding factor here.
Root length variables measured did not exhibitmuch significant change through time, with only thefine root length (>0.25 mm diameter) variable chan-ging through time. The majority of root length meas-ured was found in the very fine root length (<0.25 mmdiameter) variable. Fine root length dynamics some-what follow the dynamics of AM fungal variables overthe growing season, and AM hyphal length is posit-ively correlated with all root length variables. AMFare obligate biotrophs, and perhaps less hyphal de-velopment is possible when there are fewer roots tocolonize.
Correlations between glomalin and other variables
It is very important to keep in mind that correlationswere calculated across different time points; henceresponse variables with different turnover (or evenphase-shifted dynamics) would appear non-correlatedin this analysis.
There was a general lack of correlation betweenglomalin fractions and fungal variables, which canseem counterintuitive considering glomalin is pro-duced by AM hyphae. However, we suggest that thislack of correlation is explained by differential turnoverof glomalin and fungal structures (e.g. extraradicalhyphae; Friese and Allen, 1991; Rillig et al. 2001;Steinberg and Rillig, 2003).
Correlations between glomalin fractions and rootvariables were only observed between the IREEGfraction and all root length variables, where an in-crease in root length correlated to an increase in IR-EEG. As previously mentioned, it is unclear how theseoperationally defined glomalin pools differ from eachother, hence we cannot explain this result based onour current knowledge. It is interesting to speculatethat roots themselves contain glomalin (in intrarad-ical fungal structures), and that this is reflected in soilextractions. We did not exclude root fragments fromthe soils from which glomalin was extracted. Altern-atively, if IREEG partly represents glomalin recentlyliberated from spore walls or soil surfaces (Stein-berg and Rillig, 2003), the rhizosphere priming effectof roots on microbial activity (and hence microbial-mediated release of glomalin) could be responsible forthis observation.
Conclusions
This is one of the first reports on seasonal behaviorof glomalin, and we draw three main conclusions: (1)Although glomalin overall has a slow turnover time insoil, it appears that a proportion of glomalin can fluc-tuate through a growing season, and we could detectthese changes here. Based on the relative size of therecalcitrant and more labile glomalin pool, seasonalchanges could be relatively small (as we observedhere), or larger. Further studies of glomalin season-ality in other ecosystems could not only test if thepattern we saw holds generally, but could also test theidea that the proportion of labile to recalcitrant glom-alin can vary among ecosystems (and give clues as towhy that may occur). (2) The small seasonal changes
82
of glomalin have implications for designing samplingprotocols. It would appear that for our site one or twotime points per growing season would be sufficient tocapture glomalin pools. However, we advise caution inextrapolating this conclusion to other ecosystems (seeabove). (3) The overall lack of correlation betweenAM fungal variables and glomalin is important, as itpoints out that glomalin fractions, as currently defined,may not be useful as indicators of AMF hyphal lengthand fungal activity in general. The current fractionswere not devised with this purpose in mind; howeverit may be possible to obtain fractions of glomalin thatcould be useful as an indicator for AM extraradicalhyphae.
Acknowledgements
E.R.L. and M.C.R. acknowledge funding for this pro-ject from the Center for Invasive Plant Management,located at Montana State University, the National Sci-ence Foundation, and the U.S. Department of Energy.D.M-C. acknowledges funding from Project TRAIN(Training American Indians in Environmental Bio-logy) at the University of Montana (NSF, P. Kukuk,P.I.). We thank Dr S. F. Wright for MAb32B11. Wethank the City of Missoula Open Space Program forpermission to conduct this research.
References
Allen M F 1991 The Ecology of Mycorrhizae, Cambridge Univer-sity Press, Cambridge. 184 pp.
Allen M F and Boosalis M G 1983 Effects of two species of VAmycorrhizal fungi on drought tolerance of winter wheat. NewPhytol. 93, 67–76.
Anderson R C, Liberta A E and Dickman L A 1984 Interactionof vascular plants and vesicular-arbuscular mycorrhizal fungiacross a soil moisture-nutrient gradient. Oecologia 64, 111–117.
Augé R M 2001 Water relations, drought and vesicular-arbuscularmycorrhizal symbiosis. Mycorrhiza 11, 3–42.
Cook B D, Jastrow J D and Miller R M 1988 Root and mycor-rhizal endophyte development in a chronosequence of restoredtall-grass prairie. New Phytol. 110, 355–362.
Friese C F and Allen M F 1991 The spread of VA mycorrhizal fungalhyphae in soil: Inoculum types and external hyphal architecture.Mycologia 83, 409–418.
Gay P E, Grubb P J and Hudson H J 1982 Seasonal changes inthe concentrations of nitrogen, phosphorous, and potassium, andin the density of mycorrhiza, in bienniel and matrix formingperennial species of closed chalkland turf. J. Ecol. 70, 571–593.
Hart M M and Reader R J 2002 Taxonomic basis for variation inthe colonization strategy of arbuscular mycorrhizal fungi. NewPhytol. 153, 335–344.
Huynh H and Feldt L S 1976 Estimation of the Box correction fordegrees of freedom for sample data in randomized block andsplit-plot designs. J. Educational Stat. 1, 69–82.
Jastrow J D and Miller R M 1997 Soil aggregate stabilization andcarbon sequestration: feedbacks through organomineral associ-ations. In Soil Processes and the Carbon Cycle. Eds. R. Lal, J MKimble, R F Follett and B A Stewart. pp. 207–222. CRC Press,Boca Raton, LA.
Jakobsen I, Abbott L K and Robson A D 1992 External hyphae ofvesicular-arbuscular mycorrhizal fungi associated with Trifoliumsubterraneum L. spread of hyphae and phosphorous inflow intoroots. New Phytol. 120, 371–380.
Johnson N C, Zak D R, Tilman D and Pfleger F L 1991 Dynamicsof vesicular-arbuscular mycorrhizae during old field succession.Oecologia 86, 349–358.
Kabir Z, O’Halloran I P, Fyles J W and Hamel C 1997 Seasonalchanges of arbuscular mycorrhizal fungi as affected by tillagepractices and fertilization: Hyphal density and mycorrhizal rootcolonization. Plant Soil 192, 285–293.
Miller R M, Reinhardt D R and Jastrow J D 1995 External hyphalproduction of vesicular-arbuscular mycorrhizal fungi in pastureand tallgrass prairie communities. Oecologia 103, 17–23.
Montana Drought Monitoring; Natural Resource Information Sys-tem. http://nris.state.mt.us. September 24, 2002.
Mueggler W F and Stewart W L 1980 Grassland and shrublandhabitat types of western Montana. USDA Forest Service Gen-eral Technical Report INT 66. Intermountain Forest and RangeExperimental Station, Ogden, UT.
Mullen R B and Schmidt S K 1993 Mycorrhizal infection, phosphor-ous uptake, and phenology in Ranunculus adoneus: implicationsfor the functioning of mycorrhizae in alpine systems. Oecologia94, 229–234.
National Climatic Data Center. http://lwf.ncdc.noaa.gov. September24, 2002.
O’Neill E G, O’Neill R V and Norby R J 1991 Hierarchy theory as aguide to mycorrhizal research on large-scale problems. Environ.Poll. 73, 271–284.
Priha O, Lehto T and Smolander A 1998/1999 Mycorrhizas and Cand N transformations in the rhizospheres of Pinus sylvestris,Picea abies, and Betula pendula seedlings. Plant Soil 206 (2),191–204.
Reinhardt D R and Miller R M 1990 Size class of root diameterand mycorrhizal fungal colonization in two temperate grasslandcommunities. New Phytol. 116, 129–136.
Rillig M C, Ramsey P W, Morris S and Paul E A 2003 Glomalin, anarbuscular mycorrhizal fungal soil protein, responds to land-usechange. Plant Soil (In press)
Rillig M C, Wright S F, Nichols K A, Schmidt W F and M S Torn2001 Large contribution of arbuscular mycorrhizal fungi to soilcarbon pools in tropical forest soils. Plant Soil 233, 167–177.
Rillig M C, Field C B and Allen M F 1999 Soil biota responses tolong-term atmospheric CO2 enrichment in two California annualgrasslands. Oecologia 119, 572–577.
Sanders F E and Fitter A H 1992 The ecology and function-ing of vesicular-arbuscular mycorrhizas in co-existing grasslandspecies. I. Seasonal patterns of mycorrhizal occurrence andmorphology. New Phytol. 120, 517–524.
Scheiner S M 1993 MANOVA: Multiple response variables andmultispecies interactions. In Design and Analysis of EcologicalExperiments. Eds. S M Scheiner and J Gurevitch. pp. 94–112.Chapman and Hall, New York.
Schreiner R P and Bethlenfalvay G J 1995 Mycorrhizal interactionsin sustainable agriculture. Crit. Rev. Biotechnol. 15, 271–285.

83
Smith S E and Read D J 1997 Mycorrhizal Symbiosis. AcademicPress, San Diego, CA.
Staddon P L, Thompson K, Jakobsen I, Grime J P, Askew A Pand Fitter A H 2003 Mycorrhizal fungal abundance is affectedby long-term climatic manipulations in the field. Global ChangeBiol. 9, 186–194.
Steinberg P D and Rillig M C 2003 Differential decomposition ofarbuscular mycorrhizal fungal hyphae and glomalin. Soil Biol.Biochem., in press.
Tennant, D 1975 A test of a modified line intersect method ofestimating root length. J. Ecol. 63, 995–1001.
Thomas R S, Franson R L and Bethlenfalvay G J 1993. Separationof vesicular- arbuscular mycorrhizal fungus and root effects onsoil aggregation. Soil Sci. Soc. Am. J. 57, 77–81.
van der Heijden M G A, Klironomos J N, Ursic, M, MoutoglisP, Streitwolf-Engel R, Boller T, Wiemken A and Sanders I R
1998 Mycorrhizal fungal diversity determines plant biodiversity,ecosystem variability and productivity. Nature 396, 69–72.
Western Regional Climate Center. www.wrcc.dir.edu. September19, 2002.
Wright S F and Upadhyaya A 1996 Extraction of an abundant andunusual protein from soil and comparison with hyphal protein ofarbuscular mycorrhizal fungi. Soil Sci. 161(9), 575–586.
Wright S F, Franke-Snyder M, Morton J B and Upadhyaya J1996 Time-course study and partial characterization of a pro-tein on hyphae of arbuscular mycorrhizal fungi during activecolonization of roots. Plant Soil 181, 193–203.
Wright S F and Upadhyaya A 1998 A survey of soils for aggregatestability and glomalin, a glycoprotein produced by hyphae ofarbuscular mycorrhizal fungi. Plant Soil 198, 97–107.
Section editor: J. H. Graham