u.s. citrus import demand: seasonality and substitution
TRANSCRIPT

U.S. Citrus Import Demand: Seasonality and Substitution
Katherine L. Baldwin
Formerly of the Economic Research Service, United States Department of Agriculture Washington, DC
Email: [email protected]; Telephone: (202) 205-3396
Keithly G. Jones
Animal Products and Cost of Production Branch, Market and Trade Economics Division, Economic Research Service, United States Department of Agriculture
Washington, DC Email: [email protected]; Telephone: (202) 694-5172
Selected Paper prepared for presentation at the Southern Agricultural Economics
Association Annual Meeting, Birmingham, AL, February 4-7, 2012
The views expressed here are those of the authors and may not be attributed to the Economic Research Service or the U.S. Department of Agriculture. Copyright 2012 by Baldwin and Jones. All rights reserved. Readers may make verbatim copies of this document for non-commercial purposes by any means, provided this copyright notice appears on all such copies.

U.S. Citrus Import Demand: Seasonality and Substitution
Abstract
Citrus fruits make up one-fifth of all fresh fruit consumed in the United States. Given the increasing importance of imported citrus in the diet of American consumers, it is perhaps surprising that no import demand analysis of U.S. citrus has been conducted. Using quarterly U.S. import data for six citrus commodities, we employed a demand systems model and evaluated aspects of seasonality. The results suggest wide variations in price responses to different types of imported citrus. The average amplitude and phase shift suggest that all citrus fruits exhibit some seasonality in their imports, likely a result of peak harvesting schedules of exporters.
Key words: Fresh citrus, oranges, limes, lemons, grapefruit, mandarins, import demand, seasonality

U.S. Citrus Import Demand: Seasonality and Substitution
Introduction
Although its share has been declining in recent years, citrus fruits make up one fifth of all fresh
fruit consumed in the United States, with oranges (in fresh and juice form) alone accounting for nearly
10 percent of total per capita fruit consumption (USDA-ERS, 2010a). While per capita consumption of
fresh citrus has declined since 1980, total U.S. consumption of citrus fruits has increased 20 percent
since that time. Over the same period, total U.S. production of citrus fruits has been flat to declining,
including the virtual disbandment of the U.S. commercial lime industry. In order to fulfill domestic
fresh citrus demand, imported citrus has increased in importance, accounting for more than 20 percent of
total domestic consumption in the 2009/10 crop year.
Given the increasing importance of imported citrus in the diet of American consumers, it is
perhaps surprising that no detailed import demand analysis of the U.S. citrus market has been conducted
to date. Large fluctuations in price could have negative consequences for the U.S. citrus industry, U.S.
consumers, or both. Additionally, negative import demand reactions to changes in price could have
serious economic consequences for those countries that export to the U.S. market – the majority of
which are developing nations.
While citrus import demand studies have been conducted for other countries, (Lee, Seale, and
Jienviriyapant, 1990; Torres, 1996; Schmitz and James L. Seale, 2002; Seale, et al., 2005; Feleke and
Kilmer, 2009), none has looked at U.S. import demand for fresh citrus fruits. Sparks (1992) even
pondered why there was such paucity of studies on fresh oranges, given its level of importance in

international trade. The paucity of research on fresh oranges has persisted into the 21st century, but this
study seeks to fill this knowledge gap.
The overall objective of this article is to explore U.S. import demand characteristics for all
major categories of fresh citrus imports – oranges, grapefruit, lemons, limes, mandarins, and
miscellaneous citrus products – and to identify aspects of seasonality in imports. Specifically, although
the different citrus fruits have various end uses (including direct consumption, flavoring agent, or even
for juicing), the extent to which consumers substitute between citrus fruits for the various uses is not
well understood, and we hope that this analysis sheds light on the degree of substitutability between
products. In the next section, a brief overview of the U.S. citrus industry is provided. This is followed
by an explanation of the approach used to model U.S. citrus imports. The data used in the model is then
described, followed by the results and interpretation of the empirical estimates. The conclusions end the
paper.
Citrus Industry Overview
Though often aggregated into the single “citrus” classification, each citrus fruit has a unique
production, consumption, and trade back-story that can be used to help explain changes in import
demand due to both own-price and cross-commodity price fluctuations. For all citrus products, imports
into the U.S. are growing (see Figure 1). However, the relevance of imports to total consumption varies,
and in some cases the share of consumption filled by imports has fluctuated very little over the past few
decades. A brief overview of the production, consumption, and import situations of each commodity is
provided below.
Oranges

Although oranges comprise the bulk of U.S. citrus fruit production, most oranges are destined for
juice production and therefore do not enter the fresh market (Perez and Pollack, 2002). During the
2009/10 marketing year, just over 25 percent of total U.S. orange production was destined for the fresh
market. Although more than 70 percent of U.S.-grown oranges come from Florida, most Florida
oranges are processed into juice. California dominates the fresh orange market – almost 85 percent of
U.S. fresh-use oranges come from California, followed by Florida and Texas with 13 and 3 percent,
respectively. Total fresh-use orange production tends to fluctuate around 2 million short-tons, with no
clear upward or downward long-term trend.
Although production has been largely static since 1980/81, per capita consumption of fresh
oranges has fallen nearly 24 percent. Declining consumption is largely a result of consumers preferring
convenient, easy-to-consume fruits, and can also partially be attributed to greater availability of a wider
array of fresh fruits in the marketplace. Despite static domestic production and declining per capita
consumption, fresh orange imports have grown markedly in the past few decades. Fresh orange imports
in 2009/10 were ten times higher than levels seen in 1980/81. Regardless, imports still only account for
a minute 6 percent share of U.S. consumption, up from only 1 percent in 1980/81. The motivation for
increased imports is largely a matter of seasonality. Peak import season begins in July after the end of
the California navel season and ends in October when the harvesting of Florida’s early-season varieties
begins. South Africa, Chile, Mexico, and Australia are the top sources for U.S. orange imports. South
Africa has been the largest supplier of fresh oranges to the U.S. market essentially since 2003. Its
entrance into the U.S. market began with the 2000 passage of the African Growth Opportunity Act
(AGOA), under which all imports of oranges from South Africa enter the U.S. duty-free. Interestingly,

the top four fresh orange suppliers receive preferential trade status, and all but South Africa export under
free trade agreements.1
Grapefruit
Amongst all citrus fruits produced in the United States, grapefruit is unique in that both domestic
production and consumption are falling. Indeed, the long-term decline in U.S. grapefruit production is a
product of weak U.S. consumer demand. Even with declining domestic demand, the U.S. remains the
world’s second largest producer of grapefruit.
Around 70 percent of the U.S. grapefruit crop is grown in Florida, with Texas and California
accounting for 20 and 10 percent, respectively. Bearing acreage has declined an average of 7 percent
each year since 2005/06 in Florida, but seems to have stabilized in California and Texas. In total, U.S.
grapefruit production has declined by 50 percent since the 2000/01 marketing year.
This production decline mirrors a fall in U.S. consumer demand and is not the result of
competition from imports. U.S. per capita consumption of fresh grapefruit has declined from a high of
7.84 pounds per person in 1982/83 to 2.71 pounds per person in 2009/10. Several factors could be
affecting demand for the fruit. First, unlike many other fruits, grapefruit is difficult to eat out of the
hand, and consumer convenience has become an increasingly important driver of fruit demand over the
past decade. Second, a wider array of imported fruits are now available during the winter months when
grapefruit is typically marketed, so grapefruit has lost marketing share. Lastly, grapefruit consumption
declined in the 1990’s after several studies found that grapefruit amplified the effects of certain
medications. Unfortunately, the same people most likely to be taking such medications were also one of
1 Most citrus imports (greater than 80 percent) enter the U.S. under duty-free status due to various trade agreements. For those countries who do not qualify for duty-free status, tariff rates are relatively consistent across products from 1.5¢ to 2.5¢ per kilo or 0.8% per kilo for Tahitian limes and “other citrus” categories. Although tariffs vary seasonally for grapefruit, more than 99% of grapefruit imports enter the U.S. under duty-free status. For these reasons, we do not believe that the tariff structure significantly alters our result.

the most important demographics of grapefruit consumers – people over the age of 50. This fear of
interaction has likely been the most important driver of reduced domestic fresh grapefruit demand (Perez
and Pollack, 2005).
With declining consumer demand, it is not surprising that imports of grapefruit are small,
accounting for around 3 percent of U.S. fresh grapefruit consumption. Imports generally peak in the late
fall and early winter when U.S. domestic shipments are also greatest. April and May are the lightest
months for imported grapefruit. Most imports are sourced from Mexico and the Bahamas, both of which
enjoy duty-free access under NAFTA and the Caribbean Basin Initiative, respectively.
Limes
As a share of consumption in the U.S., imports are most important for limes, now accounting for
virtually 100 percent of the limes consumed in the U.S. Formerly, limes had been grown in Florida due
to that State’s sandy soils and sub-tropical climate: ideal conditions for lime production. However, the
Florida industry suffered severe tree losses from Hurricane Andrew in 1992 – production declined
nearly 80 percent between the 1992/93 and 1993/94 marketing years, with area declining to 1,900 acres
from a high of 7,500 acres in the 1980’s. Replanting was slow in the aftermath of Hurricane Andrew,
and the industry was unable to fully recover before an epidemic of citrus canker affected groves in the
main production areas of Southeastern Florida (Perez and Pollack, 2000). By 2002, less than 400 acres
of commercial lime groves existed in Florida. Groves could not be replanted because of the continuing
citrus canker threat, and with demand for vegetable crops and urban encroachment driving up the price
of land, commercial lime production all but ceased in the 2002/03 crop year when the National
Agricultural Statistics Service (NASS) discontinued its lime production survey (Perez and Pollack,
January 2003a).

Even before Hurricane Andrew, imports were rising as a share of consumption, reaching nearly
80 percent of total consumption in 1992/93. However, after the hurricane, imports surged 30 percent
and were able to provide adequate supplies for U.S. consumers (Kantor and Malanoski, 1997).
Beginning in 1993/94, imports made up at least 90 percent of U.S. lime consumption and have been
responsible for virtually 100 percent of U.S. lime consumption since the demise of the U.S. lime
industry in 2002/03. Around 97 percent of U.S. lime imports come from Mexico. Similarly, over 90
percent of that country’s lemon/lime exports are shipped to the U.S. For this reason, either a shock to
Mexican lime production or to U.S. consumer demand would heavily influence U.S. lime import levels.
Though limes are available year-round to consumers, imports tend to peak in the summer months of July
and August, with the lightest demand experienced in January and February.
Per capita lime consumption continues to grow in the United States, more than doubling from
1.15 pounds per person in 1996/97 to 2.57 pounds per person in 2009/10. This increase is partially due
to a rising Hispanic population, as limes are a key ingredient in many Latin cuisines. Due to their high
acid content, limes are not typically directly consumed as an orange or grapefruit might be. Instead,
their juice is used as a flavoring.
Lemons
Though lemons are similar to limes in that they are typically used as a flavoring agent and not
directly consumed because of high acidity, production and import demand for the two crops are quite
different. U.S. production of lemons remains strong, supplying more than 90 percent of domestic
consumption needs and even making the U.S. the fifth-largest exporter of fresh lemons/limes in the
world (USDA PS&D, 2011).

Nearly all U.S. lemons are produced in the States of California and Arizona. The U.S. lemon
season runs from August through July, with Californian producers able to store production long enough
to partially supply the high-demand summer season. Imports tend to be highest during the summer
months. However, U.S. production is just gearing up for harvest at that time, and domestic supplies are
at their lowest (Perez and Pollack, 2004). Despite rising import demand during the summer months,
imports only account for around 10 percent of U.S. consumption.2 Mexico and Chile are the primary
sources of U.S. lemons imports, with both countries able to ship lemons duty-free through free trade
agreements.
Though per capita fresh lemon consumption has fluctuated in recent years, it has generally been
on an upward trend. U.S. lemon production and consumption are projected to continue increasing, with
imports filling seasonal demand gaps.
Mandarins
As with lemons, the U.S. mandarin/tangerine industry is on a trend of both increasing production
and consumption. Unlike lemons, however, imports make up a significant portion of U.S. mandarin
consumption, and the fruits themselves are typically directly consumed. Worldwide, mandarins are
known for being easy to peel and readily separating into different sections, which makes them
convenient to eat in fresh form (Perez and Pollack, 2003b). Moreover, many different countries in the
world produce their own particular varieties of mandarins, including satsumas, clementines, and
numerous tangerine hybrids.
U.S. production of mandarins has more than doubled since 1992/93, reaching 960 million pounds
in 2009/10. California produces nearly 65 percent of the U.S. mandarin crop, with Florida accounting
2 In fact, the U.S. exports twice as many lemons as it imports in a marketing year, though these shares differ on a seasonal basis.

for most of the remainder. Expansion has been driven by increasing consumer demand for the fruit,
mostly due to its convenience. For this reason, mandarins have been able to successfully compete for a
share of U.S. consumers’ fresh food dollars, while oranges and grapefruit have not. Consequently, per
capita consumption of mandarins has doubled since 1992/93.
While most mandarins consumed in the U.S. are domestically-grown, seasonal imports account
for nearly 30 percent of consumption. Unlike other citrus varieties, mandarins do not store well on the
tree and should be harvested soon after maturity. For this reason, the U.S. marketing season for
mandarins is shorter than it is for other citrus varieties. Nearly half of U.S. mandarin imports come from
Spain, with Chile, Morocco, and Peru accounting for most of the remainder. Imports from Spain are
nearly all of the clementine variety, which are in high demand by U.S. consumers because they are
seedless. Total U.S. imports tend to peak November through January when the bulk of Spain’s crop is
marketed. A smaller peak occurs in July and August when Chilean clementines and Peruvian tangelos
enter the market.
Other citrus fruits
A few specialty citrus varietals – including citrons, kumquats, and bergamots – are also imported
into the United States under a catchall “other citrus” tariff category. Though their quantities remain
small (less than 460 tons of specialty “other citrus” were imported in 2010 compared to more than
140,000 tons of mandarins), they are included in this analysis because of their niche market appeal.
Additionally, more than 80 percent of these “other citrus” imports are sourced from Jamaica.
Simultaneously, 30 percent or more of Jamaica’s total citrus exports to the U.S. are classified as “other,”
such that any identifiable trend in imports of this category could have significant implications for that
nation.

Empirical Specification of the Almost Ideal Demand Model
In order to gain further insights into the demand for U.S. citrus imports, we chose to employ the
nonlinear Almost Ideal Demand System (NAIDS) model as specified by Deaton and Muellbauer as:
1
ln( ) ln*
k
i i ij j ii
mw p
P
(1)
where wi is the budget share of imported citrus i, pj is the price of imported citrus j, m is the total
expenditure on all imported citrus in the demand system, and P* is the translog price index which is
defined as *0
1 1 1
ln( *) ln( ) 0.5 ln( ) ln( ).jk k
k k kj k ji i j
P p p p
(2)
αi, βi, and γij are coefficients to be estimated and * *( ) / 2.ij ij ji
Arnade and Pick (1998) extended their model to account for seasonal patterns using harmonic
analysis. They used a variable consisting of an interaction term between a trend variable and a
trigonomic variable representing a particular frequency, then used this variable to detect changes in the
seasonal cycle. We extend the standard nonlinear AIDS model for import demand to incorporate
seasonal and trend effects. The informational shift variables are incorporated into the αi parameter as:
1
k
i i i i ii
S T
(3)
where S is the vector of seasonality, T is a trend variable, and ,,,, and are parameters to be
estimated. Utility maximization requires that the coefficients satisfy the following restrictions: adding
up satisfied by 1; 0; 0; 1; 0; 0i ij i i i ii i i i i i
; homogeneity is satisfied if
0 ;ijj
i and symmetry is satisfied if .ij j i i j

Deviating from Arnade and Pick (1998), we follow Makridakis, Wheelwright, and McGee (1983), and
Washington, Kilmer, and Weldon (2002), where S is a nonlinear problem:
2
*sin
n
tfS
(4)
Where σ is the estimated amplitude of the sine wave, f is the frequency of completion of the sine wave
over the number of observations, t is the time, n is the number of observations, and ζ is the estimated
phase angle. Based on trigonometric theory, equation 4 can be linearized where
2
*cossin2
*sincos
n
tf
n
tfSi
(5)
If σ cos ζ = s1 and σ sin ζ = s2 , then
2
*cos2
*sin 21 n
tfs
n
tfsS
(6)
The adding up condition 0ii
can be rewritten as 1 0,ii
s and 2 0ii
s .
Following Makridakis, Wheelwright, and McGee (1983), we then calculate an average amplitude (σ)
and average phase shift (ς) as:
22
21 ss
(7)
and
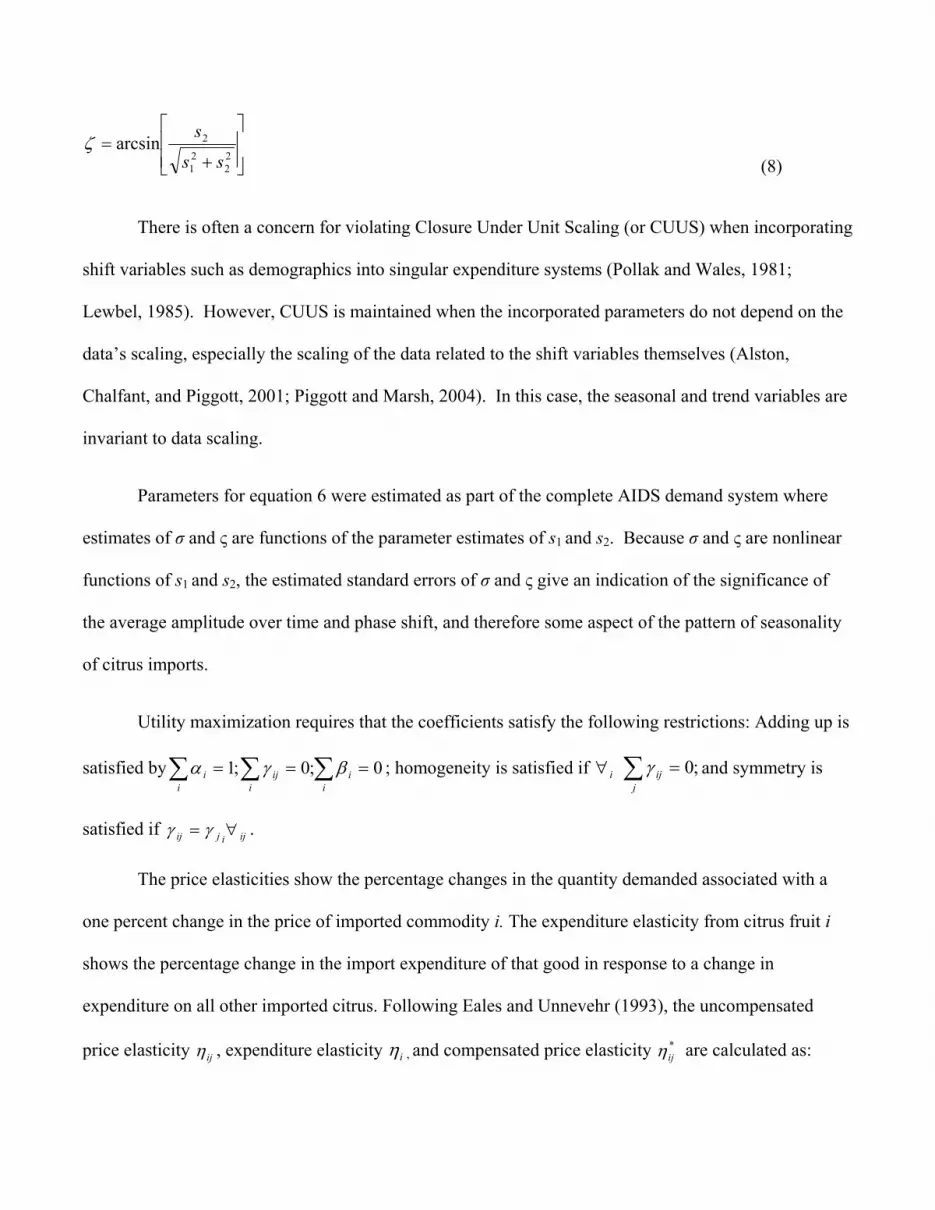
22
21
2arcsinss
s
(8)
There is often a concern for violating Closure Under Unit Scaling (or CUUS) when incorporating
shift variables such as demographics into singular expenditure systems (Pollak and Wales, 1981;
Lewbel, 1985). However, CUUS is maintained when the incorporated parameters do not depend on the
data’s scaling, especially the scaling of the data related to the shift variables themselves (Alston,
Chalfant, and Piggott, 2001; Piggott and Marsh, 2004). In this case, the seasonal and trend variables are
invariant to data scaling.
Parameters for equation 6 were estimated as part of the complete AIDS demand system where
estimates of σ and ς are functions of the parameter estimates of s1 and s2. Because σ and ς are nonlinear
functions of s1 and s2, the estimated standard errors of σ and ς give an indication of the significance of
the average amplitude over time and phase shift, and therefore some aspect of the pattern of seasonality
of citrus imports.
Utility maximization requires that the coefficients satisfy the following restrictions: Adding up is
satisfied by i
ii
iji
i 0;0;1 ; homogeneity is satisfied if i j
ij ;0 and symmetry is
satisfied if ijijij .
The price elasticities show the percentage changes in the quantity demanded associated with a
one percent change in the price of imported commodity i. The expenditure elasticity from citrus fruit i
shows the percentage change in the import expenditure of that good in response to a change in
expenditure on all other imported citrus. Following Eales and Unnevehr (1993), the uncompensated
price elasticity ij , expenditure elasticity i , and compensated price elasticity *ij are calculated as:
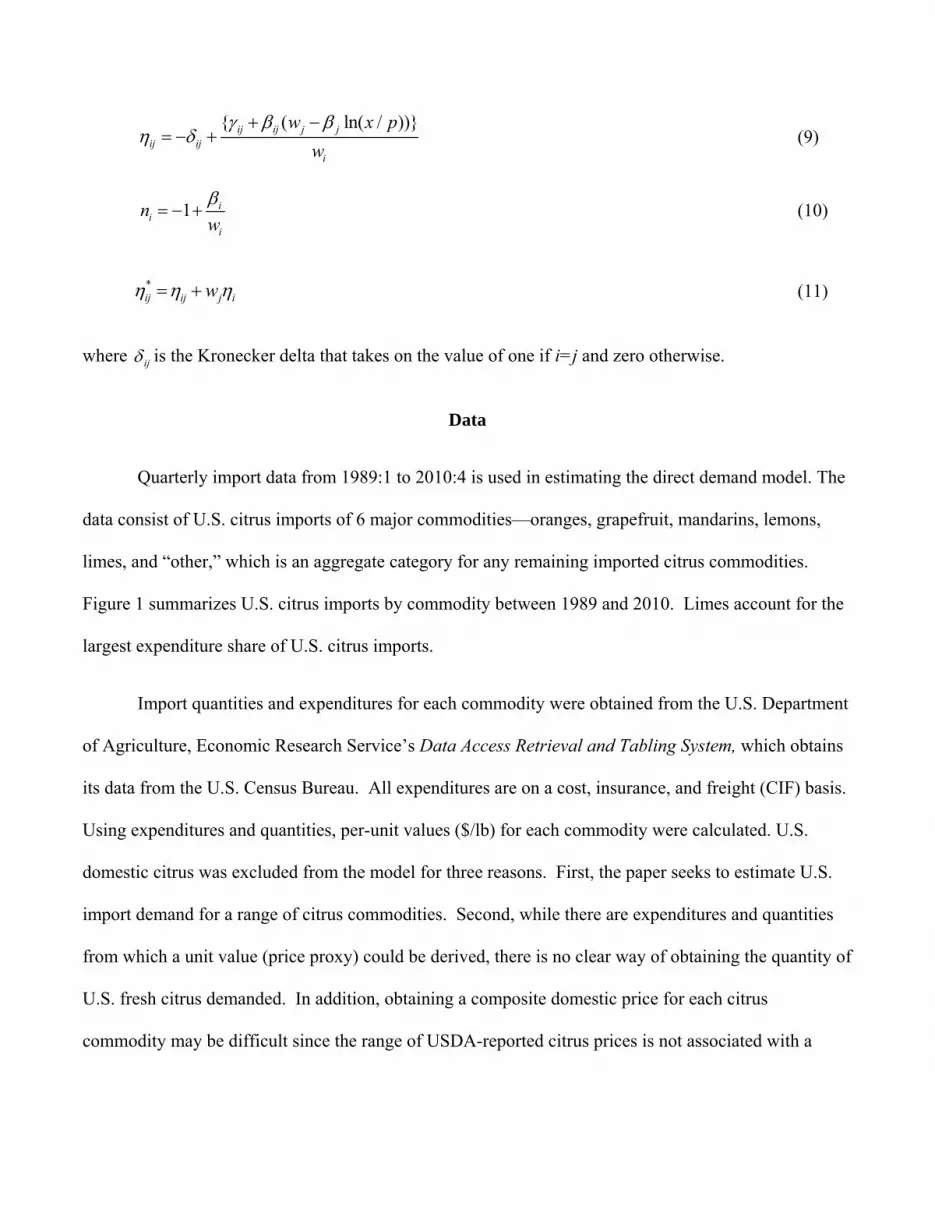
{ ( ln( / ))}ij ij j jij ij
i
w x p
w
(9)
1 ii
i
nw
(10)
*ij ij j iw (11)
where ij is the Kronecker delta that takes on the value of one if i=j and zero otherwise.
Data
Quarterly import data from 1989:1 to 2010:4 is used in estimating the direct demand model. The
data consist of U.S. citrus imports of 6 major commodities—oranges, grapefruit, mandarins, lemons,
limes, and “other,” which is an aggregate category for any remaining imported citrus commodities.
Figure 1 summarizes U.S. citrus imports by commodity between 1989 and 2010. Limes account for the
largest expenditure share of U.S. citrus imports.
Import quantities and expenditures for each commodity were obtained from the U.S. Department
of Agriculture, Economic Research Service’s Data Access Retrieval and Tabling System, which obtains
its data from the U.S. Census Bureau. All expenditures are on a cost, insurance, and freight (CIF) basis.
Using expenditures and quantities, per-unit values ($/lb) for each commodity were calculated. U.S.
domestic citrus was excluded from the model for three reasons. First, the paper seeks to estimate U.S.
import demand for a range of citrus commodities. Second, while there are expenditures and quantities
from which a unit value (price proxy) could be derived, there is no clear way of obtaining the quantity of
U.S. fresh citrus demanded. In addition, obtaining a composite domestic price for each citrus
commodity may be difficult since the range of USDA-reported citrus prices is not associated with a

quantity. Last, a significant portion of domestic citrus is used primarily for the processing market, while
imported citrus is used primarily in the fresh and flavoring markets.
Results
Various specification tests were done on the import demand equations outlined above. They
included autocorrelation (Durbin-Watson and Godfrey tests), heteroskedasticity (White test) and a Wu-
Hausman endogeneity test for endogeneity of the quantity variables. Test results did not indicate the
presence of endogeneity of the quantity variables or the presence of autocorrelation or heteroskedasticity
in the residuals. However, we corrected for autocorrelation using the approach specified by Moschini
and Moro (1994) which allow for first-order autocorrelation within and across equations. This
specification ensures invariance with the deleted equation and that the adding-up condition is
maintained. Parameter estimates for the full model, which includes the seasonal and trend variables, are
presented in Tables 1 and 2. Interestingly, although the trend estimates for oranges, grapefruit, and
limes were significant, the magnitude of the trend was negligible. The seasonal (sine and cosine)
coefficient does not provide an adequate interpretation of seasonality. As such, seasonality is explored
later by examining the amplitude and phase shift of the different citrus fruits.
The compensated price and expenditure elasticities are presented in Table 3. The asymptotic
standard errors are shown in parentheses. These elasticities are conditional on the total expenditure on
all imported citrus. The expenditure elasticities were all positive and statistically significant except for
“other citrus.” Positive expenditure elasticities suggest normal goods. The estimated expenditure
elasticities for oranges, grapefruit, mandarins and lemons were all greater than one (1.442, 1.479, 1.360,
and 1.164, respectively) while limes and other citrus had expenditure elasticities of less than one (0.518
and 0.262, respectively). These findings suggest that as income increases, consumers would likely

spend a higher proportion of their overall imported citrus expenditure on oranges, grapefruit, mandarins
and lemons and less on limes and other citrus.
The compensated price elasticities represent both the substitution and expenditure effect of price
changes. Consistent with theory, all own-price elasticities had the correct negative sign and were
statistically significant (except for oranges), implying that an increase in the import price of a citrus
commodity reduces its quantity demanded. Grapefruit and other citrus were fairly price responsive with
own-price elasticities greater than one in absolute value (elasticities of -1.136 and -1.405, respectively),
such that it is not possible for the supplying countries of these two citrus commodities to increase
revenue by lowering quantities supplies. Also, an increase in the price of imported grapefruit and other
citrus would result in a more than proportional decrease in the quantity imported. However, based on
the inelastic own-price elasticities for oranges, mandarins, lemons, and limes (-0.050, -0.359, -0.742,
and -0.126), supplying countries could increase their revenues by lowering the quantity they supply to
the United States, and an increase in the price of these imported commodities would result in a less than
proportional decrease in the quantity imported.
The compensated cross-price elasticity relates to the quantity imported of a commodity when the
price of another commodity changes, holding utility constant. The compensated cross-price elasticity
determines substitutability and complementarity between products. These cross-price effects account
for both the substitution and expenditure effects of price changes. Positive compensated cross-price
elasticities indicate a substitute relationship between products while negative compensated cross-price
elasticities indicate a complementary relationship and may suggest that the expenditure effect of the
price change has outweighed the pure substitution effect. As expected, most of the cross-price
elasticities for citrus fruits are positive, but only a few are statistically significant, implying that U.S.
citrus imports are mostly substitutes across commodities, but perhaps only weak substitutes. Since

imported citrus fruits are destined primarily for the fresh market, there is significant competition
between commodities. The substitute relationship across commodities would suggest that changes in
import prices could influence the U.S. consumer’s loyalty to most imported citrus commodities.
Interestingly, none of the citrus fruits were found to be statistically significant natural substitutes
for fresh oranges. However, grapefruit exhibited a statistically significant complementary relationship
with oranges. Grapefruit were also found to exhibit substitute relationships with mandarins and other
citrus. The results also showed that U.S. consumers were willing to substitute mandarins for lemons,
limes and grapefruit, although grapefruit were shown to exhibit the strongest substitute relationship with
mandarins. Limes and lemons were found to exhibit a complementary relationship, but not a statistically
significant one.
Aspects of seasonality were also explored and presented. Table 4 presents the seasonal patterns
as estimated by the amplitude and phase shift estimates for imported citrus fruits. The phase shift
estimates are measures of the extent to which each frequency component of one series leads or lags the
other. A positive phase shift means that the cycle is shifted backwards (appears earlier in the series) and
a negative phase shift means that the cycle is shifted forwards (appears later in the series). The
amplitude is the measurement of the sine wave from one peak to another. It measures the average height
of the sine wave over time. Larger amplitudes suggest greater seasonality.
All imported citrus fruits exhibited statistically significant average amplitudes (except other
citrus) with grapefruit having the smallest magnitude (0.005) and limes having the largest magnitude
(0.174). However, based on the overall small magnitude of the amplitudes, it would appear that
seasonality in fresh citrus imports is becoming less pronounced. The small magnitude on the amplitude
of grapefruit may be explained by the low absolute level of grapefruit imports as compared to other
citrus fruits, and by declining overall consumer demand for both domestically-produced and imported
grapefruit. The larger amplitude on limes may be largely due to the fact that most imported limes come
from Mexico. As such, variations in Mexico’s lime production would result in large variations in U.S.
lime availability.
The average phase shift has also shed some light into the patterns of seasonality of imported
citrus. Oranges, grapefruit, and lemons showed no statistical differences in their pattern of seasonality
in imports over time. However, mandarins and limes have seen statistically significant shifts in their
seasonal cycles over time. Mandarins have seen a positive shift in its cycle, suggesting that the seasonal
cycle is occurring at earlier months over time. Limes, on the other hand, have seen a negative shift in its
cycle, suggesting that peak imports are occurring at later months of the year. The decline in U.S. lime
production likely precipitated the phase shift in U.S. lime imports.
Conclusions
Imported fresh citrus fruit continue to grow as a share of total U.S. citrus fruit consumption.
This has sparked interest in understanding citrus import demand issues, as well as issues of seasonality.
The previous research on U.S. fresh citrus fruits has been sparse and has not addressed the import
demand dynamics of this sector, particularly seasonality.
The present analysis uses an AIDS demand model to explore U.S. import demand characteristics
for all major categories of fresh citrus. The results suggest wide variations in import quantities in
response to changes in prices for imported citrus. The expenditure elasticities of all the imported citrus
commodities were positive, indicating that all the commodities are normal goods, consumption of which
will increase with increased overall imported citrus expenditure. Additionally, various fruits exhibited

complementary or substitute relationships – grapefruits and other citrus were shown to be substitutes,
while lemons and limes exhibited a complementary relationship.
The average amplitude and phase shift suggest that all citrus fruits exhibit some seasonality in
their imports, likely a result of the peak harvesting schedules of principal citrus fruit exporters. The
degree of the amplitude illuminated the importance of diversification in sourcing fresh citrus fruits, if
demand is to remain steady and continuous. Fresh citrus fruits that were sourced from fewer locations
exhibited greater seasonal amplitude than fruits that were sourced from multiple global locations. The
phase shift in imports provides some insight into the dynamics of the complementary domestic citrus
industry. In the case of mandarins, its acceptance into the regular mainstream fresh fruit diet has tended
to shift its consumption from being a one season product, while the phase shift in limes reflects the
decline and eventual loss of the U.S. lime sector.
References
Alston, J.M., J.A. Chalfant, and N.E. Piggott. 2001. “Incorporating Demand Shifters in the Almost Ideal Demand System.” Economic Letters. 70:73-78. Arnade, C., and D. Pick 1998. “Seasonality and Unit Roots: The Demand for fruits”, Agricultural Economics. 18:53-62. Brown, M. G., Lee, J. Y. 1997. Incorporating Generic and Brand Advertising Effects in the Rotterdam Demand System. International Journal of Advertising 16 (3): 211‐220. Brown, M. G., and Spreen, T. H. 2010.The Allocation of Advertising and Research Dollars in the Florida Orange Juice Industry. International Journal of Food System Dynamics (1):37-45. Capps, Jr., O.; Bressler; D. A. , and Williams, G. W. 2003. Evaluating the Economic Impacts Associated with Advertising Efforts of the Florida Department of Citrus. Prepared for the Advertising Review Committee in Association with the Florida Department of Citrus and Citrus Mutual. College Station, Texas: Forecasting and Business Analytics, LLC (FABA). Deaton, A. S., and J. Muellbauer. 1980a. “An Almost Ideal Demand System.” American Economic Review 70: 312–26.
Deaton, A. S., and J. Muellbauer. 1980b. Economics and Consumer Behavior. Cambridge: Cambridge University Press. Eales J, Unnevehr L. 1993. “Simultaneity and Structural Change in US Meat Demand.” American Journal of Agricultural Economics 75: 259-268
Feleke, S, T and R. L. Kilmer. 2009. “The Japanese Market for Imported Fruit Juices”. International Food and Agribusiness Management Review. 12:1-28 Goodwin, B.K., D. Harper, and R. Schnepf. 2003. “Short-Run Demand Relationships in the U.S. Fats and Oils Complex.” Journal of Agricultural and Applied Economics. 35(2003):171-184 Houck, J.P. 1966. “A Look at Flexibilities and Elasticities: Reply”. Journal of Farm Economics 48(1966):1022-1023. Henneberry, S.R., and S.H. Hwang. 2007. “Meat Demand in South Korea: An Application of the Restricted Source-Differentiated Almost Ideal Demand System Model.” Journal of Agricultural and Applied Economics 39:47-60. Ito, K. and J. Dyck. 2010. “Fruit Policies in Japan” E-Outlook, USDA-ERS, FTS-341-01. Lee, J., J.L. Seale, Jr., and P A. Jienviriyapant. 1990 “Do Trade Agreements Help U.S. Exports? A Study of the Japanese Citrus Industry,” Agribusiness: An International Journal, 6, 505 (1990).
Lewbel, A. “A Unified Approach to Incorporating Demographic or other Effects into Demand Systems.” Review of Economic Studies. (1985):1-18. Kantor, L.S. and M. Malanoski. 1997. “Imports Play a Growing Role in the American Diet.” Food Review, USDA-ERS, September-December 1997. Makridakis, S., S. C. Wheelwright, and V. E. McGee. 1983. Forecasting: Methods and Applications. New York: John Wiley and Sons. Mori, H., J. Dyck, S.Pollack, and K. Ishibashi. 2008. “Japanese Market for Oranges” E-Outlook, USDA-ERS, FTS-330-01. Moschini, G. and D. Moro. 1994. “Autocorrelation Specification in Singular Equation Systems.” Economic Letters. 46: 303-09. Moschini, G. and A. Vissa. 1993. “Flexible Specification of Mixed Demand Systems.” American Journal of Agricultural Economics. 46: 303-09. Perez, A. and S. Pollack, 2000. “Fruit and Tree Nuts Outlook” E-Outlook, USDA-ERS, FTS-289. Perez, A. and S. Pollack, 2002. “Fruit and Tree Nuts Outlook” E-Outlook, USDA-ERS, FTS-296.

Perez, A. and S. Pollack, 2003a.“Fruit and Tree Nuts Outlook” E-Outlook, USDA-ERS, FTS-302. Perez, A. and S. Pollack, 2003b. “Fruit and Tree Nuts Outlook” E-Outlook, USDA- ERS, FTS-306. Perez, A. and S. Pollack, 2004. “Fruit and Tree Nuts Outlook” E-Outlook, USDA-ERS, FTS-310. Perez, A. and S. Pollack, 2005. “Fruit and Tree Nuts Outlook” E-Outlook, USDA-ERS, FTS-314. U.S. Department of Agriculture, Economic Research Service (ERS) Real and Nominal Country Exchange Rates, http://www.ers.usda.gov/Data/exchangerates/ accessed May 2, 2010. Piggott, N.E. and T.L. Marsh. 2004. “Does Food Safety Information Impact US Meat Demand?” American Journal of Agricultural Economics. 86:154-174. Pollak, R.A. and T.J. Wales. 1981. “Demographic Variables in Demand Analysis.” Econometrica. 49:1533-51. Seale, J., Lee, J, Schmitz, A. and Schmitz, T. 2005. Import Demand for Fresh Fruit in Japan and Uniform Substitution for Products from Different Sources. International Agricultural Trade and Policy Center Monograph Series, MGTC 05-02, Food and Resource Economics Department, University of Florida, 92 pages. Schmitz, T. and J. Seale. 2002. Import Demand for Disaggregated Fresh Fruits in Japan. Journal of Agricultural and Applied Economics 34(3):585-02.
Sparks, Amy. 1992. A system-wide approach to import demand for U.S. fresh oranges. Agribusiness: An International Journal 8(3):253-260.
Torres, M. 1996. Almost Ideal Demand System: Citrus Fruit Demand Elasticities in Germany. Acta Hort. (ISHS) 429:445-452. http://www.actahort.org/books/429/429_56.htm accessed April 26.
U.S. Department of Agriculture, Foreign Agricultural Service (FAS) Foreign Agricultural Trade of the United States (FATUS). http://www.ers.usda.gov/Data/FATUS. Accessed March, 2011.
U.S. Department of Agriculture, Economic Research Service (2010a). Fruit and tree nut per capita use, 1976-2009, Fruit and Tree Nut Yearbook Spreadsheet Files, http://usda.mannlib.cornell.edu/usda/ers/89022/Table-A1.xlsx. U.S. Department of Agriculture, Economic Research Service (2010b). Various fresh fruit supply and utilization tables, 1980/81 to date, Fruit and Tree Nut Yearbook Spreadsheet Files, http://usda.mannlib.cornell.edu/MannUSDA/viewDocumentInfo.do?documentID=1377. U.S. Department of Agriculture, Economic Research Service. Data Access Retrieval and Tabling System. U.S. trade data from the Bureau of the Census. Accessed, March 2010. U.S. Department of Agriculture, Foreign Agricultural Service (2011). “Production, Supply, and Distribution database,” Available at: http://www.fas.usda.gov/psd. Washington, A., R. L. Kilmer and R. N. Weldon. 2002. “An Evaluation of the Effectiveness of the Florida

Cooperative Seasonal Pricing Plan on Seasonal Production Variability.” Agricultural and Resource Economics Review31:127-137. Ward, R.W. (1982). “Time Varying Demand for Oranges in the EEC,” Journal of Agricultural Economics, 33, 57. Ward, R. W. et al. (2005). Generic Promotions of Florida Citrus: What Do We Know About the Effectiveness of the Florida Department of Citrus Processed Orange Juice Demand Enhancing Programs. Prepared by a Panel of Economists Appointed by the Florida Citrus Commission, Lakeland, Florida. April 8, 2005.

Table 1. Nonlinear Almost Ideal Demand System Parameter Estimates for Imported Citrus
Intercept Orange Grapefruit Mandarin Lemon Lime Other Expenditure
Orange -1.187** 0.023 -0.021*** -0.216*** -0.006 0.212 -0.008 -0.083***
(0.487) (0.096) (0.007) (0.049) (0.028) (0.127) (0.012) (0.029) Grapefruit -0.060 -0.002 0.003 0.001 0.015 0.003*** -0.005
(0.068) (0.002) (0.008) (0.003) (0.015) (0.001) (0.004) Mandarin -1.653*** -0.122 0.013 0.331*** 0.017 0.113***
(0.439) (0.101) (0.030) (0.105) (0.013) (0.006) Lemon 0.108 0.011 0.004 0.004 -0.009
(0.261) (0.005) (0.056) (0.004) (0.016) Lime 3.873*** -0.534*** -0.028* -0.203***
(0.386) (0.159) (0.022) (0.023) Other 0.135 -0.005** -0.007
(0.106) (0.002) (0.006) Asymptotic standard errors are in parentheses. ***Significance level < 0.01 **Significance level < 0.05 *Significance level < 0.10

Table 2. Seasonality and Trend Estimates of Imported Citrus Cosine Sine Trend
Orange -0.097*** -0.100*** -0.002** (0.020) (0.024) (0.001)
Grapefruit -0.002 0.004 0.000*** (0.003) (0.003) (0.000)
Mandarin 0.241*** 0.144*** 0.001 (0.018) (0.012) (0.001)
Lemon 0.025** -0.044*** 0.000 (0.010) (0.010) (0.000)
Lime -0.121*** 0.004 0.003*** (0.018) (0.021) (0.001)
Other 0.003
(0.004) 0.001
(0.004) 0.0001 (0.000)
Asymptotic standard errors are in parentheses. ***Significance level < 0.01 **Significance level < 0.05
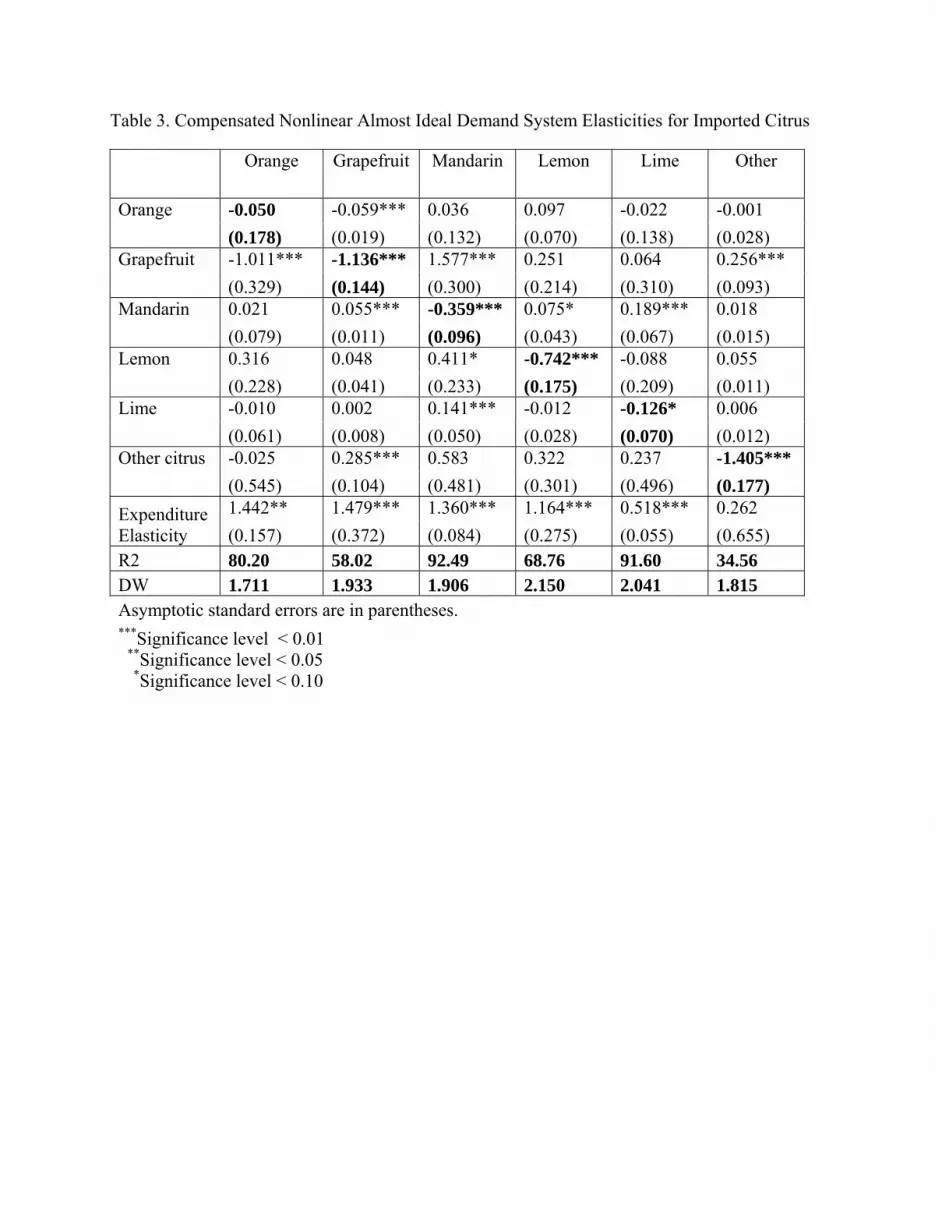
Table 3. Compensated Nonlinear Almost Ideal Demand System Elasticities for Imported Citrus
Orange Grapefruit Mandarin Lemon Lime Other
Orange -0.050 -0.059*** 0.036 0.097 -0.022 -0.001
(0.178) (0.019) (0.132) (0.070) (0.138) (0.028) Grapefruit -1.011*** -1.136*** 1.577*** 0.251 0.064 0.256***
(0.329) (0.144) (0.300) (0.214) (0.310) (0.093) Mandarin 0.021 0.055*** -0.359*** 0.075* 0.189*** 0.018
(0.079) (0.011) (0.096) (0.043) (0.067) (0.015) Lemon 0.316 0.048 0.411* -0.742*** -0.088 0.055
(0.228) (0.041) (0.233) (0.175) (0.209) (0.011) Lime -0.010 0.002 0.141*** -0.012 -0.126* 0.006
(0.061) (0.008) (0.050) (0.028) (0.070) (0.012) Other citrus -0.025 0.285*** 0.583 0.322 0.237 -1.405***
(0.545) (0.104) (0.481) (0.301) (0.496) (0.177)
Expenditure Elasticity
1.442** 1.479*** 1.360*** 1.164*** 0.518*** 0.262
(0.157) (0.372) (0.084) (0.275) (0.055) (0.655) R2 80.20 58.02 92.49 68.76 91.60 34.56 DW 1.711 1.933 1.906 2.150 2.041 1.815 Asymptotic standard errors are in parentheses. ***Significance level < 0.01 **Significance level < 0.05 *Significance level < 0.10

Table 4. Amplitude and Phase Shift in Seasonal Citrus Imports by the United States.
Amplitude Phase shift
Orange 0.092*** 0.282
(0.015) (0.195)
Grapefruit 0.005** -0.733
(0.002) (0.583)
Mandarin 0.111*** 1.464***
(0.018) (0.104)
Lemon 0.021*** 0.307
(0.007) (0.414)
Lime 0.174*** -1.009***
(0.018) (0.122)
Other citrus
0.003 (0.004)
1.412 (1.292)
Asymptotic standard errors are in parentheses. ***Significance level < 0.01 **Significance level < 0.05
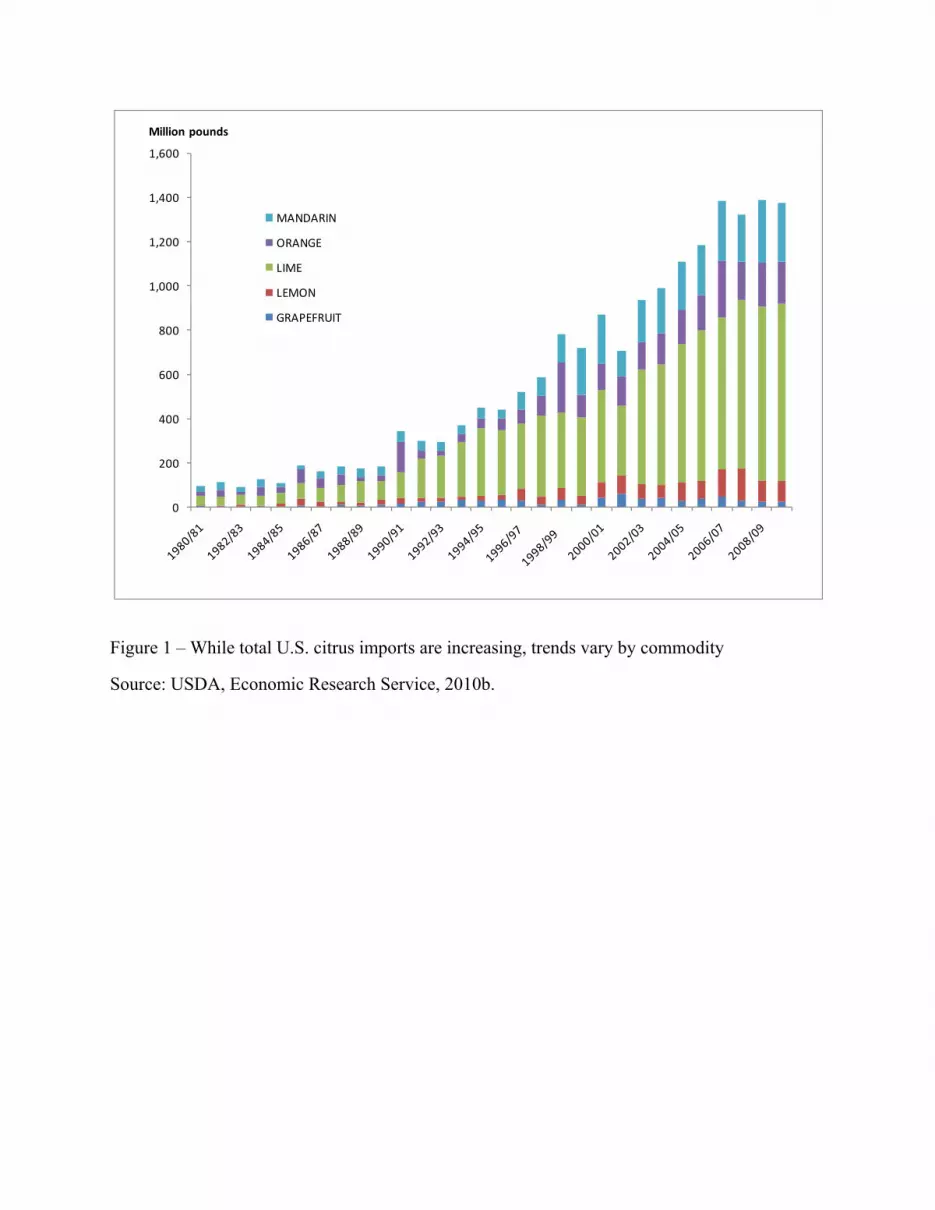
Figure 1 – While total U.S. citrus imports are increasing, trends vary by commodity
Source: USDA, Economic Research Service, 2010b.
0
200
400
600
800
1,000
1,200
1,400
1,600
Million pounds
MANDARIN
ORANGE
LIME
LEMON
GRAPEFRUIT

Figur
the U
0
0.2
0.4
0.6
0.8
1
re 2. Seasona
United States
1989
1990
1991
1992
lity associate
1994
1995
1996
1997
1999
Actual
d with citrus
1999
2000
2001
2002
2004
Predicted
Lime
imports by
2005
2006
2007
2009
2010
d
2010