chapter - african export-import bank
TRANSCRIPT
AFRICAN EXPORT-IMPORT BANKBANQUE AFRICAINE DʼIMPORT-EXPORT
(AFREXIMBANK)
Annual ReportAnd
Financial StatementsFor The Year EndedDecember 31, 2002

CONTENTS
Contents Page
Afreximbankʼs Mission ......................................................................................................... iTransmittal Letter ................................................................................................................. iiBoard of Directors ................................................................................................................ iiiManagement .......................................................................................................................... ivExternal Auditors .................................................................................................................. vList of Tables ......................................................................................................................... viList of Figures ....................................................................................................................... viiList of Boxes ......................................................................................................................... viiList of Appendices ................................................................................................................ viii
Chapter OneIntroduction ............................................................................................................................... 1
PART ONE: THE OPERATING ENVIRONMENT ............................................................... 3
Chapter TwoInternational Developments ...................................................................................................... 5
Chapter ThreeDevelopments in Africa .......................................................................................................... 17
PART TWO: AFREXIMBANK ACTIVITIES AND FINANCIAL RESULTS ................... 45
Chapter FourAfreximbank Operations and Activities .................................................................................. 47
Chapter FiveOperating Results .................................................................................................................... 67
FINANCIAL STATEMENTS .............................................................................................. 69
Annexes ................................................................................................................................... 86

Afreximbankʼs Mission
To stimulate a consistent expansion, diversification and development of African trade
while operating as a first class profit-oriented financialinstitution and a center of excellence in African trade matters.
i

TRANSMITTAL LETTER
AFREXIMBANK
March 22, 2003
The ChairmanGeneral Meeting of ShareholdersAfrican Export-Import BankCairoEgypt
Dear Mr. Chairman,
In accordance with Article 35 of Afreximbank Charter, I have the honour, on behalf of the Board of Directors, to submit, herewith, the Report of the Bankʼs activities for the period January 1, 2002 to December 31, 2002, including its audited Financial Statements covering the same period.
The Report also contains a review of the international and African economic environments under which the Bank operated during the period.
Mr. Chairman, please accept the assurances of my highest consideration.
Christopher C. EdorduPresident & Chairman of the Board of Directors
ii
BOARD OF DIRECTORS
Chairman M. C.C. Edordu President
MEMBERS OF THE BOARD
Class “A” Mr. A. Bâ Director
Hon. M. Keah Director
Mr. M. M. Khalil Director
Dr. S. Usman Director
Class “B” Mr. E. Koffi Ahoutou Director
Mr. C. Chikaura Director
Dr. M. Daouas Director
Mr. L-J Mabert Director
Class “C” Mr. F. Kennedy Director Dr. O. H. Saeed Director
Secretary to the Board Mr. Getachew Telahun
iii
MANAGEMENT
President & Chairman of the Board C.C. Edordu
Executive Vice President J-L Ekra
Deputy Director (Operations) K. El-Kheshen
Deputy Director (Projects & Administrative Services) K. Komara
Deputy Director (Finance) P. Kamau
Deputy Director (Planning and Development) & Special Assistantto the President B .O. Oramah
Deputy Director (Export Development Finance) T. A. B. Disu
Head Board Secretariat G. Telahun
Chief Legal Officer G. Elombi
iv
EXTERNAL AUDITORS
1. Deloitte & Touche, Nigeria
2. KPMG, Egypt
HEADQUARTERS
World Trade Center Building1191 Corniche El Nil
Cairo 11221Egypt
Postal Address :P. O. Box 404 Gezira
Cairo 11568Egypt
Tel: 20 2 578 0281-6Fax : 20 2 578 0276-9
TLX:20003 AFRXM UNE-mail : [email protected] [email protected] : www.afreximbank.com
HARARE BRANCH OFFICE
Eastgate Building3rd Floor Gold Bridge (North Wing)
2nd StreetHarare
ZimbabweTel: 263 4 729 751-5Fax: 263 4 729 756
Tlx: 26770 AFXYBK ZW
ABUJA BRANCH OFFICE (Opening First Quarter, 2003)
Plot 83, (2nd floor) Ralph Shodeinde Street,Central Business District
Opposite Federal Ministry of Finance,Rivers State Liaison Office
Abuja, Nigeria.
v
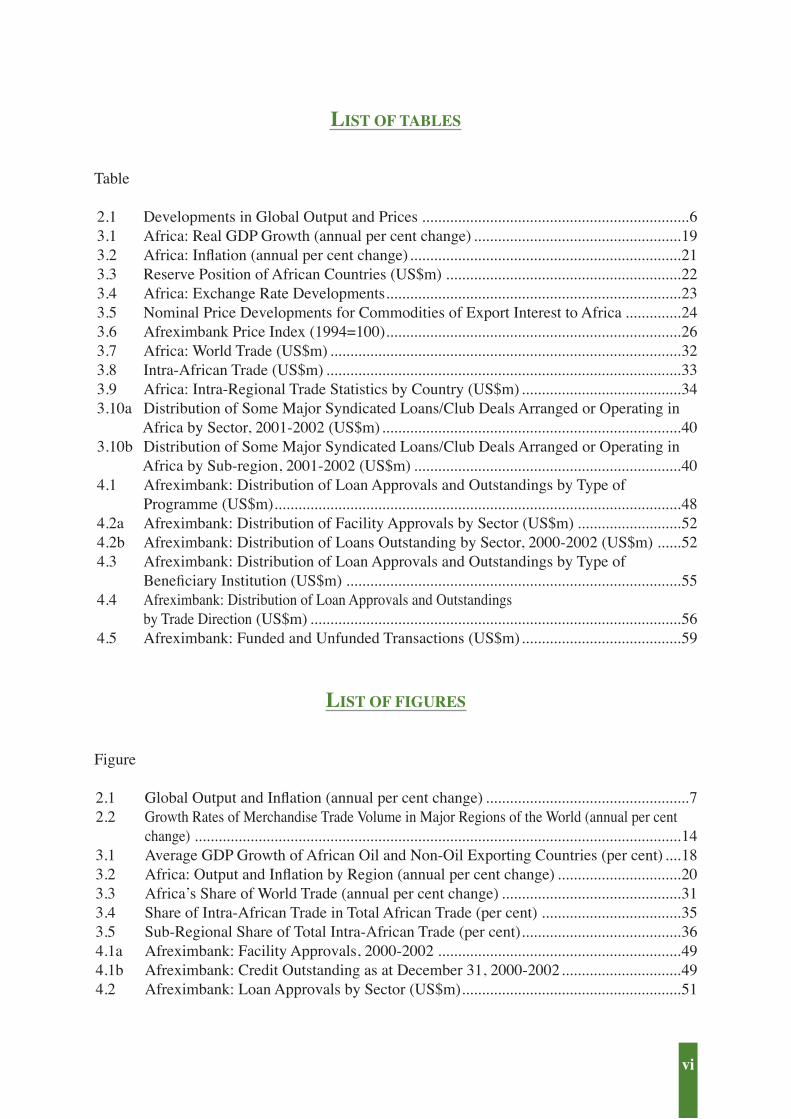
LIST OF TABLES
Table
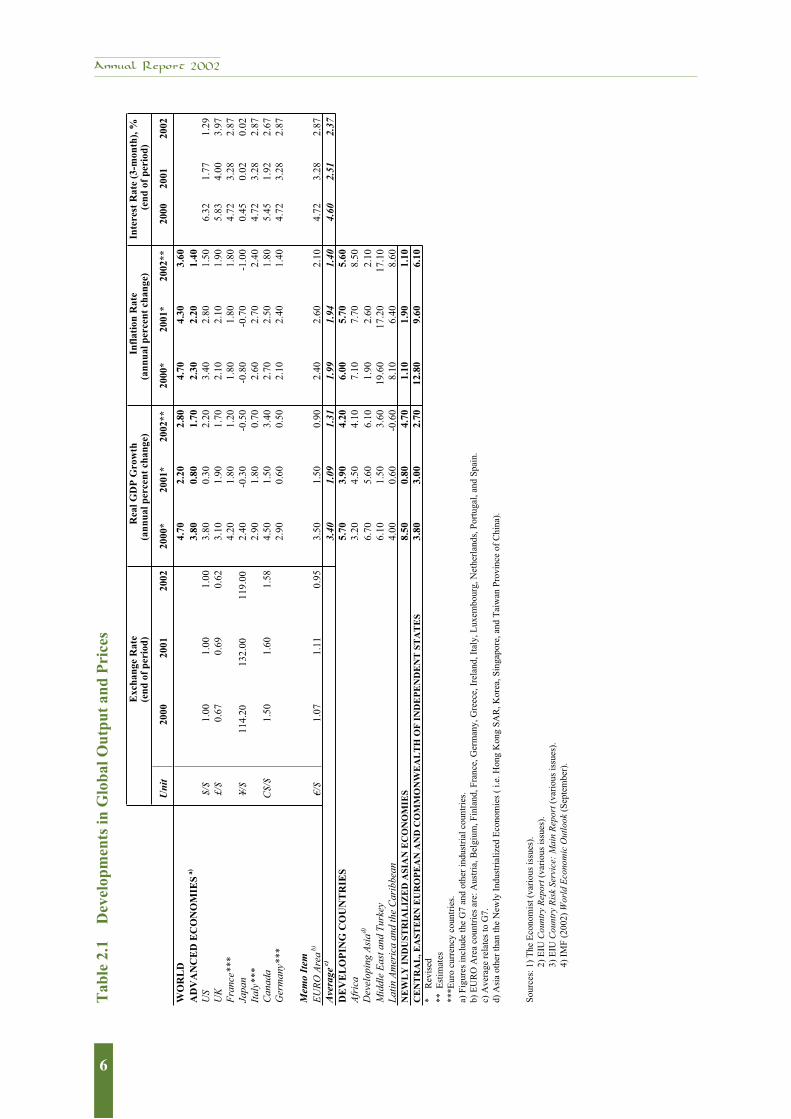
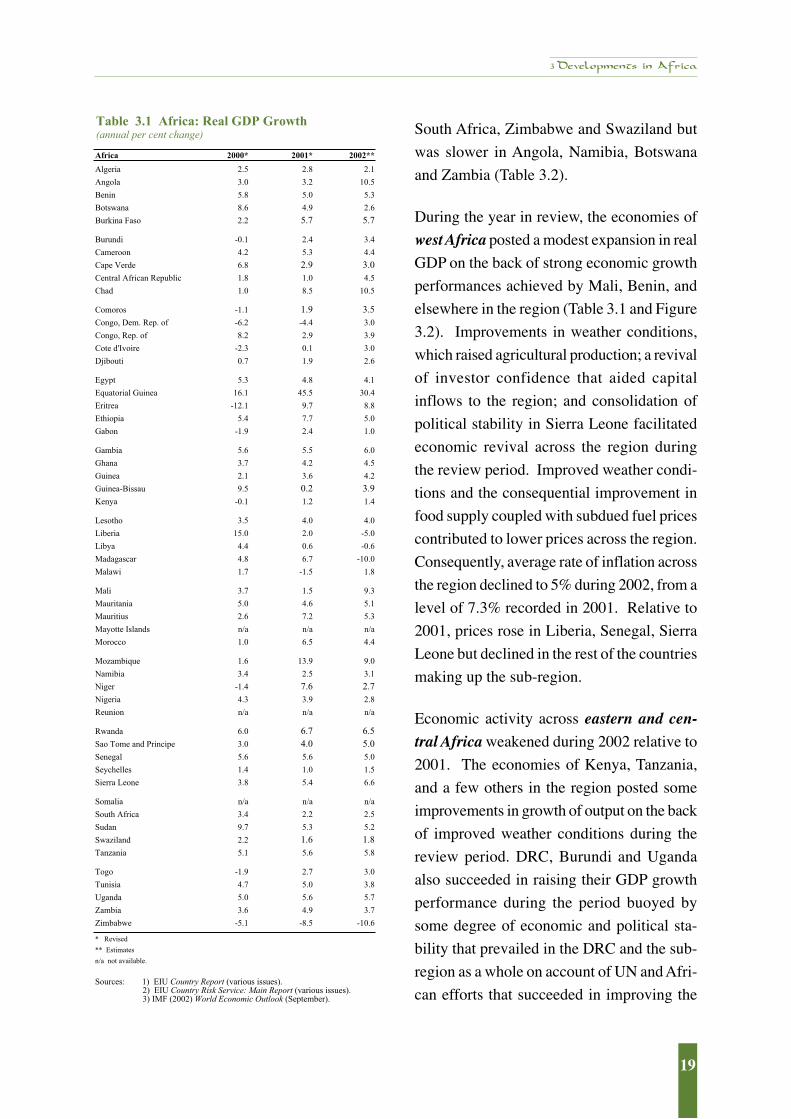
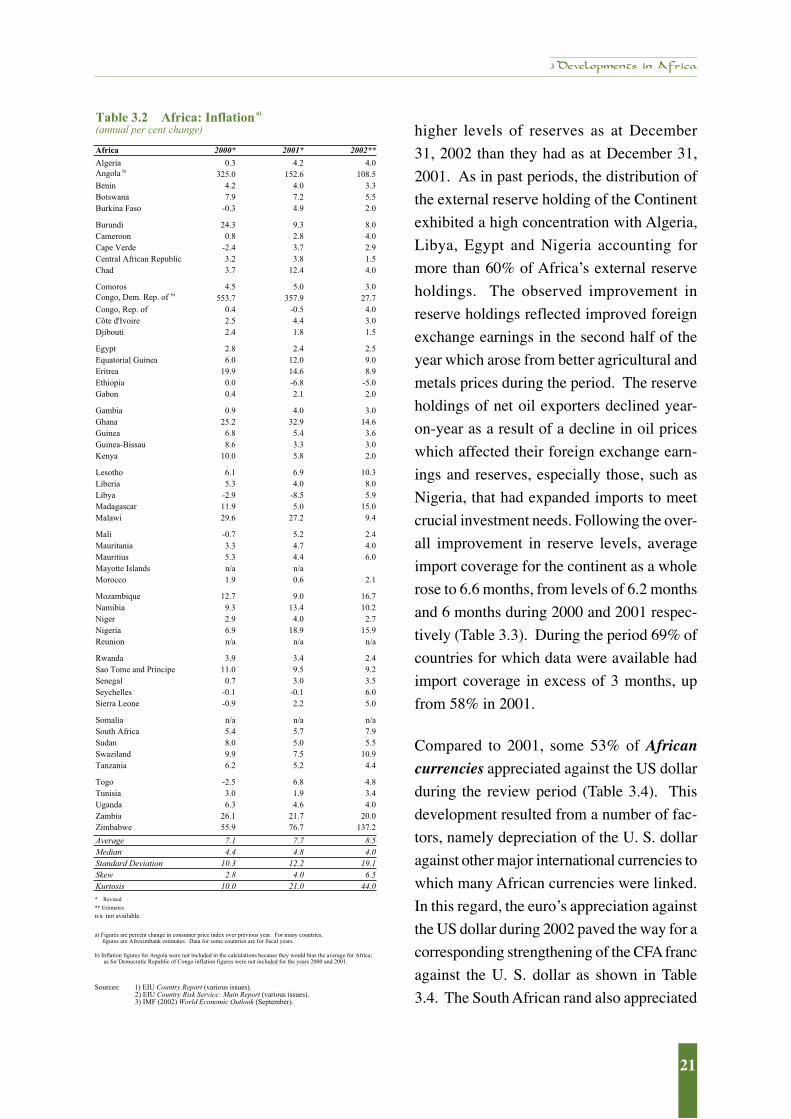
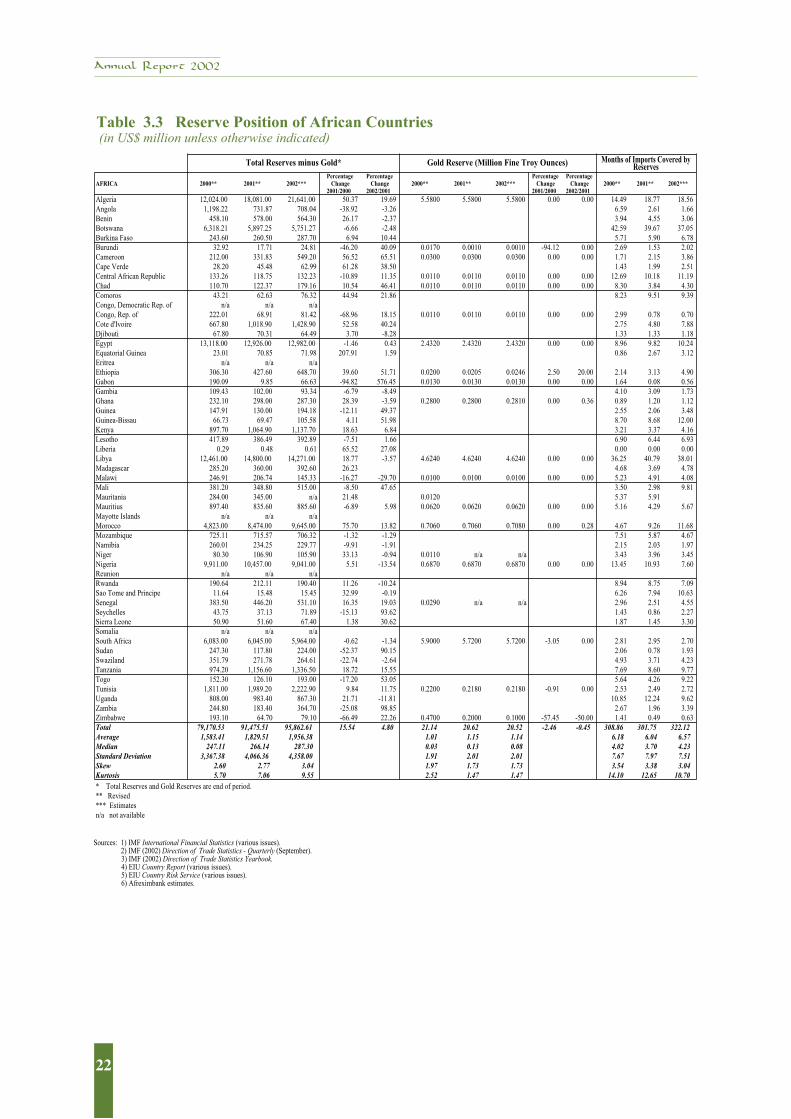
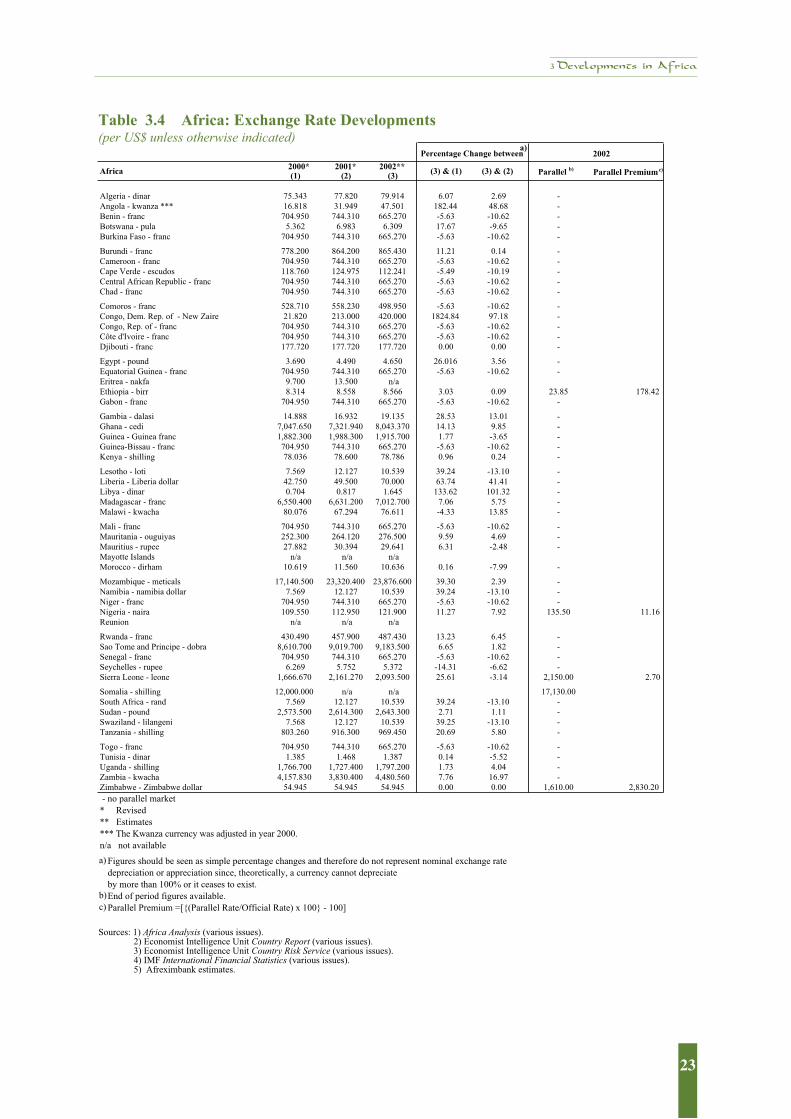
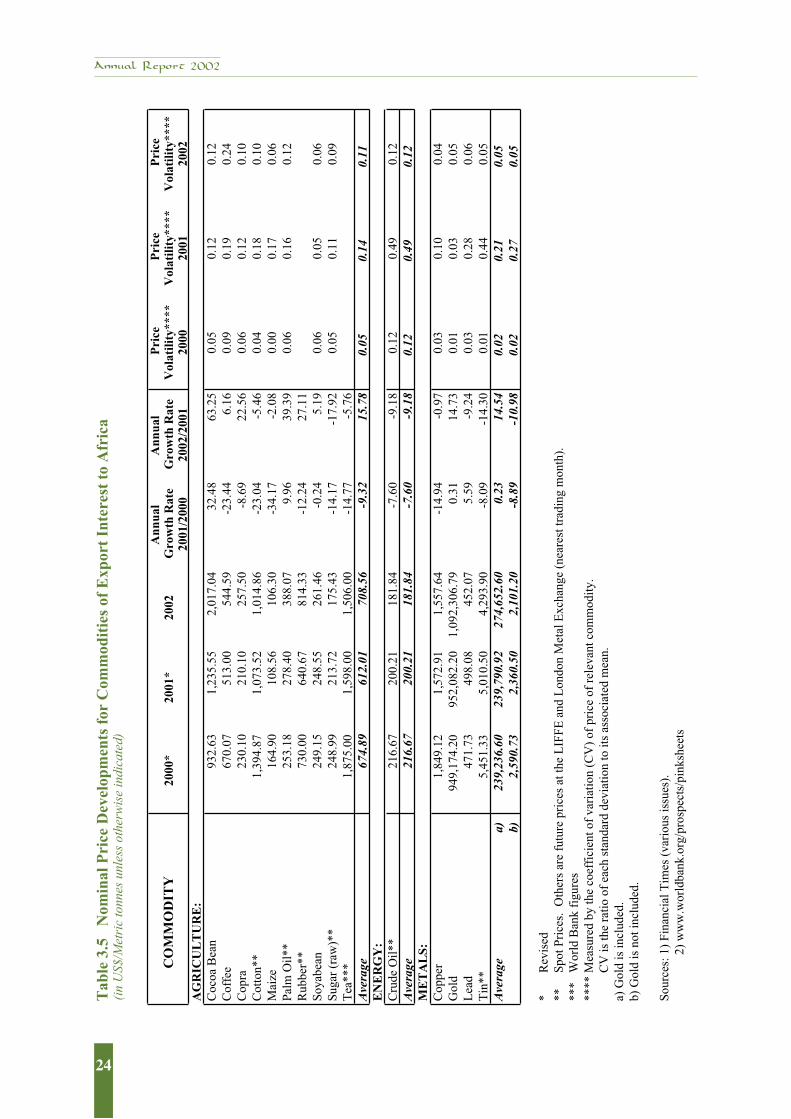
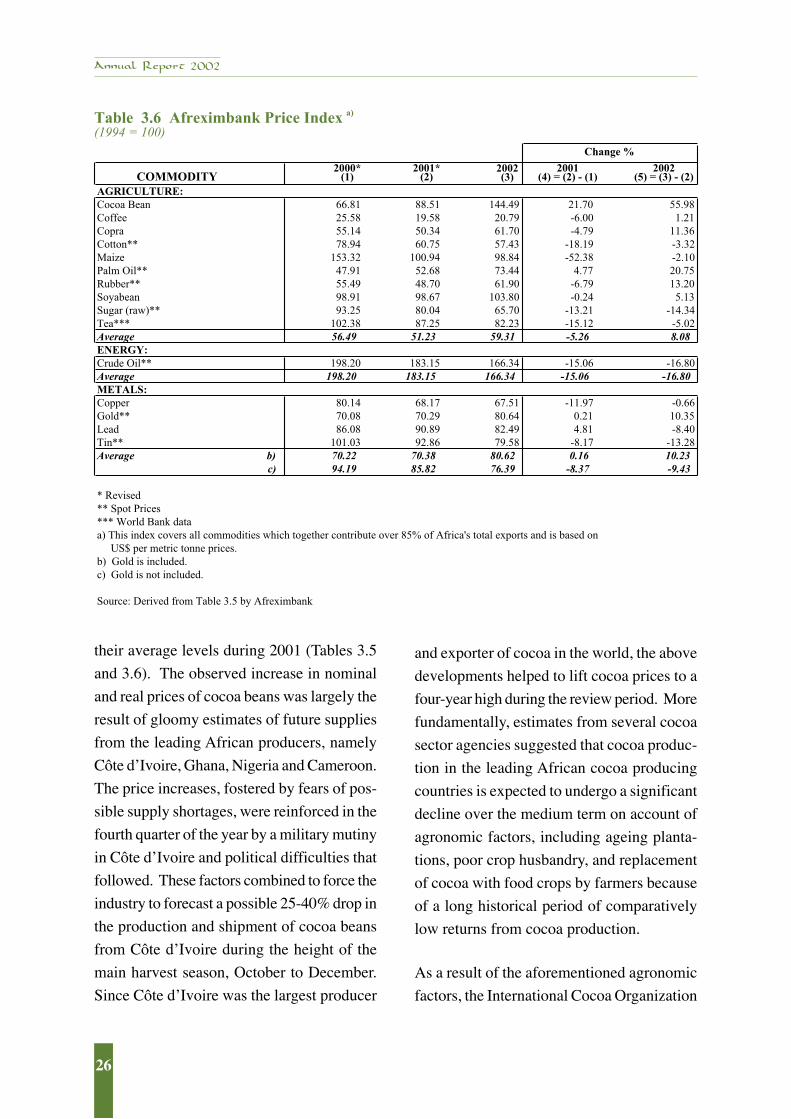
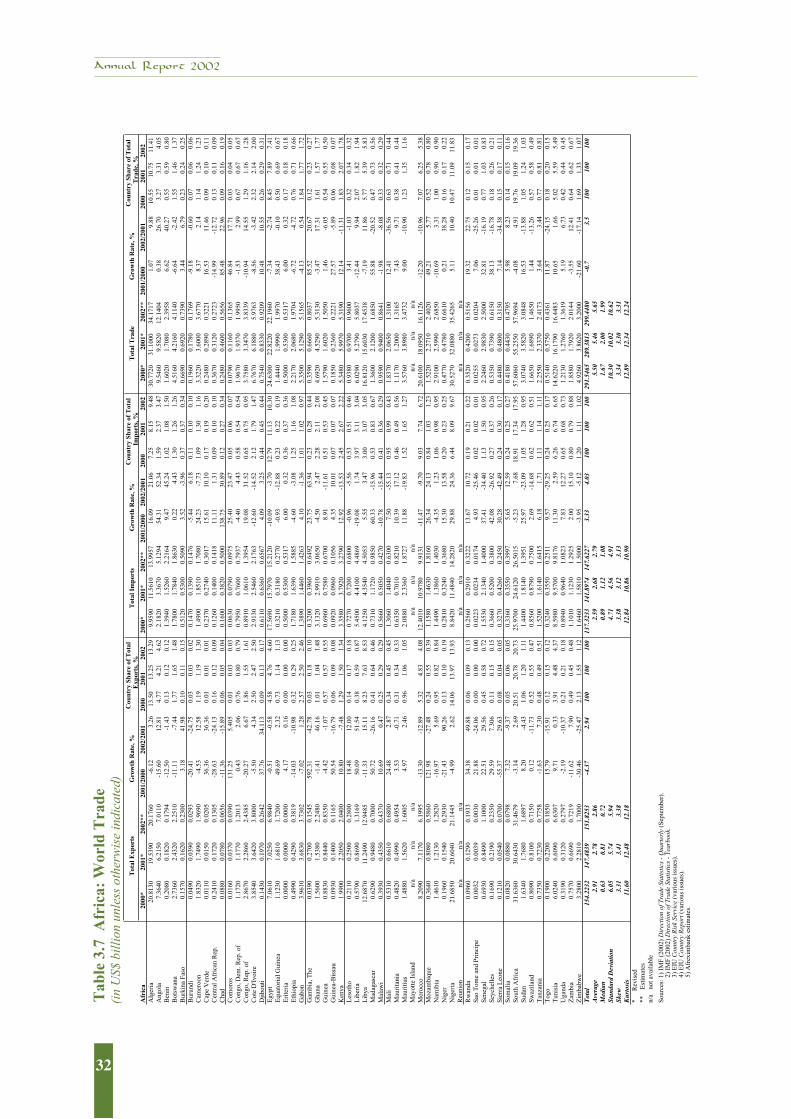
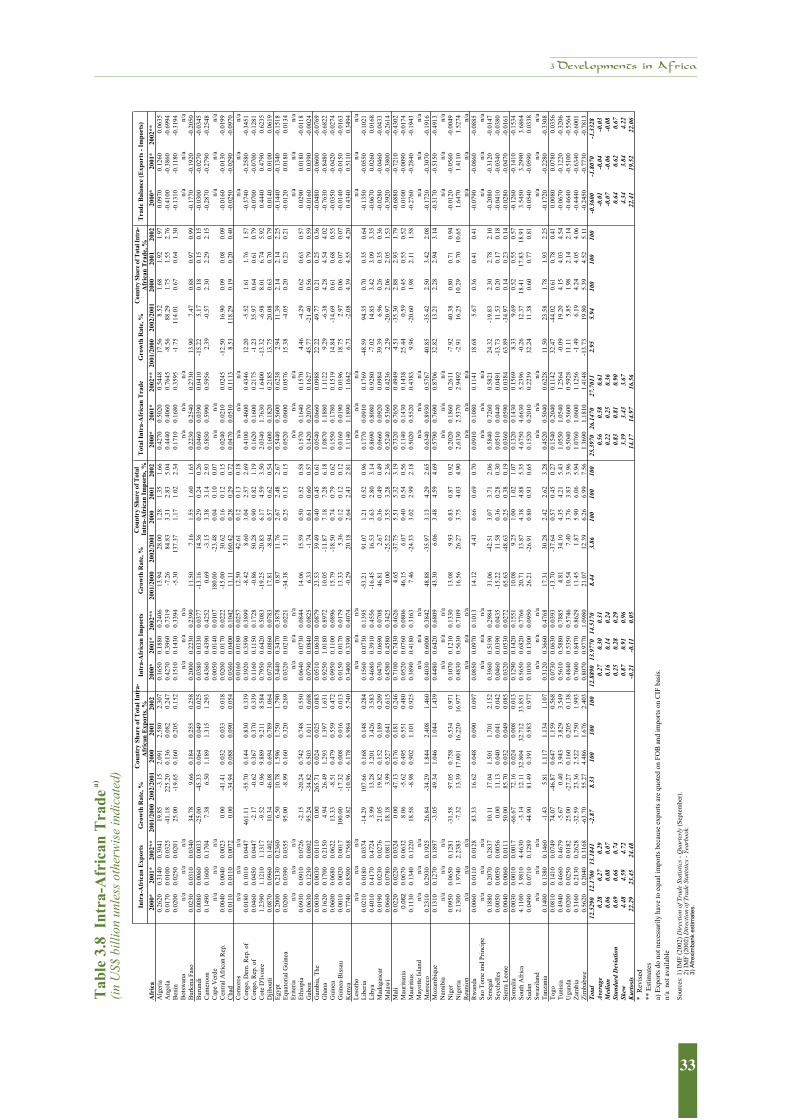
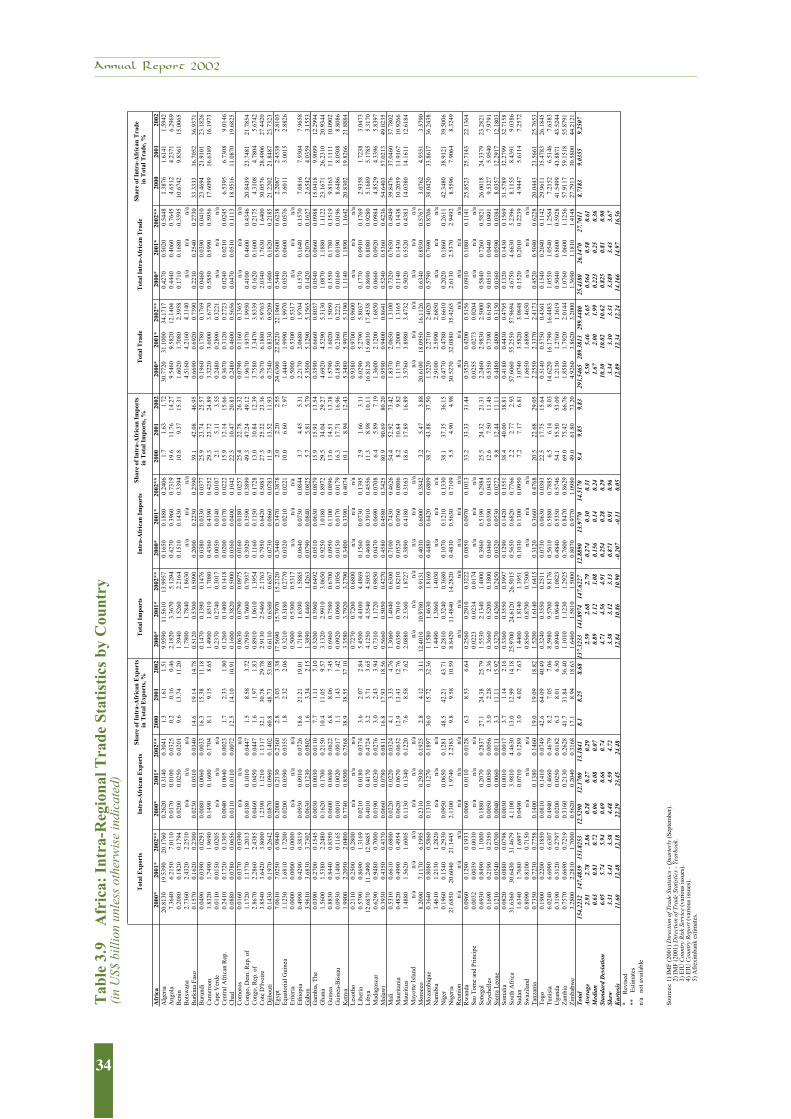
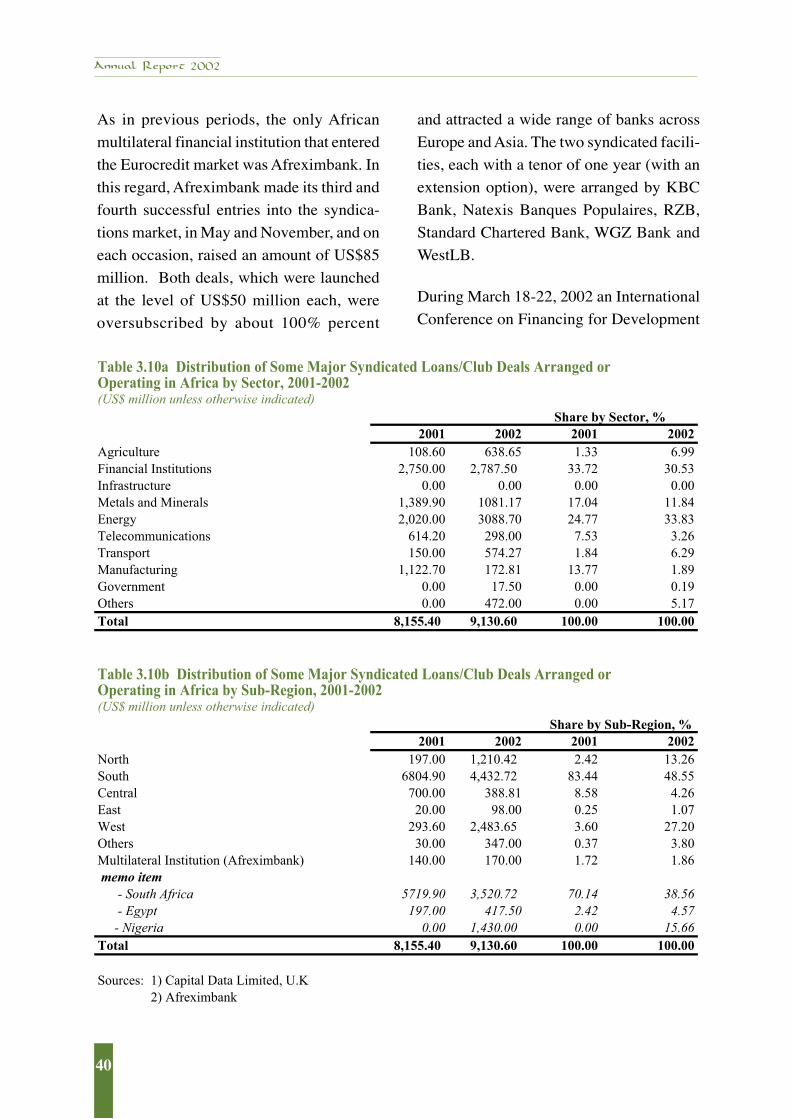
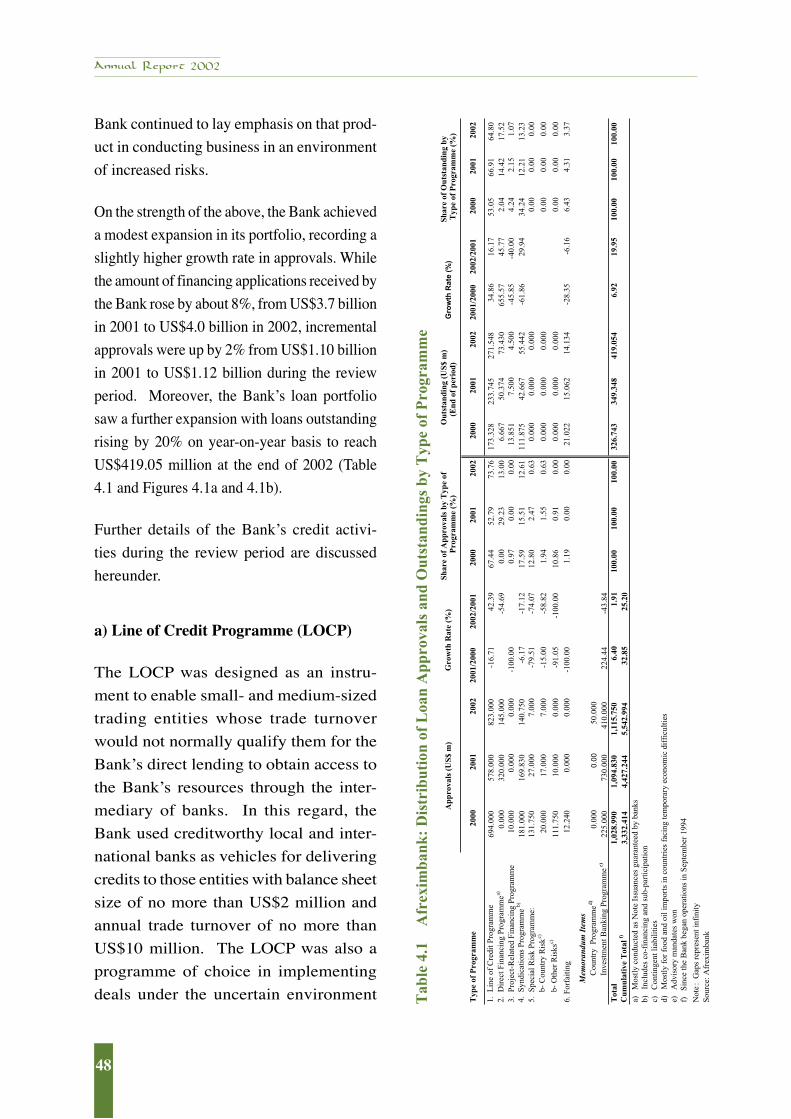
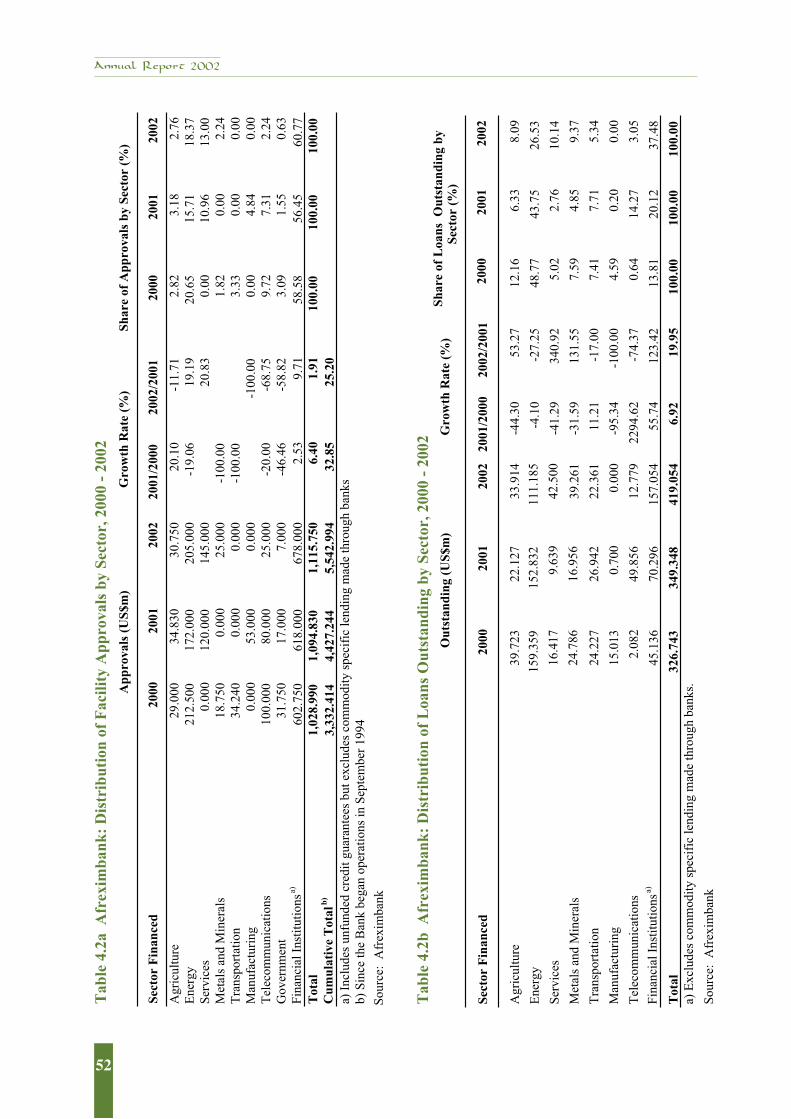
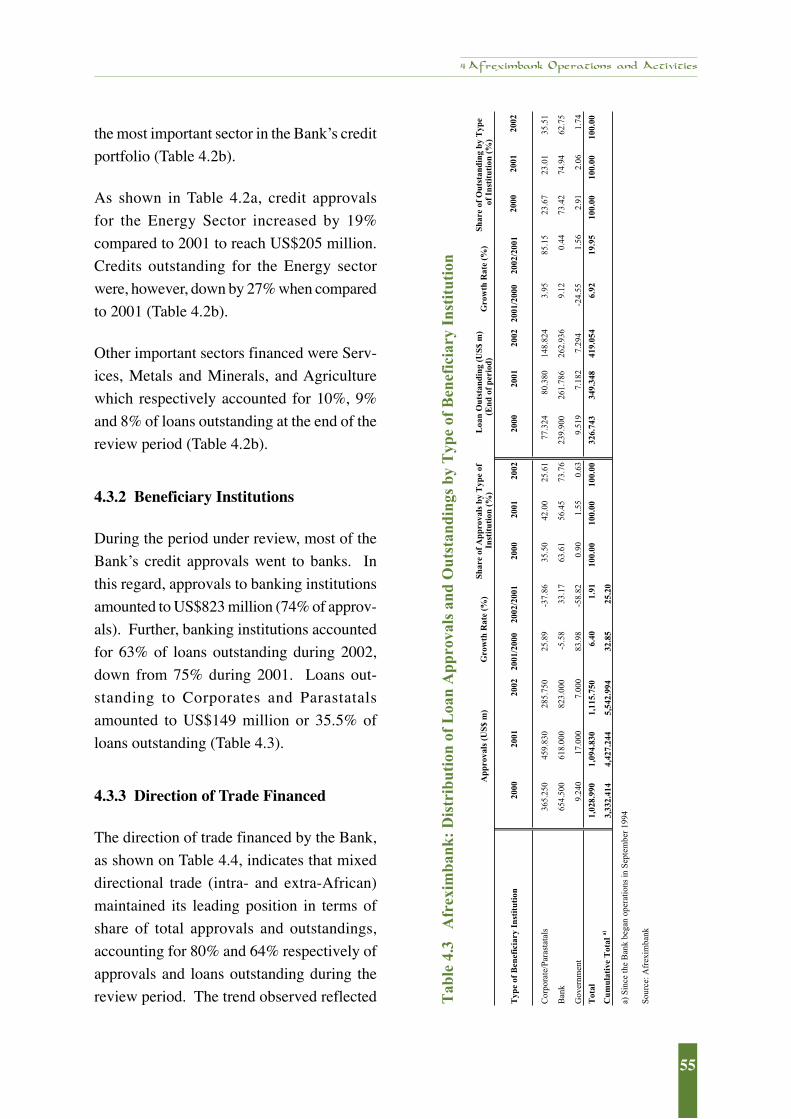
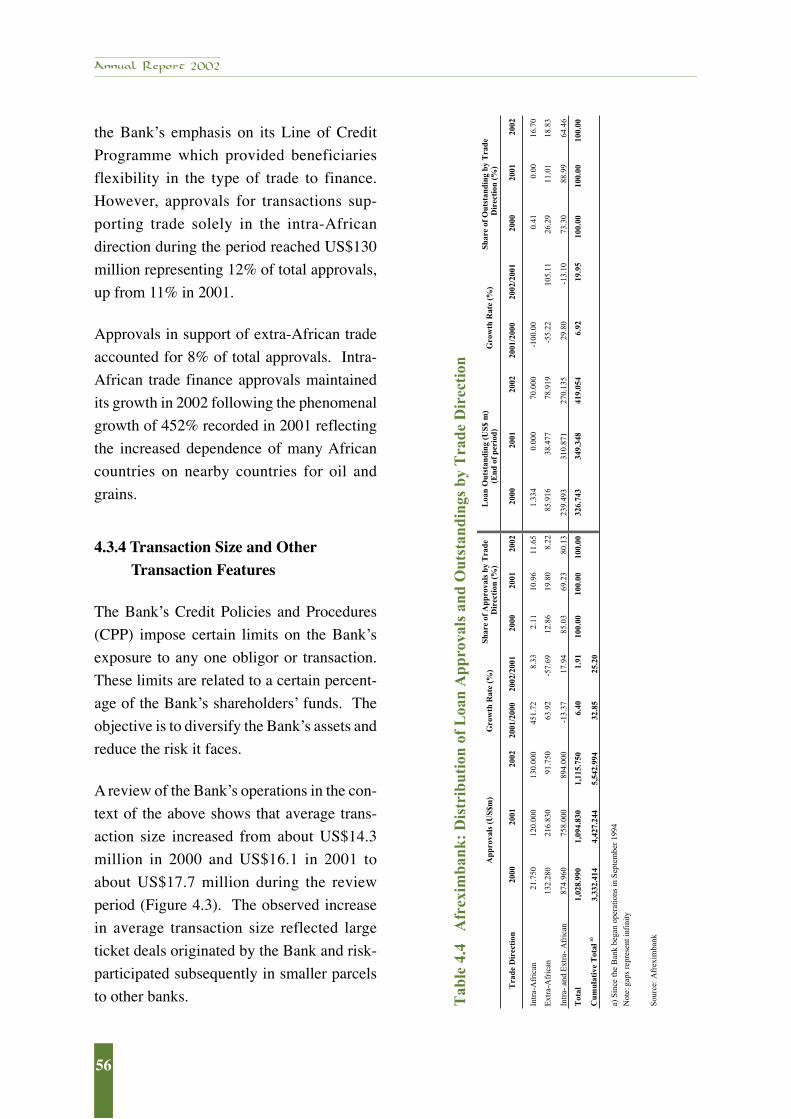
2.1 Developments in Global Output and Prices ...................................................................63.1 Africa: Real GDP Growth (annual per cent change) ....................................................193.2 Africa: Inflation (annual per cent change)....................................................................213.3 Reserve Position of African Countries (US$m) ...........................................................223.4 Africa: Exchange Rate Developments..........................................................................233.5 Nominal Price Developments for Commodities of Export Interest to Africa ..............243.6 Afreximbank Price Index (1994=100)..........................................................................263.7 Africa: World Trade (US$m) ........................................................................................323.8 Intra-African Trade (US$m) .........................................................................................333.9 Africa: Intra-Regional Trade Statistics by Country (US$m) ........................................343.10a Distribution of Some Major Syndicated Loans/Club Deals Arranged or Operating in Africa by Sector, 2001-2002 (US$m)...........................................................................403.10b Distribution of Some Major Syndicated Loans/Club Deals Arranged or Operating in Africa by Sub-region, 2001-2002 (US$m) ...................................................................404.1 Afreximbank: Distribution of Loan Approvals and Outstandings by Type of Programme (US$m)......................................................................................................484.2a Afreximbank: Distribution of Facility Approvals by Sector (US$m) ..........................524.2b Afreximbank: Distribution of Loans Outstanding by Sector, 2000-2002 (US$m) ......524.3 Afreximbank: Distribution of Loan Approvals and Outstandings by Type of Beneficiary Institution (US$m) ....................................................................................554.4 Afreximbank: Distribution of Loan Approvals and Outstandings by Trade Direction (US$m) .............................................................................................564.5 Afreximbank: Funded and Unfunded Transactions (US$m)........................................59
LIST OF FIGURES
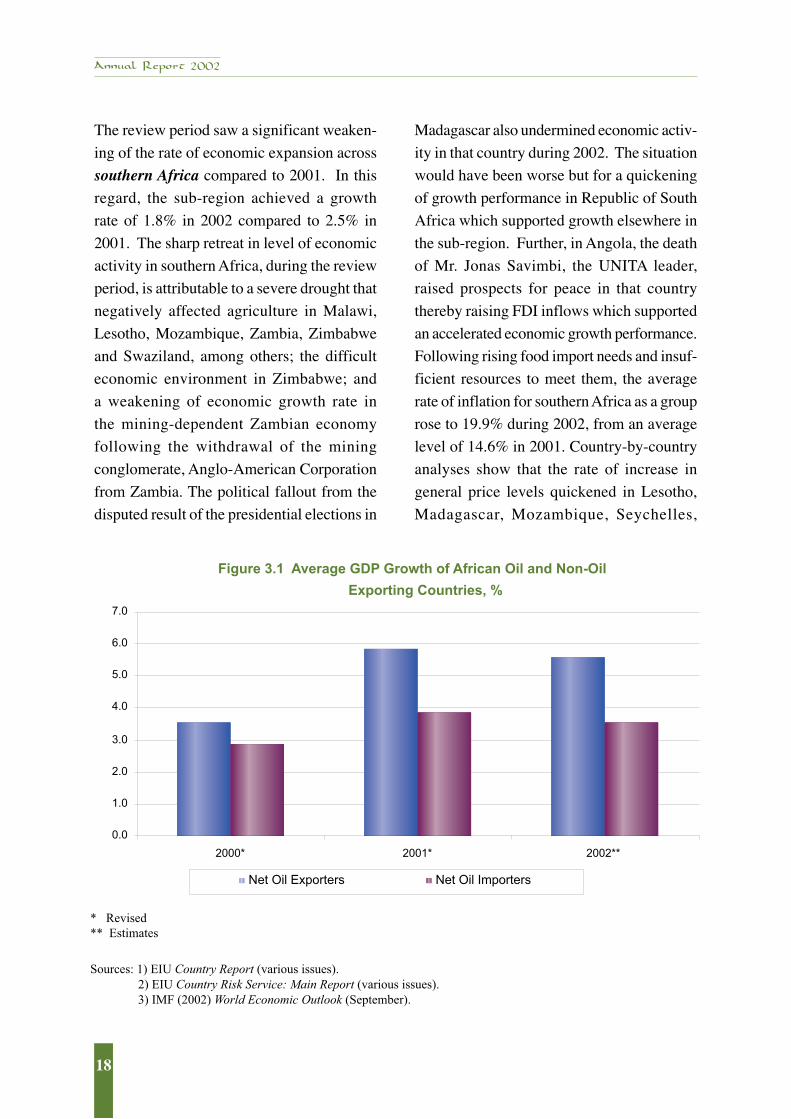
Figure
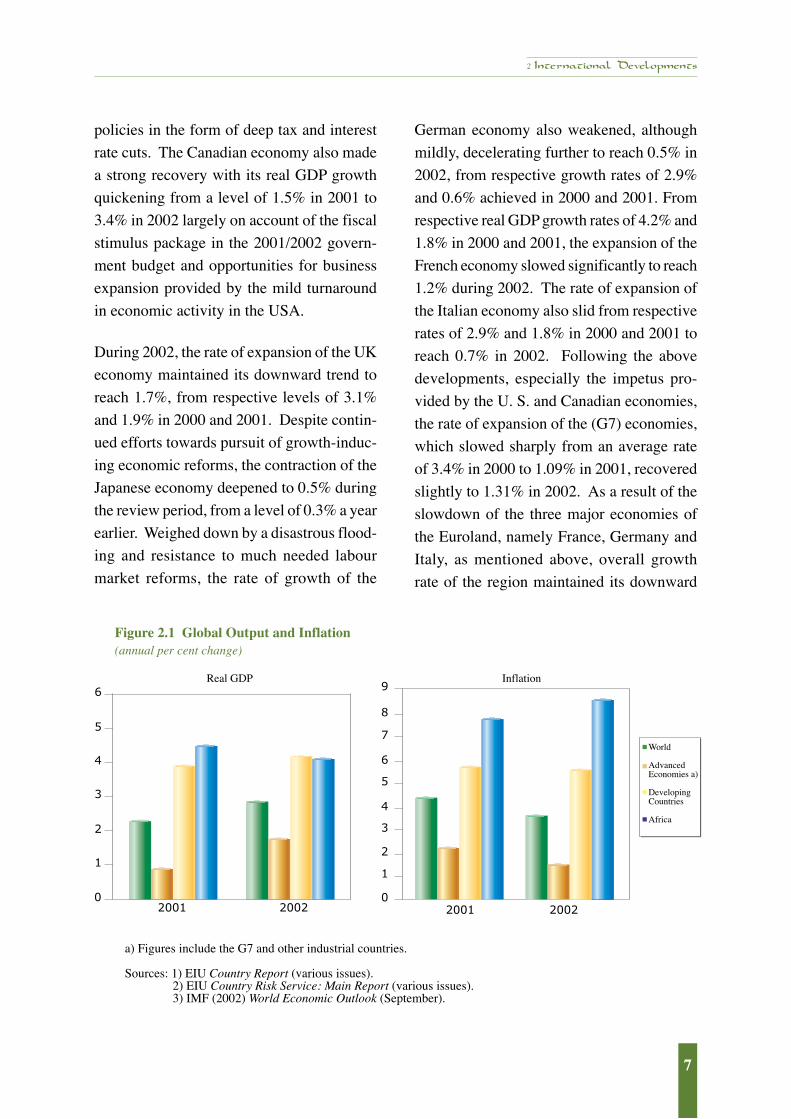
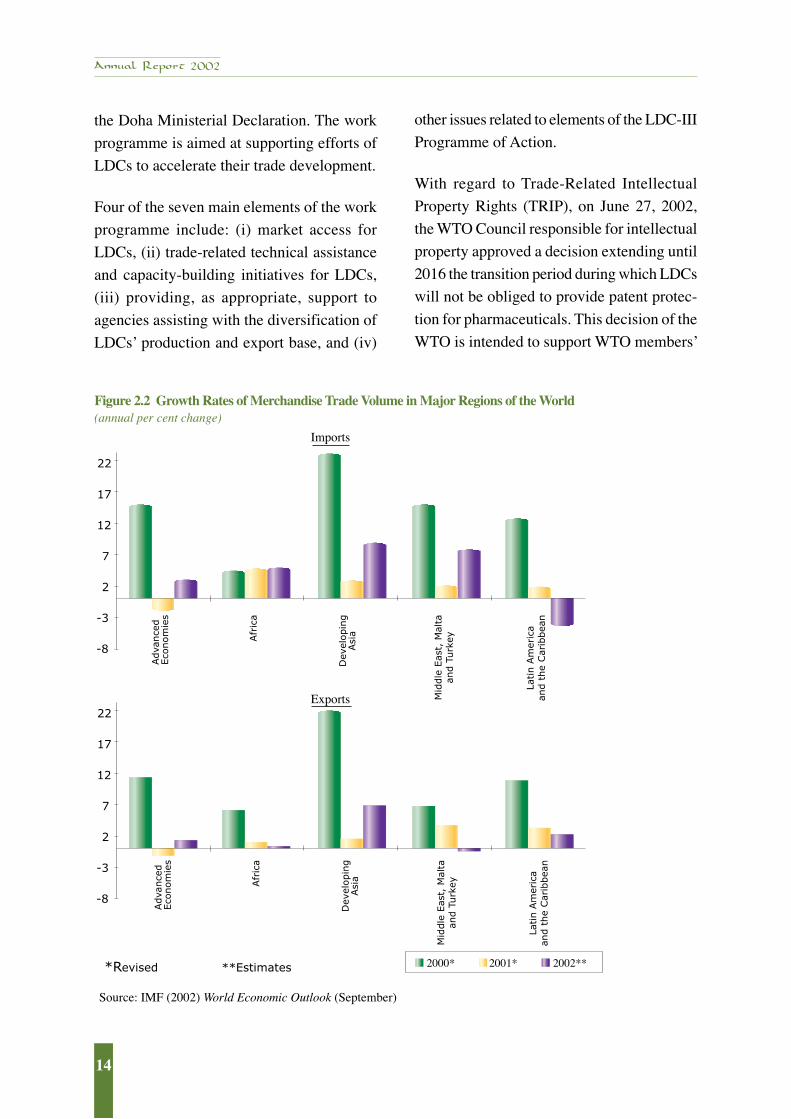
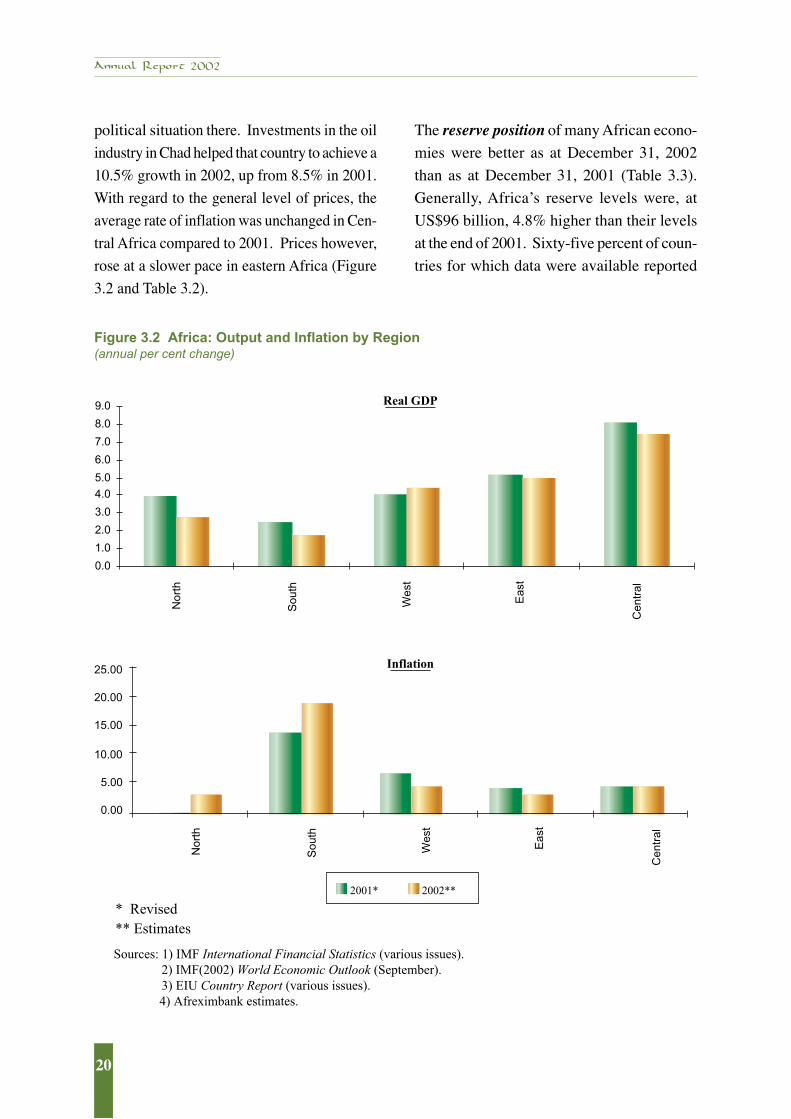
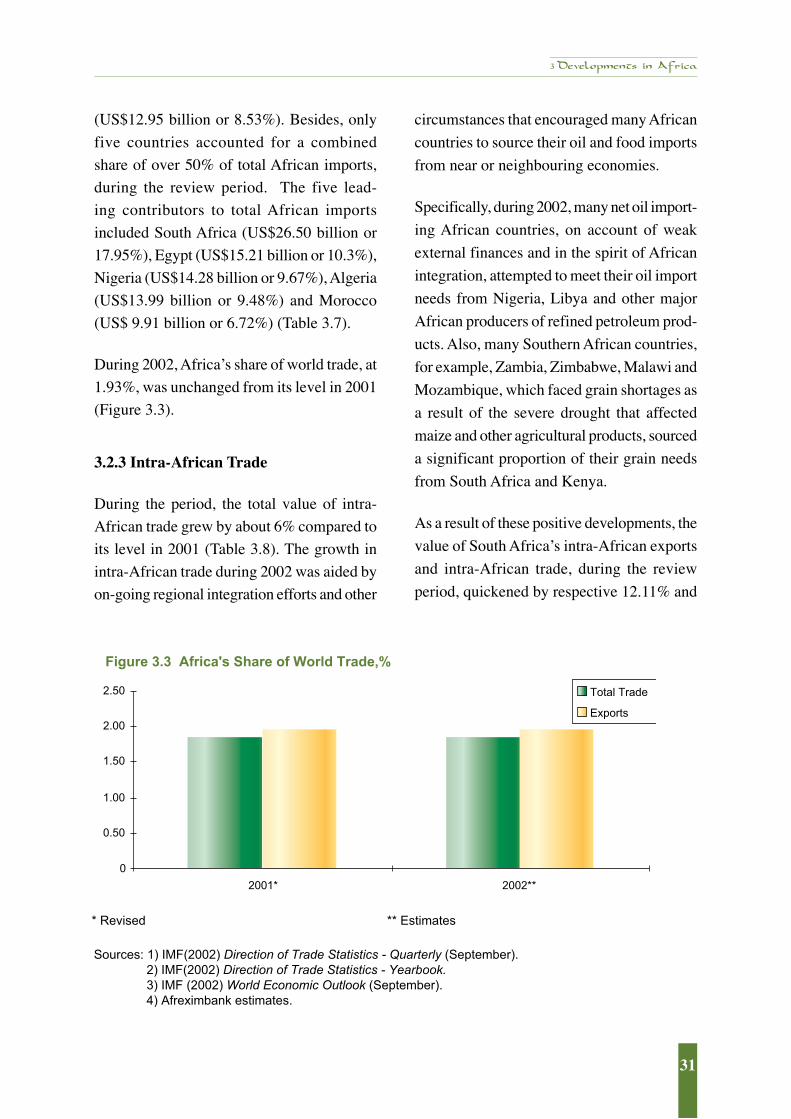
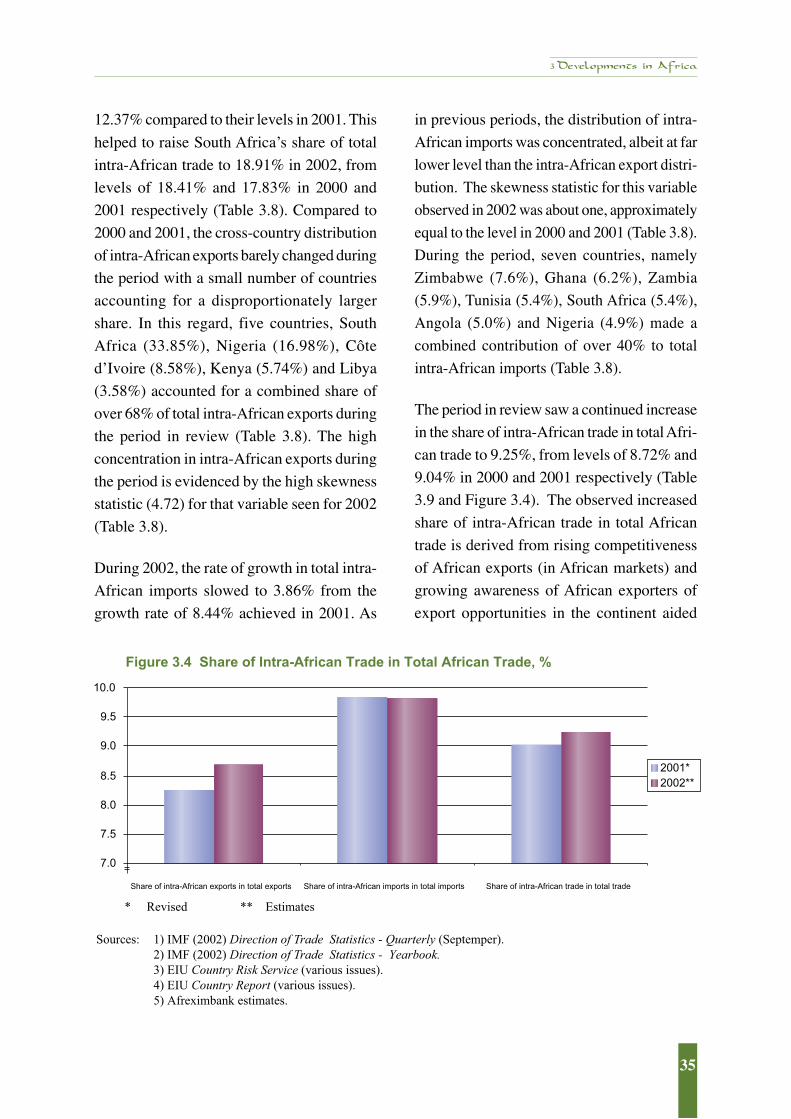
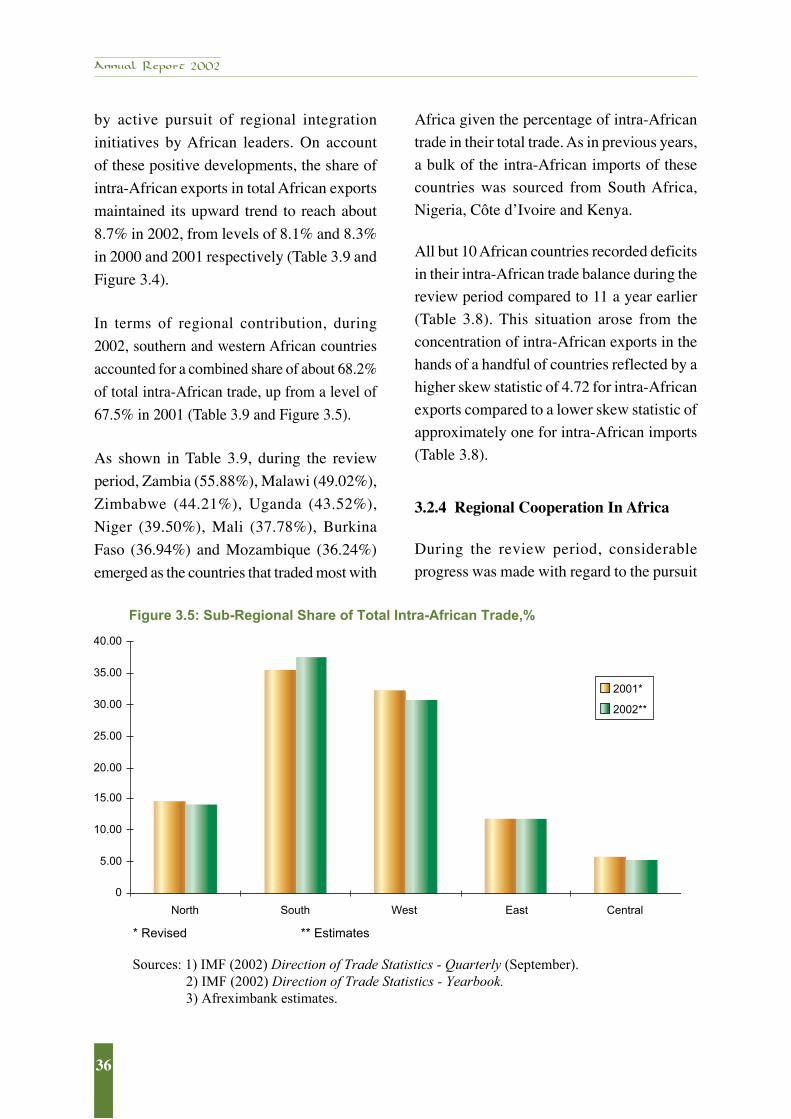
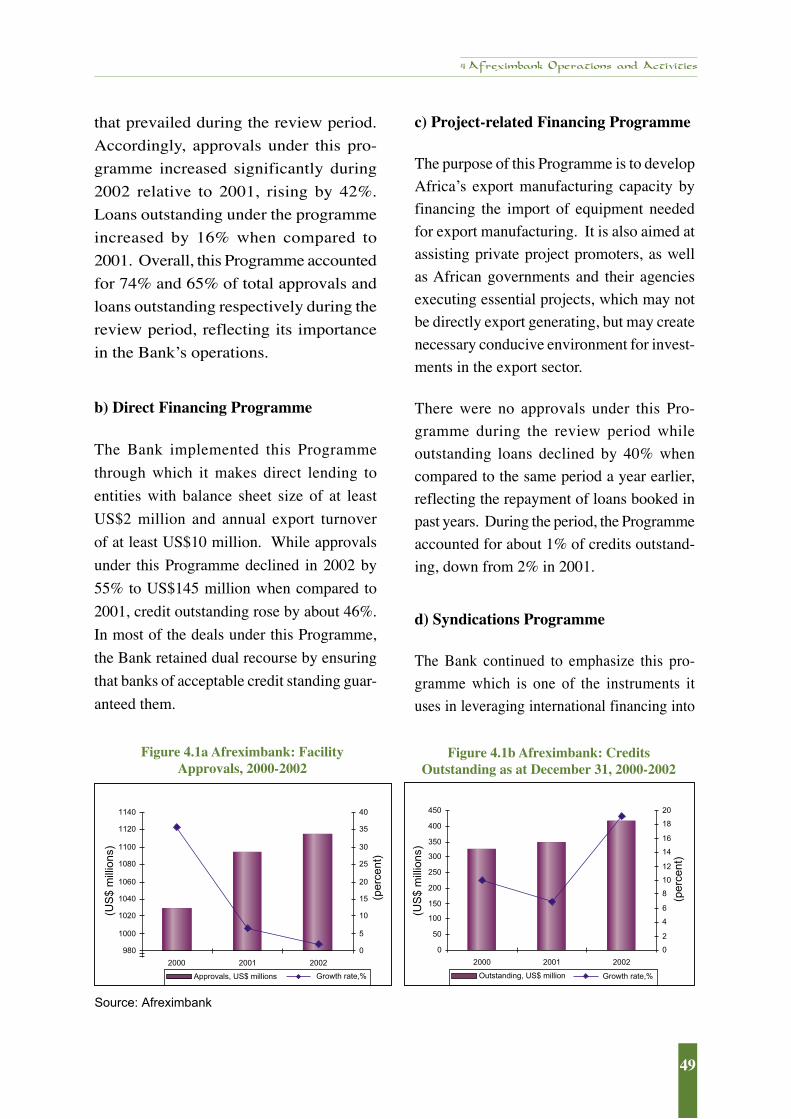
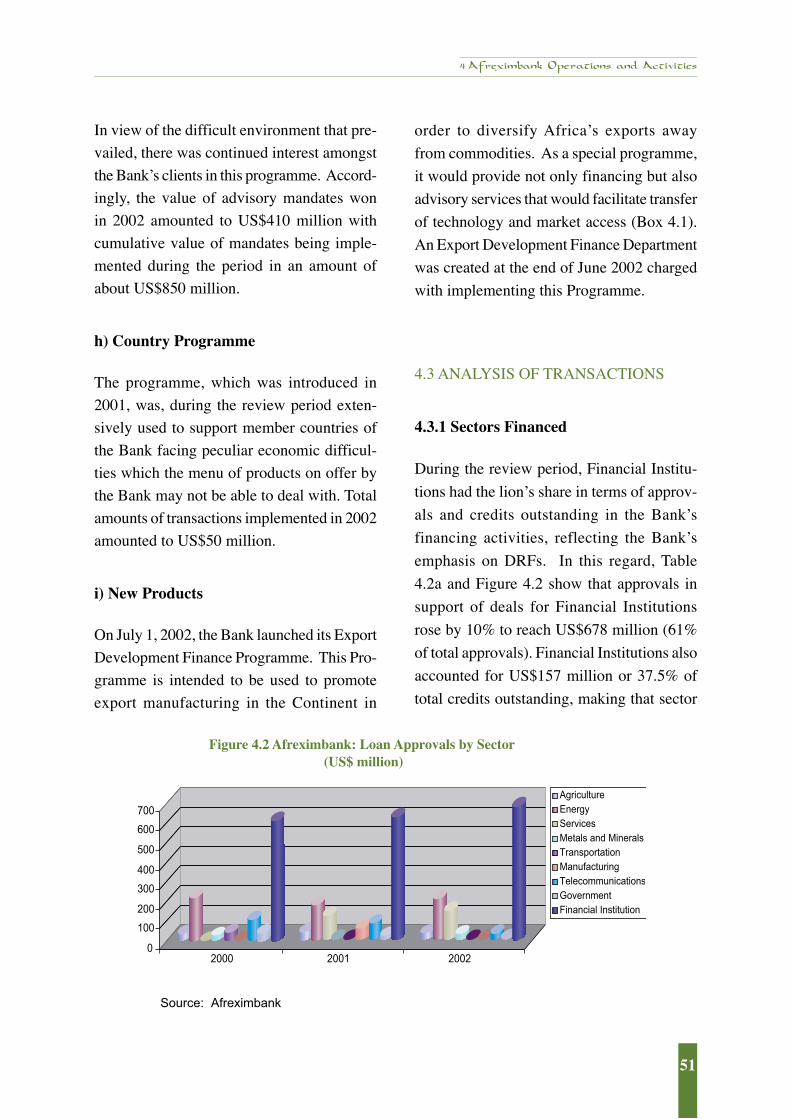
2.1 Global Output and Inflation (annual per cent change) ...................................................72.2 Growth Rates of Merchandise Trade Volume in Major Regions of the World (annual per cent change) ..........................................................................................................................143.1 Average GDP Growth of African Oil and Non-Oil Exporting Countries (per cent) ....183.2 Africa: Output and Inflation by Region (annual per cent change) ...............................203.3 Africaʼs Share of World Trade (annual per cent change) .............................................313.4 Share of Intra-African Trade in Total African Trade (per cent) ...................................353.5 Sub-Regional Share of Total Intra-African Trade (per cent)........................................364.1a Afreximbank: Facility Approvals, 2000-2002 .............................................................494.1b Afreximbank: Credit Outstanding as at December 31, 2000-2002..............................494.2 Afreximbank: Loan Approvals by Sector (US$m).......................................................51
vi
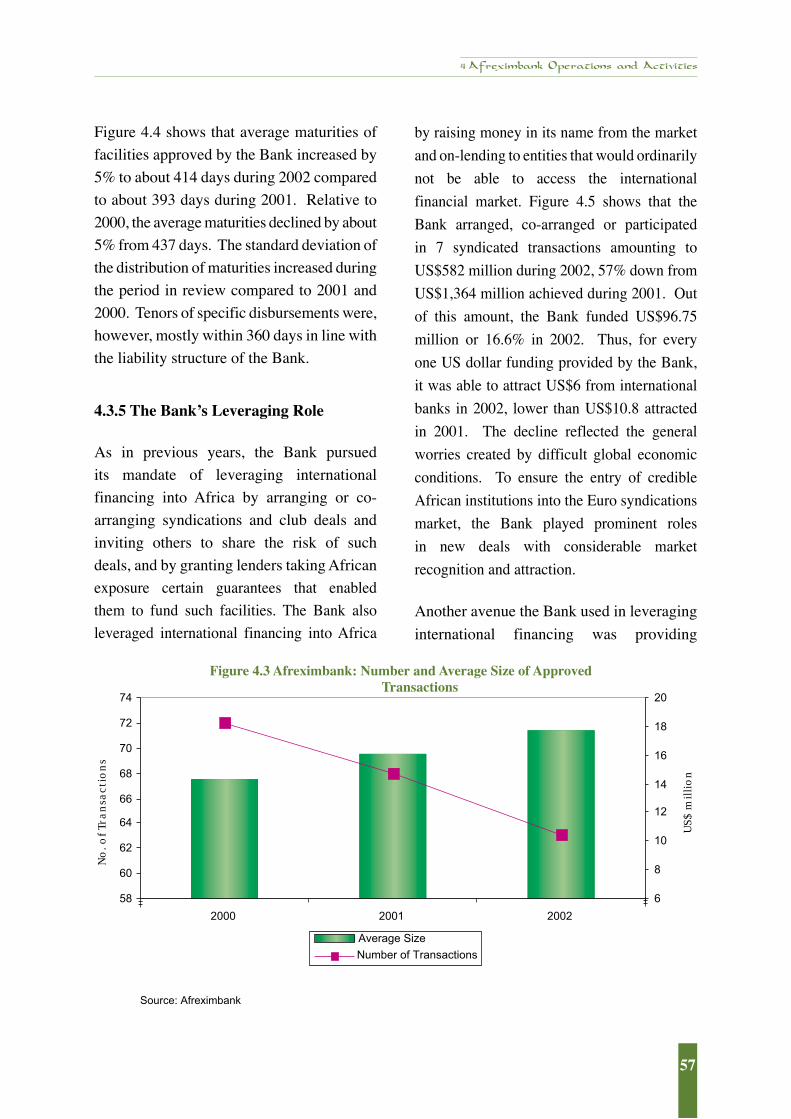
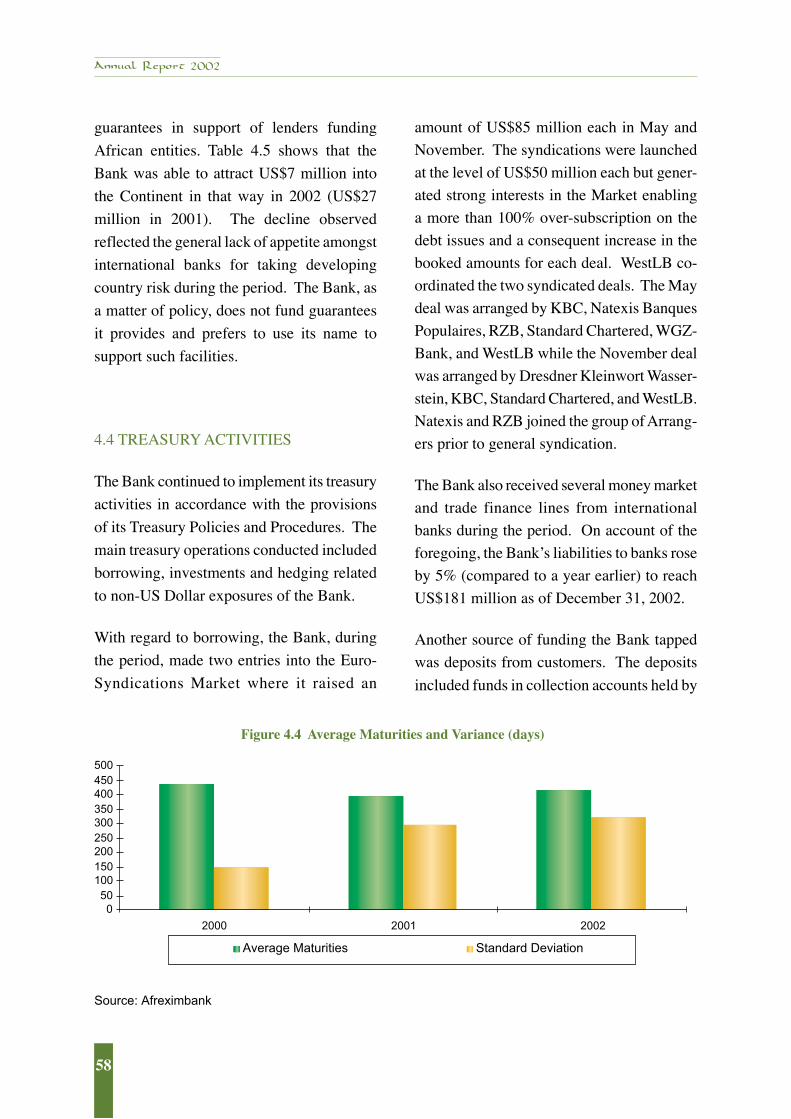
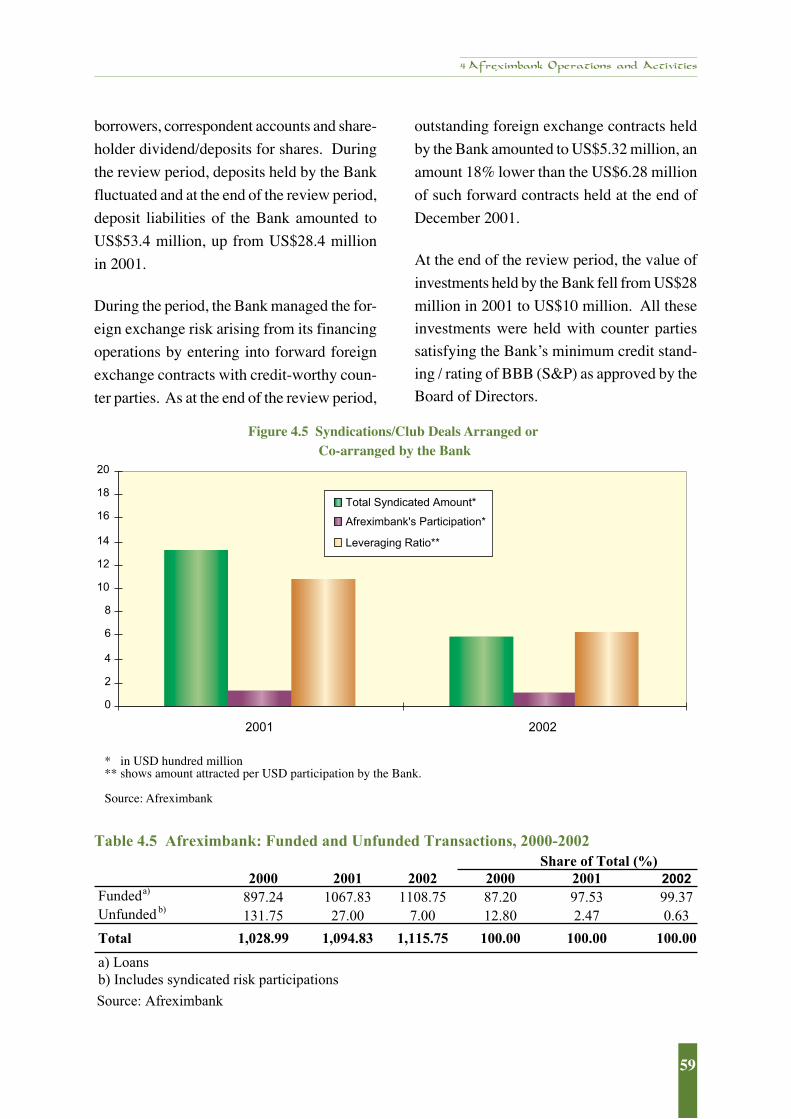
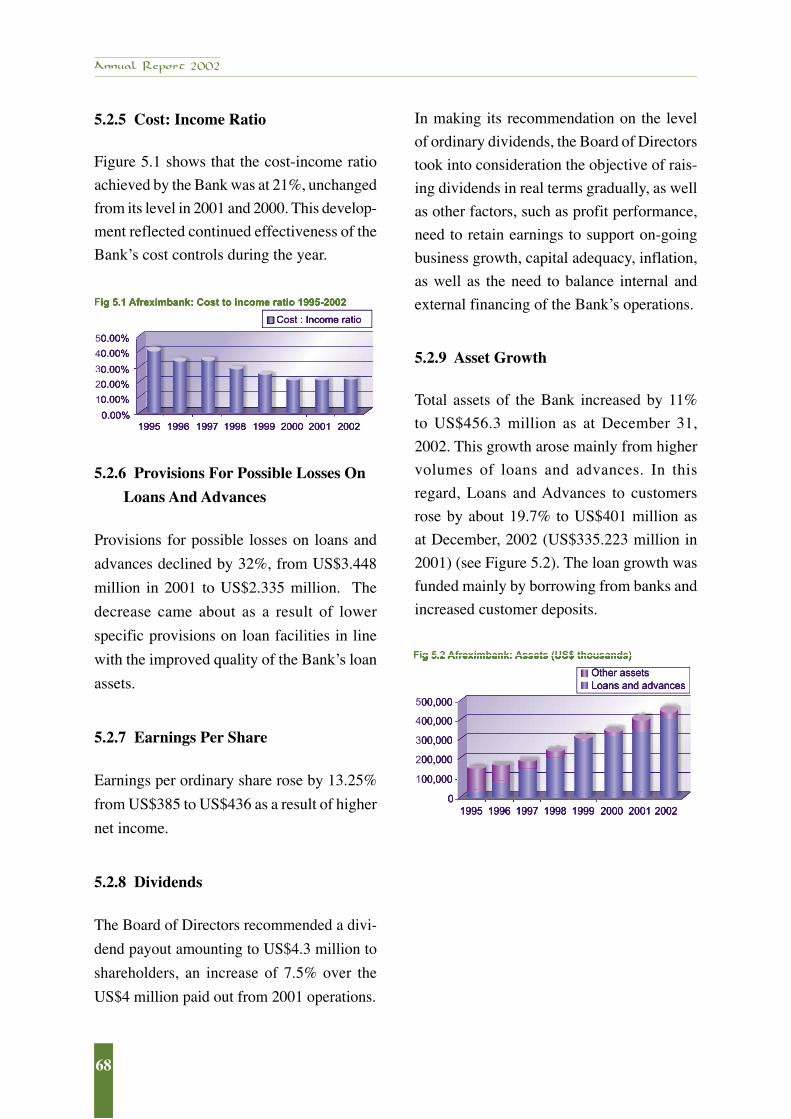
4.3 Afreximbank: Number and Average Size of Approved Transactions ..........................574.4 Average Maturities and Variance (days) ......................................................................584.5 Syndications/Club Deals Arranged or Co-arranged by the Bank (US$m)...................595.1 Afreximbank: Cost to Income Ratio, 1995-2002 .........................................................685.2 Afreximbank: Assets (US$ thousands) ........................................................................68
LIST OF BOXES
Box
2.1 Low International Interest Rates and Africaʼs Economic Prospects ..............................113.1 Recent Developments in the International Banking Scene and Implications for African Trade Finance .......................................................................................................................................... 393.2 Monterrey Consensus on Financing for Development ...................................................414.1 Afreximbankʼs Export Development Finance Programme: Rationale, Objectives, Instruments and Partners ................................................................................................53
LIST OF ANNEXES
Annex
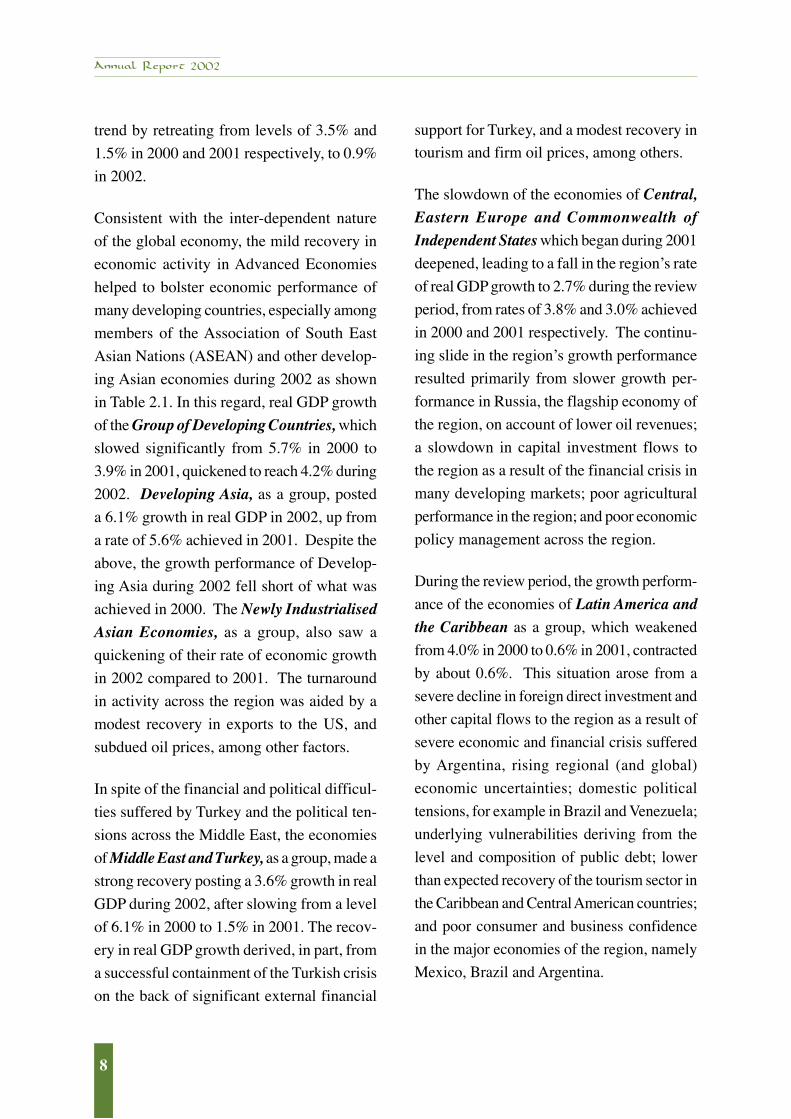
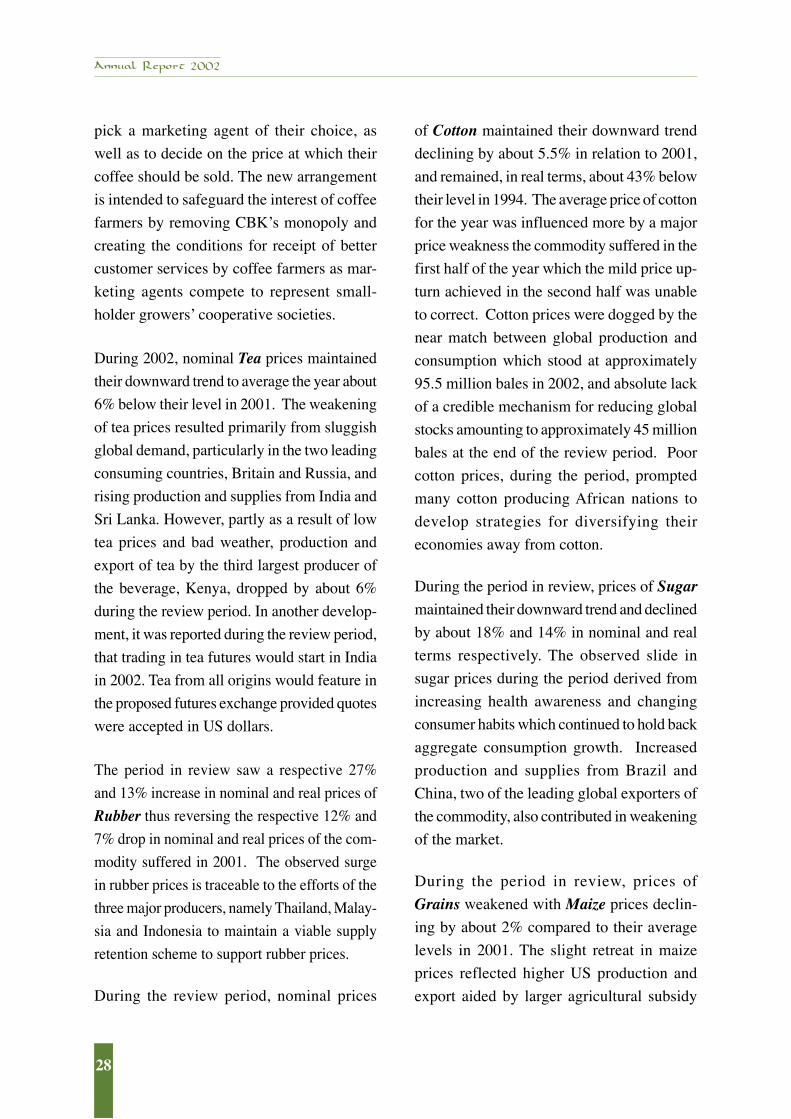
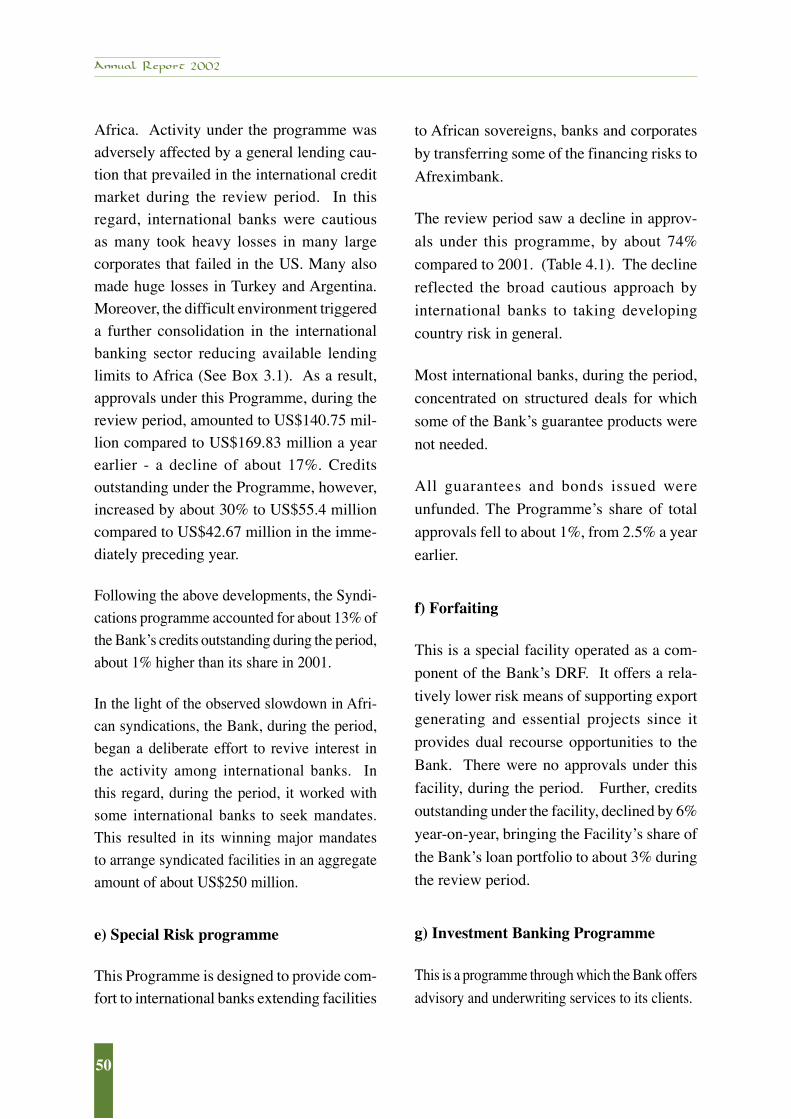
1 Weekly Movement in Prices of Major Agricultural Commodities, $/Mt. .......................86 Weekly Movement in Prices of Major Metals and Minerals, $/Mt. ................................86 Weekly Movement in Prices of Minor Agricultural Commodities, $/Mt. ........................862 Some Major Syndicated Loans/Club Deals Arranged or Operating in Africa, 2001-2002 ............ 87
vii


No. of Transactions
US$ million

70
Annual Report 2002
71
Financial StatementsFor The Year EndedDecember 31, 2002
70
Annual Report 2002
71
REPORT OF THE AUDIT COMMITTEE TO THEBOARD OF DIRECTORS AND GENERAL MEETING
OF THE AFRICAN EXPORT-IMPORT BANK
In compliance with the provisions of Article 30(l) and (3) of the Charter of the African Export- Import Bank and pursuant to the terms of Resolution N°. Afrexim/BD/9/95/02 concerning the establishment, membership, functions and powers of the Audit Committee of the African Export Import Bank (as amended), the Audit Committee considered the audited Financial Statements for the year ended 31 December, 2002, at its meeting held on 22 March, 2003.
In our opinion, the scope and planning of the audit for the year ended 31 December, 2002 were adequate.
After due consideration, the Committee accepted the Report of the Auditors to the effect that the Financial Statements were prepared in accordance with ethical practice and international stand-ards on accounting and gave a true and fair view of the state of affairs of the Bankʼs financial condition as at 31 December, 2002.
The Committee, therefore, recommended that the audited Financial Statements of the Bank for the Financial Year ended 31 December, 2002 and the Auditors ̓Report thereon be approved by the Board and presented for consideration by Shareholders at the Tenth General Meeting.
The Committee accepted the provision made in the Accounts for the remuneration of the Auditors and recommends that the Board accepts same. Furthermore, the Audit Committee recommends to the Shareholders the re-appointment of the Bankʼs External Auditors for the Financial Year 2003.
____________________MOHAMED DAOUASCHAIRMANAUDIT COMMITTEE
Members of the CommitteeM. Daouas (Chairman); S. Usman; O.H. Saeed
72
Annual Report 2002
73
Financial Statements
72
Annual Report 2002
73
14,759
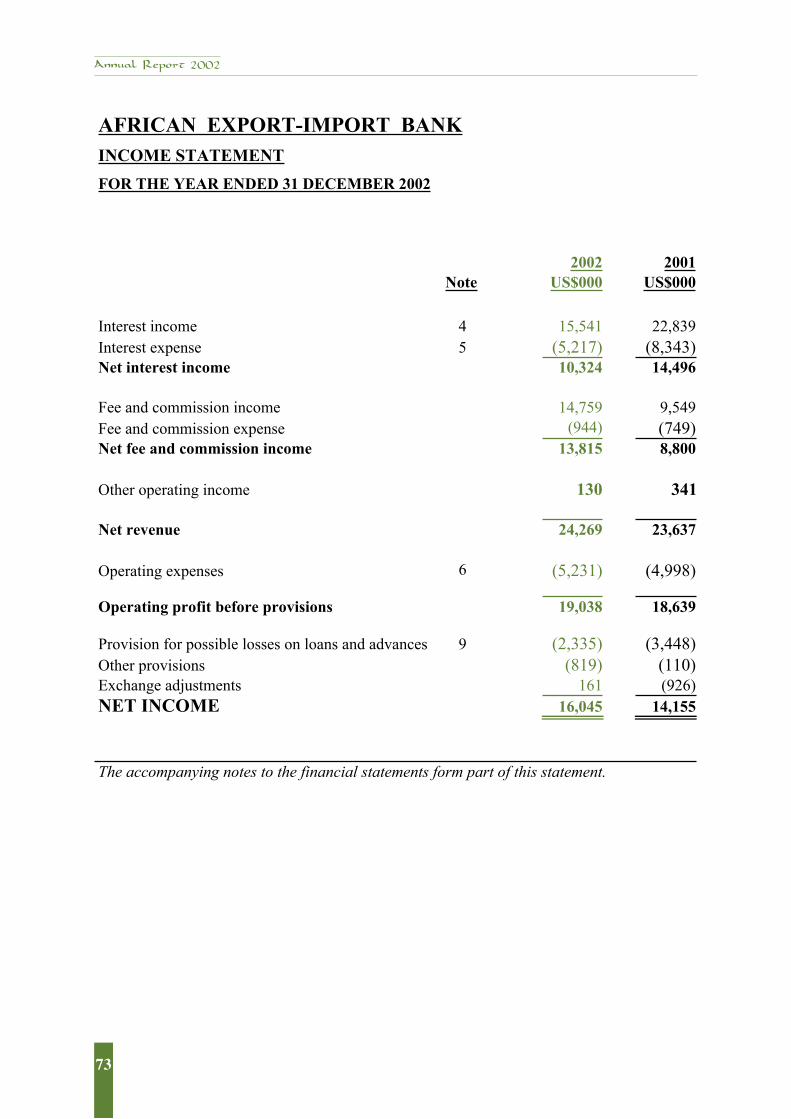
AFRICAN EXPORT-IMPORT BANKINCOME STATEMENT
FOR THE YEAR ENDED 31 DECEMBER 2002
2002 2001Note US$000 US$000
Interest income 4 15,541 22,839Interest expense 5 (5,217) (8,343)Net interest income 10,324 14,496
Fee and commission income 9,549Fee and commission expense (944) (749)Net fee and commission income 13,815 8,800
Other operating income 130 341
Net revenue 24,269 23,637
Operating expenses 6 (5,231) (4,998)
Operating profit before provisions 19,038 18,639
Provision for possible losses on loans and advances 9 (2,335) (3,448)Other provisions (819) (110)Exchange adjustments 161 (926)NET INCOME 16,045 14,155
The accompanying notes to the financial statements form part of this statement.
74
Annual Report 2002
75
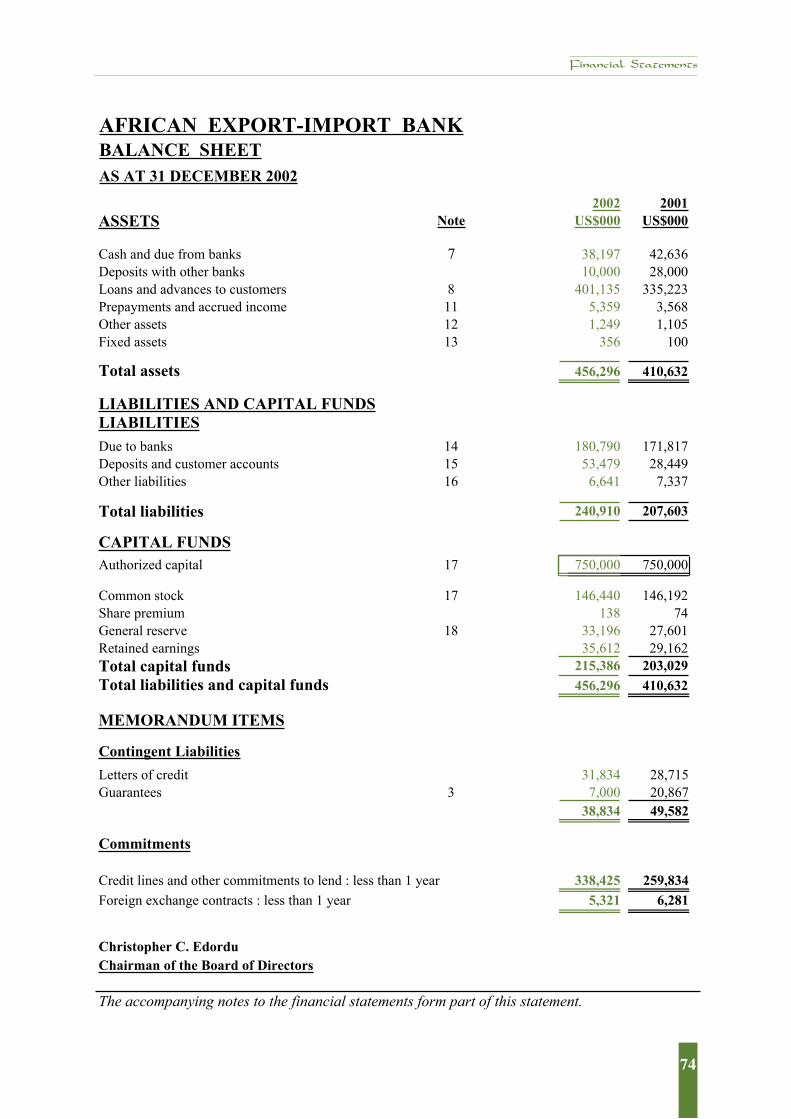
AFRICAN EXPORT-IMPORT BANKBALANCE SHEETAS AT 31 DECEMBER 2002
2002 2001ASSETS Note US$000 US$000
Cash and due from banks 7 38,197 42,636Deposits with other banks 10,000 28,000Loans and advances to customers 8 401,135 335,223Prepayments and accrued income 11 5,359 3,568Other assets 12 1,249 1,105Fixed assets 13 356 100
Total assets 456,296 410,632
LIABILITIES AND CAPITAL FUNDSLIABILITIESDue to banks 14 180,790 171,817Deposits and customer accounts 15 53,479 28,449Other liabilities 16 6,641 7,337
Total liabilities 240,910 207,603
CAPITAL FUNDSAuthorized capital 17 750,000 750,000
Common stock 17 146,440 146,192Share premium 138 74General reserve 18 33,196 27,601Retained earnings 35,612 29,162Total capital funds 215,386 203,029Total liabilities and capital funds 456,296 410,632
MEMORANDUM ITEMS
Contingent Liabilities
Letters of credit 31,834 28,715Guarantees 3 7,000 20,867
38,834 49,582
Commitments
Credit lines and other commitments to lend : less than 1 year 338,425 259,834Foreign exchange contracts : less than 1 year 5,321 6,281
Christopher C. EdorduChairman of the Board of Directors
The accompanying notes to the financial statements form part of this statement.
Financial Statements
74
Annual Report 2002
75
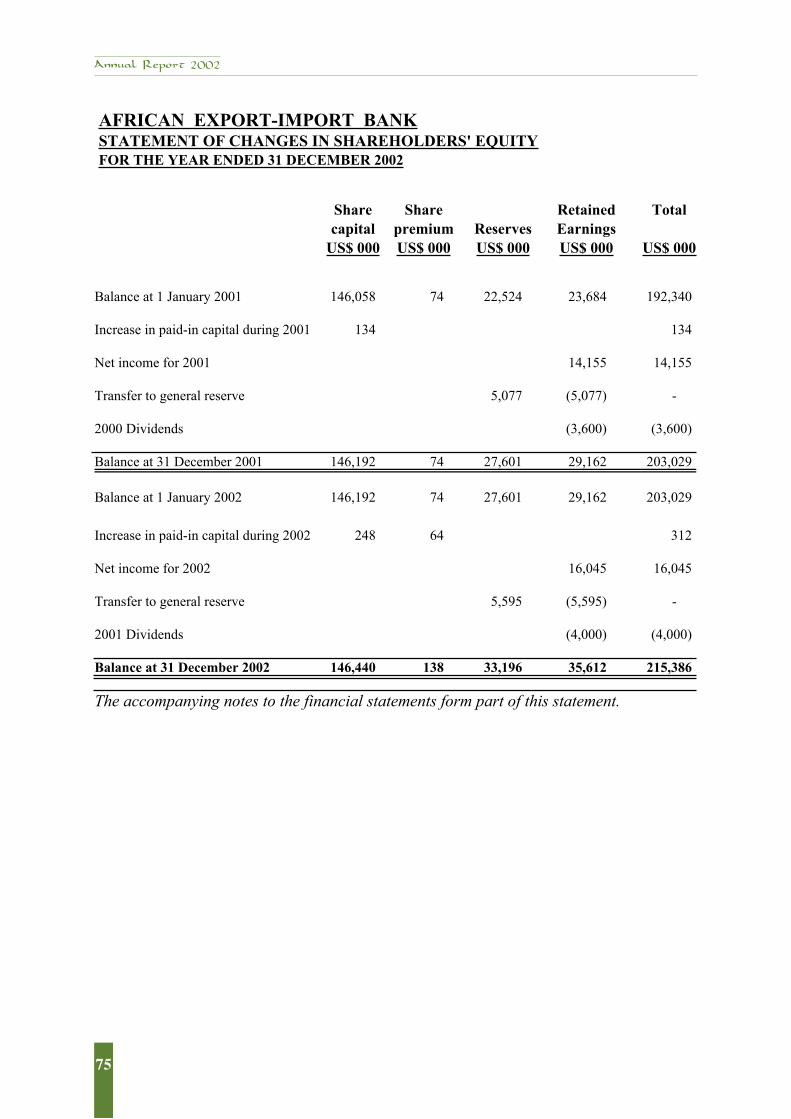
AFRICAN EXPORT-IMPORT BANKSTATEMENT OF CHANGES IN SHAREHOLDERS' EQUITYFOR THE YEAR ENDED 31 DECEMBER 2002
Share Share Retained Totalcapital premium Reserves Earnings
US$ 000 US$ 000 US$ 000 US$ 000 US$ 000
Balance at 1 January 2001 146,058 74 22,524 23,684 192,340
Increase in paid-in capital during 2001 134 134
Net income for 2001 14,155 14,155
Transfer to general reserve 5,077 (5,077) -
2000 Dividends (3,600) (3,600)
Balance at 31 December 2001 146,192 74 27,601 29,162 203,029
Balance at 1 January 2002 146,192 74 27,601 29,162 203,029
Increase in paid-in capital during 2002 248 64 312
Net income for 2002 16,045 16,045
Transfer to general reserve 5,595 (5,595) -
2001 Dividends (4,000) (4,000)
Balance at 31 December 2002 146,440 138 33,196 35,612 215,386
The accompanying notes to the financial statements form part of this statement.
76
Annual Report 2002
77
Financial Statements
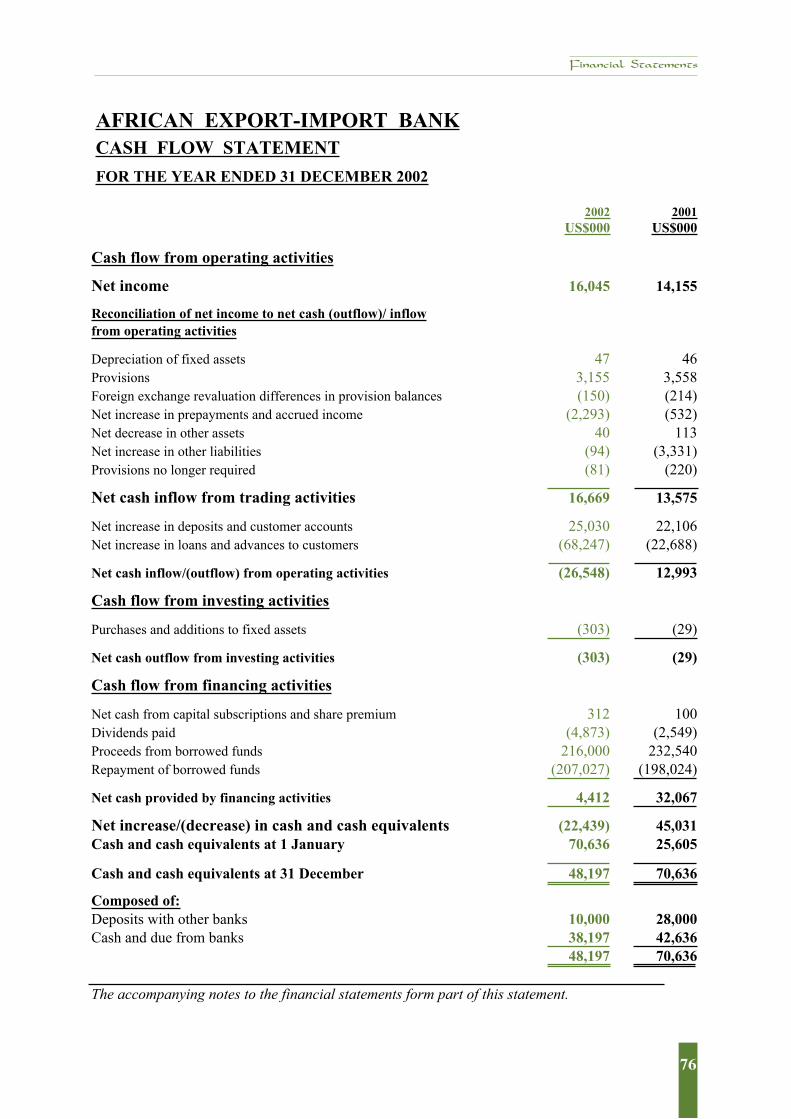
AFRICAN EXPORT-IMPORT BANKCASH FLOW STATEMENT
FOR THE YEAR ENDED 31 DECEMBER 2002
2002 2001US$000 US$000
Cash flow from operating activities
Net income 16,045 14,155
Reconciliation of net income to net cash (outflow)/ inflowfrom operating activities
Depreciation of fixed assets 47 46Provisions 3,155 3,558Foreign exchange revaluation differences in provision balances (150) (214)Net increase in prepayments and accrued income (2,293) (532)Net decrease in other assets 40 113Net increase in other liabilities (94) (3,331)Provisions no longer required (81) (220)
Net cash inflow from trading activities 16,669 13,575
Net increase in deposits and customer accounts 25,030 22,106Net increase in loans and advances to customers (68,247) (22,688)
Net cash inflow/(outflow) from operating activities (26,548) 12,993
Cash flow from investing activities
Purchases and additions to fixed assets (303) (29)
Net cash outflow from investing activities (303) (29)
Cash flow from financing activities
Net cash from capital subscriptions and share premium 312 100Dividends paid (4,873) (2,549)Proceeds from borrowed funds 216,000 232,540Repayment of borrowed funds (207,027) (198,024)
Net cash provided by financing activities 4,412 32,067
Net increase/(decrease) in cash and cash equivalents (22,439) 45,031Cash and cash equivalents at 1 January 70,636 25,605
Cash and cash equivalents at 31 December 48,197 70,636
Composed of:Deposits with other banks 10,000 28,000Cash and due from banks 38,197 42,636
48,197 70,636
The accompanying notes to the financial statements form part of this statement.
76
Annual Report 2002
77
AFRICAN EXPORT-IMPORT BANKNOTES TO THE FINANCIAL STATEMENTS
AS AT 31 DECEMBER 2002
1. STATUS AND ACTIVITIES
The African Export-Import Bank (“the Bank”), headquartered in Cairo, Egypt, is a supranational institution, established on 27 October 1993. The Bank started lending operations on 30 September 1994. The principal activity of the Bank is to finance and facilitate trade among African countries and between Africa and the rest of the world.
2 SUMMARY OF SIGNIFICANT ACCOUNTING POLICIES
The accounting policies applied by the Bank have been approved by the Board of Directors of the Bank and are consistent with internationally accepted accounting principles promulgated by the International Accounting Standards Board. The major accounting policies adopted and applied by the Bank are summarized below.
2.1 Accounting Conventions The financial statements are prepared under the historical cost convention and are expressed
in US dollars in accordance with the Bankʼs Charter.
2.2 Income Recognition Interest receivable is recognized in the income statement on a time proportion basis, taking
account of the principal outstanding and the rate applicable, except in the case of non-accrual loans and advances (see note 2.5). Fee and commission income is accounted for in the period when receivable.
2.3 Foreign Currencies Transactions in foreign currencies are translated into US dollars at the prevailing exchange
rate at the date of the transaction.
At the balance sheet date, balances of monetary assets and liabilities denominated in foreign currencies are translated at the exchange rates ruling at that date or at the forward
78
Annual Report 2002
79
exchange rate, as appropriate. Any gains or losses resulting from the translation are taken to the income statement.
2.4 Cash and Cash Equivalents
For the purpose of the cash flow statement, cash and cash equivalents comprise cash in hand, and deposits held at call with banks.
2.5 Loans and Advances to Customers
Loans and advances to customers are reported at their principal amounts outstanding, less provisions for possible losses and suspended interest. Interest on loans is credited to income based on loan principal amounts outstanding at contracted interest rates.
Loans and advances are identified as impaired and placed on non-accrual (cash) basis where there is reasonable doubt regarding the collectability of principal or interest. Whenever a payment is 90 days past due, loans and advances are automatically placed on non-accrual (cash) basis, unless they are well secured and in the process of collection. All loans and advances are classified on a non-accrual (cash) basis when a payment is 180 days in arrears. Upon classification of a loan to a non-accrual (cash) basis, any previously accrued but unpaid interest thereon is reversed against income of the current period, and put in interest in suspense account. Interest on non-accrual loans is only recorded as earned when it is collected. Non-accrual loans are restored to an accrual basis when principal and interest payments are current and there is no longer any reasonable doubt regarding collectability.
Until all or part of the loans and advances is written off, interest continues to accrue on customers ̓accounts, but is not included in income. Such suspended interest is credited to an interest in suspense account, which is deducted from loans and advances on the balance sheet.
2.6 Provision for Possible Losses on Loans and Advances
Provision for possible losses on loans and advances are based on the managementʼs regular reviews of the entire loans and advances portfolio. Specific provisions are made where the repayment of identified loans and advances is in doubt. The specific amount provided reflects managementʼs judgement of the estimate of the amount of possible loss based on the probability of recovering the net amounts outstanding. The process of determining specific amounts provided is necessarily subjective and involves significant estimates that may be susceptible to changes. A general provision is made to take into account the
Financial Statements
78
Annual Report 2002
79
inherent risk of loss which, although not separately identified, is known from experience to be present in any loan portfolio. This general provision is made on loans and advances outstanding at the balance sheet date for which specific provision has not been made.
2.7 Fixed Assets
Fixed assets are carried in the balance sheet at cost less accumulated depreciation. Depreciation is charged on a straight-line basis over the estimated useful lives of the related assets. The estimated useful lives are 5 years for motor vehicles and 4 years for furniture and equipment.
2.8 Staff Provident Fund Scheme
The Bank operates a defined contribution and benefit plan approved by the Board of Directors. Contributions are recognized in the income statement on an accrual basis.
2.9 Government Grants
Government grants are not recognized unless there is reasonable assurance that the grants will be received and that the Bank will comply with the conditions attaching to the grant. Grants relating to fixed assets are recorded together with the related fixed asset at fair values.
2.10 Use of Financial Instruments
The Bankʼs financial instruments consist primarily of cash and deposits with banks, loans and advances to customers and customer deposits. The Bank uses forward foreign exchange contracts to hedge against exchange rate fluctuations. The gain or loss arising from the settlement of the foreign exchange contracts is recognized as income or expense at the same time when the hedged transaction is realized. The Bank does not speculate in or engage in the trading of derivative financial instruments.
2.11 Interest Rate Risk
Interest rate movements affect the Bank s̓ profitability. Exposure to interest rate movements exists because the Bank has assets and liabilities on which interest rates either change from time to time (rate sensitive assets and liabilities) or do not change (rate insensitive assets and liabilities) and exposure to interest rate movements arises when there is a mismatch
80
Annual Report 2002
81
between the rate sensitive assets and liabilities.
The Bank closely monitors interest rate movements and seeks to limit its exposure by managing the interest rate and maturity structure of assets and liabilities carried on the balance sheet.
2.12 Credit Risk
Credit risk is the risk that a customer or counterparty of the Bank will be unable or unwilling to meet a commitment that it has entered into with the Bank. It arises from lending, trade finance, treasury and other activities undertaken by the Bank.
The carrying amounts of cash and deposits with banks, and loans and advances to customers appearing on the balance sheet represent the maximum amount exposed to credit risk.
2.13 Concentration of Credit Risk
The Bankʻs financial instruments do not represent a concentration of credit risk because the Bank deals with a variety of major banks, and its loans and advances are structured and spread among a number of major industries, customers and geographic areas. In addition, the Bank has procedures and policies in place to limit the amount of credit exposure to any counterparty.
2.14 Fair Value of Financial Instruments
The estimated fair value is the amount at which an instrument could be exchanged in a current transaction between willing parties other than enforced or liquidation sale. The fair value of on balance sheet financial instruments approximate to their carrying amounts. The fair values of off balance sheet financial instruments are the same figures appearing as memorandum items on the balance sheet.
3. UNFUNDED RISK GUARANTEE PROGRAMS
The Bank engaged in unfunded risk guarantee programs, the outstanding amount of which as at 31 December 2002 was US$ 7,000,000 (2001: US$ 20,867,000). The credit risk associated with these transactions is considered minimal because the Bank receives a counter-guarantee from sound parties. To limit credit risk we deal exclusively with creditworthy counterparties.
Financial Statements
80
Annual Report 2002
81
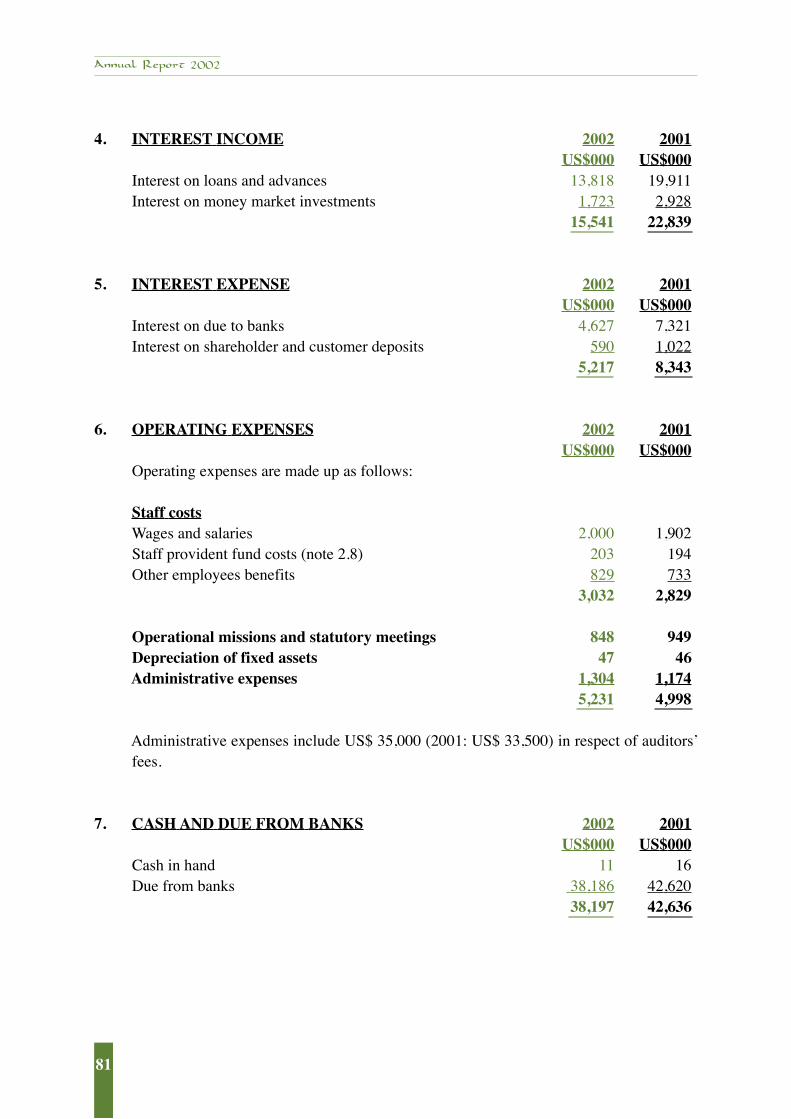
4. INTEREST INCOME 2002 2001 US$000 US$000 Interest on loans and advances 13,818 19,911 Interest on money market investments 1,723 2,928 15,541 22,839
5. INTEREST EXPENSE 2002 2001 US$000 US$000 Interest on due to banks 4,627 7,321 Interest on shareholder and customer deposits 590 1,022 5,217 8,343
6. OPERATING EXPENSES 2002 2001 US$000 US$000 Operating expenses are made up as follows: Staff costs Wages and salaries 2,000 1,902 Staff provident fund costs (note 2.8) 203 194 Other employees benefits 829 733 3,032 2,829 Operational missions and statutory meetings 848 949 Depreciation of fixed assets 47 46 Administrative expenses 1,304 1,174 5,231 4,998
Administrative expenses include US$ 35,000 (2001: US$ 33,500) in respect of auditors ̓fees.
7. CASH AND DUE FROM BANKS 2002 2001 US$000 US$000 Cash in hand 11 16 Due from banks 38,186 42,620 38,197 42,636
82
Annual Report 2002
83
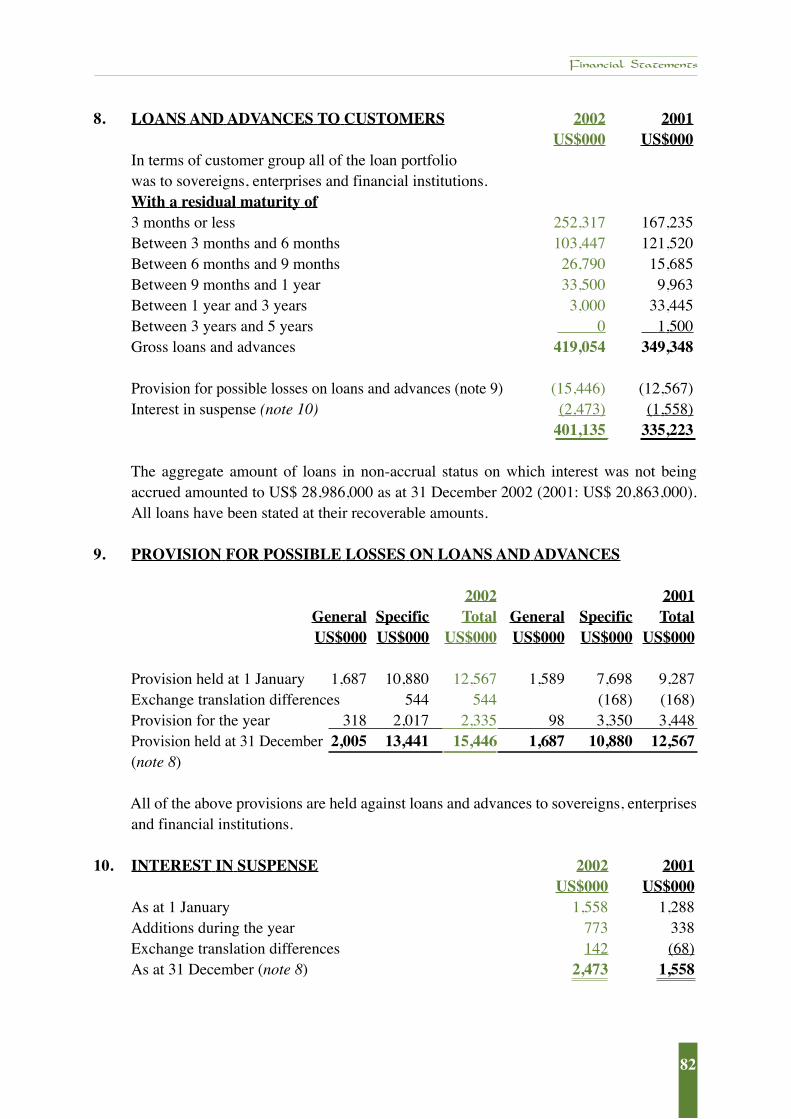
8. LOANS AND ADVANCES TO CUSTOMERS 2002 2001 US$000 US$000 In terms of customer group all of the loan portfolio was to sovereigns, enterprises and financial institutions. With a residual maturity of 3 months or less 252,317 167,235 Between 3 months and 6 months 103,447 121,520 Between 6 months and 9 months 26,790 15,685 Between 9 months and 1 year 33,500 9,963 Between 1 year and 3 years 3,000 33,445 Between 3 years and 5 years 0 1,500 Gross loans and advances 419,054 349,348
Provision for possible losses on loans and advances (note 9) (15,446) (12,567) Interest in suspense (note 10) (2,473) (1,558) 401,135 335,223
The aggregate amount of loans in non-accrual status on which interest was not being accrued amounted to US$ 28,986,000 as at 31 December 2002 (2001: US$ 20,863,000). All loans have been stated at their recoverable amounts.
9. PROVISION FOR POSSIBLE LOSSES ON LOANS AND ADVANCES
2002 2001 General Specific Total General Specific Total
US$000 US$000 US$000 US$000 US$000 US$000
Provision held at 1 January 1,687 10,880 12,567 1,589 7,698 9,287Exchange translation differences 544 544 (168) (168)Provision for the year 318 2,017 2,335 98 3,350 3,448Provision held at 31 December 2,005 13,441 15,446 1,687 10,880 12,567(note 8)
All of the above provisions are held against loans and advances to sovereigns, enterprises and financial institutions.
10. INTEREST IN SUSPENSE 2002 2001 US$000 US$000
As at 1 January 1,558 1,288Additions during the year 773 338Exchange translation differences 142 (68)As at 31 December (note 8) 2,473 1,558
Financial Statements
82
Annual Report 2002
83
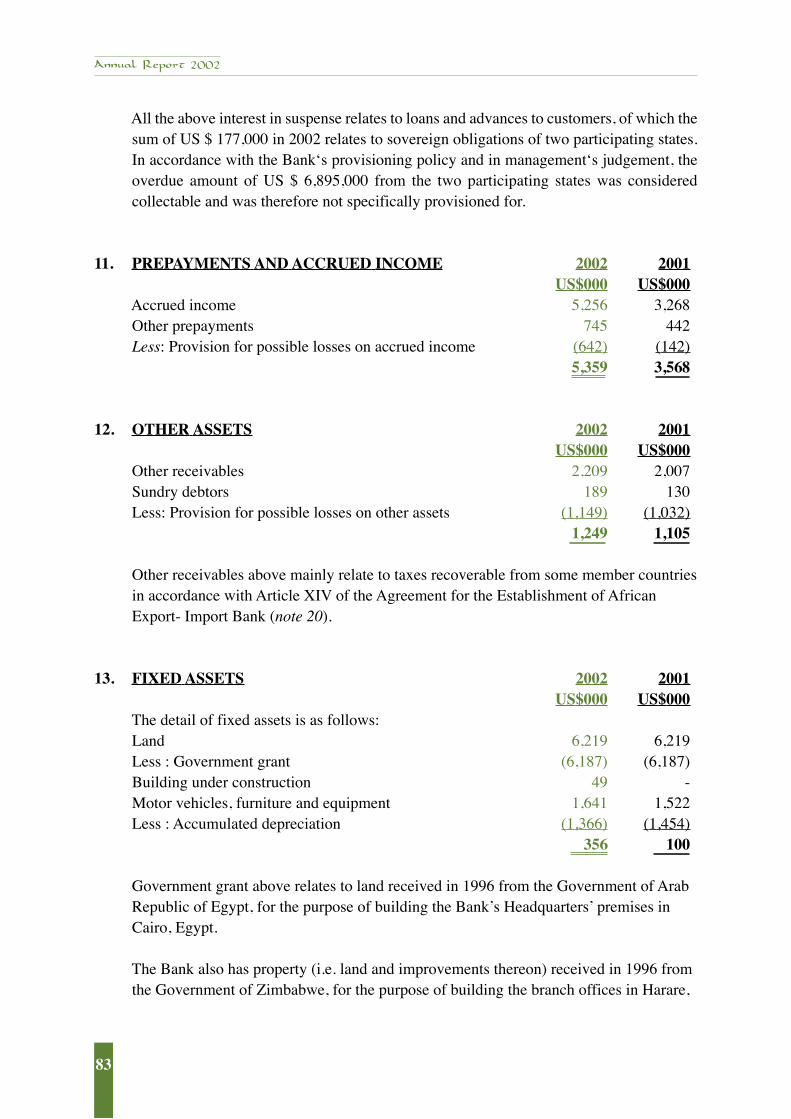
All the above interest in suspense relates to loans and advances to customers, of which the sum of US $ 177,000 in 2002 relates to sovereign obligations of two participating states. In accordance with the Bankʻs provisioning policy and in managementʻs judgement, the overdue amount of US $ 6,895,000 from the two participating states was considered collectable and was therefore not specifically provisioned for.
11. PREPAYMENTS AND ACCRUED INCOME 2002 2001 US$000 US$000 Accrued income 5,256 3,268 Other prepayments 745 442 Less: Provision for possible losses on accrued income (642) (142) 5,359 3,568
12. OTHER ASSETS 2002 2001 US$000 US$000 Other receivables 2,209 2,007 Sundry debtors 189 130 Less: Provision for possible losses on other assets (1,149) (1,032) 1,249 1,105
Other receivables above mainly relate to taxes recoverable from some member countries in accordance with Article XIV of the Agreement for the Establishment of African Export- Import Bank (note 20).
13. FIXED ASSETS 2002 2001 US$000 US$000 The detail of fixed assets is as follows: Land 6,219 6,219 Less : Government grant (6,187) (6,187) Building under construction 49 - Motor vehicles, furniture and equipment 1,641 1,522 Less : Accumulated depreciation (1,366) (1,454) 356 100
Government grant above relates to land received in 1996 from the Government of Arab Republic of Egypt, for the purpose of building the Bankʼs Headquarters ̓premises in Cairo, Egypt.
The Bank also has property (i.e. land and improvements thereon) received in 1996 from the Government of Zimbabwe, for the purpose of building the branch offices in Harare,
84
Annual Report 2002
85
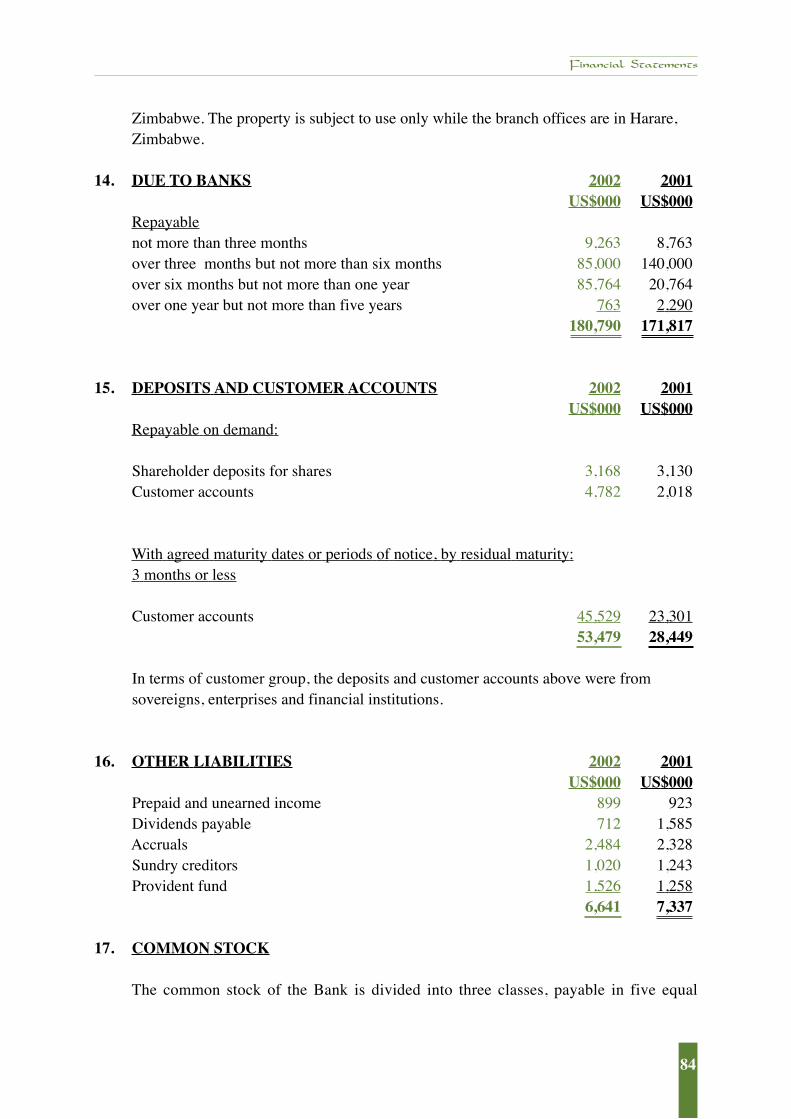
Zimbabwe. The property is subject to use only while the branch offices are in Harare, Zimbabwe.
14. DUE TO BANKS 2002 2001 US$000 US$000 Repayable not more than three months 9,263 8,763 over three months but not more than six months 85,000 140,000 over six months but not more than one year 85,764 20,764 over one year but not more than five years 763 2,290 180,790 171,817
15. DEPOSITS AND CUSTOMER ACCOUNTS 2002 2001 US$000 US$000 Repayable on demand: Shareholder deposits for shares 3,168 3,130 Customer accounts 4,782 2,018 With agreed maturity dates or periods of notice, by residual maturity: 3 months or less Customer accounts 45,529 23,301 53,479 28,449
In terms of customer group, the deposits and customer accounts above were from sovereigns, enterprises and financial institutions.
16. OTHER LIABILITIES 2002 2001 US$000 US$000 Prepaid and unearned income 899 923 Dividends payable 712 1,585 Accruals 2,484 2,328 Sundry creditors 1,020 1,243 Provident fund 1,526 1,258 6,641 7,337
17. COMMON STOCK
The common stock of the Bank is divided into three classes, payable in five equal
Financial Statements
84
Annual Report 2002
85
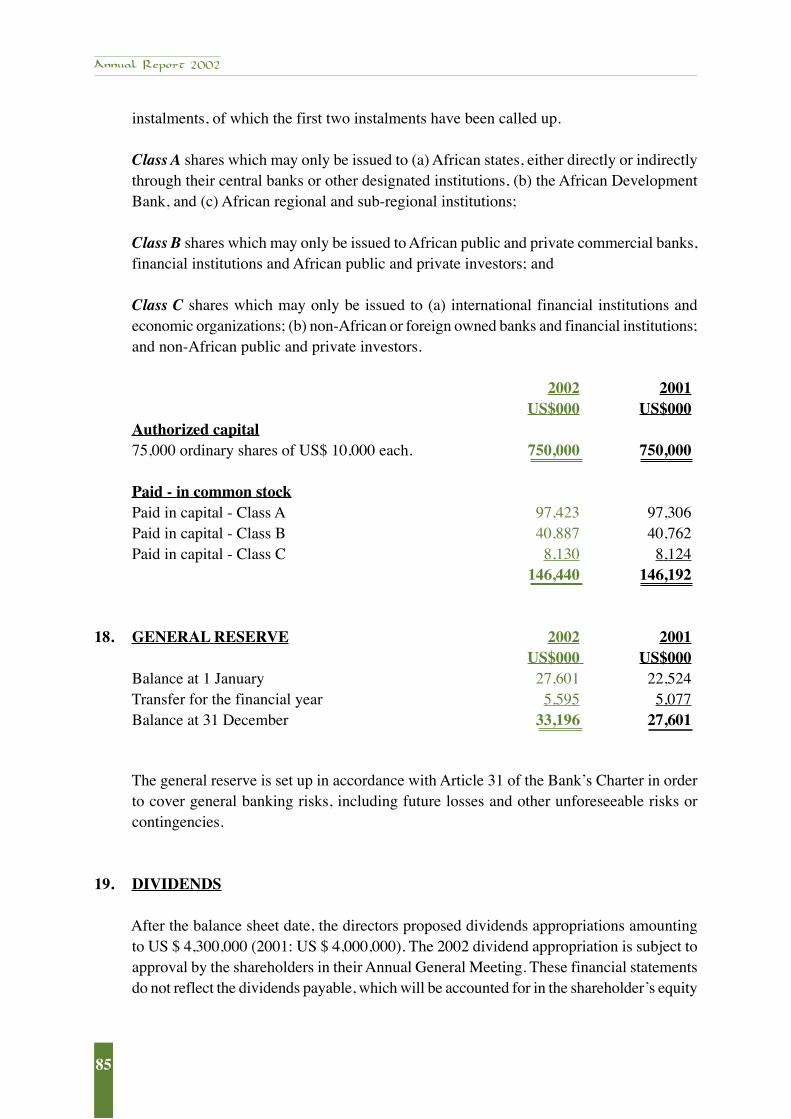
instalments, of which the first two instalments have been called up.
Class A shares which may only be issued to (a) African states, either directly or indirectly through their central banks or other designated institutions, (b) the African Development Bank, and (c) African regional and sub-regional institutions;
Class B shares which may only be issued to African public and private commercial banks, financial institutions and African public and private investors; and
Class C shares which may only be issued to (a) international financial institutions and economic organizations; (b) non-African or foreign owned banks and financial institutions; and non-African public and private investors.
2002 2001 US$000 US$000 Authorized capital 75,000 ordinary shares of US$ 10,000 each. 750,000 750,000 Paid - in common stock Paid in capital - Class A 97,423 97,306 Paid in capital - Class B 40,887 40,762 Paid in capital - Class C 8,130 8,124 146,440 146,192
18. GENERAL RESERVE 2002 2001 US$000 US$000 Balance at 1 January 27,601 22,524 Transfer for the financial year 5,595 5,077 Balance at 31 December 33,196 27,601
The general reserve is set up in accordance with Article 31 of the Bankʼs Charter in order to cover general banking risks, including future losses and other unforeseeable risks or contingencies.
19. DIVIDENDS
After the balance sheet date, the directors proposed dividends appropriations amounting to US $ 4,300,000 (2001: US $ 4,000,000). The 2002 dividend appropriation is subject to approval by the shareholders in their Annual General Meeting. These financial statements do not reflect the dividends payable, which will be accounted for in the shareholder s̓ equity
86
Annual Report 2002
87
as an appropriation of retained earnings in the year ending 2003.
20. TAXATION
According to Article XIV of the Agreement for the Establishment of African Export-Import Bank, which is signed and ratified by African member countries, the Bank s̓ property, assets, income, operations and transactions are exempt from all taxation and custom duties.
21. COMPARATIVE FIGURES
Certain comparative figures have been reclassified to conform with the current year presentation.
22. APPROVAL OF FINANCIAL STATEMENTS
The financial statements were approved by the Board of Directors on 22 March, 2003.
Financial Statements
86
Annual Report 2002
87
AN
NEX
1
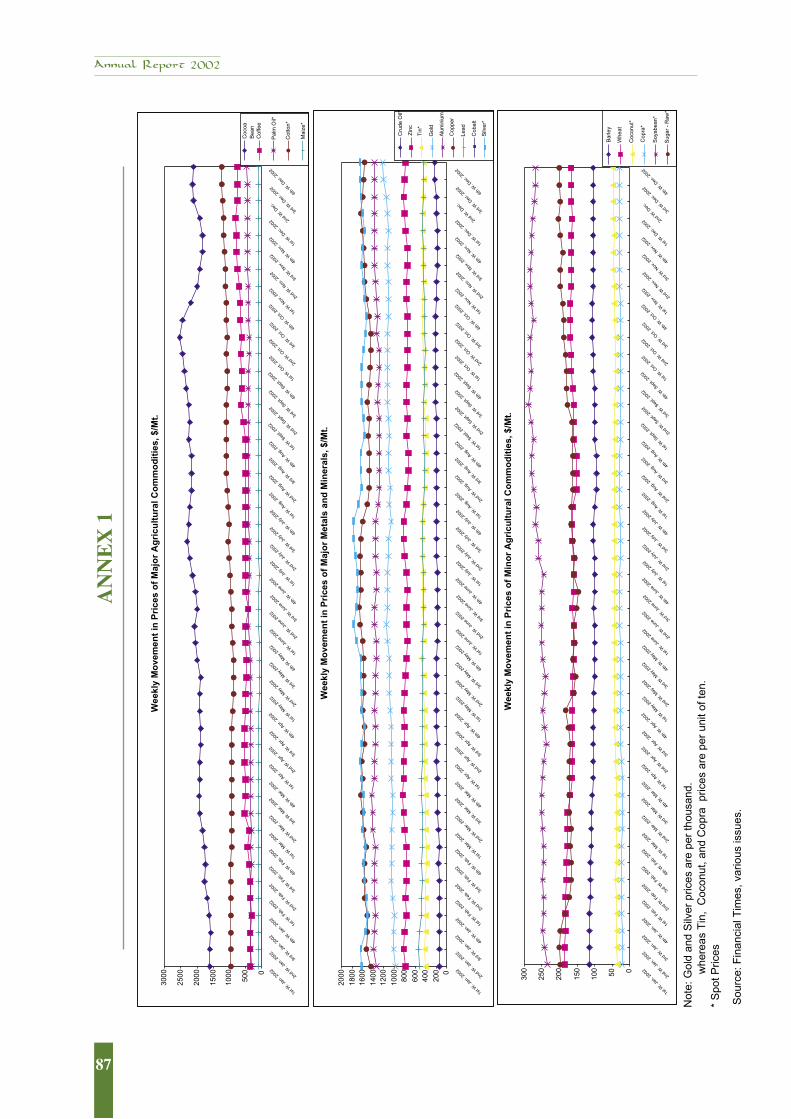
Not
e: G
old
and
Silv
er p
rices
are
per
thou
sand
.
whe
reas
Tin
, C
ocon
ut, a
nd C
opra
pric
es a
re p
er u
nit o
f ten
.*
Spo
t Pric
es
Sou
rce:
Fin
anci
al T
imes
, var
ious
issu
es.
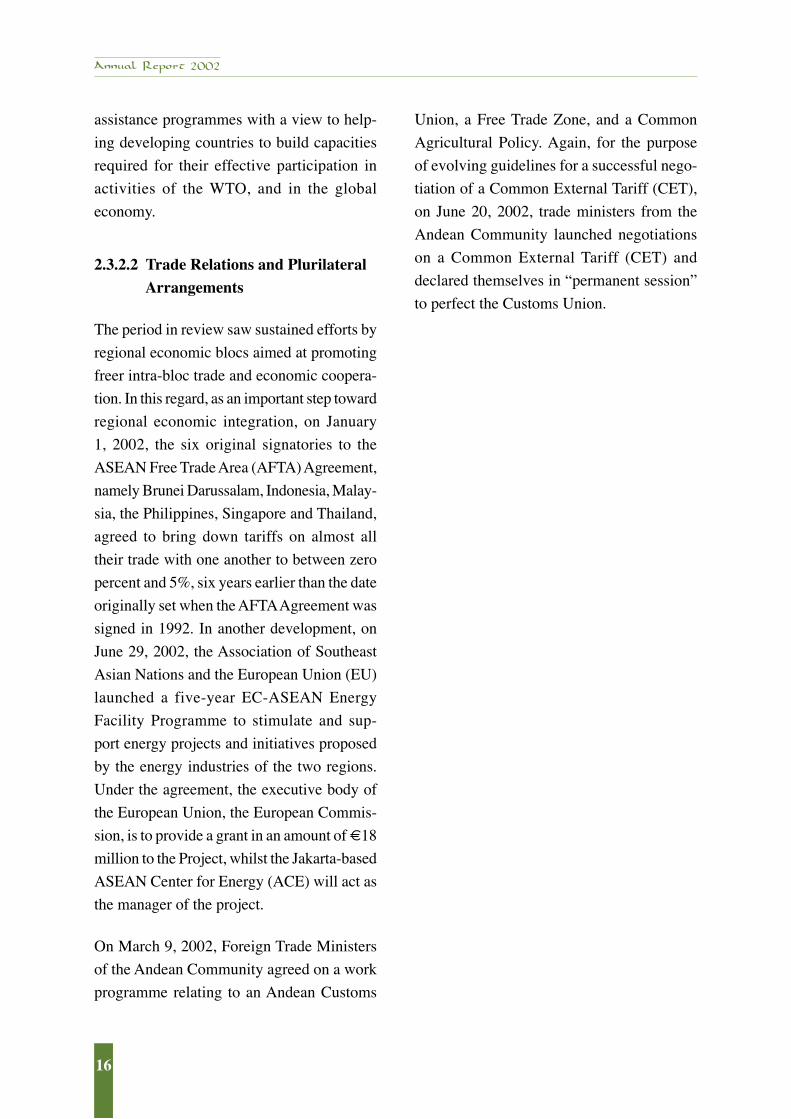
Wee
kly
Mo
vem
ent
in P
rice
s o
f M
ajo
r A
gri
cult
ura
l Co
mm
od
itie
s, $
/Mt.
0
500
1000
1500
2000
2500
3000
1st W
. Jan
. 200
22n
d W
. Jan
. 200
23r
d W
. Jan
. 200
24t
h W
. Jan
. 200
21s
t W. F
eb. 2
002
2nd
W. F
eb. 2
002
3rd
W. F
eb. 2
002
4th
W. F
eb. 2
002
1st W
. Mar
. 200
22n
d W
. Mar
. 200
23r
d W
. Mar
. 200
2
4th
W. M
ar. 2
002
1st W
. Apr
. 200
22n
d W
. Apr
. 200
2
3rd
W. A
pr. 2
002
4th
W. A
pr. 2
002
1st W
. May
200
2
2nd
W. M
ay 2
002
3rd
W. M
ay 2
002
4th
W. M
ay 2
002
1st W
. Jun
e 20
02
2nd
W. J
une
2002
3rd
W. J
une
2002
4th
W. J
une
2002
1st W
. July
200
2
2nd
W. J
uly 2
002
3rd
W. J
uly 2
002
4th
W. J
uly 2
002
1st W
. Aug
. 200
2
2nd
W. A
ug. 2
002
3rd
W. A
ug. 2
002
4th
W. A
ug. 2
002
1st W
. Sep
t. 20
02
2nd
W. S
ept.
2002
3rd
W. S
ept.
2002
4th
W. S
ept.
2002
1st W
. Oct.
200
2
2nd
W. O
ct. 2
002
3rd
W. O
ct. 2
002
4th
W. O
ct. 2
002
1st W
. Nov
. 200
2
2nd
W. N
ov. 2
002
3rd
W. N
ov. 2
002
4th
W. N
ov. 2
002
1st W
. Dec
. 200
2 2nd
W. D
ec.
3rd
W. D
ec. 2
002
4th
W. D
ec. 2
002
Coc
oaB
ean
Cof
fee
Pal
m O
il*
Cot
ton*
Mai
ze*
Wee
kly
Mo
vem
ent
in P
rice
s o
f M
ajo
r M
etal
s an
d M
iner
als,
$/M
t.
020
0
400
600
800
1000
1200
1400
1600
1800
2000
Cru
de O
il*
Zin
c
Tin
*
Gol
d
Alu
min
ium
Cop
per
Lead
Cob
alt
Silv
er*
Wee
kly
Mo
vem
ent
in P
rice
s o
f M
ino
r A
gri
cult
ura
l Co
mm
od
itie
s, $
/Mt.
050100
150
200
250
300
Bar
ley
Whe
at
Coc
onut
*
Cop
ra*
Soy
abea
n*
Sug
ar -
Raw
*
1st W
. Jan
. 200
22n
d W
. Jan
. 200
23r
d W
. Jan
. 200
24t
h W
. Jan
. 200
21s
t W. F
eb. 2
002
2nd
W. F
eb. 2
002
3rd
W. F
eb. 2
002
4th
W. F
eb. 2
002
1st W
. Mar
. 200
22n
d W
. Mar
. 200
23r
d W
. Mar
. 200
2
4th
W. M
ar. 2
002
1st W
. Apr
. 200
22n
d W
. Apr
. 200
2
3rd
W. A
pr. 2
002
4th
W. A
pr. 2
002
1st W
. May
200
2
2nd
W. M
ay 2
002
3rd
W. M
ay 2
002
4th
W. M
ay 2
002
1st W
. Jun
e 20
02
2nd
W. J
une
2002
3rd
W. J
une
2002
4th
W. J
une
2002
1st W
. July
200
2
2nd
W. J
uly 2
002
3rd
W. J
uly 2
002
4th
W. J
uly 2
002
1st W
. Aug
. 200
2
2nd
W. A
ug. 2
002
3rd
W. A
ug. 2
002
4th
W. A
ug. 2
002
1st W
. Sep
t. 20
02
2nd
W. S
ept.
2002
3rd
W. S
ept.
2002
4th
W. S
ept.
2002
1st W
. Oct.
200
2
2nd
W. O
ct. 2
002
3rd
W. O
ct. 2
002
4th
W. O
ct. 2
002
1st W
. Nov
. 200
2
2nd
W. N
ov. 2
002
3rd
W. N
ov. 2
002
4th
W. N
ov. 2
002
1st W
. Dec
. 200
2 2nd
W. D
ec.
3rd
W. D
ec. 2
002
4th
W. D
ec. 2
002
1st W
. Jan
. 200
22n
d W
. Jan
. 200
23r
d W
. Jan
. 200
24t
h W
. Jan
. 200
21s
t W. F
eb. 2
002
2nd
W. F
eb. 2
002
3rd
W. F
eb. 2
002
4th
W. F
eb. 2
002
1st W
. Mar
. 200
22n
d W
. Mar
. 200
23r
d W
. Mar
. 200
2
4th
W. M
ar. 2
002
1st W
. Apr
. 200
22n
d W
. Apr
. 200
2
3rd
W. A
pr. 2
002
4th
W. A
pr. 2
002
1st W
. May
200
2
2nd
W. M
ay 2
002
3rd
W. M
ay 2
002
4th
W. M
ay 2
002
1st W
. Jun
e 20
02
2nd
W. J
une
2002
3rd
W. J
une
2002
4th
W. J
une
2002
1st W
. July
200
2
2nd
W. J
uly 2
002
3rd
W. J
uly 2
002
4th
W. J
uly 2
002
1st W
. Aug
. 200
2
2nd
W. A
ug. 2
002
3rd
W. A
ug. 2
002
4th
W. A
ug. 2
002
1st W
. Sep
t. 20
02
2nd
W. S
ept.
2002
3rd
W. S
ept.
2002
4th
W. S
ept.
2002
1st W
. Oct.
200
2
2nd
W. O
ct. 2
002
3rd
W. O
ct. 2
002
4th
W. O
ct. 2
002
1st W
. Nov
. 200
2
2nd
W. N
ov. 2
002
3rd
W. N
ov. 2
002
4th
W. N
ov. 2
002
1st W
. Dec
. 200
2 2nd
W. D
ec.
3rd
W. D
ec. 2
002
4th
W. D
ec. 2
002
88
Annual Report 2002
89
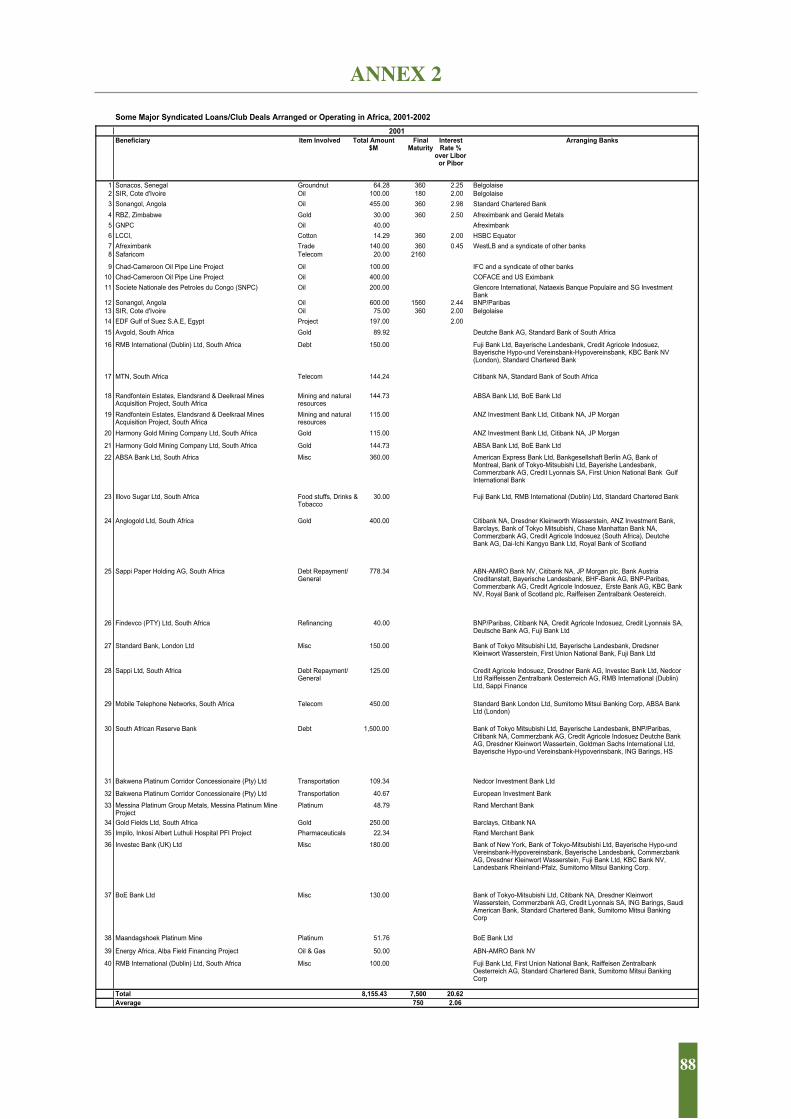
Some Major Syndicated Loans/Club Deals Arranged or Operating in Africa, 2001-2002
2001Beneficiary Item Involved Total Amount
$MFinal
MaturityInterestRate %
over Liboror Pibor
Arranging Banks
1 Sonacos, Senegal Groundnut 64.28 360 2.25 Belgolaise2 SIR, Cote d'Ivoire Oil 100.00 180 2.00 Belgolaise
3 Sonangol, Angola Oil 455.00 360 2.98 Standard Chartered Bank
4 RBZ, Zimbabwe Gold 30.00 360 2.50 Afreximbank and Gerald Metals
5 GNPC Oil 40.00 Afreximbank
6 LCCI, Cotton 14.29 360 2.00 HSBC Equator
7 Afreximbank Trade 140.00 360 0.45 WestLB and a syndicate of other banks8 Safaricom Telecom 20.00 2160
9 Chad-Cameroon Oil Pipe Line Project Oil 100.00 IFC and a syndicate of other banks
10 Chad-Cameroon Oil Pipe Line Project Oil 400.00 COFACE and US Eximbank
11 Societe Nationale des Petroles du Congo (SNPC) Oil 200.00 Glencore International, Nataexis Banque Populaire and SG InvestmentBank
12 Sonangol, Angola Oil 600.00 1560 2.44 BNP/Paribas13 SIR, Cote d'Ivoire Oil 75.00 360 2.00 Belgolaise
14 EDF Gulf of Suez S.A.E, Egypt Project 197.00 2.00
15 Avgold, South Africa Gold 89.92 Deutche Bank AG, Standard Bank of South Africa
16 RMB International (Dublin) Ltd, South Africa Debt 150.00 Fuji Bank Ltd, Bayerische Landesbank, Credit Agricole Indosuez,Bayerische Hypo-und Vereinsbank-Hypovereinsbank, KBC Bank NV(London), Standard Chartered Bank
17 MTN, South Africa Telecom 144.24 Citibank NA, Standard Bank of South Africa
18 Randfontein Estates, Elandsrand & Deelkraal MinesAcquisition Project, South Africa
Mining and naturalresources
144.73 ABSA Bank Ltd, BoE Bank Ltd
19 Randfontein Estates, Elandsrand & Deelkraal MinesAcquisition Project, South Africa
Mining and naturalresources
115.00 ANZ Investment Bank Ltd, Citibank NA, JP Morgan
20 Harmony Gold Mining Company Ltd, South Africa Gold 115.00 ANZ Investment Bank Ltd, Citibank NA, JP Morgan
21 Harmony Gold Mining Company Ltd, South Africa Gold 144.73 ABSA Bank Ltd, BoE Bank Ltd
22 ABSA Bank Ltd, South Africa Misc 360.00 American Express Bank Ltd, Bankgesellshaft Berlin AG, Bank ofMontreal, Bank of Tokyo-Mitsubishi Ltd, Bayerishe Landesbank,Commerzbank AG, Credit Lyonnais SA, First Union National Bank GulfInternational Bank
23 Illovo Sugar Ltd, South Africa Food stuffs, Drinks &Tobacco
30.00 Fuji Bank Ltd, RMB International (Dublin) Ltd, Standard Chartered Bank
24 Anglogold Ltd, South Africa Gold 400.00 Citibank NA, Dresdner Kleinworth Wasserstein, ANZ Investment Bank,Barclays, Bank of Tokyo Mitsubishi, Chase Manhattan Bank NA,Commerzbank AG, Credit Agricole Indosuez (South Africa), DeutcheBank AG, Dai-Ichi Kangyo Bank Ltd, Royal Bank of Scotland
25 Sappi Paper Holding AG, South Africa Debt Repayment/General
778.34 ABN-AMRO Bank NV, Citibank NA, JP Morgan plc, Bank AustriaCreditanstalt, Bayerische Landesbank, BHF-Bank AG, BNP-Paribas,Commerzbank AG, Credit Agricole Indosuez, Erste Bank AG, KBC BankNV, Royal Bank of Scotland plc, Raiffeisen Zentralbank Oestereich.
26 Findevco (PTY) Ltd, South Africa Refinancing 40.00 BNP/Paribas, Citibank NA, Credit Agricole Indosuez, Credit Lyonnais SA,Deutsche Bank AG, Fuji Bank Ltd
27 Standard Bank, London Ltd Misc 150.00 Bank of Tokyo Mitsubishi Ltd, Bayerische Landesbank, DredsnerKleinwort Wasserstein, First Union National Bank, Fuji Bank Ltd
28 Sappi Ltd, South Africa Debt Repayment/General
125.00 Credit Agricole Indosuez, Dresdner Bank AG, Investec Bank Ltd, NedcorLtd Raiffeissen Zentralbank Oesterreich AG, RMB International (Dublin)Ltd, Sappi Finance
29 Mobile Telephone Networks, South Africa Telecom 450.00 Standard Bank London Ltd, Sumitomo Mitsui Banking Corp, ABSA BankLtd (London)
30 South African Reserve Bank Debt 1,500.00 Bank of Tokyo Mitsubishi Ltd, Bayerische Landesbank, BNP/Paribas,Citibank NA, Commerzbank AG, Credit Agricole Indosuez Deutche BankAG, Dresdner Kleinwort Wassertein, Goldman Sachs International Ltd,Bayerische Hypo-und Vereinsbank-Hypoverinsbank, ING Barings, HS
31 Bakwena Platinum Corridor Concessionaire (Pty) Ltd Transportation 109.34 Nedcor Investment Bank Ltd
32 Bakwena Platinum Corridor Concessionaire (Pty) Ltd Transportation 40.67 European Investment Bank
33 Messina Platinum Group Metals, Messina Platinum MineProject
Platinum 48.79 Rand Merchant Bank
34 Gold Fields Ltd, South Africa Gold 250.00 Barclays, Citibank NA
35 Impilo, Inkosi Albert Luthuli Hospital PFI Project Pharmaceuticals 22.34 Rand Merchant Bank
36 Investec Bank (UK) Ltd Misc 180.00 Bank of New York, Bank of Tokyo-Mitsubishi Ltd, Bayerische Hypo-undVereinsbank-Hypovereinsbank, Bayerische Landesbank, CommerzbankAG, Dresdner Kleinwort Wasserstein, Fuji Bank Ltd, KBC Bank NV,Landesbank Rheinland-Pfalz, Sumitomo Mitsui Banking Corp.
37 BoE Bank Ltd Misc 130.00 Bank of Tokyo-Mitsubishi Ltd, Citibank NA, Dresdner KleinwortWasserstein, Commerzbank AG, Credit Lyonnais SA, ING Barings, SaudiAmerican Bank, Standard Chartered Bank, Sumitomo Mitsui BankingCorp
38 Maandagshoek Platinum Mine Platinum 51.76 BoE Bank Ltd
39 Energy Africa, Alba Field Financing Project Oil & Gas 50.00 ABN-AMRO Bank NV
40 RMB International (Dublin) Ltd, South Africa Misc 100.00 Fuji Bank Ltd, First Union National Bank, Raiffeisen ZentralbankOesterreich AG, Standard Chartered Bank, Sumitomo Mitsui BankingCorp
Total 8,155.43 7,500 20.62Average 750 2.06
ANNEX 2
88
Annual Report 2002
89
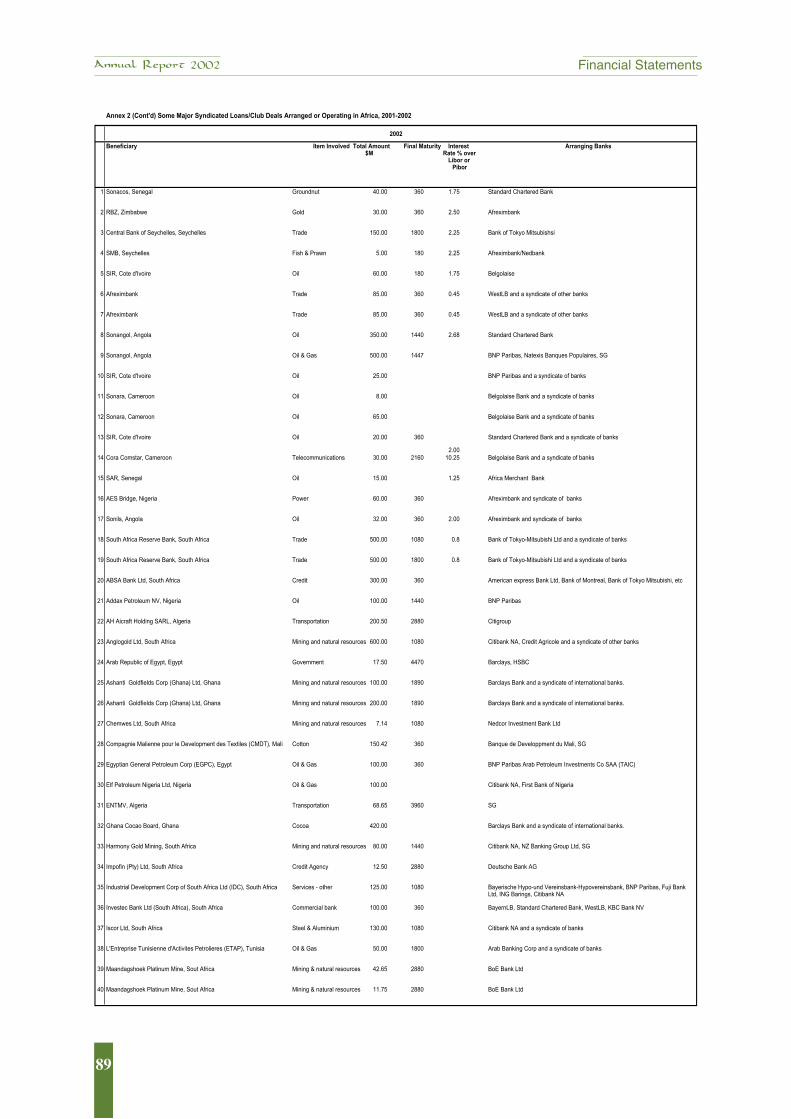
Annex 2 (Cont'd) Some Major Syndicated Loans/Club Deals Arranged or Operating in Africa, 2001-2002
2002
Beneficiary Item Involved Total Amount$M
Final Maturity InterestRate % over
Libor orPibor
Arranging Banks
1 Sonacos, Senegal Groundnut 40.00 360 1.75 Standard Chartered Bank
2 RBZ, Zimbabwe Gold 30.00 360 2.50 Afreximbank
3 Central Bank of Seychelles, Seychelles Trade 150.00 1800 2.25 Bank of Tokyo Mitsubishsi
4 SMB, Seychelles Fish & Prawn 5.00 180 2.25 Afreximbank/Nedbank
5 SIR, Cote d'Ivoire Oil 60.00 180 1.75 Belgolaise
6 Afreximbank Trade 85.00 360 0.45 WestLB and a syndicate of other banks
7 Afreximbank Trade 85.00 360 0.45 WestLB and a syndicate of other banks
8 Sonangol, Angola Oil 350.00 1440 2.68 Standard Chartered Bank
9 Sonangol, Angola Oil & Gas 500.00 1447 BNP Paribas, Natexis Banques Populaires, SG
10 SIR, Cote d'Ivoire Oil 25.00 BNP Paribas and a syndicate of banks
11 Sonara, Cameroon Oil 8.00 Belgolaise Bank and a syndicate of banks
12 Sonara, Cameroon Oil 65.00 Belgolaise Bank and a syndicate of banks
13 SIR, Cote d'Ivoire Oil 20.00 360
2.00
Standard Chartered Bank and a syndicate of banks
14 Cora Comstar, Cameroon Telecommunications 30.00 2160 10.25 Belgolaise Bank and a syndicate of banks
15 SAR, Senegal Oil 15.00 1.25 Africa Merchant Bank
16 AES Bridge, Nigeria Power 60.00 360 Afreximbank and syndicate of banks
17 Sonils, Angola Oil 32.00 360 2.00 Afreximbank and syndicate of banks
18 South Africa Reserve Bank, South Africa Trade 500.00 1080 0.8 Bank of Tokyo-Mitsubishi Ltd and a syndicate of banks
19 South Africa Reserve Bank, South Africa Trade 500.00 1800 0.8 Bank of Tokyo-Mitsubishi Ltd and a syndicate of banks
20 ABSA Bank Ltd, South Africa Credit 300.00 360 American express Bank Ltd, Bank of Montreal, Bank of Tokyo Mitsubishi, etc
21 Addax Petroleum NV, Nigeria Oil 100.00 1440 BNP Paribas
22 AH Aicraft Holding SARL, Algeria Transportation 200.50 2880 Citigroup
23 Anglogold Ltd, South Africa Mining and natural resources 600.00 1080 Citibank NA, Credit Agricole and a syndicate of other banks
24 Arab Republic of Egypt, Egypt Government 17.50 4470 Barclays, HSBC
25 Ashanti Goldfields Corp (Ghana) Ltd, Ghana Mining and natural resources 100.00 1890 Barclays Bank and a syndicate of international banks.
26 Ashanti Goldfields Corp (Ghana) Ltd, Ghana Mining and natural resources 200.00 1890 Barclays Bank and a syndicate of international banks.
27 Chemwes Ltd, South Africa Mining and natural resources 7.14 1080 Nedcor Investment Bank Ltd
28 Compagnie Malienne pour le Development des Textiles (CMDT), Mali Cotton 150.42 360 Banque de Developpment du Mali, SG
29 Egyptian General Petroleum Corp (EGPC), Egypt Oil & Gas 100.00 360 BNP Paribas Arab Petroleum Investments Co SAA (TAIC)
30 Elf Petroleum Nigeria Ltd, Nigeria Oil & Gas 100.00 Citibank NA, First Bank of Nigeria
31 ENTMV, Algeria Transportation 68.65 3960 SG
32 Ghana Cocao Board, Ghana Cocoa 420.00 Barclays Bank and a syndicate of international banks.
33 Harmony Gold Mining, South Africa Mining and natural resources 80.00 1440 Citibank NA, NZ Banking Group Ltd, SG
34 Impofin (Pty) Ltd, South Africa Credit Agency 12.50 2880 Deutsche Bank AG
35 Industrial Development Corp of South Africa Ltd (IDC), South Africa Services - other 125.00 1080 Bayerische Hypo-und Vereinsbank-Hypovereinsbank, BNP Paribas, Fuji BankLtd, ING Barings, Citibank NA
36 Investec Bank Ltd (South Africa), South Africa Commercial bank 100.00 360 BayernLB, Standard Chartered Bank, WestLB, KBC Bank NV
37 Iscor Ltd, South Africa Steel & Aluminium 130.00 1080 Citibank NA and a syndicate of banks
38 L'Entreprise Tunisienne d'Activites Petrolieres (ETAP), Tunisia Oil & Gas 50.00 1800 Arab Banking Corp and a syndicate of banks
39 Maandagshoek Platinum Mine, Sout Africa Mining & natural resources 42.65 2880 BoE Bank Ltd
40 Maandagshoek Platinum Mine, Sout Africa Mining & natural resources 11.75 2880 BoE Bank Ltd
Financial Statements
90
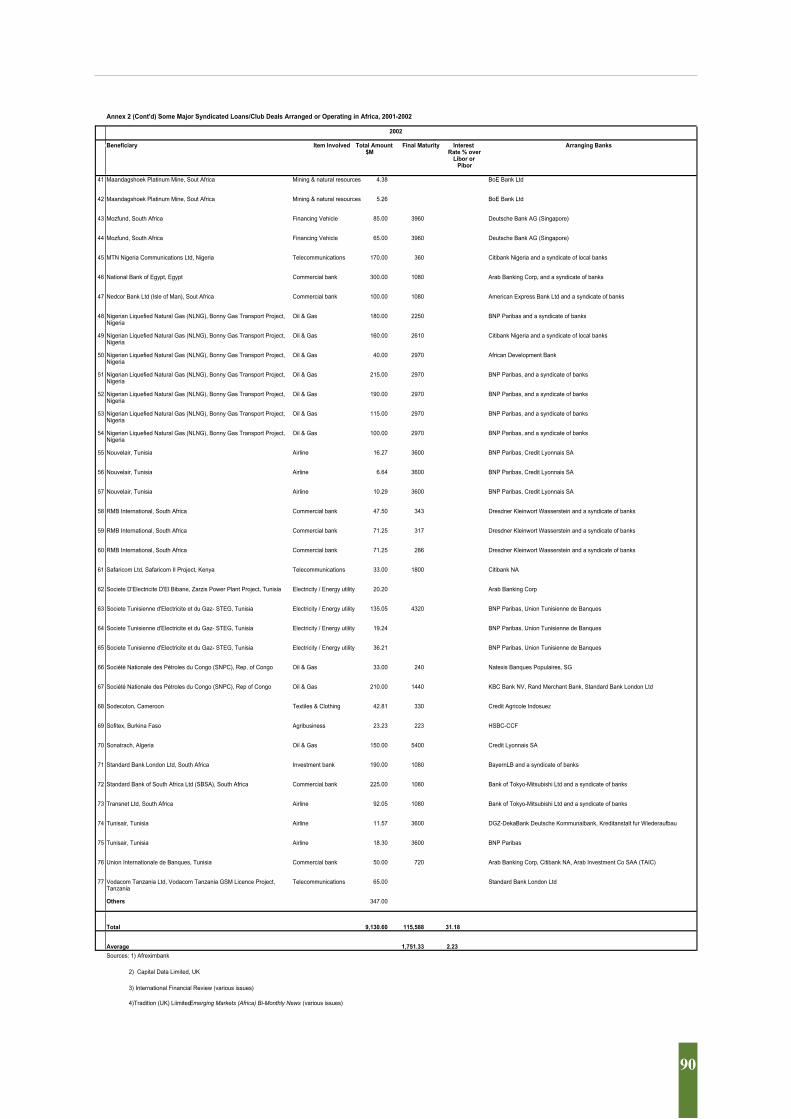
Annex 2 (Cont'd) Some Major Syndicated Loans/Club Deals Arranged or Operating in Africa, 2001-2002
2002
Beneficiary Item Involved Total Amount$M
Final Maturity InterestRate % over
Libor orPibor
Arranging Banks
41 Maandagshoek Platinum Mine, Sout Africa Mining & natural resources 4.38 BoE Bank Ltd
42 Maandagshoek Platinum Mine, Sout Africa Mining & natural resources 5.26 BoE Bank Ltd
43 Mozfund, South Africa Financing Vehicle 85.00 3960 Deutsche Bank AG (Singapore)
44 Mozfund, South Africa Financing Vehicle 65.00 3960 Deutsche Bank AG (Singapore)
45 MTN Nigeria Communications Ltd, Nigeria Telecommunications 170.00 360 Citibank Nigeria and a syndicate of local banks
46 National Bank of Egypt, Egypt Commercial bank 300.00 1080 Arab Banking Corp, and a syndicate of banks
47 Nedcor Bank Ltd (Isle of Man), Sout Africa Commercial bank 100.00 1080 American Express Bank Ltd and a syndicate of banks
48 Nigerian Liquefied Natural Gas (NLNG), Bonny Gas Transport Project,Nigeria
Oil & Gas 180.00 2250 BNP Paribas and a syndicate of banks
49 Nigerian Liquefied Natural Gas (NLNG), Bonny Gas Transport Project,Nigeria
Oil & Gas 160.00 2610 Citibank Nigeria and a syndicate of local banks
50 Nigerian Liquefied Natural Gas (NLNG), Bonny Gas Transport Project,Nigeria
Oil & Gas 40.00 2970 African Development Bank
51 Nigerian Liquefied Natural Gas (NLNG), Bonny Gas Transport Project,Nigeria
Oil & Gas 215.00 2970 BNP Paribas, and a syndicate of banks
52 Nigerian Liquefied Natural Gas (NLNG), Bonny Gas Transport Project,Nigeria
Oil & Gas 190.00 2970 BNP Paribas, and a syndicate of banks
53 Nigerian Liquefied Natural Gas (NLNG), Bonny Gas Transport Project,Nigeria
Oil & Gas 115.00 2970 BNP Paribas, and a syndicate of banks
54 Nigerian Liquefied Natural Gas (NLNG), Bonny Gas Transport Project,Nigeria
Oil & Gas 100.00 2970 BNP Paribas, and a syndicate of banks
55 Nouvelair, Tunisia Airline 16.27 3600 BNP Paribas, Credit Lyonnais SA
56 Nouvelair, Tunisia Airline 6.64 3600 BNP Paribas, Credit Lyonnais SA
57 Nouvelair, Tunisia Airline 10.29 3600 BNP Paribas, Credit Lyonnais SA
58 RMB International, South Africa Commercial bank 47.50 343 Dresdner Kleinwort Wasserstein and a syndicate of banks
59 RMB International, South Africa Commercial bank 71.25 317 Dresdner Kleinwort Wasserstein and a syndicate of banks
60 RMB International, South Africa Commercial bank 71.25 286 Dresdner Kleinwort Wasserstein and a syndicate of banks
61 Safaricom Ltd, Safaricom II Project, Kenya Telecommunications 33.00 1800 Citibank NA
62 Societe D'Electricite D'El Bibane, Zarzis Power Plant Project, Tunisia Electricity / Energy utility 20.20 Arab Banking Corp
63 Societe Tunisienne d'Electricite et du Gaz- STEG, Tunisia Electricity / Energy utility 135.05 4320 BNP Paribas, Union Tunisienne de Banques
64 Societe Tunisienne d'Electricite et du Gaz- STEG, Tunisia Electricity / Energy utility 19.24 BNP Paribas, Union Tunisienne de Banques
65 Societe Tunisienne d'Electricite et du Gaz- STEG, Tunisia Electricity / Energy utility 36.21 BNP Paribas, Union Tunisienne de Banques
66 Société Nationale des Pétroles du Congo (SNPC), Rep. of Congo Oil & Gas 33.00 240 Natexis Banques Populaires, SG
67 Société Nationale des Pétroles du Congo (SNPC), Rep of Congo Oil & Gas 210.00 1440 KBC Bank NV, Rand Merchant Bank, Standard Bank London Ltd
68 Sodecoton, Cameroon Textiles & Clothing 42.81 330 Credit Agricole Indosuez
69 Sofitex, Burkina Faso Agribusiness 23.23 223 HSBC-CCF
70 Sonatrach, Algeria Oil & Gas 150.00 5400 Credit Lyonnais SA
71 Standard Bank London Ltd, South Africa Investment bank 190.00 1080 BayernLB and a syndicate of banks
72 Standard Bank of South Africa Ltd (SBSA), South Africa Commercial bank 225.00 1080 Bank of Tokyo-Mitsubishi Ltd and a syndicate of banks
73 Transnet Ltd, South Africa Airline 92.05 1080 Bank of Tokyo-Mitsubishi Ltd and a syndicate of banks
74 Tunisair, Tunisia Airline 11.57 3600 DGZ-DekaBank Deutsche Kommunalbank, Kreditanstalt fur Wiederaufbau
75 Tunisair, Tunisia Airline 18.30 3600 BNP Paribas
76 Union Internationale de Banques, Tunisia Commercial bank 50.00 720 Arab Banking Corp, Citibank NA, Arab Investment Co SAA (TAIC)
77 Vodacom Tanzania Ltd, Vodacom Tanzania GSM Licence Project,Tanzania
Telecommunications 65.00 Standard Bank London Ltd
Others 347.00
Total 9,130.60 115,588 31.18
Average 1,751.33 2.23
Sources: 1) Afreximbank
2) Capital Data Limited, UK
3) International Financial Review (various issues)
4)Tradition (UK) LiimitedEmerging Markets (Africa) Bi-Monthly News (various issues)