soil microbial community function, structure, and glomalin in response to tall fescue endophyte...
TRANSCRIPT

REGULAR ARTICLE
Soil microbial community function, structure, and glomalinin response to tall fescue endophyte infection
Jeffrey S. Buyer & David A. Zuberer &
Kristine A. Nichols & Alan J. Franzluebbers
Received: 9 July 2010 /Accepted: 24 September 2010 /Published online: 16 October 2010# Springer Science+Business Media B.V. (outside the USA) 2010
Abstract Tall fescue [Lolium arundinaceum (Schreb.)S.J. Darbyshire] is naturally infected with a fungalendophyte, Neotyphodium coenophialum, which pro-duces toxic ergot alkaloids that negatively affectherbivores and may alter soil microbial communities.A 60-week mesocosm study with a factorial arrange-ment of soil type (clay loam and loamy sand) andendophyte infection (with and without) was conductedto determine changes in soil microbial communityfunction (substrate utilization using Biolog), structure(phospholipid fatty acid profile), and glomalin concen-
tration. Microbial utilization of carbohydrate, carbox-ylic acid, and miscellaneous substrate groups waslower in soil planted to endophyte-infected tall fescuethan in soil planted to endophyte-free tall fescue.Gram-positive bacteria, arbuscular mycorrhizae, andglomalin in small (0.25–1.0 mm) and large (>1 mm)water-stable macro-aggregates were also negativelyaffected by endophyte infection. Although microbialchanges due to endophyte infection were not ubiqui-tous and overwhelming, they were consistent withprevious observations of reduced decomposition ofendophyte-infected tall fescue plant litter, which maylead to greater soil C sequestration.
Keywords Biolog . Community-level physiologicalprofiles .Microbialdiversity . Phospholipid fattyacids .
Substrate utilization assay
AbbreviationsCFU Colony forming unitE− Endophyte freeE+ Endophyte infectedPLFA Phospholipid fatty acid
Introduction
Tall fescue [Lolium arundinaceum (Schreb.) S.J.Darbyshire] is an important grass grown around theworld for forage and turf and is considered the most
Plant Soil (2011) 339:401–412DOI 10.1007/s11104-010-0592-y
Responsible Editor: Eric Paterson.
J. S. BuyerUSDA—Agricultural Research Service,Building 001, Room 140, BARC-West,Beltsville, MD 20705, USA
D. A. ZubererDepartment of Soil and Crop Sciences,Texas A&M University,College Station, TX 77843, USA
K. A. NicholsUSDA—Agricultural Research Service,1701 10th Avenue SW, P.O. Box 459, Mandan, ND 58554,USA
A. J. Franzluebbers (*)USDA—Agricultural Research Service,1420 Experiment Station Road,Watkinsville, GA 30677, USAe-mail: [email protected]

important perennial, cool-season grass for cattleproduction in the southeastern USA. It is naturallyinfected with a fungal endophyte, Neotyphodiumcoenophialum, which resides in the above-groundportions of the plant and produces a variety ofalkaloids that have been shown to be toxic whenconsumed in large quantities by grazing cattle, sheep,and horses (Stuedemann and Hoveland 1988).Endophyte-free (E−) tall fescue pastures can bedeveloped by planting seed that has had the funguskilled during prolonged storage. However, endophyte-free pastures have not been widely developed forlong-term grazing systems, because stands are notpersistent due to reduced grazing tolerance and lowerdisease and pest resistance (Hoveland 1993). Thefungal endophyte symbiosis with tall fescue (E+),therefore, is considered an important component inthe agroecological fitness of tall fescue (Clay 1997).
One of the positive ecological consequences ofendophyte infection can be found in soil. Total soilorganic C and N contents were greater under high- thanunder low-endophyte-infected pastures (Franzluebbers etal. 1999). One reason for the difference in soil organicC and N could be related to greater fitness of E+ tallfescue, in which seedling dry matter production can begreater than under E− tall fescue (Cheplick et al. 1989;Clay 1993). In a 60-week growth study, E+ tall fescueproduced greater plant biomass than E− tall fescue,although results varied by soil type (Franzluebbers2006). Greater plant production could lead to greater Cinput to soil resulting in greater soil organic C, andsubsequent changes in soil microbial communitycomposition.
Another reason for the difference in soil organic Cand N contents could be due to altered soil microbialdynamics. When 8 to 15 year-old tall fescue pastureshad high endophyte infection levels, potential Cmineralization per unit of soil organic C was lowerthan when endophyte infection levels were low(Franzluebbers et al. 1999). At the end of 4 years ofseed-harvest management of tall fescue in Kentucky,potential C mineralization per unit of microbialbiomass C was lower under E+ than under E− tallfescue (Handayani et al. 2010). Leaf litter from E+ tallfescue decomposed slower than from E− tall fescuethroughout a 24-week litter-bag study (Siegrist et al.2010). Further, E+ ryegrass (Lolium multiflorum Lam.)leaf litter decomposed slower than E− leaf litter in a12-week outdoor microcosm (Omacini et al. 2004).
During a 32-d decomposition experiment, C mineral-ization and microbial biomass C were slightly inhibitedby E+ tall fescue leaves compared with E− leaves, butnet N mineralization and microbial biomass N wereenhanced by endophyte infection (Franzluebbers andHill 2005). During a 60-week growth study, Archaeaand high G+C (guanine and cytosine) Gram-positivebacteria were suppressed by E+ compared with E− in aclay loam soil, but not in a loamy sand soil (Jenkins etal. 2006). Both greater C input and altered microbialprocessing of leaf litter and soil organic matter appearto be possible mechanisms for greater soil organic Cand N accumulation in long-term E+ than E− tallfescue pastures. Further research is needed to under-stand the potential changes in soil microbial commu-nity structure and function in response to endophyteexposure, both in the short- and long-term.
Soil microbial community structure and functioncan be evaluated with a combination of phospholidfatty acid (PLFA) profiles and substrate utilization(Biolog) (Buyer et al. 1999, 2002; Petersen et al.2002). Biolog has been effective at characterizing thefunctional capability of soil organisms to utilizespecific C substrates (Garland and Mills 1991;Garland 1996; Buyer et al. 2001). The method isrelatively simple, rapid, and easy to use, but has beencriticized, because it implicitly assumes that bacteriapresent are culturable, which may not always be thecase (Konopka et al. 1998). Soil PLFA profiles canhelp isolate specific biomarker groups of organismswithout the need to culture organisms (Cavigelli et al.1995; McMahon et al. 2005). However, PLFAprofiles are limited with regards to assessing soilfunction, since they combine organisms into largegroups with overlapping functions. How microbialcommunities change in soil could alter specific soilprocesses, such as production of glomalin (anaggregating glue-like glycoprotein) by arbuscularmycorrhizae, development of soil structure, and theirresulting impacts on water infiltration, nutrient cycling,and soil organic C sequestration (Treseder and Turner2007). We hypothesized that Biolog and PLFA profilescould discriminate potential microbial communitychanges in soil in response to endophyte infection oftall fescue. We wanted to associate potential microbialcommunity changes with potential differences inglomalin (as measured by Bradford-reactive soilprotein), since differences in water-stable aggregationand C and N contents of aggregate fractions were
402 Plant Soil (2011) 339:401–412

previously observed in response to endophyte infection(Franzluebbers 2006) and grassland sampling showedstrong relationships among glomalin, soil organic C,total soil N, particulate organic C and N, potentiallymineralizable C, and soil microbial biomass C(Franzluebbers et al. 2000). Previously, responsesof soil prokaryotic communities to endophyte infec-tion of tall fescue in bulk and rhizosphere soil weredetermined with fluorescent in situ hybridization(Jenkins et al. 2006).
Amesocosm experiment was conducted to determinesoil microbial community structure and function inresponse to short-term exposure of soil to E+ and E− tallfescue plants. Two soil types were evaluated to discernthe influence of particle size (and presumed difference insoil porosity) and inherent fertility on changes in soilmicrobial community structure with time. A semi-controlled experiment [i.e. uniform soil and plantpopulations with naturally variable environmental con-ditions (although with irrigation and winter protection)]with multiple evaluations of soil was employed toovercome large inherent spatial variability in soilproperties in typical pastures and to help discerntemporal changes. The working hypothesis was that E+ tall fescue would inhibit a portion of the soil microbialcommunity during the experiment, and eventually leadto enhanced organic C and N storage compared with E−tall fescue, as observed in long-term field studies.
Materials and methods
Experimental setup
An outdoor mesocosm study consisting of 48 exper-imental units was conducted from March 2002 untilApril 2003 near Watkinsville GA (33° 52′ N, 83° 25′W). Climatic conditions during the experiment werereported in Franzluebbers (2006); average monthlytemperature ranged from a low of 5°C at 46 weeks toa high of 26°C at 20 weeks. The experimental designconsisted of three randomized replications of afactorial arrangement of soil type (clay loam andloamy sand) and endophyte infection [E− and E+(common toxic endophyte infection)] placed in fourblocks, in which 12 containers (2 soil type × 2endophyte infection × 3 replications) were sequen-tially harvested at 8, 20, 36, and 60 weeks of growth.The clay loam contained an average of 33% clay and
46% sand and the loamy sand contained an average of24% clay and 64% sand. Soil was not exposed to tallfescue-endophyte association previously and was ofCecil-Pacolet-Appling series (clayey, kaolinitic, thermicTypic Kanhapludults) collected from a depth of ∼1-m(clay loam) and at the surface of an alluvial wash (loamysand). Details of the container study can be found inFranzluebbers (2006) with a summary described in thefollowing.
Containers were 15 cm in diameter and heightand filled with 2.5 kg of the clay loam and 2.7 kgof the loamy sand. Tillers from 2- to 3-year-old‘Jesup’ tall fescue pastures (E− and E+) wereexcavated, washed, and five tillers placed in eachcontainer. At 8, 20, and 36 weeks of growth, thoseexperimental units not removed for plant and soilanalyses had the forage clipped ∼3 cm above thesoil and placed on the soil surface to decompose.This protocol allowed some return of above-groundplant material to the surface, but did not closelymimic natural pasture dynamics, in which grazingand dung deposition are the major pathways ofabove-ground plant input and ungrazed plantmaterial senesces without clipping prematurely.
Soil sampling and analyses
At each of the four sampling dates, 12 experimentalunits were removed for analysis. Roots were separatedfrom soil by hand-working contents over a screen with8-mm openings. Subsamples were kept field-moist at4°C for Biolog and plate counting analyses and at −20°Cfor PLFA analysis. The remaining portion of soil wasdried at 55°C for 3 days and passed through a screenwith 4.75-mm openings and then split into two sub-samples—one for water-stable aggregation and glomalinanalyses and one for biochemical and physical soilanalyses reported in Franzluebbers (2006).
Plate counts
Soil samples (10 g) were diluted to 10−5 in steriledeionized water. Soil suspension (1 mL) was spreadonto 0.1-strength tryptic soy agar plates and incubated at30°C for 72 h. Plate counts were conducted in triplicateand mean values associated with each experimental unitwere subjected to further statistical analysis. Colonyforming units were recorded and data were transformedto log 10 values for statistical analyses.
Plant Soil (2011) 339:401–412 403
Substrate utilization assay (Biolog)
Soil samples (10 g) were diluted to 10−3 in steriledeionized water. Soil suspension (150 μL, 10−3
dilution) was added to each well of Biolog GN plates.Plates were incubated for 48 h at 30°C and scannedon a LabSystems Multiskan MS at 590 nm. Averagewell-color development was recorded as absorbancevalues ranging from 0 to 2. Substrates were catego-rized into seven groups for statistical analysis:polymers, carbohydrates, carboxylic acids, aminesand amides, amino acids, miscellaneous, and thesum of all other groups (Zak et al. 1994).
Phospholipid fatty acid (PLFA) analysis
The method was previously described (Buyer et al.2010). Briefly, lipids were extracted from 5 g oflyophilized soil using a modified Bligh-Dyer extraction.Lipids were fractionated by silica gel chromatographyand the phospholipid fraction then trans-esterified inmild alkaline methanol. Resulting fatty acid methylesters were purified by solid phase extraction chroma-tography using a 100 mg NH2 column (Phenomenex).Each sample was loaded and eluted in chloroform. Afterevaporation of chloroform, samples were dissolved in200 μL of 1:1 hexane:methyl tert-butyl ether andanalyzed with an Agilent 6890 gas chromatograph.Fatty acid methyl esters were identified using MIDIsoftware (MIDI Inc., Newark DE), with the eukaryoticmethod modified to use a split ratio of 1:50. Hexade-canoic acid methyl ester was used as an externalstandard for quantification. Identification of fatty acidswas confirmed for randomly chosen samples using agas chromatograph-mass spectrometer (Hewlett-Packard5890 GC, 5970 MSD). Fatty acids were categorizedinto seven groups for statistical analysis: Gram-positivebacteria (iso and anteiso branched), Gram-negativebacteria (monounsaturated), actinomycetes (10-methylfatty acids), fungi (18:2 ω6 cis), protozoa (20:3 ω6 cisand 20:4ω6 cis), arbuscular mycorrhizae (16:1ω5 cis),and total PLFAs.
Glomalin
Soil from each experimental unit was separated intothe following components for glomalin analysis:water-stable micro-aggregates (0.053–0.25 mm),small water-stable macro-aggregates (0.25–1.0 mm),
large water-stable macro-aggregates (>1 mm), particu-late organic matter fraction (>0.053 mm), and wholesoil. Details of fractionation procedures were describedin Franzluebbers (2006). Glomalin was extracted with100 mM sodium pyrophosphate, pH 9.0 (Wright et al.2006). All extractions were performed at 121°C for anhour. After each 1-h cycle, samples were centrifuged sothat the supernatant could be decanted from the pelletedsoil. The extraction procedure was repeated until theextract solution became straw-colored. Decanted solu-tion from each extraction cycle was combined andassayed for glomalin concentration using the Bradford-reactive total protein assay (Rillig 2004; Wright et al.1996). In some cases, the amount of glomalin in theextract was too dilute and the sample volume wasconcentrated by evaporation at 70°C. Glomalin datawere calculated on a g−1 soil basis, accounting for thefraction of whole soil in the aggregate or particulatefraction.
Statistical analyses
Analysis of variance was conducted using the generallinear model in SAS (Cary NC) following theexperimental setup consisting of a factorial arrange-ment of soil type (clay loam and loamy sand) andendophyte infection (E− and E+) in a completelyrandomized design with three replications and repeat-ed measurement at four time periods (8, 20, 36, and60 weeks). Endophyte-infection treatment effectswere analyzed as a main (1° of freedom, df) andinteractive effect with soil type (1 df) using thereplication × soil type × endophyte infection variationas an error term (8 df). Interaction of endophyteinfection with sampling period (3 df) was also testedusing the residual variation (24 df). Effects wereconsidered significant at p≤0.05.
Correlation amongmicrobial variables (reported here)and soil biochemical and physical properties [reported inFranzluebbers (2006)] was conducted on mean valuesfor each soil type × endophyte infection × samplingperiod (n=16), excluding the initial soil analyses.Associations were considered significant at p≤0.01.
Redundancy analysis was conducted usingCanoco 4.5 to analyze relationships among PLFAs,treatments (endophyte infection and soil type), andsoil properties. Decomposition of variance wasconducted as described by ter Braak and Smilauer(2002).
404 Plant Soil (2011) 339:401–412

Results
Plate counts
Colony forming units (CFUs) on tryptic soy agaraveraged across treatments increased with time frominitiation (6.85 log10 CFUs g
−1 soil) to Week 36, butdeclined again at Week 60 (Table 1). Across samplingperiods and endophyte infection levels, plate countswere greater (p=0.004) in the clay loam (7.44 log10CFUs g−1 soil) than in the loamy sand (7.29 log10CFUs g−1 soil). Endophyte infection had no signifi-cant effect on plate counts, whether as main effect oras interactive effect with soil or sampling period.
Substrate utilization assay (Biolog)
Microbial community function from the sum of thesix substrate groups (i.e. polymers, carbohydrates,carboxylic acids, amines and amides, amino acids,and miscellaneous) varied with soil, endophyteinfection, and time (Table 1). Highest summedfunctional activity was at Week 36 and lowest atWeek 60. Across sampling periods and endophyteinfection levels, summed functional activity waslower (p<0.001) in the clay loam (2.4) than in the
loamy sand (3.9). Endophyte infection had a signif-icant effect (p=0.002) on summed functional activity,in which E+ was lower (2.9) than E− (3.3). Theinteraction of endophyte infection with soil type(p=0.07) suggested that the endophyte effect wasgreater in the clay loam (E+, 2.1 vs. E−, 2.7) than inthe loamy sand (E+, 3.7 vs. E−, 4.0). The strongestendophyte effect occurred at Week 36 (Table 1).
Microbial utilization was lower in the clay loamthan in the loamy sand for all substrate groups.Functional activity averaged across soil type andsampling period was lower with E+ than with E− oncarbohydrate substrates (E+, 0.52 vs. E−, 0.65, p<0.001), on carboxylic acid substrates (E+, 0.65 vs. E−,0.73, p=0.003), and on the miscellaneous substrategroup (E+, 0.42 vs. E−, 0.52, p<0.001). Microbialutilization of polymers (0.49, p=0.84), amines/amides(0.34, p=0.17), and amino acids (0.57, p=0.10) wasnot affected by the main effect of endophyte infection.
The reduced microbial utilization of carbohydrateswith E+ compared with E− interacted significantlywith soil type (p=0.01), in which microbial utilizationwas much more reduced with E+ than with E− in theclay loam (E+, 0.35 vs. E−, 0.57, p<0.001) than inthe loamy sand (E+, 0.69 vs. E−, 0.74, p=0.24).Reduced microbial utilization of the miscellaneous
Table 1 Analysis of variance for bacterial colony formingunits on tryptic soy agar (TSA), total microbial communityfunction (as sum of six Biolog groups), total microbial
community [as sum of six phospholipid fatty acid (PLFA)groups], and glomalin concentration of whole soil and meanvalues for endophyte × sampling period
Source of variation df Bacteria on TSA(CFU g−1 soil)
Total Biolog (absorbance) Total PLFA(μmol g−1 soil)
Whole-soil glomalin(mg g−1 soil)
Pr>F
Soil (S) 1, 8 0.004 <0.001 0.10 0.002
Endophyte (E) 1, 8 0.78 0.002 0.46 0.95
S × E 1, 8 0.16 0.07 0.17 0.35
Sampling period (SP) 3, 24 <0.001 <0.001 <0.001 <0.001
S × SP 3, 24 0.11 <0.001 0.55 0.69
E × SP 3, 24 0.43 0.04 0.34 0.36
S × E × SP 3, 24 0.58 0.64 0.35 0.36
Mean values
Sampling period (weeks) E− E+ E− E+ E− E+ E− E+
8 7.25 7.18 3.2 3.0 4.8 3.2 0.21 0.24
20 7.28 7.32 2.2 2.3 13.5 17.1 0.25 0.33
36 7.86 7.94 6.0 4.6 19.7 17.8 0.44 0.33
60 7.03 7.03 2.1 1.9 20.8 17.8 0.50 0.50
LSD0.05 0.13 0.8 5.5 0.16
Plant Soil (2011) 339:401–412 405

substrate group with E+ compared with E− alsointeracted in magnitude with soil type (p=0.03), inwhich the endophyte effect was more negative in theclay loam (E+, 0.29 vs. E−, 0.43, p<0.001) than inthe loamy sand (E+, 0.55 vs. E−, 0.61, p=0.04).Reduced microbial utilization of carboxylic acids withE+ than with E− was consistent across soil types,averaging 0.51 vs. 0.60, respectively (p=0.01), in theclay loam and 0.80 vs. 0.86, respectively (p=0.03), inthe loamy sand.
Microbial utilization of all substrate groups (exceptpolymers) was significantly lower with E+ than withE− at Week 36. The reduction in microbial utilization(a) of carbohydrates due to endophyte infection was34% at Week 36 (p<0.001) and 9±12% at othersampling periods, (b) of carboxylic acid substrateswas 14% at Week 36 (p=0.03) and 7±8% at othersampling periods, (c) of amine/amide substrates was26% at Week 36 (p=0.02) and 0±8% at othersampling periods, (d) of amino acid substrates was20% at Week 36 (p=0.008) and 0±9% at othersampling periods, and (e) of miscellaneous substrateswas 33% at Week 36 (p<0.001) and 6±6% at othersampling periods. These temporal effects of endo-phyte infection on microbial activity were consistentacross soil type.
Phospholipid fatty acid (PLFA) analysis
Total PLFA increased rapidly from Week 8 to Week20, but more slowly thereafter (Table 1). Total PLFAaveraged across endophyte infection and samplingperiods was marginally lower (p=0.10) in the clayloam (13.5 μmol g−1) than in the loamy sand(15.2 μmol g−1). Endophyte infection had no effecton total PLFA concentration, neither as a main effectnor as an interaction with soil type or sampling period.
Biomarker groups of PLFA were variably affect-ed by soil type, endophyte infection, and interac-tions with sampling period. All biomarker groupsincreased in concentration with time. Concentrationof the Gram-positive bacterial marker was (a)lower (p=0.03) in the clay loam (1.1 μmol g−1)than in the loamy sand (1.2 μmol g−1), (b)marginally lower with E+ than with E− in the clayloam (E+, 1.0 vs. E−, 1.2 μmol g−1, p=0.08), butnot affected in the loamy sand (E+, 1.3 vs. E−,1.2 μmol g−1, p=0.59), and (c) not affected byendophyte infection during the first 36 weeks, but
reduced 17% (p=0.06) with E+ compared with E− atWeek 60. Concentration of the Gram-negativebacterial marker was only lower (p=0.01) in theclay loam (5.9 μmol g−1) than in the loamy sand(7.4 μmol g−1) and not affected at any level byendophyte infection. Concentration of the actino-mycetal marker was also only lower (p=0.004) inthe clay loam (1.0 μmol g−1) than in the loamy sand(1.6 μmol g−1) and not affected at any level byendophyte infection. In contrast, concentration ofthe fungal marker was greater (p=0.006) in the clayloam (1.3 μmol g−1) than in the loamy sand(0.8 μmol g−1), but also not affected at any levelby endophyte infection. Concentration of the proto-zoan biomarkers was unaffected by soil type,endophyte infection, and their interactions. Concen-tration of the arbuscular mycorrhizal marker waslower (p=0.003) in the clay loam (0.5 μmol g−1)than in the loamy sand (0.7 μmol g−1) and wasaffected by endophyte infection only at Week 60, inwhich E+ was 26% lower than E− (p=0.04).
Glomalin
Glomalin concentration of whole soil increasedslowly with time and eventually was greater at Week60 than at all other sampling periods (Table 1).Whole-soil glomalin concentration was lower (p<0.001) in the clay loam (0.21 mg g−1) than in theloamy sand (0.49 mg g−1) and not affected at anylevel by endophyte infection.
Glomalin concentration of the particulate organicmatter fraction (>0.053 mm) following mild alkalinedispersion had a pattern similar to that of whole soil,in which glomalin was lower (p<0.001) in the clayloam (0.10 mg g−1 soil) than in the loamy sand(0.22 mg g−1 soil) and not affected at any level byendophyte infection. The particulate organic matterfraction accounted for 45% of the weight of the clayloam and 60% of the loamy sand. Whether glomalinwas expressed on a fractional or whole-soil basis hadlittle effect on detecting differences due to endophyteinfection.
Glomalin concentration of the water-stable aggre-gate fractions was variably affected by soil type,endophyte infection, and interactions with samplingperiod. Glomalin concentration on a whole-soil basiswas obtained by multiplying the concentration perfraction by the portion of soil in that fraction (Table 2).
406 Plant Soil (2011) 339:401–412
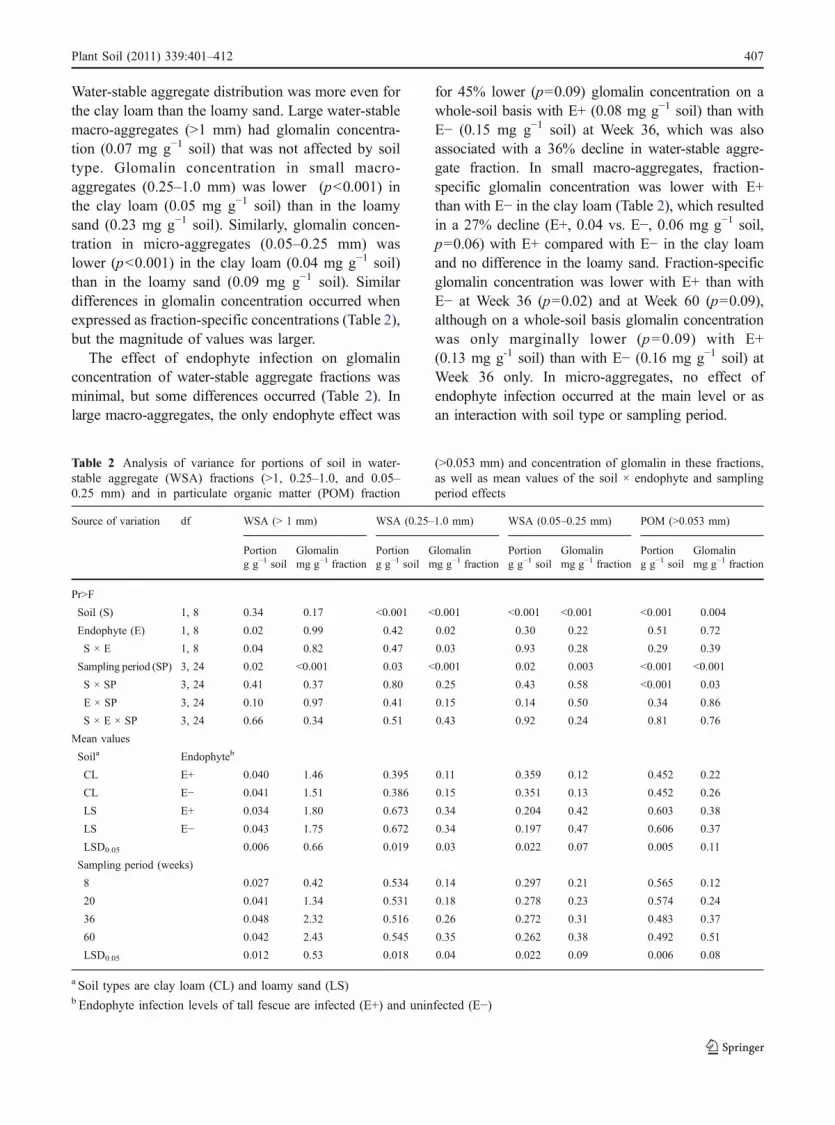
Water-stable aggregate distribution was more even forthe clay loam than the loamy sand. Large water-stablemacro-aggregates (>1 mm) had glomalin concentra-tion (0.07 mg g−1 soil) that was not affected by soiltype. Glomalin concentration in small macro-aggregates (0.25–1.0 mm) was lower (p<0.001) inthe clay loam (0.05 mg g−1 soil) than in the loamysand (0.23 mg g−1 soil). Similarly, glomalin concen-tration in micro-aggregates (0.05–0.25 mm) waslower (p<0.001) in the clay loam (0.04 mg g−1 soil)than in the loamy sand (0.09 mg g−1 soil). Similardifferences in glomalin concentration occurred whenexpressed as fraction-specific concentrations (Table 2),but the magnitude of values was larger.
The effect of endophyte infection on glomalinconcentration of water-stable aggregate fractions wasminimal, but some differences occurred (Table 2). Inlarge macro-aggregates, the only endophyte effect was
for 45% lower (p=0.09) glomalin concentration on awhole-soil basis with E+ (0.08 mg g−1 soil) than withE− (0.15 mg g−1 soil) at Week 36, which was alsoassociated with a 36% decline in water-stable aggre-gate fraction. In small macro-aggregates, fraction-specific glomalin concentration was lower with E+than with E− in the clay loam (Table 2), which resultedin a 27% decline (E+, 0.04 vs. E−, 0.06 mg g−1 soil,p=0.06) with E+ compared with E− in the clay loamand no difference in the loamy sand. Fraction-specificglomalin concentration was lower with E+ than withE− at Week 36 (p=0.02) and at Week 60 (p=0.09),although on a whole-soil basis glomalin concentrationwas only marginally lower (p=0.09) with E+(0.13 mg g-1 soil) than with E− (0.16 mg g−1 soil) atWeek 36 only. In micro-aggregates, no effect ofendophyte infection occurred at the main level or asan interaction with soil type or sampling period.
Table 2 Analysis of variance for portions of soil in water-stable aggregate (WSA) fractions (>1, 0.25–1.0, and 0.05–0.25 mm) and in particulate organic matter (POM) fraction
(>0.053 mm) and concentration of glomalin in these fractions,as well as mean values of the soil × endophyte and samplingperiod effects
Source of variation df WSA (> 1 mm) WSA (0.25–1.0 mm) WSA (0.05–0.25 mm) POM (>0.053 mm)
Portion Glomalin Portion Glomalin Portion Glomalin Portion Glomaling g−1 soil mg g−1 fraction g g−1 soil mg g−1 fraction g g−1 soil mg g−1 fraction g g−1 soil mg g−1 fraction
Pr>F
Soil (S) 1, 8 0.34 0.17 <0.001 <0.001 <0.001 <0.001 <0.001 0.004
Endophyte (E) 1, 8 0.02 0.99 0.42 0.02 0.30 0.22 0.51 0.72
S × E 1, 8 0.04 0.82 0.47 0.03 0.93 0.28 0.29 0.39
Sampling period (SP) 3, 24 0.02 <0.001 0.03 <0.001 0.02 0.003 <0.001 <0.001
S × SP 3, 24 0.41 0.37 0.80 0.25 0.43 0.58 <0.001 0.03
E × SP 3, 24 0.10 0.97 0.41 0.15 0.14 0.50 0.34 0.86
S × E × SP 3, 24 0.66 0.34 0.51 0.43 0.92 0.24 0.81 0.76
Mean values
Soila Endophyteb
CL E+ 0.040 1.46 0.395 0.11 0.359 0.12 0.452 0.22
CL E− 0.041 1.51 0.386 0.15 0.351 0.13 0.452 0.26
LS E+ 0.034 1.80 0.673 0.34 0.204 0.42 0.603 0.38
LS E− 0.043 1.75 0.672 0.34 0.197 0.47 0.606 0.37
LSD0.05 0.006 0.66 0.019 0.03 0.022 0.07 0.005 0.11
Sampling period (weeks)
8 0.027 0.42 0.534 0.14 0.297 0.21 0.565 0.12
20 0.041 1.34 0.531 0.18 0.278 0.23 0.574 0.24
36 0.048 2.32 0.516 0.26 0.272 0.31 0.483 0.37
60 0.042 2.43 0.545 0.35 0.262 0.38 0.492 0.51
LSD0.05 0.012 0.53 0.018 0.04 0.022 0.09 0.006 0.08
a Soil types are clay loam (CL) and loamy sand (LS)b Endophyte infection levels of tall fescue are infected (E+) and uninfected (E−)
Plant Soil (2011) 339:401–412 407
Tab
le3
Correlatio
nmatrixof
soilph
ysical,chem
ical,andbiolog
ical
prop
ertiesdeterm
ined
intwosoils
(clayloam
andloam
ysand
),twoendo
phyteinfectionlevelsof
tallfescue
(freeandinfected),andfour
samplingperiod
(8,20
,36
,and60
weeks)
Var
iabl
eD
MS
OC
PO
CS
MB
CC
MIN
Mac
roM
WD
CF
UB
-sum
B-p
oly
B-c
arb
B-a
cid
B-a
min
B-a
aB
-mis
cF
A-t
otF
A-G
r+F
A-G
r-F
A-a
ctin
FA
-fun
gF
A-p
rot
FA
-myc
Gl-w
hol
Gl-P
OM
Gl-L
MA
Gl-S
MA
Gl-M
icro
DM
--0.
660.
890.
660.
780.
160.
29-0
.09
-0.0
50.
01-0
.08
-0.0
80.
00-0
.06
-0.0
20.
800.
850.
780.
870.
370.
850.
900.
630.
740.
740.
510.
55S
OC
0.00
5--
0.92
0.87
0.86
0.80
0.86
-0.0
70.
440.
420.
380.
450.
480.
430.
430.
630.
670.
700.
81-0
.01
0.60
0.78
0.94
0.94
0.64
0.95
0.88
PO
C<
0.00
1<
0.00
1--
0.82
0.90
0.52
0.62
-0.0
60.
230.
260.
190.
230.
270.
220.
240.
770.
840.
810.
900.
210.
800.
920.
860.
930.
770.
800.
81S
MB
C0.
005
<0.
001
<0.
001
--0.
840.
690.
76-0
.08
0.31
0.31
0.29
0.28
0.36
0.28
0.34
0.72
0.71
0.78
0.81
0.17
0.51
0.83
0.83
0.81
0.57
0.86
0.60
CM
IN<
0.00
1<
0.00
1<
0.00
1<
0.00
1--
0.48
0.62
0.26
0.51
0.55
0.46
0.47
0.55
0.49
0.51
0.80
0.85
0.86
0.89
0.26
0.65
0.86
0.78
0.78
0.81
0.71
0.66
Mac
ro0.
56<
0.00
10.
040.
003
0.06
--0.
95-0
.26
0.41
0.35
0.34
0.46
0.46
0.42
0.38
0.18
0.18
0.27
0.39
-0.3
90.
170.
360.
800.
690.
200.
910.
71M
WD
0.28
<0.
001
0.01
<0.
001
0.01
<0.
001
---0
.13
0.51
0.45
0.46
0.53
0.60
0.51
0.49
0.36
0.35
0.46
0.52
-0.2
30.
320.
500.
880.
720.
450.
920.
77C
FU
0.73
0.81
0.82
0.76
0.32
0.33
0.62
--0.
650.
690.
700.
550.
590.
630.
650.
210.
230.
240.
060.
34-0
.20
-0.0
8-0
.20
-0.1
80.
32-0
.27
-0.1
2B
-sum
0.87
0.09
0.38
0.24
0.04
0.12
0.04
0.00
7--
0.97
0.98
0.98
0.98
0.99
0.99
0.20
0.21
0.29
0.28
-0.0
7-0
.09
0.12
0.34
0.18
0.41
0.33
0.38
B-p
oly
0.98
0.10
0.33
0.25
0.03
0.18
0.08
0.00
3<
0.00
1--
0.93
0.93
0.94
0.96
0.95
0.22
0.24
0.31
0.29
-0.0
3-0
.09
0.14
0.35
0.16
0.43
0.30
0.35
B-c
arb
0.78
0.15
0.49
0.28
0.07
0.20
0.08
0.00
3<
0.00
1<
0.00
1--
0.93
0.94
0.96
0.99
0.23
0.22
0.31
0.27
0.02
-0.1
10.
120.
270.
150.
410.
270.
30B
-aci
d0.
760.
080.
400.
300.
060.
070.
040.
03<
0.00
1<
0.00
1<
0.00
1--
0.94
0.99
0.96
0.10
0.13
0.19
0.24
-0.2
1-0
.09
0.09
0.34
0.19
0.32
0.37
0.42
B-a
min
0.99
0.06
0.31
0.17
0.03
0.07
0.01
0.02
<0.
001
<0.
001
<0.
001
<0.
001
--0.
970.
960.
250.
250.
340.
32-0
.07
-0.0
20.
170.
420.
220.
480.
380.
43B
-aa
0.81
0.09
0.41
0.30
0.05
0.10
0.04
0.00
9<
0.00
1<
0.00
1<
0.00
1<
0.00
1<
0.00
1--
0.98
0.15
0.17
0.24
0.26
-0.1
3-0
.09
0.09
0.33
0.17
0.38
0.33
0.39
B-m
isc
0.93
0.10
0.38
0.20
0.04
0.15
0.06
0.00
7<
0.00
1<
0.00
1<
0.00
1<
0.00
1<
0.00
1<
0.00
1--
0.24
0.25
0.33
0.31
0.00
-0.0
80.
150.
330.
180.
420.
320.
36F
A-t
ot<
0.00
10.
009
<0.
001
0.00
2<
0.00
10.
510.
170.
430.
460.
420.
400.
720.
360.
570.
36--
0.99
0.99
0.89
0.72
0.77
0.87
0.57
0.68
0.74
0.44
0.47
FA
-Gr+
<0.
001
0.00
5<
0.00
10.
002
<0.
001
0.51
0.18
0.38
0.43
0.36
0.40
0.64
0.35
0.52
0.35
<0.
001
--0.
980.
910.
670.
800.
890.
590.
730.
770.
460.
53F
A-G
r-<
0.00
10.
003
<0.
001
<0.
001
<0.
001
0.31
0.07
0.38
0.28
0.25
0.24
0.47
0.20
0.36
0.21
<0.
001
<0.
001
--0.
900.
650.
750.
890.
640.
720.
770.
520.
52F
A-a
ctin
<0.
001
<0.
001
<0.
001
<0.
001
<0.
001
0.13
0.04
0.84
0.29
0.28
0.32
0.38
0.23
0.33
0.24
<0.
001
<0.
001
<0.
001
--0.
390.
780.
900.
720.
830.
700.
660.
62F
A-f
ung
0.15
0.97
0.43
0.53
0.33
0.13
0.40
0.20
0.79
0.92
0.96
0.43
0.81
0.63
0.99
0.00
20.
005
0.00
60.
14--
0.41
0.39
0.00
0.09
0.38
-0.2
1-0
.03
FA
-pro
t<
0.00
10.
01<
0.00
10.
040.
006
0.53
0.23
0.46
0.75
0.73
0.67
0.74
0.95
0.74
0.76
<0.
001
<0.
001
<0.
001
<0.
001
0.11
--0.
860.
600.
710.
660.
470.
59F
A-m
yc<
0.00
1<
0.00
1<
0.00
1<
0.00
1<
0.00
10.
170.
050.
770.
650.
610.
660.
740.
530.
740.
58<
0.00
1<
0.00
1<
0.00
1<
0.00
10.
14<
0.00
1--
0.73
0.82
0.74
0.68
0.59
Gl-w
hol
0.00
9<
0.00
1<
0.00
1<
0.00
1<
0.00
1<
0.00
1<
0.00
10.
450.
200.
190.
320.
200.
100.
210.
220.
020.
020.
008
0.00
20.
990.
010.
001
--0.
850.
640.
920.
88G
l-PO
M0.
001
<0.
001
<0.
001
<0.
001
<0.
001
0.00
30.
002
0.52
0.51
0.55
0.58
0.49
0.42
0.52
0.51
0.00
40.
002
0.00
2<
0.00
10.
740.
002
<0.
001
<0.
001
--0.
600.
870.
83G
l-LM
A0.
001
0.00
7<
0.00
10.
02<
0.00
10.
450.
080.
220.
110.
100.
110.
220.
060.
150.
100.
001
<0.
001
<0.
001
0.00
20.
150.
006
0.00
10.
007
0.01
--0.
470.
63G
l-SM
A0.
04<
0.00
1<
0.00
1<
0.00
10.
002
<0.
001
<0.
001
0.31
0.21
0.26
0.31
0.16
0.14
0.21
0.23
0.09
0.07
0.04
0.00
50.
430.
070.
004
<0.
001
<0.
001
0.07
--0.
80G
l-Mic
r0.
03<
0.00
1<
0.00
10.
010.
006
0.00
2<
0.00
10.
670.
150.
190.
260.
110.
090.
130.
170.
070.
040.
040.
010.
900.
020.
02<
0.00
1<
0.00
10.
009
<0.
001
--
Darkshadingindicatessign
ificance
ofp<0.00
1.Light
shadingindicatessign
ificance
of0.00
1<p<0.01
DM
cumulativeplantdrymatter(kgha
−1),SO
CsoilorganicC
(mgg−
1soil),POC
particulateorganicC
(mgg−
1soil),SM
BC
soilmicrobial
biom
assC
(μgg−
1soil),CMIN
potentially
mineralizable
C(μgg−
1soil24
d−1),Macro
water-stablemacro-agg
regate
fractio
n(g
g−1soil),MWD
mean-weigh
tdiam
eter
ofwater-stableaggregation(m
m),CFU
bacterialcolony
form
ingun
itson
tryp
ticsoyagar
(CFU
g−1soil),B-sum
sum
ofsixBiologgrou
ps(absorbance),B-polypo
lymer
Biologabsorbance,B-carbcarboh
ydrate
Biolog
absorbance,B-acidcarbox
ylic
acid
Biologabsorbance,B-amin
amine/am
ideBiologabsorbance,B-aaam
inoacid
Biologabsorbance,B-m
iscmiscellaneou
ssubstrateBiolog
absorbance,FA
-tot
totalph
osph
olipid
fatty
acid
(PLFA
)(μgg−
1soil),FA
-Gr+
Gram-positive
bacteria
PLFA
biom
arker(μgg−
1soil),FA
-Gr−
Gram-negativebacteria
PLFA
biom
arker(μgg−
1soil),F
A-actin
actin
omycetePLFA
biom
arker(μgg−
1soil),F
A-fun
gfung
alPLFA
biom
arker(μgg−
1soil),F
A-protprotozoa
PLFA
biom
arker(μgg−
1soil),F
A-
myc
mycorrhizal
PLFA
biom
arker(μgg−
1soil),Gl-who
lglom
alin
ofwho
lesoil(m
gg−
1soil),Gl-POM
glom
alin
ofparticulateorganicmatterfractio
n(m
gg−
1soil),Gl-LMA
glom
alin
oflargemacro-aggregate
(>1mm)fractio
n(m
gg−
1soil),Gl-SM
Aglom
alin
ofsm
allmacro-agg
regate
(0.25–1.0mm)fractio
n(m
gg−
1soil),G
l-Micro
glom
alin
ofmicro-
aggregate(0.05–
0.25
mm)fractio
n(m
gg−
1soil)
408 Plant Soil (2011) 339:401–412
Association of soil properties
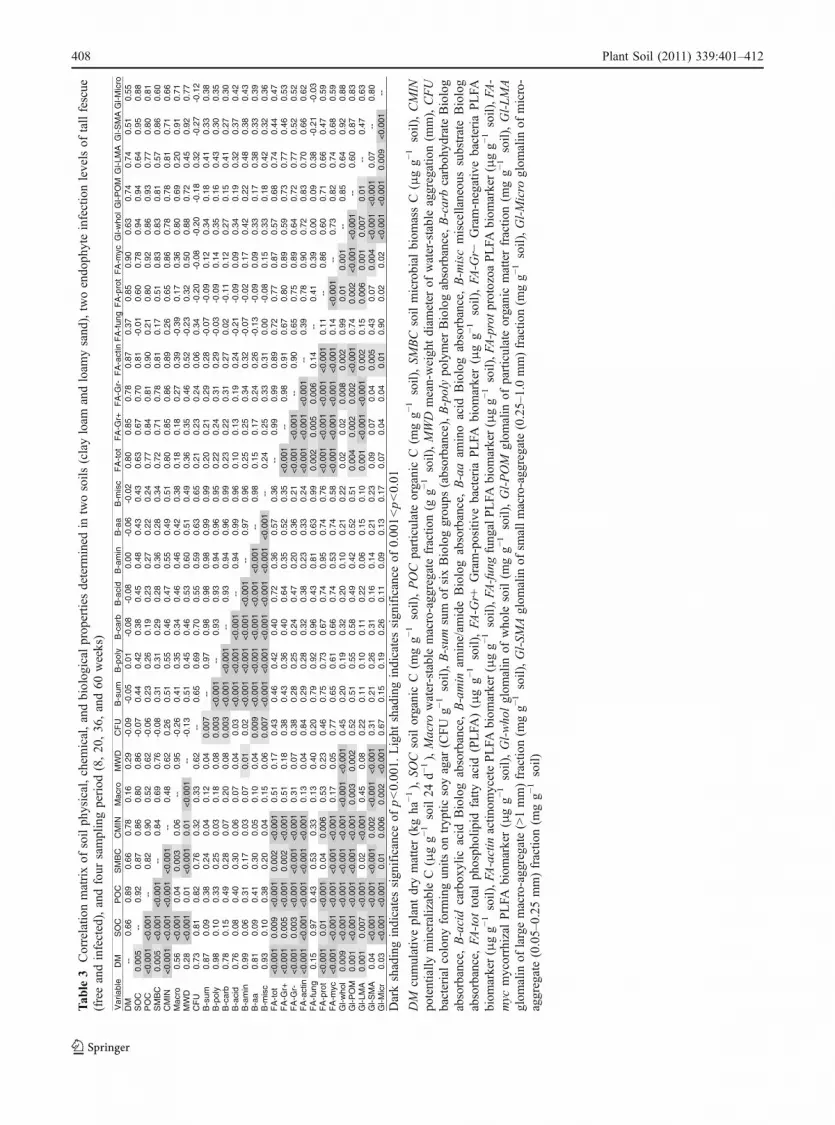
Many soil properties were highly correlated witheach other (Table 3). The effect of cumulative plantgrowth was also highly related to several soilproperties, such as soil organic matter fractions(total, particulate, microbial biomass, and mineraliz-able C), soil microbial community structure (allPLFA biomarker groups except fungi), and glomalin(in whole soil, particulate, and large macro-aggregates, but not in smaller size fractions). Soilorganic matter fractions (total, particulate, microbialbiomass, and mineralizable C) were the mostconsistent and highly related properties to other soilproperties, such as soil microbial community struc-ture (all PLFA biomarker groups except fungi), andglomalin (all fractions), but they were not related tosoil microbial community functions (Biolog groups).Soil microbial structural groups were also not relatedto microbial community functions, but were relatedto glomalin fractions (primarily to particulate andlarge macro-aggregate fractions). Soil microbialfunctional activity was related to bacterial platecounts, but not to any other soil properties.
Of course, individual soil properties within acategory (such as specific biomarkers within themicrobial community structure family (PLFAs) weremostly highly related with each other (an exceptionwas the lack of relationship of fungal biomarker withmany other biomarkers). Overall, soil organic matterfractions dictated to a great extent the development ofsoil microbial community structure (except fungi) andglomalin, but not of substrate utilization potential.
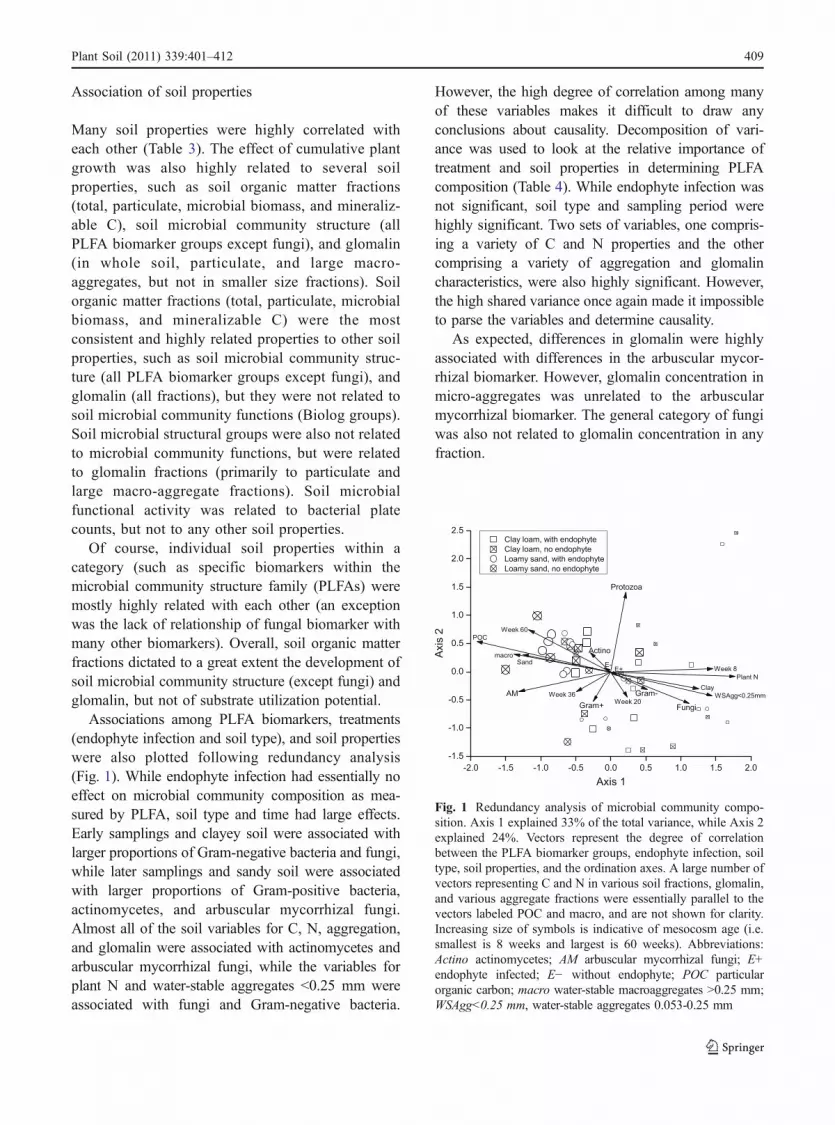
Associations among PLFA biomarkers, treatments(endophyte infection and soil type), and soil propertieswere also plotted following redundancy analysis(Fig. 1). While endophyte infection had essentially noeffect on microbial community composition as mea-sured by PLFA, soil type and time had large effects.Early samplings and clayey soil were associated withlarger proportions of Gram-negative bacteria and fungi,while later samplings and sandy soil were associatedwith larger proportions of Gram-positive bacteria,actinomycetes, and arbuscular mycorrhizal fungi.Almost all of the soil variables for C, N, aggregation,and glomalin were associated with actinomycetes andarbuscular mycorrhizal fungi, while the variables forplant N and water-stable aggregates <0.25 mm wereassociated with fungi and Gram-negative bacteria.
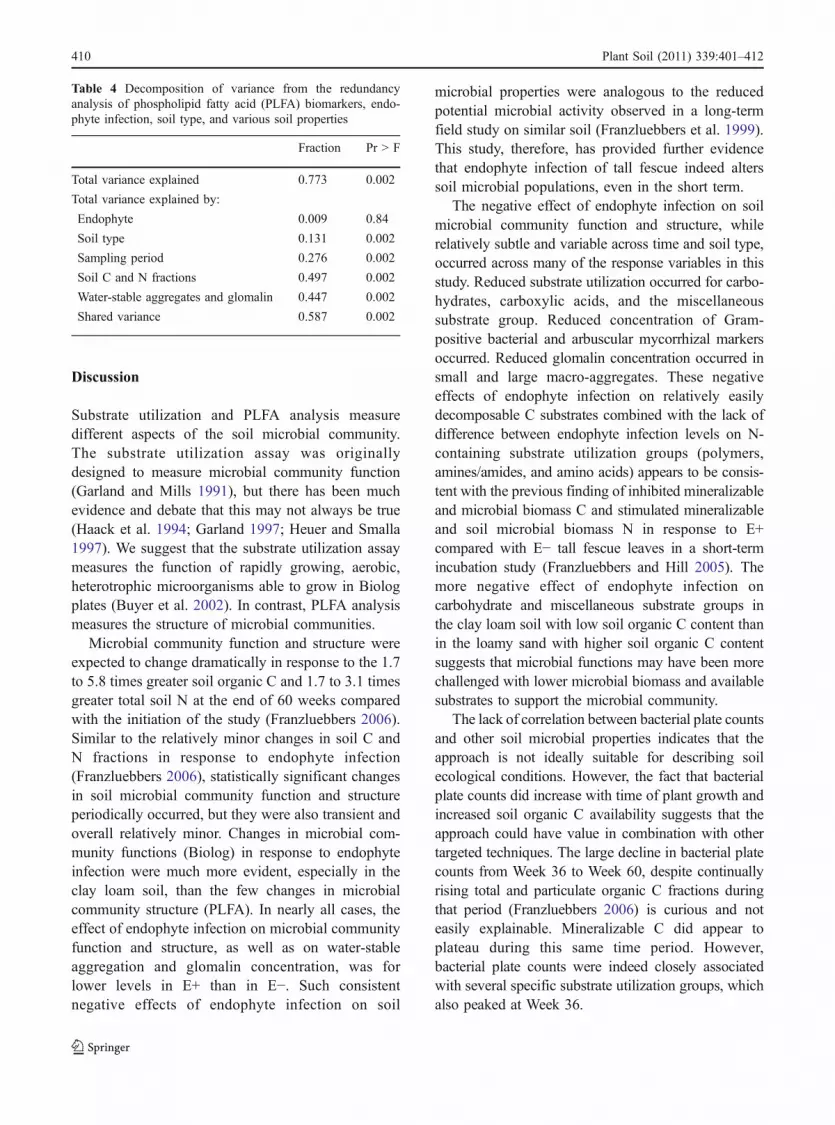
However, the high degree of correlation among manyof these variables makes it difficult to draw anyconclusions about causality. Decomposition of vari-ance was used to look at the relative importance oftreatment and soil properties in determining PLFAcomposition (Table 4). While endophyte infection wasnot significant, soil type and sampling period werehighly significant. Two sets of variables, one compris-ing a variety of C and N properties and the othercomprising a variety of aggregation and glomalincharacteristics, were also highly significant. However,the high shared variance once again made it impossibleto parse the variables and determine causality.
As expected, differences in glomalin were highlyassociated with differences in the arbuscular mycor-rhizal biomarker. However, glomalin concentration inmicro-aggregates was unrelated to the arbuscularmycorrhizal biomarker. The general category of fungiwas also not related to glomalin concentration in anyfraction.
Fig. 1 Redundancy analysis of microbial community compo-sition. Axis 1 explained 33% of the total variance, while Axis 2explained 24%. Vectors represent the degree of correlationbetween the PLFA biomarker groups, endophyte infection, soiltype, soil properties, and the ordination axes. A large number ofvectors representing C and N in various soil fractions, glomalin,and various aggregate fractions were essentially parallel to thevectors labeled POC and macro, and are not shown for clarity.Increasing size of symbols is indicative of mesocosm age (i.e.smallest is 8 weeks and largest is 60 weeks). Abbreviations:Actino actinomycetes; AM arbuscular mycorrhizal fungi; E+endophyte infected; E− without endophyte; POC particularorganic carbon; macro water-stable macroaggregates >0.25 mm;WSAgg<0.25 mm, water-stable aggregates 0.053-0.25 mm
Plant Soil (2011) 339:401–412 409
Discussion
Substrate utilization and PLFA analysis measuredifferent aspects of the soil microbial community.The substrate utilization assay was originallydesigned to measure microbial community function(Garland and Mills 1991), but there has been muchevidence and debate that this may not always be true(Haack et al. 1994; Garland 1997; Heuer and Smalla1997). We suggest that the substrate utilization assaymeasures the function of rapidly growing, aerobic,heterotrophic microorganisms able to grow in Biologplates (Buyer et al. 2002). In contrast, PLFA analysismeasures the structure of microbial communities.
Microbial community function and structure wereexpected to change dramatically in response to the 1.7to 5.8 times greater soil organic C and 1.7 to 3.1 timesgreater total soil N at the end of 60 weeks comparedwith the initiation of the study (Franzluebbers 2006).Similar to the relatively minor changes in soil C andN fractions in response to endophyte infection(Franzluebbers 2006), statistically significant changesin soil microbial community function and structureperiodically occurred, but they were also transient andoverall relatively minor. Changes in microbial com-munity functions (Biolog) in response to endophyteinfection were much more evident, especially in theclay loam soil, than the few changes in microbialcommunity structure (PLFA). In nearly all cases, theeffect of endophyte infection on microbial communityfunction and structure, as well as on water-stableaggregation and glomalin concentration, was forlower levels in E+ than in E−. Such consistentnegative effects of endophyte infection on soil
microbial properties were analogous to the reducedpotential microbial activity observed in a long-termfield study on similar soil (Franzluebbers et al. 1999).This study, therefore, has provided further evidencethat endophyte infection of tall fescue indeed alterssoil microbial populations, even in the short term.
The negative effect of endophyte infection on soilmicrobial community function and structure, whilerelatively subtle and variable across time and soil type,occurred across many of the response variables in thisstudy. Reduced substrate utilization occurred for carbo-hydrates, carboxylic acids, and the miscellaneoussubstrate group. Reduced concentration of Gram-positive bacterial and arbuscular mycorrhizal markersoccurred. Reduced glomalin concentration occurred insmall and large macro-aggregates. These negativeeffects of endophyte infection on relatively easilydecomposable C substrates combined with the lack ofdifference between endophyte infection levels on N-containing substrate utilization groups (polymers,amines/amides, and amino acids) appears to be consis-tent with the previous finding of inhibited mineralizableand microbial biomass C and stimulated mineralizableand soil microbial biomass N in response to E+compared with E− tall fescue leaves in a short-termincubation study (Franzluebbers and Hill 2005). Themore negative effect of endophyte infection oncarbohydrate and miscellaneous substrate groups inthe clay loam soil with low soil organic C content thanin the loamy sand with higher soil organic C contentsuggests that microbial functions may have been morechallenged with lower microbial biomass and availablesubstrates to support the microbial community.
The lack of correlation between bacterial plate countsand other soil microbial properties indicates that theapproach is not ideally suitable for describing soilecological conditions. However, the fact that bacterialplate counts did increase with time of plant growth andincreased soil organic C availability suggests that theapproach could have value in combination with othertargeted techniques. The large decline in bacterial platecounts from Week 36 to Week 60, despite continuallyrising total and particulate organic C fractions duringthat period (Franzluebbers 2006) is curious and noteasily explainable. Mineralizable C did appear toplateau during this same time period. However,bacterial plate counts were indeed closely associatedwith several specific substrate utilization groups, whichalso peaked at Week 36.
Table 4 Decomposition of variance from the redundancyanalysis of phospholipid fatty acid (PLFA) biomarkers, endo-phyte infection, soil type, and various soil properties
Fraction Pr > F
Total variance explained 0.773 0.002
Total variance explained by:
Endophyte 0.009 0.84
Soil type 0.131 0.002
Sampling period 0.276 0.002
Soil C and N fractions 0.497 0.002
Water-stable aggregates and glomalin 0.447 0.002
Shared variance 0.587 0.002
410 Plant Soil (2011) 339:401–412
Strong correlations with changes in soil organicmatter fractions during the course of this mesocosmstudy indicate that root-derived organic inputs to soilwere extremely important to the development of soilmicrobial community structure and changes in glo-malin concentration. Indeed, endophyte infection oftall fescue has been shown to alter root production(Franzluebbers 2006) and root exudation (Malinowskiet al. 2000), which could affect nutrient uptake byplants (Malinowski et al. 1999) and sward-levelfunctional diversity (Rudgers and Clay 2007). How-ever, the fact that subtle changes in soil microbialcommunity function and structure developed, even inthe relatively short time course of this study, suggestthat shoot- and/or root-derived organic inputs fromdifferences in tall fescue endophyte infection have thepotential to significantly alter soil microbial dynam-ics. Such subtle changes provide support to thefindings of long-term changes in soil organic C andN fractions under tall fescue with low and highendophyte-infection frequency (Franzluebbers et al.1999; Franzluebbers and Stuedemann 2005).
Statistically significant, yet subtle inhibition ofplant litter decomposition due to high versus lowendophyte infection of tall fescue (and perennialryegrass) has been oft observed (Omacini et al.2004; Franzluebbers and Hill 2005; Lemons et al.2005; Siegrist et al. 2010). Further, soil that has beenexposed to endophyte-infected tall fescue for manyyears has also exhibited reduced capacity to decom-pose plant litter compared with soil planted toendophyte-free tall fescue (Omacini et al. 2004;Franzluebbers and Hill 2005; Siegrist et al. 2010).These long-term changes in decomposition potential ofthe soil microbial community may be caused by subtlechanges in soil microbial community function andstructure. The results of the current study support thislinkage between subtle changes in microbial communityfunction and structure in the short term with long-termchanges in soil organic matter, although precise mech-anistic changes in microbial physiological processesinduced by endophyte-infected tall fescue have yet to beisolated.
Conclusions
Soil microbial community function, structure, andglomalin were negatively affected by endophyte-
infected compared with endophyte-free tall fescueduring a 60-week mesocosm study. Microbial com-munity growth as determined by PLFA and glomalindeposition in particulate organic matter and largemacro-aggregates were highly related to the accumu-lation of soil organic matter fractions (total, particu-late, microbial biomass, and mineralizable C) duringthe course of this study. The clay loam soil with lowinitial organic C was generally more negativelyaffected by endophyte infection than the loamy sandwith higher organic C. The subtle, short-term changesin microbial community function and structure inresponse to endophyte infection support observationsof long-term changes in soil organic matter C and Nin field studies. Further work is needed to isolate theexact physiological processes affecting soil microbialcommunities by endophyte infection of tall fescue.
Acknowledgements This research was partially supported bythe Office of Science (BER), U.S. Department of Energy, GrantNo. DE-IA02-00ER63021. Excellent technical support wasprovided by Steve Knapp, Devin Berry, Annette Fincher,Heather Hart, Shaheen Humayoun, Robert Martin, StanleyTesch, and Lori Thompson.
References
Buyer JS, Roberts DP, Russek-Cohen E (1999) Microbialcommunity structure and function in the spermosphere asaffected by soil and seed type. Can J Microbiol 45:138–144
Buyer JS, Roberts DP, Millner P, Russek-Cohen E (2001)Analysis of fungal communities by sole carbon sourceutilization profiles. J Microbiol Methods 45:53–60
Buyer JS, Roberts DP, Russek-Cohen E (2002) Soil and planteffects on microbial community structure. Can J Microbiol48:955–964
Buyer JS, Teasdale JR, Roberts DP, Zasada IA, Maul JE (2010)Factors affecting soil microbial community structure intomato cropping systems. Soil Biol Biochem 42:831–841
Cavigelli MA, Robertson GP, Klug MJ (1995) Fatty acidmethyl ester (FAME) profiles as measures of soilmicrobial community structure. Plant Soil 170:99–113
Cheplick GP, Clay K, Wray S (1989) Interactions betweenfungal endophyte infection and nutrient limitation in thegrasses Lolium perenne and Festuca arundinacea. NewPhytol 111:89–97
Clay K (1993) The ecology and evolution of endophytes. AgricEcosyst Environ 44:39–64
Clay K (1997) Consequences of endophyte-infected grasses onplant biodiversity. In: Bacon CW, Hill NS (eds) Neotypho-dium/grass interactions. Plenum, New York, pp 109–124
Franzluebbers AJ (2006) Short-term responses of soil C and Nfractions to tall fescue endophyte infection. Plant Soil282:153–164
Plant Soil (2011) 339:401–412 411

Franzluebbers AJ, Hill NS (2005) Soil carbon, nitrogen, andergot alkaloids with short- and long-term exposure toendophyte-infected and endophyte-free tall fescue. SoilSci Soc Am J 69:404–412
Franzluebbers AJ, Stuedemann JA (2005) Soil carbon andnitrogen pools in response to tall fescue endophyteinfection, fertilization, and cultivar. Soil Sci Soc Am J69:396–403
Franzluebbers AJ, Nazih N, Stuedemann JA, Fuhrmann JJ,Schomberg HH, Hartel PG (1999) Soil carbon andnitrogen pools under low- and high-endophyte-infectedtall fescue. Soil Sci Soc Am J 63:1687–1694
Franzluebbers AJ, Wright SF, Stuedemann JA (2000) Soilaggregation and glomalin under pastures in the SouthernPiedmont USA. Soil Sci Soc Am J 64:1018–1026
Garland JL (1996) Analytical approaches to the characterization ofsamples of microbial communities using patterns of potentialC source utilization. Soil Biol Biochem 28:213–221
Garland JL (1997) Analysis and interpretation of community-level physiological profiles in microbial ecology. FEMSMicrobiol Ecol 24:289–300
Garland JL, Mills AL (1991) Classification and characterizationof heterotrophic microbial communities on the basis ofpatterns of community-level sole-carbon-source utiliza-tion. Appl Environ Microbiol 57:2351–2359
Haack SK, Garchow H, Odelson DA, Forney LJ, Klug MJ(1994) Accuracy, reproducibility, and interpretation offatty acid methyl ester profiles of model bacterialcommunities. Appl Environ Microbiol 60:2483–2493
Handayani IP, Coyne MS, Phillips TD (2010) Soil organiccarbon fractions differ in two contrasting tall fescuesystems. Plant Soil. doi:1007/s11104-010-0352-z
Heuer H, Smalla K (1997) Evaluation of community-levelcatabolic profiling using BIOLOG GN microplates tostudy microbial community changes in potato phyllo-sphere. J Microbiol Methods 30:49–61
Hoveland CS (1993) Importance and economic significance ofthe Acremonium endophytes to performance of animalsand grass plant. Agric Ecosyst Environ 44:3–12
Jenkins MB, Franzluebbers AJ, Humayoun SB (2006) Assess-ing short-term responses of prokaryotic communities inbulk and rhizosphere soils to tall fescue endophyteinfection. Plant Soil 289:309–320
Konopka A, Oliver L, Turco RF (1998) The use of carbonsubstrate utilization patterns in environmental and ecolog-ical microbiology. Microb Ecol 35:103–115
Lemons A, Clay K, Rudgers JA (2005) Connecting plant-microbial interactions above and belowground: a fungalendophyte affects decomposition. Oecologia 145:595–604
Malinowski DP, Brauer DK, Belesky DP (1999) The endophyteNeotyphodium coenophialum affects root morphology oftall fescue grown under phosphorus deficiency. J AgronCrop Sci 183:53–60
Malinowski DP, Alloush GA, Belesky DP (2000) Leafendophyte Neotyphodium coenophialum modifies mineraluptake in tall fescue. Plant Soil 227:115–126
McMahon S, Williams MA, Bottomley PJ, Myrold DD (2005)Dynamics of microbial communities during decompositionof carbon-13 labeled ryegrass fractions in soil. Soil SciSoc Am J 69:1238–1247
Omacini M, Chaneton EJ, Ghersa CM, Otero P (2004) Do foliarendophytes affect grass litter decomposition? A microcosmapproach using Lolium multiflorum. Oikos 104:581–590
Petersen SO, Frohne PS, Kennedy AC (2002) Dynamics of asoil microbial community under spring wheat. Soil Sci SocAm J 66:826–833
Rillig MC (2004) Arbuscular mycorrhizae, glomalin, and soilaggregation. Can J Soil Sci 84:355–363
Rudgers JA, Clay K (2007) Endophyte symbiosis with tallfescue: How strong are the impacts on communities andecosystems? Fungal Biol Rev 21:107–124
Siegrist JA, McCulley RL, Bush LP, Phillips TD (2010) Alkaloidsmay not be responsible for endophyte-associated reductionsin tall fescue decomposition rates. Funct Ecol 24:460–468
Stuedemann JA, Hoveland CS (1988) Fescue endophyte: Historyand impact on animal agriculture. J Prod Agric 1:39–44
ter Braak CJF, Smilauer P (2002) CANOCO reference manualand CanoDraw for Windows user’s guide: software forcanonical community ordination (version 4.5). Microcom-puter Power, Ithaca, NY, USA, 500 pp
Treseder KK, Turner KM (2007) Glomalin in ecosystems. SoilSci Soc Am J 71:1257–1266
Wright SF, Franke-Snyder M, Morton JB, Upadhyaya A (1996)Time-course study and partial characterization of a proteinon hyphae of arbuscular mycorrhizal fungi during activecolonization of roots. Plant Soil 181:193–203
Wright SF, Nichols KA, Schmidt WF (2006) Comparison ofefficacy of three extractants to solubilize glomalin onhyphae and in soil. Chemosphere 64:1219–1224
Zak JC, Willig MR, Moorhead DL, Wildman HG (1994)Functional diversity of microbial communities: a quanti-tative approach. Soil Biol Biochem 26:1101–1108
412 Plant Soil (2011) 339:401–412