flood seasonality-based regionalization methods: a data-based comparison
TRANSCRIPT
HYDROLOGICAL PROCESSESHydrol. Process. 25, 3613–3624 (2011)Published online 11 April 2011 in Wiley Online Library(wileyonlinelibrary.com) DOI: 10.1002/hyp.8088
Flood seasonality-based regionalization methods:a data-based comparison
Ali Sarhadi1 and Reza Modarres2*1 Faculty of Natural Resources, Isfahan University of Technology, Isfahan, Iran
2 Institute national de la recherche scientifique, 490 rue de la couronne, Quebec, Canada
Abstract:
Improving techniques of flood frequency estimation at ungauged catchments is one of the major challenges for hydrologists,especially in arid and semi-arid regions with insufficient information. Recently, popularity of flood seasonality-based descriptorshas increased among hydrologists for delineating of hydrologically homogenous regions.
This study presents a data-based comparison of three well-known flood seasonality-based regionalization methods in Halilrudbasin in southeastern Iran. A Jack-knife procedure is used to assess the performance of the methods for flood quantile estimationat ungauged sites. The results of these three seasonality-based methods are compared to those results obtained from twoalternative methods: a traditional regionalization method based on catchment’s hydrogeomorphic characteristics similarity anda scenario that uses all available information without subdividing area.
The results indicate that although peak over threshold (POT) approach which uses all flood events during year leads tobetter performance than other methods, but applying POT data series in a specific season (critical season) based on POT-CSapproach leads to better homogenous region and improves flood quantile estimation at ungauged sites. Copyright 2011 JohnWiley & Sons, Ltd.
KEY WORDS seasonality-based regional flood frequency; peak over threshold method; Jack-knife; critical season
Received 18 May 2010; Accepted 8 March 2011
INTRODUCTION
Regional flood frequency analysis is a common methodused for reliable estimation of flood quantiles in therequired return period at the ungauged locations. Thisobjective comprises two main steps: (i) delineation ofhomogenous region and (ii) estimation of the regionalflood quantiles at different return periods for the regionof interest. The identification of homogenous regions is afundamental step in regional frequency analysis. Catch-ment grouping approaches based on geographic similarityand flood magnitude are common methods used for thedelineation of homogenous region (Mosley, 1981; Wilt-shire, 1985; Acreman and Sinclair, 1986; Chokmani andOuarda, 2004). However, an approach based on similarityin flood seasonality has been recently gaining increasedpopularity among hydrologists. In this seasonal regionalmethod, the delineation of homogenous regions is basedon the seasonal behaviour of flood flows in different sites(Ouarda et al., 1993; Burn, 1997; Cunderlik and Burn,2002; Cunderlik et al., 2004). The seasonal partitioningof flood events can help water resources manager to iden-tify the flood risk associated with seasonal behaviourof floods. The results of flood seasonality that lead tothe delineation of hydrologically homogenous regionscan also be used for separating mixed-distribution floods
* Correspondence to: Reza Modarres, Institute national de la recherchescientifique, 490 rue de la couronne, Quebec, Canada.E-mail: [email protected]
generated by different mechanisms and in other applica-tions in the field of water resources management such asreservoir management, flood forecasting and floodplainprotection (Ouarda et al., 2006).
During the last decade, several directional statistic-based methods have been proposed for flood seasonality-based regionalization (Magilligan and Graber, 1996;Cunderlik and Burn, 2002). The main advantage ofthese approaches is that flood seasonality is based ondate data which are particularly error-free and morerobust than methods based on flood magnitude data.The use of directional statistical methods for floodseasonality can be found in Bayliss and Jones (1993),Burn (1997), Castellarin et al. (2001), Cunderlik andBurn (2002) and Cunderlik et al. (2004). Ouarda et al.(2006) presented a data-based comparison of three floodseasonality regionalization methods by using a set ofcatchments in the province of Quebec (Canada). Theyused Jack-knife procedure to assess the performance ofthe methods in regional quantile estimation. Comprisingwith the results of traditional regionalization methods,the seasonality method based on the peak over threshold(POT) approach was concluded to have the best results.
Although the increasing interest in the use of flood sea-sonality for identifying homogenous hydrological regionsfor regional flood frequency, there is no study focussingon flood seasonality approaches in arid and semi-aridregions. The insufficient data for flood frequency analy-sis, complex physiographic characteristics; including highmountainous area and low flat plains in arid regions
Copyright 2011 John Wiley & Sons, Ltd.
3614 A. SARHADI AND R. MODARRES
in combination with irregular spatiotemporal pattern ofintense rainfall make it difficult to address the exactflood generating mechanisms in arid regions, especiallyfor flash floods. Regional flood frequency based on theseasonality approaches can help us to understand the roleof different factors on flash floods in these areas.
The aim of this study is to present a data-basedcomparison of three main approaches for describing floodseasonality to find the best flood regionalization methodin arid region with the problem of insufficient availabledata for better quantiles estimation at ungauged sites: themethod based on the relative frequencies (RFs) of floodoccurrence, the method based on directional statisticsand the method based on discrete seasonal POT model(POT-DS).
In the first part of this study, part A, homogenoushydrological regions with similar flood regime are identi-fied based on seasonality-based methods. In each region,
flood quantiles are estimated at all sites (treated con-secutively as ungauged sites) using a Jack-knife proce-dure. The performance results of quantile estimation atungauged sites are then compared for all the three meth-ods. The results are also compared with two alternativemethods: a traditional regionalization method based onsimilarity of hydrogeomorphic catchment characteristicsand the results of a scenario which assumes all regionsas a single region and all available information is usedin the regional analysis.
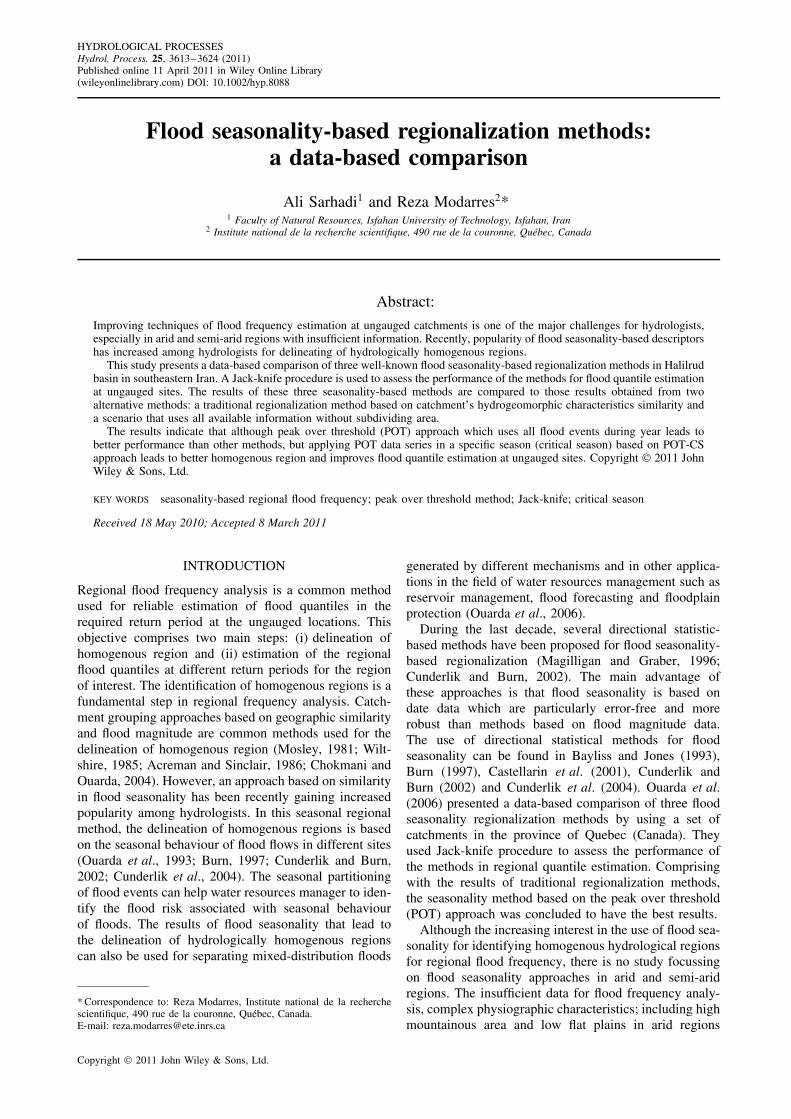
In the second part of this study, part B, better homoge-nous regions are tried to being identified and floodquantile estimation at ungauged sites based on ‘discretecritical season POT mode’ which uses only informationof exceedances in a specific season are improved. Finally,the results of two part A and B are compared and the bestregionalization method is introduced. Figure 1 shows abrief overview of the procedure of this study.
Introducing the best POT-based method fordelineation of homogeneous regions and flood
quantile estimation at ungauge basins
Comparison of the twomethods (A and B)
Regional quantile estimation at gauge basinsby multiple linear regressions
Selecting the robust method in floodquantile estimation for ungauge basin
Part A
Gathering dailystreamflow data
Approving independencyand homogeneity
Extraction of Hydro-Geomorphiccharacteristics of basins
Part B
Selection of the flood threshold criterion
Testing homogeneity of the region derivedfrom critical season
Discrimination of Critical seasons accordingto POT-CS method
Jack-knife resampling procedure forPerformance evaluation
Classification of basins by flood seasonalitytechniques (RF, XY, POT-DS) and
traditional regionalization method (PG)
Testing Homogeneity of derived regionsusing H measurement
Regional Quantile estimation by multiplelinear regressions for guaged basins
Performance evaluation by Jack-kniferesampling procedure among all techniques
Figure 1. Flowchart of the methodology
Copyright 2011 John Wiley & Sons, Ltd. Hydrol. Process. 25, 3613–3624 (2011)
SEASONALITY-BASED FLOOD REGIONALIZATION 3615
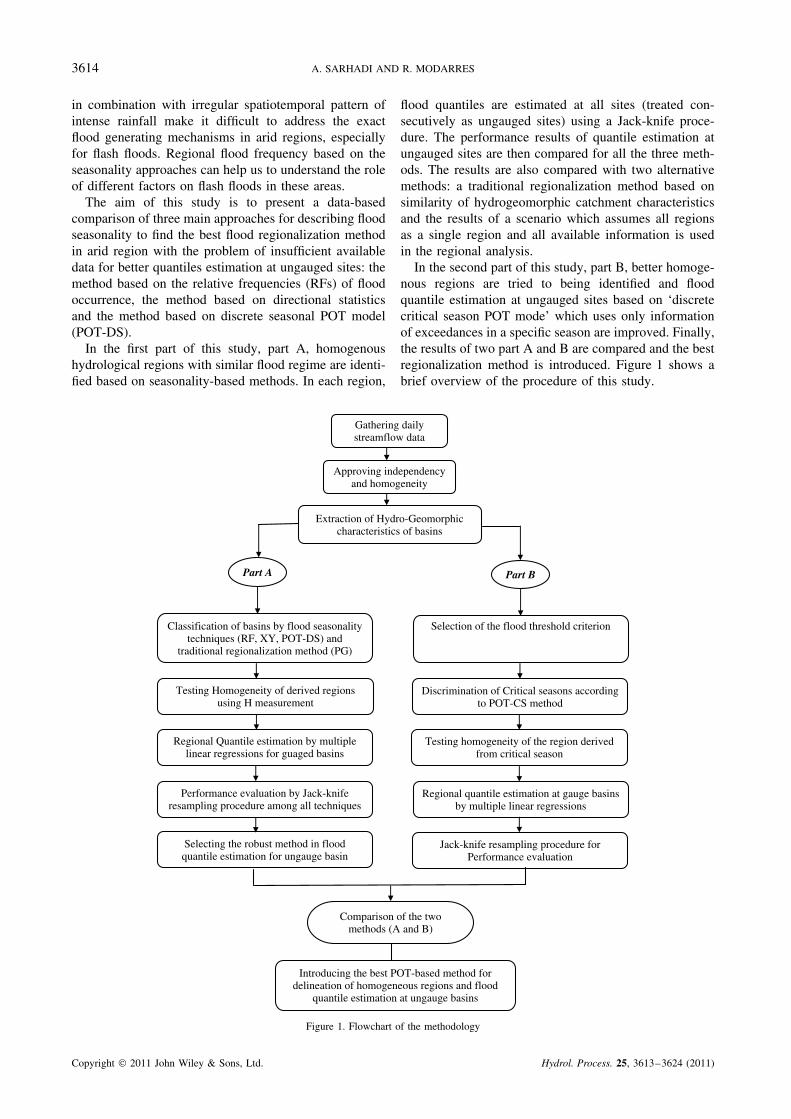
Figure 2. Location map of Halilrud basin with flow direction map and selected stations (diameter of the circles is proportional to catchment area)
STUDY AREA AND DATASET
In this study, Halilrud basin was selected as the studyarea. Located in the south of Kerman province in aridand semi-arid regions of Iran, Halilrud basin with thearea of 1Ð6 Mha, 250 mm annual rainfall and averageelevation of 1774 m is considered as one of the mostvulnerable watershed of southeast territory of Iran to flashflooding hazard. There are two permanent rivers in thisbasin which originate from upward mountains and tilt tothe flat area. Characterized by wide cross section and highflood magnitude in wet season, these rivers cause heavydamages to the population centres. As shown in Figure 2,high mountain ranges and abruptly slope changing in thefoot of mountains have made special hydrogeomorphicalcharacteristics for Halilrud basin as a vulnerable regionto the flooding hazard. These conditions accompaniedwith usual heavy storms of arid and semi-arid regionsincrease the risk of flood damages to residential andcommercial centres in the Halilrud basin. Therefore, it isimportant to estimate flood magnitude at ungauged sitesbased on identifying the seasonal distribution of flashfloods in hydrologically homogenous catchments, whichcan help decision makers and managers in an optimummanagement and for planning mitigation strategies tocope with the flood hazard.
In this study, daily streamflow of 15 stations acrossthe two main catchments of Halilrud basin (Halil andShur catchments) are used. The location of these stationshas been illustrated in Figure 2. The circle size presentsa scale for the area of each catchment. The length ofavailable data record is different, so that the shortestlength of data belongs to Kenaruieh station (15 years) andthe longest record belongs to Soltani station (36 years).The mean of record length for all stations is 22 years.
It is worth noting that short data record is a commonproblem in arid and semi-arid regions of the world andthis study aims to propose a methodology to find thebest flood regionalization method in arid regions with theproblem of insufficient available data for better quantileestimation.
The catchment properties were determined usingdigital elevation model of the basin. The followinghydrogeomorphic and climatic characteristics in eachsubcatchment were extracted using HEC-GEO HMSextension in Arc GIS 9Ð3 software. Land use character-istics are also extracted by ETMC images of Landsatsatellite taken in 2002 (Modarres and Sarhadi, 2010).The main variables used in this study for fitting regionalregression model are as follows:
ž Area, drainage area (km2)ž MAR, mean annual rainfall (mm)ž BS, basin slope (%)ž Dd, drainage density (km/km2)ž ME, mean elevation, maximum elevation and minimum
elevation (m)ž RS, river slope (%)ž BL, bare land (km2)ž BA, building area (km2)ž VC, vegetation cover (km2)
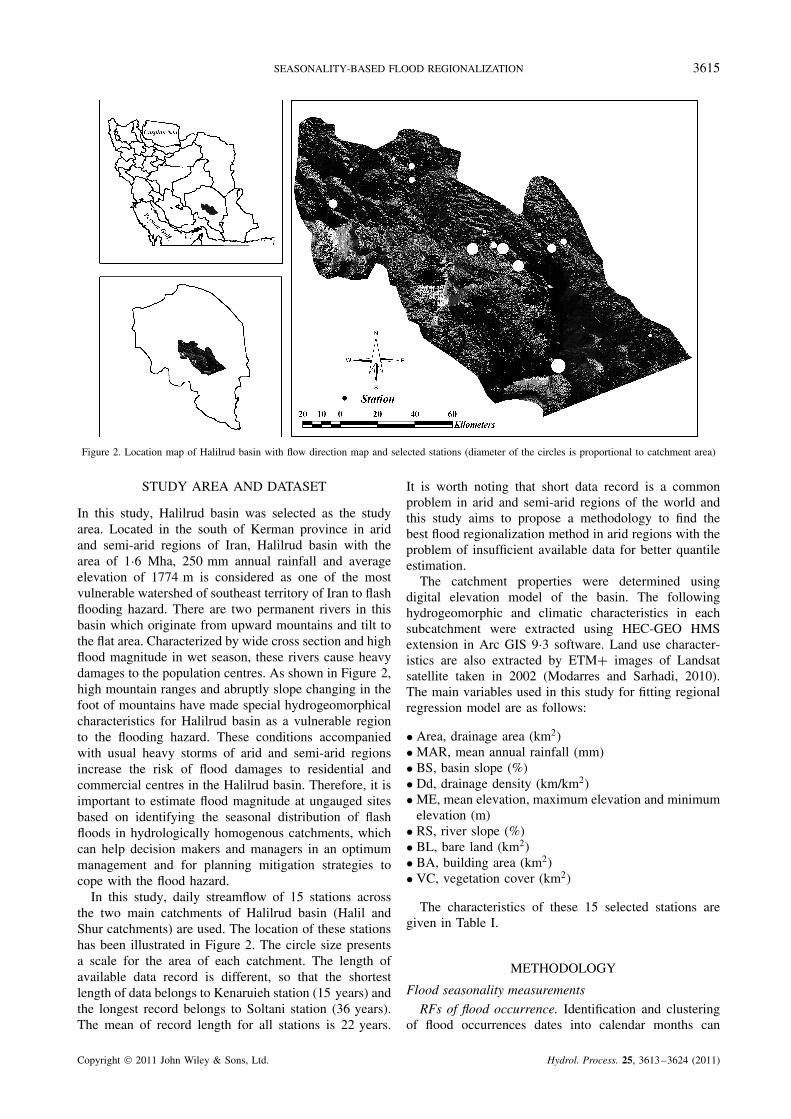
The characteristics of these 15 selected stations aregiven in Table I.
METHODOLOGY
Flood seasonality measurements
RFs of flood occurrence. Identification and clusteringof flood occurrences dates into calendar months can
Copyright 2011 John Wiley & Sons, Ltd. Hydrol. Process. 25, 3613–3624 (2011)
3616 A. SARHADI AND R. MODARRES
Table I. Characteristics of 15 selected basins at Halilrud basin
Stationname
Meanannualrainfall(mm)
Area(km2)
Basinslope(%)
Drainagedensity
(km/km2)
Minimumelevation
(m)
Maximumelevation
(m)
Meanelevation
(m)
Riverslope(%)
Bareland
(km2)
Urbanarea
(km2)
Vegetationcover(km2)
Aroos 293Ð08 292Ð73 32Ð0 0Ð74 1283Ð8 3586Ð9 2337Ð7 3Ð8 235Ð80 0Ð19 56Ð74Cheshme 320Ð28 76Ð42 29Ð9 0Ð98 2627Ð4 3386Ð7 2971Ð62 3Ð18 45Ð39 19Ð25 11Ð78Dehrood 284Ð41 1136Ð87 38Ð62 0Ð87 1158Ð2 3503Ð9 2155Ð19 2Ð2 742Ð15 57Ð4 337Ð32Hanjan 312Ð42 265Ð17 34Ð27 0Ð85 2330Ð0 3350Ð0 2784Ð9 2Ð44 177Ð10 78Ð35 9Ð72Hossienabad 288Ð44 8775Ð94 12Ð45 0Ð85 977Ð24 3586Ð9 2244Ð11 0Ð79 7142Ð51 1075Ð48 557Ð95Kahnak 273Ð99 14 181Ð12 12Ð45 0Ð91 530Ð0 3586Ð9 1925Ð28 0Ð63 10 350Ð87 2360Ð92 1469Ð33Kaldan 295Ð84 134Ð02 51Ð9 0Ð79 1620Ð0 3288Ð6 2420Ð3 4Ð71 79Ð66 1Ð25 53Ð11Kenarueih 290Ð55 7781Ð28 12Ð45 0Ð9 1420Ð0 3499Ð3 2294Ð8 0Ð7 6234Ð73 1074Ð92 471Ð63Meidan 309Ð68 554Ð94 34Ð27 0Ð87 2212Ð6 3386Ð7 2718Ð8 2Ð2 298Ð85 221Ð29 34Ð80Narab 289Ð81 8306Ð88 12Ð45 0Ð89 1160Ð0 3586Ð9 2278Ð24 0Ð64 6693Ð23 1075Ð11 538Ð54Polbaft 308Ð13 165Ð07 12Ð37 0Ð85 2475Ð2 2897Ð3 2680Ð9 1Ð63 129Ð50 22Ð98 12Ð59Ramoon 285Ð46 33Ð71 44Ð15 0Ð57 1637Ð3 2463Ð1 2186Ð68 5Ð79 30Ð98 0 2Ð73Soltani 300Ð49 853Ð52 12Ð45 0Ð9 2180Ð0 3090Ð6 2518Ð67 0Ð97 662Ð63 152Ð46 38Ð43Tighsiah 286Ð2 4Ð39 42Ð4 0Ð64 1829Ð6 2907Ð6 2134Ð3 4Ð1 3Ð64 0 0Ð75Zarrin 282Ð3 353Ð95 29Ð75 0Ð91 1461Ð8 3112Ð6 2095Ð4 2Ð81 216Ð18 54Ð39 83Ð38
represent detailed information about flood seasonality.This approach is usually used for each single month.In this method, dates of flood occurrences are groupedinto months and the RFs of flood occurrences arecalculated for every month. An adjustment must beaccompanied when converting time into angles. Mardia(1972) proposed a frequency-based method in which thefrequencies can be adjusted so that they correspond to360 days with all months having the same length and 1°
will correspond to 1 day. To achieve this, the observedfrequencies for months with 31 days are multiplied by30/31 and the frequency for February by 30/28 or by30/29 respectively for a normal or a leap year. Theyear is then reduced to 360 days but the sum (S) of theoriginal frequencies RFi does not equal the sum (S0) ofthe adjusted frequencies RFi
0. To preserve the sum S,the final adjusted frequencies are obtained by multiplyingRFi
0 by S/S0.
12∑iD1
RFi D12∑
iD1
RF0i
S
S0 �1�
Therefore, the use of this method can represent floodseasonality pattern and similarity between two sites basedon RF. The similarity of two catchments (Simi,j) is thenexpressed as the following (Cunderlik and Burn, 2002):
Simi,j D
√√√√√√12∑
kD1
�RFki � RFk
j�
12�2�
where RFki and RFk
j are the adjusted RFs of floodoccurrence at catchments i �j� for month k. This methodwill be hereafter abbreviated as the ‘RF’ method.
Directional statistics. In this approach, flood season-ality can be described by converting dates of floodoccurrences into a directional statistics (Fisher, 1993),
so that each of the individual dates of flood occurrencesis defined as a directional variable by converting Julianday (JDi) to an angular value (�i) using the followingequation:
�i D JDi2�
ND0 � �i � 2� �3�
where ND is the number of days in a year (ND D 365or 366 for a leap year and 1 January corresponds to day1). �i is the angular value representing the date of floodevent i (in radians). Therefore, a date of flood occurrencerepresents a vector with a unit magnitude and a directiongiven by �i. The mean direction, � (or the mean day offlood occurrences) MDF, is calculated by unit vectors:
� D tan�1(
y
x
)x 6D 0 MDF D �
ND
2��4�
where
x D 1
n
n∑iD1
cos��i� y D 1
n
n∑iD1
sin��i� �5�
and n is the number of samples for a given site, the meandirection (�) represents a directional location measure ofa sample consisting dates of flood occurrence.
A dimensionless dispersion measure of the individualdates of flood occurrence around mean value can also bedefined as a variable (Bayliss and Jones, 1993):
r D√
x2 C y2 0 � r � 1 �6�
The value of r close to 1 indicates that events in thesample are tightly grouped around the mean direction,whereas a value close to 0 indicates that variability inthe date of flood occurrence is very high.
The direction mean and the variance measure definedin a polar coordinates by � and r can be represented inCartesian coordinates by the average coordinates x andy. In this way, the coordinates can describe similarity
Copyright 2011 John Wiley & Sons, Ltd. Hydrol. Process. 25, 3613–3624 (2011)
SEASONALITY-BASED FLOOD REGIONALIZATION 3617
in flood seasonality at a given site and can be usedto measure similarity between sites by the Euclideandistance (Burn, 1997):
DiSi,j D√
�xi � xj�2 C �yi � yj�2 �7�
where xi and yi are the coordinates defined in theEquation (5).
The application of this method can be found inMagilligan and Graber (1996), Cunderlik and Burn(2002) and Ouarda et al. (2006). They concluded thatthis is an appropriate method for linking flood seasonalityand the influencing factors such as area and rainfall. Inthis study, this method will be hereafter called as ‘XY’method.
POT method. Three different ways can be considered toextract information from a flow records for regional floodfrequency analysis: (1) the annual maximum series (AM),(2) the partial duration series or POT and (3) the timeseries (TS) data. In the AM flow series, the maximumannual observation is only considered. However, the useof AM series may involve some loss of information. Forexample, the second or the third peak flood within a yearmay be ignored while they are greater than the maximumflow in other years. This problem is obviated in the POTmodels where all peaks above a certain base value areconsidered (Rao and Hamed, 2000).
In this study for regional flood frequency analysisbased on POT method, we use an approach which wasproposed by Ouarda et al. (1993):
�� D{
0; Q� � QB
Q� � QB; Q� ½ QB
}�8�
where QB is the base level, Q� the river flow at time ��
and �� the exceedance at time ��.To definite a truncation level for delineation of similar
flood seasonality based on POT method, we select thecarrying capacity of river channel as the threshold level.For the calculation of carrying capacity of a cross section,the HEC-GEO RAS program is applied on digital terrainmodel with 2 m resolution at each study site. Accuracyof extracted cross sections was then tested by channelsurveying.
In the ‘POT-DS model’, the year is divided into ‘n’seasons, where exceedances belong to the Kth season,K D 1, . . . , n, are taken to be identically distributed,regardless of their year of occurrence (Gupta et al., 1976;Ouarda et al., 1993, 2006). Hence with ‘n’ seasons,we obtain ‘n’ different distribution functions to fit tothe exceedances on record. The discrete seasonal modelmakes two assumptions concerning flood characteristics.The first assumption is that different storm types producedifferent flood characteristics from one season to another,and the second is that within each season, variationin flood magnitude are negligible (Ouarda et al., 1993,2006).
The POT-DS model consists of plotting the cumulativemean number of floods exceeding threshold, (t),
in a time interval (1, T) equal to 1 year, against thetime t, for each station, and for a truncation baselevel. Changing slope and piecewise linearity of the (t) plots indicate significant seasons for each station.Therefore, this graphical method can illustrate seasonalvariation of flood events and allows grouping sites intographical regions that are homogenous in seasonal flooddistribution. This method can also help to identifying aspecific season that includes significant flood events. Theapplication of this method can be found in Gupta et al.(1976), Ouarda et al. (1993) and Ouarda et al. (2006).This method will be hereafter referenced as POT-DSmethod.
Other reference methods
The results of the application of the RF, XY andPOT-DS methods are also compared to those obtainedfrom a traditional regionalization method which uses onlycatchment’s hydrogeomorphic characteristics similarityfor identification of homogeneous regions (no season-ality measures). This method provides a common basisto compare the performances of various seasonal-basedmethods (which follow the same general approach foridentifying homogenous regions) in flood quantile esti-mation at ungauged sites. This traditional regionalizationmethod which does not use seasonality measures will behereafter referenced as ‘PG’ method.
The results obtained by the three seasonality-basedmethods are also compared to the results from a scenariowhere the set of all sites without any restoring to thedelineation of homogenous regions is treated as oneregion, and all available information is used in the floodregionalization. The value of applying this method is thatto allow identifying the advantages of the subdivisionof study basin into homogenous regions according tovarious seasonality methods. In the remainder of thisstudy, this method is denoted as ‘ALL’ method.
Comparison methodology
In the POT-DS model, the identification of seasonallyhomogenous regions requires the evaluation of the graphsof exceedances plotted for each site in the region. Afterextraction of mean number of exceedances at each sta-tion, sites are grouped according to these characteristics(the mean number of flood events). The study region isthen subdivided into smaller subregions according to theduration and location of the flood events on a timescale.
To delineate homogenous regions according to floodseasonality-based methods of RF and XY, cluster analy-sis is also applied. The hierarchical approach is used forgrouping stations into similar regions based on 12 RFsof flood occurrences in RF method, (X, Y) of the meanvector r in XY method. This method is also applied fortraditional regionalization method based on catchmentshydrogeomorphic characteristics similarity. As the vari-ables have different units, it is necessary to normalize thedata set prior to cluster analysis.
Hierarchical clustering is a method for simultaneouslyinvestigating grouping in data over a variety of scales,
Copyright 2011 John Wiley & Sons, Ltd. Hydrol. Process. 25, 3613–3624 (2011)
3618 A. SARHADI AND R. MODARRES
by creating a cluster tree. The hierarchical clusteringtechnique that is used as a tool for the delineation ofhomogeneous regions in this study will be described inthe following Section on Cluster Analysis.
Cluster analysis. The aim of hydrologic variablesclustering is to group observations or variables intoclusters based on high similarity of hydrologic features,such as geographical, physical and statistical propertiesof observations. In this method, each cluster contains theleast variance of variables (the smallest dissimilarity). Inthis study, the hierarchical cluster technique (describedby Kaufman and Rousseuw, 1990) is applied in order toclassify catchments into similar regions. Several methodshave been proposed for hierarchical cluster analysis,including single, average and complete linkage, andWard’s minimum variance method. The last two methodsare widely used in different fields of hydroclimaticclassification (Nathan and McMahon, 1990 Jackson andWeinand, 1995; Ramos, 2001; Modarres and Sarhadi,2011). All above studies indicated that the Ward’s methodgives better results for classification than other methods.Therefore, Ward’s method is used for partitioning thedata into regions according to the similarity in floodseasonality achieved by methods of RF, XY and POT-DS,and traditional regionalization of PG method.
In Ward’s method, the distance between two clustersis calculated as the sum of squares between two clusters,added up over all variables. At each iteration, the sum ofsquares is minimized. If CK and CL are two clusters thatmerged to form the cluster CM, the distance between thenew cluster and another cluster CJ is
dJ.M D ��nJ C nK��dJK C �nJ C nL�dJL � nJdKL�
nJ C nM�9�
where nJ, nK, nL and nM are the number of the stationsin clusters J, K, L and M, respectively, and dJK, dJL anddKL represent the distances between the observations inthe clusters J and K, J and L and K and L, respectively.
After clustering of sites, due to regional flood fre-quency analysis requires to homogenous regions, toensure about homogeneity of clustered sites, heterogene-ity measures of L-moments approach are applied.
L-moments approach. The method of L-moments(Hosking and Wallis, 1997) is now a common androbust method for regional frequency analysis of dif-ferent hydrologic and climatic variables. For example,Kumar et al. (2003), Modarres (2008a,b) and Yurekliet al. (2009) have used L-moments method for flood, lowflow, wind speed and extreme rainfall, respectively.
L-moments are linear combinations of order statistics,which is used for summarizing theoretical distribution ofan observed sample of a random variable (X). Hoskingand Wallis (1997) defined L-moments as linear functionsof probability weighted moments (PWMs), which arerobust to outliers and virtually unbiased for small sample.Greenwood et al. (1979) defined PWMs as:
ˇr D E{
X[F�X�]r} �10�
where F�X� is the cumulative distribution function of X,and ˇr is the rth-order PWM. The first four L-momentsrelated to the PWMs are calculated as
1 D ˛0 D ˇ0 �11�
2 D ˛0 � 2˛1 D 2ˇ1 � ˇ0 �12�
3 D ˛0 � 6˛1 C 6˛2 D 6ˇ2 � 6ˇ1 C ˇ0 �13�
4 D ˛0 � 12˛1 C 30˛2 � 20˛3 D 20ˇ3 � 30ˇ2
C 12ˇ1 � ˇ0 �14�
In general:
rC1 D ��1�rr∑
kD0
pŁr,k˛k D
r∑kD0
pŁr,kˇk �15�
Different L-moment ratios can then be defined (Hosk-ing and Wallis, 1997). 1, is measure of central tendency,� D 1/2 is a measure of scale and dispersion (or the L-coefficient of variation, L-CV), the ratio 3/4 is referredto as �3 or the measure of skewness (L-coefficient ofskewness, L-CS), whereas the ratio 4/2 referred to as�4 is the measure of kurtosis (L-coefficient of kurtosis,L-CK).
Hosking and Wallis (1997) also derived three use-ful statistics for (i) estimation of the degree of homo-geneity of a group of sites (Heterogeneity measurement,Hi), (ii) determination of an unusual site in a group(Discordancy measurement, Di) and (iii) identification ofregional distribution function (ZDIST). In this study, weapply the first two statistics to test the homogeneity ofthe groups identified by cluster analysis of different floodseasonality indices and to find the discordant station(s)within each group.
For the sake of brevity, the detailed information andformulas of L-moments and the statistics are not givenin this article and the reader is referred to Hosking andWallis (1997) for more details.
Flood estimation at gauged sites
For at-site flood quantile estimation, different fre-quency distributions are fitted to flood data, and theparameters of the distribution are estimated by maximumlikelihood method. The best at-site frequency distributionfor flood data can be assessed by least-square error. Theroot mean square error (RMSE) is used as a measure ofgoodness-of-fit test for each single distribution fitted toflood data series derived from various methods.
Model performance for flood estimation at ungaugedsites
When no discharge record exists at site of interest, aregional regression model can be used to estimate stream-flow statistics at the ungauged sites. Therefore, using aregion of gauged river sites, this method (multivariateregression analysis) requires relationship between floodquantiles at different probabilistic levels (specific returnperiods) and hydrogeomorphic characteristics to be devel-oped. Performance evaluation of different models for
Copyright 2011 John Wiley & Sons, Ltd. Hydrol. Process. 25, 3613–3624 (2011)
SEASONALITY-BASED FLOOD REGIONALIZATION 3619
quantile estimation at ungauged sites is done based onJack-knife resampled multiple linear regression (MLR).The primary advantage of Jack-knife resampling is thatthe goodness-of-fit statistics are based on the predictionsfrom data that are independent of the calibration data.Thus, they more likely indicate the accuracy of futureprediction than the statistics based on calibration of alldata set and the main advantage is that the methodologyis easy to apply.
An MLR model between at-site flood quantiles andbasin characteristics is first developed in each homo-geneous region identified by each seasonality method.To evaluate the flood estimation accuracy at ungaugedbasins, the Jack-knife procedure is used. In other words,in each region, a site is considered as an ungauged targetsite and is removed from the data base. All remain-ing sites are then used to build a multiple regressionmodel for the estimation of flood quantiles correspond-ing to different return periods at the removed target site.Final estimation of quantiles is then obtained in each tar-get basin using the selected seasonality-based approachfor determination of homogenous regions coupled with amultiple regression estimation procedure.
The following relative performance measures, theBIAST and the RMSET, are calculated for each region-alization methods:
BIAST�%� D 1
N
N∑iD1
( OQiT � Qi
T
QiT
)ð 100 �16�
RMSET�%� D√√√√ 1
N
N∑iD1
( OQiT � Qi
T
QiT
)2
ð 100 �17�
where OQiT is the estimated T-year quantile at a site i
which has been removed from the regional regressionmodel and considered as an ungauged site, Qi
T is theestimated quantile at site i from frequency distributionfunction and N is the number of sites in the region.
RESULTS
Part A
Identification of flood groups. After approving inde-pendency and homogeneity of all streamflow data withWald–Wolfowitz and Wilcoxon methods, flood sea-sonality of daily streamflow was accomplished usingregionalization methods described in the Section onMethodology.
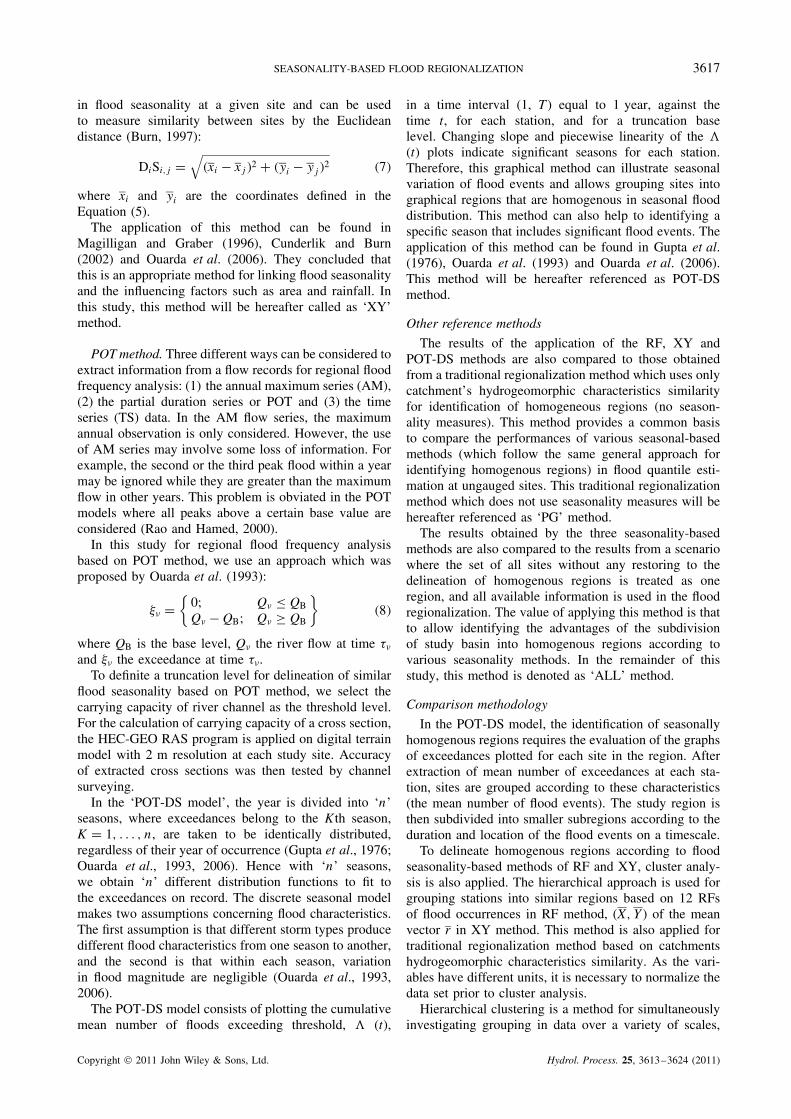
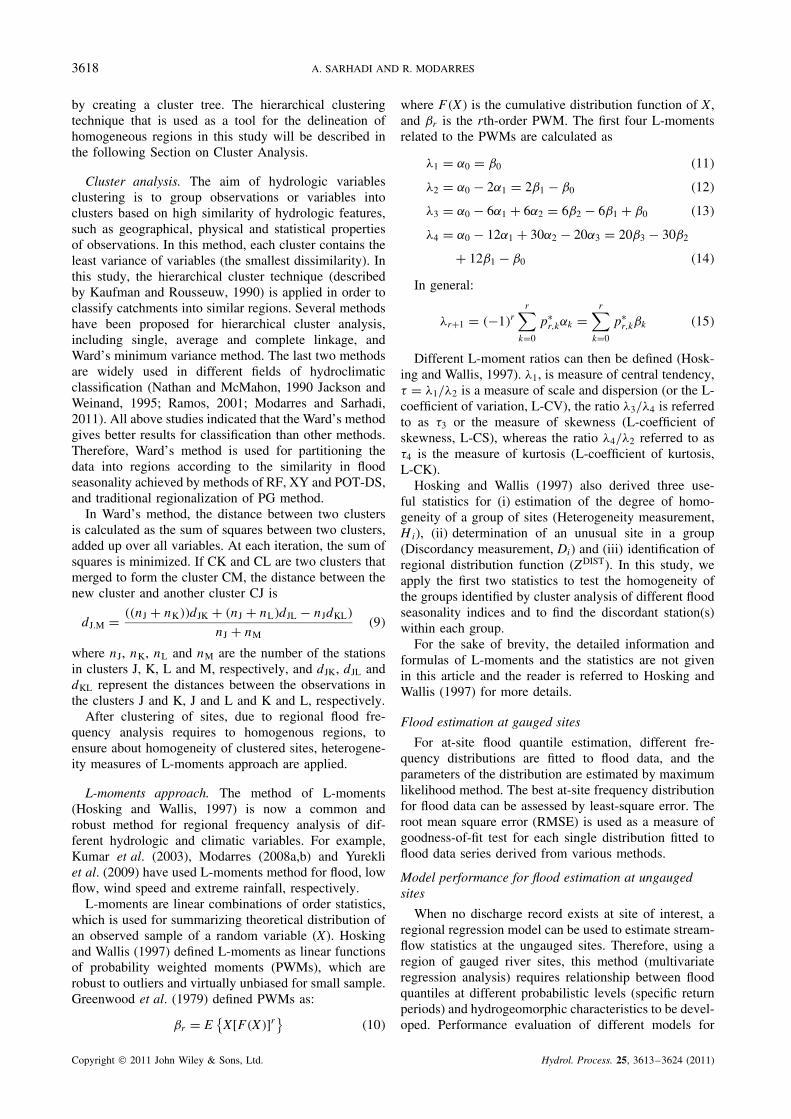
A rose diagram depicting the RFs of flood occurrencesusing RF method in Soltani station is presented inFigure 3. Figure 4 shows the flood seasonality at thisstation using directional method (XY). The location ofsite in polar location–variance coordinates is shownusing the mean day of flood occurrence (day 302) and theflood variability measure r D 0Ð83. For POT-DS method,after calculating of the truncation level according tostream carrying capacity at the location of each station,
Figure 3. Flood seasonality of Soltani station according to the RF method
Figure 4. Flood seasonality of Soltani station according to the XY method
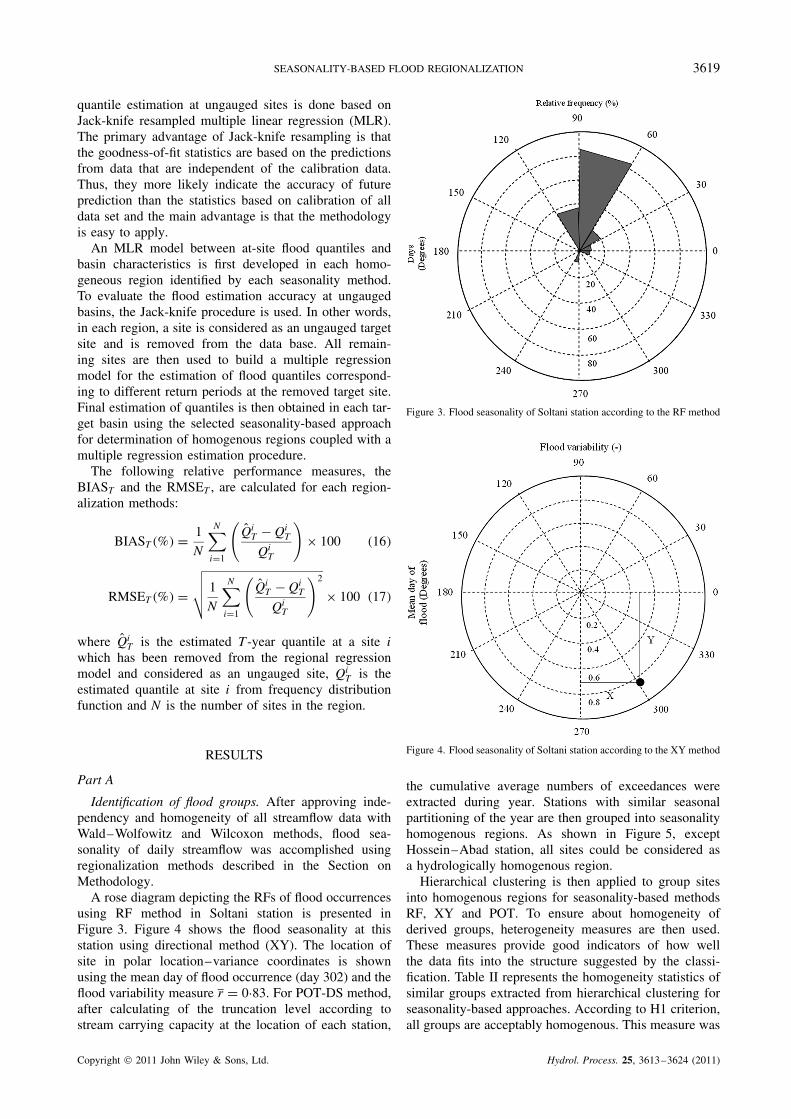
the cumulative average numbers of exceedances wereextracted during year. Stations with similar seasonalpartitioning of the year are then grouped into seasonalityhomogenous regions. As shown in Figure 5, exceptHossein–Abad station, all sites could be considered asa hydrologically homogenous region.
Hierarchical clustering is then applied to group sitesinto homogenous regions for seasonality-based methodsRF, XY and POT. To ensure about homogeneity ofderived groups, heterogeneity measures are then used.These measures provide good indicators of how wellthe data fits into the structure suggested by the classi-fication. Table II represents the homogeneity statistics ofsimilar groups extracted from hierarchical clustering forseasonality-based approaches. According to H1 criterion,all groups are acceptably homogenous. This measure was
Copyright 2011 John Wiley & Sons, Ltd. Hydrol. Process. 25, 3613–3624 (2011)
3620 A. SARHADI AND R. MODARRES
Figure 5. Flood seasonality at each station according to the POT-DS method
Table II. Homogeneity measures (Hi) of derived groups accord-ing to various regionalization methods
Methods Regions Number of stations H1 H2 H3
RF G1 13 0Ð27 �0Ð24 �0Ð81G2 2 1Ð05 1Ð66 1Ð95
XY G1 11 0Ð94 0Ð82 0Ð67G2 2 −1Ð07 �1Ð52 �1Ð52G3 2 −0Ð73 �1Ð27 �1Ð11
POT-DS G1 14 0Ð25 0Ð16 �0Ð72G2 1 — — —
PG G1 12 0Ð69 0Ð35 �0Ð17G2 3 1Ð54 0Ð96 0Ð59
ALL G1 15 1Ð90 0Ð75 �0Ð04
also calculated for two alternatives of traditional regional-ization methods based on basin hydrogeomorphic similar-ity (PG) and the scenario where all available informationis used for regional analysis (ALL).
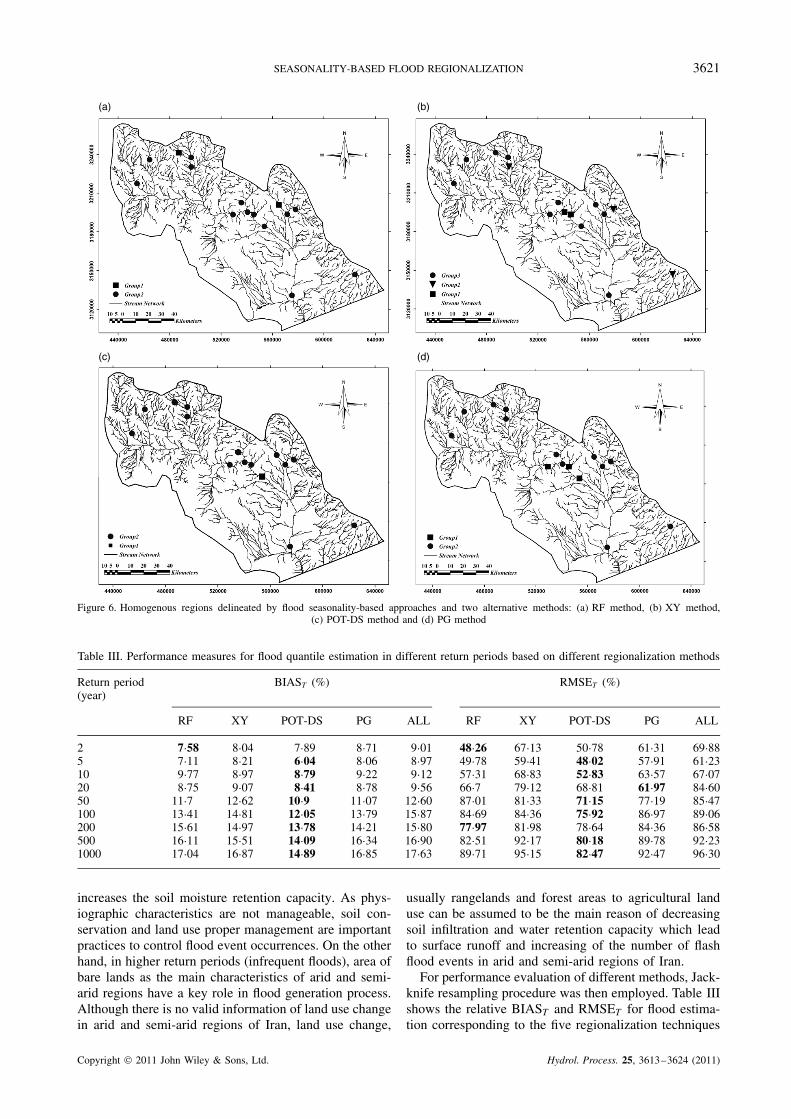
Figure 6 shows the spatial pattern of the regions ofsimilar flood seasonality which are delineated based onthe RF, XY, POT methods and two alternative methods(PG and ALL). Figure 6 reveals that except XY methodwhich divides study area into three regions, the restof seasonality-based approaches show two homogenousregions. This figure also exhibits that except PG method,the regions delineated with seasonality-based method RF,XY and POT cover approximately the same geographicareas.
Model evaluation for flood estimation at ungaugedbasins. After identification of homogenous regions byvarious techniques, we applied Jack-knife MLR
procedure for regional flood estimations. After remov-ing one gauged site from the region, considered asan ungauged site, at-site flood quantiles are used asdependent variables and the physiographic and climaticcharacteristics are used as independent variables in a step-wise multiple regression procedure. For flood quantiles atreturn periods of 2, 5, 10 and 20 years, the maximum ele-vation (max elv.) and vegetation cover (VC) remain inmodels. The MLR models are defined as
QT D a0 C a1 �VC� C a2 �max elv.� �18�
For higher return periods, 50, 100, 200, 500 and1000 years, the area (A) and the barelands enter to theregression models. The following equations representregression models for these return periods:
Log�QT� D a0 C a1 �A�
Log�QT� D a0 C a1 �barelands� �19�
where QT is the flood at the return period T, and a0
and a1 are regression coefficients. In the above models,the coefficient of determination (R2) is higher than 0Ð90.This indicates that the relation between flood quantilesin different return periods and watershed properties isclearly significant and the current regression models arevalid for prediction of flood quantiles at ungauged basins.
The regression models show that land use character-istics and sever topography are dominant factors con-trolling frequent floods, because catchment’s topographycharacteristics forming hydraulic head difference allowssurface water to flow to the main channel, and vegeta-tion cover controls the infiltration of surface water and
Copyright 2011 John Wiley & Sons, Ltd. Hydrol. Process. 25, 3613–3624 (2011)
SEASONALITY-BASED FLOOD REGIONALIZATION 3621
(a) (b)
(c) (d)
Figure 6. Homogenous regions delineated by flood seasonality-based approaches and two alternative methods: (a) RF method, (b) XY method,(c) POT-DS method and (d) PG method
Table III. Performance measures for flood quantile estimation in different return periods based on different regionalization methods
Return period(year)
BIAST (%) RMSET (%)
RF XY POT-DS PG ALL RF XY POT-DS PG ALL
2 7Ð58 8Ð04 7Ð89 8Ð71 9Ð01 48Ð26 67Ð13 50Ð78 61Ð31 69Ð885 7Ð11 8Ð21 6Ð04 8Ð06 8Ð97 49Ð78 59Ð41 48Ð02 57Ð91 61Ð2310 9Ð77 8Ð97 8Ð79 9Ð22 9Ð12 57Ð31 68Ð83 52Ð83 63Ð57 67Ð0720 8Ð75 9Ð07 8Ð41 8Ð78 9Ð56 66Ð7 79Ð12 68Ð81 61Ð97 84Ð6050 11Ð7 12Ð62 10Ð9 11Ð07 12Ð60 87Ð01 81Ð33 71Ð15 77Ð19 85Ð47100 13Ð41 14Ð81 12Ð05 13Ð79 15Ð87 84Ð69 84Ð36 75Ð92 86Ð97 89Ð06200 15Ð61 14Ð97 13Ð78 14Ð21 15Ð80 77Ð97 81Ð98 78Ð64 84Ð36 86Ð58500 16Ð11 15Ð51 14Ð09 16Ð34 16Ð90 82Ð51 92Ð17 80Ð18 89Ð78 92Ð231000 17Ð04 16Ð87 14Ð89 16Ð85 17Ð63 89Ð71 95Ð15 82Ð47 92Ð47 96Ð30
increases the soil moisture retention capacity. As phys-iographic characteristics are not manageable, soil con-servation and land use proper management are importantpractices to control flood event occurrences. On the otherhand, in higher return periods (infrequent floods), area ofbare lands as the main characteristics of arid and semi-arid regions have a key role in flood generation process.Although there is no valid information of land use changein arid and semi-arid regions of Iran, land use change,
usually rangelands and forest areas to agricultural landuse can be assumed to be the main reason of decreasingsoil infiltration and water retention capacity which leadto surface runoff and increasing of the number of flashflood events in arid and semi-arid regions of Iran.
For performance evaluation of different methods, Jack-knife resampling procedure was then employed. Table IIIshows the relative BIAST and RMSET for flood estima-tion corresponding to the five regionalization techniques
Copyright 2011 John Wiley & Sons, Ltd. Hydrol. Process. 25, 3613–3624 (2011)
3622 A. SARHADI AND R. MODARRES
in different return periods. These results indicate that inmost of the return periods, the POT-DS approach allo-cates the lowest RMSET values. Therefore, we can con-clude that this method shows a significant improvementin quantile estimation at ungauged basins.
Now the question is that if we can improve floodquantile estimation at ungauged sites without losing theinformation of sites? In other words, is this possible todelineate more homogenous region than the best selectedseasonality-based approach in part A? To answer thesequestions, we applied a discrete critical season POTmodel (POT-CS) in part B.
Part B
POT-CS approach. POT-CS approach is the same asthe POT-DS in identification of flood seasons method,with this difference that POT-CS method considers onlymean number of exceedances in a specific season fordelineation of homogenous regions in return of allexceedances during year. Characterizing by the slopes ofthe exceedances plots, this season is included the mostof significant flood events. For this reason, we named itas ‘critical season’.
To execute POT-CS, the POT-DS method which isdescribed in the part A is applied. As shown in Figure 5,the graphs present mean number of exceedances plottedfor each sites according to truncation levels in POT-DSmethod. The behaviour of (t) based on the slopes ofthese exceedances plots indicates the numbers and thestarting and ending dates of seasons. POT-DS identifiesthree distinct seasons of flood occurences in the studyarea. Season I from day 266 to day 345, season IIfrom 345 to 102 and season III from 102 to 265. Sincethe slopes of exceedances plots is changed in seasonII (with piecewise increasing linearity), this season isdistinguished as critical season. The flood information ofall sites during this season is then separated from dataset.The homogeneity of these flood TS is then checked withthe heterogeneity measures of L-moments approach.
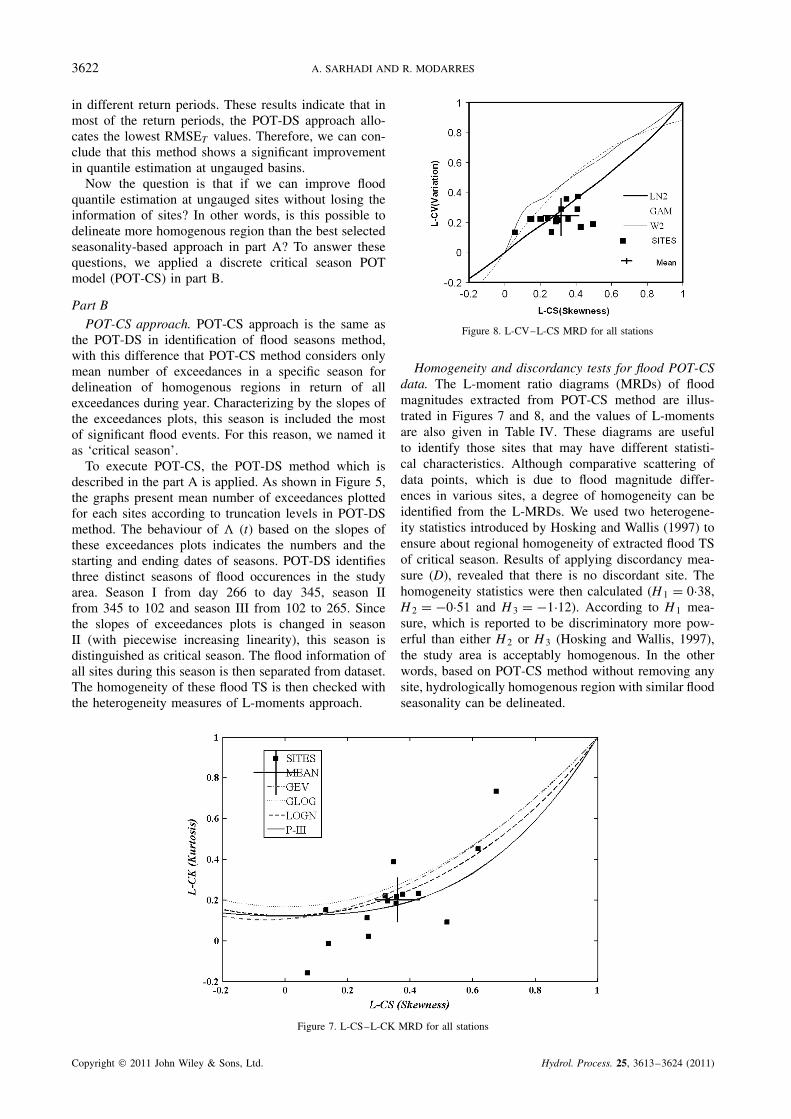
Figure 8. L-CV–L-CS MRD for all stations
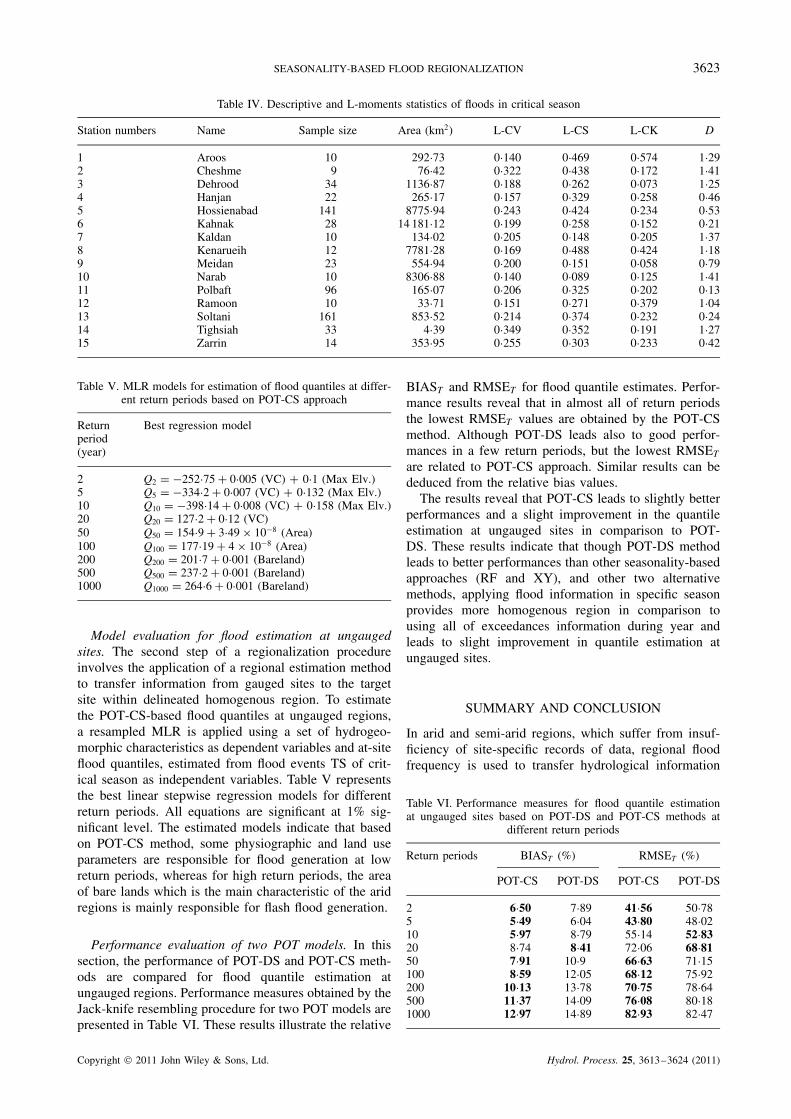
Homogeneity and discordancy tests for flood POT-CSdata. The L-moment ratio diagrams (MRDs) of floodmagnitudes extracted from POT-CS method are illus-trated in Figures 7 and 8, and the values of L-momentsare also given in Table IV. These diagrams are usefulto identify those sites that may have different statisti-cal characteristics. Although comparative scattering ofdata points, which is due to flood magnitude differ-ences in various sites, a degree of homogeneity can beidentified from the L-MRDs. We used two heterogene-ity statistics introduced by Hosking and Wallis (1997) toensure about regional homogeneity of extracted flood TSof critical season. Results of applying discordancy mea-sure (D), revealed that there is no discordant site. Thehomogeneity statistics were then calculated (H1 D 0Ð38,H2 D �0Ð51 and H3 D �1Ð12). According to H1 mea-sure, which is reported to be discriminatory more pow-erful than either H2 or H3 (Hosking and Wallis, 1997),the study area is acceptably homogenous. In the otherwords, based on POT-CS method without removing anysite, hydrologically homogenous region with similar floodseasonality can be delineated.
Figure 7. L-CS–L-CK MRD for all stations
Copyright 2011 John Wiley & Sons, Ltd. Hydrol. Process. 25, 3613–3624 (2011)
SEASONALITY-BASED FLOOD REGIONALIZATION 3623
Table IV. Descriptive and L-moments statistics of floods in critical season
Station numbers Name Sample size Area (km2) L-CV L-CS L-CK D
1 Aroos 10 292Ð73 0Ð140 0Ð469 0Ð574 1Ð292 Cheshme 9 76Ð42 0Ð322 0Ð438 0Ð172 1Ð413 Dehrood 34 1136Ð87 0Ð188 0Ð262 0Ð073 1Ð254 Hanjan 22 265Ð17 0Ð157 0Ð329 0Ð258 0Ð465 Hossienabad 141 8775Ð94 0Ð243 0Ð424 0Ð234 0Ð536 Kahnak 28 14 181Ð12 0Ð199 0Ð258 0Ð152 0Ð217 Kaldan 10 134Ð02 0Ð205 0Ð148 0Ð205 1Ð378 Kenarueih 12 7781Ð28 0Ð169 0Ð488 0Ð424 1Ð189 Meidan 23 554Ð94 0Ð200 0Ð151 0Ð058 0Ð7910 Narab 10 8306Ð88 0Ð140 0Ð089 0Ð125 1Ð4111 Polbaft 96 165Ð07 0Ð206 0Ð325 0Ð202 0Ð1312 Ramoon 10 33Ð71 0Ð151 0Ð271 0Ð379 1Ð0413 Soltani 161 853Ð52 0Ð214 0Ð374 0Ð232 0Ð2414 Tighsiah 33 4Ð39 0Ð349 0Ð352 0Ð191 1Ð2715 Zarrin 14 353Ð95 0Ð255 0Ð303 0Ð233 0Ð42
Table V. MLR models for estimation of flood quantiles at differ-ent return periods based on POT-CS approach
Returnperiod(year)
Best regression model
2 Q2 D �252Ð75 C 0Ð005 (VC) C 0Ð1 (Max Elv.)5 Q5 D �334Ð2 C 0Ð007 (VC) C 0Ð132 (Max Elv.)10 Q10 D �398Ð14 C 0Ð008 (VC) C 0Ð158 (Max Elv.)20 Q20 D 127Ð2 C 0Ð12 (VC)50 Q50 D 154Ð9 C 3Ð49 ð 10�8 (Area)100 Q100 D 177Ð19 C 4 ð 10�8 (Area)200 Q200 D 201Ð7 C 0Ð001 (Bareland)500 Q500 D 237Ð2 C 0Ð001 (Bareland)1000 Q1000 D 264Ð6 C 0Ð001 (Bareland)
Model evaluation for flood estimation at ungaugedsites. The second step of a regionalization procedureinvolves the application of a regional estimation methodto transfer information from gauged sites to the targetsite within delineated homogenous region. To estimatethe POT-CS-based flood quantiles at ungauged regions,a resampled MLR is applied using a set of hydrogeo-morphic characteristics as dependent variables and at-siteflood quantiles, estimated from flood events TS of crit-ical season as independent variables. Table V representsthe best linear stepwise regression models for differentreturn periods. All equations are significant at 1% sig-nificant level. The estimated models indicate that basedon POT-CS method, some physiographic and land useparameters are responsible for flood generation at lowreturn periods, whereas for high return periods, the areaof bare lands which is the main characteristic of the aridregions is mainly responsible for flash flood generation.
Performance evaluation of two POT models. In thissection, the performance of POT-DS and POT-CS meth-ods are compared for flood quantile estimation atungauged regions. Performance measures obtained by theJack-knife resembling procedure for two POT models arepresented in Table VI. These results illustrate the relative
BIAST and RMSET for flood quantile estimates. Perfor-mance results reveal that in almost all of return periodsthe lowest RMSET values are obtained by the POT-CSmethod. Although POT-DS leads also to good perfor-mances in a few return periods, but the lowest RMSET
are related to POT-CS approach. Similar results can bededuced from the relative bias values.
The results reveal that POT-CS leads to slightly betterperformances and a slight improvement in the quantileestimation at ungauged sites in comparison to POT-DS. These results indicate that though POT-DS methodleads to better performances than other seasonality-basedapproaches (RF and XY), and other two alternativemethods, applying flood information in specific seasonprovides more homogenous region in comparison tousing all of exceedances information during year andleads to slight improvement in quantile estimation atungauged sites.
SUMMARY AND CONCLUSION
In arid and semi-arid regions, which suffer from insuf-ficiency of site-specific records of data, regional floodfrequency is used to transfer hydrological information
Table VI. Performance measures for flood quantile estimationat ungauged sites based on POT-DS and POT-CS methods at
different return periods
Return periods BIAST (%) RMSET (%)
POT-CS POT-DS POT-CS POT-DS
2 6Ð50 7Ð89 41Ð56 50Ð785 5Ð49 6Ð04 43Ð80 48Ð0210 5Ð97 8Ð79 55Ð14 52Ð8320 8Ð74 8Ð41 72Ð06 68Ð8150 7Ð91 10Ð9 66Ð63 71Ð15100 8Ð59 12Ð05 68Ð12 75Ð92200 10Ð13 13Ð78 70Ð75 78Ð64500 11Ð37 14Ð09 76Ð08 80Ð181000 12Ð97 14Ð89 82Ð93 82Ð47
Copyright 2011 John Wiley & Sons, Ltd. Hydrol. Process. 25, 3613–3624 (2011)
3624 A. SARHADI AND R. MODARRES
from gauged site to the site of interest. The funda-mental step in regional estimation approach is delin-eation of hydrologically homogenous regions. In thisstudy, in order to find the best method for delineationa homogenous region based on flood seasonality, in partA, three flood seasonality-based regionalization methodswere applied: the method based on the relative frequen-cies of flood occurrences (RF), the method based ondirectional statistics (XY) and a graphical approach basedon POT-DS model. The results of these three meth-ods were also compared to results of two alternativemethods: a traditional regionalization method based oncatchment’s hydrogeomorphic characteristics similarity(PG) and a scenario which uses all available informa-tion without subdividing the area into homogenous region(ALL).
The results of Jack-knife resampling procedure wereused to compare the general performances of studymethods. The relative bias and the RMSE of floodquantiles in different return periods show that POT-DSmethod based on the use of POT data leads to a betterperformance than other seasonality-based approaches(RF and XY). POT-DS method also leads to slightimprovement in quantile estimation in comparison to PGmethod which is based on catchment’s hydrogeomorphicsimilarity (no seasonality measures). The approach thatuses all available information without restoring areato homogenous regions leads to poor performances. Inpart B, to delineate better homogenous region and toimprove flood quantile estimation at ungauged sites,we applied POT-CS model that uses only informationof exceedances in a specific season. The performanceevaluation of results of POT-CS method in critical seasonshows slight improvement in flood quantile estimationat ungauged sites in comparison to POT-DS methodthat uses all exceedances information during year. Theseresults indicate that POT-CS that uses flow peaks abovea certain base truncation in a specific season capturesmore information about flood seasonality than otherapproaches, and without removing any site, this methodleads to delineation of better homogenous region forregional flood frequency analysis.
The results of this study confirm the study of Ouardaet al. (2006) that compared three seasonality-based meth-ods in Quebec, Canada, but there is no published rationalcomparison of the same approaches in arid and semi-arid regions area available prior to this study. There-fore, the generality of the finding of this study needsto be tested in other arid and semi-arid regions of theworld. The methodology of this study can also be directedtowards the application of seasonality-based techniquesespecially POT-CS approach for the regionalization ofother hydrologic variables such as precipitation or sedi-ment loads.
REFERENCES
Acreman MC, Sinclair CD. 1986. Classification of drainage basinsaccording to their physical characteristics; an application for floodfrequency analysis in Scotland. Journal of Hydrology 84: 365–380.
Bayliss AC, Jones RC. 1993. Peaks-over-threshold flood database:summary statistics and seasonality. Report No. 121. Institute ofHydrology: Wallingford; 61 pp.
Burn DH. 1997. Catchment similarity for regional flood frequencyanalysis using seasonality measures. Journal of Hydrology 202:212–230.
Castellarin A, Burn DH, Brath A. 2001. Assessing the effectiveness ofhydrological similarity measures for flood frequency analysis. Journalof Hydrology 241: 270–285.
Chokmani K, Ouarda TBMJ. 2004. Physiographical space based krigingfor regional flood frequency estimation at ungauged sites. WaterResources Research 40: W12514. DOI: 10.1029/2003WR002983.
Cunderlik JM, Burn DH. 2002. Analysis of the linkage between rain andflood regime and its application to regional flood frequency estimation.Journal of Hydrology 261: 115–131.
Cunderlik JM, Ouarda TBMJ, Bobee B. 2004. On the objectiveidentification of flood seasons. Water Resources Research 40: W01520.DOI: 10.1029/2003WR002295.
Fisher NI. 1993. Statistical Analysis of Circular Data . CambridgeUniversity Press: Cambridge; 277 pp.
Greenwood JA, Landwahr JM, Matalas NC, Wallis JR. 1979. Probabilityweighted moments: definition and relation to parameters of severaldistributions expressible in inverse form. Water Resources Research15: 1049–1054.
Gupta VK, Duckstein L, Peebles RW. 1976. On the joint distribution ofthe largest flood and its time of occurrence. Water Resources Research12: 295–304.
Hosking JRM, Wallis JR. 1997. Regional Frequency Analysis, anApproach Based on L-Moments . Cambridge University Press: UK; 224pp.
Jackson IJ, Weinand H. 1995. Classification of tropical rainfall stations:a comparison of clustering techniques. International Journal ofClimatology 15: 985–994.
Kaufman L, Rousseuw PJ. 1990. Finding Groups in Data: an Introductionto Cluster Analysis . Wiley: New York; 344 pp.
Kumar R, Chatterjee C, Kumar S, Lohani AK, Singh RD. 2003.Development of regional flood frequency relationships using L-moments for Middle Ganga Plains Subzone 1(f) of India. WaterResources Management 17: 243–257.
Magilligan FJ, Graber BE. 1996. Hydroclimatological and geomorphiccontrols on the timing and spatial variability of floods in New England,USA. Journal of Hydrology 178: 159–180.
Mardia KV. 1972. Statistics of Directional Data . Academic Press:London, UK.
Mosley MP. 1981. Delimitation of New Zealand hydrologic regions.Journal of Hydrology 49: 173–192.
Modarres R, Sarhadi A. 2011. Statistically-based Regionalization ofRainfall climates of Iran. Global and Planetary Change 75: 65–75.
Modarres R. 2008a. Regional frequency distribution type of low flowin North of Iran by L-moments. Water Resources Management 22:823–841.
Modarres R. 2008b. Regional extreme wind speed frequency analysis forarid and semi arid region of Iran. Journal of Arid Environment 72:1329–1342.
Modarres R, Sarhadi A. 2010. Frequency distribution of extremehydrologic drought of Southeastern semi-arid region Iran. Journal ofHydrologic Engineering 15: 255–264.
Nathan RJ, McMahon TA. 1990. Identification of homogeneous regionsfor the purpose of regionalization. Journal of Hydrology 121: 217–238.
Ouarda TBMJ, Ashkar F, El-Jabi N. 1993. Peaks over threshold modelfor seasonal flood variations. In: Engineering Hydrology , Kuo CY (ed),ASCE Publications: New York, USA; 341–346.
Ouarda TBMJ, Cunderlik JM, St-Hilaire A, Barbet M, Bruneau P,Bobee B. 2006. Data-based comparison of seasonality-based regionalflood frequency methods. Journal of Hydrology 330: 329–339.
Ramos MC. 2001. Divisive and hierarchical clustering techniques toanalyze variability of rainfall distribution patterns in a Mediterraneanregion. Journal of Hydrology 57: 123–138.
Rao AR, Hamed KH. 2000. Flood Frequency Analysis . CRC Press: BocaRaton, FL.
Wiltshire SE. 1985. Grouping basins for regional flood frequencyanalysis. Hydrological Sciences Journal 30: 151–159.
Yurekli K, Modarres R, Ozturk F. 2009. Regional daily maximum rainfallestimation for Cekerek Watershed by L-moments. MeteorologicalApplications 16: 435–444.
Copyright 2011 John Wiley & Sons, Ltd. Hydrol. Process. 25, 3613–3624 (2011)