università degli studi di ferrara - cern document server
TRANSCRIPT
CER
N-T
HES
IS-2
012-
039
30/0
3/20
12
Università degli Studi di Ferrara
DOTTORATO DI RICERCA IN Matematica e Informatica
CICLO XXIV
COORDINATORE Prof.ssa Ruggero Valeria
Intelligent monitoring and fault diagnosis for ATLAS TDAQ:
a complex event processing solution
Settore Scientifico Disciplinare INF/01
Dottorando Tutore Dott. Magnoni Luca Prof.ssa Luppi Eleonora
Co-Tutore Dott. Lehmann Miotto Giovanna
Anni 2009/2011

Acknowledgements
I would like to thank all my colleagues at CERN for the collaboration and
discussion over the years. My deep and sincere gratitude goes to my super-
visor at CERN Dr. Lehmann Miotto Giovanna for her guidance, support
and trust.
I would also like to thank my supervisor at the University of Ferrara, Prof.
Luppi Eleonora for her advice and assistance.
My sincere thanks are due to the o�cial referees, Dr. Giacomini Francesco
and Dr. Gorini Benedetto for their detailed review and constructive criticism
during the preparation of this thesis.
I would also like to express my deepest gratitude to my parents, Deanna
and Daniele, and to all my family for their dedication and unconditional
support.
Finally, I owe my loving thanks to Tamara, her encouragement and under-
standing are what have made this dissertation possible.
Declaration
I herewith declare that I have produced this paper without the prohibited
assistance of third parties and without making use of aids other than those
speci�ed; notions taken over directly or indirectly from other sources have
been identi�ed as such. This paper has not previously been presented in
identical or similar form to any other examination board.
Abstract
E�ective monitoring and analysis tools are fundamental in modern IT infras-
tructures to get insights on the overall system behavior and to deal promptly
and e�ectively with failures. In recent years, Complex Event Processing
(CEP) technologies have emerged as e�ective solutions for information pro-
cessing from the most disparate �elds: from wireless sensor networks to
�nancial analysis. This thesis proposes an innovative approach to monitor
and operate complex and distributed computing systems, in particular refer-
ring to the ATLAS Trigger and Data Acquisition (TDAQ) system currently
in use at the European Organization for Nuclear Research (CERN). The re-
sult of this research, the AAL project, is currently used to provide ATLAS
data acquisition operators with automated error detection and intelligent
system analysis.
The thesis begins by describing the TDAQ system and the controlling archi-
tecture, with a focus on the monitoring infrastructure and the expert system
used for error detection and automated recovery. It then discusses the lim-
itations of the current approach and how it can be improved to maximize
the ATLAS TDAQ operational e�ciency.
Event processing methodologies are then laid out, with a focus on CEP
techniques for stream processing and pattern recognition. The open-source
Esper engine, the CEP solution adopted by the project is subsequently an-
alyzed and discussed.
Next, the AAL project is introduced as the automated and intelligent mon-
itoring solution developed as the result of this research. AAL requirements
and governing factors are listed, with a focus on how stream processing
functionalities can enhance the TDAQ monitoring experience. The AAL
processing model is then introduced and the architectural choices are justi-
�ed. Finally, real applications on TDAQ error detection are presented.
The main conclusion from this work is that CEP techniques can be success-
fully applied to detect error conditions and system misbehavior. Moreover,
the AAL project demonstrates a real application of CEP concepts for intelli-
gent monitoring in the demanding TDAQ scenario. The adoption of AAL by
several TDAQ communities shows that automation and intelligent system
analysis were not properly addressed in the previous infrastructure. The re-
sults of this thesis will bene�t researchers evaluating intelligent monitoring
techniques on large-scale distributed computing system.
Contents
List of Figures i
List of Tables v
1 Introduction 3
1.1 CERN and the ATLAS experiment . . . . . . . . . . . . . . . . . . . . . 4
1.1.1 CERN (Organisation européenne pour la recherche nucléaire) . . 4
1.1.2 The Large Hadron Collider (LHC) . . . . . . . . . . . . . . . . . 5
1.1.3 A Toroidal LHC Apparatus (ATLAS) . . . . . . . . . . . . . . . 6
1.1.4 The ATLAS TDAQ system . . . . . . . . . . . . . . . . . . . . . 8
1.2 Problem introduction . . . . . . . . . . . . . . . . . . . . . . . . . . . . . 9
1.2.1 Information monitoring in enterprise systems . . . . . . . . . . . 10
1.2.2 Limitation of traditional monitoring . . . . . . . . . . . . . . . . 10
1.2.3 Towards intelligence and automation . . . . . . . . . . . . . . . 11
1.3 Thesis objectives . . . . . . . . . . . . . . . . . . . . . . . . . . . . . . . 12
1.3.1 The shifter assistant . . . . . . . . . . . . . . . . . . . . . . . . . 13
1.4 Summary . . . . . . . . . . . . . . . . . . . . . . . . . . . . . . . . . . . 13
2 ATLAS Trigger and Data Acquisition system 15
2.1 The TDAQ infrastructure . . . . . . . . . . . . . . . . . . . . . . . . . . 15
2.1.1 Computing farms . . . . . . . . . . . . . . . . . . . . . . . . . . . 16
2.1.2 Network con�guration . . . . . . . . . . . . . . . . . . . . . . . . 17
2.2 Software infrastructure . . . . . . . . . . . . . . . . . . . . . . . . . . . . 18
2.2.1 Inter Process Communication (IPC) . . . . . . . . . . . . . . . . 18
2.2.2 Information Service (IS) . . . . . . . . . . . . . . . . . . . . . . . 19
2.2.3 Error Reporting Service (ERS) . . . . . . . . . . . . . . . . . . . 20
v
CONTENTS
2.2.4 Message Reporting Service (MRS) . . . . . . . . . . . . . . . . . 20
2.2.5 Message archiving (LogService) . . . . . . . . . . . . . . . . . . . 21
2.2.6 Con�guration . . . . . . . . . . . . . . . . . . . . . . . . . . . . . 22
2.2.7 RunControl . . . . . . . . . . . . . . . . . . . . . . . . . . . . . . 23
2.2.8 Process ManaGer (PMG) . . . . . . . . . . . . . . . . . . . . . . 24
2.3 Conclusions . . . . . . . . . . . . . . . . . . . . . . . . . . . . . . . . . . 25
3 Problem introduction 27
3.1 Operating the data acquisition system . . . . . . . . . . . . . . . . . . . 27
3.1.1 Operational procedures . . . . . . . . . . . . . . . . . . . . . . . 28
3.1.2 Monitoring infrastructure . . . . . . . . . . . . . . . . . . . . . . 29
3.1.2.1 TDAQ core-services . . . . . . . . . . . . . . . . . . . . 31
3.1.2.2 Data Monitoring tools . . . . . . . . . . . . . . . . . . . 32
3.1.2.3 Farm and network tools . . . . . . . . . . . . . . . . . . 33
3.1.3 Limitations of continuous monitoring . . . . . . . . . . . . . . . . 34
3.1.3.1 Dynamic system conditions . . . . . . . . . . . . . . . . 35
3.1.3.2 No static thresholds . . . . . . . . . . . . . . . . . . . . 35
3.1.3.3 Re-use of expert knowledge and formalization . . . . . . 36
3.1.3.4 Repetitive checks and controls . . . . . . . . . . . . . . 36
3.2 Error management in TDAQ . . . . . . . . . . . . . . . . . . . . . . . . 36
3.2.1 Error detection and recovery . . . . . . . . . . . . . . . . . . . . 37
3.2.2 The expert system approach . . . . . . . . . . . . . . . . . . . . . 37
3.2.2.1 Rule based expert system . . . . . . . . . . . . . . . . . 38
3.2.3 The TDAQ Error Management System (EMS) . . . . . . . . . . 38
3.2.3.1 The CLIPS framework . . . . . . . . . . . . . . . . . . . 39
3.2.3.2 Knowledge base . . . . . . . . . . . . . . . . . . . . . . 40
3.2.4 Limitations . . . . . . . . . . . . . . . . . . . . . . . . . . . . . . 40
3.3 The ATLAS data taking e�ciency . . . . . . . . . . . . . . . . . . . . . 41
3.3.1 Ine�ciency governing factors . . . . . . . . . . . . . . . . . . . . 42
3.3.1.1 Repartition of 2011 ine�ciency . . . . . . . . . . . . . . 44
3.3.2 Operational ine�ciency . . . . . . . . . . . . . . . . . . . . . . . 44
3.4 An automated and intelligent assistant for TDAQ operations . . . . . . 45
3.4.1 Aims . . . . . . . . . . . . . . . . . . . . . . . . . . . . . . . . . . 45
vi
CONTENTS
3.4.2 Requirements . . . . . . . . . . . . . . . . . . . . . . . . . . . . 46
3.4.2.1 Automatize check and controls in real-time . . . . . . . 46
3.4.2.2 Detect complex system behavior . . . . . . . . . . . . . 46
3.4.2.3 Knowledge-base of instructions . . . . . . . . . . . . . . 47
3.4.2.4 E�ective noti�cation . . . . . . . . . . . . . . . . . . . . 47
3.5 Summary . . . . . . . . . . . . . . . . . . . . . . . . . . . . . . . . . . . 47
4 Complex event processing with Esper 49
4.1 Information processing technologies . . . . . . . . . . . . . . . . . . . . . 49
4.1.1 Active DBMS . . . . . . . . . . . . . . . . . . . . . . . . . . . . . 50
4.1.2 Data stream processing . . . . . . . . . . . . . . . . . . . . . . . 51
4.1.3 Event processing technologies . . . . . . . . . . . . . . . . . . . . 52
4.2 Complex Event Processing: a theoretical introduction . . . . . . . . . . 52
4.2.1 What events are . . . . . . . . . . . . . . . . . . . . . . . . . . . 52
4.2.2 How events are created . . . . . . . . . . . . . . . . . . . . . . . . 53
4.2.3 Time, Causality and Aggregation . . . . . . . . . . . . . . . . . . 54
4.2.3.1 Cause-Time Axiom . . . . . . . . . . . . . . . . . . . . 55
4.2.3.2 Genetic parameters . . . . . . . . . . . . . . . . . . . . 55
4.2.3.3 Augmenting time with causality . . . . . . . . . . . . . 55
4.2.4 Event patterns . . . . . . . . . . . . . . . . . . . . . . . . . . . . 56
4.2.4.1 Rules . . . . . . . . . . . . . . . . . . . . . . . . . . . . 57
4.2.5 Processing model architecture . . . . . . . . . . . . . . . . . . . . 58
4.2.5.1 FSM automata . . . . . . . . . . . . . . . . . . . . . . . 58
4.3 Event processing implementations . . . . . . . . . . . . . . . . . . . . . 59
4.3.1 Cloud-derived technologies . . . . . . . . . . . . . . . . . . . . . . 59
4.3.1.1 Storm . . . . . . . . . . . . . . . . . . . . . . . . . . . . 60
4.3.1.2 S4 - Yahoo! . . . . . . . . . . . . . . . . . . . . . . . . . 60
4.3.2 Pure CEP solutions . . . . . . . . . . . . . . . . . . . . . . . . . 60
4.3.2.1 StreamBase Event Processing Platform . . . . . . . . . 61
4.3.2.2 Oracle-CEP . . . . . . . . . . . . . . . . . . . . . . . . . 61
4.4 A CEP engine for the TDAQ assistant: Esper . . . . . . . . . . . . . . 61
4.4.1 Esper engine . . . . . . . . . . . . . . . . . . . . . . . . . . . . . 62
4.4.2 An event in Esper . . . . . . . . . . . . . . . . . . . . . . . . . . 63
vii
CONTENTS
4.4.2.1 Event properties . . . . . . . . . . . . . . . . . . . . . . 63
4.4.2.2 Event example . . . . . . . . . . . . . . . . . . . . . . . 64
4.4.3 Event Processing Language (EPL) . . . . . . . . . . . . . . . . . 64
4.4.4 Processing model . . . . . . . . . . . . . . . . . . . . . . . . . . . 65
4.4.4.1 Streams . . . . . . . . . . . . . . . . . . . . . . . . . . . 66
4.4.4.2 Filters . . . . . . . . . . . . . . . . . . . . . . . . . . . . 67
4.4.4.3 Time windows . . . . . . . . . . . . . . . . . . . . . . . 68
4.4.4.4 Event aggregations . . . . . . . . . . . . . . . . . . . . . 70
4.4.5 Performance . . . . . . . . . . . . . . . . . . . . . . . . . . . . . . 70
4.5 Summary . . . . . . . . . . . . . . . . . . . . . . . . . . . . . . . . . . . 71
5 The AAL project 73
5.1 The project architecture . . . . . . . . . . . . . . . . . . . . . . . . . . . 73
5.1.1 Information gathering . . . . . . . . . . . . . . . . . . . . . . . . 74
5.1.2 Information processing . . . . . . . . . . . . . . . . . . . . . . . . 75
5.1.3 Result distribution and visualization . . . . . . . . . . . . . . . . 75
5.2 Information providers and data types . . . . . . . . . . . . . . . . . . . 76
5.2.1 Information streams . . . . . . . . . . . . . . . . . . . . . . . . . 76
5.2.1.1 Information Service (IS) . . . . . . . . . . . . . . . . . . 76
5.2.1.2 Application log messages . . . . . . . . . . . . . . . . . 78
5.2.1.3 Java Message Service (JMS) stream . . . . . . . . . . . 79
5.2.2 Static information providers . . . . . . . . . . . . . . . . . . . . . 80
5.2.2.1 Con�guration . . . . . . . . . . . . . . . . . . . . . . . . 80
5.2.2.2 Nagios . . . . . . . . . . . . . . . . . . . . . . . . . . . 81
5.3 Knowledge engineering: directives . . . . . . . . . . . . . . . . . . . . . 82
5.3.1 Directive structure . . . . . . . . . . . . . . . . . . . . . . . . . . 83
5.3.1.1 Pattern . . . . . . . . . . . . . . . . . . . . . . . . . . . 83
5.3.1.2 Listener . . . . . . . . . . . . . . . . . . . . . . . . . . . 83
5.3.2 Directive management . . . . . . . . . . . . . . . . . . . . . . . . 84
5.4 Alerts . . . . . . . . . . . . . . . . . . . . . . . . . . . . . . . . . . . . . 85
5.4.1 Alert structure . . . . . . . . . . . . . . . . . . . . . . . . . . . . 85
5.5 Conclusions . . . . . . . . . . . . . . . . . . . . . . . . . . . . . . . . . . 86
viii
CONTENTS
6 The AAL design and implementation 87
6.1 The AAL architecture . . . . . . . . . . . . . . . . . . . . . . . . . . . . 87
6.2 The AAL engine . . . . . . . . . . . . . . . . . . . . . . . . . . . . . . . 88
6.2.1 The AAL events processor . . . . . . . . . . . . . . . . . . . . . . 89
6.2.2 Injectors . . . . . . . . . . . . . . . . . . . . . . . . . . . . . . . 90
6.2.2.1 Injector types . . . . . . . . . . . . . . . . . . . . . . . . 90
6.2.2.2 Injector criteria and con�guration . . . . . . . . . . . . 91
6.2.2.3 Injector design . . . . . . . . . . . . . . . . . . . . . . . 91
6.2.3 Listeners . . . . . . . . . . . . . . . . . . . . . . . . . . . . . . . . 91
6.2.3.1 Listener types . . . . . . . . . . . . . . . . . . . . . . . 91
6.2.3.2 Writers and output formats . . . . . . . . . . . . . . . . 93
6.2.4 Readers . . . . . . . . . . . . . . . . . . . . . . . . . . . . . . . . 94
6.3 Threading and concurrency . . . . . . . . . . . . . . . . . . . . . . . . . 94
6.3.1 CORBA ORB . . . . . . . . . . . . . . . . . . . . . . . . . . . . 94
6.3.2 Esper threading model . . . . . . . . . . . . . . . . . . . . . . . . 96
6.3.3 AAL engine threading and concurrency . . . . . . . . . . . . . . 96
6.3.3.1 AAL con�guration . . . . . . . . . . . . . . . . . . . . . 97
6.4 Examples of TDAQ use cases . . . . . . . . . . . . . . . . . . . . . . . . 98
6.4.1 Event streams . . . . . . . . . . . . . . . . . . . . . . . . . . . . . 98
6.4.2 Composite streams . . . . . . . . . . . . . . . . . . . . . . . . . . 100
6.4.3 Pattern samples . . . . . . . . . . . . . . . . . . . . . . . . . . . . 100
6.4.3.1 Error for the ATLAS partition . . . . . . . . . . . . . . 100
6.4.3.2 Continuous check on ROS loads . . . . . . . . . . . . . 101
6.4.3.3 Connectivity problems on ROS . . . . . . . . . . . . . . 102
6.5 Alerts distribution and visualization . . . . . . . . . . . . . . . . . . . . 103
6.5.1 Message queuing system . . . . . . . . . . . . . . . . . . . . . . . 103
6.5.2 The AAL web application . . . . . . . . . . . . . . . . . . . . . . 104
6.5.2.1 Alert domain . . . . . . . . . . . . . . . . . . . . . . . . 105
6.5.2.2 Per-domain view . . . . . . . . . . . . . . . . . . . . . . 106
6.5.2.3 Other distribution strategies . . . . . . . . . . . . . . . 107
6.6 Summary . . . . . . . . . . . . . . . . . . . . . . . . . . . . . . . . . . . 107
ix
CONTENTS
7 Conclusions and future work 109
7.1 Summary . . . . . . . . . . . . . . . . . . . . . . . . . . . . . . . . . . . 109
7.1.1 ATLAS operational e�ciency . . . . . . . . . . . . . . . . . . . . 110
7.1.2 Complex Event Processing for TDAQ operations analysis . . . . 110
7.1.3 The AAL project . . . . . . . . . . . . . . . . . . . . . . . . . . . 111
7.2 Future research . . . . . . . . . . . . . . . . . . . . . . . . . . . . . . . . 111
7.2.1 Combination of CEP with machine learning for problem classi�-
cation . . . . . . . . . . . . . . . . . . . . . . . . . . . . . . . . . 112
7.2.2 On-line problem classi�cations . . . . . . . . . . . . . . . . . . . 112
7.3 Conclusions . . . . . . . . . . . . . . . . . . . . . . . . . . . . . . . . . . 113
References 115
x
List of Figures
1.1 The LHC tunnel and the main experiments. . . . . . . . . . . . . . . . . 4
1.2 Map of the CERN accelerators. . . . . . . . . . . . . . . . . . . . . . . . 5
1.3 ATLAS with composing sub-detectors. . . . . . . . . . . . . . . . . . . . 7
1.4 View of the ATLAS underground areas and surface buildings. . . . . . . 7
1.5 High-level view of the ATLAS Trigger and Data Acquisition system with
event and data rates. . . . . . . . . . . . . . . . . . . . . . . . . . . . . . 8
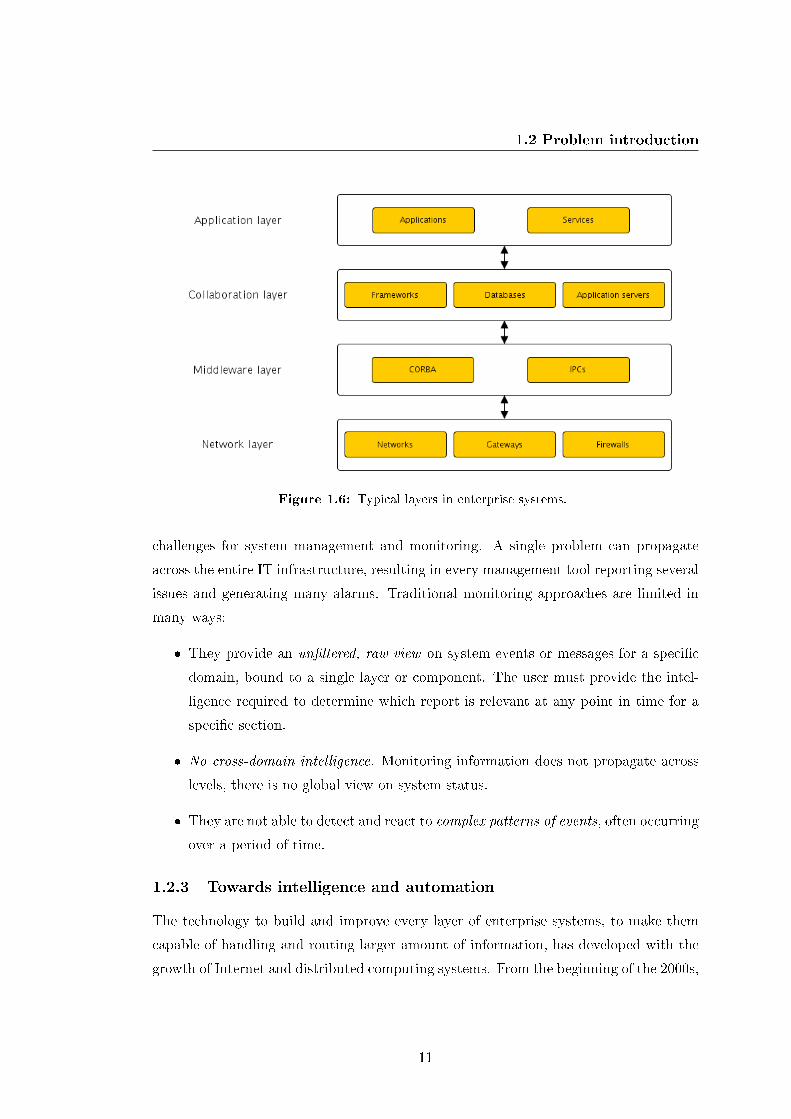
1.6 Typical layers in enterprise systems. . . . . . . . . . . . . . . . . . . . . 11
2.1 Outline of the ATLAS Trigger and Data Acquisition system with event
and data rates. . . . . . . . . . . . . . . . . . . . . . . . . . . . . . . . . 16
2.2 TDAQ routers layout. . . . . . . . . . . . . . . . . . . . . . . . . . . . . 18
2.3 Information Service (IS) . . . . . . . . . . . . . . . . . . . . . . . . . . . 19
2.4 Message displayed by the Message viewer application. . . . . . . . . . . 21
2.5 The LogService stores all messages in a database which can subsequently
be queried. . . . . . . . . . . . . . . . . . . . . . . . . . . . . . . . . . . 21
2.6 Log viewer: the Log service graphical interface. . . . . . . . . . . . . . . 22
2.7 High-level view on the con�guration database structure. . . . . . . . . . 23
2.8 The Finite State Machine used to control the system. . . . . . . . . . . . 24
3.1 The ATLAS control room. . . . . . . . . . . . . . . . . . . . . . . . . . . 28
3.2 Operators desk con�guration. . . . . . . . . . . . . . . . . . . . . . . . . 29
3.3 High-level view on operational procedures. . . . . . . . . . . . . . . . . . 30
3.4 Data quality monitoring tool. . . . . . . . . . . . . . . . . . . . . . . . . 32
3.5 Information providers used by TDAQ operators and experts. . . . . . . . 34
3.6 Key components of the EMS framework. . . . . . . . . . . . . . . . . . 39
i
LIST OF FIGURES
3.7 ATLAS total integrated luminosity in 2011. . . . . . . . . . . . . . . . . 41
3.8 ATLAS data taking e�ciency in 2011. . . . . . . . . . . . . . . . . . . . 41
3.9 Data-acquisition e�ciency and stable beam duration for the period 20
June 2011 to 30 June 2011. . . . . . . . . . . . . . . . . . . . . . . . . . 42
3.10 Ine�ciency factors for ATLAS data taking in 2011 with focus on opera-
tional issues. . . . . . . . . . . . . . . . . . . . . . . . . . . . . . . . . . 45
4.1 High-level view on enterprise system layers. . . . . . . . . . . . . . . . . 54
4.2 An event log of network protocol events ordered by time. . . . . . . . . 56
4.3 The same event log of network protocol with explicit causal-relationship
as DAG . . . . . . . . . . . . . . . . . . . . . . . . . . . . . . . . . . . . 56
4.4 A CEP system interfaced with a target system. . . . . . . . . . . . . . . 58
4.5 Finale State Machine to express a simple pattern. . . . . . . . . . . . . . 58
4.6 Esper processing model. . . . . . . . . . . . . . . . . . . . . . . . . . . . 62
4.7 Output example for a simple statement. . . . . . . . . . . . . . . . . . . 66
4.8 Output example for a statement with data window. . . . . . . . . . . . 67
4.9 Output example for a �ltering statement. . . . . . . . . . . . . . . . . . 68
4.10 Output example for a statement with time window. . . . . . . . . . . . 69
4.11 Output example for a statement with time batch window. . . . . . . . . 69
5.1 High-level view on the AAL project architecture and operational stages. 74
5.2 Information Service (IS) functional schema. . . . . . . . . . . . . . . . . 76
5.3 IS information as seen from IS viewer. . . . . . . . . . . . . . . . . . . . 77
5.4 IS update rates during ATLAS data taking operations. . . . . . . . . . 78
5.5 Spike in ERS messages generated in case of a network connectivity prob-
lem. . . . . . . . . . . . . . . . . . . . . . . . . . . . . . . . . . . . . . . 80
5.6 Information can be collected from a JMS provider. . . . . . . . . . . . . 81
5.7 Directive schema. . . . . . . . . . . . . . . . . . . . . . . . . . . . . . . . 82
5.8 Directives are structured in XML documents. . . . . . . . . . . . . . . . 84
5.9 A list of alerts presented by the AAL web interface. . . . . . . . . . . . . 86
6.1 AAL architecture overview. . . . . . . . . . . . . . . . . . . . . . . . . . 88
6.2 AAL engine architecture. . . . . . . . . . . . . . . . . . . . . . . . . . . 89
6.3 An injector interfaces a TDAQ data source with the AAL domain. . . . 90
ii
LIST OF FIGURES
6.4 Injectors factory-based design. . . . . . . . . . . . . . . . . . . . . . . . . 92
6.5 Listeners and writers architecture. . . . . . . . . . . . . . . . . . . . . . 93
6.6 CORBA ORBs threading architecture for an IS server. . . . . . . . . . 94
6.7 Esper threading model in default con�guration. . . . . . . . . . . . . . . 95
6.8 Overview of AAL threading architecture. . . . . . . . . . . . . . . . . . . 97
6.9 High-level view on CEP functionalities applied on problem detection. . . 98
6.10 Alerts distribution is based on a message-driven architecture. . . . . . . 104
6.11 The layout of the AAL web interface. . . . . . . . . . . . . . . . . . . . . 106
iii

LIST OF FIGURES
iv
List of Tables
1.1 Abbreviation of the LHC related experiments. . . . . . . . . . . . . . . . 6
2.1 ATLAS TDAQ farm composition. . . . . . . . . . . . . . . . . . . . . . . 17
3.1 Ine�ciency factors for ATLAS data taking in 2011. . . . . . . . . . . . 44
4.1 Events types and underlying Java objects . . . . . . . . . . . . . . . . . 62
4.2 Types of event properties . . . . . . . . . . . . . . . . . . . . . . . . . . 63
5.1 ERS message schema . . . . . . . . . . . . . . . . . . . . . . . . . . . . 79
6.1 IS stream properties. . . . . . . . . . . . . . . . . . . . . . . . . . . . . . 99
6.2 MRS stream properties. . . . . . . . . . . . . . . . . . . . . . . . . . . . 99
v

LIST OF TABLES
vi
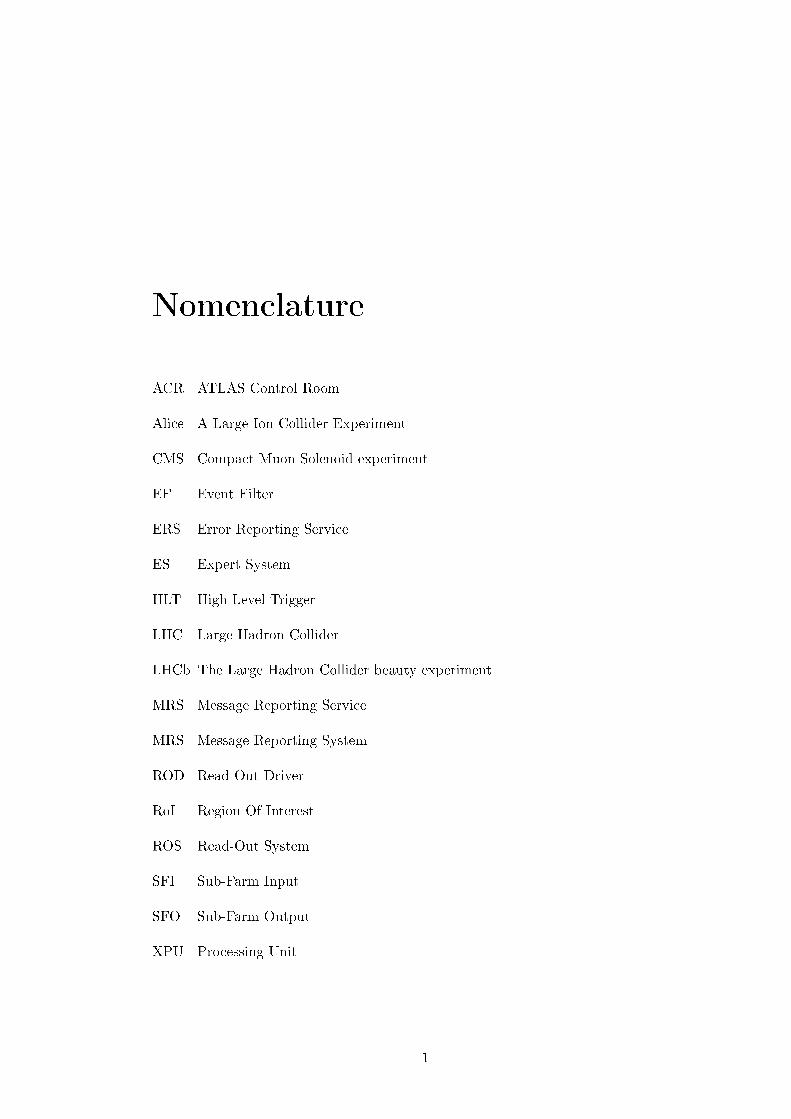
Nomenclature
ACR ATLAS Control Room
Alice A Large Ion Collider Experiment
CMS Compact Muon Solenoid experiment
EF Event Filter
ERS Error Reporting Service
ES Expert System
HLT High Level Trigger
LHC Large Hadron Collider
LHCb The Large Hadron Collider beauty experiment
MRS Message Reporting Service
MRS Message Reporting System
ROD Read-Out Driver
RoI Region Of Interest
ROS Read-Out System
SFI Sub-Farm Input
SFO Sub-Farm Output
XPU Processing Unit
1

LIST OF TABLES
2
1
Introduction
This thesis proposes a new approach to monitor and operate complex and distributed
computing systems, in particular referring to the ATLAS Trigger and Data Acquisi-
tion (TDAQ) system currently in use at the European Laboratory for Particle Physics
(CERN). E�ective monitoring and analysis tools are fundamental in modern IT infras-
tructures to get insights on overall system behavior and to deal promptly and e�ectively
with failures. These systems have in common a layered architecture, with every layer
providing functionalities other layers and services rely on (such as network, middleware,
application, user interfaces, web portals, etc.). In this scenario, standard monitoring
techniques and tools have several limitations, such as being too focused on single as-
pects, the lack of �exibility with respect to the dynamic working conditions and the
timeliness of monitoring information provided. More generally, they do not covers all
the requirements the increasing complexity in businesses and infrastructures poses. The
objective of this thesis is to present a new monitoring solution o�ering a deep integration
across all infrastructure layers, pattern recognition to quickly spot problems, real-time
updates at high resolution and automatic adaptation to changing environments. This
project combines technologies coming from di�erent disciplines, in particular it lever-
ages an event-driven architecture to manage the �ow of information coming from the
ATLAS TDAQ infrastructure, together with a Complex Event Processing (CEP) engine
to provide intelligent systems analysis.
The di�erent problems and techniques concerning information analysis and intel-
ligent monitoring are investigated, the design and the technical choices made during
3
1. INTRODUCTION
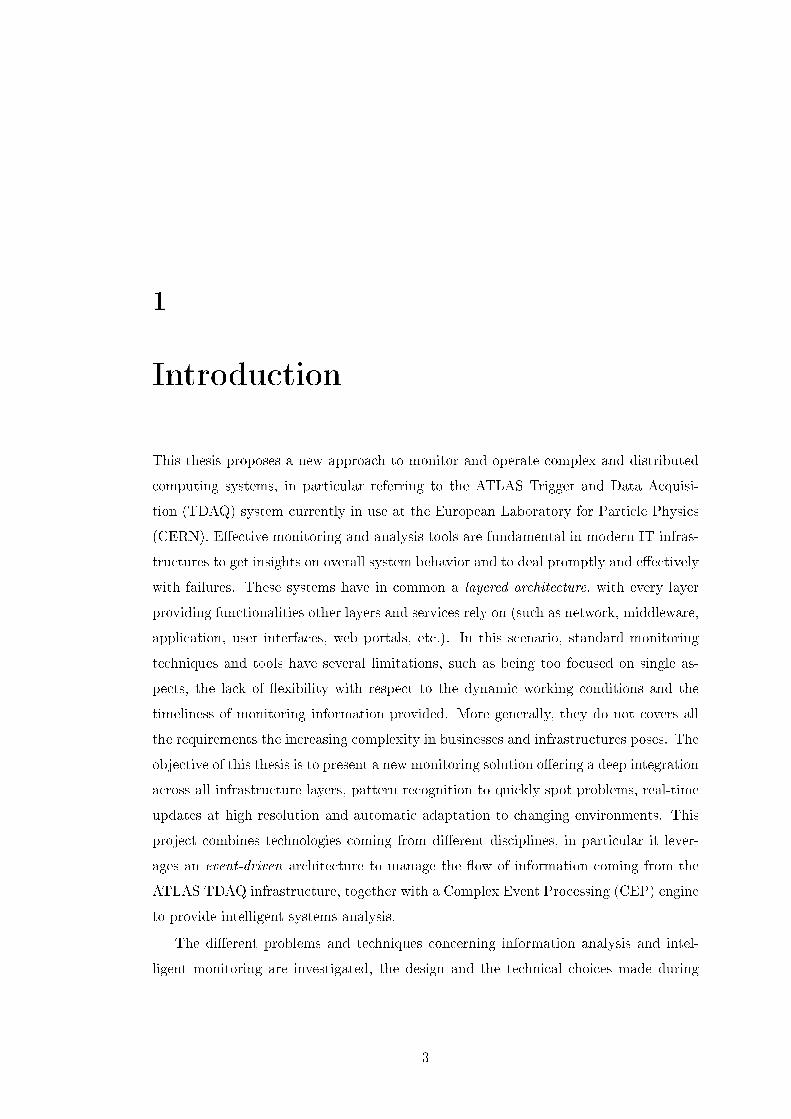
Figure 1.1: The LHC tunnel and the main experiments.
the development of the project are then presented and discussed together with results
obtained during its usage in production for ATLAS data taking operations.
1.1 CERN and the ATLAS experiment
This section provides a very brief introduction to the CERN laboratory, the Large
Hadron Collider (LHC) and the ATLAS TDAQ system.
1.1.1 CERN (Organisation européenne pour la recherche nucléaire)
The European Organization for Nuclear Research, known as CERN, is an international
organization whose purpose is to operate the world largest particle physics laboratory,
which is situated in the northwest suburbs of Geneva on the Franco�Swiss border, as
shown in Figure 1.1. The main research topics shifted from the early days, when the
research was concentrated on nuclear physics, to modern particle physics, hence now it
is commonly referred to as the �European Laboratory for Particle Physics�. Today 20
European member states collaborate to run CERN, although contributions are made
from countries all around the world, including USA, Russia, Japan and China. In addi-
4
1.1 CERN and the ATLAS experiment
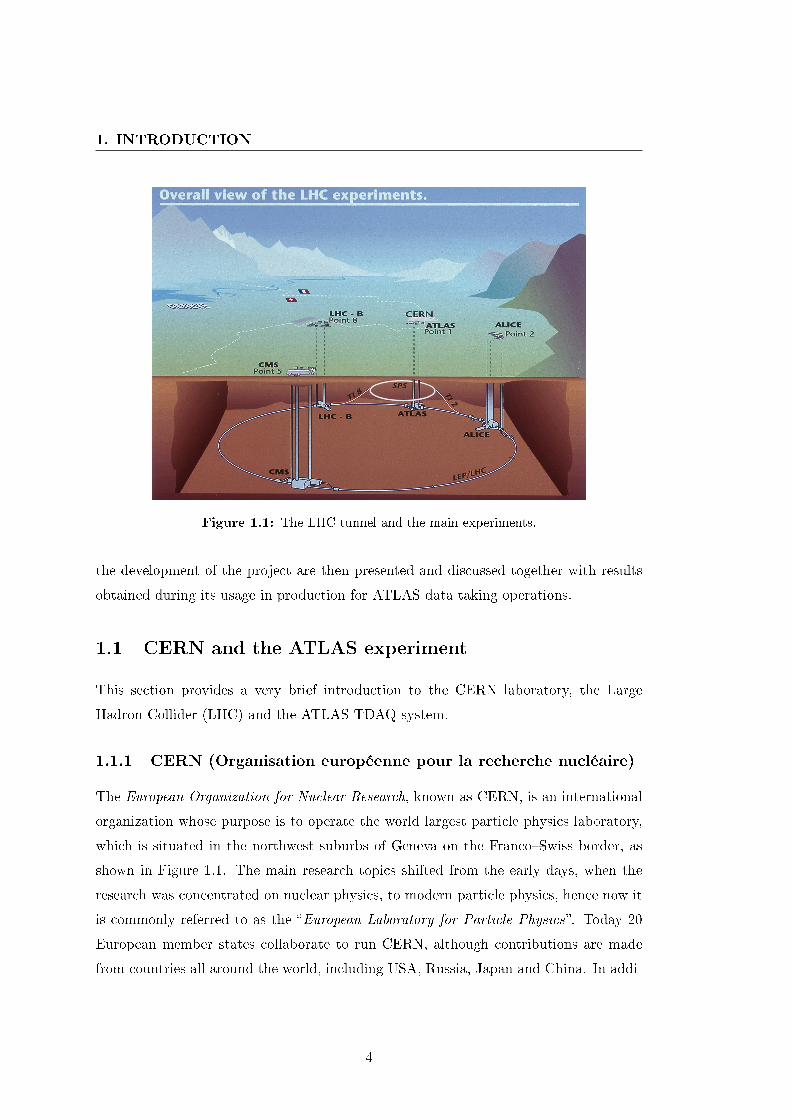
Figure 1.2: Map of the CERN accelerators.
tion to the approximately 2500 sta� permanently at CERN, more than 8000 scientists
visit and perform part of their work at CERN. Most of the activities at CERN are
currently directed towards operating and maintaining the new Large Hadron Collider
(LHC) , and the experiments installed on it.
1.1.2 The Large Hadron Collider (LHC)
CERN operates a network of six accelerators and a decelerator1. Each machine in the
chain increases the energy of particle beams before delivering them to experiments or
to the next more powerful accelerator. The last stage of this acceleration is the Large
Hadron Collider (LHC)(17), a 27 km circumference synchrotron that can accelerate
protons and lead ions to higher energies and will eventually collide particles every 25 ns
with a centre-of-mass energy of 14 TeV. After acceleration the beams are kept circulating
in the machine for a period of typically 10-20 hours and are brought into collision at
four interaction points.
This makes it possible to study physics phenomena that have previously never been
observed in a controlled experimental environment. Four main experiments are installed
and connected to the LHC ring: ATLAS, CMS, LHCb and ALICE. An overview of
1the CNGS sends neutrinos from CERN to the Gran Sasso National Laboratory (LNGS).
5
1. INTRODUCTION
Abbreviation Full name
ATLAS A Toroidal LHC ApparatuS
ISOLDE Isotope Separator on Line
AD Antiproton Decelerator
PS Proton Synchrotron
LEIR Low Energy Ion Ring
LINAC LINear ACcelerator
n-TOF neutron Time Of Flight
CNGS CERN Neutrinos to Gran Sasso
SPS Super Proton Synchrotron
ALICE A Large Ion Collider Experiment
CMS Compact Muon Solenoid experiment
LHCb The Large Hadron Collider beauty experiment
Table 1.1: Abbreviation of the LHC related experiments.
the LHC and the location of the four experiments is shown in Figure 1.2. Each of
the four experiments are designed to ful�ll speci�c goals. The Alice experiment is
concerned with studying lead-ion interactions while the LHCb experiment is concerned
with studying matter and anti-matter. The ATLAS and CMS are both general purpose
detectors designed to cover the widest possible range of physics phenomena. While the
two experiments have the same goal in mind, they are built using di�erent technical
solutions and design. LHC was �rst switched on the 10th of September 2008: after a
short time in operation complications arose and it was shut down for repairs. Since
spring 2010 LHC is back in operations, initially with a relatively low energy to ensure
the safe operation of the LHC. The collision energy will only later be increased to its
full potential of 14 TeV.
1.1.3 A Toroidal LHC Apparatus (ATLAS)
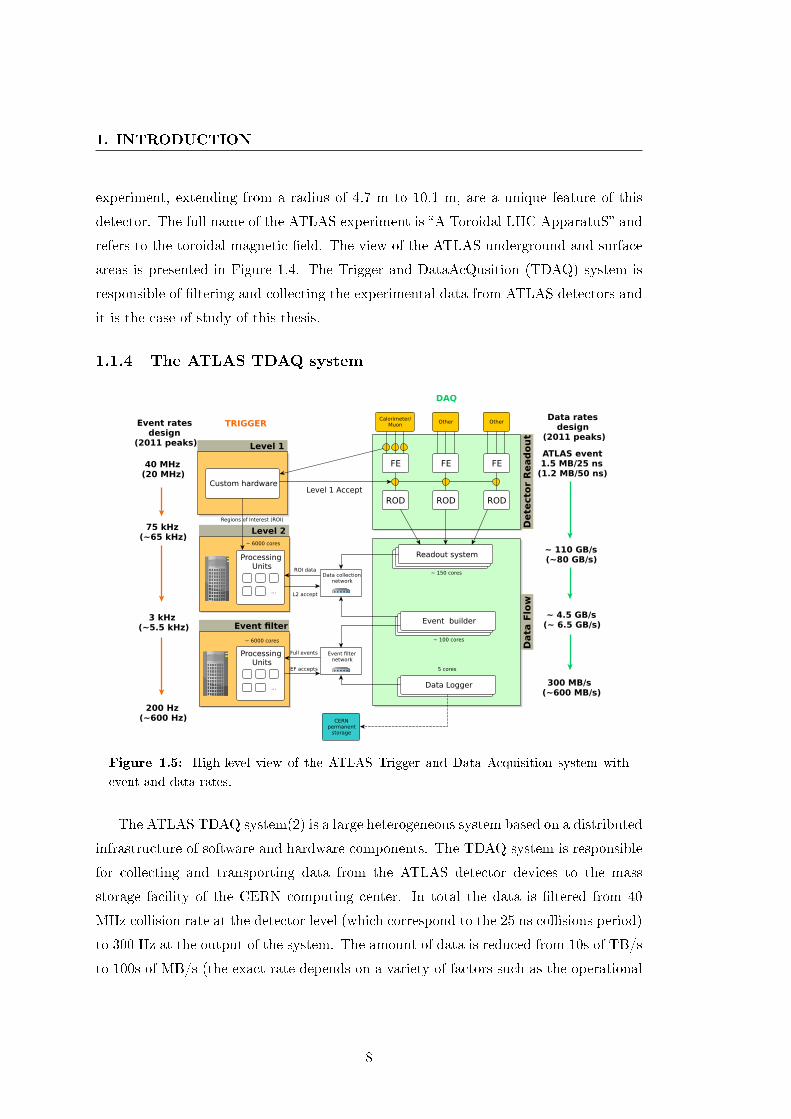
ATLAS (3) is the largest particle detector ever built and its scope is to determine
which particles are produced during proton-proton interactions at the LHC. The ATLAS
detector surrounds interaction point 1 of the LHC, about 100 m underground. It consists
of a large cylinder (43m length x 25m diameter) of detecting devices, as shown in Figure
1.3. The 8 large superconducting magnet coils, 25.3 m long, at the outside of the
6
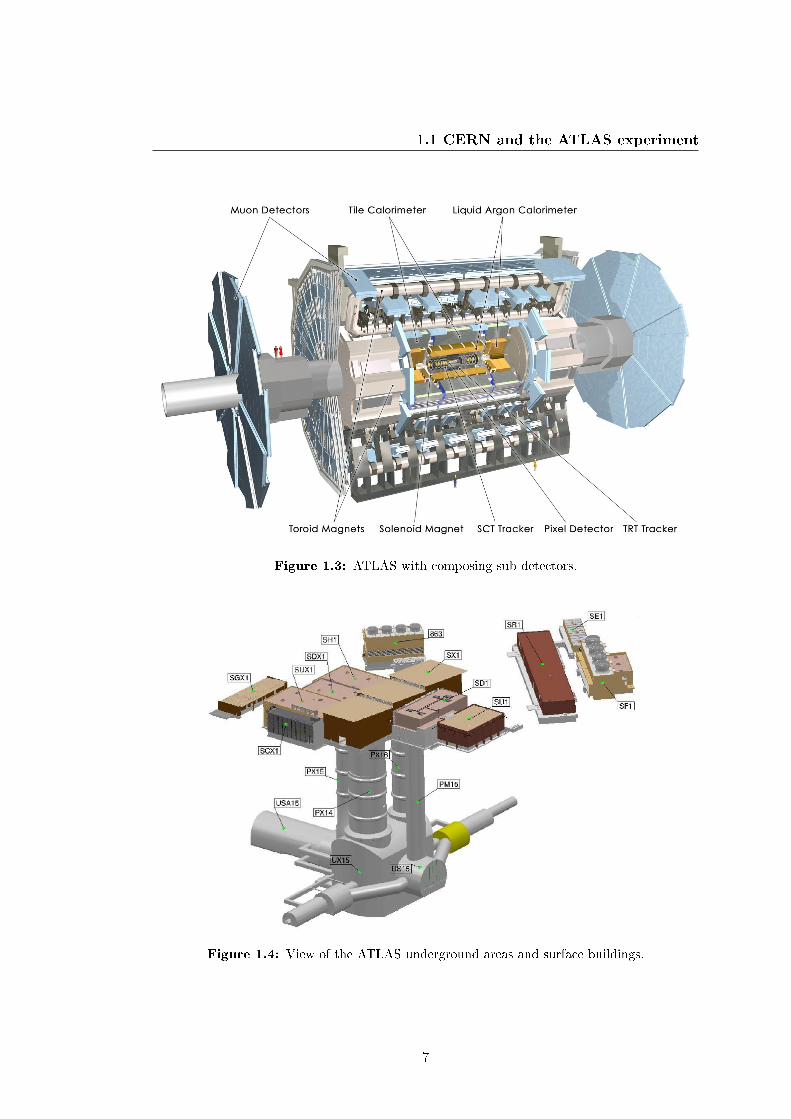
1.1 CERN and the ATLAS experiment
Figure 1.3: ATLAS with composing sub-detectors.
Figure 1.4: View of the ATLAS underground areas and surface buildings.
7
1. INTRODUCTION
experiment, extending from a radius of 4.7 m to 10.1 m, are a unique feature of this
detector. The full name of the ATLAS experiment is �A Toroidal LHC ApparatuS� and
refers to the toroidal magnetic �eld. The view of the ATLAS underground and surface
areas is presented in Figure 1.4. The Trigger and DataAcQusition (TDAQ) system is
responsible of �ltering and collecting the experimental data from ATLAS detectors and
it is the case of study of this thesis.
1.1.4 The ATLAS TDAQ system
Data
Flo
w
Dete
cto
r R
ead
ou
t
Event filter
Level 1
Level 2
Custom hardware
Processing Units
Calorimeter/Muon
FE
ROD
Other
FE
ROD
Other
FE
RODLevel 1 Accept
Readout systemReadout systemReadout system
Data collection network
Readout systemReadout systemEvent builder
Readout systemData Logger
ROI data
L2 accept
Event rates design
(2011 peaks)
40 MHz(20 MHz)
75 kHz(~65 kHz)
3 kHz(~5.5 kHz)
200 Hz(~600 Hz)
TRIGGER
DAQ
Data rates design
(2011 peaks)
ATLAS event1.5 MB/25 ns
(1.2 MB/50 ns)
~ 110 GB/s(~80 GB/s)
~ 4.5 GB/s(~ 6.5 GB/s)
300 MB/s (~600 MB/s)
...
Processing Units
...
~ 6000 cores
Event filter network
5 cores
~ 150 cores
~ 100 cores
~ 6000 cores
Full events
EF accepts
CERNpermanent
storage
Regions of Interest (ROI)
Figure 1.5: High-level view of the ATLAS Trigger and Data Acquisition system with
event and data rates.
The ATLAS TDAQ system(2) is a large heterogeneous system based on a distributed
infrastructure of software and hardware components. The TDAQ system is responsible
for collecting and transporting data from the ATLAS detector devices to the mass
storage facility of the CERN computing center. In total the data is �ltered from 40
MHz collision rate at the detector level (which correspond to the 25 ns collisions period)
to 300 Hz at the output of the system. The amount of data is reduced from 10s of TB/s
to 100s of MB/s (the exact rate depends on a variety of factors such as the operational
8
1.2 Problem introduction
energy of the LHC and the con�guration of the TDAQ system). To select interesting
experimental data the TDAQ system is based on three levels of on-line �ltering of the
data; Level-1 trigger, Level-2 trigger and Event �lter. Each level will further re�ne the
results of the previous one only keeping those parts of the data which may be of interest
for further analysis. While the Level 1 trigger is mainly hardware based, the Level 2 and
Event �lter facilities, composing the so called High Level Trigger (HLT) are provided
via software components running in the TDAQ computing infrastructure.
To cope with the very high data rate produced by the detector a complex and
distributed infrastructure has been built. More than 200 switches and routers intercon-
nect about 2000 hosts, ranging from 12-core processing nodes to computers containing
custom-made hardware modules linked directly to the ATLAS detector. On top of the
hardware infrastructure, over 20.000 applications are responsible for analyzing, �ltering
and moving event data to permanent storage. A schematic overview of the di�erent
parts of the TDAQ system is shown in Figure 1.5.
A detailed description of the design and implementation of the TDAQ system can
be found in (2) and (44).
1.2 Problem introduction
The growing complexity of modern computing infrastructures is posing new challenges
for monitoring procedures and tools. In particular, today operations engineers are faced
with increasing di�culties in understanding overall system behaviors and investigating
problems and failures. This is mainly due to the limitations of the current genera-
tions of monitoring services, failing to cope with the distributed scale and complexity
of modern businesses and infrastructures. This situation is subject of multiple studies
and investigations and is driving the development of new technologies and disciplines, in
particular in the �eld of data analysis and even stream processing, as presented in(11).
Nevertheless, comprehensive monitoring solutions exist only as vendor-speci�c frame-
work customized for speci�c computing infrastructure and software environments, as
presented in 4.3. The peculiarity of the TDAQ software architecture and the demand-
ing monitoring and error detection requirements make these commercial solution not
suitable for the ATLAS TDAQ use case.
9
1. INTRODUCTION
The project subject of this thesis is an automated monitoring and error detection
solution which leverage open-source technologies for information processing and results
distribution. This project has been developed to satisfy the ATLAS data acquisition
requirements, but thanks to a generic design it can be easily adopted by di�erent com-
puting infrastructures.
1.2.1 Information monitoring in enterprise systems
The problems investigated in this thesis are not speci�c to data acquisition infrastruc-
tures but are common to a wider category of IT systems, commonly named as enterprise
systems. An enterprise system can be seen as a distributed system with thousands of
application programs communicating with each other by means of multiple IT layers.
Typical examples are systems that automate operations of commercial enterprises such
as bank and �nancial companies, or systems that o�er high level services backed on
distributed computing and storage facilities. From an architectural perspective they
are all layered systems, as shown in Figure 1.6, with every layer providing features upon
which other layers and services rely on.
An activity taking place in a certain level can be abstracted as an event, and the
information �ow inside the enterprise system can be represented as a �ow of events
across the di�erent layers. The monitoring of an enterprise systems requires operators
to get insights on events �owing through the di�erent IT layers. In particular, operators
have to analyze the relationships between events in order to understand the root causes
of problems and failures that may impact at di�erent levels.
The common problems of today enterprise systems is the lack of tools to enables
a global, e�ective view on system events in order to help operators and experts to
understand the overall system behavior. There are many monitoring tools acting at
every speci�c IT layers, such as networking, farm and applications monitoring, but
the events correlation have to be manually performed by the operators for every single
problems.
1.2.2 Limitation of traditional monitoring
In multi-tier environments, applications no longer operate in isolation e.g. a failure
on a database can cause applications executing on a an application server that uses
the database to fail as well. The interdependency between services poses interesting
10
1.2 Problem introduction
Figure 1.6: Typical layers in enterprise systems.
challenges for system management and monitoring. A single problem can propagate
across the entire IT infrastructure, resulting in every management tool reporting several
issues and generating many alarms. Traditional monitoring approaches are limited in
many ways:
� They provide an un�ltered, raw view on system events or messages for a speci�c
domain, bound to a single layer or component. The user must provide the intel-
ligence required to determine which report is relevant at any point in time for a
speci�c section.
� No cross-domain intelligence. Monitoring information does not propagate across
levels, there is no global view on system status.
� They are not able to detect and react to complex patterns of events, often occurring
over a period of time.
1.2.3 Towards intelligence and automation
The technology to build and improve every layer of enterprise systems, to make them
capable of handling and routing larger amount of information, has developed with the
growth of Internet and distributed computing systems. From the beginning of the 2000s,
11
1. INTRODUCTION
with the consolidation of enterprise systems, a similar development of technology ap-
peared for monitoring and managing the information �ows, as discussed in the book in
�The Power of Events� by David C. Luckham (30) who formalized the concept of Com-
plex Event Processing (CEP). Driven by these progresses, monitoring and management
services can evolve mainly along two dimensions:
� Intelligence: to process data and provide advanced analysis capabilities, through
events correlations, pattern detection and time-series analysis.
� Automation: to automatically performs checks an controls, to provide the desired
information on demand to the operators and experts, to become a pro-active
facility for fault diagnosis and root cause analysis.
1.3 Thesis objectives
The ATLAS TDAQ system, like many modern IT systems, is a complex distributed
infrastructure made of networks, services and applications, each one working at di�erent
layer in a hierarchical con�guration. Due to the very critical operational task, both
economically and in terms of manpower, dealing fast and e�ectively with problems and
failures is fundamental to minimize system downtime, here meaning the time when the
system is not performing its main tasks at its full potential. Hence, the need to optimize
the way the TDAQ system is operated by shifters and experts has become increasingly
important.
The TDAQ system is equipped with an automated error recovery service, as pre-
sented in section 3.2, able to recover part of the TDAQ infrastructure from error sit-
uations. Nevertheless, only a minor fraction of the overall operational procedures can
be automated, and about the 50% of the TDAQ operational ine�ciency, as presented
in 3.4 , is coming from situations where human intervention is involved. In this re-
spect, a high level tools helping operators with diagnosis of problems and suggesting
the expected reaction is still a missing technology to improve the ATLAS data taking
e�ciency.
The goal of this thesis is to presents the study, the design and the development
of the AAL project (Automated Analysis and inteLligent monitoring), a new service
meant to improve the system monitoring and fault diagnosis for the ATLAS TDAQ
12
1.4 Summary
system, towards automation and intelligence as described in the previous sections. I
developed the AAL project as part of the Control and Con�guration (12) group of the
TDAQ system. The project has proven to be an e�ective solution and since spring 2011
it is used in production by shifters and experts running the ATLAS data acquisition
operations. Moreover, because of it simpli�es operational procedures and it allows for
a better use of experts knowledge, the AAL project fosters the reduction of TDAQ
operators while increasing the overall situation awareness for the TDAQ infrastructure.
1.3.1 The shifter assistant
The AAL project operates as an automated assistant for the data acquisition proce-
dures, so it is usually referred to as the shifter assistant. It gathers and analyzes data
from multiple data sources and it produces alerts for TDAQ experts and shifters to
improve problem detection and diagnosis. AAL is made by several components: core
functionalities are provided by a Java-coded engine leveraging the Esper open-source
technology for event processing. The engine is fully integrated in the TDAQ infrastruc-
ture via the CORBA based IPC facilities and APIs. Alerts are distributed in a loosely
coupled architecture based on a message broker (Apache ActiveMQ). For users interac-
tion and alerts visualization a real-time, dynamic and interactive web application has
been developed.
The key functionalities AAL o�ers are:
� Timeliness detection of complex error situations, performing time-based analysis
on system conditions.
� Formalize TDAQ experts know-how. The knowledge-base of AAL is fed by TDAQ
experts with instructions de�ning error situations to be detected and expected
reactions.
� Promptly error noti�cation. When a problem is detected, AAL promptly noti�es
TDAQ operators with error details and suggestion on how to react.
1.4 Summary
In the ATLAS data acquisition system, as in many modern IT enterprise system, the
faster a problem is detected and the better it is for the recovery and solving procedures.
13
1. INTRODUCTION
Given the complexity of a layered architecture, monitoring technologies have to the
move in the direction of pattern-based, problem-recognition strategies. IT events can
be captured by this intelligent tools to be processed, the streams of data can be analyzed
and the interesting situations can be promptly presented to operators and experts with
matching competencies.
In recent years, with the raise of distributed computing and cloud technologies,
solutions have appeared to handle and to monitor the stream of events produced by such
systems. But these monitoring solutions are all bounded to speci�c software platforms
and frameworks, such as for Oracle-CEP (25) and StreamBase (9). The AAL project
is an automated monitoring and error detection solution which leverage open-source
technologies for information processing and results distribution. A generic design that
decouple data gathering, processing and distribution allows AAL to be deeply integrated
with TDAQ control and monitoring infrastructure but as well to be easily adapted to
di�erent computing infrastructures.
14
2
ATLAS Trigger and Data
Acquisition system
This chapter presents the Trigger and Data Acquisition (TDAQ) system of the ATLAS
experiment. In particular, it focuses on applications and services of particular relevance
for system monitoring and fault analysis operations.
2.1 The TDAQ infrastructure
The ATLAS Trigger and Data Acquisition system is a vast heterogeneous system con-
sisting of a large number of both software and hardware components. The system is
connected to the ATLAS detector and its main purpose is to read the data from the
detector, �lter out the subset of data which may be of interest for further analysis and
ultimately store the data. This data is then later used for the so called �o�-line� anal-
ysis. The system gathers the data as it is produced by the detector and is therefore
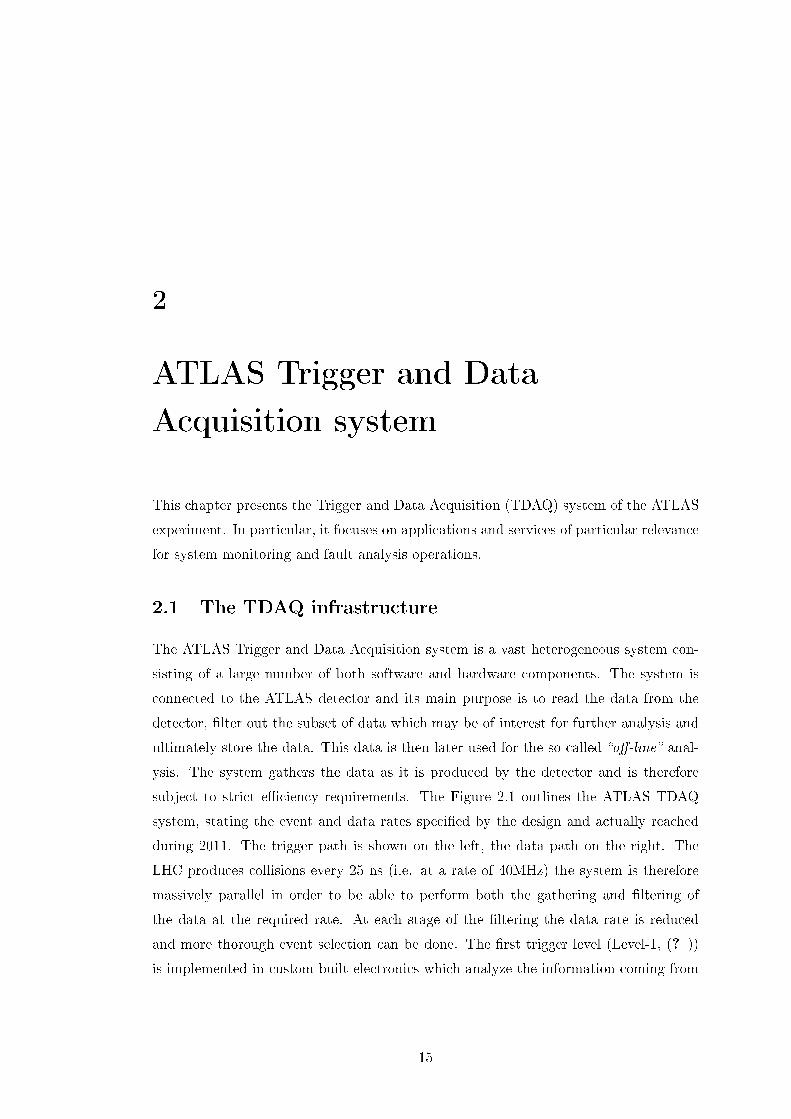
subject to strict e�ciency requirements. The Figure 2.1 outlines the ATLAS TDAQ
system, stating the event and data rates speci�ed by the design and actually reached
during 2011. The trigger path is shown on the left, the data path on the right. The
LHC produces collisions every 25 ns (i.e. at a rate of 40MHz) the system is therefore
massively parallel in order to be able to perform both the gathering and �ltering of
the data at the required rate. At each stage of the �ltering the data rate is reduced
and more thorough event selection can be done. The �rst trigger level (Level-1, (? ))
is implemented in custom built electronics which analyze the information coming from
15
2. ATLAS TRIGGER AND DATA ACQUISITION SYSTEM
Data
Flo
w
Dete
cto
r R
ead
ou
t
Event filter
Level 1
Level 2
Custom hardware
Processing Units
Calorimeter/Muon
FE
ROD
Other
FE
ROD
Other
FE
RODLevel 1 Accept
Readout systemReadout systemReadout system
Data collection network
Readout systemReadout systemEvent builder
Readout systemData Logger
ROI data
L2 accept
Event rates design
(2011 peaks)
40 MHz(20 MHz)
75 kHz(~65 kHz)
3 kHz(~5.5 kHz)
200 Hz(~600 Hz)
TRIGGER
DAQ
Data rates design
(2011 peaks)
ATLAS event1.5 MB/25 ns
(1.2 MB/50 ns)
~ 110 GB/s(~80 GB/s)
~ 4.5 GB/s(~ 6.5 GB/s)
300 MB/s (~600 MB/s)
...
Processing Units
...
~ 6000 cores
Event filter network
5 cores
~ 150 cores
~ 100 cores
~ 6000 cores
Full events
EF accepts
CERNpermanent
storage
Regions of Interest (ROI)
Figure 2.1: Outline of the ATLAS Trigger and Data Acquisition system with event and
data rates.
the muon chambers and the calorimeters to produce a coarse event selection with a
maximum output event rate of 75 kHz. The other two levels are software-based, run on
commodity PCs and have access to the detector data at full granularity. The second
trigger level (Level-2) has tight timing constraints and thus accesses only a subset of
event data in the so-called �Regions of Interest� (RoIs), de�ned by the Level-1. After
the event selection provided by the Level-2, the maximum event rate is 5.5 kHz. The
last trigger level, called Event Filter, analyzes the full events selected by the Level-2
and sends the accepted ones to the data-logging system, with a peak event rate of 600
Hz.
2.1.1 Computing farms
The ATLAS TDAQ system requires the usage of a large computing farm, most of the
nodes being dedicated to the High Level Triggers (HLT), i.e. the Level-2 trigger and the
16
2.1 The TDAQ infrastructure
Component Nodes
Control and Con�guration 60 + 44 rack servers
ROS 150
RoI Builder, L2 servers 6
HLT (L2 + EF) 963 XPU + 434 EF (6300 L2 + 6400 EF applications)
Event Builder 48 (96 applications)
SFO 5 (headroom for high throughput (1.2 GB/s peak))
Table 2.1: ATLAS TDAQ farm composition.
Event Filter. Data �ows from the detector front-end devices to the Level-2 processors
and the event building nodes through a dedicated network; a second network connects
the Event Builder to the Event Filter and the output nodes. A third network (control
network) connects all the nodes and is used to send commands and share monitoring
information. Table 2.1shows the current farm composition. All the nodes and the
network equipment are installed and active in the system, with the exception of the
HLT nodes, which are added incrementally to the system to follow the evolution of
need due to increasing LHC luminosity. HLT nodes are installed in racks; each rack
contains a �le/boot server for computing units, a node dedicated to software services
(database caching, monitoring information service, etc.) and several computing units.
HLT racks contain either nodes dedicated to EF processes, connected to EF network
only, or nodes (called Processin Unit, or XPU) connected to both the Level-2 and the
EF network. The latter can be con�gured as either Level-2 or EF processing units,
improving �exibility in assigning resources.
Globally the system involved in 2011 data taking operations comprises approxi-
mately 2000 heterogeneous nodes for an overall number of deployed cored around 13000.
At such a size errors must be expected and they do indeed frequently occur in the system.
It is therefore of great importance that the system is able to deal with and recover from
these errors, when they occur. When the TDAQ system will be completely deployed,
there will be more than 20000 applicaitons involved in data taking operations.
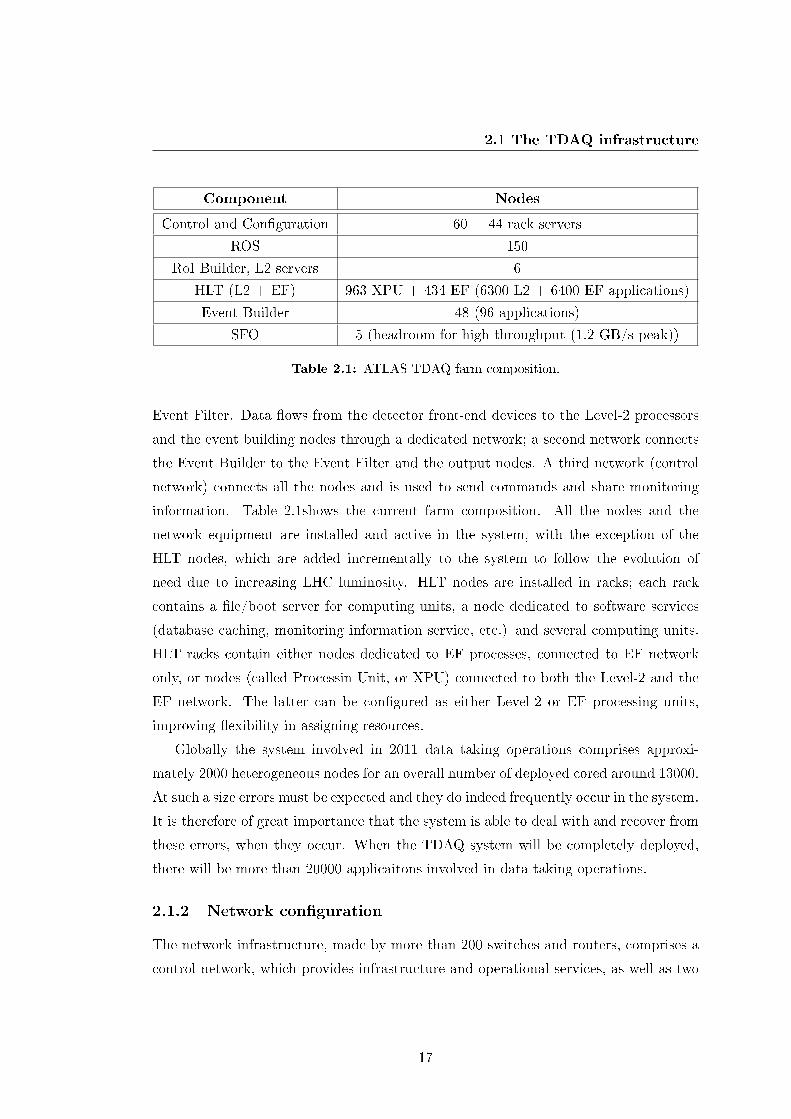
2.1.2 Network con�guration
The network infrastructure, made by more than 200 switches and routers, comprises a
control network, which provides infrastructure and operational services, as well as two
17
2. ATLAS TRIGGER AND DATA ACQUISITION SYSTEM
Figure 2.2: TDAQ routers layout.
dedicated data networks, used exclusively for transferring the experimental data. All
these networks rely on the IP (Internet Protocol) protocol and are implemented using
Ethernet technology. Figure 2.2 shows the three HLT networks and their interface with
ATCN (Atlas Technical and Control Network, the general purpose network from the
ATLAS experimental site).
2.2 Software infrastructure
This section introduces the main software components and services composing the data
acquisition system, with particular focus on the ones involved in operational procedures
and error diagnosis processes. In addition to the processes directly taking part in the
�ow of data there are also a number of services providing functionality in order to moni-
tor the system, store application errors and warnings, provide means of communication,
enabling data quality monitoring, etc. These services are referred as the core-services
of the TDAQ system, composing the framework to control, command and synchronize
of all the processes involved in data taking.
2.2.1 Inter Process Communication (IPC)
Given the size and the distributed and heterogeneous nature of the ATLAS TDAQ
system support for inter process communication by highly scalable distributed middle-
ware with excellent performance is required. Due to the long life time of the ATLAS
18
2.2 Software infrastructure
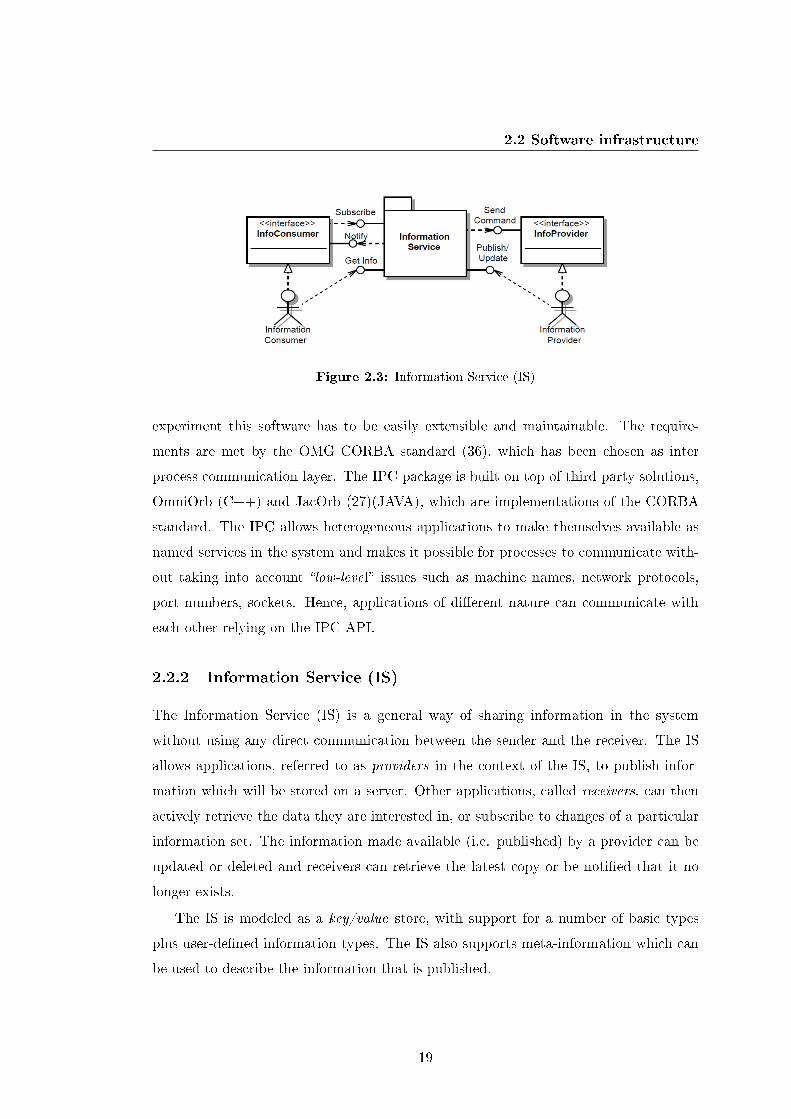
Figure 2.3: Information Service (IS)
experiment this software has to be easily extensible and maintainable. The require-
ments are met by the OMG CORBA standard (36), which has been chosen as inter
process communication layer. The IPC package is built on top of third party solutions,
OmniOrb (C++) and JacOrb (27)(JAVA), which are implementations of the CORBA
standard. The IPC allows heterogeneous applications to make themselves available as
named services in the system and makes it possible for processes to communicate with-
out taking into account �low-level� issues such as machine names, network protocols,
port numbers, sockets. Hence, applications of di�erent nature can communicate with
each other relying on the IPC API.
2.2.2 Information Service (IS)
The Information Service (IS) is a general way of sharing information in the system
without using any direct communication between the sender and the receiver. The IS
allows applications, referred to as providers in the context of the IS, to publish infor-
mation which will be stored on a server. Other applications, called receivers, can then
actively retrieve the data they are interested in, or subscribe to changes of a particular
information set. The information made available (i.e. published) by a provider can be
updated or deleted and receivers can retrieve the latest copy or be noti�ed that it no
longer exists.
The IS is modeled as a key/value store, with support for a number of basic types
plus user-de�ned information types. The IS also supports meta-information which can
be used to describe the information that is published.
19
2. ATLAS TRIGGER AND DATA ACQUISITION SYSTEM
Any TDAQ application can act as a client to one or several IS servers by using one
of the public interfaces provided by the IS, as in Figure 2.3:
� an information provider can publish its own information to an IS server via the
Publish interface and inform it about changes in the published information via
the Update interface,
� an information consumer can either access the information of an IS server on
request, via the GetInfo interface, or can be noti�ed, via a call-back mechanism
when new or updated information are available.
Many of the applications publish statistics about their own performance using this
service, and it is therefore of interest when doing error detection. For example, a
reduction in the processing rate for a number of applications may be an indication that
something has gone wrong in the system. Being one of the main information sources
for the AAL project, the IS structure and details are discussed in 5.2.
2.2.3 Error Reporting Service (ERS)
Every software component of the TDAQ system uses the Error Reporting Service (ERS)
to report issues, i.e. events that need attention, either to the software component calling
it or to the external environment, like e.g. a human operator or an expert system.
The ERS provides several services, including a common format and a �xed range of
severity levels for all errors reported in the TDAQ system. It is possible to con�gure
global settings that de�ne the behavior of error reporting, such as where errors are
sent, amount of information for each error, etc. This common framework also makes
it possible to collect errors into classes/groups to be reused by other applications. The
ERS relies on the MRS package in order to distribute error messages between di�erent
applications and also to allow for subscriptions to di�erent messages.
2.2.4 Message Reporting Service (MRS)
The Message Reporting Service (MRS) (18) is the service used for distributing messages
between di�erent TDAQ applications using a publish/subscribe model. It provides a
means of sending messages between the applications in the system and is designed to be
scalable in order to sustain any needed message rate. The publish/subscribe approach
20
2.2 Software infrastructure
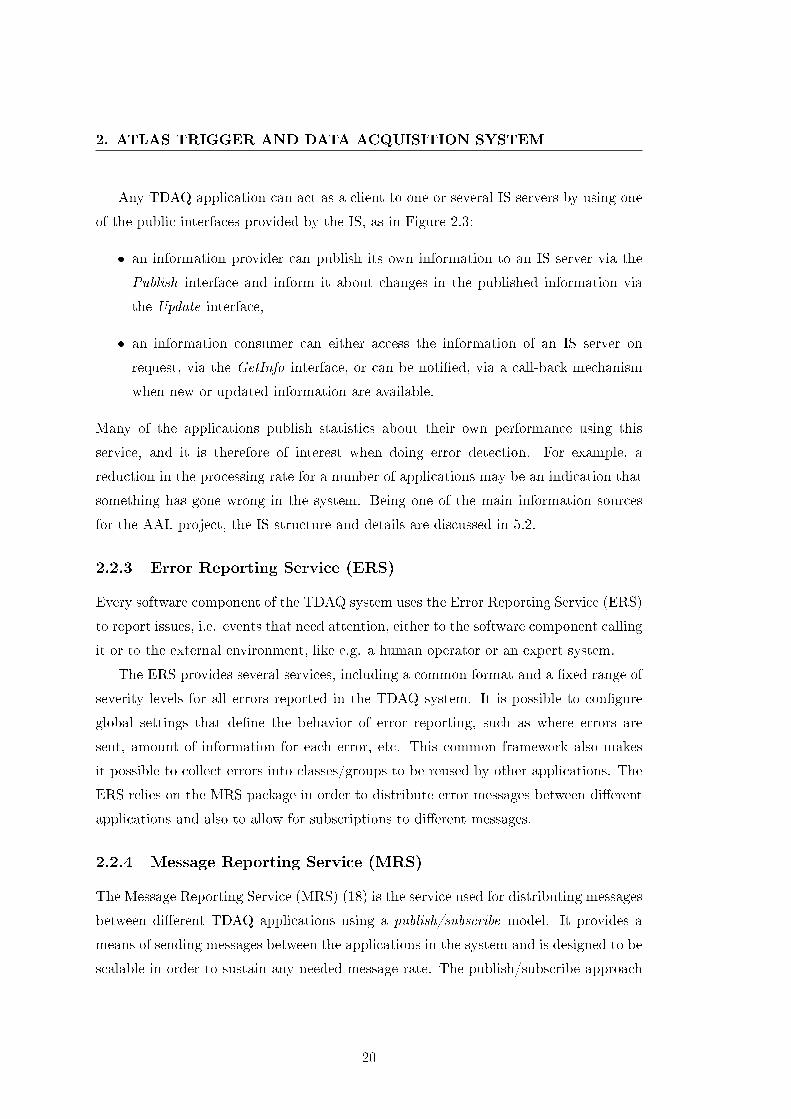
Figure 2.4: Message displayed by the Message viewer application.
decouples the message producer from the multiple consumers that may be interested in
receiving it. The �ow of messages can be seen online by the TDAQ shift operators in
the MRS monitor application (see Figure 2.4).
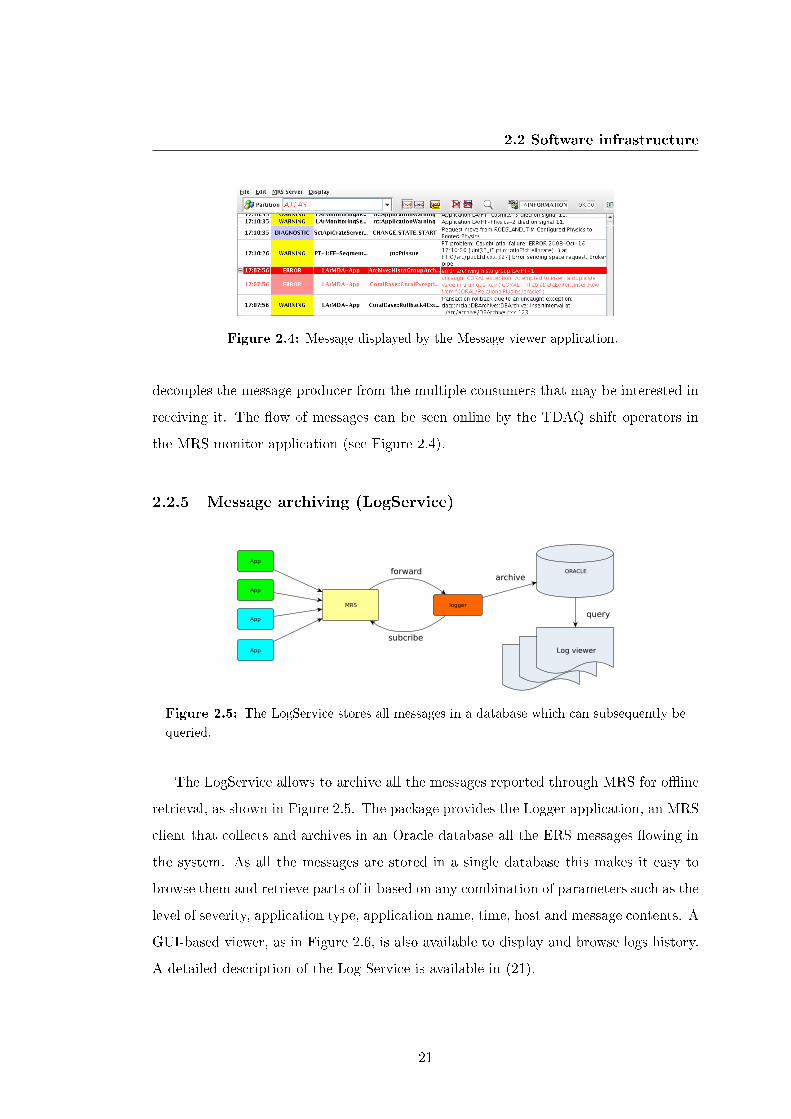
2.2.5 Message archiving (LogService)
App
App
App
App
MRS logger
ORACLE
Log viewer
subcribe
forwardarchive
query
Figure 2.5: The LogService stores all messages in a database which can subsequently be
queried.
The LogService allows to archive all the messages reported through MRS for o�ine
retrieval, as shown in Figure 2.5. The package provides the Logger application, an MRS
client that collects and archives in an Oracle database all the ERS messages �owing in
the system. As all the messages are stored in a single database this makes it easy to
browse them and retrieve parts of it based on any combination of parameters such as the
level of severity, application type, application name, time, host and message contents. A
GUI-based viewer, as in Figure 2.6, is also available to display and browse logs history.
A detailed description of the Log Service is available in (21).
21
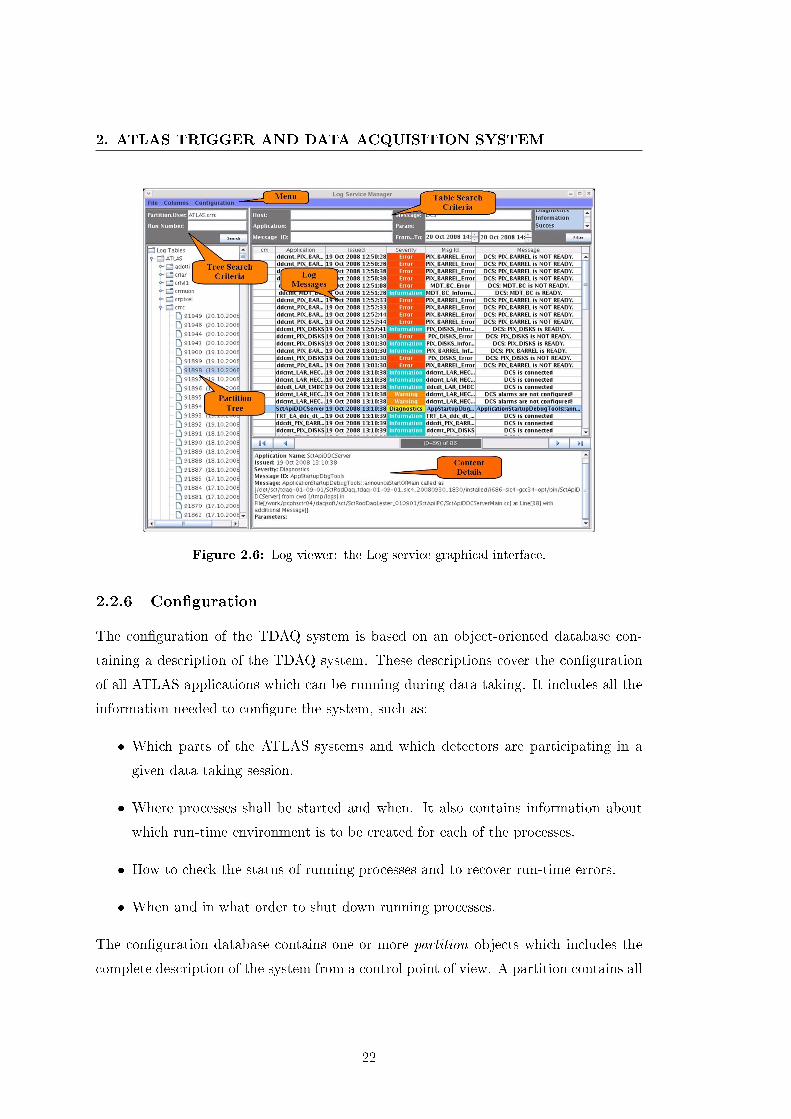
2. ATLAS TRIGGER AND DATA ACQUISITION SYSTEM
Figure 2.6: Log viewer: the Log service graphical interface.
2.2.6 Con�guration
The con�guration of the TDAQ system is based on an object-oriented database con-
taining a description of the TDAQ system. These descriptions cover the con�guration
of all ATLAS applications which can be running during data taking. It includes all the
information needed to con�gure the system, such as:
� Which parts of the ATLAS systems and which detectors are participating in a
given data taking session.
� Where processes shall be started and when. It also contains information about
which run-time environment is to be created for each of the processes.
� How to check the status of running processes and to recover run-time errors.
� When and in what order to shut down running processes.
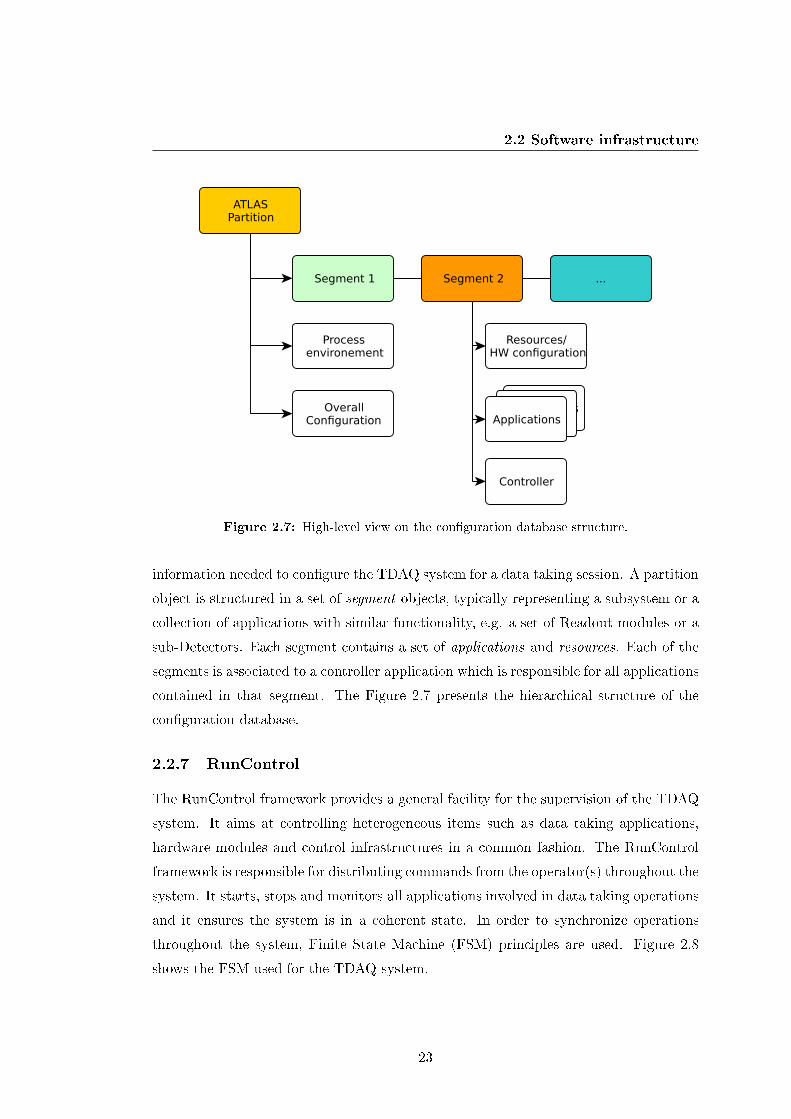
The con�guration database contains one or more partition objects which includes the
complete description of the system from a control point of view. A partition contains all
22
2.2 Software infrastructure
Applications
ATLASPartition
Segment 1 Segment 2 ...
Processenvironement
OverallConfiguration
Resources/HW configuration
Applications
Controller
Figure 2.7: High-level view on the con�guration database structure.
information needed to con�gure the TDAQ system for a data taking session. A partition
object is structured in a set of segment objects, typically representing a subsystem or a
collection of applications with similar functionality, e.g. a set of Readout modules or a
sub-Detectors. Each segment contains a set of applications and resources. Each of the
segments is associated to a controller application which is responsible for all applications
contained in that segment. The Figure 2.7 presents the hierarchical structure of the
con�guration database.
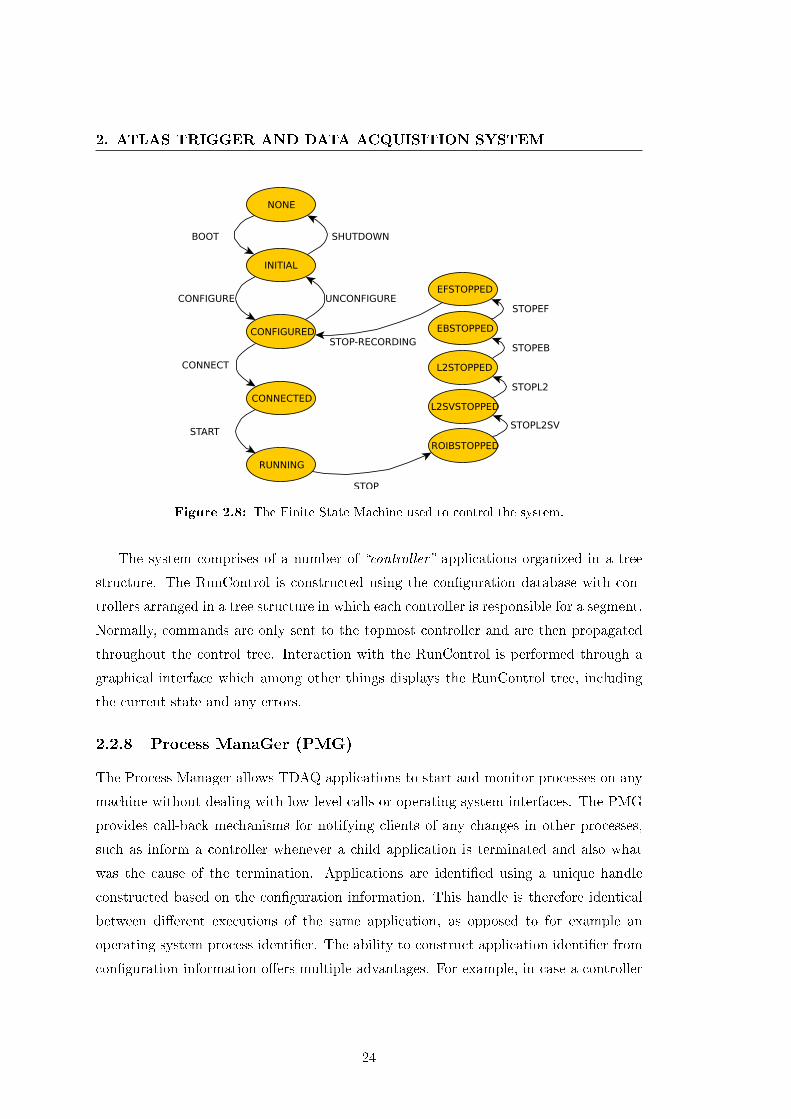
2.2.7 RunControl
The RunControl framework provides a general facility for the supervision of the TDAQ
system. It aims at controlling heterogeneous items such as data taking applications,
hardware modules and control infrastructures in a common fashion. The RunControl
framework is responsible for distributing commands from the operator(s) throughout the
system. It starts, stops and monitors all applications involved in data taking operations
and it ensures the system is in a coherent state. In order to synchronize operations
throughout the system, Finite State Machine (FSM) principles are used. Figure 2.8
shows the FSM used for the TDAQ system.
23
2. ATLAS TRIGGER AND DATA ACQUISITION SYSTEM
NONE
INITIAL
CONFIGURED
CONNECTED
RUNNING
ROIBSTOPPED
L2SVSTOPPED
L2STOPPED
EBSTOPPED
EFSTOPPED
SHUTDOWNBOOT
UNCONFIGURE
STOPL2SV
CONFIGURE
CONNECT
START
STOP
STOPL2
STOPEB
STOPEF
STOP-RECORDING
Figure 2.8: The Finite State Machine used to control the system.
The system comprises of a number of �controller� applications organized in a tree
structure. The RunControl is constructed using the con�guration database with con-
trollers arranged in a tree structure in which each controller is responsible for a segment.
Normally, commands are only sent to the topmost controller and are then propagated
throughout the control tree. Interaction with the RunControl is performed through a
graphical interface which among other things displays the RunControl tree, including
the current state and any errors.
2.2.8 Process ManaGer (PMG)
The Process Manager allows TDAQ applications to start and monitor processes on any
machine without dealing with low-level calls or operating system interfaces. The PMG
provides call-back mechanisms for notifying clients of any changes in other processes,
such as inform a controller whenever a child application is terminated and also what
was the cause of the termination. Applications are identi�ed using a unique handle
constructed based on the con�guration information. This handle is therefore identical
between di�erent executions of the same application, as opposed to for example an
operating system process identi�er. The ability to construct application identi�er from
con�guration information o�ers multiple advantages. For example, in case a controller
24
2.3 Conclusions
has been restarted it is able to �nd out which of its child processes are still running
and regain complete control of them. It can then start applications that are missing or
otherwise bring its part of the system back to the state in which it should be.
The PMG provides also the functionalities to query the status of the system, for
example to �nd out whether an application is indeed running and not responding or
whether it is actually not running at all, making it a precious tool for system debugging
and error diagnosis.
2.3 Conclusions
This chapter has provided an introduction of the ATLAS TDAQ system and its main
components. It introduces the TDAQ architecture, it gives a brief overview of the
TDAQ computing and networking infrastructure and thus it focuses on applications
and services of particular relevance for system monitoring and fault analysis operations.
For a more complete description please refer to (8).
25
2. ATLAS TRIGGER AND DATA ACQUISITION SYSTEM
26
Chapter 3
Problem introduction
The TDAQ system is operated by a non-expert shift crew, assisted by a set of experts
providing knowledge for speci�c components. The daily work of operators is made
of procedures to run the system, periodic checks and controls on system status, well
de�ned reaction in case of known problems and interaction with experts in case of non
standard issues. The evaluation of the correctness of running operations requires strong
competence and experience in understanding log messages and monitoring information,
and often the meaningful information is not in the single event but in the aggregated
behaviour in a certain time-line. As presented in this chapter, the 50% of the TDAQ
data taking ine�ciency (i.e. the loss of experimental data) is coming from situations
where a human intervention is involved. Due to the very critical operational task, both
economically and in terms of manpower, dealing fast and e�ectively with problems and
failures is fundamental to minimize operational ine�ciency. In this respect, a high-level
monitoring tool helping operators with automated diagnosis of problems and suggesting
the appropriate reaction could reduce the time for error management and minimize the
loss of experimental data. This is the objective of the AAL project: to be an automated
and intelligent assistant for TDAQ operators.
3.1 Operating the data acquisition system
The ATLAS data taking operations are executed from the so-called �ATLAS Control
Room� (ACR), shown in Figure 3.1, by a team of operators each of them with speci�c
27
3. PROBLEM INTRODUCTION
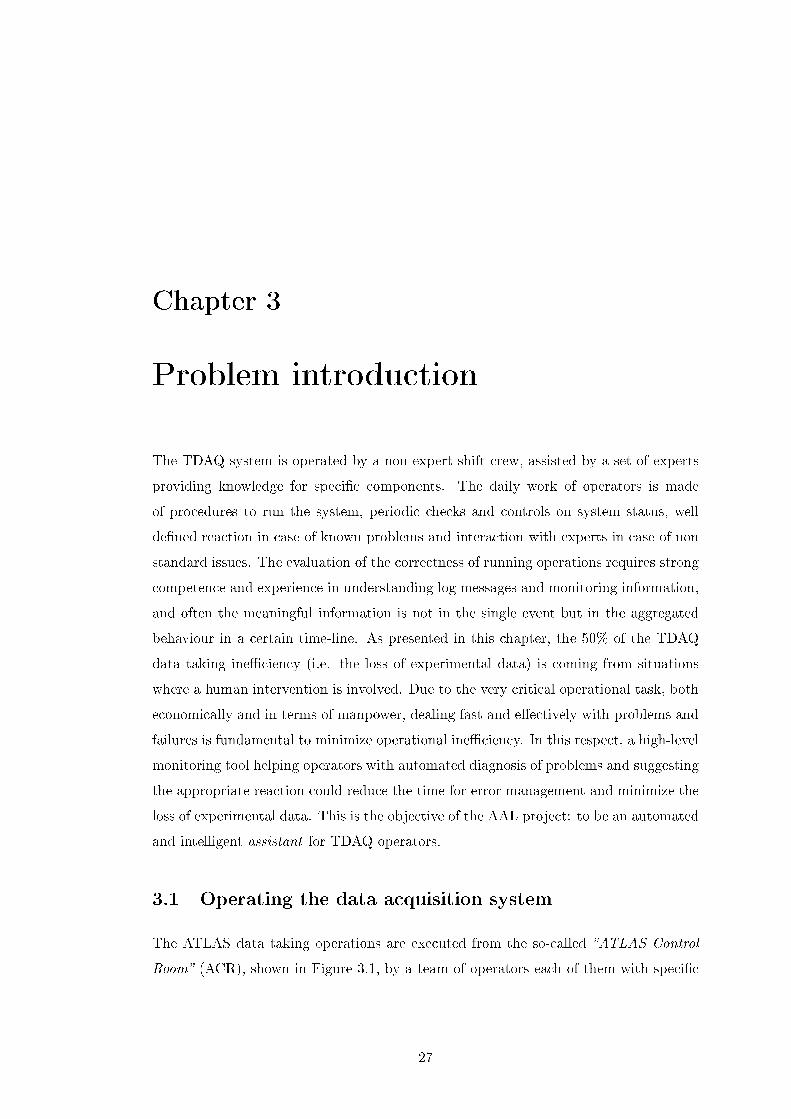
Figure 3.1: The ATLAS control room.
responsibility on a experiment's1 aspect, ranging from safety to data quality monitoring.
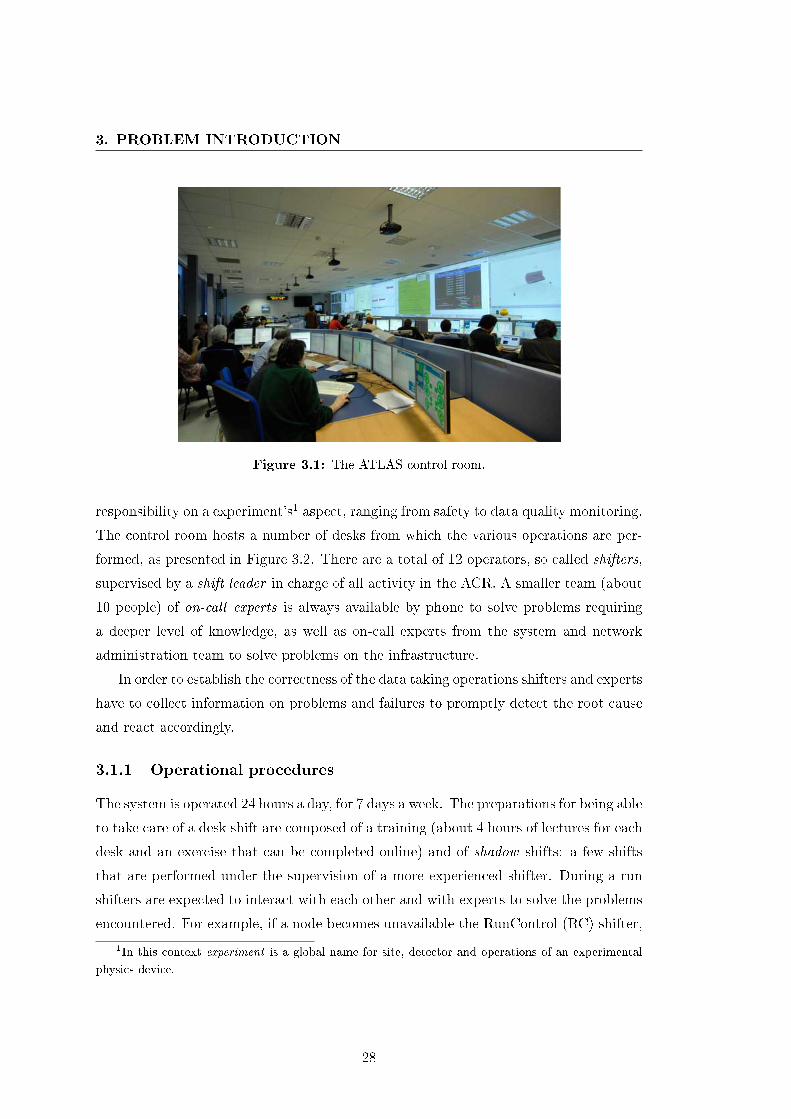
The control room hosts a number of desks from which the various operations are per-
formed, as presented in Figure 3.2. There are a total of 12 operators, so called shifters,
supervised by a shift leader in charge of all activity in the ACR. A smaller team (about
10 people) of on-call experts is always available by phone to solve problems requiring
a deeper level of knowledge, as well as on-call experts from the system and network
administration team to solve problems on the infrastructure.
In order to establish the correctness of the data taking operations shifters and experts
have to collect information on problems and failures to promptly detect the root cause
and react accordingly.
3.1.1 Operational procedures
The system is operated 24 hours a day, for 7 days a week. The preparations for being able
to take care of a desk shift are composed of a training (about 4 hours of lectures for each
desk and an exercise that can be completed online) and of shadow shifts: a few shifts
that are performed under the supervision of a more experienced shifter. During a run
shifters are expected to interact with each other and with experts to solve the problems
encountered. For example, if a node becomes unavailable the RunControl (RC) shifter,
1In this context experiment is a global name for site, detector and operations of an experimental
physics device.
28
3.1 Operating the data acquisition system
Figure 3.2: Operators desk con�guration.
responsible for controlling the infrastructure, disables that node and informs the system
administrators as well as the data �ow (DAQ/HLT) shifter, responsible for the data
�ow operations, who knows the details of the farms. If the level of knowledge in the
ACR is not su�cient, the shifters refer to the on-call experts who are available for
solving problems requiring a deeper level of knowledge. The on-call phones also have a
certain hierarchy: if the primary TDAQ on-call phone holder can not solve the actual
problem, this person forwards the problem to the secondary on-call experts with speci�c
competency: front-end electronics; events selection; event building and control and
con�guration. The system and network administration phones are also active 24/7 to
intervene on problems which go beyond the TDAQ software and hardware. Accumulated
experience in 2010 and 2011 shows that the primary on-call person is called on the
average about 4-5 times a week and in very few occasions the call is forwarded to the
secondary experts (22).
3.1.2 Monitoring infrastructure
The evaluation of correctness of running operations requires shifters and experts to
gather and correlate information from multiple data sources, often to be aggregated in
a certain time-line. Given the layered nature of the TDAQ infrastructure, as presented
in Section 1.2.1, information sources are spread among the di�erent levels and provide
views on multiple aspects of the data acquisition system. The monitoring infrastructure
is composed of data providers at di�erent levels that can be grouped in three main
29
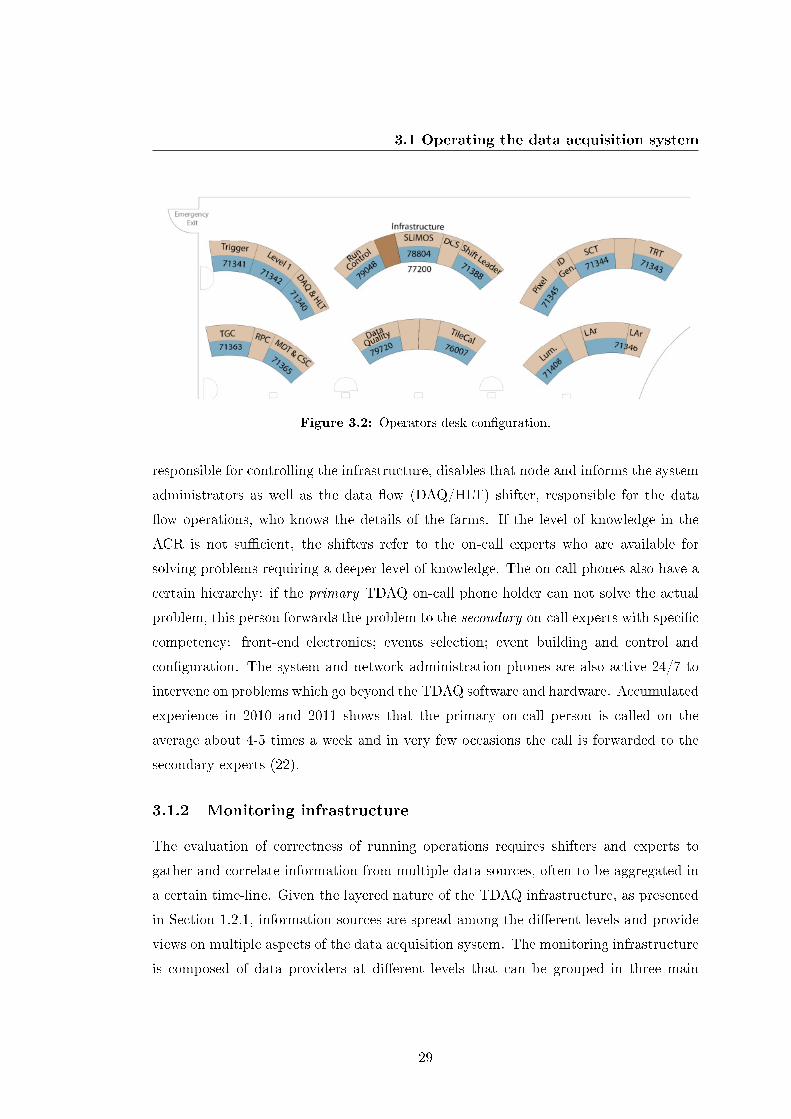
3. PROBLEM INTRODUCTION
Figure 3.3: High-level view on operational procedures.
categories:
� TDAQ core-services: which provide access to low-level, un�ltered data about
the basic activities in the system, for example application logs, process communi-
cation and system con�guration.
� Data Monitoring tools: a set of high-level monitoring tools that provides views
at di�erent levels of the data-�ow chain. They may collect and aggregate infor-
mation from other providers to compute new information, such as displaying the
overall data �ltering and archiving rates during runs.
� Farm tools: a set of speci�c tools managed by system and network administra-
tor to provide information about the status of the farm and of the networking
infrastructure.
From a functional perspective, information is made available via several GUI interfaces
or web pages. Operators and experts have to know which tool to use to retrieve the
information they need. In the next sections the di�erent categories are detailed.
30
3.1 Operating the data acquisition system
3.1.2.1 TDAQ core-services
This section presents the TDAQ core-services that are relevant for monitoring opera-
tions:
� The Information Service (IS) provides generic means for sharing information be-
tween distributed TDAQ applications, in a publish/subscribe fashion. Information
is stored in memory by so called IS servers and it is modelled as generic key-value
pairs with support for user-de�ned types. IS is the most common approach to
store functional and operational data used by TDAQ applications, so it plays a
key role in checking the correctness of system behaviour. The generic key-value
approach allows for high �exibility on the types of information managed, but it
also requires the user to know exactly the key corresponding to the desired data.
IS manages thousands of di�erent pieces of information and it handles a very high
update rate (sustained 5 kHz in running condition, with peaks of 100 kHz). In
this way, it re�ects with great precision the status of data acquisition applications.
However, since IS is mainly designed for information sharing, it o�ers a view only
on the last snapshot of the published information, without any historical data.
� Error and message reporting : every software component of the TDAQ system uses
the Error Reporting Service (ERS) to report issues, i.e. events that need atten-
tion, either to the software component calling it or to the external environment,
like e.g. a human operator or an expert system. The inter-process transport mech-
anism for messages is called Message Reporting System (MRS). The Log Service
package allows to archive messages for o�ine retrieval. This is the main source of
information for operators and experts to investigate data acquisition operations
over time. Although the message viewer GUI allows users to �lter log messages
on several criteria, the process of extracting meaningful information is not trivial.
The �ow of messages generated by the thousands of TDAQ applications can be
easily in the order of 100/hour in normal condition but it can fast grow with spike
of 1000/minute in case of error situations.
� Con�guration database: stores a large number of parameters describing the data
acquisition system architecture, the hardware and the software components and
run conditions. It contains for example information about the system topology,
31
3. PROBLEM INTRODUCTION
Figure 3.4: Data quality monitoring tool.
i.e. which machines are actually part of the data acquisition infrastructure, which
applications run on which machine, application parameters, etc.
The Integrated Graphical User Interface (IGUI), that is the graphical interface used by
shifters to operate the TDAQ system, is not properly a monitoring tool but it is the
�rst place where operators get noti�ed if something is not running properly. The IGUI
provides a tree-like representation of TDAQ computers and process retrieving the system
topology from the con�guration database. Every node represents a TDAQ application,
for which the corresponding operational data is read from IS. If an application is not
running correctly the problem is represented on the tree.
3.1.2.2 Data Monitoring tools
A set of higher-level monitoring tools has been developed to satisfy requirements com-
ing from di�erent ATLAS sub-detectors and to monitor di�erent levels of the data-�ow
chain. These tools aggregate information from the TDAQ core-services or from sampling
experimental data. The monitoring system is organised as a distributed framework. It
32
3.1 Operating the data acquisition system
includes core software applications for information-sharing, dedicated monitoring facil-
ities and graphical monitoring displays. The ATLAS TDAQ and sub-detector systems
are monitored in two di�erent ways:
� Operational Monitoring: from the hardware and software components func-
tional parameters are collected and published to the monitoring applications.
� Event Monitoring: sampled event data are analysed and the results are pub-
lished as monitoring information.
A set of visualization tools is available to presents the results produced by the monitoring
framework. These tools allow for a remote access to monitoring information, that is
an indispensable feature of the experiment operational model. This includes the access
to monitoring histograms, to the detector state and to the data quality status either
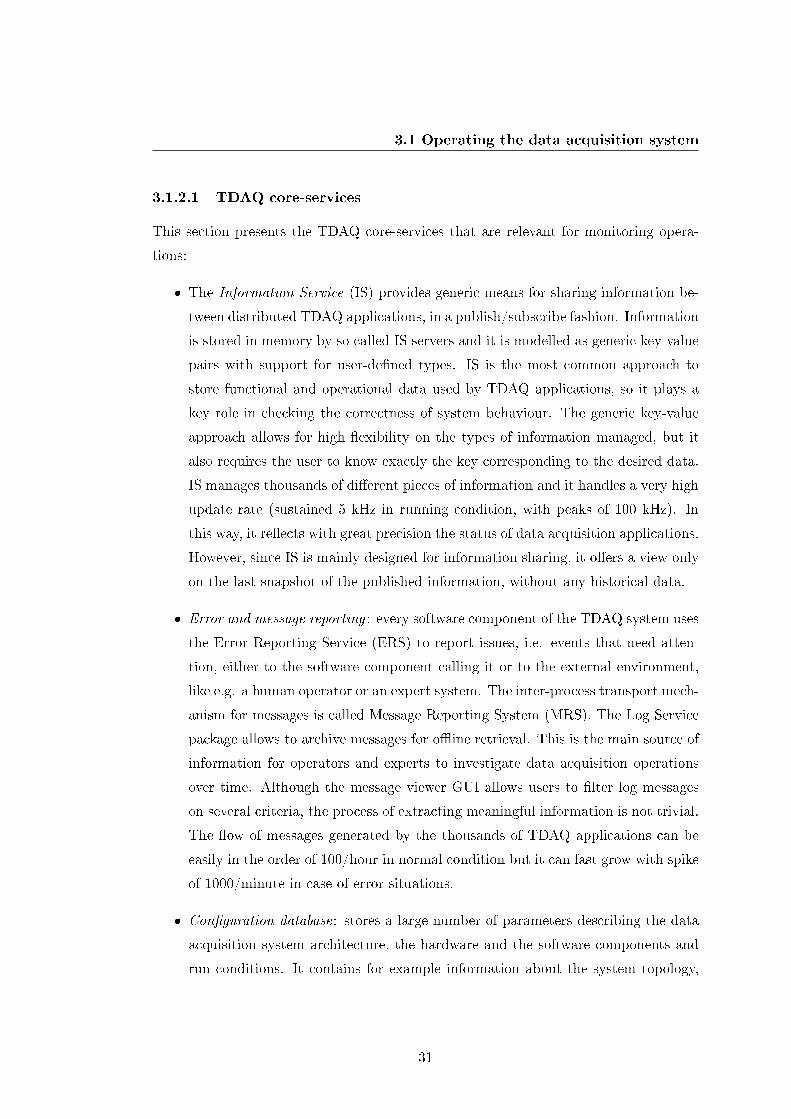
via web-based services or via direct export of monitoring displays. Figure 3.4 presents
an example of a high-level graphical user interface that shows results produced by the
Data Quality Monitoring (DQM) framework.
3.1.2.3 Farm and network tools
The trigger and data acquisition computing cluster contains about 2400 commissioned
computers (220 racks situated underground and about 100 racks on the surface). The
TDAQ computing system is being constantly monitored using the Nagios monitoring
software (34). For most of the ATCN nodes only low�level monitoring has been im-
plemented: basic OS warnings and errors are reported, network connections are being
regularly polled and hardware state is monitored. For some of the nodes (�le servers,
gateways, web servers) speci�c services are also monitored such as NTP, NFS and
DHCP.
The TDAQ network con�guration, as presented in (33), is composed by a control
network, which provides infrastructure and operational services, and by two dedicated
data networks, used exclusively for transferring the event data. The network is moni-
tored via dedicated tools:
� SNMP (Simple Network Management Protocol) polling engine that e�ciently
gathers statistics from all the network ports into RRD �les, with a polling in-
terval of at most 30 seconds;
33
3. PROBLEM INTRODUCTION
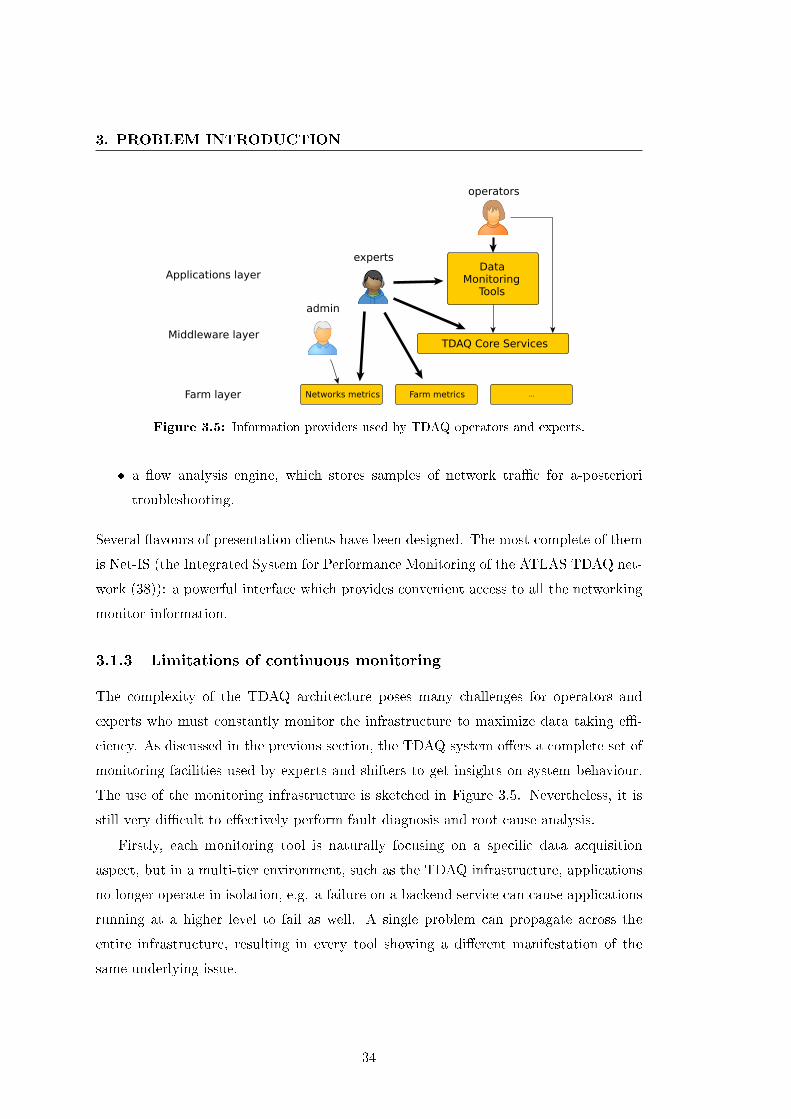
Networks metrics Farm metrics
TDAQ Core Services
Data Monitoring
Tools
Farm layer
Middleware layer
Applications layer
...
operators
experts
admin
Figure 3.5: Information providers used by TDAQ operators and experts.
� a �ow analysis engine, which stores samples of network tra�c for a-posteriori
troubleshooting.
Several �avours of presentation clients have been designed. The most complete of them
is Net-IS (the Integrated System for Performance Monitoring of the ATLAS TDAQ net-
work (38)): a powerful interface which provides convenient access to all the networking
monitor information.
3.1.3 Limitations of continuous monitoring
The complexity of the TDAQ architecture poses many challenges for operators and
experts who must constantly monitor the infrastructure to maximize data taking e�-
ciency. As discussed in the previous section, the TDAQ system o�ers a complete set of
monitoring facilities used by experts and shifters to get insights on system behaviour.
The use of the monitoring infrastructure is sketched in Figure 3.5. Nevertheless, it is
still very di�cult to e�ectively perform fault diagnosis and root cause analysis.
Firstly, each monitoring tool is naturally focusing on a speci�c data acquisition
aspect, but in a multi-tier environment, such as the TDAQ infrastructure, applications
no longer operate in isolation, e.g. a failure on a backend service can cause applications
running at a higher level to fail as well. A single problem can propagate across the
entire infrastructure, resulting in every tool showing a di�erent manifestation of the
same underlying issue.
34
3.1 Operating the data acquisition system
Secondly, fault diagnosis requires strong competence and experience. Operators
and experts have to know exactly where to look for the information they need, which
tool to use, via GUI, command line tools or web pages. In most cases the meaningful
information is not in the single data or message, but it requires to manually perform
correlation of events, often over a speci�c time line.
And lastly, high-level tools are not able to provide access to detailed monitoring
information. They aggregate monitoring data to provide a global view on the system,
but with a signi�cant loss of details. For debugging purposes operators have to rely
mainly on core services where the information is complete but more di�cult to handle.
Together with these limitations, which are related to the layered architecture of
the TDAQ system, there are a set of constraints speci�c to the TDAQ operational
procedure, detailed in the next paragraphs.
3.1.3.1 Dynamic system conditions
The complexity of the TDAQ architecture and the dynamics of system con�gurations
make it extremely di�cult to de�ne with absolute precision what has to be considered a
problem during data taking operation. A typical example is the analysis of log messages
reported by applications. There are situations when a fatal error message can be safely
ignored by the shifter because of known issues or temporary conditions. But the same
error has to be handled promptly and correctly when the temporary condition disap-
pears. As an example, issues reported from farm monitoring tools have to be handled
di�erently depending on the role of the involved machine in the data acquisition.
Instructions about known issues and temporary problems are collected by TDAQ
experts in wikis and web pages (5). Shifters are supposed to check them before taking
any action. This is a non-optimal and error-prone solution, experts have to be extremely
careful in keeping the pages up to date and shifters have to check the pages in case of
any problems.
3.1.3.2 No static thresholds
TDAQ farm monitoring tools already include systems, such as Ganglia (15) and Nagios(34),
capable of automatically detecting problems and sending noti�cations. These systems,
mainly focusing on system architecture issues, are primarily driven by threshold-based
35
3. PROBLEM INTRODUCTION
checks. As long as the result of a test or check lies within a prede�ned range, the
monitored service is considered to be operating normally.
This static threshold approach works well for low-level infrastructure monitoring
but is not appropriate for monitoring the correctness of data taking operations. The
dynamic TDAQ con�gurations make it extremely di�cult to de�ne the expected working
conditions. For example, the load on a machine is strongly dependent on its role in
TDAQ infrastructure and on the run conditions, such as event �ltering rates. This
makes static threshold only useful to detect hardware problem or boundary situations
(e.g. a disk full), but of poor utility to detect more complex scenarios.
3.1.3.3 Re-use of expert knowledge and formalization
Section 3.1.1 described how shifters interact with experts for most of the fault diagnosis
operations. Now that the TDAQ system is into the full operational phase, shifts are
often covered by new operators with limited experience. In case of problems the experts
have the knowledge and experience to investigate the issue and suggest the appropriate
reaction. But this information is given through a direct communication between the
shifter and the expert and it is not formally represented and maintained. Often, if the
problem appears again then the next operator will contact the expert posing the same
question. This is not optimal and is a clear ine�cient use of experts know-how.
3.1.3.4 Repetitive checks and controls
Operators duties include periodic checks and controls on system conditions and data
taking parameters, such as the veri�cation that all services are up and running correctly
and that no errors exist. Hourly reports have to be compiled with the results of a set of
test procedures. Often, the checked conditions correspond to rare situations that may
not have direct impact on data taking operations, but are still valuable for o�ine anal-
ysis. The repetitiveness of tasks and the low probability of problems occurrence lower
the attention threshold of operators, so that failures may not be promptly detected.
3.2 Error management in TDAQ
Given the size and complexity of the TDAQ system, errors and failures are bound
to happen and must be dealt with. The data acquisition system has to recover from
36
3.2 Error management in TDAQ
these errors promptly and e�ectively, possibly without the need to stop data taking
operations. This section introduces the Error Management System (EMS) that has
been implemented and is currently in use in TDAQ (? ). This EMS proved to be
very e�ective for automated recovery for well-de�ned situations. Nevertheless, only
a minor fraction of the overall operational procedures can be automated, and about
50% of the TDAQ operational ine�ciency, as presented in Section 3.4, is coming from
situations where human intervention is still required. In this respect, a high level tool
helping operators with diagnosis of problems and suggesting appropriate reaction is still
a missing technology. The design and implementation of such a system is the subject
of this thesis work and is presented in Chapters 5 and 6.
3.2.1 Error detection and recovery
Due to the very high costs of operation of the ATLAS experiment, both economically
and in terms of manpower, reducing the amount of downtime, here meaning the time
when the system is not performing its main tasks at its full potential, is very important.
The downtime consists of two periods of time:
� Time-to-detection: The time from when an error occurred in the system until the
error is detected. This clearly depends on the e�ectiveness of the error detection
system available, the skill of the human operator involved or a combination of the
two.
� Time-to-recovery : The time from when the error is detected until appropriate
actions have been performed and the system has been restored to a functional
state. The main contributions for this period are from two activities:
� problem investigation: the time from when the error is detected until the
cause is recognized;
� recovery action: the time spent in restoring the normal data taking opera-
tions.
3.2.2 The expert system approach
Expert systems (ESs) are a sub-�eld of Arti�cial Intelligence which deals with complex
problems within a well de�ned specialised �eld or domain. An ES is usually realised by
37
3. PROBLEM INTRODUCTION
encoding the knowledge of an expert in the �eld/domain in question in such a way that
this knowledge can be reproduced by an automated system.
3.2.2.1 Rule based expert system
In a rule based expert system the encoded expert knowledge is usually referred to as
the knowledge base and consists of rules in an IF-THEN form. Rules consist of two
parts, namely:
� Antecedents: One or more conditions that must be ful�lled for a proposition/rule
to be true. Hence, in a rule in the IF-THEN form it is the part that follows the
IF statement and precedes the THEN statement.
� Consequents: is the second half of a proposition. In a rule in the IF-THEN form,
the consequent is the part that follows the THEN statement.
The rule based system then relies on an inference engine in order to drive the system
and automatically activate rules that are relevant to the current situation. Inference
engines usually follow one of two approaches:
� Forward chaining : This is an approach where the working memory is matched with
the available rules so that if all the antecedents of a rule are ful�lled the consequent
part is added to the working memory. The CLIPS framework presented in 3.2.3.1
is using forward chaining.
� Backward chaining : As opposed to forward chaining this approach starts with a
consequent and attempts to and antecedents that followed that rule. An example
of a system using backward chaining is the logic programming language Prolog
(40).
3.2.3 The TDAQ Error Management System (EMS)
The Error Management System (EMS), presented below, aims at detecting failures and
performing recovery procedures during data taking operations without the need for
human intervention (? ). The main functionalities are:
� Gather the knowledge on system condition and errors, connecting to the core-
services such as IS and ERS.
38
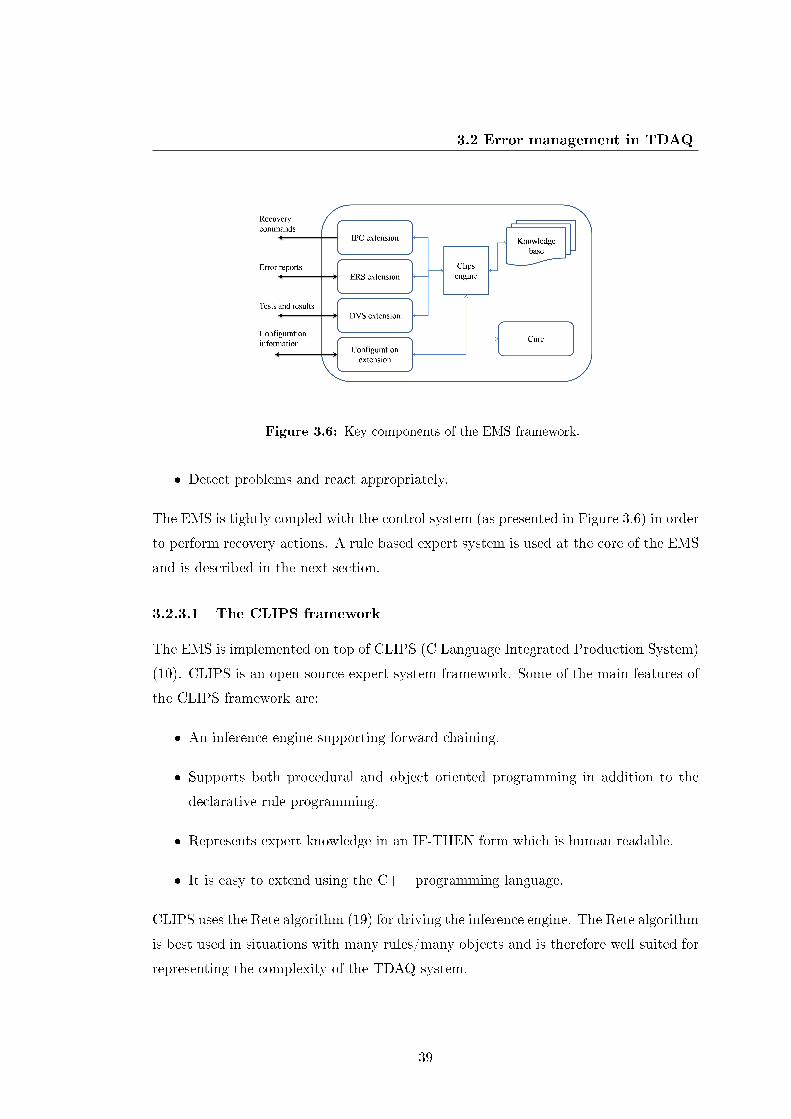
3.2 Error management in TDAQ
Figure 3.6: Key components of the EMS framework.
� Detect problems and react appropriately.
The EMS is tightly coupled with the control system (as presented in Figure 3.6) in order
to perform recovery actions. A rule based expert system is used at the core of the EMS
and is described in the next section.
3.2.3.1 The CLIPS framework
The EMS is implemented on top of CLIPS (C Language Integrated Production System)
(10). CLIPS is an open-source expert system framework. Some of the main features of
the CLIPS framework are:
� An inference engine supporting forward chaining.
� Supports both procedural and object oriented programming in addition to the
declarative rule programming.
� Represents expert knowledge in an IF-THEN form which is human readable.
� It is easy to extend using the C++ programming language.
CLIPS uses the Rete algorithm (19) for driving the inference engine. The Rete algorithm
is best used in situations with many rules/many objects and is therefore well suited for
representing the complexity of the TDAQ system.
39
3. PROBLEM INTRODUCTION
3.2.3.2 Knowledge base
At the core of the expert system is naturally the knowledge base containing the neces-
sary rules to e�ect the EMS. Information about the di�erent applications, computers
and other hardware is represented in the expert system using proxy objects. Whenever
the ES is started it is populated with relevant information such as class instances rep-
resenting all the applications in the controllers segment (in the case of the local unit).
This information can then trigger rules in the expert system. The matching of facts
and objects to the rule base is performed by the inference engine.
3.2.4 Limitations
Although the rule-based expert system approach suits well for the error recovery func-
tionalities provided by the EMS, there are limitations preventing its adoption as intel-
ligent engine in the scope of this thesis:
� Forward chaining is not appropriate for root cause analysis of problem. It adopts
a data-driven approach, i.e. the engine starts rules evaluation with the available
data and uses inference rules to extract more data until a goal is reached. It can
be used to detects error conditions but it is not meant to deduce how a particular
goal was achieved.
� The ability of the system to perform reasoning about time is very limited. While
it can react to and deal with a large number of facts, the IF-THEN approach is
not meant to detect complex patterns over time.
� System complexity. An expert system approach with a broader requirements set
was �rstly attempted more than 8 years ago for controlling the TDAQ system
(13). The size and the complexity of the knowledge base became very hard to
maintain it eventually required a redesign to deal only with error-management
functionalities (? ).
40
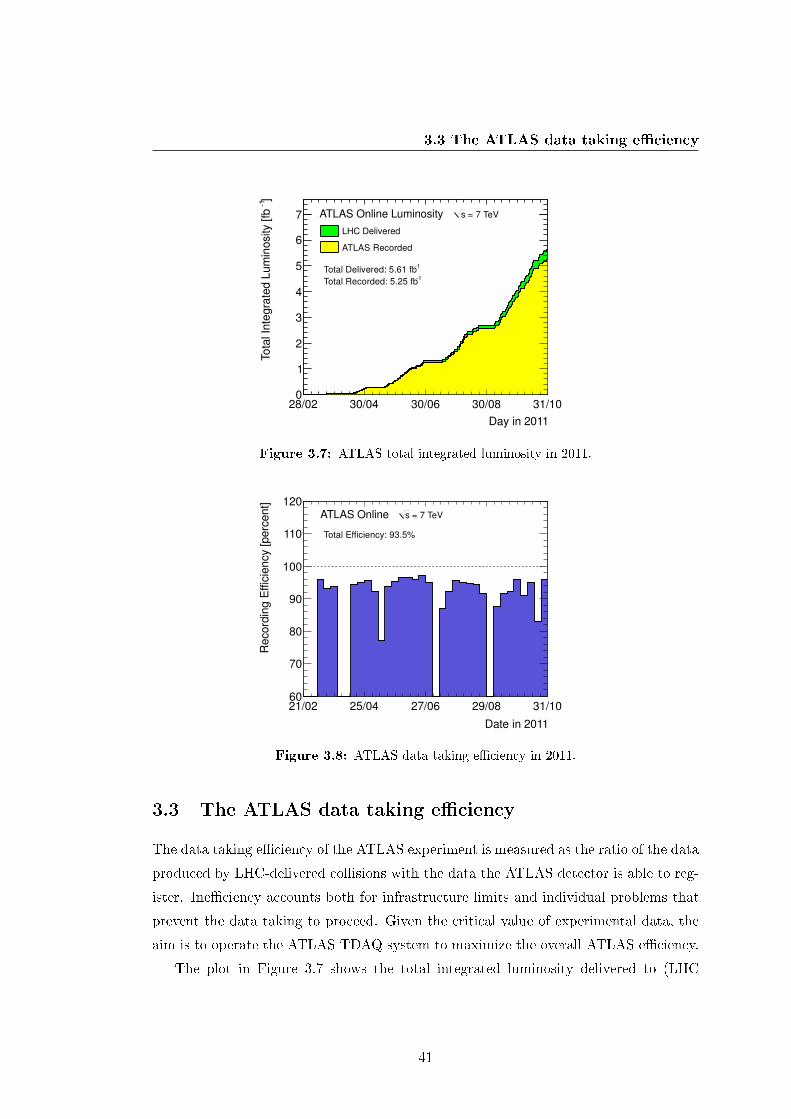
3.3 The ATLAS data taking e�ciency
Day in 2011
28/02 30/04 30/06 30/08 31/10
]1
To
tal In
tegra
ted L
um
inosity [fb
0
1
2
3
4
5
6
7 = 7 TeVs ATLAS Online Luminosity
LHC Delivered
ATLAS Recorded
1Total Delivered: 5.61 fb1Total Recorded: 5.25 fb
Figure 3.7: ATLAS total integrated luminosity in 2011.
Date in 2011
21/02 25/04 27/06 29/08 31/10
Record
ing E
ffic
ien
cy [perc
ent]
60
70
80
90
100
110
120 = 7 TeVs ATLAS Online
Total Efficiency: 93.5%
Figure 3.8: ATLAS data taking e�ciency in 2011.
3.3 The ATLAS data taking e�ciency
The data taking e�ciency of the ATLAS experiment is measured as the ratio of the data
produced by LHC-delivered collisions with the data the ATLAS detector is able to reg-
ister. Ine�ciency accounts both for infrastructure limits and individual problems that
prevent the data taking to proceed. Given the critical value of experimental data, the
aim is to operate the ATLAS TDAQ system to maximize the overall ATLAS e�ciency.
The plot in Figure 3.7 shows the total integrated luminosity delivered to (LHC
41
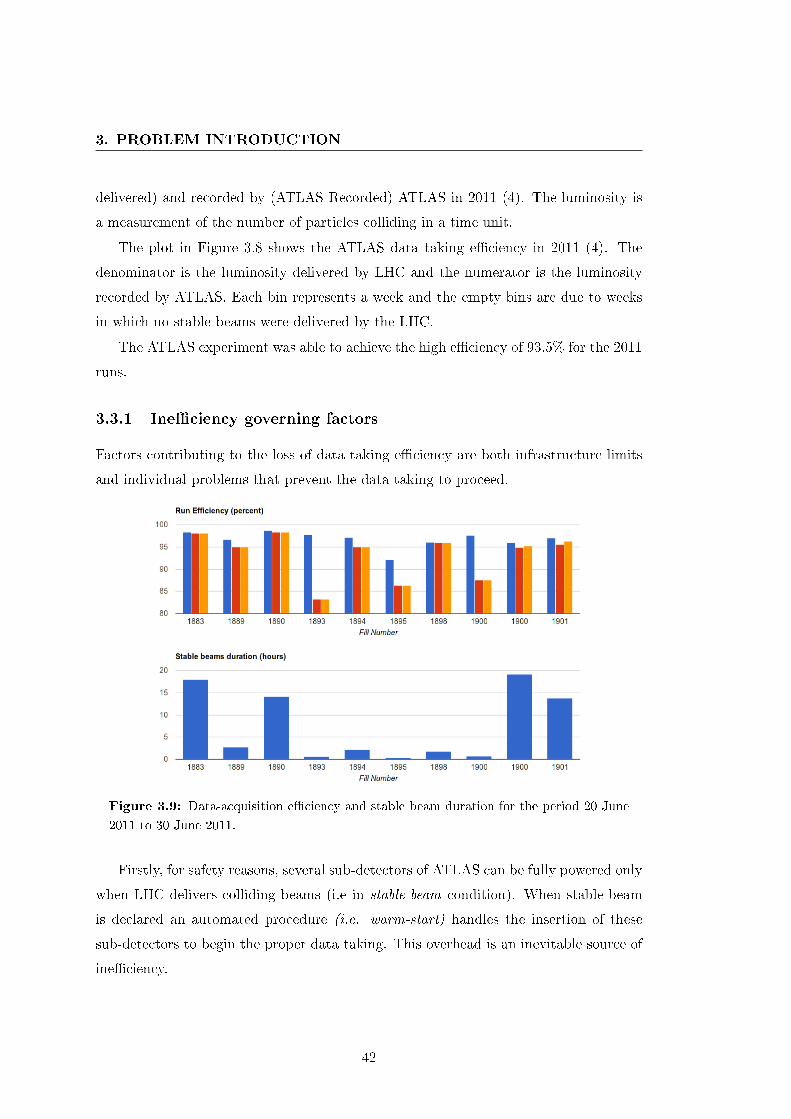
3. PROBLEM INTRODUCTION
delivered) and recorded by (ATLAS Recorded) ATLAS in 2011 (4). The luminosity is
a measurement of the number of particles colliding in a time unit.
The plot in Figure 3.8 shows the ATLAS data taking e�ciency in 2011 (4). The
denominator is the luminosity delivered by LHC and the numerator is the luminosity
recorded by ATLAS. Each bin represents a week and the empty bins are due to weeks
in which no stable beams were delivered by the LHC.
The ATLAS experiment was able to achieve the high e�ciency of 93.5% for the 2011
runs.
3.3.1 Ine�ciency governing factors
Factors contributing to the loss of data taking e�ciency are both infrastructure limits
and individual problems that prevent the data taking to proceed.
Figure 3.9: Data-acquisition e�ciency and stable beam duration for the period 20 June
2011 to 30 June 2011.
Firstly, for safety reasons, several sub-detectors of ATLAS can be fully powered only
when LHC delivers colliding beams (i.e in stable-beam condition). When stable-beam
is declared an automated procedure (i.e. warm-start) handles the insertion of these
sub-detectors to begin the proper data taking. This overhead is an inevitable source of
ine�ciency.
42
3.3 The ATLAS data taking e�ciency
Secondly, the system dead-time is another source of ine�ciency. It is the time when
the TDAQ system is running but the data is not collected (i.e the trigger is on-hold).
This can be due both to limitations on detector electronics or to problems in the data-
�ow chain.
Finally, there are many di�erent problems concerning the system con�guration and
operations that need to be handled promptly by operators to limit the loss of experi-
mental data.
The Figure 3.9 shows the data acquisition e�ciency for a sequence of LHC physics
�lls (i.e. identi�er for colliding time periods). For each LHC �ll, the top plot shows
three di�erent e�ciency values, respectively de�ned by (left to right):
� Overall e�ciency (blue) Ratio of data-taking time, excluding the dead-time, and
beam time.
� E�ciency with stable beams (red) Ratio of data-taking time with the detector in
full physics-mode (after the warm start), excluding the dead-time, and the time
with stable beams.
� E�ciency with stable beams excluding LHC dump handshake (orange). As the
previous one, but excluding the stable beam time lost due to the beam dump
handshake. This procedure is in fact known to arti�cially introduce ine�ciency
since the detector must be switched o� before the actual beam dump for safety.
The bottom plot instead presents the stable beam duration for each store. It can be
clearly observed that, for �lls lasting more than a few hours, normally the achieved
physics e�ciency is 95% or more. For shorter �lls, the time necessary to switch on the
detector after the beams are declared stable is not negligible.
43
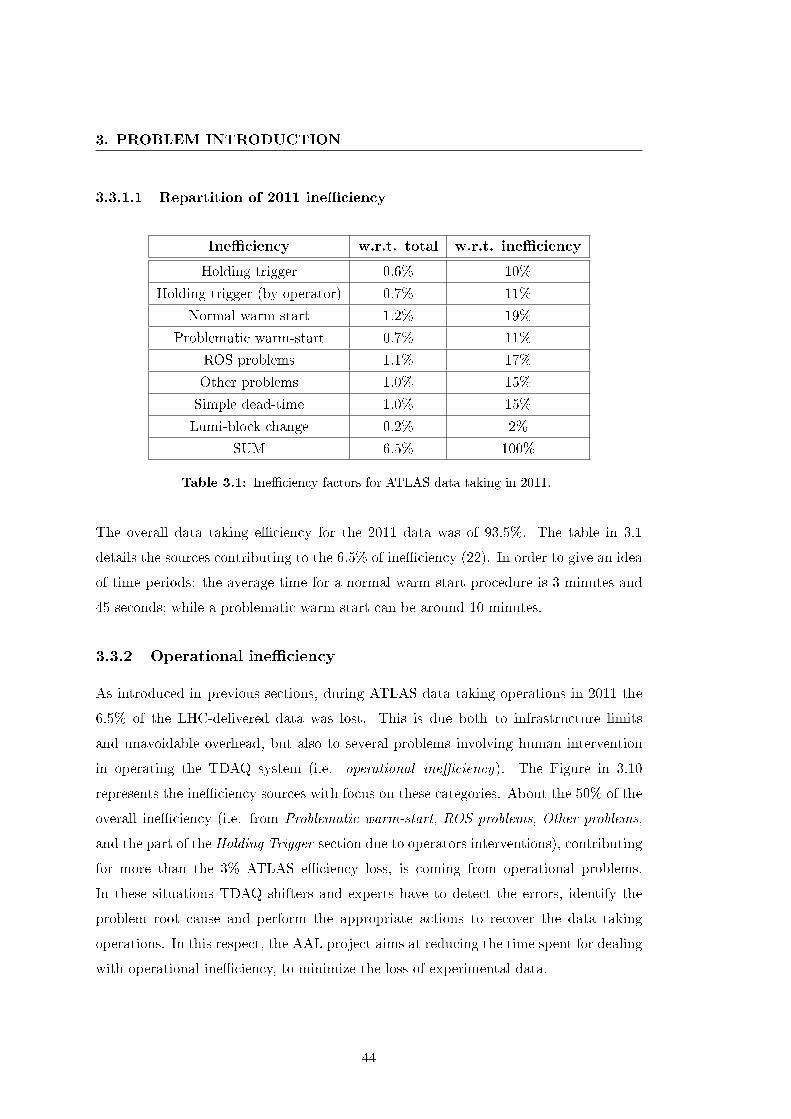
3. PROBLEM INTRODUCTION
3.3.1.1 Repartition of 2011 ine�ciency
Ine�ciency w.r.t. total w.r.t. ine�ciency
Holding trigger 0.6% 10%
Holding trigger (by operator) 0.7% 11%
Normal warm-start 1.2% 19%
Problematic warm-start 0.7% 11%
ROS problems 1.1% 17%
Other problems 1.0% 15%
Simple dead-time 1.0% 15%
Lumi-block change 0.2% 2%
SUM 6.5% 100%
Table 3.1: Ine�ciency factors for ATLAS data taking in 2011.
The overall data taking e�ciency for the 2011 data was of 93.5%. The table in 3.1
details the sources contributing to the 6.5% of ine�ciency (22). In order to give an idea
of time periods: the average time for a normal warm start procedure is 3 minutes and
45 seconds; while a problematic warm start can be around 10 minutes.
3.3.2 Operational ine�ciency
As introduced in previous sections, during ATLAS data taking operations in 2011 the
6.5% of the LHC-delivered data was lost. This is due both to infrastructure limits
and unavoidable overhead, but also to several problems involving human intervention
in operating the TDAQ system (i.e. operational ine�ciency). The Figure in 3.10
represents the ine�ciency sources with focus on these categories. About the 50% of the
overall ine�ciency (i.e. from Problematic warm-start, ROS problems, Other problems,
and the part of the Holding Trigger section due to operators interventions), contributing
for more than the 3% ATLAS e�ciency loss, is coming from operational problems.
In these situations TDAQ shifters and experts have to detect the errors, identify the
problem root cause and perform the appropriate actions to recover the data taking
operations. In this respect, the AAL project aims at reducing the time spent for dealing
with operational ine�ciency, to minimize the loss of experimental data.
44
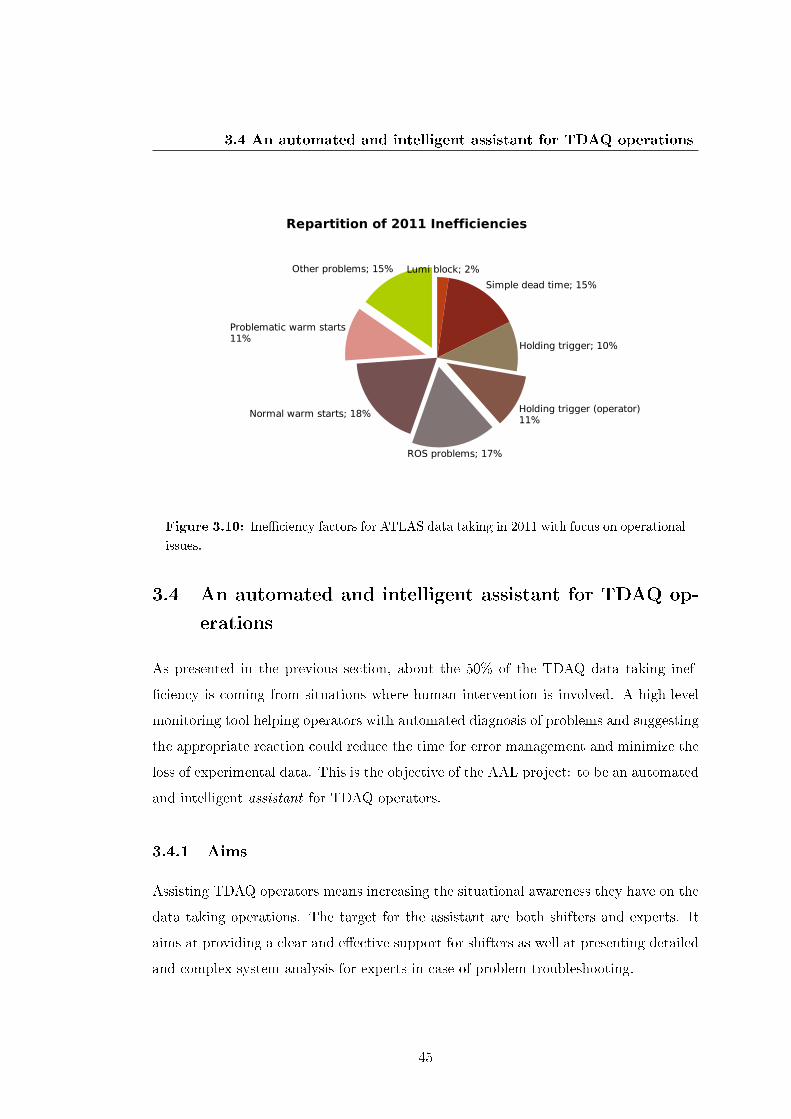
3.4 An automated and intelligent assistant for TDAQ operations
��������AB�CD
E��F������������B���D
���������������B���D
������������������F���������D
��E�F�������B�� D
!������"����������B��#D
$����������"������������D
��%���F�������B���D
����������A�BACDEEAF�BB��������A
Figure 3.10: Ine�ciency factors for ATLAS data taking in 2011 with focus on operational
issues.
3.4 An automated and intelligent assistant for TDAQ op-
erations
As presented in the previous section, about the 50% of the TDAQ data taking inef-
�ciency is coming from situations where human intervention is involved. A high-level
monitoring tool helping operators with automated diagnosis of problems and suggesting
the appropriate reaction could reduce the time for error management and minimize the
loss of experimental data. This is the objective of the AAL project: to be an automated
and intelligent assistant for TDAQ operators.
3.4.1 Aims
Assisting TDAQ operators means increasing the situational awareness they have on the
data taking operations. The target for the assistant are both shifters and experts. It
aims at providing a clear and e�ective support for shifters as well at presenting detailed
and complex system analysis for experts in case of problem troubleshooting.
45
3. PROBLEM INTRODUCTION
3.4.2 Requirements
The assistant aims to be intelligent in the way it processes TDAQ working conditions
and automated in how it detects problems and noti�es operators. The main require-
ments are:
� To automatize checks and controls in real-time.
� To detect complex error situations, performing time-based analysis on multiple
system conditions.
� To receive instructions from TDAQ experts on what to detect and how to react,
building a knowledge-base of instructions.
� To e�ectively notify TDAQ operators with the problem diagnosis and appropriate
reaction.
The di�erent requirements are analyzed in the following sections.
3.4.2.1 Automatize check and controls in real-time
The assistant should automatically collect and process information from the TDAQ
monitoring infrastructure in order to detect problems and failures as they happen and
immediately notify operators. This will be further referred as real-time error detection.
In this context the adjective real-time refers to a level of responsiveness that a user senses
as immediate or nearly immediate, as the delay from problem detection to noti�cation
is expected to be in the order of few seconds.
3.4.2.2 Detect complex system behavior
The ability to detect complex system behaviour and produce problem-relevant informa-
tion, and get it in time for it to be useful, is a key feature for the assistant tool. This
requires acting at two stages:
� gather data from the multiple data providers,
� detection of relevant patterns of events among the monitored information.
46
3.5 Summary
The assistant should gather data from the TDAQ monitoring infrastructure interacting
with providers of di�erent nature and consuming several data formats. Moreover, it
should be able to perform complex reasoning over the streams of monitoring events.
The Complex Event Processing (CEP) approach has been adopted by the AAL project
to express events relationship, as presented in Chapter 4, allowing for diagnosis of TDAQ
problems and issues.
3.4.2.3 Knowledge-base of instructions
The shifter assistant will largely depend on the willingness of TDAQ experts to regularly
feed the tool with correct knowledge and remove stale information. Experts from the
di�erent domains should feed the assistant with the information on how detect problems
and failures and the suggested reactions. The assistant should allow an easy and �exible
management of the knowledge, in order to add new and remove old instructions without
the need to restart the service.
3.4.2.4 E�ective noti�cation
Di�erent people engaged in the operations of the TDAQ system, such as shifters and ex-
perts, need di�erent kinds of information. The capability to construct problem-relevant
views of a system operation is a prerequisite for automating processes for real-time
decision making and TDAQ system managing. The main requirements are:
� Ability to create per-shifter views on system conditions and events. The di�er-
ent TDAQ operators should be provided with information relevant to their core
competency.
� E�ectively present this information to operators. Automatically present the mon-
itoring data when needed, without requiring the user to ask for it.
� Support multiple ways to visualize the information, decoupling diagnosis results
from the visualization media (e.g. web interface, mails, SMS, MRS messages).
3.5 Summary
Operating the ATLAS TDAQ infrastructure requires strong competences and deep
knowledge of the system. Since the ATLAS experiment has entered the full running
47
3. PROBLEM INTRODUCTION
phase, more and more often operators are inexperienced collaborators with very limited
training. The need to streamline the way the TDAQ system is managed by operators
has become increasingly important. The knowledge has to be transferred from experts
to new intelligent tools.
The existing error management system (EMS) has proved to be a very e�ective
solution to detect failures and performs recovery procedures for well de�ned speci�c
conditions, without the need for human interaction. About 50% of the TDAQ data
taking ine�ciency is coming from situations where operators are involved. Dealing
fast and e�ectively with problems and failures is fundamental to minimize the loss of
experimental data. This is the objective of the AAL project: to be an automated and
intelligent assistant for TDAQ operators.
48
Chapter 4
Complex event processing with
Esper
The need to process streams of information from distributed sources at high rate with
low latency is of interest from the most disparate �elds: from wireless sensor networks
to �nancial analysis, from business process management to fault diagnosis. All these
applications rely on an information processing engine capable to timely process and
digest the �ow of data, to extract new knowledge to answer complex queries and to
promptly present results.
In recent years Complex Event Processing (CEP) technologies have emerged as e�ec-
tive solutions for information processing and event stream analysis. CEP technologies
provide the means to reason upon events and relationships among them. Esper(7) is
the leading open source engine for complex event processing and it has been adopted
as CEP engine in the project presented in this thesis.
This chapter gives an overview of information processing technologies, describes the
concepts and mechanisms at the base of complex event processing and presents Esper
architecture and functionalities.
4.1 Information processing technologies
Information processing technologies have been developed to address the requirements
of applications that analyze and react to events. Some typical examples are:
49
4. COMPLEX EVENT PROCESSING WITH ESPER
� Business process management and automation (process monitoring, reporting ex-
ceptions).
� Finance (algorithmic trading, fraud detection, risk management).
� Network and application monitoring (intrusion detection, SLA monitoring).
� Sensor network applications (RFID reading, scheduling and control of fabrication
lines, air tra�c control).
The commonality of all these applications is the requirement to process events in real-
time or near real-time. Key aspects for these types of applications are throughput,
latency and the complexity of the logic required.
� High throughput: applications that process large volumes of messages per unit of
time (up to hundreds of thousands of messages per second).
� Low latency: applications that react in real-time to conditions that occur (from
a few milliseconds to a few seconds).
� Complex computations: applications that detect patterns among events (event
correlation), �lter events, aggregate events over time, join event streams, trigger
on absence of events.
These requirements led to the development of a number of technologies di�erent in
architecture, data models, rule languages, and processing mechanisms. An example
of information processing application is a �re detection system that has to generate an
alarm if �re is detected in a building. It works by gathering and processing temperature
data from a set of sensors, potentially at high rate, from all building rooms.
To illustrate the di�erent types of information processing technology the classi�ca-
tion presented in (32) is adopted, where three models emerged: the active database
system (37), the data stream processing (6) and the complex event processing (30).
4.1.1 Active DBMS
Active Data Base Systems can be seen as an extension of classical Data Base Manage-
ment Systems (DBMSs). A DBMS requires data to be persistently stored and indexed
before it could be processed. The processing model of a DBMS is completely passive:
50
4.1 Information processing technologies
data are only processed and presented when explicitly asked by users or applications via
data queries. The concept of active DBMSs emerged from the database community to
overcome this limitation, moving the reactive behavior from the application layer into
the DBMS. The knowledge model usually consists of active rules composed of three
parts: Events (that de�ne which action should trigger a reaction, such as a tuple inser-
tion or update); Condition (that speci�es the query criteria, e.g. when an event has to
be considered interesting); Action (actions to be performed when the event is detected,
such as database modi�cation).
Nevertheless, as a database extension, active rules can refer only to data presents in
the database, e.g. implement an automatic reaction to constraint violations for certain
tuple insertion or other operations. In the context of continuous processing of data �ow
this is a strong limitation, because most of the processed data have no intrinsic value.
For example, to implement the �re detection system, an active DBMS requires to store
all sensor reading as database entries. But most of this information is of no value if
no �re is detected, while storing a high �ow of data may impact the overall system
behaviour.
4.1.2 Data stream processing
The database community developed a new class of systems to process large streams of
data: Data Stream Management Systems (DSMSs). They di�er from DBMSs in:
� data is organized in streams that are usually unbounded, not in tables;
� a query can continuously produce results as new data is inserted, as opposite to
user-driven query execution.
Data are analyzed via standing (or continuous) queries, i.e. queries that are deployed
once and continue to produce results until removed. Standing queries can be executed
periodically or continuously as new stream items arrive. The answer to a query can be
seen as an output stream or as an entry in a storage that is continuously modi�ed as
new elements �ow inside the processing stream. The project Aurora (14) is an example
of this technology.
Although this is an improvement in data stream analysis, these systems do not
support any complex pattern detections or expression of event relationships, so they
remain limited in practical applications.
51
4. COMPLEX EVENT PROCESSING WITH ESPER
4.1.3 Event processing technologies
Event processing technologies, like the name says, introduce the concept of event to
associate a precise semantics to the information data being processed: they are noti�-
cations of events which happened in the external world and were observed by sources.
An event processing engine is responsible for �ltering and combining such noti�cations
to understand what is happening in terms of higher-level events. Indeed, the event pro-
cessing model relies on the ability to specify composite events through event patterns
that match incoming event noti�cations on the basis of their content and on some re-
lationships among them. Events are analyzed via the continuous processing of de�ned
patterns. The main requirements for an event processing system are:
� the need to perform real-time analysis of incoming information to produce new
knowledge;
� the need for an expressive language to describe how incoming information has to be
processed with the ability to specify complex relationships among the information
items;
� the need for scalability to e�ectively cope with large number of events and infor-
mation sources.
4.2 Complex Event Processing: a theoretical introduction
The term Complex Event Processing (CEP), coined by D. Luckham in his �The Power
of Events� book (30), is a de-facto standard to identify event processing technologies for
distributed enterprise systems, with focus on pattern detection and recognition. This
section discusses the basic concepts of CEP, what events are, how they are created and
how CEP systems analyze and process event streams.
4.2.1 What events are
An event is an object that is a record of an activity in the system. It has three main
aspects:
� Form: an event can have many attributes or components. The form of an event
is the representation in a certain format of the event as a set of attributes. It can
52
4.2 Complex Event Processing: a theoretical introduction
be as simple as a string or a tuple of data components. In this thesis the term �
event attribute�, is as a short way to say �a data component of an event form�.
� Signi�cance: an event signi�es an activity. The event form contains data describ-
ing the activity it signi�es.
� Relativity : an activity is related to other activities by time, causality and aggre-
gation. The relationship between events is called relativity.
It is quite common to confuse an event with is form, e.g. �An event is just a message�.
Event processing is di�erent from message processing because it provides the means to
reason upon relationships between events.
4.2.2 How events are created
CEP technologies have to be able to create events that signify the activities that are
happening in the system. There are two steps:
� Observation step: the CEP system has to be able to access and observe the ac-
tivities at any level of the target system.
� Adaptation step: observations must be transformed into event objects that can be
handled by a processing engine.
Considering the process of monitoring the �ow of information in an enterprise system,
as presented in Section 1.2.1, there are three principal sources of events:
� System layers: in distributed system, as shown in Figure 4.1, communications
between the components are observable from di�erent layers. Each layer may
contain a variety of components, such as message-oriented middleware, ORBs,
databases, etc.
� Instrumentation: components of the system can generate events as metrics and
reports, such as heartbeats or alerts reported by monitoring tools.
� CEP : events are created by the CEP system itself in the course of processing
events observed in the system.
53
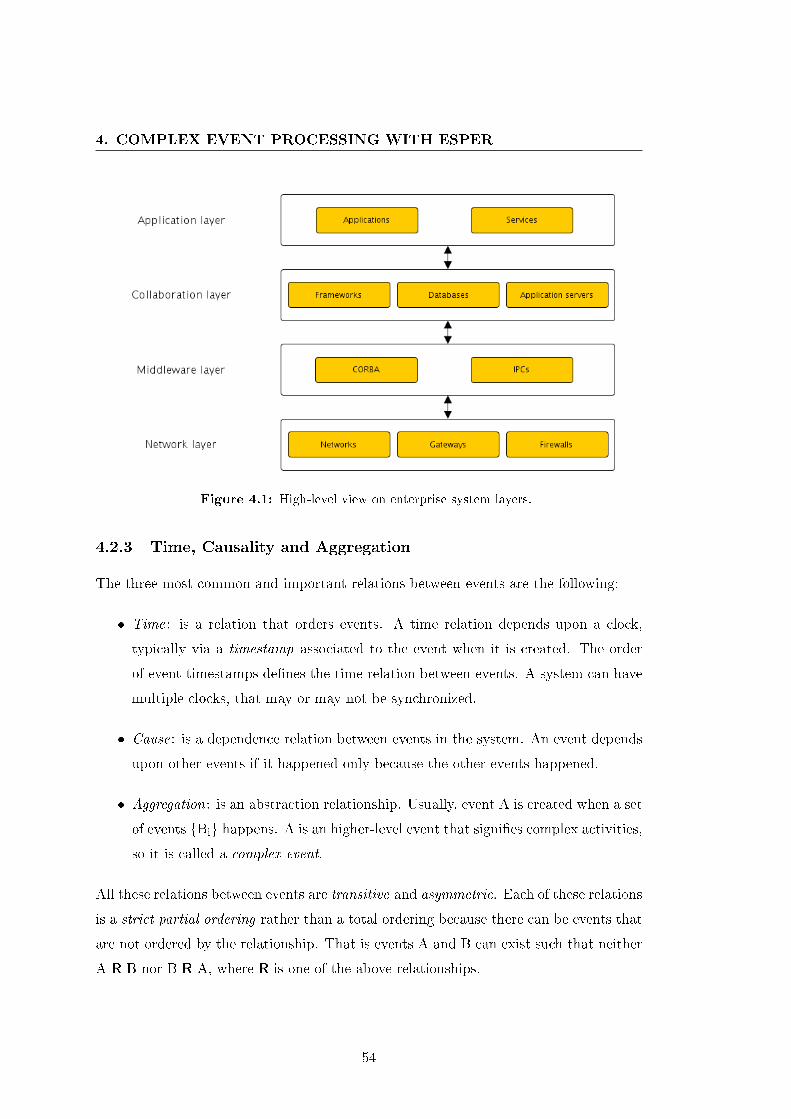
4. COMPLEX EVENT PROCESSING WITH ESPER
Figure 4.1: High-level view on enterprise system layers.
4.2.3 Time, Causality and Aggregation
The three most common and important relations between events are the following:
� Time: is a relation that orders events. A time relation depends upon a clock,
typically via a timestamp associated to the event when it is created. The order
of event timestamps de�nes the time relation between events. A system can have
multiple clocks, that may or may not be synchronized.
� Cause: is a dependence relation between events in the system. An event depends
upon other events if it happened only because the other events happened.
� Aggregation: is an abstraction relationship. Usually, event A is created when a set
of events {Bi} happens. A is an higher-level event that signi�es complex activities,
so it is called a complex event.
All these relations between events are transitive and asymmetric. Each of these relations
is a strict partial ordering rather than a total ordering because there can be events that
are not ordered by the relationship. That is events A and B can exist such that neither
A R B nor B R A, where R is one of the above relationships.
54
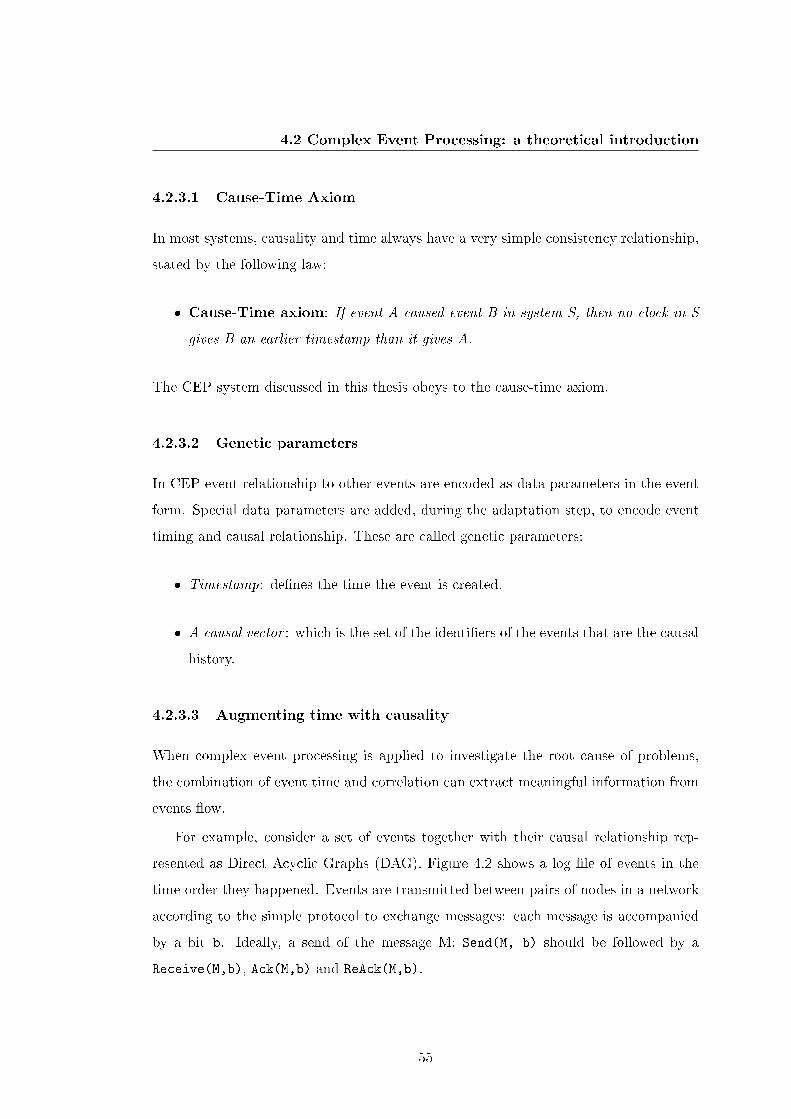
4.2 Complex Event Processing: a theoretical introduction
4.2.3.1 Cause-Time Axiom
In most systems, causality and time always have a very simple consistency relationship,
stated by the following law:
� Cause-Time axiom: If event A caused event B in system S, then no clock in S
gives B an earlier timestamp than it gives A.
The CEP system discussed in this thesis obeys to the cause-time axiom.
4.2.3.2 Genetic parameters
In CEP event relationship to other events are encoded as data parameters in the event
form. Special data parameters are added, during the adaptation step, to encode event
timing and causal relationship. These are called genetic parameters:
� Timestamp: de�nes the time the event is created.
� A causal vector : which is the set of the identi�ers of the events that are the causal
history.
4.2.3.3 Augmenting time with causality
When complex event processing is applied to investigate the root cause of problems,
the combination of event time and correlation can extract meaningful information from
events �ow.
For example, consider a set of events together with their causal relationship rep-
resented as Direct Acyclic Graphs (DAG). Figure 4.2 shows a log �le of events in the
time order they happened. Events are transmitted between pairs of nodes in a network
according to the simple protocol to exchange messages: each message is accompanied
by a bit b. Ideally, a send of the message M: Send(M, b) should be followed by a
Receive(M,b), Ack(M,b) and ReAck(M,b).
55
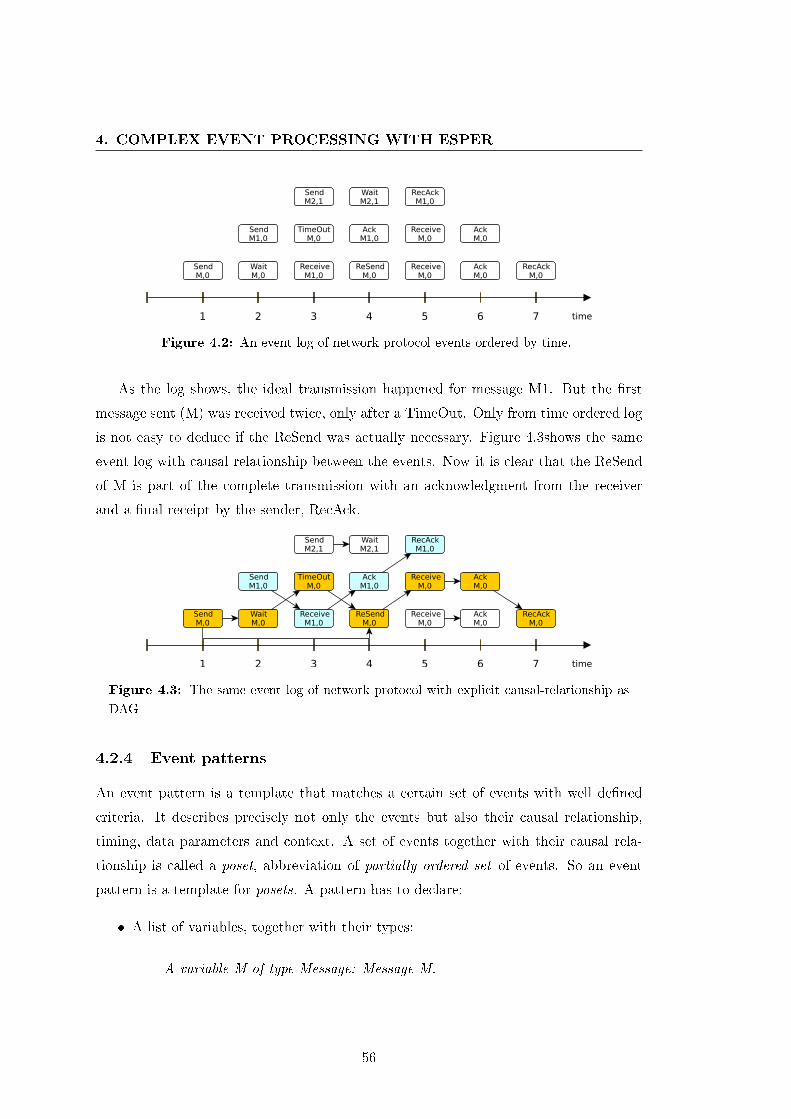
4. COMPLEX EVENT PROCESSING WITH ESPER
SendM,0
WaitM,0
ReceiveM1,0
ReSendM,0
ReceiveM,0
AckM,0
RecAckM,0
SendM1,0
TimeOutM,0
AckM1,0
ReceiveM,0
AckM,0
SendM2,1
WaitM2,1
RecAckM1,0
1 2 3 4 5 6 7 time
Figure 4.2: An event log of network protocol events ordered by time.
As the log shows, the ideal transmission happened for message M1. But the �rst
message sent (M) was received twice, only after a TimeOut. Only from time ordered log
is not easy to deduce if the ReSend was actually necessary. Figure 4.3shows the same
event log with causal relationship between the events. Now it is clear that the ReSend
of M is part of the complete transmission with an acknowledgment from the receiver
and a �nal receipt by the sender, RecAck.
SendM,0
WaitM,0
ReceiveM1,0
ReSendM,0
ReceiveM,0
AckM,0
RecAckM,0
SendM1,0
TimeOutM,0
AckM1,0
ReceiveM,0
AckM,0
SendM2,1
WaitM2,1
RecAckM1,0
1 2 3 4 5 6 7 time
Figure 4.3: The same event log of network protocol with explicit causal-relationship as
DAG
4.2.4 Event patterns
An event pattern is a template that matches a certain set of events with well de�ned
criteria. It describes precisely not only the events but also their causal relationship,
timing, data parameters and context. A set of events together with their causal rela-
tionship is called a poset, abbreviation of partially ordered set of events. So an event
pattern is a template for posets. A pattern has to declare:
� A list of variables, together with their types:
� A variable M of type Message: Message M.
56
4.2 Complex Event Processing: a theoretical introduction
� A variable T of type Time: Time T.
� A list of types of events, with a name and a parameter list of variable
� A Send event: Send(Message M, Bit B, Time T).
� A ReSend event: ReSend(Message M, Bit B, Time T).
� A pattern, as a set of event templates together with relationship between events:
� A Send and a ReSend with the same message and bit, and possibly a di�erent
timestamps: Send(M,B,T1) and ReSend(M,B,T2)
� A condition on the context of any match. This is a test that must be true when
the pattern is matched:
� The time between the Send and ReSend events must be less than a bound : 0
< T2 - T1 < Bnd
Each match of a pattern is a poset that is an instance of the pattern constructed by
replacing variables in the pattern with values from the events stream. The process of
replacing variables in a pattern with values is called pattern matching.
4.2.4.1 Rules
A rule for a CEP system speci�es an action to be taken whenever and event pattern is
matched. It has two parts:
� A trigger : an event pattern described in a certain pattern language.
� An action: an event that is created whenever the trigger matches.
While the action is strictly dependent on the technology used to develop the processing
engine, the pattern languages proposed by most of CEP solutions are derived from the
Structured Query Language (SQL) (28). Streams replace tables as the source of data
with events replacing rows as the basic unit of data. Since events are composed of
data, the SQL concepts of correlation through joins, �ltering and aggregation through
grouping can be e�ectively leveraged.
57
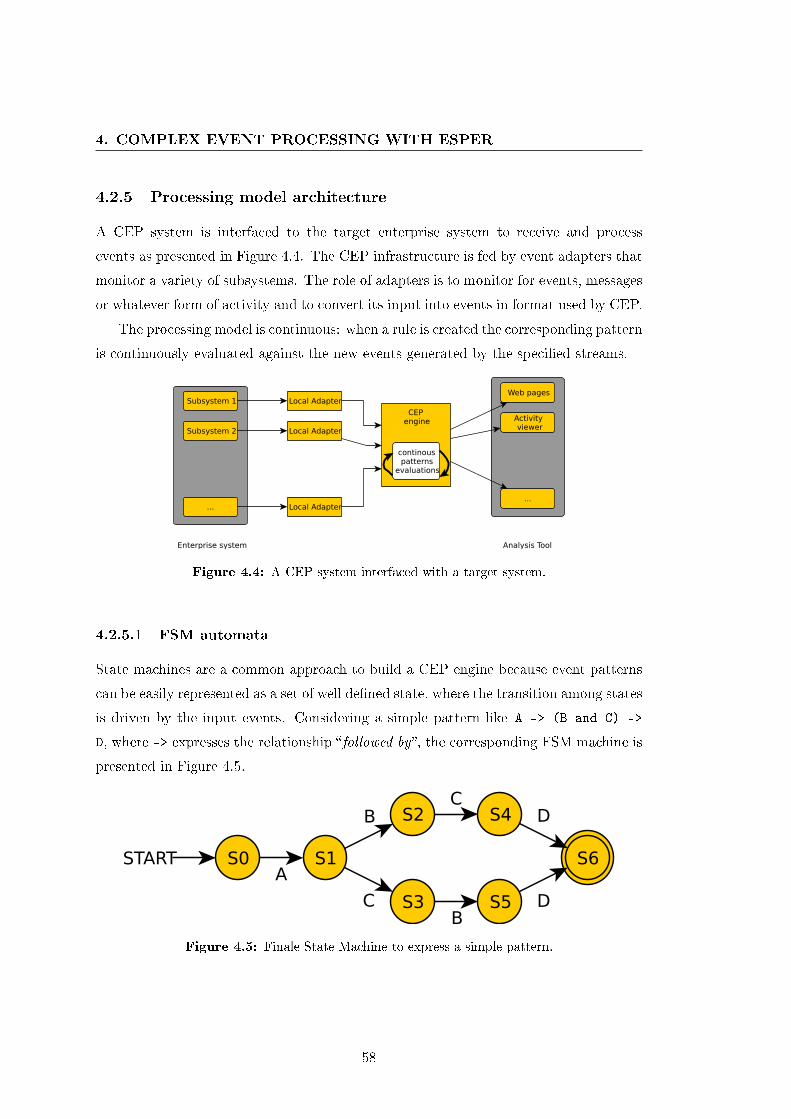
4. COMPLEX EVENT PROCESSING WITH ESPER
4.2.5 Processing model architecture
A CEP system is interfaced to the target enterprise system to receive and process
events as presented in Figure 4.4. The CEP infrastructure is fed by event adapters that
monitor a variety of subsystems. The role of adapters is to monitor for events, messages
or whatever form of activity and to convert its input into events in format used by CEP.
The processing model is continuous: when a rule is created the corresponding pattern
is continuously evaluated against the new events generated by the speci�ed streams.
Subsystem 1
Subsystem 2
...
Local Adapter
Local Adapter
Local Adapter
CEP engine
Web pages
Activity viewer
...
Enterprise system Analysis Tool
continouspatterns
evaluations
Figure 4.4: A CEP system interfaced with a target system.
4.2.5.1 FSM automata
State machines are a common approach to build a CEP engine because event patterns
can be easily represented as a set of well de�ned state, where the transition among states
is driven by the input events. Considering a simple pattern like A -> (B and C) ->
D, where -> expresses the relationship �followed by�, the corresponding FSM machine is
presented in Figure 4.5.
S0 S1
S2
S3
S4
S5
S6STARTA
B
C
C
BD
D
Figure 4.5: Finale State Machine to express a simple pattern.
58
4.3 Event processing implementations
4.3 Event processing implementations
Complex event processing, in particular the continuous processing model and the ability
to detect complex patterns of events, suits very well with automated monitoring and
errors detection requirements. This thesis applies CEP techniques for the intelligent
processing required in AAL.
The AAL project is meant to assist TDAQ operators during data taking runs and
it has to be fully integrated in the ATLAS TDAQ system (i.e. gather information from
and provide information to the TDAQ services). The CEP engine used in AAL should
then ful�ll the following requirements:
� processing capabilities: support the detection of complex pattern of events over
time with aggregation and �ltering on event properties. In particular, the pattern
language should provide this functionality without requiring a speci�c develop-
ment for patterns operations. This is because the AAL project should be applied
to a number of di�erent scenarios, dynamics and not predictable in advance.
� long-lifetime: being the lifetime of the ATLAS experiment several years (i.e. until
2020 by design) the adopted technology should have a long expected lifetime;
� light-weight: being the data processing only one of the functionalities of the AAL
project, as presented in Section 3.4.2, the CEP engine should be easily integrated
with the other AAL components.
The Esper engine from EsperTech (7) has been adopted as CEP implementation for
AAL, but other solutions have been investigated as reported below. Event processing
technologies have evolved in recent years mainly with input from two communities:
cloud technologies and pure CEP systems.
4.3.1 Cloud-derived technologies
With the evolution of distributed systems towards cloud computing platforms, several
information processing projects emerged from the major cloud actors and frameworks
with the aim to analyze logs and events �owing in cloud systems. Although these
technologies are not formally classi�ed as CEP, the provided functionalities match the
CEP requirements, so they are of interest for this investigation.
59
4. COMPLEX EVENT PROCESSING WITH ESPER
4.3.1.1 Storm
Storm is a platform for real-time computation released by Twitter in 2010 (26). It
provides a set of general primitives for doing distributed real-time computing. It can be
used for stream processing, processing messages and updating databases in real-time.
Storm also supports continuous computation, doing a continuous query on data streams
and streaming out the results to users as they are computed.
However, the Storm core competency is doing real-time distributed computation
in a way that is horizontally scalable. It was used by Twitter to process millions of
messages per second and the throughput should be even higher than that (just adding
more machines). But Storm does not have the higher-level abstractions for doing stream
processing like Esper does. It supports �ltering, joins, aggregation, but it lacks the time
window supports and more advanced constructs.
4.3.1.2 S4 - Yahoo!
S4 (45) is a general-purpose, distributed, scalable, partially fault-tolerant, plug-gable
platform that allows programmers to easily develop applications for processing continu-
ous unbounded streams of data. S4 was released by Yahoo! Inc. in October 2010. The
core platform is written in Java. The drivers to read from and write to the platform
can be implemented in any language making it possible to integrate with legacy data
sources and systems.
Although the S4 design is very �exible, in particular supporting the development of
customized client adapter that allow to send and to receive events from an S4 cluster,
the current processing capabilities are not suitable for the complex processing needed
in AAL. It mainly provided aggregation of streams and �ltering on streams criteria, but
it lacks the ability to perform time-based computations.
4.3.2 Pure CEP solutions
The recent focus on Complex Event Processing technologies (32) drives a consolidation
and evolution of the existing projects and frameworks.
60
4.4 A CEP engine for the TDAQ assistant: Esper
4.3.2.1 StreamBase Event Processing Platform
StreamBase Event Processing Platform� (9) is a high-performance software for rapidly
building systems that analyze and act on real-time streaming data. It combines a rapid
application development environment, a low-latency high-throughput event server, and
enterprise connectivity to real-time and historical data. The StreamBase programming
model uses the StreamSQL language to express pattern over stream of data. It is derived
from SQL and it supports time windows, complex operators and high level abstraction
of events.
StreamBase provides the processing capabilities required for AAL. But the Stream-
Base CEP is part of a more comprehensive framework o�ering a visual editor for rules,
graphical interfaces for monitoring and system management. Being the AAL project
integrated into the existing TDAQ software infrastructure, the integration of a new
framework with its own editing/con�guration/management was not possible. More-
over, StreamBase is not available as open-source software, and considering the long
lifetime expected for TDAQ software facilities, being locked to a speci�c-product with-
out control on it was not a feasible solution.
4.3.2.2 Oracle-CEP
Oracle-CEP is the complex event processing solution from Oracle (25). Together with
CEP functionalities it o�ers both a visual development environment as well as a standard
Java-based tooling. Until 2009, the ORACLE CEP functionalities were powered by
Esper. In the last years Oracle has developed its own processing engine. The main
advantage of Oracle CEP is to be fully integrated with Oracle eco-systems of products
and services, but this was not a requirement for the AAL project.
4.4 A CEP engine for the TDAQ assistant: Esper
Esper from EsperTech (7) is considered the leading open source solution for event stream
and complex event processing. It is designed for high volume event correlation over
millions of events with low latency. Esper focuses on providing powerful processing
capabilities via a high-performance engine with a rich and �exible API. This section
presents the Esper CEP engine and the facilities it o�ers.
61
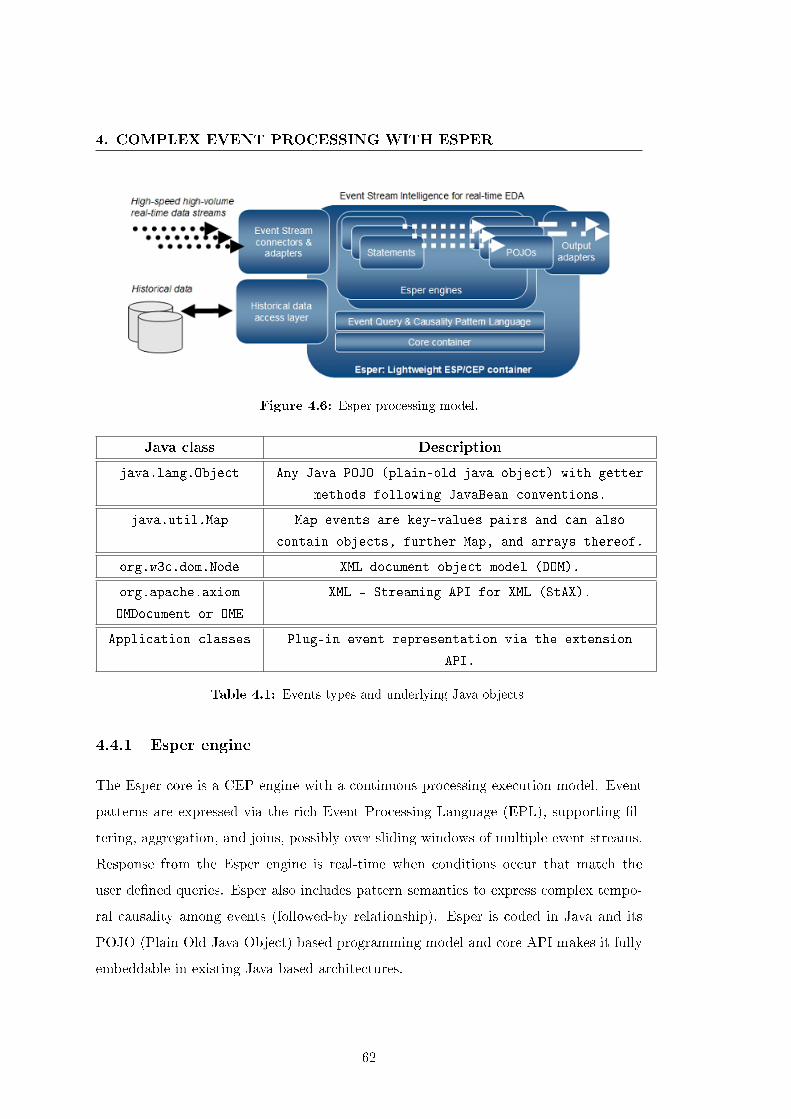
4. COMPLEX EVENT PROCESSING WITH ESPER
Figure 4.6: Esper processing model.
Java class Description
java.lang.Object Any Java POJO (plain-old java object) with getter
methods following JavaBean conventions.
java.util.Map Map events are key-values pairs and can also
contain objects, further Map, and arrays thereof.
org.w3c.dom.Node XML document object model (DOM).
org.apache.axiom
OMDocument or OME
XML - Streaming API for XML (StAX).
Application classes Plug-in event representation via the extension
API.
Table 4.1: Events types and underlying Java objects
4.4.1 Esper engine
The Esper core is a CEP engine with a continuous processing execution model. Event
patterns are expressed via the rich Event Processing Language (EPL), supporting �l-
tering, aggregation, and joins, possibly over sliding windows of multiple event streams.
Response from the Esper engine is real-time when conditions occur that match the
user de�ned queries. Esper also includes pattern semantics to express complex tempo-
ral causality among events (followed-by relationship). Esper is coded in Java and its
POJO (Plain Old Java Object) based programming model and core API makes it fully
embeddable in existing Java based architectures.
62
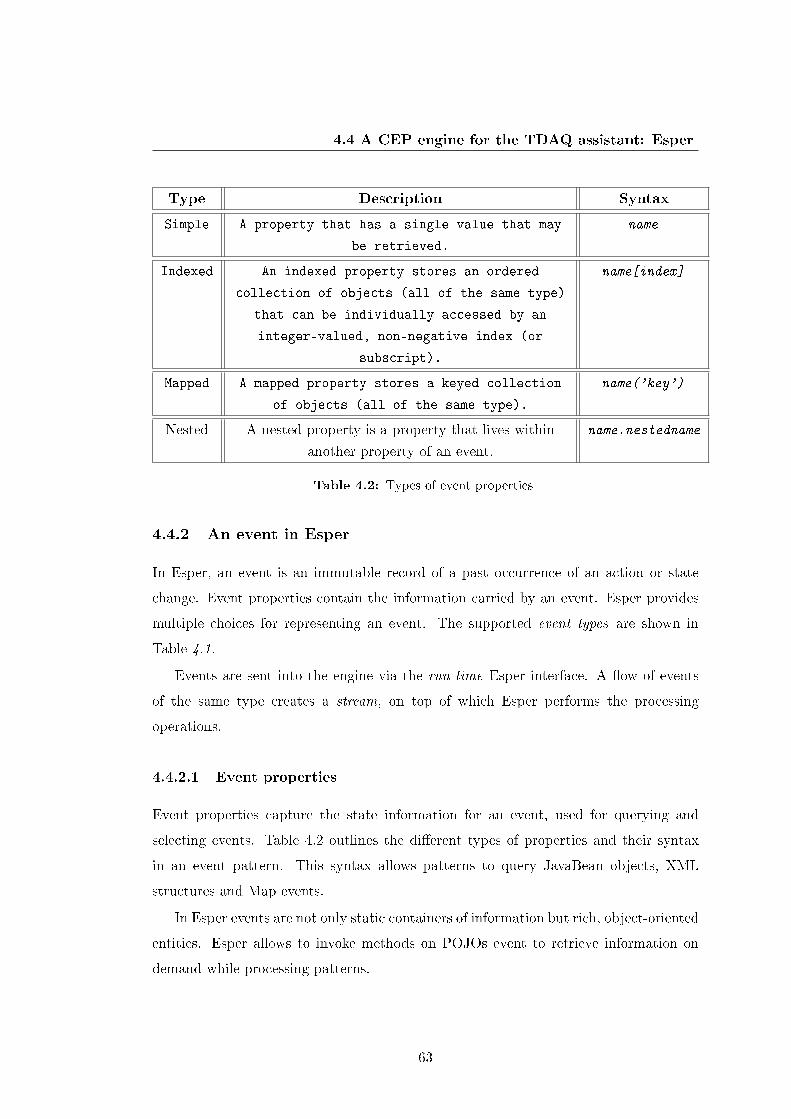
4.4 A CEP engine for the TDAQ assistant: Esper
Type Description Syntax
Simple A property that has a single value that may
be retrieved.
name
Indexed An indexed property stores an ordered
collection of objects (all of the same type)
that can be individually accessed by an
integer-valued, non-negative index (or
subscript).
name[index]
Mapped A mapped property stores a keyed collection
of objects (all of the same type).
name('key')
Nested A nested property is a property that lives within
another property of an event.
name.nestedname
Table 4.2: Types of event properties
4.4.2 An event in Esper
In Esper, an event is an immutable record of a past occurrence of an action or state
change. Event properties contain the information carried by an event. Esper provides
multiple choices for representing an event. The supported event types are shown in
Table 4.1.
Events are sent into the engine via the run-time Esper interface. A �ow of events
of the same type creates a stream, on top of which Esper performs the processing
operations.
4.4.2.1 Event properties
Event properties capture the state information for an event, used for querying and
selecting events. Table 4.2 outlines the di�erent types of properties and their syntax
in an event pattern. This syntax allows patterns to query JavaBean objects, XML
structures and Map events.
In Esper events are not only static containers of information but rich, object-oriented
entities. Esper allows to invoke methods on POJOs event to retrieve information on
demand while processing patterns.
63
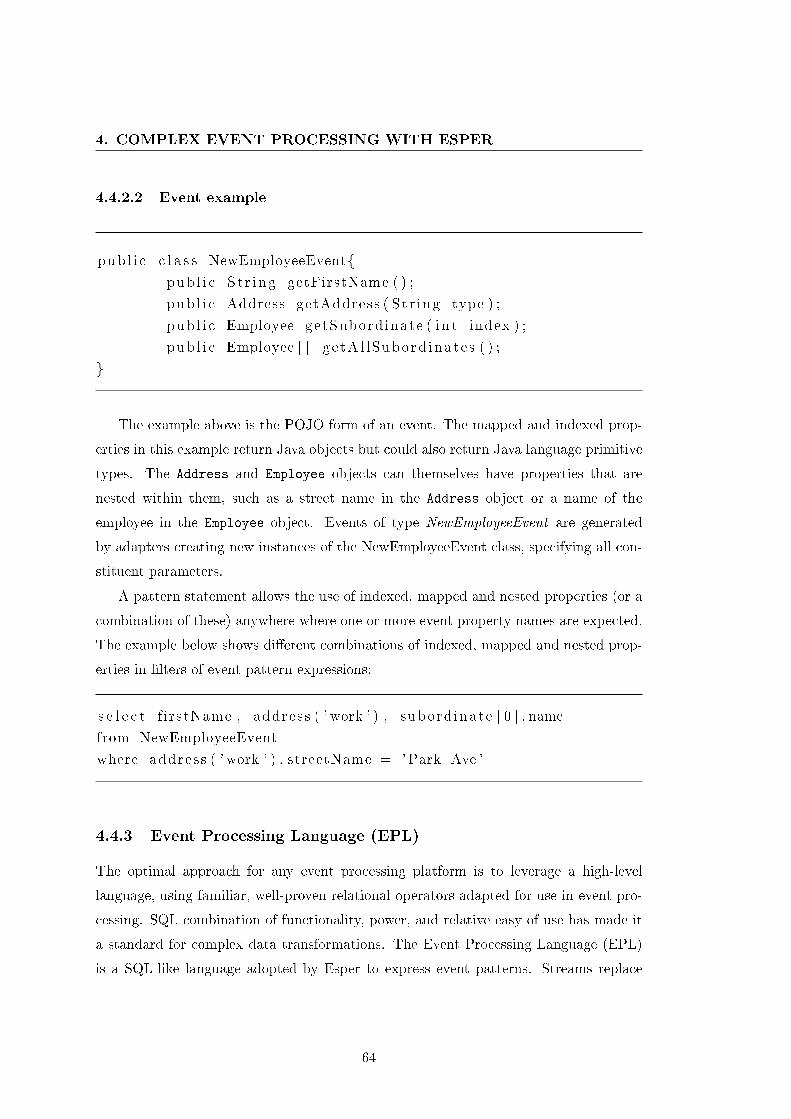
4. COMPLEX EVENT PROCESSING WITH ESPER
4.4.2.2 Event example
pub l i c c l a s s NewEmployeeEvent{
pub l i c S t r ing getFirstName ( ) ;
pub l i c Address getAddress ( S t r ing type ) ;
pub l i c Employee getSubord inate ( i n t index ) ;
pub l i c Employee [ ] g e tA l lSubord inate s ( ) ;
}
The example above is the POJO form of an event. The mapped and indexed prop-
erties in this example return Java objects but could also return Java language primitive
types. The Address and Employee objects can themselves have properties that are
nested within them, such as a street name in the Address object or a name of the
employee in the Employee object. Events of type NewEmployeeEvent are generated
by adapters creating new instances of the NewEmployeeEvent class, specifying all con-
stituent parameters.
A pattern statement allows the use of indexed, mapped and nested properties (or a
combination of these) anywhere where one or more event property names are expected.
The example below shows di�erent combinations of indexed, mapped and nested prop-
erties in �lters of event pattern expressions:
s e l e c t f irstName , address ( ' work ' ) , subord inate [ 0 ] . name
from NewEmployeeEvent
where address ( ' work ' ) . streetName = 'Park Ave '
4.4.3 Event Processing Language (EPL)
The optimal approach for any event processing platform is to leverage a high-level
language, using familiar, well-proven relational operators adapted for use in event pro-
cessing. SQL combination of functionality, power, and relative easy of use has made it
a standard for complex data transformations. The Event Processing Language (EPL)
is a SQL-like language adopted by Esper to express event patterns. Streams replace
64
4.4 A CEP engine for the TDAQ assistant: Esper
tables as the source of data with events replacing rows as the basic unit of data. Since
events are composed of data, the SQL concepts of correlation through joins, �ltering
and aggregation through grouping can be e�ectively leveraged. The main aspects of the
EPL language are:
� Powerful operations: EPL operators provide the capability to �lter streams, merge,
combine, and correlate multiple streams, and run time-window-based aggregations
and computations on real-time streams or stored tables. EPL queries can detect
late or missing data, perform pattern-matching functions, and also access and
manipulate in-memory and external storage.
� Plug-in: because the EPL operator set is highly extensible, developers can easily
achieve new processing functionality within the system, such as implementing a
proprietary analysis algorithm, or creating user-de�ned aggregates, functions, and
custom operators.
� Data windows: EPL extends the semantics of standard SQL (which assumes
records in a �nite stored dataset) by adding rich windowing constructs and stream-
speci�c operators. With EPL the window construct de�nes the stream as an ag-
gregate or a join, letting the engine know when to �nish an operation and output
an answer. Windows are de�nable over time, number of messages, or breakpoints
in other message attributes.
� Parametrized queries: parametrized queries allow to put placeholders inside of an
EPL query. At run-time these placeholders are bound with values from events
and they are then compiled into regular statements.
4.4.4 Processing model
The Esper processing model is continuous: CEP rules are composed by a pattern de�ned
in EPL and one or more actions de�ned as listeners. A listener receive updated data as
soon as the engine processes events for that pattern, according to the EPL statement
choice of event streams, views, �lters and output rates. Listener are attached to every
statement via the Esper run-time API.
65
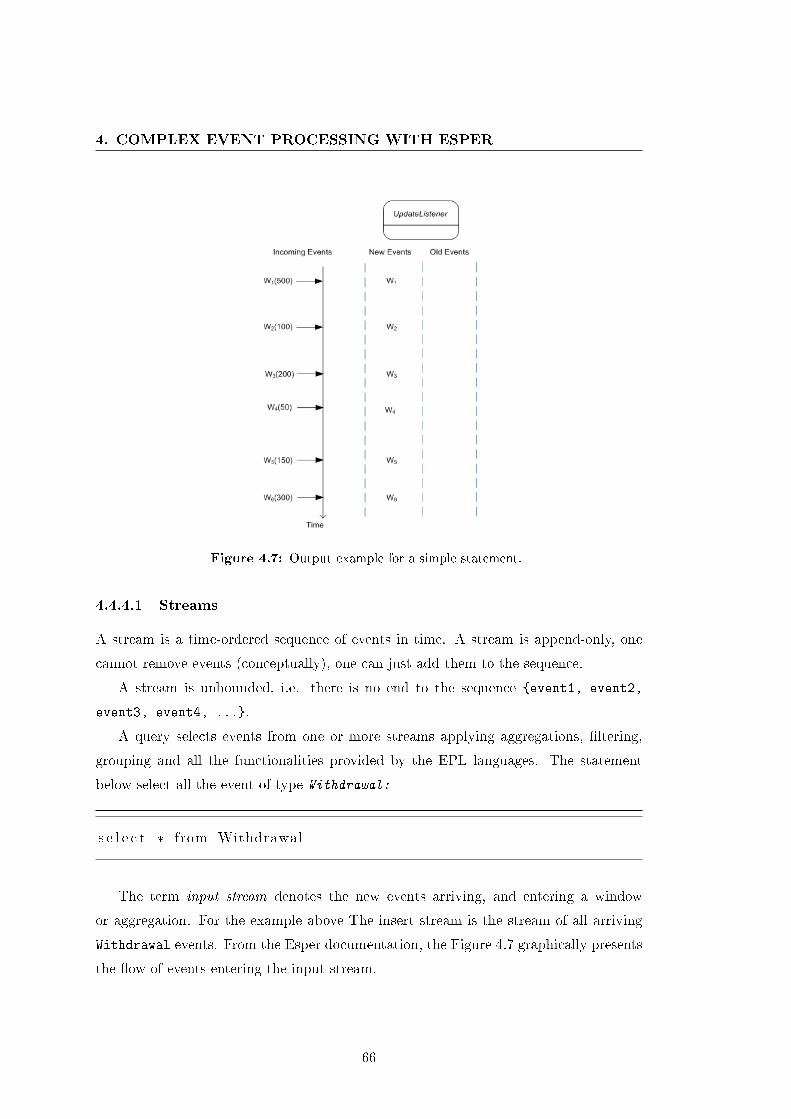
4. COMPLEX EVENT PROCESSING WITH ESPER
Figure 4.7: Output example for a simple statement.
4.4.4.1 Streams
A stream is a time-ordered sequence of events in time. A stream is append-only, one
cannot remove events (conceptually), one can just add them to the sequence.
A stream is unbounded, i.e. there is no end to the sequence {event1, event2,
event3, event4, ...}.
A query selects events from one or more streams applying aggregations, �ltering,
grouping and all the functionalities provided by the EPL languages. The statement
below select all the event of type Withdrawal:
s e l e c t * from Withdrawal
The term input stream denotes the new events arriving, and entering a window
or aggregation. For the example above The insert stream is the stream of all arriving
Withdrawal events. From the Esper documentation, the Figure 4.7 graphically presents
the �ow of events entering the input stream.
66
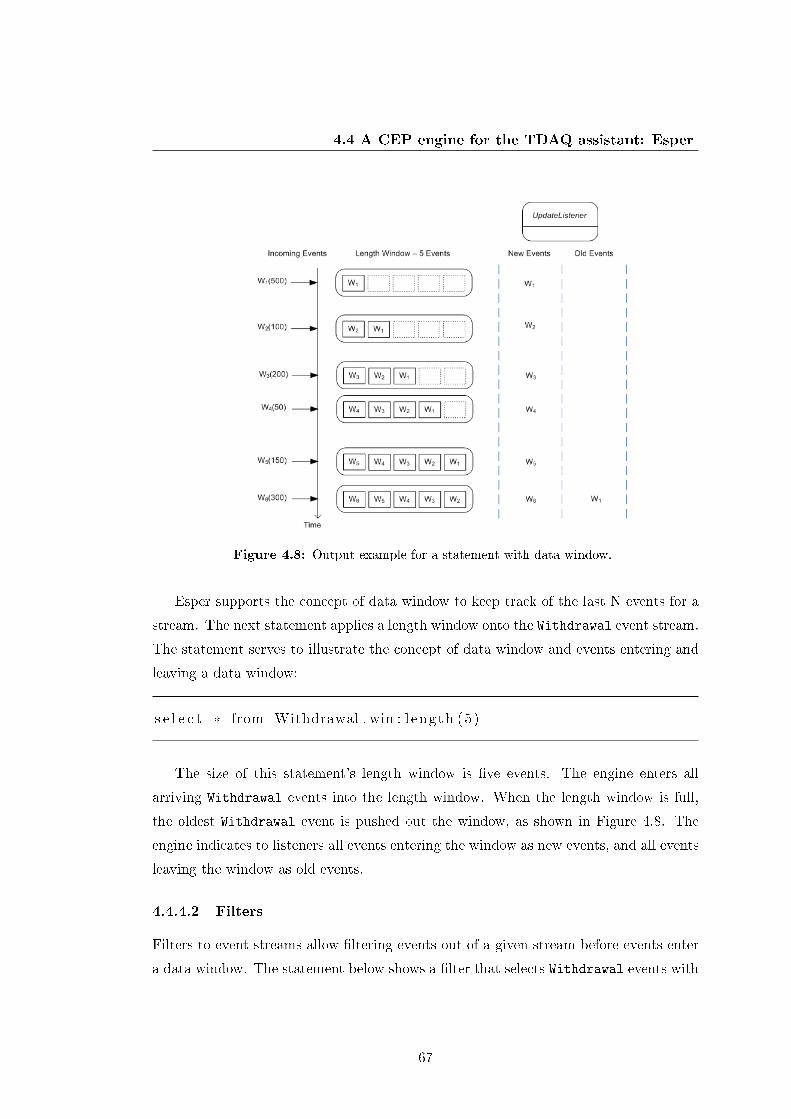
4.4 A CEP engine for the TDAQ assistant: Esper
Figure 4.8: Output example for a statement with data window.
Esper supports the concept of data window to keep track of the last N events for a
stream. The next statement applies a length window onto the Withdrawal event stream.
The statement serves to illustrate the concept of data window and events entering and
leaving a data window:
s e l e c t * from Withdrawal . win : l ength (5 )
The size of this statement's length window is �ve events. The engine enters all
arriving Withdrawal events into the length window. When the length window is full,
the oldest Withdrawal event is pushed out the window, as shown in Figure 4.8. The
engine indicates to listeners all events entering the window as new events, and all events
leaving the window as old events.
4.4.4.2 Filters
Filters to event streams allow �ltering events out of a given stream before events enter
a data window. The statement below shows a �lter that selects Withdrawal events with
67
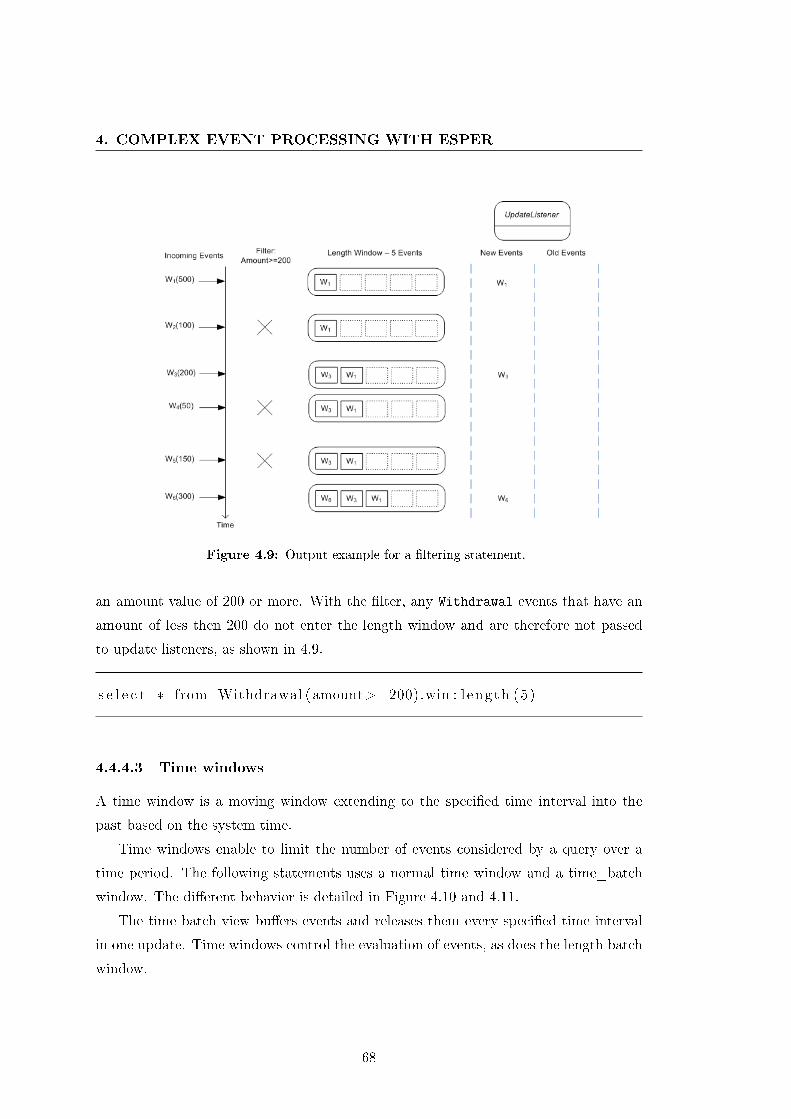
4. COMPLEX EVENT PROCESSING WITH ESPER
Figure 4.9: Output example for a �ltering statement.
an amount value of 200 or more. With the �lter, any Withdrawal events that have an
amount of less then 200 do not enter the length window and are therefore not passed
to update listeners, as shown in 4.9.
s e l e c t * from Withdrawal ( amount>=200).win : l ength (5 )
4.4.4.3 Time windows
A time window is a moving window extending to the speci�ed time interval into the
past based on the system time.
Time windows enable to limit the number of events considered by a query over a
time period. The following statements uses a normal time window and a time_batch
window. The di�erent behavior is detailed in Figure 4.10 and 4.11.
The time batch view bu�ers events and releases them every speci�ed time interval
in one update. Time windows control the evaluation of events, as does the length batch
window.
68
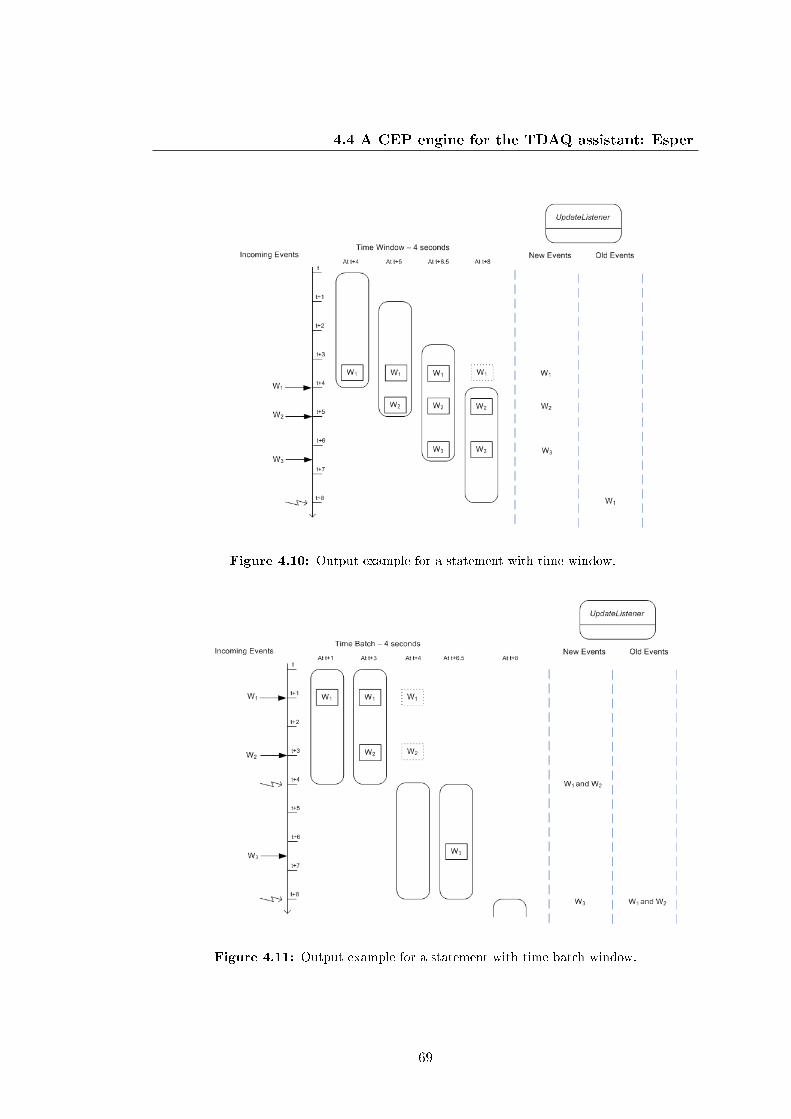
4.4 A CEP engine for the TDAQ assistant: Esper
Figure 4.10: Output example for a statement with time window.
Figure 4.11: Output example for a statement with time batch window.
69
4. COMPLEX EVENT PROCESSING WITH ESPER
s e l e c t * from Withdrawal . win : time (4 sec )
s e l e c t * from Withdrawal . win : time_batch (4 sec )
4.4.4.4 Event aggregations
Following the SQL (Standard Query Language) standards for queries against relational
databases, the presence or absence of aggregation functions and the presence or absence
of the group by clause de�nes the number of rows posted by the engine to listeners.
In summary, as in SQL, if a EPL statement selects only aggregation values, the engine
provides one row of aggregated values. It provides that row every time the aggregation is
updated (insert stream), which is when events arrive or a batch of events gets processed,
and when the events leave a data window or a new batch of events arrives.
4.4.5 Performance
Esper has been highly optimized to handle very high throughput streams with very
low latency between event receipt and output result posting. Memory consumption is
one of the most critical aspects. EPL statements with time-based or length-based data
windows can consume large amounts of memory as their size or length can be large. For
time-based data windows the memory consumed depends on the actual event stream
input throughput.
Processing performance has been deeply investigated by Esper development team,
as from documentation: � Esper exceeds over 500 000 event/s on a dual CPU 2GHz Intel
based hardware, with engine latency below 3 microseconds average (below 10us with more
than 99% predictability) on a VWAP benchmark (31) with 1000 statements registered in
the system - this tops at 70 Mbit/s at 85% CPU usage.�, with linear scalability on the
event rate. The results have been con�rmed by a set of dedicated tests performed while
prototyping the AAL project. The tests consisted in the sustained processing of a high-
rate IS update with patterns generating time-based statistics on IS data, at di�erent
time precisions. The prototype was able to handle a sustained IS rate of hundreds
of thousands update per seconds, compatible with the real load generated by TDAQ
operations.
70
4.5 Summary
Although Esper is designed as a multi-threaded software to exploit multi-core ar-
chitectures, the default threading con�guration showed several limitations for the use
cases of this project. But thanks to the con�guration options engine-level queues and
thread-pools have been optimized to �t the needs of the AAL project, as presented in
Section 6.4
4.5 Summary
The need to process streams of information from distributed sources at high-rate with
low-latency is of interest from the most disparate �elds: from wireless sensor networks to
�nancial analysis, from business process management to system monitoring. Complex
Event Processing (CEP) technologies have emerged as e�ective solutions for information
processing and event stream analysis. In particular, they provide the means to reason
upon events and on relationships among them. These functionalities are extremely
powerful when applied to error detection and fault diagnosis in a complex system such
as the ATLAS TDAQ. Esper(7) is the leading open source engine for complex event
processing and it has been investigated and adopted to provide CEP functionality for
the AAL project.
71

4. COMPLEX EVENT PROCESSING WITH ESPER
72
Chapter 5
The AAL project
This chapter presents the AAL project (29). The AAL name stands for �Automated
Analysis and inteLligent monitoring�. The project is meant at assuring a constant high-
quality problem detection in a distributed system via the automation of monitoring
tasks and the correlation of operational data and system metrics. The main operational
stages are the gathering of monitoring data, the processing of system activities and
the noti�cation of detected problems to operators. This chapter introduces AAL main
functionalities and it discusses its integration in the ATLAS trigger and data acquisition
system.
5.1 The project architecture
AAL performs a real-time1 analysis of the whole TDAQ system, detecting problematic
situations and misbehavior and producing noti�cations to operators. It is able to react
on single problems (e.g. a log message reporting a network connectivity issue from
a data acquisition application), but it o�ers more advanced correlation and analysis
capabilities (e.g. if a burst of similar log message is received in a short time period
from multiple applications belonging to the same farm rack, then the problem should
be recognized as a network switch failure).
Three main operational stages are identi�ed: information gathering, informa-
tion processing and results distribution. Being the ATLAS TDAQ system the �rst
1In this context the adjective real-time refers to a level of responsiveness that a user senses as
immediate or nearly immediate, as the delay from problem detection to noti�cation is expected to be
in the order of few seconds.
73
5. THE AAL PROJECT
Knowledge Basein XML
DO THAT
Assistant Engine
Expert InstructionsNagios
IS servers
MRS messages
COOL, OKS, ...
Configuration
Farm metrics
...
E-mail/SMS
IF
Alerts
Web
Open source event processing engine
Information gathering Information processing Result distribution
Figure 5.1: High-level view on the AAL project architecture and operational stages.
target for the AAL project, each stage poses di�erent challenges and requirements that
are presented in subsequent sections.
The project combines technologies coming from di�erent disciplines, in particular
it leverages on an event driven architecture to unify the �ow of data to be monitored,
on a Complex Event Processing (CEP) engine for real time correlation of events and
pattern recognition and on a Message Queuing system for components integration and
communication. The picture in Figure 5.1 presents an overview of the architecture
together with the three operational stages.
5.1.1 Information gathering
As presented in Chapter 3, the information about correctness of data acquisition oper-
ations in the TDAQ infrastructure is spread among several data sources, di�erent for
data formats, technologies and publication mechanisms. AAL is able to gathers and
processes all log messages from data acquisition applications, the operational data pub-
lished in the information system, the network and farm metrics, as well as data retrieved
from the con�guration databases. The high-rate of information events, that can reach
74
5.1 The project architecture
spikes in the order of hundreds of kHz, together with the diversity of technologies and
of data formats are the main challenges concerning information gathering. Section 5.2
presents data providers characteristics and requirements.
5.1.2 Information processing
The continuous processing of monitoring data in order to detect problems and failures
is the key objective of the AAL project. AAL is fed with instructions about what
situations to detect by TDAQ experts, leveraging their know-how and expertise on the
TDAQ system and operational procedures. The main aspects of information processing
are:
� Real-time complex data processing: continuous evaluation of monitoring data
streams to detect complex pattern.
� Knowledge engineering : formalize expert knowledge in patterns of monitoring
events, together with instructions on what type of result the pattern detection
should produce.
AAL relies on a CEP engine to provide the real-time processing functionalities. Chapter
6 discusses how CEP is used for problems detection and how the Esper engine has
been integrated in AAL. For what concerns knowledge engineering, AAL implements
a �exible approach, presented in Section 5.3, based on generic directives structured as
XML documents.
5.1.3 Result distribution and visualization
The AAL project has been designed to support di�erent types of reactions in case of
pattern detection. For the application of AAL as assistant in the TDAQ infrastructure
the generation of alerts is the most common reaction to a pattern detection.
Alerts are generated by AAL to notify TDAQ operators of problems and failures
in the system. Every alert contains information about the detected problems, the sug-
gested reaction as de�ned by experts and all details about the conditions that matched
the pattern. Alerts can be customized per TDAQ sub-system (e.g. an alert can be
addressed to speci�c TDAQ shifters), o�ering customized views on the system condi-
tions. Alerts provide operators with the complete set of information they need to react
promptly and e�ectively to the problem. The alert format is introduced in Section 5.4.
75
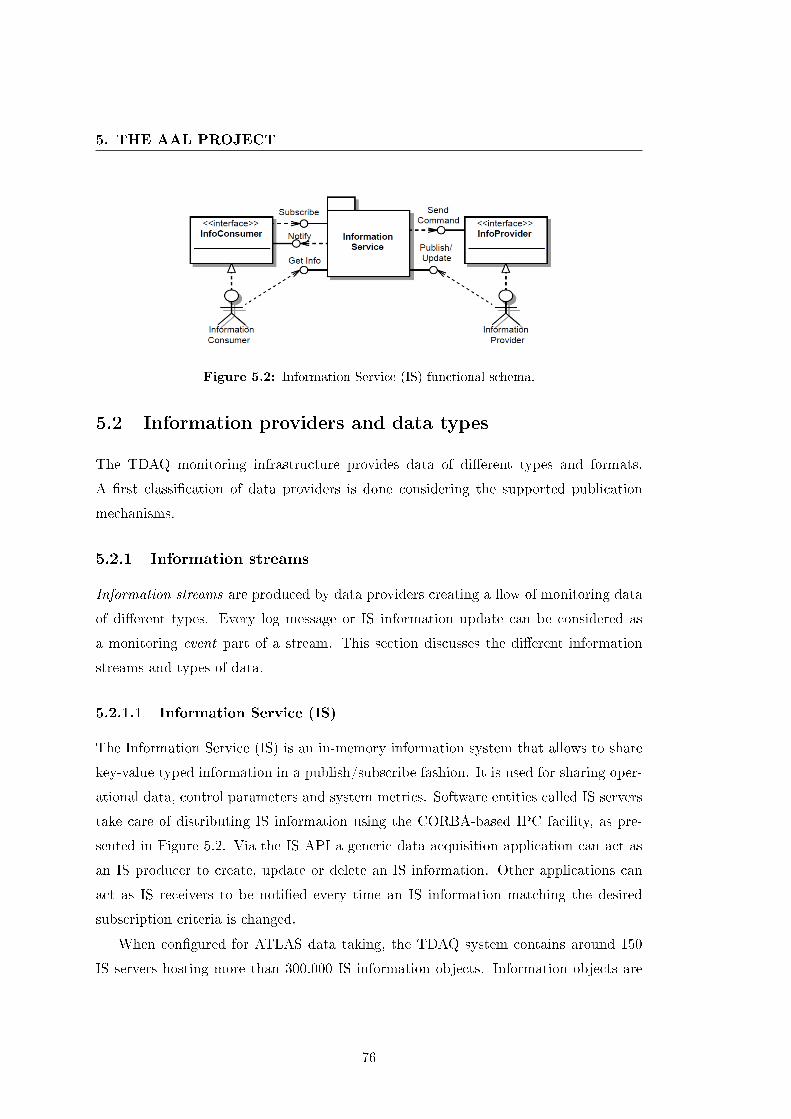
5. THE AAL PROJECT
Figure 5.2: Information Service (IS) functional schema.
5.2 Information providers and data types
The TDAQ monitoring infrastructure provides data of di�erent types and formats.
A �rst classi�cation of data providers is done considering the supported publication
mechanisms.
5.2.1 Information streams
Information streams are produced by data providers creating a �ow of monitoring data
of di�erent types. Every log message or IS information update can be considered as
a monitoring event part of a stream. This section discusses the di�erent information
streams and types of data.
5.2.1.1 Information Service (IS)
The Information Service (IS) is an in-memory information system that allows to share
key-value typed information in a publish/subscribe fashion. It is used for sharing oper-
ational data, control parameters and system metrics. Software entities called IS servers
take care of distributing IS information using the CORBA-based IPC facility, as pre-
sented in Figure 5.2. Via the IS API a generic data acquisition application can act as
an IS producer to create, update or delete an IS information. Other applications can
act as IS receivers to be noti�ed every time an IS information matching the desired
subscription criteria is changed.
When con�gured for ATLAS data taking, the TDAQ system contains around 150
IS servers hosting more than 300.000 IS information objects. Information objects are
76
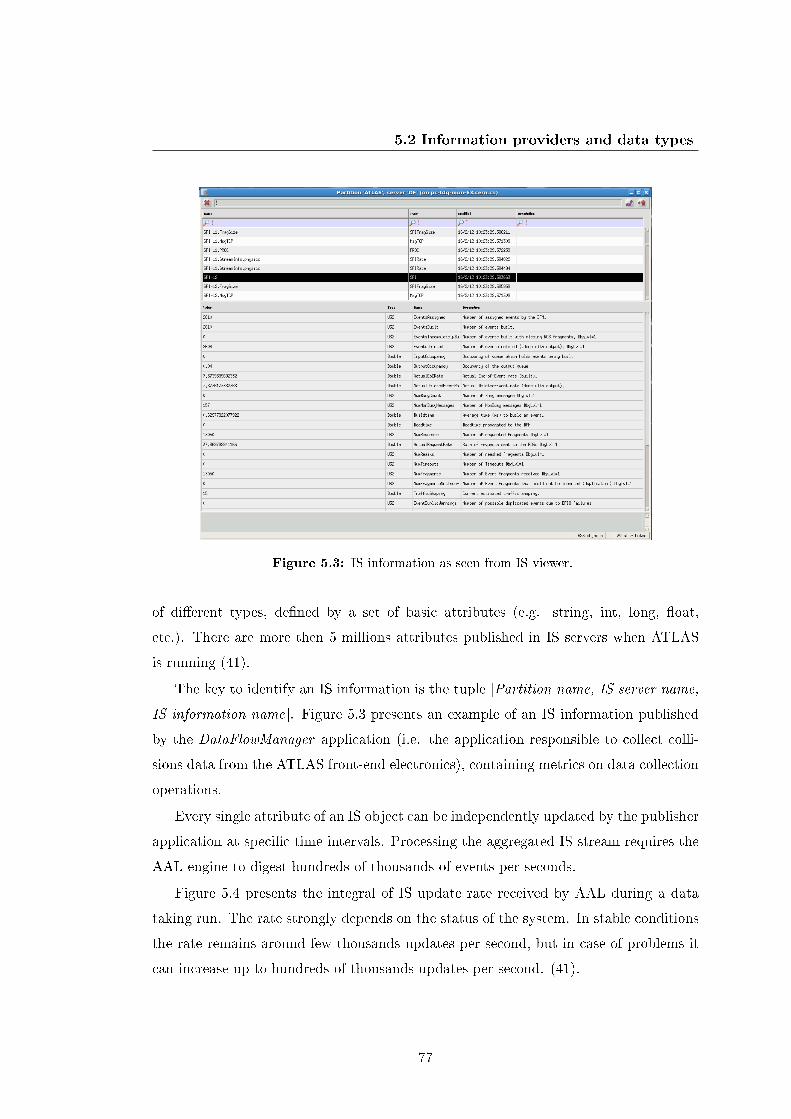
5.2 Information providers and data types
Figure 5.3: IS information as seen from IS viewer.
of di�erent types, de�ned by a set of basic attributes (e.g. string, int, long, �oat,
etc.). There are more then 5 millions attributes published in IS servers when ATLAS
is running (41).
The key to identify an IS information is the tuple [Partition name, IS server name,
IS information name]. Figure 5.3 presents an example of an IS information published
by the DataFlowManager application (i.e. the application responsible to collect colli-
sions data from the ATLAS front-end electronics), containing metrics on data collection
operations.
Every single attribute of an IS object can be independently updated by the publisher
application at speci�c time intervals. Processing the aggregated IS stream requires the
AAL engine to digest hundreds of thousands of events per seconds.
Figure 5.4 presents the integral of IS update rate received by AAL during a data
taking run. The rate strongly depends on the status of the system. In stable conditions
the rate remains around few thousands updates per second, but in case of problems it
can increase up to hundreds of thousands updates per second. (41).
77
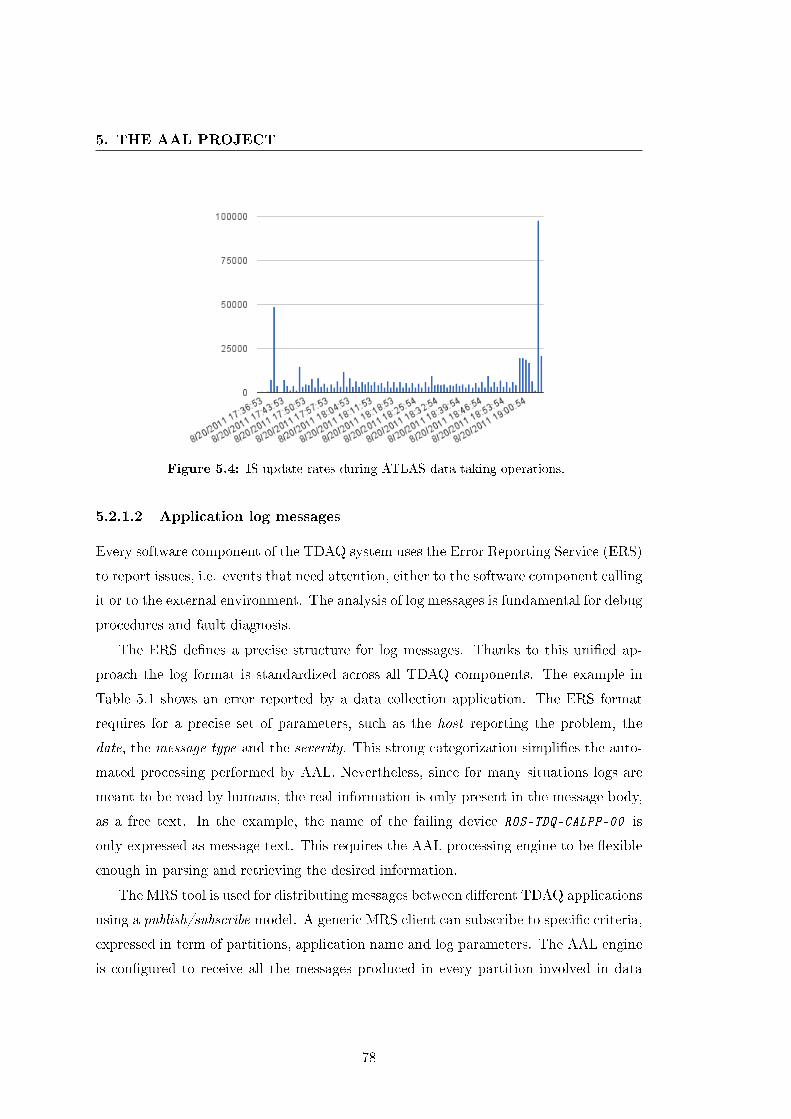
5. THE AAL PROJECT
Figure 5.4: IS update rates during ATLAS data taking operations.
5.2.1.2 Application log messages
Every software component of the TDAQ system uses the Error Reporting Service (ERS)
to report issues, i.e. events that need attention, either to the software component calling
it or to the external environment. The analysis of log messages is fundamental for debug
procedures and fault diagnosis.
The ERS de�nes a precise structure for log messages. Thanks to this uni�ed ap-
proach the log format is standardized across all TDAQ components. The example in
Table 5.1 shows an error reported by a data collection application. The ERS format
requires for a precise set of parameters, such as the host reporting the problem, the
date, the message type and the severity. This strong categorization simpli�es the auto-
mated processing performed by AAL. Nevertheless, since for many situations logs are
meant to be read by humans, the real information is only present in the message body,
as a free text. In the example, the name of the failing device ROS-TDQ-CALPP-00 is
only expressed as message text. This requires the AAL processing engine to be �exible
enough in parsing and retrieving the desired information.
The MRS tool is used for distributing messages between di�erent TDAQ applications
using a publish/subscribe model. A generic MRS client can subscribe to speci�c criteria,
expressed in term of partitions, application name and log parameters. The AAL engine
is con�gured to receive all the messages produced in every partition involved in data
78
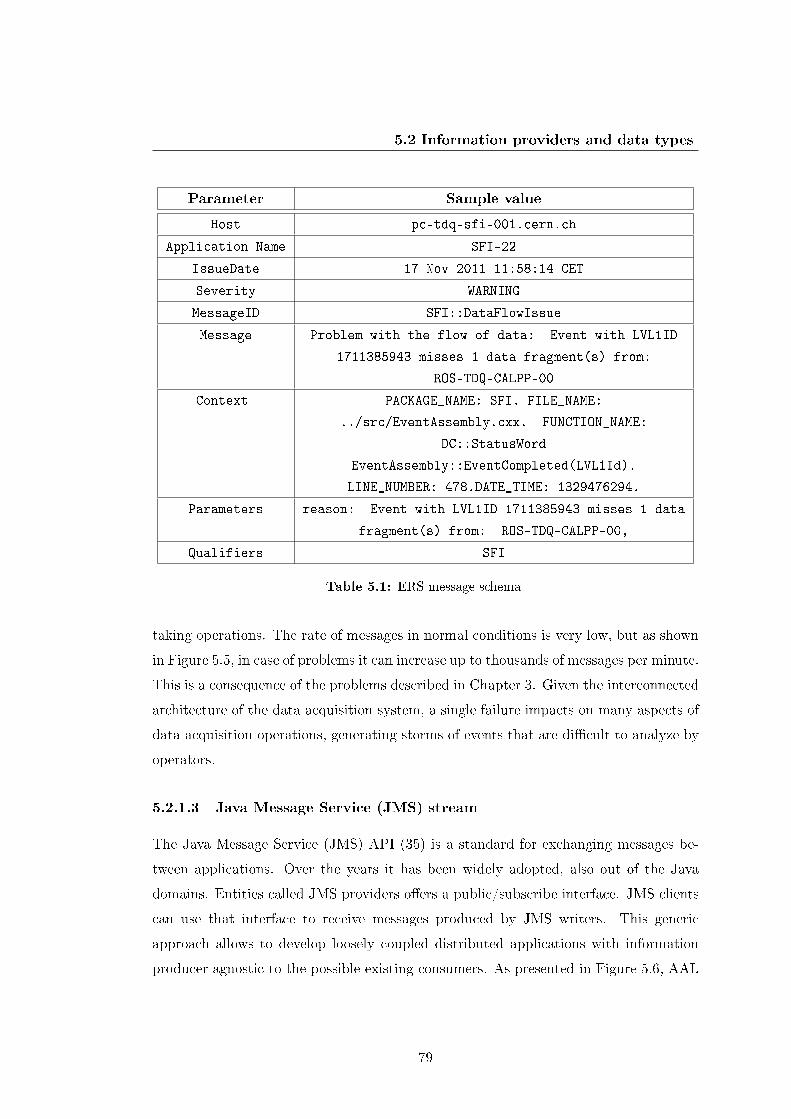
5.2 Information providers and data types
Parameter Sample value
Host pc-tdq-sfi-001.cern.ch
Application Name SFI-22
IssueDate 17 Nov 2011 11:58:14 CET
Severity WARNING
MessageID SFI::DataFlowIssue
Message Problem with the flow of data: Event with LVL1ID
1711385943 misses 1 data fragment(s) from:
ROS-TDQ-CALPP-00
Context PACKAGE_NAME: SFI. FILE_NAME:
../src/EventAssembly.cxx. FUNCTION_NAME:
DC::StatusWord
EventAssembly::EventCompleted(LVL1Id).
LINE_NUMBER: 478.DATE_TIME: 1329476294.
Parameters reason: Event with LVL1ID 1711385943 misses 1 data
fragment(s) from: ROS-TDQ-CALPP-00,
Qualifiers SFI
Table 5.1: ERS message schema
taking operations. The rate of messages in normal conditions is very low, but as shown
in Figure 5.5, in case of problems it can increase up to thousands of messages per minute.
This is a consequence of the problems described in Chapter 3. Given the interconnected
architecture of the data acquisition system, a single failure impacts on many aspects of
data acquisition operations, generating storms of events that are di�cult to analyze by
operators.
5.2.1.3 Java Message Service (JMS) stream
The Java Message Service (JMS) API (35) is a standard for exchanging messages be-
tween applications. Over the years it has been widely adopted, also out of the Java
domains. Entities called JMS providers o�ers a public/subscribe interface. JMS clients
can use that interface to receive messages produced by JMS writers. This generic
approach allows to develop loosely coupled distributed applications with information
producer agnostic to the possible existing consumers. As presented in Figure 5.6, AAL
79
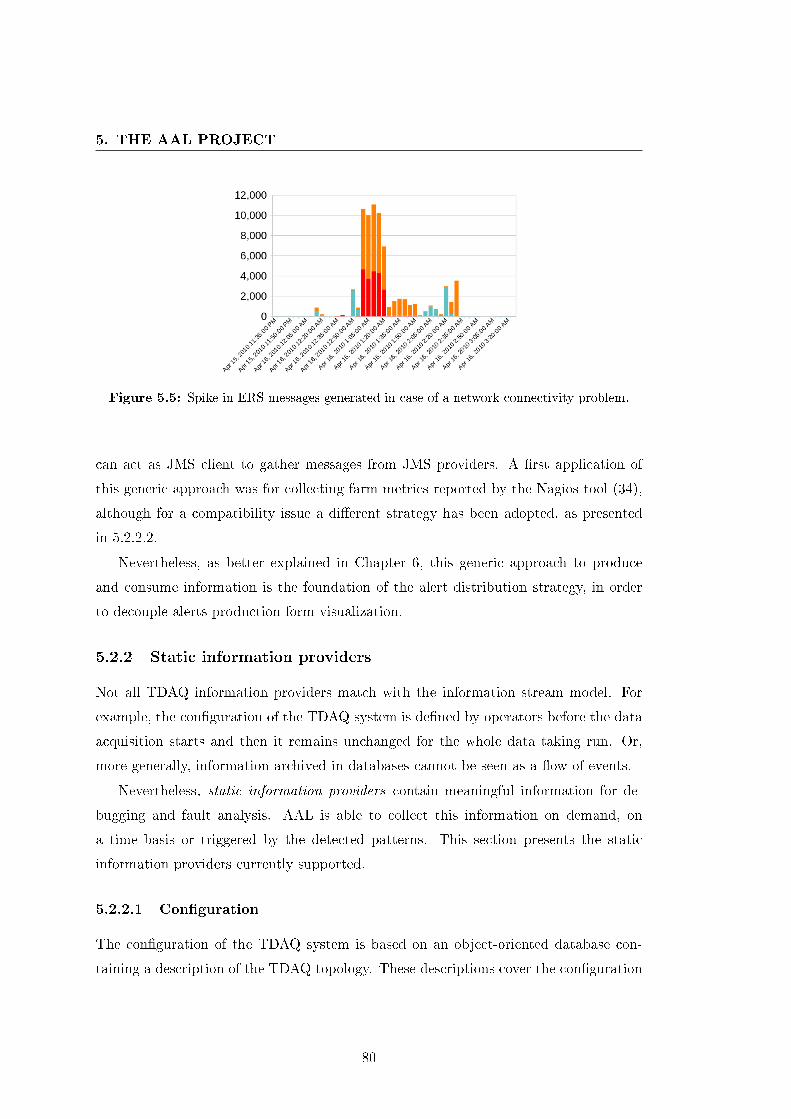
5. THE AAL PROJECT
Figure 5.5: Spike in ERS messages generated in case of a network connectivity problem.
can act as JMS client to gather messages from JMS providers. A �rst application of
this generic approach was for collecting farm metrics reported by the Nagios tool (34),
although for a compatibility issue a di�erent strategy has been adopted, as presented
in 5.2.2.2.
Nevertheless, as better explained in Chapter 6, this generic approach to produce
and consume information is the foundation of the alert distribution strategy, in order
to decouple alerts production form visualization.
5.2.2 Static information providers
Not all TDAQ information providers match with the information stream model. For
example, the con�guration of the TDAQ system is de�ned by operators before the data
acquisition starts and then it remains unchanged for the whole data taking run. Or,
more generally, information archived in databases cannot be seen as a �ow of events.
Nevertheless, static information providers contain meaningful information for de-
bugging and fault analysis. AAL is able to collect this information on demand, on
a time basis or triggered by the detected patterns. This section presents the static
information providers currently supported.
5.2.2.1 Con�guration
The con�guration of the TDAQ system is based on an object-oriented database con-
taining a description of the TDAQ topology. These descriptions cover the con�guration
80
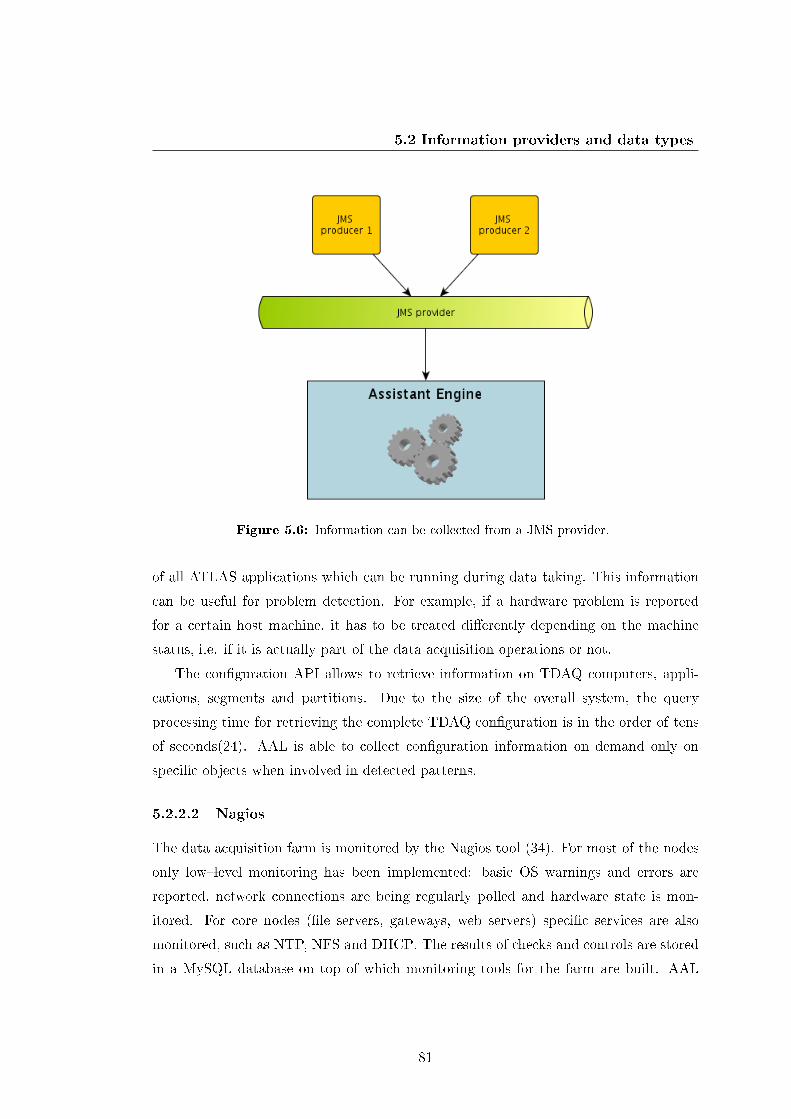
5.2 Information providers and data types
Figure 5.6: Information can be collected from a JMS provider.
of all ATLAS applications which can be running during data taking. This information
can be useful for problem detection. For example, if a hardware problem is reported
for a certain host machine, it has to be treated di�erently depending on the machine
status, i.e. if it is actually part of the data acquisition operations or not.
The con�guration API allows to retrieve information on TDAQ computers, appli-
cations, segments and partitions. Due to the size of the overall system, the query
processing time for retrieving the complete TDAQ con�guration is in the order of tens
of seconds(24). AAL is able to collect con�guration information on demand only on
speci�c objects when involved in detected patterns.
5.2.2.2 Nagios
The data acquisition farm is monitored by the Nagios tool (34). For most of the nodes
only low�level monitoring has been implemented: basic OS warnings and errors are
reported, network connections are being regularly polled and hardware state is mon-
itored. For core nodes (�le servers, gateways, web servers) speci�c services are also
monitored, such as NTP, NFS and DHCP. The results of checks and controls are stored
in a MySQL database on top of which monitoring tools for the farm are built. AAL
81
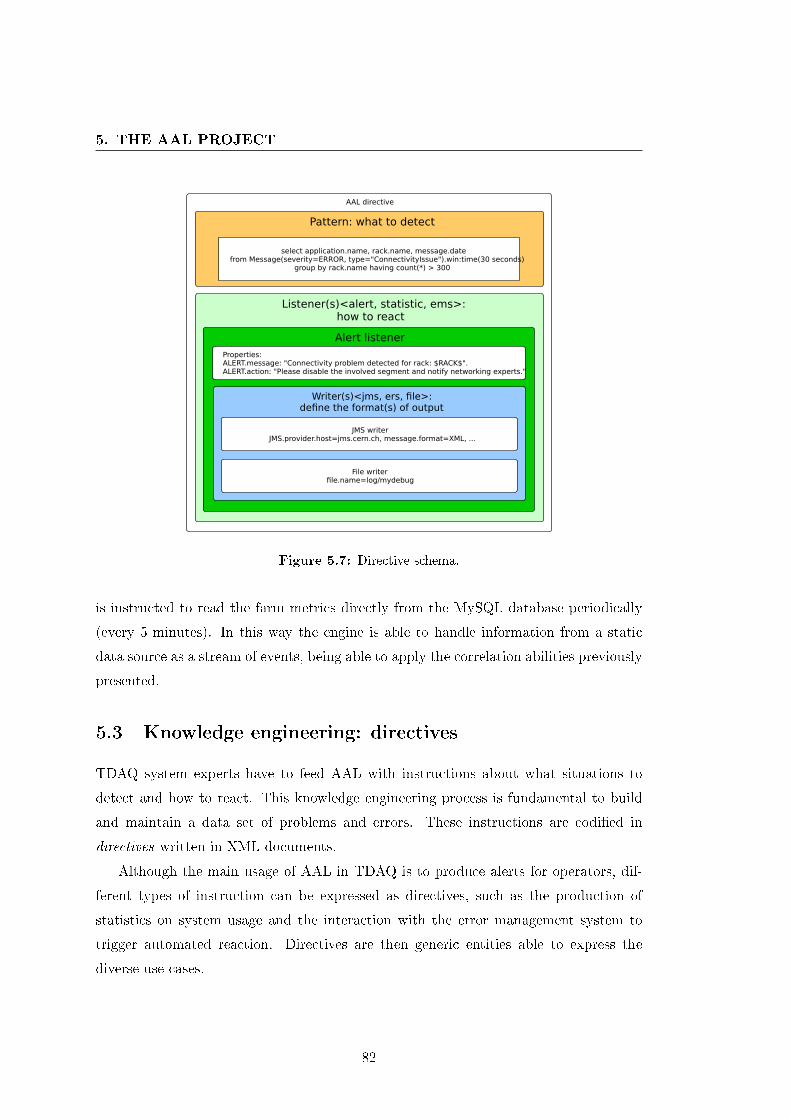
5. THE AAL PROJECT
AAL directive
Pattern: what to detect
select application.name, rack.name, message.datefrom Message(severity=ERROR, type="ConnectivityIssue").win:time(30 seconds)
group by rack.name having count(*) > 300
Listener(s)<alert, statistic, ems>:how to react
Alert listener
Properties:ALERT.message: "Connectivity problem detected for rack: $RACK$".ALERT.action: "Please disable the involved segment and notify networking experts."
Writer(s)<jms, ers, file>:define the format(s) of output
JMS writerJMS.provider.host=jms.cern.ch, message.format=XML, ...
File writerfile.name=log/mydebug
Figure 5.7: Directive schema.
is instructed to read the farm metrics directly from the MySQL database periodically
(every 5 minutes). In this way the engine is able to handle information from a static
data source as a stream of events, being able to apply the correlation abilities previously
presented.
5.3 Knowledge engineering: directives
TDAQ system experts have to feed AAL with instructions about what situations to
detect and how to react. This knowledge engineering process is fundamental to build
and maintain a data set of problems and errors. These instructions are codi�ed in
directives written in XML documents.
Although the main usage of AAL in TDAQ is to produce alerts for operators, dif-
ferent types of instruction can be expressed as directives, such as the production of
statistics on system usage and the interaction with the error management system to
trigger automated reaction. Directives are then generic entities able to express the
diverse use cases.
82
5.3 Knowledge engineering: directives
5.3.1 Directive structure
A directive, as presented in Figure 5.7, is composed by two main elements: the pattern,
that de�nes the sequence of events to react on, and by one or more listeners, that
de�ne the actions to be performed when the pattern is matched. A directive is derived
from the more generic concept of CEP rule, but it introduces a precise structure for the
listener part, speci�c to the AAL project.
5.3.1.1 Pattern
A directive pattern de�nes the pattern of events to be detected. Being the processing
functionalities in AAL implemented by the Esper CEP engine, patterns are expressed
as Esper EPL statement. The role of a pattern in a directive is to:
� de�ne the situation to react on ( i.e. detect more than 300 message of type �Con-
nectivityIssue� from di�erent applications from the same rack in 30 seconds);
� de�ne which information has to be extracted from the stream of events and passed
to the listener(s) (i.e. the list of application, the rack name, the date and time and
the message type).
5.3.1.2 Listener
A directive de�nes one or more listeners to instruct AAL on how to react when the
directive pattern is matched. There are three types of listeners:
� Alert producer: to create alerts for operators and experts.
� Statistics producer : to produce statistics using the event processing engine ca-
pabilities (e.g. computing the rate of IS callback during data taking runs or to
collect the number of log messages grouped by application).
� EMS interaction: to interact with the error management service (e.g. when a
certain pattern of events is detected, this listener can be used to interact with
EMS API to trigger a control action, such as restart a machine or application).
Every listener type requires its own set of parameters that need to be speci�ed as
instructions. Experts have to provide all the needed options when writing the directive.
83
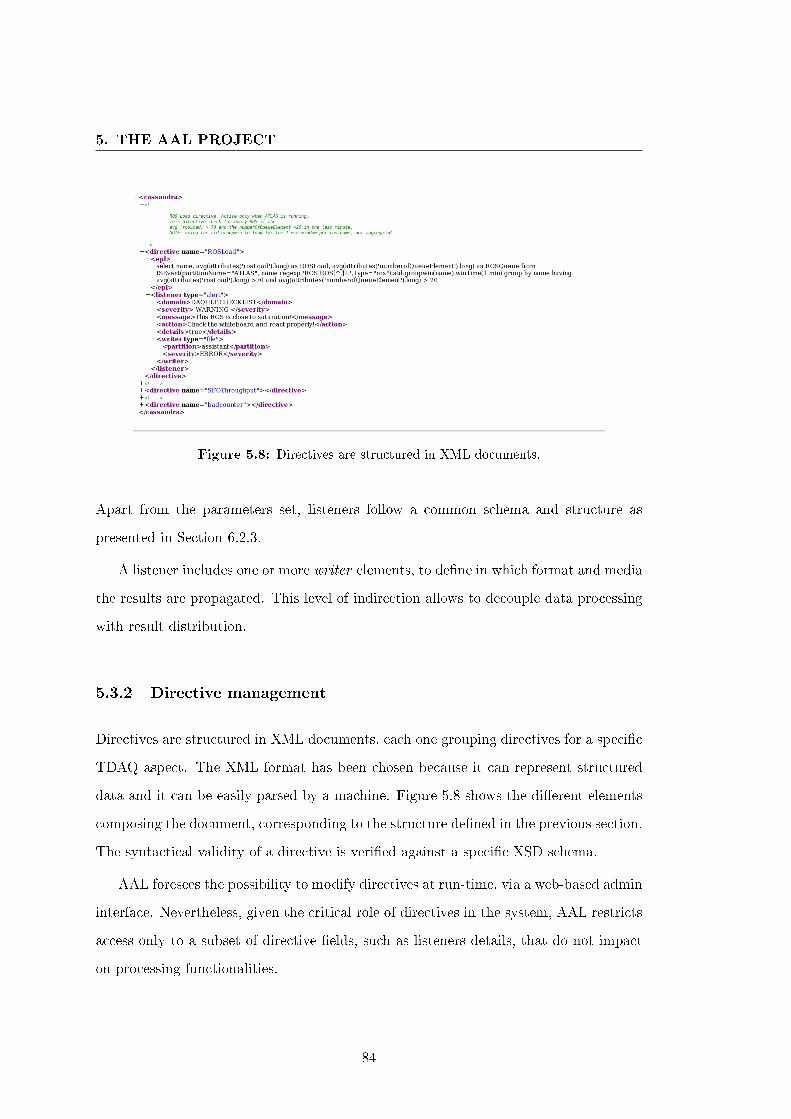
5. THE AAL PROJECT
Figure 5.8: Directives are structured in XML documents.
Apart from the parameters set, listeners follow a common schema and structure as
presented in Section 6.2.3.
A listener includes one or more writer elements, to de�ne in which format and media
the results are propagated. This level of indirection allows to decouple data processing
with result distribution.
5.3.2 Directive management
Directives are structured in XML documents, each one grouping directives for a speci�c
TDAQ aspect. The XML format has been chosen because it can represent structured
data and it can be easily parsed by a machine. Figure 5.8 shows the di�erent elements
composing the document, corresponding to the structure de�ned in the previous section.
The syntactical validity of a directive is veri�ed against a speci�c XSD schema.
AAL foresees the possibility to modify directives at run-time, via a web-based admin
interface. Nevertheless, given the critical role of directives in the system, AAL restricts
access only to a subset of directive �elds, such as listeners details, that do not impact
on processing functionalities.
84
5.4 Alerts
5.4 Alerts
Alert-based systems do not share a good reputation in monitoring and operational
procedures (16). This is mainly because there is little or no intelligence in how standard
monitoring tools determines what is normal or abnormal. This leads to alerts that are
too generic, if not completely incorrect, with no or few contextual information and with
a high rate of false-positives. Alerts becomes of no use and, by consequence, they are
completely ignored by system operators.
The AAL project o�ers an e�ective alert-based noti�cation system leveraging on :
� Intelligent processing : thanks to the CEP capabilities it minimizes the number of
false-positive situations.
� Information on demand : alerts produced by AAL carry all the information needed
for debug and fault diagnosis.
� E�ective and timeliness noti�cation: distribution and visualization solutions to
notify both operators and experts as soon as a problem is detected, minimizing
the latency.
5.4.1 Alert structure
An alert is composed by di�erent �elds :
� Problem description: brief description of the problem detected.
� Reaction: expected reaction to be taken by the operator.
� Severity: the severity of the issue.
� Domain: the domain of the noti�cation. This information is used to route alert
to the appropriate shifters desk.
� Pattern details: all the information, as collected by the patterns, about the events
that triggered the alert.
Figure 5.9presents alerts visualized via the AAL web page.
85
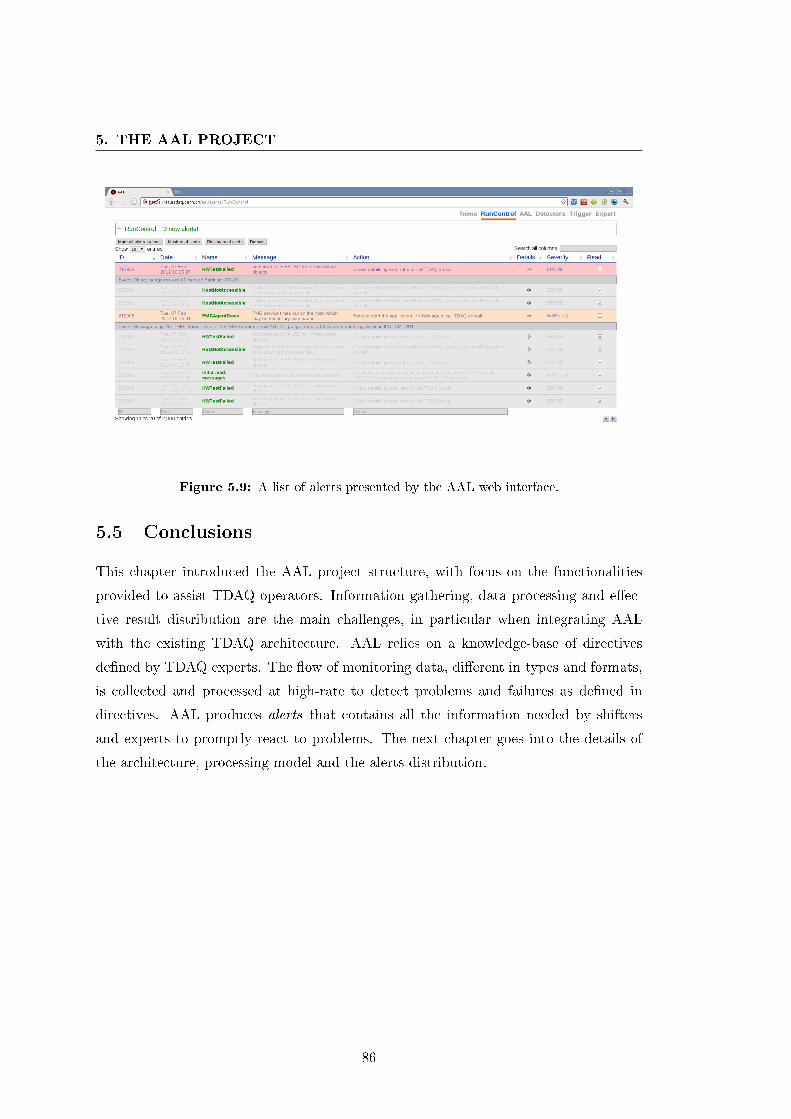
5. THE AAL PROJECT
Figure 5.9: A list of alerts presented by the AAL web interface.
5.5 Conclusions
This chapter introduced the AAL project structure, with focus on the functionalities
provided to assist TDAQ operators. Information gathering, data processing and e�ec-
tive result distribution are the main challenges, in particular when integrating AAL
with the existing TDAQ architecture. AAL relies on a knowledge-base of directives
de�ned by TDAQ experts. The �ow of monitoring data, di�erent in types and formats,
is collected and processed at high-rate to detect problems and failures as de�ned in
directives. AAL produces alerts that contains all the information needed by shifters
and experts to promptly react to problems. The next chapter goes into the details of
the architecture, processing model and the alerts distribution.
86
Chapter 6
The AAL design and
implementation
The architecture of the AAL project decouples the gathering and the processing of mon-
itoring data from the distribution of noti�cations to operators. In this way, AAL can
be easily extended with new information sources and visualization strategies without
interfering with the data processing. Alerts are distributed via a message-driven archi-
tecture and visualized in dynamic web pages, to promptly notify problems to TDAQ
operators. This chapter presents the AAL engine architecture, it discusses the threading
structure and the processing model for TDAQ problems and it �nally describes alerts
distribution and visualization.
6.1 The AAL architecture
The AAL project has a loosely-coupled architecture where two main modules interact
via a message broker, also known as event/message bus (23). As presented in Figure
6.1 the AAL components are:
� The AAL engine: responsible for the collection and correlation of monitoring data
as speci�ed in directives.
� The AAL web application: responsible for providing a dynamic and interactive
visualization of alerts for operators.
87
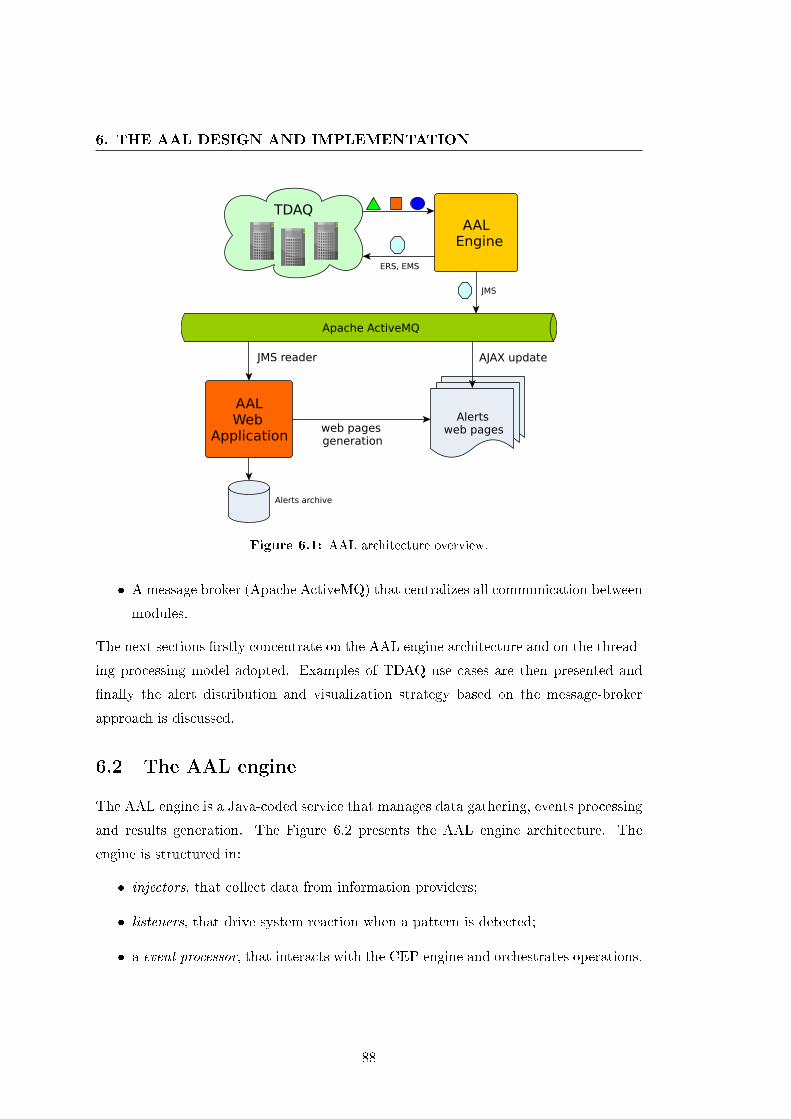
6. THE AAL DESIGN AND IMPLEMENTATION
web pageweb page
AAL Engine
Apache ActiveMQ
AALWeb
Application
JMS
JMS reader
web pages generation
Alerts archive
TDAQ
ERS, EMS
Alertsweb pages
AJAX update
Figure 6.1: AAL architecture overview.
� A message broker (Apache ActiveMQ) that centralizes all communication between
modules.
The next sections �rstly concentrate on the AAL engine architecture and on the thread-
ing processing model adopted. Examples of TDAQ use cases are then presented and
�nally the alert distribution and visualization strategy based on the message-broker
approach is discussed.
6.2 The AAL engine
The AAL engine is a Java-coded service that manages data gathering, events processing
and results generation. The Figure 6.2 presents the AAL engine architecture. The
engine is structured in:
� injectors, that collect data from information providers;
� listeners, that drive system reaction when a pattern is detected;
� a event processor, that interacts with the CEP engine and orchestrates operations.
88
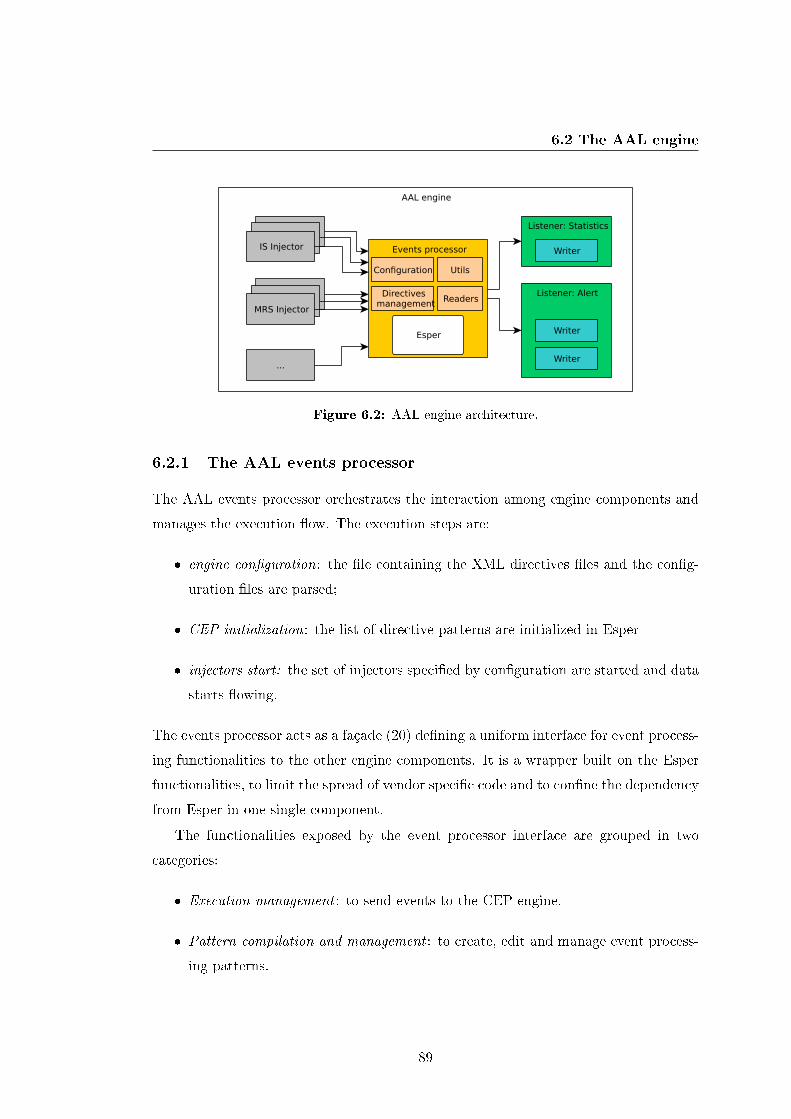
6.2 The AAL engine
AAL engine
Events processor
IS Injector
MRS InjectorMRS Injector
IS InjectorIS Injector
MRS Injector
...
Esper
Listener: Statistics
Writer
Configuration
Directives management
Listener: Alert
Alert handlerWriter
Writer
Utils
Readers
Figure 6.2: AAL engine architecture.
6.2.1 The AAL events processor
The AAL events processor orchestrates the interaction among engine components and
manages the execution �ow. The execution steps are:
� engine con�guration: the �le containing the XML directives �les and the con�g-
uration �les are parsed;
� CEP initialization: the list of directive patterns are initialized in Esper
� injectors start: the set of injectors speci�ed by con�guration are started and data
starts �owing.
The events processor acts as a façade (20) de�ning a uniform interface for event process-
ing functionalities to the other engine components. It is a wrapper built on the Esper
functionalities, to limit the spread of vendor speci�c code and to con�ne the dependency
from Esper in one single component.
The functionalities exposed by the event processor interface are grouped in two
categories:
� Execution management : to send events to the CEP engine.
� Pattern compilation and management : to create, edit and manage event process-
ing patterns.
89
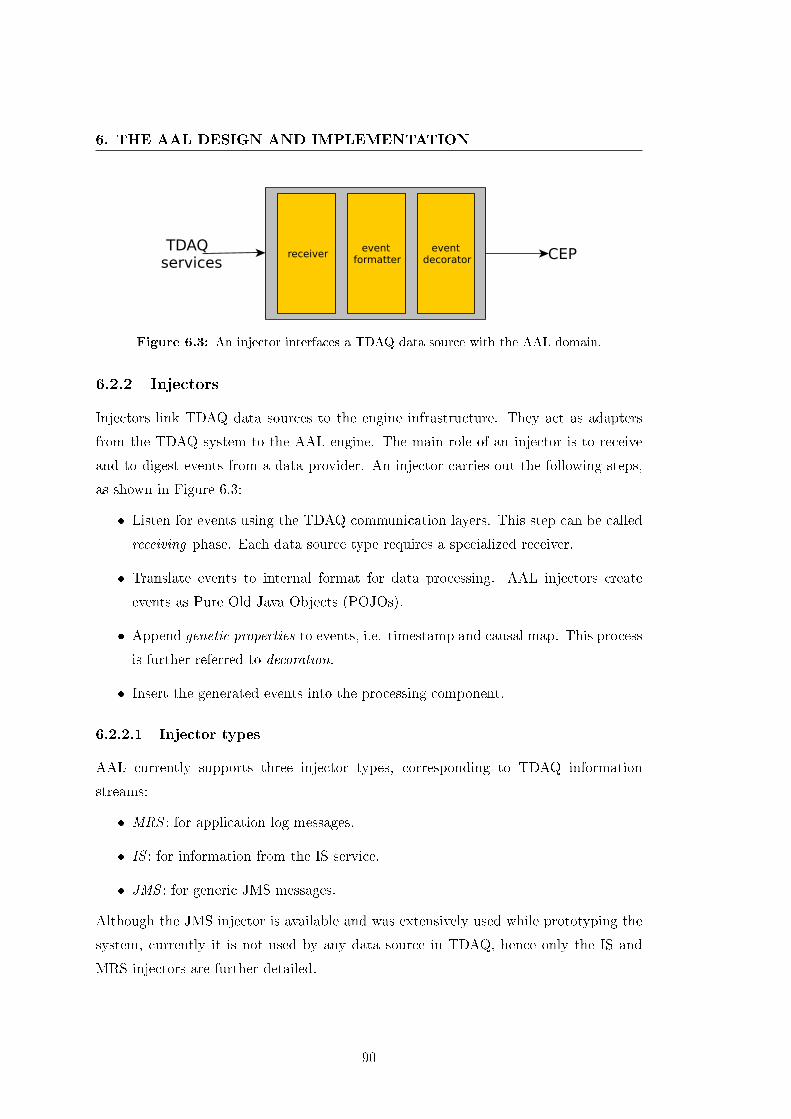
6. THE AAL DESIGN AND IMPLEMENTATION
receiverevent
formatterevent
decoratorTDAQ
servicesCEP
Figure 6.3: An injector interfaces a TDAQ data source with the AAL domain.
6.2.2 Injectors
Injectors link TDAQ data sources to the engine infrastructure. They act as adapters
from the TDAQ system to the AAL engine. The main role of an injector is to receive
and to digest events from a data provider. An injector carries out the following steps,
as shown in Figure 6.3:
� Listen for events using the TDAQ communication layers. This step can be called
receiving phase. Each data source type requires a specialized receiver.
� Translate events to internal format for data processing. AAL injectors create
events as Pure Old Java Objects (POJOs).
� Append genetic properties to events, i.e. timestamp and causal map. This process
is further referred to decoration.
� Insert the generated events into the processing component.
6.2.2.1 Injector types
AAL currently supports three injector types, corresponding to TDAQ information
streams:
� MRS : for application log messages.
� IS : for information from the IS service.
� JMS : for generic JMS messages.
Although the JMS injector is available and was extensively used while prototyping the
system, currently it is not used by any data source in TDAQ, hence only the IS and
MRS injectors are further detailed.
90
6.2 The AAL engine
6.2.2.2 Injector criteria and con�guration
Both for IS and MRS injectors, events are received via the publish/subscribe API pro-
vided by the corresponding information sources. Injectors can be subscribed to speci�c
criteria to de�ne a set of interesting events, in terms of [Partition, IS Server, name,
Information Name] for IS and [Partition, Application-Name, Message-Attributes] for
MRS.
AAL is con�gured with a list of subscription criteria in order to retrieve all data
needed to feed existing patterns. It instantiates one injector per de�ned subscription
expression. Around 40 injectors are currently de�ned for normal data-taking operations.
The AAL events processor stops/starts injectors when the corresponding data sources
are stopped or restarted, to maintain the internal state coherent with the TDAQ status.
6.2.2.3 Injector design
As presented in Figure 6.4, injectors are handled by the events processor as generic enti-
ties. Concrete injector implementations receive and digest data from the corresponding
data sources and uses the events processor API to submit new events.
Events are represented as Pure Old Java Objects (POJOs). During the translation
phase injectors parse the information received by the data source and build the cor-
responding event class, formatting the data parameters ready for processing. POJO
events are than injected in the processing engine.
6.2.3 Listeners
Listeners de�ne the actions performed when a pattern is matched, re�ecting the instruc-
tions speci�ed in directives. Listeners receive the information collected by patterns at
matching time, and use it to build the expected result, e.g. an alert contains all details
on the detected problems.
6.2.3.1 Listener types
A listener factory is used to generate concrete listeners of di�erent types. A listener
implements an update method, as de�ned by the listener interface, that is invoked every
time a pattern is matched, passing the list of matching events as parameters. There are
three listener types:
91
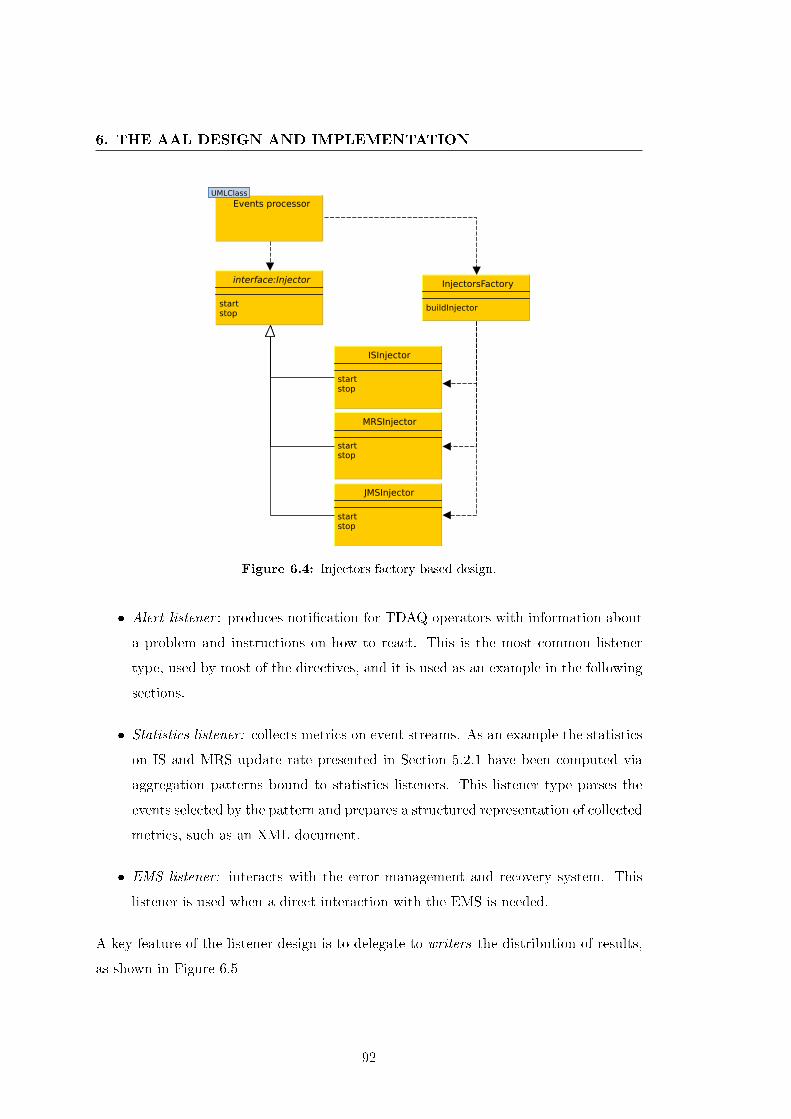
6. THE AAL DESIGN AND IMPLEMENTATION
interface:Injector
startstop
MRSInjector
startstop
ISInjector
startstop
JMSInjector
startstop
InjectorsFactory
buildInjector
Events processorUMLClassUMLClassUMLClassUMLClassUMLClassUMLClass
Figure 6.4: Injectors factory-based design.
� Alert listener : produces noti�cation for TDAQ operators with information about
a problem and instructions on how to react. This is the most common listener
type, used by most of the directives, and it is used as an example in the following
sections.
� Statistics listener: collects metrics on event streams. As an example the statistics
on IS and MRS update rate presented in Section 5.2.1 have been computed via
aggregation patterns bound to statistics listeners. This listener type parses the
events selected by the pattern and prepares a structured representation of collected
metrics, such as an XML document.
� EMS listener: interacts with the error management and recovery system. This
listener is used when a direct interaction with the EMS is needed.
A key feature of the listener design is to delegate to writers the distribution of results,
as shown in Figure 6.5
92
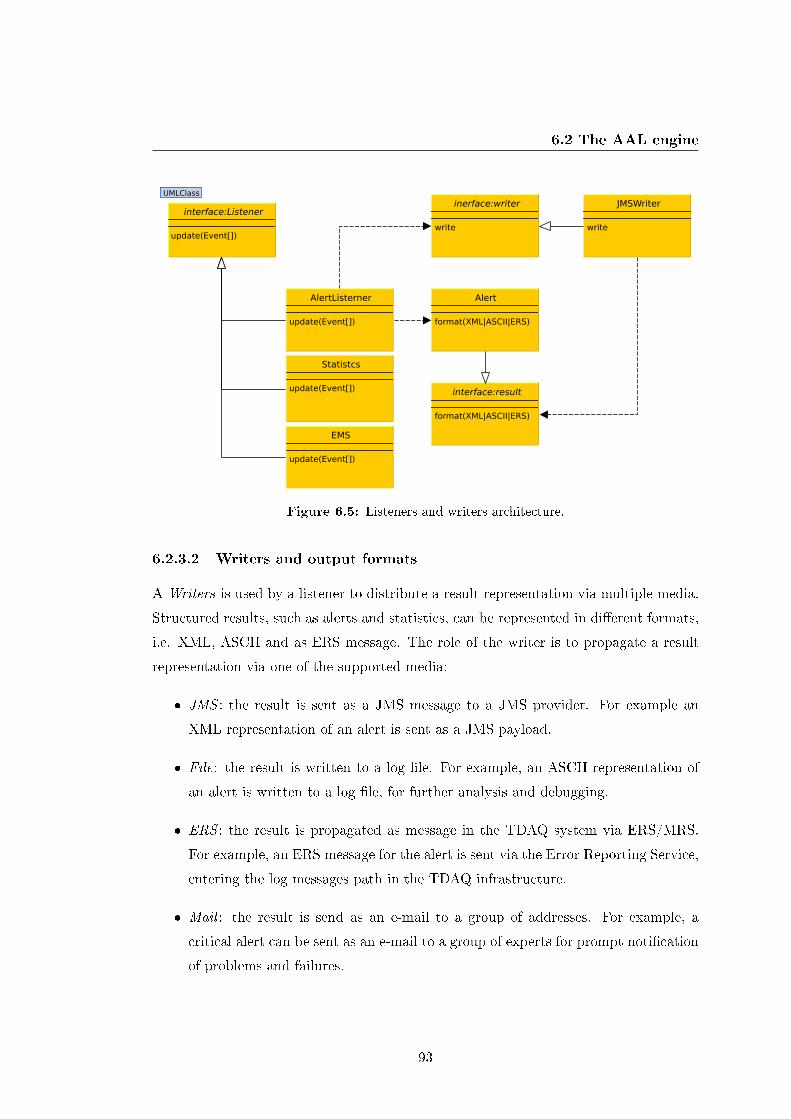
6.2 The AAL engine
interface:Listener
update(Event[])
Statistcs
update(Event[])
AlertListerner
update(Event[])
EMS
update(Event[])
interface:result
format(XML|ASCII|ERS)
Alert
format(XML|ASCII|ERS)
inerface:writer
write
JMSWriter
write
UMLClassUMLClassUMLClassUMLClassUMLClassUMLClassUMLClassUMLClass
Figure 6.5: Listeners and writers architecture.
6.2.3.2 Writers and output formats
A Writers is used by a listener to distribute a result representation via multiple media.
Structured results, such as alerts and statistics, can be represented in di�erent formats,
i.e. XML, ASCII and as ERS message. The role of the writer is to propagate a result
representation via one of the supported media:
� JMS : the result is sent as a JMS message to a JMS provider. For example an
XML representation of an alert is sent as a JMS payload.
� File: the result is written to a log �le. For example, an ASCII representation of
an alert is written to a log �le, for further analysis and debugging.
� ERS : the result is propagated as message in the TDAQ system via ERS/MRS.
For example, an ERS message for the alert is sent via the Error Reporting Service,
entering the log messages path in the TDAQ infrastructure.
� Mail : the result is send as an e-mail to a group of addresses. For example, a
critical alert can be sent as an e-mail to a group of experts for prompt noti�cation
of problems and failures.
93
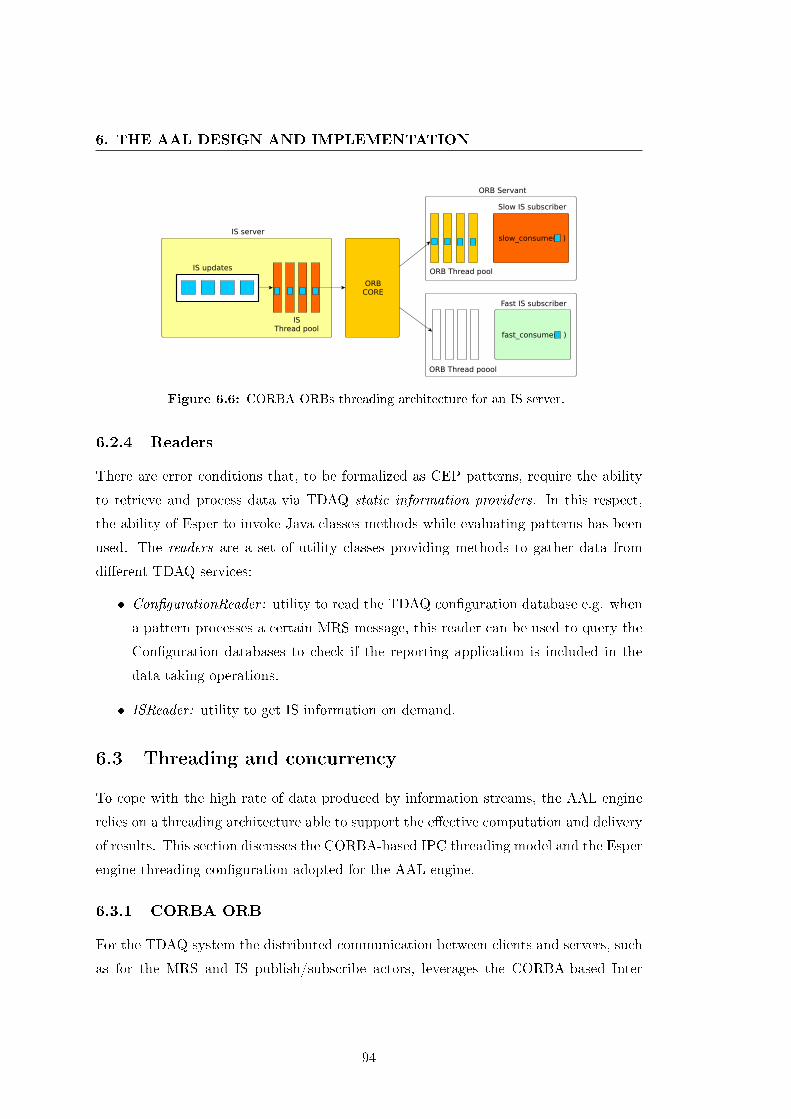
6. THE AAL DESIGN AND IMPLEMENTATION
ORB Servant
IS server
Slow IS subscriber
Fast IS subscriber
ORBCORE
ORB Thread pool
slow_consume( )
fast_consume( )
IS updates
ORB Thread poool
ISThread pool
Figure 6.6: CORBA ORBs threading architecture for an IS server.
6.2.4 Readers
There are error conditions that, to be formalized as CEP patterns, require the ability
to retrieve and process data via TDAQ static information providers. In this respect,
the ability of Esper to invoke Java classes methods while evaluating patterns has been
used. The readers are a set of utility classes providing methods to gather data from
di�erent TDAQ services:
� Con�gurationReader : utility to read the TDAQ con�guration database e.g. when
a pattern processes a certain MRS message, this reader can be used to query the
Con�guration databases to check if the reporting application is included in the
data taking operations.
� ISReader: utility to get IS information on demand.
6.3 Threading and concurrency
To cope with the high rate of data produced by information streams, the AAL engine
relies on a threading architecture able to support the e�ective computation and delivery
of results. This section discusses the CORBA-based IPC threading model and the Esper
engine threading con�guration adopted for the AAL engine.
6.3.1 CORBA ORB
For the TDAQ system the distributed communication between clients and servers, such
as for the MRS and IS publish/subscribe actors, leverages the CORBA-based Inter
94
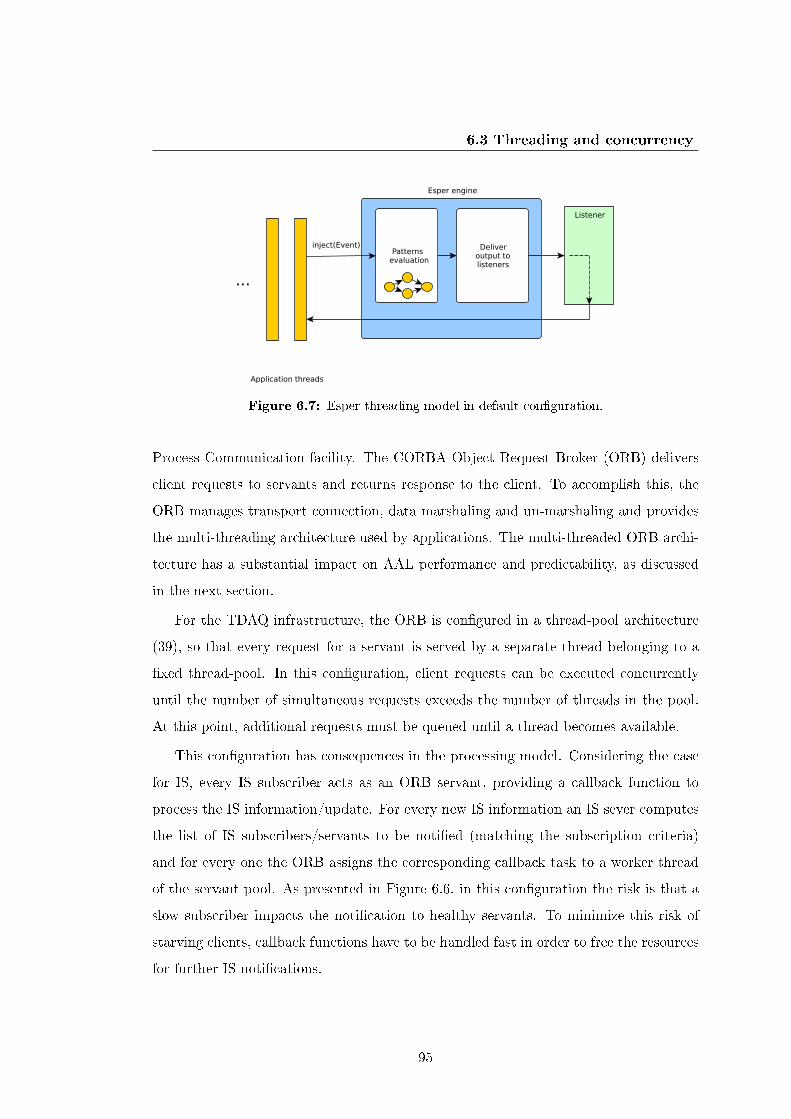
6.3 Threading and concurrency
Esper engine
Patterns evaluation
Deliveroutput tolisteners
Application threads
...
Listener
inject(Event)
Figure 6.7: Esper threading model in default con�guration.
Process Communication facility. The CORBA Object Request Broker (ORB) delivers
client requests to servants and returns response to the client. To accomplish this, the
ORB manages transport connection, data marshaling and un-marshaling and provides
the multi-threading architecture used by applications. The multi-threaded ORB archi-
tecture has a substantial impact on AAL performance and predictability, as discussed
in the next section.
For the TDAQ infrastructure, the ORB is con�gured in a thread-pool architecture
(39), so that every request for a servant is served by a separate thread belonging to a
�xed thread-pool. In this con�guration, client requests can be executed concurrently
until the number of simultaneous requests exceeds the number of threads in the pool.
At this point, additional requests must be queued until a thread becomes available.
This con�guration has consequences in the processing model. Considering the case
for IS, every IS subscriber acts as an ORB servant, providing a callback function to
process the IS information/update. For every new IS information an IS sever computes
the list of IS subscribers/servants to be noti�ed (matching the subscription criteria)
and for every one the ORB assigns the corresponding callback task to a worker thread
of the servant pool. As presented in Figure 6.6, in this con�guration the risk is that a
slow subscriber impacts the noti�cation to healthy servants. To minimize this risk of
starving clients, callback functions have to be handled fast in order to free the resources
for further IS noti�cations.
95
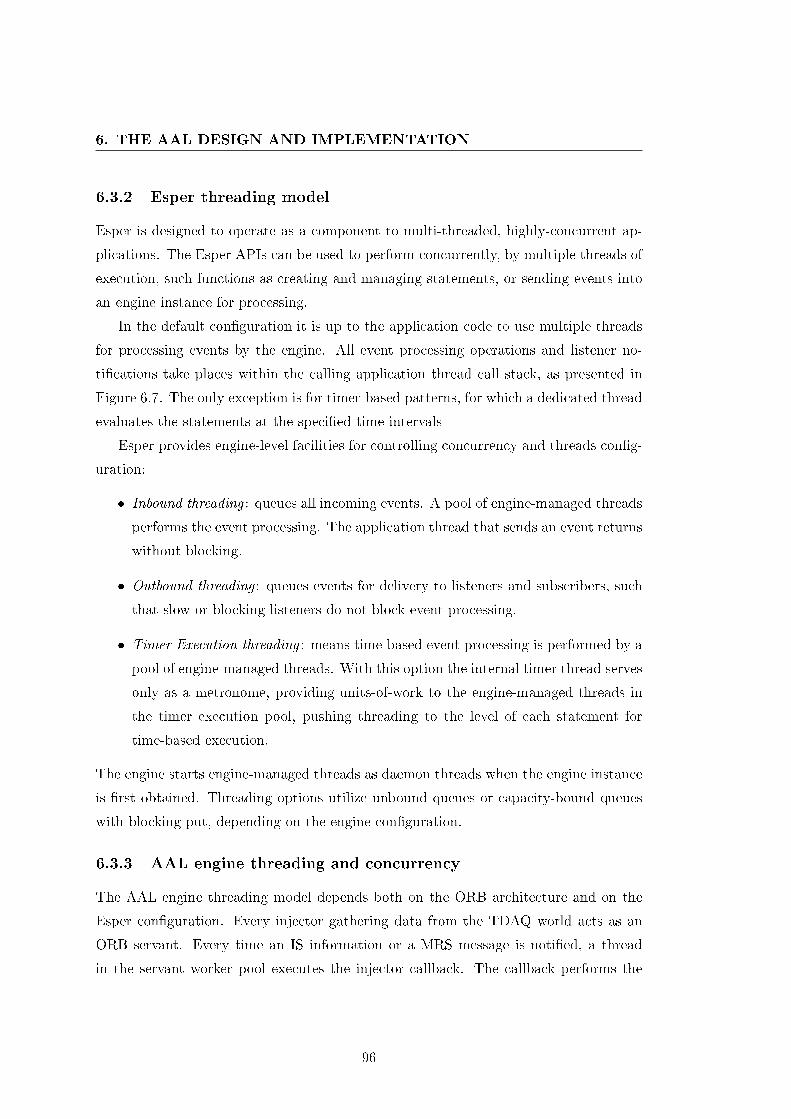
6. THE AAL DESIGN AND IMPLEMENTATION
6.3.2 Esper threading model
Esper is designed to operate as a component to multi-threaded, highly-concurrent ap-
plications. The Esper APIs can be used to perform concurrently, by multiple threads of
execution, such functions as creating and managing statements, or sending events into
an engine instance for processing.
In the default con�guration it is up to the application code to use multiple threads
for processing events by the engine. All event processing operations and listener no-
ti�cations take places within the calling application thread call stack, as presented in
Figure 6.7. The only exception is for timer-based patterns, for which a dedicated thread
evaluates the statements at the speci�ed time intervals
Esper provides engine-level facilities for controlling concurrency and threads con�g-
uration:
� Inbound threading : queues all incoming events. A pool of engine-managed threads
performs the event processing. The application thread that sends an event returns
without blocking.
� Outbound threading : queues events for delivery to listeners and subscribers, such
that slow or blocking listeners do not block event processing.
� Timer Execution threading : means time-based event processing is performed by a
pool of engine-managed threads. With this option the internal timer thread serves
only as a metronome, providing units-of-work to the engine-managed threads in
the timer execution pool, pushing threading to the level of each statement for
time-based execution.
The engine starts engine-managed threads as daemon threads when the engine instance
is �rst obtained. Threading options utilize unbound queues or capacity-bound queues
with blocking-put, depending on the engine con�guration.
6.3.3 AAL engine threading and concurrency
The AAL engine threading model depends both on the ORB architecture and on the
Esper con�guration. Every injector gathering data from the TDAQ world acts as an
ORB servant. Every time an IS information or a MRS message is noti�ed, a thread
in the servant worker pool executes the injector callback. The callback performs the
96
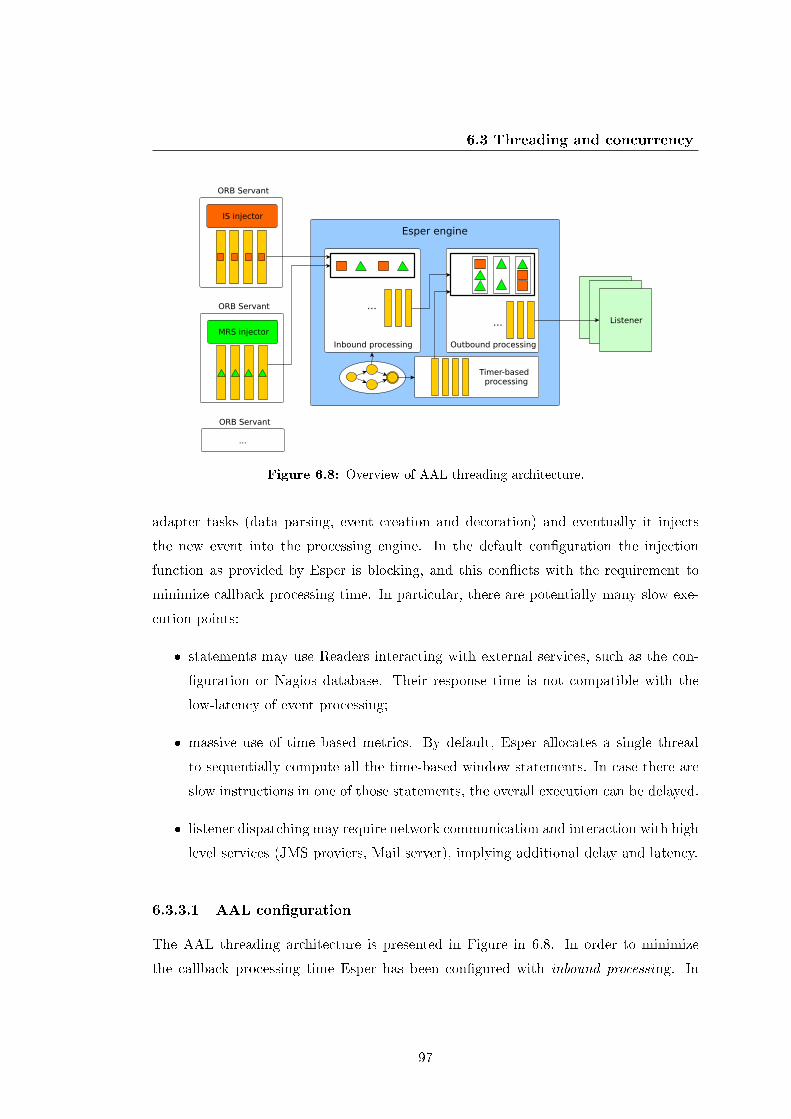
6.3 Threading and concurrency
...
...
ListenerListener
Listener
ORB Servant
IS injector
ORB Servant
MRS injector
ORB Servant
Inbound processing Outbound processing
Timer-based processing
Esper engine
...
Figure 6.8: Overview of AAL threading architecture.
adapter tasks (data parsing, event creation and decoration) and eventually it injects
the new event into the processing engine. In the default con�guration the injection
function as provided by Esper is blocking, and this con�icts with the requirement to
minimize callback processing time. In particular, there are potentially many slow exe-
cution points:
� statements may use Readers interacting with external services, such as the con-
�guration or Nagios database. Their response time is not compatible with the
low-latency of event processing;
� massive use of time based metrics. By default, Esper allocates a single thread
to sequentially compute all the time-based window statements. In case there are
slow instructions in one of those statements, the overall execution can be delayed.
� listener dispatching may require network communication and interaction with high
level services (JMS proviers, Mail server), implying additional delay and latency.
6.3.3.1 AAL con�guration
The AAL threading architecture is presented in Figure in 6.8. In order to minimize
the callback processing time Esper has been con�gured with inbound processing. In
97
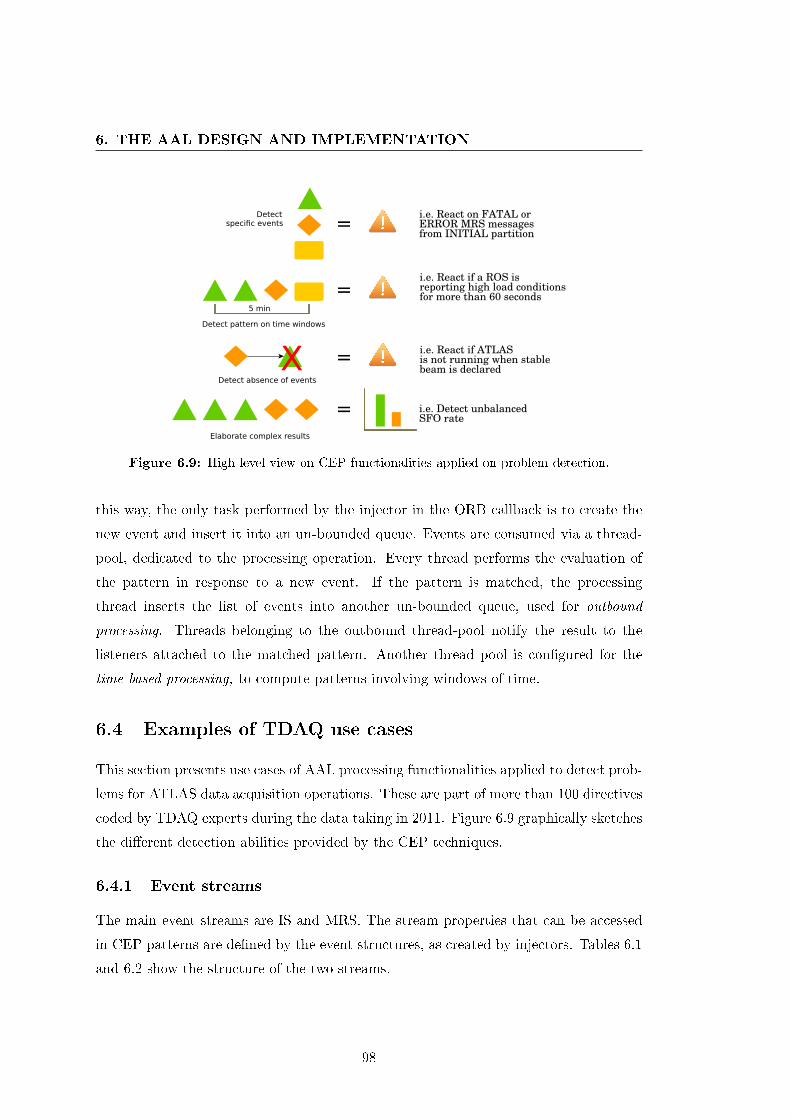
6. THE AAL DESIGN AND IMPLEMENTATION
Detectspecific events
Detect pattern on time windows
=
=5 min
=Detect absence of events
X
Elaborate complex results
=
i.e. React on FATAL or ERROR MRS messages from INITIAL partition
i.e. React if a ROS is reporting high load conditions for more than 60 seconds
i.e. React if ATLAS is not running when stable beam is declared
i.e. Detect unbalanced SFO rate
Figure 6.9: High-level view on CEP functionalities applied on problem detection.
this way, the only task performed by the injector in the ORB callback is to create the
new event and insert it into an un-bounded queue. Events are consumed via a thread-
pool, dedicated to the processing operation. Every thread performs the evaluation of
the pattern in response to a new event. If the pattern is matched, the processing
thread inserts the list of events into another un-bounded queue, used for outbound
processing. Threads belonging to the outbound thread-pool notify the result to the
listeners attached to the matched pattern. Another thread pool is con�gured for the
time-based processing, to compute patterns involving windows of time.
6.4 Examples of TDAQ use cases
This section presents use cases of AAL processing functionalities applied to detect prob-
lems for ATLAS data acquisition operations. These are part of more than 100 directives
coded by TDAQ experts during the data taking in 2011. Figure 6.9 graphically sketches
the di�erent detection abilities provided by the CEP techniques.
6.4.1 Event streams
The main event streams are IS and MRS. The stream properties that can be accessed
in CEP patterns are de�ned by the event structures, as created by injectors. Tables 6.1
and 6.2 show the structure of the two streams.
98
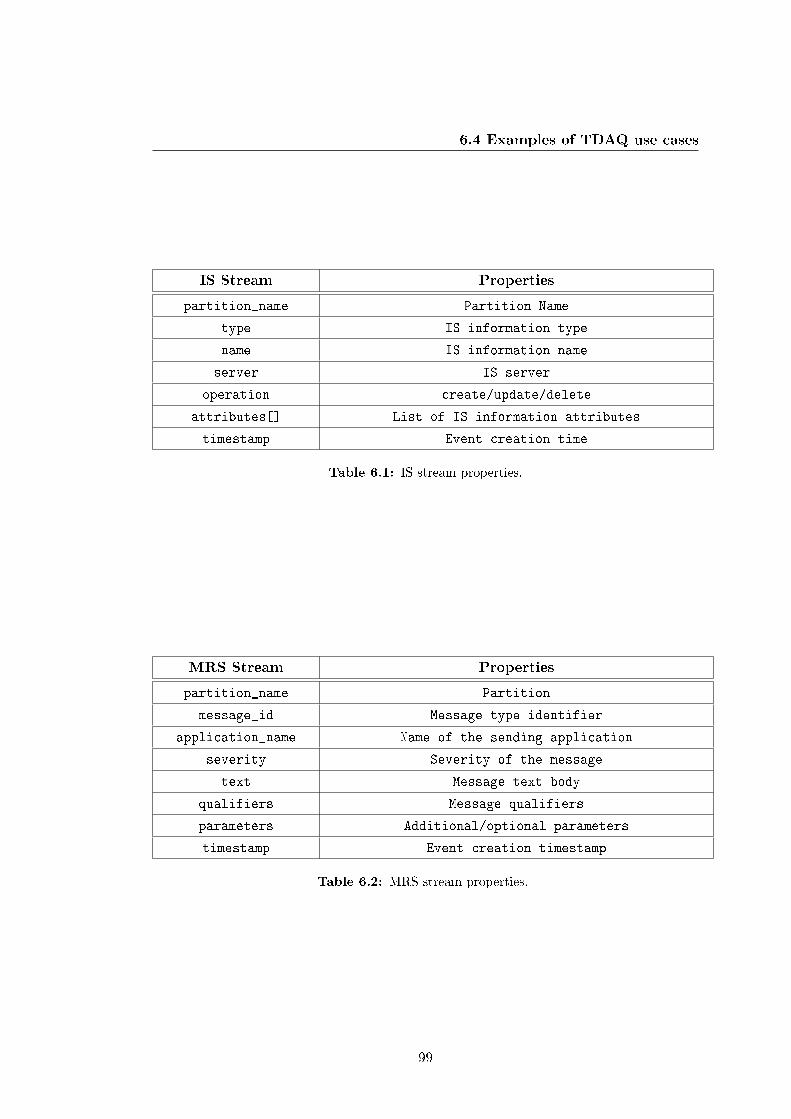
6.4 Examples of TDAQ use cases
IS Stream Properties
partition_name Partition Name
type IS information type
name IS information name
server IS server
operation create/update/delete
attributes[] List of IS information attributes
timestamp Event creation time
Table 6.1: IS stream properties.
MRS Stream Properties
partition_name Partition
message_id Message type identifier
application_name Name of the sending application
severity Severity of the message
text Message text body
qualifiers Message qualifiers
parameters Additional/optional parameters
timestamp Event creation timestamp
Table 6.2: MRS stream properties.
99
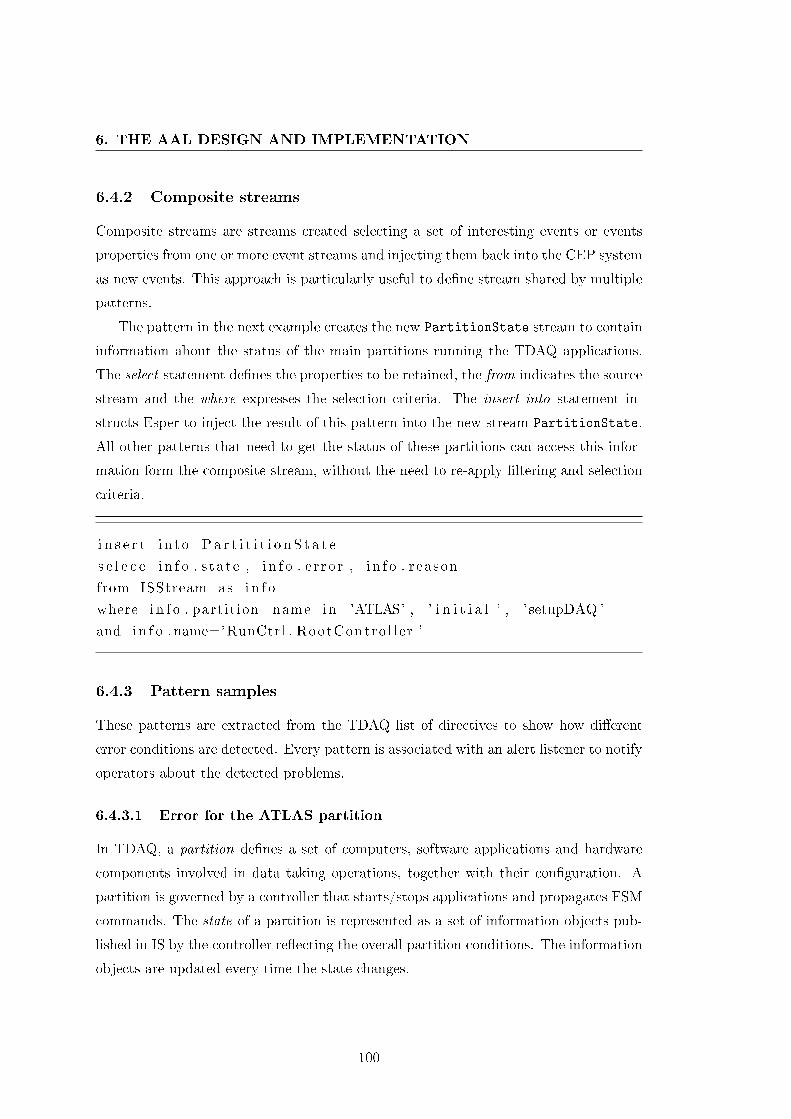
6. THE AAL DESIGN AND IMPLEMENTATION
6.4.2 Composite streams
Composite streams are streams created selecting a set of interesting events or events
properties from one or more event streams and injecting them back into the CEP system
as new events. This approach is particularly useful to de�ne stream shared by multiple
patterns.
The pattern in the next example creates the new PartitionState stream to contain
information about the status of the main partitions running the TDAQ applications.
The select statement de�nes the properties to be retained, the from indicates the source
stream and the where expresses the selection criteria. The insert into statement in-
structs Esper to inject the result of this pattern into the new stream PartitionState.
All other patterns that need to get the status of these partitions can access this infor-
mation form the composite stream, without the need to re-apply �ltering and selection
criteria.
i n s e r t i n to Pa r t i t i t i o n S t a t e
s e l e c e i n f o . s ta te , i n f o . e r ro r , i n f o . reason
from ISStream as i n f o
where i n f o . partition_name in 'ATLAS' , ' i n i t i a l ' , ' setupDAQ '
and i n f o . name='RunCtrl . RootContro l ler '
6.4.3 Pattern samples
These patterns are extracted from the TDAQ list of directives to show how di�erent
error conditions are detected. Every pattern is associated with an alert listener to notify
operators about the detected problems.
6.4.3.1 Error for the ATLAS partition
In TDAQ, a partition de�nes a set of computers, software applications and hardware
components involved in data taking operations, together with their con�guration. A
partition is governed by a controller that starts/stops applications and propagates FSM
commands. The state of a partition is represented as a set of information objects pub-
lished in IS by the controller re�ecting the overall partition conditions. The information
objects are updated every time the state changes.
100
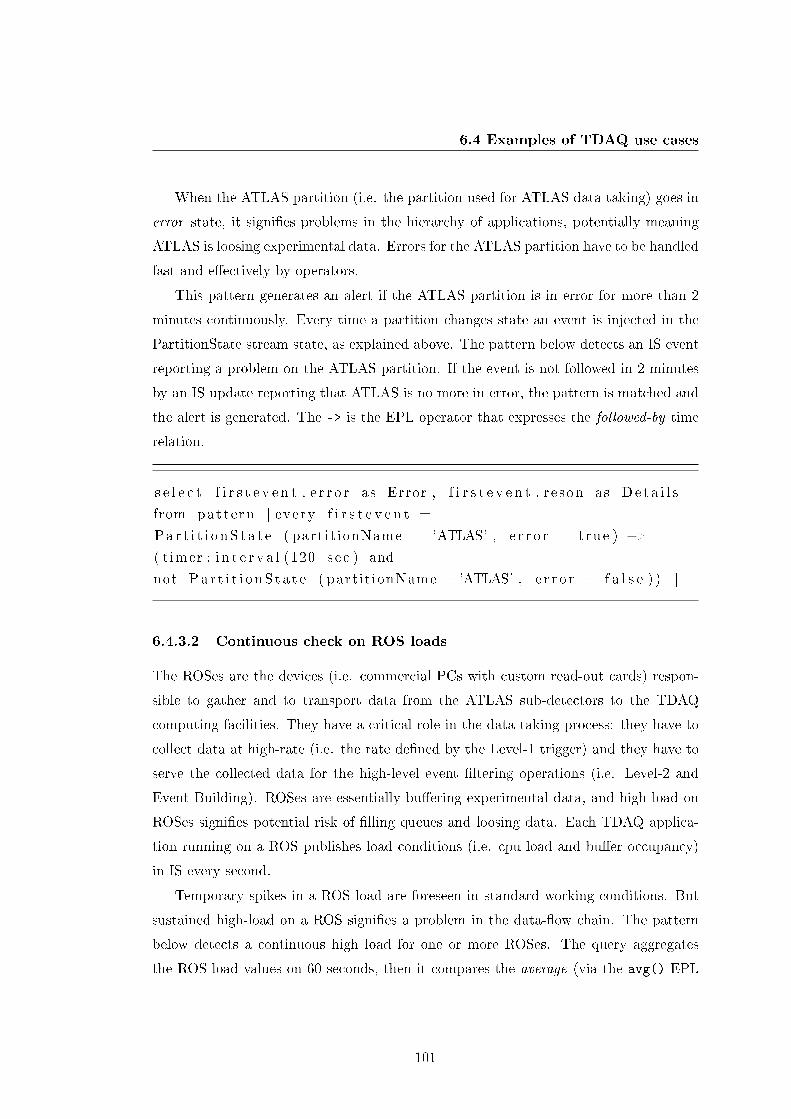
6.4 Examples of TDAQ use cases
When the ATLAS partition (i.e. the partition used for ATLAS data taking) goes in
error state, it signi�es problems in the hierarchy of applications, potentially meaning
ATLAS is loosing experimental data. Errors for the ATLAS partition have to be handled
fast and e�ectively by operators.
This pattern generates an alert if the ATLAS partition is in error for more than 2
minutes continuously. Every time a partition changes state an event is injected in the
PartitionState stream state, as explained above. The pattern below detects an IS event
reporting a problem on the ATLAS partition. If the event is not followed in 2 minutes
by an IS update reporting that ATLAS is no more in error, the pattern is matched and
the alert is generated. The -> is the EPL operator that expresses the followed-by time
relation.
s e l e c t f i r s t e v e n t . e r r o r as Error , f i r s t e v e n t . reson as De t a i l s
from pattern [ every f i r s t e v e n t =
Pa r t i t i onS t a t e ( partit ionName = 'ATLAS' , e r r o r = true ) −>( timer : i n t e r v a l (120 sec ) and
not Pa r t i t i onS t a t e ( partit ionName ='ATLAS' , e r r o r = f a l s e ) ) ]
6.4.3.2 Continuous check on ROS loads
The ROSes are the devices (i.e. commercial PCs with custom read-out cards) respon-
sible to gather and to transport data from the ATLAS sub-detectors to the TDAQ
computing facilities. They have a critical role in the data taking process: they have to
collect data at high-rate (i.e. the rate de�ned by the Level-1 trigger) and they have to
serve the collected data for the high-level event �ltering operations (i.e. Level-2 and
Event Building). ROSes are essentially bu�ering experimental data, and high load on
ROSes signi�es potential risk of �lling queues and loosing data. Each TDAQ applica-
tion running on a ROS publishes load conditions (i.e. cpu load and bu�er occupancy)
in IS every second.
Temporary spikes in a ROS load are foreseen in standard working conditions. But
sustained high-load on a ROS signi�es a problem in the data-�ow chain. The pattern
below detects a continuous high load for one or more ROSes. The query aggregates
the ROS load values on 60 seconds, then it compares the average (via the avg() EPL
101
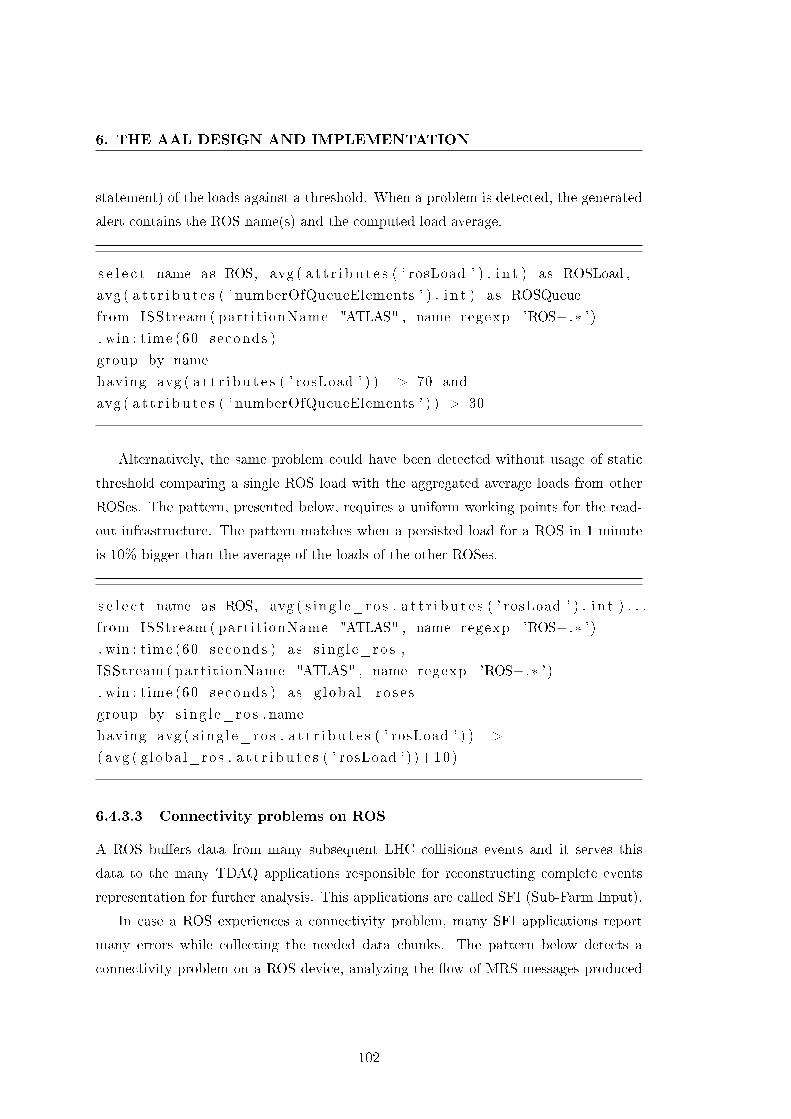
6. THE AAL DESIGN AND IMPLEMENTATION
statement) of the loads against a threshold. When a problem is detected, the generated
alert contains the ROS name(s) and the computed load average.
s e l e c t name as ROS, avg ( a t t r i b u t e s ( ' rosLoad ' ) . i n t ) as ROSLoad ,
avg ( a t t r i b u t e s ( ' numberOfQueueElements ' ) . i n t ) as ROSQueue
from ISStream ( partit ionName="ATLAS" , name regexp 'ROS− .* ' )
. win : time (60 seconds )
group by name
having avg ( a t t r i b u t e s ( ' rosLoad ' ) ) > 70 and
avg ( a t t r i b u t e s ( ' numberOfQueueElements ' ) ) > 30
Alternatively, the same problem could have been detected without usage of static
threshold comparing a single ROS load with the aggregated average loads from other
ROSes. The pattern, presented below, requires a uniform working points for the read-
out infrastructure. The pattern matches when a persisted load for a ROS in 1 minute
is 10% bigger than the average of the loads of the other ROSes.
s e l e c t name as ROS, avg ( s i ng l e_ro s . a t t r i b u t e s ( ' rosLoad ' ) . i n t ) . . .
from ISStream ( partit ionName="ATLAS" , name regexp 'ROS− .* ' )
. win : time (60 seconds ) as s ing l e_ros ,
ISStream ( partit ionName="ATLAS" , name regexp 'ROS− .* ' )
. win : time (60 seconds ) as g loba l_rose s
group by s ing l e_ro s . name
having avg ( s ing l e_ro s . a t t r i b u t e s ( ' rosLoad ' ) ) >
( avg ( g loba l_ros . a t t r i b u t e s ( ' rosLoad ' ) )+10)
6.4.3.3 Connectivity problems on ROS
A ROS bu�ers data from many subsequent LHC collisions events and it serves this
data to the many TDAQ applications responsible for reconstructing complete events
representation for further analysis. This applications are called SFI (Sub-Farm Input).
In case a ROS experiences a connectivity problem, many SFI applications report
many errors while collecting the needed data chunks. The pattern below detects a
connectivity problem on a ROS device, analyzing the �ow of MRS messages produced
102
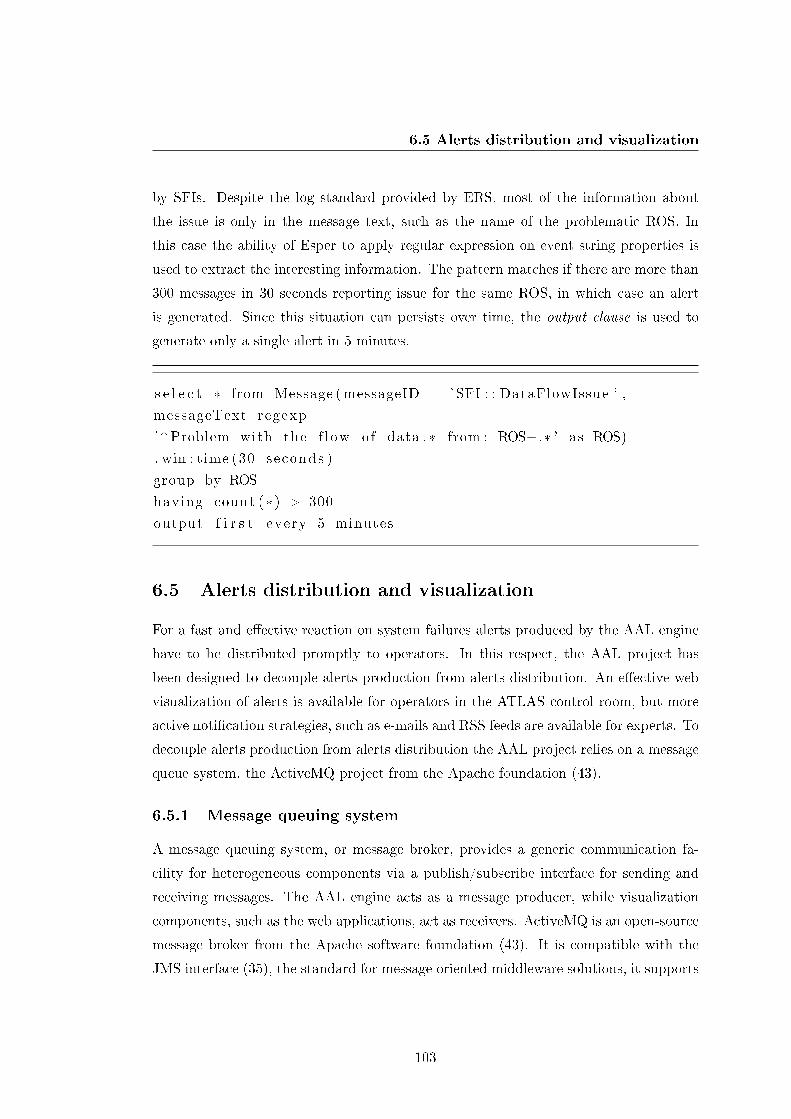
6.5 Alerts distribution and visualization
by SFIs. Despite the log standard provided by ERS, most of the information about
the issue is only in the message text, such as the name of the problematic ROS. In
this case the ability of Esper to apply regular expression on event string properties is
used to extract the interesting information. The pattern matches if there are more than
300 messages in 30 seconds reporting issue for the same ROS, in which case an alert
is generated. Since this situation can persists over time, the output clause is used to
generate only a single alert in 5 minutes.
s e l e c t * from Message (messageID = ' SFI : : DataFlowIssue ' ,
messageText regexp
'^Problem with the f low o f data .* from : ROS− .* ' as ROS)
. win : time (30 seconds )
group by ROS
having count (* ) > 300
output f i r s t every 5 minutes
6.5 Alerts distribution and visualization
For a fast and e�ective reaction on system failures alerts produced by the AAL engine
have to be distributed promptly to operators. In this respect, the AAL project has
been designed to decouple alerts production from alerts distribution. An e�ective web
visualization of alerts is available for operators in the ATLAS control room, but more
active noti�cation strategies, such as e-mails and RSS feeds are available for experts. To
decouple alerts production from alerts distribution the AAL project relies on a message
queue system, the ActiveMQ project from the Apache foundation (43).
6.5.1 Message queuing system
A message queuing system, or message broker, provides a generic communication fa-
cility for heterogeneous components via a publish/subscribe interface for sending and
receiving messages. The AAL engine acts as a message producer, while visualization
components, such as the web applications, act as receivers. ActiveMQ is an open-source
message broker from the Apache software foundation (43). It is compatible with the
JMS interface (35), the standard for message oriented middleware solutions, it supports
103
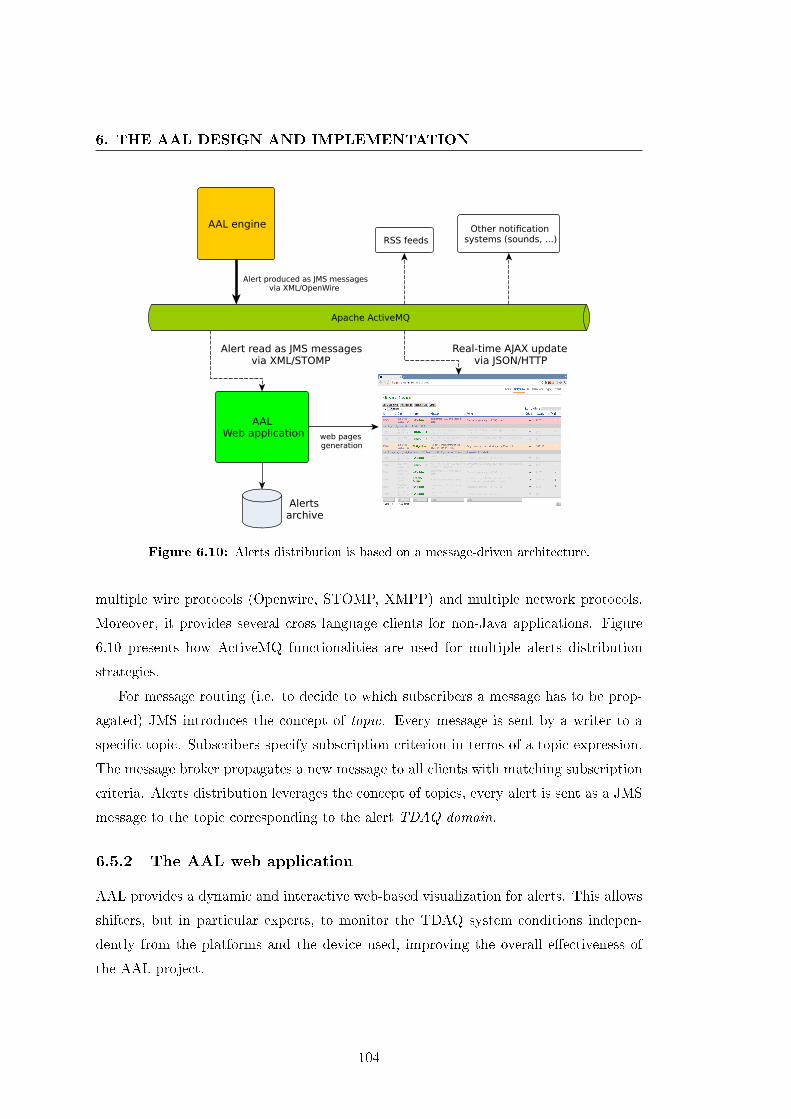
6. THE AAL DESIGN AND IMPLEMENTATION
AAL engine
Apache ActiveMQ
AALWeb application
Alert produced as JMS messagesvia XML/OpenWire
Alert read as JMS messages via XML/STOMP
Real-time AJAX update via JSON/HTTP
web pages generation
RSS feeds
Alertsarchive
Other notificationsystems (sounds, ...)
Figure 6.10: Alerts distribution is based on a message-driven architecture.
multiple wire protocols (Openwire, STOMP, XMPP) and multiple network protocols.
Moreover, it provides several cross language clients for non-Java applications. Figure
6.10 presents how ActiveMQ functionalities are used for multiple alerts distribution
strategies.
For message routing (i.e. to decide to which subscribers a message has to be prop-
agated) JMS introduces the concept of topic. Every message is sent by a writer to a
speci�c topic. Subscribers specify subscription criterion in terms of a topic expression.
The message broker propagates a new message to all clients with matching subscription
criteria. Alerts distribution leverages the concept of topics, every alert is sent as a JMS
message to the topic corresponding to the alert TDAQ domain.
6.5.2 The AAL web application
AAL provides a dynamic and interactive web-based visualization for alerts. This allows
shifters, but in particular experts, to monitor the TDAQ system conditions indepen-
dently from the platforms and the device used, improving the overall e�ectiveness of
the AAL project.
104
6.5 Alerts distribution and visualization
The AAL web application is a Django-based (1)Python-coded service that collects
and archives alerts produced by the engine and builds rich web pages for alert visual-
ization. The rich functionalities are a set of actions operators can perform:
� Mark alerts as read, e.g. when a problem has been handled. The read information
is persisted into the alert archive.
� Mask read alerts, e.g. to visualize only new alerts as they arrive.
� Filters on alerts parameters.
� Browse alert history.
� Customized pages layout, e.g. create new pages containing a desired category of
alerts, identi�ed by a domain expression.
An alert is sent by the engine as the XML payload of a JMS message via the OpenWire
binary protocol. The web application server acts as a client subscribed to all messages
produced by the engine. ActiveMQ delivers the JMS messages to the web application
as via a text based protocol (STOMP).
The web pages are automatically updated when new alerts arrive via an asyn-
chronous communication over HTTP (AJAX) between the user's browser and the Ac-
tiveMQ message broker. This guarantees a prompt noti�cation of new problems as they
happen. The layout of the web page is presented in Figure 6.11.
6.5.2.1 Alert domain
The domain is an alert's attribute used to group alerts in views, each one bound to a
speci�c TDAQ aspect. Every desk in the ATLAS control room has a speci�c view on
alerts customized for its competency, and experts can customize their own view de�ning
expressions based on domains.
The domain is as a hierarchical concept represented by a string with period-separated
elements, such as:
� RunControl.Network
105
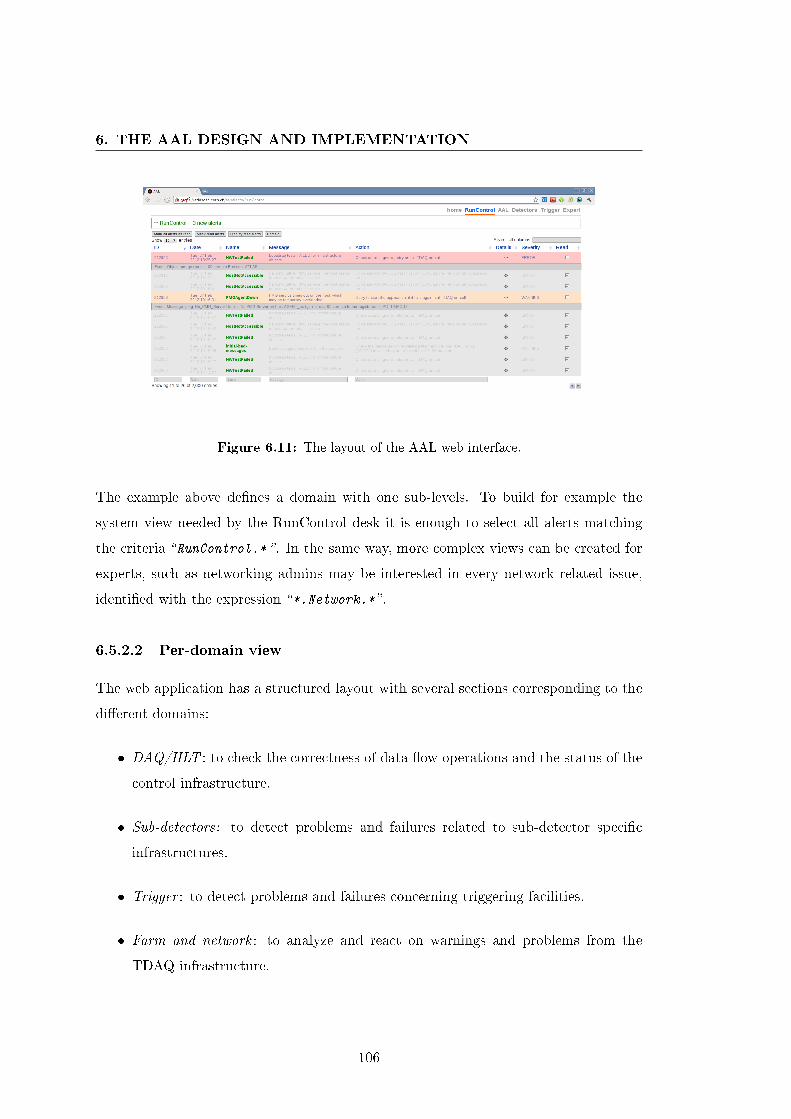
6. THE AAL DESIGN AND IMPLEMENTATION
Figure 6.11: The layout of the AAL web interface.
The example above de�nes a domain with one sub-levels. To build for example the
system view needed by the RunControl desk it is enough to select all alerts matching
the criteria �RunControl.* �. In the same way, more complex views can be created for
experts, such as networking admins may be interested in every network related issue,
identi�ed with the expression �*.Network.* �.
6.5.2.2 Per-domain view
The web application has a structured layout with several sections corresponding to the
di�erent domains:
� DAQ/HLT : to check the correctness of data �ow operations and the status of the
control infrastructure.
� Sub-detectors: to detect problems and failures related to sub-detector speci�c
infrastructures.
� Trigger : to detect problems and failures concerning triggering facilities.
� Farm and network : to analyze and react on warnings and problems from the
TDAQ infrastructure.
106
6.6 Summary
6.5.2.3 Other distribution strategies
The domain is speci�ed as JMS topic in the JMS messages produced by the AAL
engine. This allows to use the noti�cation strategies supported by ActiveMQ. For
example, experts receive alerts a RSS feeds directly connecting to ActiveMQ, specifying
the desired subscription criteria (e.g. RunControl.*)
Moreover, this loosely-coupled architecture allows to add new alert consumers with-
out a�ecting the alert production. For example, for speci�c alerts a sound is played in
the ATLAS control room. This was implemented with a simple application acting as a
new JMS subscriber.
6.6 Summary
E�ective monitoring and prompt error detection are fundamental to maximize the data
taking e�ciency of the ATLAS experiment. The main contribution of the AAL project
is to assist operators with automated analysis of system conditions and intelligent rea-
soning for discovering root causes of problems and misbehavior. AAL has been imple-
mented leveraging modern event correlation techniques combined with message driven
architecture for components integration and web technologies for alert visualization.
This lead to the development of an e�ective tool quickly adopted from di�erent com-
munities in the ATLAS TDAQ context and raising the interest from other groups with
similar monitoring requirements, such as networking and system administration.
107

6. THE AAL DESIGN AND IMPLEMENTATION
108
Chapter 7
Conclusions and future work
This chapter summarizes the results and presents the main outcome of this thesis
project. Final conclusions are drawn before some possible avenues of future research
are outlined.
7.1 Summary
This thesis proposes an innovative approach to monitoring and operating complex and
distributed computing systems, in particular referring to the ATLAS Trigger and Data
Acquisition (TDAQ) system currently in use at the European Organization for Nuclear
Research (CERN). E�ective monitoring and analysis tools are fundamental in modern
IT infrastructures to get insights on the overall system behavior and to deal promptly
and e�ectively with failures. These systems have in common a layered architecture, with
every layer providing functionalities other layers and services rely on (such as network,
middleware, application, user interfaces, web portals, etc.). In this scenario, standard
monitoring techniques and tools have several limitations, such as being too focused on
single aspects, the lack of �exibility with respect to the dynamic working conditions
and the timeliness of monitoring information provided.
The result of this thesis work is the AAL project (Automated Analysis and inteL-
ligent monitoring). It is meant to improve the system monitoring and fault diagnosis
through the automated and intelligent continuous processing of system activities. This
project combines technologies coming from di�erent disciplines, in particular it lever-
ages an event-driven architecture to manage the �ow of information coming from the
109
7. CONCLUSIONS AND FUTURE WORK
ATLAS TDAQ infrastructure, together with a Complex Event Processing (CEP) engine
to provide intelligent systems analysis.
The project has proven to be an e�ective solution and it has been extensively adopted
to assist shifters and experts during the ATLAS data acquisition operations in 2011.
Moreover, since it simpli�es operational procedures and it allows for a better use of
experts knowledge, it contributes to reduce the ATLAS operational ine�ciency while
increasing the overall situation awareness for the TDAQ infrastructure. Thanks to a
generic design it can be easily deployed to di�erent computing infrastructures.
7.1.1 ATLAS operational e�ciency
Now that the ATLAS experiment is steadily running, data acquisition procedures are
often covered by new operators with limited experience, assisted by a set of experts pro-
viding knowledge for speci�c components. The evaluation of the correctness of running
operations requires strong competence and experience in understanding log messages
and monitoring information. Moreover, the meaningful information is often not in a
single event but in the aggregated behaviour in a certain time-line. As presented in
Chapter 3, about 50% of the TDAQ data taking ine�ciency (i.e. the loss of experi-
mental data) is coming from situations where a human intervention is involved. Due to
the very critical operational task, both economically and in terms of manpower, dealing
fast and e�ectively with problems and failures is fundamental to minimize operational
ine�ciency. In this respect, a high-level monitoring tool helping operators with auto-
mated diagnosis of problems and suggesting the appropriate reaction is able to reduce
the time for error management and to minimize the loss of experimental data. This
is the objective of the AAL project, to be an automated and intelligent assistant for
TDAQ operators.
7.1.2 Complex Event Processing for TDAQ operations analysis
The need to process streams of information from distributed sources at high-rate with
low-latency is of interest from the most disparate �elds: from wireless sensor networks
to �nancial analysis, from business process management to infrastructure monitoring.
Complex Event Processing (CEP) technologies have emerged as e�ective solutions for
information processing and event stream analysis. In particular, they provide the means
to reason upon events and on relationships among them.
110
7.2 Future research
This thesis demonstrates how to leverage these technologies to implement error
detection and fault diagnosis in a complex system such as the ATLAS TDAQ. Esper
(7) is the leading open-source engine for complex event processing and it has been
investigated and adopted to provide CEP functionalities for the AAL project.
7.1.3 The AAL project
The AAL project is meant to assist operators with automated analysis of system con-
ditions and intelligent reasoning for debug and fault diagnosis. Information gathering,
data processing and e�ective result distribution are the main challenges coming from the
complex ATLAS TDAQ architecture and the demanding working conditions. TDAQ
experts feed AAL with instructions, called directives, describing the problems to be
detected and the actions to perform when they happen. The �ow of monitoring data,
di�erent in type and format, is collected and processed at a high-rate to detect problems
and failures.
The AAL project has a loosely-coupled architecture where two main modules inter-
act via a message broker, also known as event/message bus, that centralizes all commu-
nication. The AAL engine is responsible for the collection and correlation of monitoring
data via CEP techniques. It produces alerts that contain all the information needed
by shifters and experts to investigate and react on problems. The AAL web applica-
tion provides a dynamic and interactive web-based visualization for TDAQ operators
to get insights on system conditions. Moreover, the message-oriented communication
decouples the processing model from alerts distribution, allowing to implement multiple
visualization and noti�cation strategies without interfering with the data processing.
The adoption of AAL by several TDAQ communities shows that automation and
intelligent system analysis were common monitoring requirements that were lacking in
the previous infrastructure. The results of this research will bene�t researcher evaluating
intelligent monitoring techniques on large-scale distributed computing system.
7.2 Future research
This thesis demonstrates how to leverage Complex Event Processing (CEP) techniques
to process heterogeneous and dynamic streams of data at high-rate to detect problems
111
7. CONCLUSIONS AND FUTURE WORK
and failures. The following is a consideration on some of the possible ways forward in
order to extend the AAL functionalities and e�ectiveness.
The current approach requires system experts to describe problems as event patterns.
This implies having a detailed knowledge of the system behavior and of the working
conditions. An interesting �eld of research would be to investigate the techniques to
learn the correctness of running operations from the prior know failures and from the
online �ow of monitoring data
7.2.1 Combination of CEP with machine learning for problem classi-
�cation
The research in (42) demonstrates how to possibly detect and classify patterns of prob-
lems processing and analyzing the log messages and information updates recorded dur-
ing ATLAS data taking operations. The analysis on those data-sets shows that clusters
exist in the data corresponding to the di�erent simulated errors. Nevertheless, the re-
search recognizes as the main limitation on its practical adoption the need to heavily
pre-process input data to extract any general rules for the intelligent systems.
In this respect, there are clear opportunities to combine machine learning algorithms
with CEP and leverage the pre-processing of the incoming raw data. A machine learning
module could use the CEP-processed data to train a error-speci�c classi�er for further
error detection. Moreover, the loosely-coupled architecture of the AAL project is very
well suited integrate the new module and to include its results as a new source of
information for TDAQ operators.
7.2.2 On-line problem classi�cations
Another interesting evolution in the same �eld of research is to pro�t from the learning
approach together with the continuous processing capability o�ered by CEP. The �ow of
operational data could be used to automatically analyze working conditions by collecting
data directly from the live operations. An online-learner module could incrementally
train a task-speci�c classi�er with these data, in an unsupervised or semi-supervised
manner. Since learning would occur online and without experts help, it could be done
continuously, in parallel with the normal pattern matching, thus allowing to adapt the
classi�er over time.
112
7.3 Conclusions
7.3 Conclusions
E�ective monitoring and analysis tools are fundamental in modern IT infrastructures
to get insights on the overall system behavior and to deal promptly and e�ectively with
failures. This thesis proposes an innovative approach to monitor and operate complex
and distributed computing systems, in particular referring to the ATLAS Trigger and
Data Acquisition (TDAQ) system currently in use at the European Laboratory for
Particle Physics (CERN).
In recent years, Complex Event Processing (CEP) technologies have emerged as ef-
fective solutions for information processing from the most disparate �elds: from wireless
sensor networks to �nancial analysis. The AAL project, subject of this thesis, demon-
strates how to leverage CEP techniques for the continuous processing monitoring data.
It provides system operators with automated and intelligent diagnosis of problems and
failures, improving the overall situation awareness and the operational e�ciency.
The extensive adoption of AAL to assist TDAQ operators during the ATLAS data
taking in 2011 shows that automation and intelligent system analysis were not prop-
erly addressed in the previous infrastructure. The results of this thesis will bene�t
researchers evaluating intelligent monitoring techniques on large-scale distributed com-
puting system.
113

7. CONCLUSIONS AND FUTURE WORK
114
References
[1] The django project. https://www.djangoproject.com/. 105
[2] ATLAS Collaboration. ATLAS High-Level Trigger, Data Acquisition and Controls
Technical Design Report. http://cdsweb.cern.ch/record/616089/. Jun 2003. 8, 9
[3] ATLAS Collaboration. The ATLAS Experiment at the CERN Large Hadron Col-
lider. Journal of Instrumentation, S08003. 2008. 6
[4] ATLAS Collaboration. Luminosity Determination in pp Collisions at
sqrt(s)=7 TeV Using the ATLAS Detector at the LHC. Journal refer-
ence:Eur.Phys.J.C71:1630. 2011. 42
[5] ATLAS TDAQ Shifters TDAQ Whiteboard. https://pc-atlas-
www.cern.ch/twiki/bin/view/main/daqwhiteboard. 2011. 35
[6] Brian Babcock, Shivnath Babu, Mayur Datar, Rajeev Motwani, and Jennifer Wido.
Models and issues in data stream systems. Standford Publication, 2002. 50
[7] Thomas Bernhardt. The esper project. http://esper.codehaus.org/. 49, 59, 61, 71,
111
[8] ATLAS Collaboration. Atlas high level data acquisition system and controls. Tech-
nical report, CERN, 2003. 25
[9] Complex Event Processing with StreamBase. http://http://www.streambase.com.
14, 61
[10] Alina Corso-Radu, Raul Murillo Garcia, Andrei Kazarov, Giovanna Lehmann
Miotto, Luca Magnoni, and John Erik Sloper. Applications of expert system
115
REFERENCES
technology in the atlas tdaq controls framework. In International Conference on
Software and Data Technologies, Athens, Grece., 2010. 39
[11] Pan Deyu and Rao Ruonan. The research on complex event processing in moni-
toring system. IEEE International Conference on Computational and Information
Sciences (ICCIS), 2011. 9
[12] Daniel Liko et al. Control in the ATLAS TDAQ System. Computing in High
Energy Physics and Nuclear Physics. Interlaken, Switzerland. 2004. 13
[13] Daniel Liko et al. Control in the atlas tdaq system. Computing in High Energy
Physics and Nuclear Physics, page 159, Interlaken, Switzerland., 2004. 40
[14] Don Carney et al. Monitoring Streams: A New Class of Data Management Appli-
cations. Proceedings of VLDB, 2002. 51
[15] Fabio Sacerdoti et al. Wide area cluster monitoring with ganglia. 2003. 35
[16] Evan Hoke and Jimeng Sun et al. InteMon: Continous Mining of Sensors Data
in Large-scale self infrastructures. ACM SIGOPS Operating System Review. 2006.
85
[17] Lyndon Evans. The large hadron collider. New Journal of Physics, 2007. 5
[18] Ivan Fedorko. The Message Reporting System of the ATLAS DAQ System. ICATPP
Conference on Astroparticle, Particle, Space Physics Detectors and Medical Physics
Applications. 2007. 20
[19] Charles Forgy. Rete: A fast algorithm for the many pattern/many object pattern
match problem. Arti�cial Intelligence, 19(1):1737, 1982. ISSN 0004-3702, 1982.
39
[20] Erich Gamma, Richard Helm, Ralph Johnson, and John Vlissides. Design Patterns:
Elements of Reusable Object-Oriented Software. Addison-Wesley Professional, 1
edition, November 1994. 89
[21] Raul Murillo Garcia and Giovanna Lehmann Miotto. A log service package for the
ATLAS TDAQ/DCS group. Nuclear Science, IEEE Transactions, 54(4):202�207,
2007. 21
116
REFERENCES
[22] Nicoletta Garelli. Atlas 2011 operations report. ATLAS Week, Nov 2011. 29, 44
[23] Gregor Hohpe and Bobby Woolf. Enterprise Integration Patterns: Designing,
Building, and Deploying Messaging Solutions. Addison-Wesley Longman Publish-
ing Co., 2003. 87
[24] Igor Soloviev et al. ATLAS Con�guration Databases. CERN Technical report.
2002. 81
[25] Oracle Inc. Oracle complex event processing: Lightweight modular application
event stream processing in the real world. White paper, 2009. 14, 61
[26] Twtter Inc. Twitter storm: Open source real-time hadoop.
https://github.com/nathanmarz/storm, 2011. 60
[27] JacORB: The free Java implementation of the OMG's CORBA standard.
http://www.jaccorb.org. 19
[28] Namit Jain, Shailendra Mishra, Anand Srinivasan, Johannes Gehrke, Jennifer
Widom, and Hari Balakrishnan. Towards a streaming sql standard. Proceedings of
the VLDB Endowmen, 2008. 57
[29] Magnoni Luca, Giovanna Lehmann Miotto, and Kazarov Andrei. The aal project:
Automated monitoring and intelligent analysis for the atlas data taking infrastruc-
ture. In Proceedingd of 14th International Workshop On Advanced Computing And
Analysis Techniques In Physics Research,London, 2011. 73
[30] David Luckham. The Power of Events: An Introduction to Complex Event Pro-
cessing in Distributed Enterprise Systems. Addison-Wesley Professional, New York,
2002. 12, 50, 52
[31] Ananth Madhavan. VWAP Strategies. Trading, 2002. 70
[32] Alessandro Margara and Gianpaolo Cugola. Processing Flows of Information: From
Data Stream to Complex Event Processing. ACM Computing Surveys, ACM Press,
2012. 50, 60
117
REFERENCES
[33] Bran Martin, Costin Meirosu, and Stefan Stancu. Networks for ATLAS trigger and
data acquisition. Conference on Computing in High Energy and Nuclear Physics,
Mumbai, India. 2006. 33
[34] Nagios Enterprises. http://nagios.org/. 33, 35, 80, 81
[35] Oracle-Sun. The java message service api.
http://docs.oracle.com/cd/B1409919/jms.htm. 79, 103
[36] ORB CORBA. http://www.corba.org. 19
[37] Norman W Paton and Oscar Diaz. Active Database Systems. ACM Computing
Surveys, ACM Press, 1999. 50
[38] Dan Octavian Savu, Ali Al-Shabibi, Brian Martin, Silvia Batraneanu, and Stefan
Stancu. E�cient Network Monitoring for Large Data Acquisition Systems. Pro-
ceedings of the ICAPELCS 2011, Grenoble, France. 2010. 34
[39] Douglas C. Schmidt. Evaluating architectures for multi-threaded corba object
request brokers. Communications of the ACM, 2002. 95
[40] E. Shapiro and K. Fuchi. Concurrent prolog. MIT Press, Cambridge. ISBN 0-262-
19255-1, 1988. 38
[41] Alexandru Dan Sicoe, Giovanna Lehmann Miotto, and Magnoni Luca. A Persis-
tent Back-End for the ATLAS TDAQ On-line Information Service (P-BEAST).
Proceedings of the ACAT conference. 2011. 77
[42] John Erik Sloper. Error Management in ATLAS TDAQ: An Intelligent Systems
approach. PhD thesis, University of Warwick, 2010. 112
[43] The Apache Software foundation. Activemq http://activemq.apache.org/. 103
[44] Jos Vermeulen. Atlas data�ow: the read-out subsytem, results from triggering and
data-acquisition system testbed studies and fomr modeling. Nuclear Science, IEEE
Transaction, 53(3):912-917. ISSN 0018-9499, 2006. 9
[45] Yahoo Inc. S4 distributed stream computing platform,
http://incubator.apache.org/s4/. 60
118