secoa, 6 - sapienza università editrice
TRANSCRIPT


Collezione di "Testi e Studi Umanistici"
Serie Letterature, linguaggi e culture
SECOA, 6
The research leading to these results has received funding from the European Community's
Seventh Framework Program FP7/2007-2013 under grant agreement n° 244251

SECOA BOARD
Editor:
Armando Montanari, Sapienza University of Rome
Editorial Board: Karl Bruckmeier, University of Gothenburg, Sweden
Riccardo Carelli, Sapienza Innovazione, Italy
Eric Corijn, Vrije Universiteit Brussel, Belgium
Jo Foord, London Metropolitan University, United Kingdom
Tran Dinh Lan, Institute of Marine Environment and Resources, Vietnam
Eran Razin, Hebrew University of Jerusalem, Israel
José Manuel Simões, IGOT – University of Lisbon, Portugal
Vishwas Kale, University of Pune, India
Allan Williams, University of Surrey, United Kingdom

Environmental Stresses and Resource Use in Coastal Urban and Peri-Urban Regions DPSIR Approach to SECOA's 17 Case Studies
Edited by
Tran Dinh Lan, E. Gunilla Almered Olsson and Serin Alpokay
2014

SECOA FP7 Research Project is published by Casa Editrice Università La Sapienza
Published online in 2014
The copyediting is by Digital Publishing Division of DigiLab
(Centro interdipartimentale di ricerca e servizi) – La Sapienza Università di Roma
Managing editor: Gianfranco Crupi
Copyediting and Layout editor: Ivan Macculi
Graphics of book cover: Mariella Scelsi
This work is licensed under a Creative Commons Attribution 3.0 License
DOI: http://dx.doi.org/10.13133/978-88-98533-23-7

Table of Contents Table of Contents 7
Editor's Preface to the Series 15
Preface to the Volume 19
Structure of this book 19
CHAPTER 1. Environmental Stresses and Resource Uses Analysed by the DPSIR Framework 21
1. Introduction 22
2. DPSIR conceptual framework 22
3. The Complexity of Ecosystems and Habitats and Environmental Stresses Across the SECOA Case
Studies 24
3.1. Short overview of the case studies – bio-geo-climatological features and urban trends 24
3.2. Different methodological approaches to the DPSIR framework 25
4. Conclusions 25
2. References 32
CHAPTER 2. Assessment of Natural Resources Use for Sustainable Development: DPSIR
Framework for Case Studies in Oostende and Brugge, Belgium 35
1. Introduction 36
2. Materials and Methodology 36
2.1. Sources and data 36
2.2. Methods 37
2.3. Defining the study area 39
3. Natural resources and their exploitation 41
3.1. Drivers and pressures 41
3.2. State and impact 48
3.3. Responses 50
4. DPSIR analysis 58
4.1. The DPSIR analytical framework 58
4.2. Application of DPSIR and indicators to assess natural resources use in case studies 62
4.3. Assessment of the sustainability of natural resources 65
5. Conclusions 66
6. References 67
ANNEX 69
1. Developing index for sustainability assessment of natural resources 69
2. Indicators and trends 69
CHAPTER 3. Assessment of Natural Resources Use for Sustainable Development:
DPSIR Framework for Case Studies in Mumbai and Chennai, India 71
1. Introduction 72
2. Materials and methodology 73
2.1. Sources and data 73
2.2. Methods 73
2.3. Defining the study area 74
3. Natural resources and their exploitation 77
3.1. Mumbai Metropolitan Region – Mangrove ecosystem 77
3.2. State and impacts 85
3.3. Drivers and pressures 89
3.4. Responses 90
4. DPSIR analysis 94
4.1. Mumbai 94
4.2. Chennai 96
5. Conclusions 98
6. References 100
ANNEX 101
1. List of Acronyms and Units 101
2. Mapping of wetlands and development of indexes 102
3. Basic Administrative Units 102
5. Chennai Metropolitan Region – Pallikaranai Wetland Ecosystem 106
6. Index for sustainability assessment of marshland ecosystem was carried out by
using the following formula 107
CHAPTER 4. Assessment of Natural Resources Use for Sustainable Development -
DPSIR Framework for Case Studies in Palmachim (Tel Aviv Metropolitan Area) and
Carmel Coast (Haifa Metropolitan Area), Israel 111
1. Introduction 112
2. Materials and methodology 113
2.1 Sources and data 113
2.2. Methods 114
2.3. Defining the study areas 115
3. Natural resources and their exploitation 119
3.1. State and impacts 119
3.2. Drivers and pressures 127
3.3. Responses 128

4. DPSIR analysis 128
5. Conclusions 131
6. References 132
ANNEX 133
1. Method 133
CHAPTER 5. Assessment Of Natural Resources Use for Sustainable Development – DPSIR
Framework for Case Studies in Civitavecchia, XIII District of Rome (Ostia) and Pescara, Italy 135
1. Introduction 136
2. Materials and methodology 136
2.1. Sources and data 136
2.2. Methods 137
2.3. Defining the study area 138
3. Natural resources and their exploitation 140
3.1. State and impact 140
3.2. Drivers and Pressures 144
3.3. Responses 146
4. DPSIR analysis 147
4.1. DPSIR analysis – Air quality in the municipalities of Civitavecchia and Pescara 147
4.2. DPSIR analysis – Coastal Water Quality in the XIII District of Rome 169
5. Conclusions 181
5.1. Civitavecchia and Pescara 181
5.2. Municipality of Ostia 181
6. References 182
ANNEX 184
1. Framework for sustainable development index 184
2. Assessment of natural resources use - Air 185
3. Assessment of natural resources use - Water 188
4. Assessment of natural resources use - Land use analysis of the coastal areas of Rome and
Pescara Metropolitan Area (specific focus on Civitavecchia, the XIII District of Rome and
the city of Pescara) 193
CHAPTER 6. Assessment of Natural Resources Use for Sustainable Development –
DPSIR Framework for Case Studies in Metropolitan Area of Lisbon, Eastern Algarve
and Funchal, Portugal 207
1. Introduction 208
2. Materials and methodology 208
2.1. Sources and data 208

2.2. Methods 208
2.3. Limitations 209
2.4. Defining the study areas 210
3. Natural resources and their exploitation 214
3.1. MAL 214
3.2. Eastern Algarve 215
3.3. Funchal 217
3.4. Mapping critical areas under unsustainable use 217
3.5. State and impact 219
3.6. Drivers and pressures 224
3.7. Responses 226
4. DPSIR analysis 229
5. Development of sustainability indicators 231
6. Conclusions 232
7. References 232
ANNEX 233
1. Methodology and Materials 233
2. Analysis of sustainable use of resources 233
CHAPTER 7. Assessment of Natural Resources Use for Sustainable Development -
DPSIR Framework For Case Studies in Kungälv (Gothenburg Peri-Urban Area) and
Vellinge (Malmö Peri-Urban Area), Sweden 235
1. Introduction 236
2. Materials and methodology 237
2.1. Sources and data 237
2.2. Methods 238
2.3. Defining the study areas 240
3. Natural resources and their exploitation 243
3.1. State and impacts 243
3.2. Drivers and pressures 250
3.3. Responses 254
4. DPSIR analysis 261
4.1. DPSIR analysis for Vellinge: climate change and loss of natural and cultural values on the
Falsterbo Peninsula 261
4.2. DPSIR analysis for the Kungälv coastal wetlands case 264
5. Conclusions 266
5.1. General conclusions from the Vellinge Case 266

5.2. General conclusions from the Kungälv Case 268
5.3. Overall comparison and conclusions 269
6. References 270
ANNEX 275
CHAPTER 8. Assessment of Natural Resources Use for Sustainable Development -
DPSIR Framework for Case Studies in Portsmouth and Thames Gateway, U.K. 283
List of acronyms and units 284
1. Introduction 285
2. Materials and methodology 286
2.1. Sources and data 286
2.2. Methods 287
2.3. Defining the study area 293
3. Natural resources and their exploitation 297
3.1. State and impact 297
3.2. Drivers and pressures 302
3.3. Responses 306
4. DPSIR analysis 309
4.1. DPSIR Analysis For Assessing The Sustainability Of Saltmarshes And Mudflats In
Designated Conservation Areas Of Portsmouth And Thames Gateway 309
4.2. Sustainability of natural resources in the study areas 312
5. Conclusions 320
6. References 321
ANNEX 325
1. Methodology on indexes 325
2. Sustainability of natural resources in the study area 325
3. Conclusions 328
APPENDIX A: REASONS FOR NOTIFICATION OF DESIGNATIONS IN THE TWO STUDY AREAS 329
1. Langstone Harbour SSSI 329
2. Portsmouth Harbour SSSI 330
3. Benfleet and Southend Marshes SSSI 331
4. South Thames Estuary and Marshes SSSI 332
5. Medway Estuary and Marshes SSSI 333
6. The Swale SSSI 334
APPENDIX B 335
APPENDIX C 337
APPENDIX D 338

CHAPTER 9. Assessment of Natural Resources Use for Sustainable Development -
DPSIR Framework for Case Studies in Hai Phong and Nha Trang, Vietnam 339
1. Introduction 340
2. Materials and methodology 340
2.1. Sources and data 340
2.2. Methods 341
2.3. Defining the study area 341
3. Natural resources and their exploitation 343
3.1. State and impact 343
3.2. Drivers and pressures 351
3.3. Responses 364
4. DPSIR analysis 365
4.1 Mangrove ecosystem 365
4.2. Coral reef ecosystem 368
4.3. Indicator development for assessment of natural resources use in case studies 370
5. Conclusions 373
6. References 373
ANNEX 375
1. Method for developing sustainable index 375
2. Combination of indicators = Index 375
3. Sustainability index calculation for mangrove forest 377
4. Sustainability index calculationfor coral reef 381
CHAPTER 10. Conclusions: Environmental pressures and conflicts in urban and peri-urban regions 385
1. Comparison across the case studies 386
2. Synthesis of the most relevant results 387
2.1. Belgium 387
2.2. India 387
2.3. Israel 387
2.4. Italy 388
2.5. Portugal 388
2.6. Sweden 389
2.7. The United Kingdom 390
2.8. Vietnam 391
3. Reflections on the use of the DPSIR model 391
4. References 394

CHAPTER 11. Approach to Sustainable Exploitation of Natural Resources Windpower
Development in Coastal Areas – Social and Environmental Effects 395
1. Introduction – Development and impacts of wind energy systems 396
2. The state of windpower development in the coastal areas studied in SECOA 399
3. Remarks from the answers 403
4. An exemplary windpower conflict from the Swedish West Coast 404
5. Windpower as part of national energy systems – long term perspectives 406
6. References 410
List of Tables 413
Chapter 1. 413
Chapter 2. 413
Chapter 3. 413
Chapter 4. 414
Chapter 5. 414
Chapter 6. 417
Chapter 7. 417
Chapter 8. 418
Chapter 9. 418
Chapter 11. 419
List of Figures 420
Chapter 1. 420
Chapter 2. 420
Chapter 3. 421
Chapter 4. 422
Chapter 5. 422
Chapter 6. 424
Chapter 7. 425
Chapter 8. 425
Chapter 9. 426
Chapter 10. 427


Editor's Preface to the Series This volume is part of a new series on cross-national comparative research in the fields of global
climate change, coastal areas, sustainable urban development and human mobility. These
factors, which arise at both the local and global level, are confronted with a conflict of interest in
every possible combination between the local and the global. The volumes being published in
this series attempt to provide a contribution to resolving these conflicts. This multi-national and
multi-disciplinary network was set up in 2009 on the occasion of the European Commission's call
for proposals for a Seventh Framework Programme (FP7) project. The research project Solutions
for Environmental Contrasts in Coastal Areas (SECOA), Global Change, Human Mobility and
Sustainable Urban Development won the bid and began work in December 2009
(http://www.projectsecoa.eu/), coordinated by Sapienza Innovazione (Riccardo Carelli) with
scientific coordination by Sapienza Rome University (Armando Montanari).
Global changes affect both the environment and socio-economic conditions: first the
economic crisis of the 1970s and then the financial crisis of the first decade of the new millennium
have had a profound impact on environmental and socio-economic conditions. SECOA examines
the effects of human mobility on the growth and restructuring of urban settlements in coastal
- 15 -

areas, where: a) the environment is particularly fragile and space is limited, b) every phenomenon
is far more concentrated and c) the effects on natural and cultural resources and the environment
are more acute. Being aware of these effects can be extremely useful for governments and
companies – particularly in the building sector, but also in tourism – in planning their future
growth. Awareness of the environmental status of the coast and the local population's usage
preferences can help to plan the development of homes, retail and leisure facilities. The problems
have multiplied as a result of climate change and its influence on environmental parameters such
as the sea level, sparking an increased risk of flooding, the spread of pollution and the
displacement of a large number of inhabitants. The control and reduction of undesirable
consequences is leading to increased conflict among stakeholders. An integrated approach to the
ecosystem incorporating the social, economic and natural sciences is essential to understand the
complex and dynamic problems typical of coastal towns, as the figure illustrates. The complexity
of the problems and the heterogeneousness of the data required to document very diverse
phenomena are being managed using Geographic Information Systems (GIS). SECOA aims to: 1)
identify conflicts, 2) analyse their quantitative and qualitative effects on the environment, 3)
create models to synthesise the various social, economic and environmental systems and 4)
compare the priorities of each type of coastal town using a taxonomic tool. Coastal areas have
traditionally been considered difficult to manage because of the problem of the weather, the tides
and the seasons and the overlapping of the specificities features of physical geography and
hydrography, as well as overlapping jurisdictions and remits of individual government bodies
and the competing needs of various civil society stakeholders. Local, regional and national
administrations are often responsible for similar aspects of the same physical area and the uses
of coastal zones, such as fisheries, environment, agriculture, transport (inland and marine), urban
planning, the land registry and the national cartographic and hydrographic services. Many
people are able to intuitively recognise a coastline, although they find it harder to determine its
precise landward or seaward extent and vertical growth. For this reason, and considering the
diversity of the stakeholders, managing authorities and administrative structures, there are
inevitable conflicts between users of coastal zones, developers and the rest of society. Similarly,
there is a conflict between human society and natural resources. Because of the complexity of the
problems involved, the spatial component of data has also been taken into account through the
use of GIS, which offer enhanced possibilities of contributing to coastal zone management for a
number of reasons: (i) their ability to manage large databanks and integrate data relating to quite
heterogeneous criteria; (ii) their inherent tendency to harmonise data from different sources and
- 16 -
thereby contribute to the exchange of information between governing bodies and research
institutes; (iii) the possibility they offer of using shared data banks; (IV) their inherent aptitude
for modelling and simulation that allows for alternative scenarios to be built before being
implemented. The basic function of information that can appropriately inform decision-makers
is the ability to produce online geographical maps to illustrate the location of problems, the
densification and concentration of shortcomings, the density, the content, what happens in the
environs, and changes.
Together with the problems created by climate change, the SECOA project examines the
spread of human mobility – an area that principally involves the social science disciplines, each
with its own research framework, levels of analysis, dominant theories and hypotheses of
application. The social science fields can be considered according to the dependent and
independent variables they use. For example, anthropology, demography and sociology consider
behaviour a dependent variable; for economics, it is microeconomic flows and impacts; for
geography, it is decision-making ability; for history, it is experience; for law, it is treatment and
for political science, the dependent variables are management policies and their results. Examples
are always hard to agree on, but in this case they are being used to emphasise the differences that
exist even between related sectors, and the obvious multiplication of variables when the ones
proposed by the social sciences must include geomorphological variables (the way the coast
physically changes) and environmental and cultural resources (their availability and the way they
are consumed). The SECOA project has attempted to tackle this problem by also measuring types
of individual mobility and the attractiveness of the territory. For previously mentioned reasons,
these data are not generally registered, so it was decided to use the GIS tool to add space and
time values. Space in coastal metropolitan areas is characterised by the differences among the
various spatial components, and it is not always easy to identify the coastal stretch used as the
element of comparison. Time, on the other hand, is defined in terms of recurring daily, temporary
and permanent mobility, with a further variant of mobility that is either production-led (blue-
collar, white-collar, managers, regular and irregular workers) or consumption-led (including
mobility for reasons of tourism, leisure and retirement). The prediction models, on the other
hand, are an instrument to connect the past to the future, and hence to integrate the natural and
cultural heritage and contribute to building prediction scenarios.
This volume is on DIPSIR, a tool approach developed by the OECD in the Nineties and
subsequently applied by the EU Commission. They spotted DIPSIR as an item of interest in its
ability to put together 'drivers', 'pressures', 'state', 'impacts', and responses to change caused by
- 17 -

any stressor. The theme is particularly dear to me because I was personally involved on DIPSIR
discussion in the years when I was in Brussels as president of the European Environmental
Bureau. All national research groups of SECOA, whose coordinators are represented in the
editorial board of SECOA Publication Series, attended with their contributions to the preparation
of this volume.
For this volume, the Series Editor wishes to thank Tran Dinh Lan, director general of the
Institute of Marine Environment and Resources (IMER), Hai Phong City, Vietnam, who
coordinated the Work Package “Environmental stresses and resources use for sustainable
development” (SECOA, WP2), E. Gunilla Almered Olsson and Serin Alpokay, School of Global
Studies, University of Gothenburg, who shared the responsibility of editing it. Special thanks are
also due to my Editorial Board colleagues, who took on the responsibility, as referees, of revising
the text of the book, suggesting appropriate changes and requesting the necessary additions.
Armando Montanari
Rome, November 2013
- 18 -

Preface to the Volume This book is one of the outputs from the EU FP7 research project SECOA, Solutions for
Environmental Contrasts in Coastal Areas, working in the period December 20019 – 1 December
2013. In the project participated five countries from EU and three partners are from outside
Europe. The main goals of the project were to analyze conflicts on resource use in urban, coastal
areas with special emphasis on urbanization and mobility and in the context of global
environmental changes. One of the work packages in the project was dedicated to work on
Environmental stresses on the natural resources in the urban coastal context. The work package
on Environmental stresses and resource use for sustainable development was led by Dr Tran
Dinh Lan. Specific studies on this theme was performed by the partners as 17 case studies, two
(one country had three) per country, which yielded a large data set presented in this volume. The
case studies were all first written as national reports and were also compiled in a project
deliverable, D2.2.
Structure of this book
Each project partner/national research group is presenting their case studies as separate chapters
and at the authors responsibility. The theme of this book is Environmental stresses and resource
use – analysed by the DPSIR approach which is presented in each chapter. Work on sustainability
indicators and indexes have also been done by partners but not by all. In order to make the book
as consistent as possible the DPSIR work is presented in the cases studies while other data and
results (Sustainability Indicators and Indexes – if present) –are put in Appendix at the end of each
chapter. Sometimes the work on indicators was inseparable from the DPSIR work and– if so – is
kept in the chapters. Nothing substantial from the original report was deleted. Each partner has
2 (3) case studies and there are three different ways of structuring the text: Cases-together, cases-
separate, and mix of these two. To make it consistent and easy-to-read, text was restructured
according to the outline/index of the book: cases-separate. Numbering the 3rd level sub-headings
was avoided as much as possible, not to burden the index. But in some cases it was necessary to
number the 3rd level also, for the sake of clearness (marking geographical area and so forth).
- 19 -

We thank Sapienza press for publishing this series of SECOA books. We thank Armando
Montanari for being the originator and the scientific leader and Riccardo Carelli for being the
administrative leader of the SECOA project. We thank our fellow project collaborators for
inspiring collaboration and excursions. And – finally thanks to EU- FRP 7 for sponsoring this
research project.
E. Gunilla Almered Olsson
Gothenburg 22 October 2013
- 20 -

CHAPTER 1.
Environmental Stresses and Resource Uses
Analysed by the DPSIR Framework
E. Gunilla Almered OLSSON
- 21 -
SECOA, Vol. 6. Environmental Stresses and Resource Use in Coastal Urban and Peri-Urban Regions
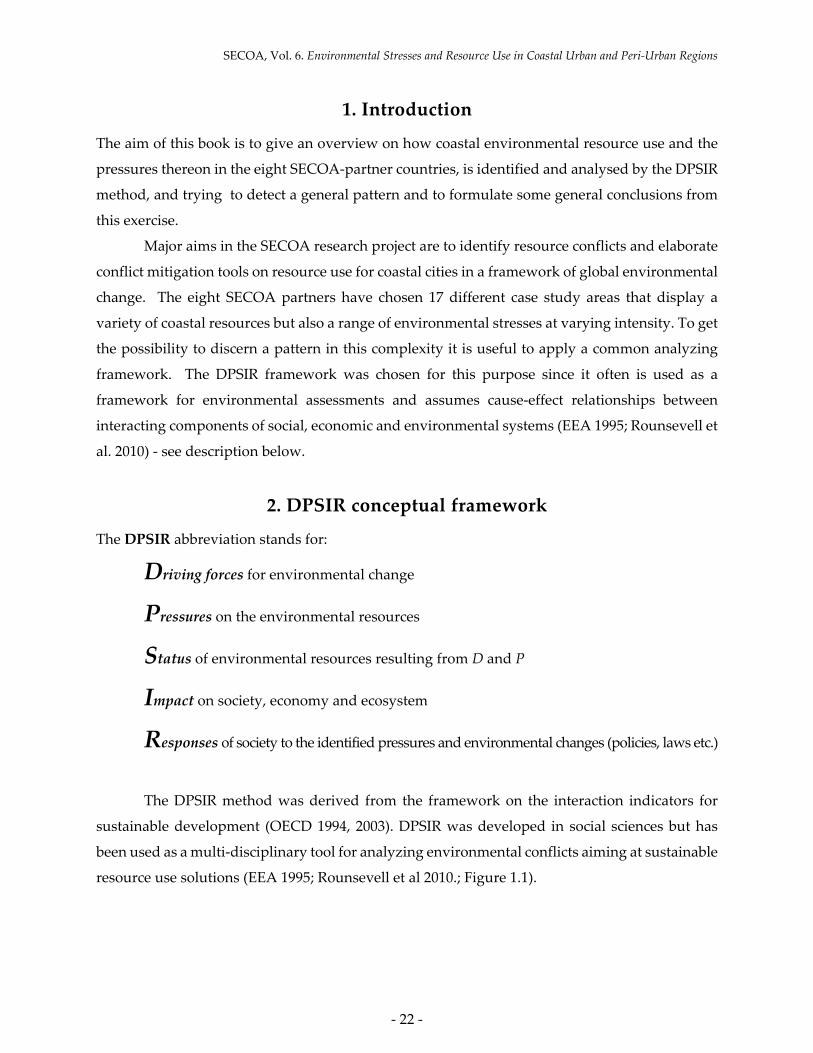
1. Introduction
The aim of this book is to give an overview on how coastal environmental resource use and the
pressures thereon in the eight SECOA-partner countries, is identified and analysed by the DPSIR
method, and trying to detect a general pattern and to formulate some general conclusions from
this exercise.
Major aims in the SECOA research project are to identify resource conflicts and elaborate
conflict mitigation tools on resource use for coastal cities in a framework of global environmental
change. The eight SECOA partners have chosen 17 different case study areas that display a
variety of coastal resources but also a range of environmental stresses at varying intensity. To get
the possibility to discern a pattern in this complexity it is useful to apply a common analyzing
framework. The DPSIR framework was chosen for this purpose since it often is used as a
framework for environmental assessments and assumes cause-effect relationships between
interacting components of social, economic and environmental systems (EEA 1995; Rounsevell et
al. 2010) - see description below.
2. DPSIR conceptual framework
The DPSIR abbreviation stands for:
Driving forces for environmental change
Pressures on the environmental resources
Status of environmental resources resulting from D and P
Impact on society, economy and ecosystem
Responses of society to the identified pressures and environmental changes (policies, laws etc.)
The DPSIR method was derived from the framework on the interaction indicators for
sustainable development (OECD 1994, 2003). DPSIR was developed in social sciences but has
been used as a multi-disciplinary tool for analyzing environmental conflicts aiming at sustainable
resource use solutions (EEA 1995; Rounsevell et al 2010.; Figure 1.1).
- 22 -

E. G. A. OLSSON, Environmental Stresses and Resource Uses Analysed by the DPSIR framework
Figure 1.1. DPSIR framework - adapted from Rounsevell et al. 2010.
The method has been used in a wide range of ecosystems and social settings and there are
numerous publications and reports from those exercises. Advantage of the method is the demand
to apply a holistic view of the social-ecological system trying to see not only the environmental
problem but also its drivers and pressures and thus the direct link to the social-economical
dimensions of the system. In reality this is very challenging and the studies that have been
performed capture only limited factors and do not always succeed in identifying driving forces.
Critique on the method has also put forward the shortcomings of relevant consideration of the
social and economic issues and of the stakeholder influence (Svarstad et al. 2008; Levrel et al.
2009; Bell 2012). It is true that the method has been frequently applied by natural scientists
focusing on e.g. biodiversity (e.g. Kuldna et al. 2009; Roura-Pascual et al. 2009) but there are also
good examples that the DPSIR method can be a useful method for identifying drivers and
pressure to e.g. biodiversity loss, complex environmental problems related to coastal mega-cities,
and to set goals for policies (Spangenberg et al. 2009; Sekovski et al. 2012).
Often indicators for different dimensions of sustainability are developed in relation to the
DPSIR exercises (OECD 2003 ) This was also recommended by the SECOA work package leader
for this task (Tran 2011 a,b) based on the methodology in Clayton & Radcliffe (1997). The partners
used a variety of indicators linked to different aspects of coastal resources resulting in heterogenic
results. Further, indexes based on the chosen indicators were developed for most case studies
although the access to time series data varied among the cases. This led to heterogenic results
- 23 -

SECOA, Vol. 6. Environmental Stresses and Resource Use in Coastal Urban and Peri-Urban Regions
making comparisons and pattern detection among case studies very difficult. Against this
background generally the results of the development of indicators, indexes and resulting maps
over sustainable development areas are put in Annexes directly linked to each chapter. If the
work on indicators is clearly separated from the development of indexes, it is presented together
with the DPSIR study in the main chapter.
3. The Complexity of Ecosystems and Habitats and Environmental
Stresses Across the SECOA Case Studies
3.1. Short overview of the case studies – bio-geo-climatological features and urban trends
The SECOA project comprises research groups from eight countries (Figure 1.2) and of the case
studies of coastal cities and townships presented in this volume 12 are from Europe and 6 from
Asia. The bio-geo-climatological span is wide encompassing Western Europe from south western
Sweden- United Kingdom – Belgium –Portugal, to Italy and Israel at the Mediterranean Sea and
tropical India and Vietnam. More details on the context of the different case studies are given in
Table 1-1. see end of this chapter.
Figure 1.2. Over view of SECOA partner countries and the 17 case studies (Source: SECOA webpage
[accessed 2013-10-14]).
- 24 -

E. G. A. OLSSON, Environmental Stresses and Resource Uses Analysed by the DPSIR framework
3.2. Different methodological approaches to the DPSIR framework
Since the case study areas in the SECOA project are very heterogenic and are subjected to
heterogenic drivers is was recommended by work package leader for this task (Tran 2011 a, b) to
focus the DPSIR study on the one component of the coastal resources, the coastal wetlands. This
was also done in most of the case studies, but not for all. The DPSIR analyses in this book relates
to natural resources of temperate coastal wetlands, tropical mangroves and coral reefs, whole
coastal landscapes, urban landscapes and specific issues as air and water quality. The scope of
the DPSIR analyses differs, from landscape scale with numerous habitats to including only one
habitat. Also the dimension of the ecosystem chosen for the analysis differs among case studies,
from land area, biodiversity, to water and air quality.
The different approaches to the DPSIR study are shown in Table 1-2. See end of this
chapter.
4. Conclusions
The DPSIR method although employed over a substantial time period, since 1994, is still applied
in a very heterogenic way. The interpretation of the method in terms of identification of
dimensions of ecosystem to analyze and also its temporal and spatial scales are to be set by the
researcher/manager. This person is similarly free to identify drivers and pressures. Hence it is
fully clear that the method will be applied in a multitude of ways. Under such circumstances it
is not meaningful to perform comparisons among case studies and regions. This was recently also
noted in a new study of use of DPSIR in coastal research and management (Alpokay 2013).
In the SECOA project with the 17 case studies 15 different DPSIR approaches are used.
Table 1.1. and Table 1.2. presented at the end of this chapter are aimed to assist manual
classification of the case studies. They display overview of the cases based on bio-geo-
climatological and landscape features and urban trends as well as dimensions of coastal
ecosystem chosen for each case study, DPSIR approach, Drivers, Pressures and Indicators. The
text content in the tables is extracted from the different case study chapters in this book.
- 25 -

SECOA, Vol. 6. Environmental Stresses and Resource Use in Coastal Urban and Peri-Urban Regions
Table 1.1. Overview of bio-geo-climatological and landscape features and urban trends for the 17 case
studies. Vegetation zone data from Walter 1977; climate zones from Köppen in FAO 2006; population
data from Williams 2012.
Country Region and Case study site
Biogeo-climatological and landscape context
Historical background and present economic activity
Population (date)
Population change 'over last decade'
(%)
EUROPE
Sweden West coast, Gothenburg met. and peri-urban area
Kungälv municipality
West European heathland-nemoral vegetation zone; Temperate; small scale hilly, mixed agricultural and woodland landscape, scattered settlements
Old agricultural landscape, harbor and shipping activities. Hub at the river mouth (Göta älv) for border traffic Sweden-Norway. Today a small township with peri-urban settlements. Agricultural areas mainly used for recreation and horse sports. Expansion of housing. Protected areas for nature and culture
Gothenburg:
714,696 (2005)
13.6
South-west coast, Malmö met. and peri-urban area
Vellinge municipality
West European heathland-nemoral vegetation zone; Temperate; fully cultivated flat agricultural landscape , dense suburban settlements
Old agricultural landscape and fish harbors. Development into attractive peri-urban residence area for Malmö met. Recreation and sports areas.
Malmö: 331,822 (2008)
9.3
UK South coast of UK: Portsmouth
Atlantic heath -Nemoral vegetation zone; Temperate –Martitime; Coastal, riverine and wetland landscape today dominated by dense sub-urban settlements and built up areas
Regional town and harbour developing into regional urban centre with expansion of housing and industries
545,201 (2009) 2.2
South-east London
met.: Thames
Gateway
Nemoral vegetation zone; Temperate- Maritime; Coastal, estuarine and wetland landscape today dominated by green spaces (recreation and conservation) scattered settlements and peri-urban built up areas
Ancient hub for business and transport on the Thames estuary, City of London with large scale expansion of a world city – although with preservation of wetlands and green areas for recreation
9,098,572 (2009) 5.6
Belgium West-Flanders: Brugge incl. Zeebrugge
West European heathland-nemoral vegetation zone; Temperate; Fully cultivated agricultural landscape surrounding the dense urban city
Ancient medieval town, UNESCO world heritage Zeebrugge is a modern port – today part of Brugge
Tourism
Port activity
255,875 (2008) 1.3
- 26 -

E. G. A. OLSSON, Environmental Stresses and Resource Uses Analysed by the DPSIR framework
Oostende Arrond.: Oostende
West European heathland-nemoral vegetation zone; Temperate; Fully cultivated agricultural landscape surrounding the dense urban city;
Developed from old coastal resort to modern coastal city: coastal tourism and port industries
123,470 (2008) 7.5
Italy West coast of Italy, southern part of Rome met : Rome and Ostia
Mediterranen vegetation zone; Mediterranean climate; Hilly and rocky coastal and urban landscapes; expanding urban areas
Since ancient time an important world city and cultural heritage site. Expanding building sector (service sector, technological industries etc) and tourism activities
Rome: 4,259,027 (2009)
Ostia: 216,515
Rome: 11.3
West coast of Italy, northern part of Rome met.: Civitaveccia
Mediterranen vegetation zone; Mediterranean climate; Flat and sandy coastal and urban landscapes; expanding urban areas
Developed into a major ferry and cruise sea port. Expanding port activities
52,0001 n.a.2
East coast of Italy, Adriatic coast, Abruzzo region: Pescara
Mediterranen vegetation zone; Mediterranean climate; Coastal plain and river valley with agricultural landscape, expanding urban, industrial and dense settlement areas.
Important commercial center, modern city rebuilt after WWII bomb attacks. Expanding commercial, administrative and
industrial activities; expanding settlements into neighbouring rural towns
120,0001 n.a.2
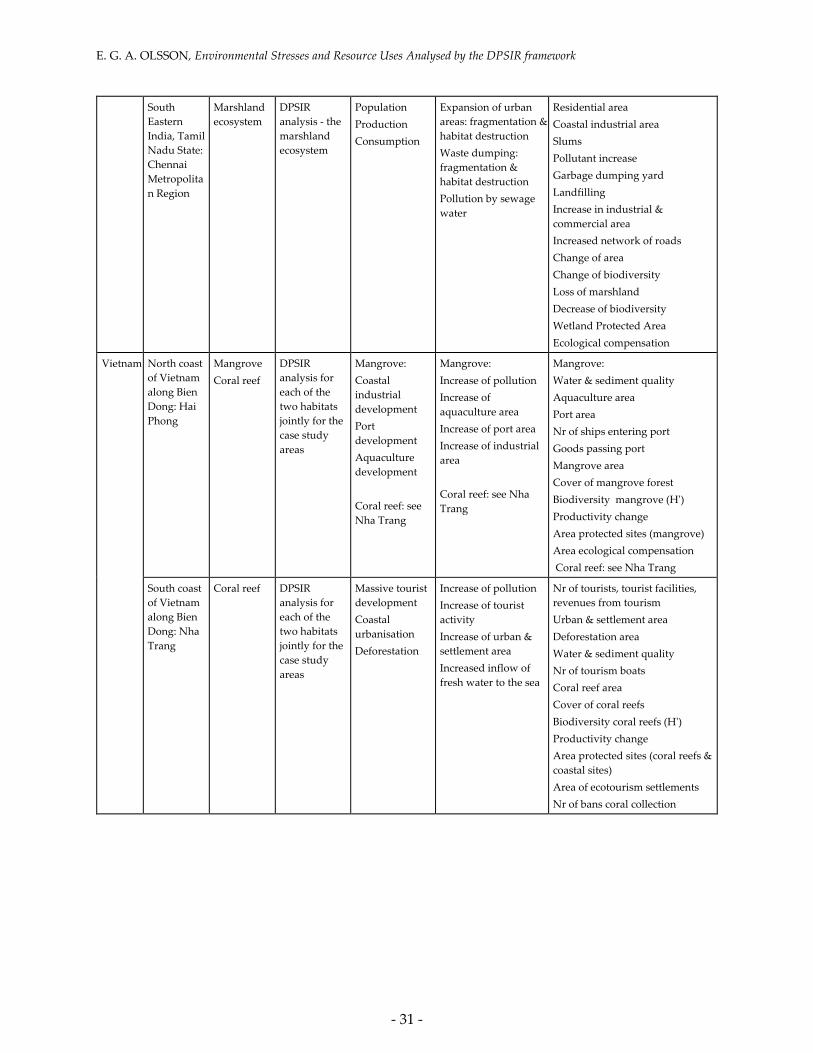
Table 1.2. Overview of selected dimensions of the coastal ecosystem for the DPSIR study, DPSIR
approach, Drivers, Pressures and Indicators chosen for the 17 case studies.
1 Data from Italy’s chapter in this book. 2 No data available.
Country Region and Case study
site
Coastal ecosystems
– components
of…
DPSIR approach
Drivers Pressures Indicators
EUROPÉ
Sweden West coast, Gothenburg met. and peri-urban area Kungälv municipality
Coastal wetlands
DPSIR analysis coastal wetlands
Globalization CAP & EU policies
Abandoned agricultural use Vulnerability of management agreements Declining grazing Boat harbor Eutrophication of drainage water
No indicators identified
- 27 -

SECOA, Vol. 6. Environmental Stresses and Resource Use in Coastal Urban and Peri-Urban Regions
South-west coast, Malmö met. and peri-urban area Vellinge municipality
Coastal habitats
DPSIR analysis coastal habitats
Urbanisation Population growth Tourism & Recreation Öresund bridge Economic growth Geological processes (land sinking, sand accumulation) Climate change
Expansion of urban and settlement areas Traffic Deterioration of nature due to over use Inundations Wave actions Sea level rise Ground water level rise Temperature rise
No indicators identified
UK South coast of UK: Portsmouth
Intertidal flats & saltmarshes within two statutory conservation areas: Portsmouth Harbour & Langstone Harbour
Joint DPSIR analysis of intertidal habitats in the two case study areas
Population growth Flood defences Economic changes Urban regeneration Port activities Tourism & Recreation EU directives (Habitats, Floods, Water)
Sea level rise Increase in wave energy Land reclamation Coastal urbanisation Change in sediment supply Coastal engineering Dredging Water pollution Invasive species Tourism & Recreation
Population growth (%) Growth in number of industries (%) Increase in urban area (%) Sea-level rise (cm in 50 yrs) Exposure to waves (relative exposure) Loss of saltmarsh area (%) Bird count decline (%) Area in unfavourable state of conservation (%)
South-east London met.: Thames Gateway
Intertidal flats & saltmarshes within four statutory conservation areas: Benfleet Marshes, South Thames Estuary, Medway Estuary, Swale
Belgium West-Flanders: Brugge incl. Zeebrugge
Coastal ecosystem as a combination of all habitats (Dunes, Beaches, Wetlands, Forests, Polders, Marine ecosystem)
DPSIR analysis of each habitat jointly for the 2 study areas
Livestock rearing Agricultural expansion Tourism/recreation Water & sand extraction Conservation CC & sea level rise Off shore activities: piping, cabling,
Soil degradation Overgrazing Erosion Reduced biodiversity Habitat decrease Fragmentation Pollution of soil & water Eutrophication Salinisation Seasonal effects High specialisation Fish stock depletion
Number of households Total overnight-stays Number of industries Coastal protected area (ha) Oil pollution at sea – annual number of observation Beach water quality Fish stocks within Safe Biological Limits (number of fish-stocks) Area of bio-agriculture (ha)
- 28 -

E. G. A. OLSSON, Environmental Stresses and Resource Uses Analysed by the DPSIR framework
shipping, wind turbines Urbanisation/Land cover change Transport link Fishery
Italy West coast of Italy, southern part of Rome met.: Rome and Ostia
Water DPSIR analysis – Coastal water
Demographic growth & urbanisation Industry Agriculture & Cattle breeding Tourism
Population Water consumption/ abstraction Water pollution Point & diffuse source pollution Recreational boating
Water consumption Tiber river water quality: (several parameters) Coastal water quality: coliform bacteria; transparency; pH; swimming water
West coast of Italy, northern part of Rome met.: Civitaveccia
Air DPSIR analysis - Air quality
Demographic growth & urbanisation Transport Industry Energy production
Population Port Traffic Industry & Commerce Power plants
Population density Maritime traffic Power plants Motorization rate Sea port emissions Industrial plants: emissions NO2 & SO2 annual surpasses PM (particular mean) annual surpasses European & National legislation Regional decrees & plans
East coast of Italy, Adriatic coast, Abruzzo region: Pescara
Air DPSIR analysis - Air quality
Demographic growth & urbanisation Transport Industry
Population Port Airport Traffic Industry & Commerce
Population density Air traffic Maritime traffic Industrial plants & activities Motorization rate Seaport emissions Airport emissions NO2 & SO2 annual surpasses PM (particular mean) annual surpasses Regional decrees & plans
Portugal West coast of Portugal: Metropolitan Area of Lisbon
Beach, dunes, sands Coastal wetlands (Salt marshes, salines, intertidal flats) Tagus estuary
DPSIR analysis – coastal ecosystem (different habitats)
Population Tourism Industry & Commerce Agriculture Ports Second homes
General pressures on all resources from all drivers: Expansion of housing along the water front Competition on land along water front: housing, industry, tourism Decrease in biodiversity: coastal & marine De-industralisation Decrease of fishing Cruise & port activity increasing
Urban fabric Industrial, commercial, transport units Agricultural areas Beach, dunes, sands Coastal wetlands Protected areas Natura 2000 areas
- 29 -

SECOA, Vol. 6. Environmental Stresses and Resource Use in Coastal Urban and Peri-Urban Regions
South coast of Portugal: Eastern Algarve
Beach, dunes, sands Coastal wetlands (Salt marshes, salines, intertidal flats) Ria Formosa lagoon
DPSIR analysis – coastal ecosystem (different habitats)
Population Tourism is main industry Agriculture Ports & fishing fleet Second homes
General pressures on all resources from all drivers: Expansion of housing along the water front Competition on land along water front: housing, tourism Decrease in biodiversity: coastal & marine Marinas & yacht tourism increasing
Urban fabric Industrial, commercial, transport units Agricultural areas Beach, dunes, sands Coastal wetlands Coastal lagoons Protected areas Natura 2000 areas
Atlantic island of Portugal: Madeira: Funchal
Beaches & wetlands
DPSIR analysis - beaches & wetlands
Tourism Industry & Commerce Agriculture Ports & Fishing fleet
General pressures on all resources from tourism, industry, cruise industry, Competition on land along water front: housing, tourism (hotels) Decrease of fishing & commercial port Cruise activity increasing
ASIA
Israel West coast of Israel: Palmachim – Tel Aviv
Vegetation on coastal sand dunes
DPSIR analysis - coastal sand dunes
Population Immigration Economic development
Expansion in urban areas: industrial & residential expansion
Change in natural vegetation cover, 1995-2009
West coast of Israel: Carmel Coast-Haifa
Vegetation on coastal sand dunes
DPSIR analysis - coastal sand dunes
Population Economic development
Expansion in urban areas: industrial & residential expansion Incursion on cultivated fields & fish ponds
Change in natural vegetation cover, 1995-2009
India North Western India, Maharastra State: Mumbai Metropolitan Region
Mangrove ecosystem
DPSIR analysis - the mangrove ecosystem
Population: built up area increase Production: waste & pollution Consumption: waste & pollution
Expansion of urban areas Expansion of slums Harvesting mangrove for fuel wood Waste dumping Industrial pollution – sewage water Overexploitation of fisheries
Salt pans Sea ports Coastal industrial areas Slums Pollutant increase Aquaculture ponds Increase in port area Increase in industrial area Coverage change Change in biodiversity Loss of mangrove forests Decrease of nursery ground Decrease of biodiversity Wetland protected area Ecological compensation
- 30 -
E. G. A. OLSSON, Environmental Stresses and Resource Uses Analysed by the DPSIR framework
South Eastern India, Tamil Nadu State: Chennai Metropolitan Region
Marshland ecosystem
DPSIR analysis - the marshland ecosystem
Population Production Consumption
Expansion of urban areas: fragmentation & habitat destruction Waste dumping: fragmentation & habitat destruction Pollution by sewage water
Residential area Coastal industrial area Slums Pollutant increase Garbage dumping yard Landfilling Increase in industrial & commercial area Increased network of roads Change of area Change of biodiversity Loss of marshland Decrease of biodiversity Wetland Protected Area Ecological compensation
Vietnam North coast of Vietnam along Bien Dong: Hai Phong
Mangrove Coral reef
DPSIR analysis for each of the two habitats jointly for the case study areas
Mangrove: Coastal industrial development Port development Aquaculture development Coral reef: see Nha Trang
Mangrove: Increase of pollution Increase of aquaculture area Increase of port area Increase of industrial area Coral reef: see Nha Trang
Mangrove: Water & sediment quality Aquaculture area Port area Nr of ships entering port Goods passing port Mangrove area Cover of mangrove forest Biodiversity mangrove (H') Productivity change Area protected sites (mangrove) Area ecological compensation Coral reef: see Nha Trang
South coast of Vietnam along Bien Dong: Nha Trang
Coral reef DPSIR analysis for each of the two habitats jointly for the case study areas
Massive tourist development Coastal urbanisation Deforestation
Increase of pollution Increase of tourist activity Increase of urban & settlement area Increased inflow of fresh water to the sea
Nr of tourists, tourist facilities, revenues from tourism Urban & settlement area Deforestation area Water & sediment quality Nr of tourism boats Coral reef area Cover of coral reefs Biodiversity coral reefs (H') Productivity change Area protected sites (coral reefs & coastal sites) Area of ecotourism settlements Nr of bans coral collection
- 31 -

SECOA, Vol. 6. Environmental Stresses and Resource Use in Coastal Urban and Peri-Urban Regions
2. References
Alpokay, S. 2013. The DPSIR Model and its Role in Natural Resource Management: A Critical
Assessment of DPSIR Application on Coastal Research and Resource Management
Practice. Master's Thesis within the framework of Project SECOA. University of
Gothenburg. Gothenburg, Sweden.
Bell, S. 2012. DPSIR = A Problem Structuring Method? An exploration from the “Imagine”
approach. European Journal of Operational Research 222:350-360.
Clayton, A.M.H. and Radcliffe, N.J. 1997. Sustainability – a system approach. Earthscan, London.
UK.
EEA. 1995. Europe's Environment: the Dobris Assessment. European Environment Agency,
Copenhagen.
FAO 2006. Global climate maps. FAOs Sustainable development department. http://www.fao.
org/sd/El direct/climate/Elsp0002.htm [accessed 2013-10-14].
Kuldna, P., Peterson, K., Poltimäe, H., Luig, J. 2009. An application of DPSIR framework to
identify issues of pollinator loss. Ecological Economics 69:32-42.
Levrel, H., Kerbiriou, C., Couvet, D., Weber, J. 2009. OECD pressure-state-response indicators for
managing biodiversity: a realistic perspective for a French biosphere reserve. Biodiversity
and Conservation 18(7):1719-1732.
OECD 1994. Environmental indicators. A preliminary set. OECD. Paris
OECD 2003. Environmental indicators. Development, measurement and use. Reference paper.
OECD Report. Paris. http://www.oecd.org/env/ [accessed 2013-07-21].
Rounsevell, M. D. A., Dawson, T.P., Harrison, P.A., 2010. A conceptual framework to assess the
effects of environmental change on ecosystem services. Biodiversity and Conservation
19:2823-2842.
Roura-Pasual, N., Richardson, D. M., Krug, R. M., Brown, A., Chapman, R.A., Forsyth, G.G., Le
Maitre, D.C., Robertson, M.P., Stafford, L., Van Wilgen, B.W., Wannenburgh, A., Wessels,
N. 2009. Ecology and management of alien plant invasion in South African fynbos:
Accommodating key complexities in objective decision making. Biological Conservation
142:1595-16054.
- 32 -

E. G. A. OLSSON, Environmental Stresses and Resource Uses Analysed by the DPSIR framework
Sekovski, I., Newton, A., William, C. D. 2012. Megacities in the coastal zone: Using a driver-
pressure-state-impact-response framework to address complex environmental problems.
Estuarine, Coastal and Shelf Science 96:48-59.
Spangenberg, J, H., Martinez-Alier, J., Omann, I., Monterroso, I., Binimelis, R. 2009. The DPSIR
scheme for analyzing biodiversity loss and developing preservation strategies. Ecological
Economics 69:9-11.
Svarstad, H., Petersen, L. K., Rothman, D., Siepel, H., Watzolde, F. 2008. Discursive Biases of the
Environmental Research Framework DPSIR. Land Use Policy 25(1):116–125.
Tran, D.L. 2011a. DPSIR framework for case studies. SECOA Report D2.1. SECOA web page.
[accessed 2013-07-12].
Tran, D.L. 2011b. Assessment report of natural resources use. SECOA Report D2.2. SECOA web
page. [accessed 2013-07-12].
Walter, H. 1977. Vegetation of the earth. Springer-Verlag New York. Heidelberg. Berlin
Williams A. M. (ed.) 2012. Human Mobility in Coastal Regions. The impact of migration and
temporary mobilities on urbanization. Sapienza Università Editrice, Vol. II, September
2012.
- 33 -

SECOA, Vol. 6. Environmental Stresses and Resource Use in Coastal Urban and Peri-Urban Regions
- 34 -

CHAPTER 2.
Assessment of Natural Resources Use for Sustainable
Development: DPSIR Framework for Case Studies in
Oostende and Brugge, Belgium
Xuan-Quynh LE, Tomas CROLS and Eric CORJIN

SECOA, Vol. 6. Environmental Stresses and Resource Use in Coastal Urban and Peri-Urban Regions
1. Introduction
The Belgian coast lies central in the European core area, at the southern point of the North Sea. It
is a densely populated area with important economic and tourist activities.
The coastline consists of wide sand beaches, usually followed by a small dune belt. Land
inward there is a flat, long and wide polder landscape, excellent for agriculture. Towards the sea,
on the continental flat one will find numerous sand banks.
Thanks to its well-established road network, the coast is easily accessible for a broad
(European) hinterland, with cities like Brussels, Cologne, Lille, Amsterdam, Paris and London.
The densely build-up areas and the linear road infrastructure makes the Belgian coast look like
one small continuous agglomeration. Small open areas only occasionally interrupt this scenery.
Because of the fact that the Belgian coast is rather small, a proximally 67 km long, the
description of the state of the environment will cover both case studies as part of the totality of
the Belgian coastal zone. Moreover, both case-study cities Oostende and Brugge are of high
importance for the Belgian coastal region in the generation of jobs, cultural activities, education,
etc. So when one takes a look at the description of the boundaries of the case studies, they will
rapidly notice that both metropolitan rings are connected to each other.
The study aims to apply the DPSIR (Driver-Pressure-State-Impact-Response) framework
to analyse the impacts of socio-economic drivers that exert environmental pressures on the
coastal ecosystems. The analytic process uses indicators to give a picture on the use of the coastal
ecosystems and to assist in determining whether coastal ecosystems are under threats of
unsustainable uses.
2. Materials and Methodology
2.1. Sources and data
For this study, a base list of indicators was compiled using various sources, most important are:
• EEA Core Indicators list (Smeets & Weterings 1999; EEA 2005),
• MIRA-T Flanders Environment Reports – Indicator Reports (2007 till 2010) (Van
Steertegem 2007-2010),
• Biodiversity Indicators – State of Nature in Flanders (2007 till 2010) (Van Daele et al. 2010)
and
• A reference guide on the use of indicators for Integrated Coastal Management (UNESCO
2003).
- 36 -

Xuan-Quynh LE, et al., […] DPSIR Framework for Case Studies in Oostende and Brugge, Belgium
It is important to note that while the MIRA-T series and the Biodiversity Indicators are
the two publications specific for Flanders, they use the main set of EU Indicators as the reference
as to comply with reporting requirement by the European Commission.
2.2. Methods
2.2.1.DPSIR Framework
The study uses the well-established D-P-S-I-R framework, which is based on the uses of indicators
and indices to analyse and understand the dynamic of the coastal ecosystems under various
socio-economic drivers and pressures.
To define the scope of sustainable development and to describe the interrelationships
between economy, environmental quality, and human well-being, models are very useful
instruments. The DPSIR framework links human actions and environmental consequences
(Figure 2.1). In the model human action is mainly driven by demographic and well-fare variables.
These human activities exert pressures, which have to do with the consumption of resources and
the release of pollutants. These pressures create impacts and subsequently alter the state of the
environment. These impaired states, in turn, elicit responses. In case the environment is not too
affected the natural feedback systems can cope with the situation. In other cases policy measures
such as regulations governing pollution or the installment of new technologies might be the
response.
Figure 2.1. The conceptual framework of the DPSIR framework indicators (After UNEP and DPCSD 1995).
Throughout the framework, indicators can be used to measure the degree of interaction
between different elements. The definition of indicators are related to the definition of the scope,
- 37 -

SECOA, Vol. 6. Environmental Stresses and Resource Use in Coastal Urban and Peri-Urban Regions
the models or integrated systems, the analysis on which the relationships are based upon, the
conditions and criteria the indicators should fulfill and the validation of the selected measures.
The decision-making processes that determine which indicators are to be used, involve
the choice of the framework and themes of sustainable development. Indicators should deal with
setting objectives and targets a sustainability policy has to reach. They also contribute to monitor
the progress towards sustainable development (Hens et al. 2000).
Indicators for sustainable development should be major guidelines for government and
authorities on the transition towards sustainability. They should act as warning signals for
decision-makers so that paths of unsustainable development can be avoided. They can also have
the potential to communicate with the public at large on sustainable development and to
stimulate social learning. They should contribute to the relevant changes needed for positive and
beneficial societal transition.
2.2.2. Indicator Selection
Selecting indicators for the analysis is the most difficult and sensitive part. Anderson (1991) has
suggested following criteria that may determine a good indicator:
• The indicator or the information from which it is calculated should be readily available.
In practice, most lists of indicators for sustainable development use to a large extent
existing data. Nevertheless, the establishment of new, specific, long term indicators which
are more relevant for sustainable development than the traditional indicators is the new
research question that warrants further studies.
• The indicator must be relatively easy to understand. Indicators are essential to inform
society on its way to a sustainable development. The easier one can understand an
indicator, the better it serves this communication target.
• The indicator must be about something that can be measured. Although qualitative
measures for sustainable development exist, most indicators are quantitative in nature.
Moreover, indicators must have the capacity to show trends over a period of time.
• The indicator should measure something believed to be important in its own right. In
other words, an indicator should be appropriate, it should go to the core of the issue and
it should not hide aspects relevant for sustainable development.
- 38 -

Xuan-Quynh LE, et al., […] DPSIR Framework for Case Studies in Oostende and Brugge, Belgium
• There should be only a short time lag between the state of affairs referred to and the
indicator becoming available. Too long delays of this kind make the indicator unattractive
for policy makers.
• The indicator should be based on information that can be used to compare different
geographical areas. Comparison capacity between areas, regions, countries, or sectors
provides an indicator extra strength. This allows defining priorities, but also has back-
draws. International comparison is desirable.
Finally, 8 indicators were selected to calculate sustainable resources use index (Isu) which
is the aim of this study (see section 3.5).
2.3. Defining the study area
The study areas in the Belgian cases have been defined taking into consideration the core-ring
relations, as well as other methods of demarcation used in Belgium, especially the works of Van
der Haegen et al. (1979; 1996). Based on a national census, the status 'Stadsgewest' has been given
to regions in Belgium primarily based on employment and commuting data.
For the SECOA case studies in Belgium we will define the metropolitan core as being
equal to the stadsgewest (agglomeration + banlieue). The forensen communes of the stadsgewest
make up the metropolitan ring.
Oostende Study Area (SA) includes following communes (Van Hecke et al. 2007):
• Agglomeration (Core): Oostende and Bredene
• Banlieue (Core): Oudenburg
• Forensen (Ring): Gistel and Middelkerke
For the Brugge Study Area (SA) these include the following communes (Van Hecke et al.
2007):
• Agglomeration (Core): Brugge
• Banlieue (Core):: Damme, Jabbeke, Oostkamp and Zuienkerke
• Forensen (Ring): Beernem, Blankenberge, Knokke-Heist and Zedelgem.
- 39 -

SECOA, Vol. 6. Environmental Stresses and Resource Use in Coastal Urban and Peri-Urban Regions
For both case-studies, the coastal zone is defined using the statutory coastal zone
definition (Figure 2.2). The whole of the Oostende SA lies within the coastal zone demarcation.
Three communes of the Brugge SA fall outside the coastal zone: Oostkamp, Berneem and
Zedelgem (Belpaeme et al. 2004).
Figure 2.2. The study areas: Brugge SA and Oostende SA.
The first case study in Belgium is Brugge (or Bruge), with a focus on Zeebrugge, a coastal
area of the Municipality of Brugge and itself a seaport. Brugge is the capital and largest city of
the Belgian province of West-Flanders, located in the northwest of the country. The historic centre
of the city is a UNESCO site, with an egg shape, located roughly 15 km from the sea. The economic
activities of the city are directly linked to its sea harbor, located in Zeebrugge. The Brugge study
area (SA) comprises the city of Brugge and several of its surrounding communes: Blankenberge,
Zuienkerke, Jabbeke, Zedelgem, Oostkamp, Beernem, Damme and Knokke-Heist. This creates a
total study area of over 616 km2 and a total of over 255,000 inhabitants. The coastline in this study
area is roughly 18.5 km long.
- 40 -

Xuan-Quynh LE, et al., […] DPSIR Framework for Case Studies in Oostende and Brugge, Belgium
The second study area (SA) in Belgium is the Oostende SA, which comprises five
communes of the Oostende Arrondissement. They are Bredene, Gistel, Middelkerke, Oostende
and Oudenburg. The whole of the Oostende SA lies within the designated coastal zone of
Belgium. Oostende SA has a total surface area of 250 km2 and a coastline of roughly 20 km, or
nearly a third of the total Belgian coastline. Oostende commune (or Oostende Municipality) is the
core of the region, where most of the socio- economic activities take place. The main activities are
coastal tourism and port industries. The four other communes that form the Oostende SA have
strategic locations around Oostende Municipality and are functionally linked to Oostende
Municipality in term of economic development and socio-economic coherence. They provide
roughly 50% of the workers for Oostende Municipality. People from Oostende also work in the
neighbouring communes which mean that the functional regions are characterized by dense and
extensive inter-relationships.
3. Natural resources and their exploitation
3.1. Drivers and pressures
Three important groups of drivers and pressures affecting both Brugge and Oostende Study
Areas (SA) have been identified as demographic features, tourisms and harbours. These drivers
and pressures will be discussed in detail below.
3.1.1. Demographic features
For most ecosystems, the most important driving force is the human society. Human society
exerts its impacts on various aspects and levels but mainly on its productions and consumptions,
both are influenced by the size and activeness of the society. Amongst demographic features,
population size and density are the most obvious indicators.
The study area on the Belgian coast comprises of the Brugge Study Area (SA) and the
Oostende Study Area. Brugge SA accommodates in total 253,079 people (in 2008), and has a total
area of around 61,600 ha. The average population density in 2008 was 415 inhabitants/km2. The
most populated commune in Brugge SA is the seafront commune of Blankenberge with the
density of 1071 inhabitants/km2, followed by the Brugge commune with the density of 843
inhabitants/km2 (Figure 2.3). Brugge Municipality is the most populous area with a density two
times higher than the regional average and is one of the most populous areas in the Province of
West-Flanders (GOM West-Vlaanderen 2010).
- 41 -

SECOA, Vol. 6. Environmental Stresses and Resource Use in Coastal Urban and Peri-Urban Regions
For the Oostende Study Area (SA), population as of 2008 was 124,209 people, distributed
across a total area of around 20,500 ha. The average density of the entire study area is 605 people
per square kilometer. The core zone has a much higher density than the ring, with Oostende
Municipality having a density 3 times higher than the regional average. Oostende Municipality
has the highest population density in the Province of West-Flanders (GOM West-Vlaanderen
2010). Oostende and Bredene Municipalities are the two most populated communes in the
Province of West-Flanders. Both border the sea. The third most populated commune in West-
Flanders is also a coastal commune, Blankenberge. In Oostende, there are many sub-areas with
population densities of over 9000 inhabitants/km2, many of them on the coast (Figure 2.3).
Figure 2.3. Population density in the study area in 2003.
Although the population grows slowly in both SAs, Oostende SA has one of the fastest
growth rates in the Province of West-Flanders (West-Vlanderen Ontcijferd 2001-2010).
In the Brugge SA, Blankenberge and Knokke-Heist have the highest proportions of aged
population (26% and 28% respectively).
Second home owners are an important group of temporary residents. In 2007, the coastal
communes of Brugge SA and Oostende SA had in total of 82,700 second homes (Gunst et al. 2008).
Coastal communes within Brugge SA are the most popular destinations for second-home owners,
with Knokke-Heist leading the list with approximately 18,200 second homes. Blankenberge has
roughly 6,600 units and Zeebrugge has around 830 units (Gunst et al. 2008).
- 42 -

Xuan-Quynh LE, et al., […] DPSIR Framework for Case Studies in Oostende and Brugge, Belgium
The coastal communes of the Oostende SA are also a popular destination, with
Middelkerke being first ranked with more than 14,000 units, followed by Oostende with around
6,600 units. Bredene also has around 1000 second homes units (Gunst et al. 2008).
Between 1989 and 2007, the total number of second homes in the coastal communes (both
Brugges SA and Oostende SA) has increased by more than 25,000 units or 43%, representing an
annual increase of approximately 2% (Gunst et al. 2008). Most of the second homes are at the sea-
front, right onto the beaches.
Approximately 60% of the second homes are used by the owners (46%) or made free for
his/her acquaintances (14%) for tourism/recreation purposes. Around 40% of the second homes
are used as tourist lodging facilities (rented accommodation) (WES 2008).
3.1.2. Tourism
Brugge city (the central core of the Brugge SA) is considered one of the most attractive historic-
cultural cities in Europe. In 2007, Brugge SA attracted a total of approximately 1,150,000 visitors,
and 69% of these had visited the core area (mainly Brugge Municipality/city). There is an
exceptionally high proportion of foreigners – 62.5% of the total: of these, 90% visited the core.
67% of the Belgian visitors were more likely to visit the ring area, mainly Blankenberge (over
40%) and Knokke-Heist (over 20%). The pressures generated by tourism, particularly in context
of the historic urban structures of Brugge represent major challenges.
Overnights stays in Brugge SA are dominated by stays in the core area (over 60% of the
total). The core and the ring attract different groups of tourists. While the core (with the dominant
of Brugge Municipality) attracts mostly foreign tourists (nearly 85%), Belgian tourists tend to opt
for the ring locations.
A large number of visitors come to Brugge for business purposes, especially in recent
years, while Brugge is strongly promoted as a congress centre. In 2009, Brugge hosted 165
registered events, including 12 major conferences (with more than 200 participants). In total,
15,000 people have visited Brugge in 2009 for meetings and conferences.
Visitors to Brugge come year round, but some seasonality occurs with the lowest number
in January and highest in August.
While Brugge municipality is the best known tourism destination internationally, there
are also significant flows (from within the metropolitan area, as well as from elsewhere, to the
coast. Brugge SA, Knokke-Heist, Blankenberge and Zeebrugge are the three coastal communes
- 43 -

SECOA, Vol. 6. Environmental Stresses and Resource Use in Coastal Urban and Peri-Urban Regions
that are in the “most- popular” list for day-tourists. Knokke-Heist is in second place, right behind
Oostende, with 3.2 million day visitors in 2009. Blankenberge is in fourth place with 1.9 million
day visitors and Zeebrugge also attracted 0.2 million the same year.
Oostende SA is one of the most popular tourist destinations in Belgium. The total number
of visitors to the region has been relatively stable during the last decade. The core area has seen
a decreasing trend in the number of foreign visitors while the number of Belgian visitors has
increased, resulting in a small increase in the total number of visitors. Meanwhile, the ring has
experienced a slight decrease in the number visitors.
The core attracts most of the visitors (around 80%), especially foreign visitors. Meanwhile,
Belgian tourists tend to go to the ring area. In 2001, around 60% of Belgian overnight-stays were
spent in the core. By 2007, this figure was around 70%. Amongst foreigners, most of the overnight
stays were spent in the core (around 80%). Overall, the number of overnight stays in the ring has
decreased during the period 2001-2007 while the figure for the core remain stable – indicating a
tendency to greater centralization of tourism flows.
Oostende is also a popular destination for day tourism to the coast. According to a survey
in 2007, Oostende is the most popular destination for day-tourism amongst Belgians, being a
chosen destination of 24% of Belgian day-tourists (Vanden Brouck 2008) both in the summer and
in the winter. Middelkerke and Bredene in the Oostende SA are also amongst the most popular
sites. Middelkerker attracts 5% of day-tourists during summer and 6% of day-tourists during the
winter. Bredene attracts around 5% of day-tourists during the summer but around 1% during the
winter. In total, Oostende SA accounts for 35% of total day-tourists to the Belgian coast during
summer and approximately 30% of the total to the Belgian coast during the winter. These
represent significant flows of people into the coastal regions.
It is estimated that around a third of the Flemish population goes at least once to the coast
during the summer. This number in winter time is one fifth. The coast is less popular area for the
population of Brussels and Wallonie regions, with 10.5% and 15.9% respectively in summer and
7.2% and 8.9% respectively in winter (Vanden Brouck 2008). It is estimated that around 18.1
million day-tourists visited the coast in 2009. The peak estimate was in 2003 with 18.9 million
visitors (Figure 2.4) (Vandaele & Callens 2010).
- 44 -

Xuan-Quynh LE, et al., […] DPSIR Framework for Case Studies in Oostende and Brugge, Belgium
Figure 2.4. Evolution of day-tourists 1997-2009 (Vandaele & Callens 2010).
On the busiest day at the coast there were around 250,000 day-visitors and around 350,000
visitors that stayed overnight (Vandaele & Callens 2010). Around one third of the total day-
tourists visit the coast during the summer (July-August). The rest are spread throughout the year.
Most of the day-tourists come to the coast in private cars (Figure 2.5). Only 12% of the visitors
come with the trains (Vandaele & Callens 2010). They generate considerable congestion on
particular routes to and within the coastal region, especially in summer.
Figure 2.5. Number of day-tourists to the coastal communes in 2008, divided by mode of transport
(Westtoer 2010).
- 45 -

SECOA, Vol. 6. Environmental Stresses and Resource Use in Coastal Urban and Peri-Urban Regions
3.1.3. Harbours
Zeebrugge is internationally renowned as a deep-sea port which can accommodate biggest vessels
regardless of the tide. The port continually grows and changes with new infrastructure added to
generate additional traffic and improve competition. The trends in the recent years (1996-2009) show
that although cargo throughput in Zeebrugge grows year after year, even while the number of ships
calling at the port is lightly decreasing. The port receives more and more ULC (Ultra Large Carriers -
which have more than 10,000 TEU on board).
The port of Zeebrugge is a rapidly growing port within the range of ports from Hamburg to
Le Havre. Annually, it handles around 45 million tons of goods. The core business consists of unit
loads (roro freight and containers), accounts for roughly three quarters of the total port activity.
Zeebrugge is also a prominent hub for LNG. The sector of conventional cargo, like vegetables and
fruit, is also important for employment and added value.
During the last 10 years, container traffic in Zeebrugge has more than doubled, even during
the period of the world economic downturn 2007-2009. Zeebrugge is also a leading intra-European
roll-on/roll-off port which offers about 20 freight services chiefly to the British islands, but also
increasingly to Scandinavia, the Baltic region and Southern Europe. The cargo consists of trucks,
(unaccompanied) trailers and roro containers, project cargo and new cars. Zeebrugge also tries to
increase its added-value services, especially for car industry.
In term of passenger transport, the number of passengers on the ferry crossing to North
England and Scotland decreases while the number of cruise passengers is growing steadily. Not only
is the number of visiting cruise ships increasing, but also the size of the ships. In 2004, 40 cruise ships
moored in the outer port of Zeebrugge, representing 67,172 passengers. In 2009 Zeebrugge welcomed
130,000 cruise passengers.
As of 2009, the port of Zeebrugge offers around 28,000 jobs, either directly or indirectly related
to the port. In 2008, the direct employment in Zeebrugge increased with 3.6% (up to 11,111 full-time
equivalents). This increase can be attributed to the maritime cluster where 410 extra full-time
equivalents have been deployed (mainly in the handling of goods). In 2008, the indirect employment
amounted to 16,902 full-time equivalents. This can be divided into 10,714 full-time equivalents in the
maritime cluster and 6,188 full-time equivalents in the non-maritime cluster. Also in this segment the
employment in the maritime sector increased heavily.
About 300 companies are active in the port area of Zeebrugge and Bruges. The data published
by the National Bank of Belgium which relate to the year 2008 show that together, these companies
realize an added value of 951.5 million euros.
- 46 -

Xuan-Quynh LE, et al., […] DPSIR Framework for Case Studies in Oostende and Brugge, Belgium
The economic interest of the port for the region keeps on growing. Today, not less than 28,000
people owe their job directly or indirectly to the port of Zeebrugge.
The modal split of the maritime transport is the division of goods over the various transport
modes by which they are transported from and to the port. The road transport is dominant in
Zeebrugge, but railway transport is also well developed. Currently, Zeebrugge still lacks an adequate
connection with the European inland navigation, which is temporarily compensated through the
deployment of estuary ships.
The strong increase of container traffic largely determines the evolution of the modal split. In
2009 the port handled 25 million tons of containers (2.3 million TEU). At a rough estimate, in 2030 the
western outer port will handle about 5 million TEU. The hinterland for containers is reached by road,
by railway and via navigation.
The port of Oostende, situated in Europe's busiest maritime area, is undoubtedly a versatile
short-sea port. It can accommodate all types of coastal maritime traffic. The port of Oostende started
off as a passenger port around 150 years ago since the establishment of the very first regular service
between the UK and the continent in 1846. There is no dedicated passenger service nowadays, but
Trans-Europe Ferries combines passenger and freight service on its line to Ramsgate.
In the past few years, the expansion of the ro-ro port got the main focus in the modernisation
of the outer port. Nowadays Oostende is an important short sea hub for traffic to the UK. The port
handles about 300.000 ro-ro units per year.
A contemporary passenger terminal and an entirely new cruise quay with a length of 250 m
and a depth of 10 m are important assets, which attract cruise companies to Oostende. Ships berth in
the middle of town and the historical cities of Flanders are within easy reach.
Short sea container lines and feeder services choose Oostende for the excellent facilities, short
transit times and efficient service. Railway lines connect up to the port. The general cargo port is an
essential element in the port activities.
The construction of windmills on the Thorntonbank in the North Sea, has brought an entirely
new industry to the Port of Oostende. The port has invested in a new infrastructure on the East Banks
of the port, which made it possible to construct and transport the windmills to sea. New projects are
planned in the future.
Until 2008 there was a steady increase in the traffic of goods reported in the port. In 2008 they
first reached a total amount off over 8 million ton. This was well within the expected growth rate of
5%. The biggest addition for this was to be found in 'general cargo', mainly minerals, sand and gravel,
with an increase of 14.1%. The main activity at the port, roro-traffic also improved with 4.6%.
Although a positive evolution was expected for 2009, activities plunged, due to the global
economic crisis. Several businesses had a hard time, and one off the biggest players in Oostende on
- 47 -

SECOA, Vol. 6. Environmental Stresses and Resource Use in Coastal Urban and Peri-Urban Regions
the market of roro-traffic, Cobelfort, ceased its activities. The harbor now has to focus on a new
strategic plan, and has to look for new opportunities. The core-business will remain roro-traffic and
bulk goods, but a new addition will by the generation of renewable energy. This offshore industry
will possibly not generate new traffics, but it will bring forward new added value and employment.
Passenger traffic also suffered from the economic crisis. Even though 2007 was a record year,
2008 already had a decrease of 7.3% ending up at 230.000 passengers. From Oostende, tourist cars can
transfer to Ramsgate, also in this sector there is a decline starting from 2008. The directing board of
the harbor is rather pessimistic about the future of passenger traffic at this point, but is working on a
plan, together with the port of Zeebrugge, to attract more cruise ships.
3.2. State and impact
Due to its location on the boundary that exists between sea and land, the coast has a specific ecological
value at sea, on land as well as in the transition zone. The Belgian coast is home for some valuable
ecosystems, such as the beaches and dunes, the coastal wetlands, and the polders and forests.
Although the North Sea is small in surface area in comparison to other oceans and seas, it still
sustains a rich marine life. This is particularly true of the shallow waters and on the bottom of the
Belgian part of the North Sea, which features a wide diversity of animals and plants. In 2010, the
Belgian Register of Marine Species was created by the Flanders Marine Institute (BeRMS). As of
September 2010, only species occurring in the marine environment up till (but not including) the
coastal dune front of the Belgian Territorial Water is included. In total, 2187 species have been
documented. The majority of them are invertebrates with Nematoda being the most abundant group
(472 species). Within the vertebrates, fish and birds are the most abundant of all (respectively 127 and
75 species). Of those 2187 species, 118 are considered to be vagrant, exotic or drift species, which
means they are observed limitedly in the Belgian part of the North Sea without having an established
population here (Vandepitte et al. 2010). Inventories of the species of the coastal zone, including the
salt marshes, mud flats, dunes and the adjacent brackish areas are not available at this moment
(Vandepitte et al. 2010).
On the landside, beaches and the dunes constitute the boundary between sea and land. The
beach reserve "De Baai van Heist" (50 ha) is located on the beach plain created by sand and silt
deposits in the lee of the eastern breakwater of the port of Zeebrugge. The bare beach plain has
developed into a very diverse and dynamic coastal area. Under the lee of the wet beach and some
thin covered beach banks, we now find a 'green beach' with embryonic dunes, silt, salt march and
low dunes.
- 48 -

Xuan-Quynh LE, et al., […] DPSIR Framework for Case Studies in Oostende and Brugge, Belgium
The dunes along the Belgian coast are very vulnerable ecosystems that have only recently
been incorporated into a protection plan.
Within the Flemish Region, grey dunes are important for the conservation of Red List species,
including regionally rare chalk grassland species, e.g. Thesium humifusum, Cirsium acaule and
Asperula cynanchica, or species characteristic of grasslands of dry to moist nutrient-poor soils.
Invertebrate fauna in grey dunes are the most endangered species. Most characteristic dune
invertebrates however, are found in more dynamic habitats such as mobile dunes and young dune
slacks (Provoost et al. 2004).
Older forests along the coast can be found in the dunes and in the transition zone between
the dunes and the polders. The forests were originally planted to protect the agricultural lands in the
hinterland from wind and sands. In the dune forest of De Haan the successive vegetation belts can be
clearly distinguished, from resistant grasses and herbs (marram, fescue, etc.) at high-tide level, to
subsequently bush species (creeping willow, sea buckthorn, elder, etc.) and eventually timber. In the
past, conifer species (common pine, Corsican pine) were planted behind a screen of native deciduous
tree species (oak, maple), but nowadays, they are being replaced by deciduous tree species. The most
important dune forests along the western coast of Belgium are the Calmeynbos, the Doornpanne and
the forest reserve Hannecartbos. Along the eastern coast we can find the dune forests of De Haan and
the Blinkaertbos and the Zwinbosjes in Knokke.
The coastal hinterland mainly consists of polders, land previously reclaimed from the sea by
systematic dyke construction and drainage. The flat polder area is mainly used for agriculture, for the
purpose of which a draining system with sluices and canals has been constructed. The areas with a
higher elevation are largely used as arable land, whereas a number of vast pasturelands featuring a
specific pasture bird fauna can be found in the lower areas.
Table 2.1. Land use changes between 1990-2006 in Brugge SA and Oostende SA.
Categories Brugge SA Oostende SA
Unit: km² 1990 2000 2006 1990 2000 2006
Arable land 127.47 125.97 125.49 77.46 76.97 77.26
Agriculture 315.51 310.98 309.16 78.21 74.81 74.47
Forests 24.65 24.80 24.65 0.00 0.00 0.00
Scrubs & herbaceous land 2.42 5.59 5.76 1.07 1.07 1.19
Beaches, dunes & sand 2.05 2.05 1.26 1.41 1.41 0.61
Wetlands 1.82 1.82 1.77 0.21 0.21 0.83
- 49 -

SECOA, Vol. 6. Environmental Stresses and Resource Use in Coastal Urban and Peri-Urban Regions
From the Table 2-1, it is clear that dunes and wetlands have been swindled. Only scrubs
and herbaceous land is extended (CORINE data). Along the western part of the Belgian Coast,
the grey dune area is decreased by half between 1950s and 1990s, mainly due to urbanization and
scrub encroachment. In addition, grey dunes are subject to internal degradation due to the grass
encroachment. The changes have led to a qualitative shift toward a less specific flora although no
drastic decline in the total number of grey dune species has been recorded (Provoost et al. 2004).
Nowadays coastal forests not only have an important environmental function but are of
an explicit tourist-recreational importance as well. Forests are less easily affected by human
activities than grassy dune areas. In addition, the capacity for walkers, cyclists and horsemen on
the same surface is about 20 times higher than in open agricultural land.
Forests are mainly visited in autumn and in spring because they offer the possibility to
walk out of the wind. This is a major addition to beach tourism in summer as the tourist
infrastructure of the coast can thus be used efficiently during a longer period of the year. For all
these reasons new forests are being planted in the vicinity of the coast. To protect the historical
'open' picture of the polders this is done near urban environments and more precisely in areas
where the scenery is already affected. These forests will replace the forests in the transition zone
between the dunes and the polders. New forests have already been planted near Oostende
(Keignaertbos) and Blankenberge (Zeebos). Other forests are planned near Nieuwpoort and
Knokke.
3.3. Responses
The responses for the Brugge SA and the Oostende SA could be gathered in two groups: 1)
institutional and policy responses and 2) ecosystem protection actions. These two types of
responses will be discussed further below.
3.3.1. Institutional and policy responses
The Belgian coastal zone is managed by different state actors through a various coloration
mechanisms. The management of the coastal area is a matter in which the national (federal),
regional (Flemish), provincial and local (municipal) governments have jurisdictions and
responsibilities. This necessitates close cooperation between federal state and region in
determining coastal policy and management.
Coastal zone management on land falls under federal and regional jurisdiction, whereas
the federal government (barring a few exceptions) is competent for taking management measures
- 50 -

Xuan-Quynh LE, et al., […] DPSIR Framework for Case Studies in Oostende and Brugge, Belgium
at sea. The dividing line between land and sea is formed by the provincial frontier of West
Flanders, which is bounded on the seaward side by the baseline or the mean low-water line along
the coast. However, divergent laws can assign jurisdictions at sea to the Flemish Region. For
example, the Law of 8 August 1988 (B.S. 13 August 1988) provides explicitly for the execution of
activities and works in the Belgian part of the North Sea that are necessary for the exercise of
regional powers (waterways, harbours, coastal defense, pilot services, rescue and towing services
at sea). Jurisdiction for fisheries was also transferred in 2001 from the federal state to the regions.
In order to collaborate in managing the coastal zone, management and cooperation structures
have been set up and gradually evolved.
1990 - Establishment of the North Sea Technical Commission. Preparing and executing
actions that are part of international management conducted for the protection of the marine
environment necessitates consultation between federal and regional bodies. The Interministerial
Conference on the Environment (ICE) of 12 November 1990 set up the North Sea Technical
Commission (MNZ) on an ad-hoc basis, which served as a consultative structure for preparing
and executing the decisions taken in the context of international treaties on the marine
environment. It was placed under the presidency of the Management Unit of the Mathematical
Model of the North Sea (MUMM). This consultative structure is still operating today, now under
the coordination of FPS Environment.
1994 - Informal inter-cabinet Steering Committee for Integrated Coastal Zone
Management was set up. Also under the impulse of NGOs, an informal inter-cabinet steering
committee for integrated coastal zone management was set up in 1994 by the then Flemish
minister for the environment. This was a first attempt at coordination of and consultation for
cross-sector activities with respect to the coastal area. The inter-cabinet steering committee was
composed of political and official representatives from the main federal and Flemish departments
concerned, and the province of West Flanders. This steering committee met three times up to the
end of 2000.
1995 - Establishment of the Coordinating Committee for International Environmental
Policy (CCIEP). This structure was set up through the Cooperation Agreement of 5 April 1995
between the Federal State, the Flemish Region, the Walloon Region and the Brussels Capital City
Region. The North Sea Technical Commission established in 1991 was renamed the North Sea
and Oceans Steering Committee, but continues to prepare the national positions on marine
environmental policy. From then on, the meeting was part of the CCIEP structure, which has a
- 51 -

SECOA, Vol. 6. Environmental Stresses and Resource Use in Coastal Urban and Peri-Urban Regions
permanent character. Since early 2005, the presidency of the North Sea and Oceans Steering
Committee has been taken over by the new Marine Environment UNITF of FPS Environment.
2001 - Establishment of the Coordination Point for Integrated Coastal Zone Management
(ICZM). As a continuation of the TERRA Coastal Zone Management project (see below), in 2001,
in the context of the Objective-2 Coast Programme (European Fund for Regional Development),
an application was submitted for the “establishment and development of a Coordination Point
for Integrated Coastal Zone Management”. Resources were allocated for three years. The partners
in this project were the province of West Flanders (project leader) and Department of Nature
(department of the Environment and Infrastructure) of the Ministry for the Flemish Community.
For the period 2004-2007, in addition to the province of West Flanders and the Department of
Nature, the Department (Waterways) of the Coast signed a new agreement for the continuation
of the Coordination Point. Both departments have a key role in the management of the coastal
zone. In view of the fact that the European Recommendation mainly emphasizes the
environmental aspects of Coastal Zone Management with the objective of pursuing an integrated
national implementation, whereby not only regional but also Provincial and municipal levels are
highly involved, the FPS Environment decided at the end of 2004 to take part in the activities and
to help finance the operation of the Coordination Point for Coastal Zone Management.
2002 - The EU Recommendation 2002/413/EC was approved by the EU Council Environment.
The legal basis of this Recommendation (Article 175 of the Treaty) stipulates that this subject falls
under the Cooperation Agreement between the Federal and Regional governments of 05/04/95.
This Cooperation agreement establishes the way in which the preparation, coordination of the
implementation and reporting in the context of the international environmental policy take place.
In order to fulfill these tasks, there is a broad coordinating structure: the Coordinating Committee
for International Environmental Policy (CCIEP). At the national level, European Recommen-
dation Coastal Zone Management is followed up by a specialized working group, “the North Sea
and Oceans Steering Committee”, of the CCIEP. This Steering Committee is also responsible for
the development of national positions, reporting and coordination of the implementation of other
marine-related international forums (OSPAR, the system of North Sea Conferences, European
Marine Strategy, etc.). In addition, it fulfills an important role, not only as an expertise platform
but also as regards the pursuit of coherence in the Belgian position at international marine
forums.
- 52 -

Xuan-Quynh LE, et al., […] DPSIR Framework for Case Studies in Oostende and Brugge, Belgium
2003 - Belgium given a Minister for the North Sea This minister assumes the political
coordination between the actors involved in the management of Belgian Marine areas.
2003 - Establishment of the Coastguard With a view to improve coordination of the
actions of the Belgian State at sea, a national coastguard was set up in 2003, under the Minister of
Internal Affairs (Royal Decree of 13 May 2003). The “coastguard” structure consists of a policy
body, a permanent secretariat and a consultative platform. Decisions are taken by consensus. In
the exercise of State jurisdictions in Belgian marine areas (the coastguard only operates at sea),
the following federal government departments (FPSs), programming government departments
(PPSs) and ministries concerned: - FPS Public Health, Safety of the Food Chain and the
Environment; - FPS Internal Affairs; - FPS Mobility and Transport; - FPS Finances; - FPS Foreign
Affairs; - FPS Economy, SMEs, Self-employed Persons and Energy; - Ministry of National
Defense. - PPS Scientific Policy; - PPS Sustainable Development. In this system, Flanders was an
observer. Representatives of the Flemish government attended the meetings. In order to achieve
efficient exercise of powers, it is important that these departments can work together and operate
in a coordinated way, can call on each other's expertise as well as on the information that each of
these departments have at their disposal.
2004 - Cooperation Agreement on Maritime Heritage was concluded. A Cooperation
agreement was concluded between the federal government and the Flemish region with respect
to maritime heritage. This Cooperation agreement had the aim of contributing to public
awareness and a more efficient management of the maritime archaeological heritage in the part
of the North Sea bordering Belgium.
2004 - Establishment of the Marine Environment Department within FPS Environment.
FPS Environment established a new Marine Environment Department to follow up inter alia the
above recent developments in a coherent and centralized manner. This department subsequently
also became a partner of the ICZM Coordination Point and in addition contributed to the
financing of this structure.
2005 - Cooperation agreement between the federal state and the Flemish Region as
regards the coastguard. Although in 2003 the Flemish government was already a very active
observer in the context of a Royal Decree (B.S. 17 June 2003), it was thought necessary to widen
cooperation through a Cooperation agreement. The basic principles of this agreement are:
equivalence between the parties, respect by each party for the jurisdictions of the other party and
avoidance of duplicated capital outlay by the optimal use of infrastructure and resources.
- 53 -

SECOA, Vol. 6. Environmental Stresses and Resource Use in Coastal Urban and Peri-Urban Regions
Defining the way in which activities will be organised and the role of the departments concerned
which will take part constitutes future challenges for this “new” coastguard.
3.3.2. Ecosystem protection actions
'Ecosystem vulnerability maps' have been created for the whole Flemish Region to document on
map the units (e.g. ecosystems) or other landscape attributes (e.g. faunistic groups,
geomorphologies, soil, water seepage zones) that are vulnerable by anthropogenic process or
action (Figure 2.6). These units are based on several databases determining the natural value of a
specific area, the presence of important/endangered species and all other biotic and abiotic
parameters. The human activities that can have an influence consist of barrier effect caused by
transport infrastructure, residential and industrial development. Also pollution effects and
general disturbance were put into count. Based on all these parameters, a scoring system was set
up. The darker the coloration, the more vulnerable area is for human alteration.
Figure 2.6. Ecosystem vulnerability map of the East coast (1:190.000). Copyright © 2006 Agentschap
voor Geografische Informatie Vlaanderen.
- 54 -

Xuan-Quynh LE, et al., […] DPSIR Framework for Case Studies in Oostende and Brugge, Belgium
One of the criteria to come to these vulnerability maps is based on the biological value of
an area. Also these maps show that the study areas chosen for the SECOA project are of great
importance for the Belgian coast. Especially the communes surrounding Brugge are of great value
(Figure 2.7). These high biological values mean that some of these areas must be protected under
the European legislation. Practically the whole Belgian coastline has to take the Habitat directive
under consideration for its activities. Large parts in the region of Brugge are home to several bird
populations and are protected by the Bird directive (Figure 2.8).
In Belgium, nature conservation is part of the regional legislation, so a Flemish Ecological
Network (Vlaams Ecologisch Netwerk (VEN) in Dutch) is set up (Figure 2.9). This network
connects and protects ecologically valuable areas in order to minimize barrier effects for fauna
and flora. Much effort is put into this system, but it is not always easy to acquire the necessary
terrains, because of different ownership and other interests. At this point some land in the study
area is already a part of this network.
Figure 2.7. Map showing the biological value of the case studies. Oostende is on the left, Brugge on the
right. A darker green coloration signifies a higher biological value. Red areas are of high faunistic value
(Copyright © 2010 Agentschap voor Geografische Inform).
- 55 -

SECOA, Vol. 6. Environmental Stresses and Resource Use in Coastal Urban and Peri-Urban Regions
Figure 2.8. Map showing areas that fall under the Habitat directive (green) and areas that fall under the
Bird directive (blue).Copyright © 2010 Agentschap voor Geografische Informatie Vlaanderen.
Figure 2.9. Map showing areas that are part of VEN and have a special protective status. Copyright ©
2010 Agentschap voor Geografische Informatie Vlaanderen.
- 56 -

Xuan-Quynh LE, et al., […] DPSIR Framework for Case Studies in Oostende and Brugge, Belgium
In these areas several reserves have been defined to protect their natural values. Most of
them are already a part of VEN, other will receive this status soon. The three largest nature
reserves along the coast are "De Westhoek", "Het Zwin" and "Ter Yde". “Het Zwin” is located in
our study area of Brugge.
Het Zwin is one of the most important nature reserves in Belgium. It has a coastal length
of approximately 2.3 km in the Belgian-Holland border region. About 2 km is located in Belgium,
in the commune of Knokke-Heist. The total area covers 158 ha, out of that 125 ha is in Belgium. It
is made up by dunes, followed by salinated intertidal sandy planes. This intertidal play brings
forward the irregular deposit of sand and clay, giving rise to small undulations. This, in
combination with the tides is the origin of a variety in vegetation; it is like a patchwork of salt
loving plants.
The soil is the habitat of millions of worms, snails and bivalves, an excellent diet for birds.
Numerous birds come here to breed, rest, fly over, etc. Especially during the winter months one
can count over tens of thousands birds here. A large part of the reserve is inaccessible for the
public, but a lot of the area is well visible from a distance, without disturbing the wildlife.
In our study areas, several other, officially recognized, protected areas can be found (Table
2-2, Table 2-3). Some of them are owned by private nature protection groups; while the rest are
under the ownership of the state government.
Table 2.2. Overview of additional nature reserves in the case study area of Oostende.
Name reserve Place Size (ha)
Warande duinen Middelkerke 75
Puidenbroeke (Slijpe) Middelkerke 11,1
Bourgognepolder Oudenburg 5
Zwaanhoek Oudenburg 96
Grote Keynaert Oostende 18
D'Heye Bredene 30
Paelsteenpanne Bredene 13
248.1
- 57 -

SECOA, Vol. 6. Environmental Stresses and Resource Use in Coastal Urban and Peri-Urban Regions
Table 2.3. Overview of additional nature reserves in the case study area.
Name reserve Place Size (ha)
Paddengat Jabbeke 1
Maskobossen Jabbeke 11
Rode dopheide reservaat St. Andries, Brugge 2.4
Zevenkerke St. Andries, Brugge 4
Ter Doest Lissewege, Brugge 18
Kanaalberm Lissewege, Brugge 4
Schobbejakshoogte St. Kruis, Brugge 6
Pilse Zedelgem 0.6
Doeveren Zedelgem 44.3
Plaisirbos Zedelgem 28
Leienmeerse Oostkamp 36
Warandeputten Oostkamp 10
Uitkerkse Polders Blankenberge 275
Fonteintjes Blankenberge 20
Oude stadswallen Damme 46.3
Kreken van lapscheure Damme 2.1
Romboutswerve Damme 13
Sint-Donaaspolder Knokke 2.3
Park 58 Knokke 7
531
4. DPSIR analysis
4.1. The DPSIR analytical framework
As the two case-studies of Oostende SA and Brugge SA share the same coastal strip along the
North Sea, with many similar features as well as management scheme, the two case studies will
be analysed together in one coastal zone unit, as defined by the Belgian Integrated Coastal Zone
Management Point.
Table 2-4 shows the D-P-S-I-R framework and its elements with regard to different coastal
ecosystem in the Belgian coastal zone. Possible indicators are listed to give a comprehensive list
for the assessment of the use of the coastal ecosystems and to narrow to a core list of indicators
that can be used to calculate the Sustainable Use Index (ISU) (see annex).Table 2.4. List of
elements of the D-P-S-I-R for the Belgian coastal ecosystems.
- 58 -

Xuan-Quynh LE, et al., […] DPSIR Framework for Case Studies in Oostende and Brugge, Belgium
Table 2.4. List of elements of the D-P-S-I-R for the Belgian coastal ecosystems.
Ecosystems Driver (driving forces)
Pressures States Impacts Responses
Dunes *Livestock rearing
*Tourism/Recreation
*Water extraction
*Conservation
*Climate Change/Sea Level Rise (CC/SLR)
*Soil degradation
*Over grazing?
*Low biodiversity
*Decrease in area
*Concentration of N and P in the soil
*Water level and groundwater pollution
*Areas under management/protection
(inland and marine)
*Livestock/herds
*Biodiversity/Aliens species
*Uses for tourism (trekking/camping/
cycling/etc.)
*Reduction in area
*Changes in species composition/dynamism
*Changes in soil quality
*Dune Decree
*ICZM
*Areas under management/protectio
n
Beaches (inc.
seawater)
*Tourism
*Near-shore activities (piping, cabling,
shipping, windturbines, etc.)
*Sand supplement
*CC/SLR
*Pollution (beach and
water)
*Erosion
*Seasonal effects
*Solid waste
*Number of beach users/tourists (seasonal?)
*Bathing water quality
*Beach erosion and replenishment activities
*Changes in bathing water
quality based on season
*Changes in beach dynamic (replenishment
or erosion)
*Bathing water quality
control (Flags)
*Beach monitoring and control
(replenishment)
*Clean-up
Wetlands *Tourism
*Water extraction
*Conservation
*Eutrophication
*Reduced diversity
*Reduced area
*Area with good/bad wetlands
*Fragmentation
*Pollution
*Biodiversity
*Area
*Biodiversity Strategy
Forests *Tourism
*Urbanisation/LUC
*Conservation
*Reduced diversity
*Reduced total area
*Fragmentation
*Coverage
*Fragmentation
*Area with good/bad
forest quality
*Biodiversity
*Fragmentation
*Biodiversity Strategy
*Nature protection plan
Polders *Agriculture
*Livestock rearing
*Urbanisation
*Eutrophication
*Salinisation
*Soil degradation
*High specialisation
*Soil quality
*Concentration of N and P in soil/water
*Concentration of other pollutants
*Reduced diversity
Marine
ecosystem
*Transport link
*Fishery
*Oil pollution
*Fish-stock depletion
*Oil pollution
*Fish stocks
*Reduced water quality
*Reduced fishing productivity
*Oil pollution control
*Fishing quota
- 59 -

SECOA, Vol. 6. Environmental Stresses and Resource Use in Coastal Urban and Peri-Urban Regions
Indicators for the Sustainable Use Analysis
Based on the indicator selection process detailed in “Methods and methodology” section,
8 indicators are included in the analysis:
Number of households: IPop
Total overnight-stay: ITour
Number of industries: Iind
Coastal protected area (ha): IPA
Oil pollution at sea - annual number of observation: IOil
Beach water quality: IBWQ
Fish stocks within Safe Biological Limits (number of fish-stocks): IFish
Area of bio-agriculture (ha): IBioAg
In addition to the indicator value, a direction of each indicator was also considered. The
direction of an indicator shows how the indicator contributes to the final index. A negative
direction (-) shows a negative contribution, i.e. reduce the level of sustainability. A positive
direction (+) shows that the indicator helps increase the level of the sustainability.
Number of households is an indicator for the environmental pressure on resources.
Environmental pressure per person increases as the households become smaller (Van Steertegem
2007-2010) as smaller household consume for products (electricity, gas, packaging, etc.) per
person than larger household. The increasing number of households leads to increasing demand
for housing and greater land use.
Total overnight-stay is an indicator on the impact of tourism on resources.
Number of industries units: This indicator reflects local economic changes, which
influence population mobility and determine the type and intensity of demand for environmental
pressures and the use of natural resources (e.g. industrial discharges, traffic, water usage,
demand for office space, land use change etc.).
Coastal protected area (ha) is the first indicator to be chosen to express the sustainability
level in the coastal area. Protected area is widely accepted indicator for Sustainability at the
global, European as well as Flemish scales (UNESCO 2003, European Indicators, MIRA-T series).
The area of protected area shows how important ecosystems, habitats and species are preserved.
It is an indicator of both status and response.
- 60 -

Xuan-Quynh LE, et al., […] DPSIR Framework for Case Studies in Oostende and Brugge, Belgium
Oil pollution at sea is an important indicator as it shows how marine environment is
affected by human activities. Although it cannot show the level of impacts or status, it is a good
indicator for pressure.
Beach water quality (percentage of monitored sites meeting the minimum quality targets)
is an indicator imposed by the EC on its coastal state members. The indicator is used twofold: it
shows the state of the coastal water and beach as well as the pressure of (mostly) tourism on the
coastal water. Systematic monitoring of beach water quality in Europe has been implemented for
the last 15 years and can give a very good picture on the effectiveness of responses towards beach
water pollution.
Fish stocks within Safe Biological Limits (number of fish-stocks): In the North Sea, the
number of commercial fish stocks within safe reference ranges from 2 to 7, including haddock,
herring, mackerelcod, whiting, plaice and sole. For most of the species, fishing pressure is too
high. The objective of fisher management is that all fish stocks stay within the safe limits (CDK
2007).
Area with agro-environmental measures that support biodiversity (Bio-agriculture) (ha):
The agro- environmental measures aim at the development, conservation and restoration of the
nature and landscape within farmland area. The farmers in Flanders get opportunities to sign up
voluntarily for the schemes (Van Daele et al. 2010, Van Steertegem 2009-2010). This includes
biological agriculture/organic farming. As of 2007, there were 15 groups of agro-environmental
measures possible, each subdivided into specific management package. The Flemish government
aims to attain 20% of the agricultural area to be covered by one or more of the agreement packages
(Van Steertegem 2009).
Table 2-5 presents the distribution of indicators according to the stage of the DPSIR
assessment. Most of the indicators allows an assessment of more than one issue. For example,
IPop allows assessing both the Driver and the Pressure of development while IPA shows both
the State, the Impact and the Response. The indicators are spreading quite evenly, allowing an
assessment of all the stage of the DPSIR framework.
- 61 -

SECOA, Vol. 6. Environmental Stresses and Resource Use in Coastal Urban and Peri-Urban Regions
Table 2.5. Classification of selected indicators into D-P-S-I-R categories.
Name of indicators Code D P S I R
Number of households IPop x x
Total overnight-stay ITour x x
Number of industries Iind x x
Coastal protected area (ha) IPA x x x
Oil pollution at sea - annual number of
IOil x
Beach water quality IBWQ x
Fish stocks within Safe Biological Limits (number
IFish x
Area of bio-agriculture (ha) IBioAg x x
4.2. Application of DPSIR and indicators to assess natural resources use in case studies
4.2.1. Analysis of sustainable use of natural resources
Table 2-6 gives the data for each indicator during the period 2001-2007. During this period, the
number of households in the study area increase steadily at the rate between 0.6% to 1.1%, with
the faster rate of increase at the beginning of the decade than later. For the number of overnight-
stays, the data shows a declining trend, with a dip during the period 2002-2004 and slowly
picking up in the period 2005-2006. However, the number of visitors increased during the whole
period.
The number of industrial/commercial firms in general increases during the period 2001-
2007 with a minor dip in 2002-2003, and picks up strongly during 2005-2007.
As for the area of protected status, efforts on implementing a series of protection
measures have resulted to a continual increase in the size of the protected area. The period 2002-
2003 saw an increase of more 25% in the total area under some types of protection. However, the
rate is slowing down recently.
The area of bio-agriculture has reduced dramatically during the last decade, from around
137 ha in 2001 down to 62 ha in 2007.
On the status of beach water quality, monitoring shows that Flemish coast provides a
safe bathing beaches to the tourism industry, with more than 95% of the monitored points meet
the required standard by EU.
- 62 -

Xuan-Quynh LE, et al., […] DPSIR Framework for Case Studies in Oostende and Brugge, Belgium
Table 2.6. Data for different indicators. Code Unit 2001 2002 2003 2004 2005 2006 2007
IPop # of households 159,742 161,441 163,399 165,054 166,477 167,877 168,874 ITour Overnight stays 4,389,371 4,689,989 4,499,571 4,273,651 4,184,464 4,233,157 4,215,398 Iind # of unit 121,189 122,987 122,138 124,450 125,373 128,345 131,010 IPA Ha 1354.92 1417.87 1797.02 2000.36 2032.62 2084.74 2217.87 IOil # of observation 21 29 20 24 3 9 24
IBWQ % 100.00 94.87 100.00 97.44 95.00 95.00 97.50 IFish # of species 1 2 2 1 2 2 2
IBioAg Ha 137.24 137.69 139.39 72.04 63.49 62.58 62.59
Based on the calculation methodology as laid out in the section on “Methodology”,
indicators and Sustainable Use Index were calculated. The results are presented in Table 2-7
“calculation of indexes” in the annex.
4.2.2. Mapping indicators for sustainable resource uses
In this section, various indicators used for the calculation of the Sustainable Use Index are
presented on maps, in an attempt to illustrate the changes and those indicators overtime. Figure
2.10 shows the difference in the areas under bio-agriculture between 2001 and 2007. It is clear that
the bio-agriculture area has reduced dramatically (as also shown in Table 2-6). However, the
break-down by localities shows that bio-agriculture has totally disappeared in the coastal
communes of Oostende, Middenburg and Zuienkerke while there has been a significant increase
in Oudenburg and Damme.
Figure 2.10. Changes in area of bio-agriculture in the study area between 2001-2007.
- 63 -

SECOA, Vol. 6. Environmental Stresses and Resource Use in Coastal Urban and Peri-Urban Regions
Figure 2.11 shows the locations of various protected areas in the study area. Most of the
areas are small and mingle next to urban centers. Most of the Bird Protected Areas (under EU
Bird Directive) lie around the port of Zeebrugge, the most active industrial centre of the region.
Figure 2.11. Areas of protected sites in the study areas.
Figure 2.12 shows the trend in forest fragmentation status between 1990 and 2006. During
this 15-year period, forest in the study area has become more fragmented and patchy. Also the
absolute area of the forest (areas under forest cover) has not decreased, data on forest
fragmentation shows that forest quality has not been maintained, though the change is small at
this stage.
- 64 -

Xuan-Quynh LE, et al., […] DPSIR Framework for Case Studies in Oostende and Brugge, Belgium
Figure 2.12. Forest fragmentation in the study area.
4.3. Assessment of the sustainability of natural resources
To assess the sustainability of the coastal ecosystem, the ISU for the Belgian study area over the
year between 2001-2007 is compared to the following scale:
0 - 0.25 : very unsustainable
>0.25 - <0.5 : unsustainable
0.5 - 0.75 : sustainable
>0.75 - 1 : very sustainable
Calculation of indexes (see Table 2-7) shows that the years 2002, 2004, 2006 and 2007 have
the ISU just below the threshold 0.5 for sustainable use. The worst year was 2004, with the ISU =
0.434 and the best year was 2003 with ISU = 0.717. The sudden change between 2003 and 2004 can
be explained by the very successful tourism activity in 2004, with a surge of tourist coming to the
Belgian coast. In the same year, more fish-stock was recorded at the lower level than the
sustainable threshold.
- 65 -

SECOA, Vol. 6. Environmental Stresses and Resource Use in Coastal Urban and Peri-Urban Regions
Figure 2.13. Trends of different indicators and the Sustainable Index.
Figure 2.13 shows the evaluation of the indicators over time. The two indicators IBWQ
and IBioAg had the highest value in 2001-2003 period but both did not do well recently. The
indicator for Bio- Agriculture has reduced close to zero. Meanwhile, indicator IPA continue to do
well thanks to the continual increase in the size of the protected area. The indicator for fish-stock
IFish is stable over the years with only one dip in 2004.
Overall, the Sustainable Use index ISU fluctuates between 0.43 and 0.72 during the period
2001-2007.
5. Conclusions
The use of the coastal ecosystems in the Belgian case study area is put into an assessment using
the DPSIR framework, which allows a calculation of a Sustainable Use Index based on 8 core
indicators. Due to the fact that the Belgian coastal zone is small and the lack of accessible data for
each type of ecosystem, one-unit analysis was done for the whole study are, which comprises all
available ecosystems which are beach, dunes, polders , wetland and forest.
The assessment was done for the period 2001-2007 using 8 indicators. The final
Sustainable Use Index shows that the use of the coastal ecosystems in the study area is close to
sustainable level, with 3 years out of 7 years assessed have the Index above 0.5. The index for the
other 4 years is below 0.5 but not very low (between 0.434 and 0.491) [see annex].
The trend of the indicators and subsequently the index fluctuated around the sustainable
threshold. However, more research should be done to get to a more conclusive results. The
- 66 -

Xuan-Quynh LE, et al., […] DPSIR Framework for Case Studies in Oostende and Brugge, Belgium
selection of the indicators for the calculation of the Sustainable Use Index is of vital importance
as to which direction the Index will be.
6. References
Agentschap voor Geografische Informatie Vlaanderen: http://www.agiv.be/gis/diensten/geo-
vlaanderen/ . Assessed June – December 2010.
Anderson V. 1991. Alternative economic indicators London, Routledge
Belpaeme K., Konings Ph. (eds.) 2004. The Coastal Atlas Flanders-Belgium. Publication of the Co-
ordination Center for Coastal Zone Management, 100 pp.
Coördinatiepunt Duurzaam Kustbeheer (CDK) 2007. Kust barometer 2007. http://www.vliz.be
/projects/indicatoren/db.php?year=2007
European Environment Agency 2005. EEA core set of indicators — Guide (EEA Technical report
No 1/2005 — ISSN 1725-2237). Luxembourg: Office for Official Publications of the
European Communities.
GOM West-Vlaanderen 2001-2010. West-Vlanderen Ontcijfers. Rapporten 2001-2010.
Gunst C., Vanden Broucke L., Verhaeghe A. 2008. Tweede verblijven in breedbeeld. Toerisme,
WES. IN West Vlaanderen Werkt 3: Dossier Kusttoerisme, 2008.
Hens L. (ed.) 2000. Human Ecology Course Reader. VUB.
Lokalestatistieken. http://aps.vlaanderen.be/lokaal/lokale_statistieken.htm. Accessed Oct 2010-
Jan 2011.
Provoost, S., Ampe, C., Bonte, D., Cosyns, E., Hoffmann, M. 2004. Ecology, management and
monitoring of grey dunes in Flanders. Journal of Coastal Conservation, 2004, Volume 10,
Numbers 1-2, Pages 33-42.
Smeets, E., Weterings, R. 1999. Technical report No 25: Environmental indicators: Typology and
overview. EEA, Copenhagen, 1999.
UNEP and DPCSD 1995. The Role of Indicators in Decision Making. In: Discussion papers on
indicators of sustainable development for decision making. Ghent, Belgium, January 9-11.
Bureau de Plan, Brussels, Belgium.
UNESCO 2003. A reference guide on the use of indicators for Integrated Coastal Management.
ICAM Dossier 1, IOC Manuals and Guides No. 45.
- 67 -

SECOA, Vol. 6. Environmental Stresses and Resource Use in Coastal Urban and Peri-Urban Regions
Van Daele, T., Van Reeth, W., Dumortier, M., Peymen, J. 2010. Biodiversity Indicators 2010. The
State of Nature in Flanders (Belgium). Research Institute for Nature and Forest, Brussels.
INBO.M.2010.3.
Van de Haegen H., Van Hecke E., Juchtmans G. 1996. De Belgische stadsgewesten 1991.
Statische Studiën (104).
Van de Haegen H., Van Hecke E., Juchtmans G. 1996. De Belgische stadsgewesten 1991.
Statische Studiën (104).
Van der Haegen H., Pattyn M. 1979. De Belgische stadsgewesten. Statistisch Tijdschrift (3).
Van Hecke E., Luyten S., 2007. De Belgische stadsgewesten 2001. Algemene directie statistiek en
economische informatie.
Van Steertegem, M. (Ed.) 2007. MIRA-T 2007 Indicator Report - Flanders Environment
Report.Flemish Environment Agency.
Van Steertegem, M. (Ed.) 2009. MIRA-T 2008 Indicator Report - Flanders Environment Report.
Flemish Environment Agency.
Van Steertegem, M. (Ed.) 2009. MIRA-T 2009 Indicator Report - Flanders Environment Report.
Flemish Environment Agency.
Van Steertegem, M. (Ed.) 2010. MIRA-T 2010 Indicator Report - Flanders Environment
Report.Flemish Environment Agency.
Vandaele D., Callens M. 2010. Dagtoerisme aan de Kust - Een stabiele pijler van het
kusttoerisme, 2009. Department of Strategic Planning, Data Management and Research, West-
Flanders Office for Tourism and Recreation.
Vanden Brouck L. 2008. De dagtoerist aan de Vlaamse Kust in 2007. IN West Vlaanderen Werkt
3: Dossier Kusttoerisme, 2008.
Vandepitte L., Decock W.,Mees J. (eds.) 2010. The Belgian Register of Marine Species, compiled
and validated by the VLIZ Belgian Marine Species Consortium. VLIZ Special Publication,
46. Vlaams Instituut voor de Zee (VLIZ): Oostende, Belgium. 78 pp. ISBN 978-90-812900-
8-1
WES 2008. West Vlaanderen Werkt – 3/2008 – N° 224 – 50ste jaargang.
Westtoer 2010. www.westtoer.be. Accessed December 2010.
- 68 -

Xuan-Quynh LE, et al., […] DPSIR Framework for Case Studies in Oostende and Brugge, Belgium
ANNEX
1. Developing index for sustainability assessment of natural resources
Sustainable index is developed base the above indicators, taking into account the direction
of each indicators (either negative or positive). The indicator is calculated using following
formula:
(1)
Where as:
Ii: indicator number i
It: value of the indicator i at certain time of the system
Imax: expected value of the indicator i in the system (or the maximum value during a period)
Imin: minimum value of the indicator i in the system
Equation (1) does not take into account the weight of each indicator as the study does not
have sufficient data to determine the weights. Therefore, all indicators have the same weight in
this study. The index then calculated using following formula with Ci=1: not have sufficient data
to determine the weights. Therefore, all indicators have the same weight in this study. The index
then calculated using following formula with Ci=1: then calculated using following formula with
Ci=1:
(2)
2. Indicators and trends
Table 2.7. Calculation of indexes.
Code It
2001 2002 2003 2004 2005 2006 2007 Ipop 1.000 0.814 0.600 0.418 0.262 0.109 0.000 Itour 0.595 0.000 0.377 0.824 1.000 0.904 0.939 Iind 1.000 0.817 0.903 0.668 0.574 0.271 0.000 IPA 0.000 0.073 0.512 0.748 0.785 0.846 1.000 Ioil 0.308 0.000 0.346 0.192 1.000 0.769 0.192
IBWQ 1.000 0.000 1.000 0.500 0.025 0.025 0.513 Ifish 0.000 1.000 1.000 0.000 1.000 1.000 1.000
IbioAg 0.972 0.978 1.000 0.123 0.012 0.000 0.000 ISU 0.609 0.460 0.717 0.434 0.582 0.491 0.455
- 69 -

SECOA, Vol. 6. Environmental Stresses and Resource Use in Coastal Urban and Peri-Urban Regions
- 70 -

CHAPTER 3.
Assessment of Natural Resources Use for
Sustainable Development: DPSIR Framework for
Case Studies in Mumbai and Chennai, India
Vishwas KALE and Veena JOSHI

SECOA, Vol. 6. Environmental Stresses and Resource Use in Coastal Urban and Peri-Urban Regions
1. Introduction
Coastal wetlands are a critical environmental resource that function as wild life habitat and provide
various ecosystem services. Due to rapid socio-economic development and high population
densities, wetlands are increasingly being subjected to degradation and over-exploitation. The last
3-4 decades have been marked by rapid deterioration of water quality, increased pollution and
consequent loss of wildlife habitat and biodiversity. As a result, the Integrated Environmental
Assessment is one of the lead research topics. For describing the relationships between the origins
and consequence of coastal environmental problems, the DPSIR framework is now being widely
adopted (Kristensen 2004). The focus of this report is specifically on wetlands in two coastal
metropolitan cities of India, namely, Mumbai and Chennai (Figure 3.1).
Figure 3.1. Mumbai and Chennai Metropolitan Regions, India.
- 72 -

V. Kale et al., DPSIR Framework for Case Studies in Mumbai and Chennai, India
2. Materials and methodology
2.1. Sources and data
For both Mangrove Ecosystem in Mumbai Metropolitan Region and Pallikaranai Marshland
Ecosystem in Chennai Metropolitan Region, all the parameters used in the assessment have been
obtained from image processing of the Indian Remote Sensing satellite digital data for the year
1997 and 2008 for all the 111 wards in MMR and the 10 wards in the PML area. As we did not
have data for any other year, we have interpolated the values of these parameter for each wards
by considering the 1997 and 2008 values and assuming that the rate of change in these categories
was uniform. The interpolated values were then used for sustainability assessment of mangrove
ecosystem and marshland ecosystem in 2003 (approximately the mid-point) between 1997 and
2008.
Some data on water and air pollution for Greater Mumbai and ring have been collected
by the Maharashtra Pollution Control Board (MPCB).
Some data from a research conducted by Chandramohan, B. P. and Bharathi, D. (2009)
has also been used.
2.2. Methods
2.2.1. DPSIR Framework
The DPSIR model was used as an analytical framework to trace the changes in coastal wetland
structure and function over time and to look at the drivers of these changes in MMR and CMR.
Within this model, drivers (D) are defined as the underlying factors causing or influencing a
variety of pressures on coastal wetlands. Pressures (P) are defined as the variables that directly
cause the changes in these wetlands. State (S) is the measure of the physical, chemical and
biological condition within the ecosystem. Impacts (I) describe the effects of changes in coastal
wetland area and coverage. And finally, response (R) is defined as the efforts of society (i.e.,
planners, law-makers, NGOs) to solve the problems resulting from changes in wetland function.
- 73 -

SECOA, Vol. 6. Environmental Stresses and Resource Use in Coastal Urban and Peri-Urban Regions
2.2.2. Selection of core indicators
The following parameters have been used to calculate the Sustainability Index
1. Area under mangroves in MMR (see list of acronyms) and area under Pallikaranai
Marshland in CMR (see list of acronyms).
2. As the urban land use in both the cities is mixed and it is not possible to separate the area
under aquaculture, ports and industries, we have calculated the built-up area in each
ward. The built-up area in the coastal wards is a good measure of the wetland area lost
by reclamation. Reclamation is a major threat to the wetlands in both the cities.
3. Area under salt pans in MMR and area under garbage dump yard in PML.
4. The NDVI values, derived from the analysis of the IRS multi-spectral digital satellite data,
with a spatial resolution of 5.8 m (see annex).
2.3. Defining the study area
Mumbai is the gateway of India and the financial and commercial capital of India and thus the
powerhouse of the country. With a total population of about 19 million (2001), it is the sixth
largest city in the world (Munich Re 2005). Mumbai contributes about 33% of the country’s
income tax, 60% of customs duty and 40% of the foreign trade.
Mumbai (formerly, Bombay) is the capital of the Maharashtra State in western India
(Figure 3.1). The MMR extends over an area of 4,355 km2 and comprises the Municipal
Corporations of Greater Mumbai, Thane, Kalyan, Navi Mumbai, Ulhasnagar, Mira Bhayander
and Vasai-Virar; 15 municipal towns; 7 non- municipal urban centers; and 995 villages. The city
rose from being a small fishing hamlet in the 13th century to the modern mega city after the cession
of the Mumbai group of islands to the Portuguese in 1534 and possession of the island by the
British in 1661. In the 19th century, economic and educational development in the first half of the
19th century, the beginning of the first-ever Indian railway line in 1853 and the opening of the
Suez Canal in 1869, established Mumbai as the international port and commercial capital of India.
During the British rule, Bombay was the capital of Bombay Presidency, encompassing much of
the western and central India.
MMR forms a part of the north Konkan coastal lowland that extends from the Arabian
Sea in the west to the Western Ghat Escarpment (or Sahyadri) in the east. Nearly 45% area of
- 74 -

V. Kale et al., DPSIR Framework for Case Studies in Mumbai and Chennai, India
MMR is below 20 m a.s.l. The area under forest and scrubland is ~ 31%. The major observed forest
types are evergreen, semi- evergreen, deciduous and mixed. MMR has five sanctuaries – Sanjay
Gandhi National Park, Tungareshwar, Phansad, Karnala and Tansa. Matheran is one of three
ecological hot spots in India that has been designated as Eco-Sensitive Zones. Wetlands
(including mangroves) cover about 8% of the MMR.
As per Köppen’s climatic classification, the Mumbai area belongs to Am or Aw type. The
mean temperature in Mumbai is ~ 27° C. The mean minimum temperature ranges between 16.4°
C (January) and 26.1° C (May), and the mean maximum temperature varies from 29.3° C (August)
to 33.3° C (May). May is the hottest month and January is the coolest month.
The annual rainfall in Mumbai is about 2422 mm and increases to more than 5000 mm at
Matheran, located in the eastern part. Over 95% of the rainfall is received in the four months of
the southwest monsoon season – June to September. July is the wettest month with 25% of the
annual rainfall. In general, 81 days in a year are wet days. Hail, fog and squall are uncommon in
the Mumbai Region.
As the frequency of tropical cyclones is low in the Arabian Sea, Mumbai region is not
frequently impacted by tropical cyclones and depressions. However, thunderstorms are
relatively frequent and are responsible for localized heavy rainfall. On an average, 20 days in a
year, experience such storms. Most of these storms occur in June and September. One of the most
severe storms was recorded on 26th July 2005, when nearly 945 mm of rain fell in less than 24
hours. Before 2005, some of the highest 1-day rainfalls were recorded in July 1975 (575 mm),
September 1991 (475 mm) and September 1930 (548 mm).
The average population density in MMR is about 4445 persons/km2. Greater Mumbai,
with a population of 11.9 million is the ‘core’ of the metropolitan region. Slum population
constituted about 54% of the total population of Greater Mumbai in 2001. The city is facing severe
problems of air and water pollution, unsatisfactory solid waste and sewage management,
exploitation of wetlands, high traffic volume, insufficient housing, poor infrastructure and severe
economic disparity.
Chennai (formerly, Madras), with a total population of 7.2 million (2001), is ranked as the
fourth largest urban agglomeration in India and is the capital of the Tamil Nadu State in southern
India. Chennai is situated on the eastern seaboard of India (Figure 3.1). The CMR extends over
an area of 1,189 km2 and comprises the Chennai Municipal Corporation, 16 Municipalities, 20
Town Panchayats and 214 villages. The city of Madras (present name Chennai) was a small
- 75 -

SECOA, Vol. 6. Environmental Stresses and Resource Use in Coastal Urban and Peri-Urban Regions
fishing village known as Chennaipatnam, before the British East India Company acquired it in
1639. The laying down of a railway line in 1864 and the completion of the harbour in 1896
converted the non-descriptive village of Chennaipatnam into a flourishing trade and commerce
center in the late 19th century. During the British rule, Madras was the capital of Madras
Presidency. Today, Chennai is recognized as the major export hub in South East Asia and a major
automobile manufacturing center in India.
The Chennai Metropolitan Region is dominated by gentle slopes, and sandy, flat terrain.
Nearly 58% area is below 16 m a.s.l. The Chennai City and the metro area do not have much of
the green cover (< 2%). The two main ecological hot spots in the CMR include the Pallikaranai
Marshland (ca. 500 ha) and the Guindy National Park (area 270 ha).
The climate of Chennai is very hot and humid. The climate type is tropical savanna or Aw
type as per Köppen’s climatic classification. The mean annual temperature ranges between 24.3°
C and 32.9° C. The mean minimum and the mean maximum temperatures are respectively 20.6°
C (January) and 36.6° C (June). The hottest and driest months are April and May. In May, the
maximum temperature can rise to 41° C. The average annual rainfall of the area is 1266 mm. The
maximum annual rainfall (2566 mm) between 1980 and 2006 was recorded in 2005 at
Nungambakkam (Chennai). The average total number of wet days in a year is usually 55. Over
60% of the annual rainfall is received during the winter months (October to December). The
principal source of moisture is the northeast or winter monsoon. Tropical cyclones and
depressions originating over the Bay of Bengal also significantly contribute to the annual rainfall
totals. Heavy rainfall is also associated with thunderstorms, which, on an average, occur on 26
days every year, especially in the month of August, September and October. Thunderstorms are
rare during the northeast monsoon season (December to February). Hail, fog and squall are not
a special feature of the Chennai area.
The average population density in CMR is nearly 6042 persons/km2. Nearly 4.3 million
inhabitants of CMR live in Chennai City, the core of CMR. The slum population constituted about
19% in the city. Apart from the usual problems faced by large Asian cities, such as pollution, over-
crowding and economic disparity, the Chennai Metropolitan Area is facing acute shortage of
water. The shortage of water has reached a critical level in recent years.
- 76 -

V. Kale et al., DPSIR Framework for Case Studies in Mumbai and Chennai, India
3. Natural resources and their exploitation
3.1. Mumbai Metropolitan Region – Mangrove ecosystem
The coastal and offshore environment of Konkan (Mumbai) coast supports rich biodiversity and
has variety of natural ecosystems. The coastal areas of MMR have both living and non-living
marine and coastal resources. The non-living resources include sand, rock, estuaries, creeks, tidal
and mudflats, etc. and the living resources include flora and fauna. Figure 3.2 graphically depicts
the major coastal ecosystems of MMR.
Figure 3.2. Hierarchical analysis of the coastal wetland ecosystems in Mumbai Metropolitan Region.
Tidal flats and mangroves are important ecosystem of MMR.
The main resources of MMR are rocky coastline with many estuaries and creeks, large
areas of mangroves and tidal flats and plenty of marine fish. The shoreline is thus dominated by
rocky coastal habitats between the high and low tide limits and estuarine habitats along the
- 77 -
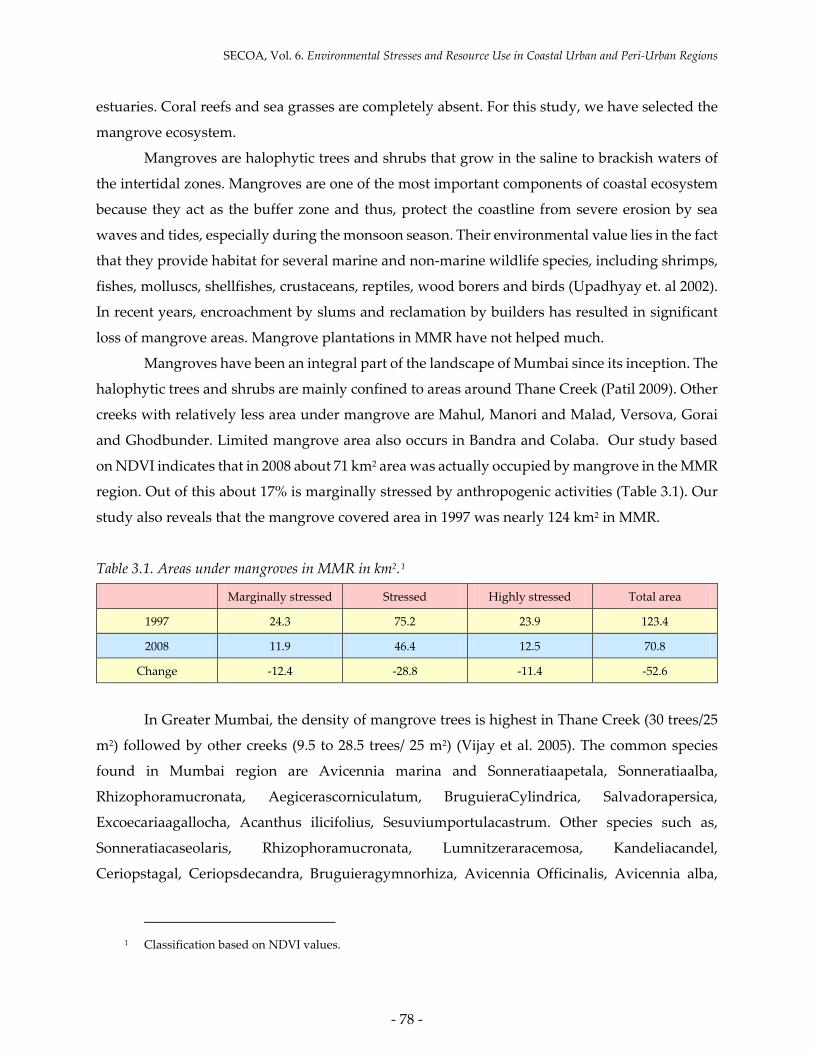
SECOA, Vol. 6. Environmental Stresses and Resource Use in Coastal Urban and Peri-Urban Regions
estuaries. Coral reefs and sea grasses are completely absent. For this study, we have selected the
mangrove ecosystem.
Mangroves are halophytic trees and shrubs that grow in the saline to brackish waters of
the intertidal zones. Mangroves are one of the most important components of coastal ecosystem
because they act as the buffer zone and thus, protect the coastline from severe erosion by sea
waves and tides, especially during the monsoon season. Their environmental value lies in the fact
that they provide habitat for several marine and non-marine wildlife species, including shrimps,
fishes, molluscs, shellfishes, crustaceans, reptiles, wood borers and birds (Upadhyay et. al 2002).
In recent years, encroachment by slums and reclamation by builders has resulted in significant
loss of mangrove areas. Mangrove plantations in MMR have not helped much.
Mangroves have been an integral part of the landscape of Mumbai since its inception. The
halophytic trees and shrubs are mainly confined to areas around Thane Creek (Patil 2009). Other
creeks with relatively less area under mangrove are Mahul, Manori and Malad, Versova, Gorai
and Ghodbunder. Limited mangrove area also occurs in Bandra and Colaba. Our study based
on NDVI indicates that in 2008 about 71 km2 area was actually occupied by mangrove in the MMR
region. Out of this about 17% is marginally stressed by anthropogenic activities (Table 3.1). Our
study also reveals that the mangrove covered area in 1997 was nearly 124 km2 in MMR.
Table 3.1. Areas under mangroves in MMR in km2.1
Marginally stressed Stressed Highly stressed Total area
1997 24.3 75.2 23.9 123.4
2008 11.9 46.4 12.5 70.8
Change -12.4 -28.8 -11.4 -52.6
In Greater Mumbai, the density of mangrove trees is highest in Thane Creek (30 trees/25
m2) followed by other creeks (9.5 to 28.5 trees/ 25 m2) (Vijay et al. 2005). The common species
found in Mumbai region are Avicennia marina and Sonneratiaapetala, Sonneratiaalba,
Rhizophoramucronata, Aegicerascorniculatum, BruguieraCylindrica, Salvadorapersica,
Excoecariaagallocha, Acanthus ilicifolius, Sesuviumportulacastrum. Other species such as,
Sonneratiacaseolaris, Rhizophoramucronata, Lumnitzeraracemosa, Kandeliacandel,
Ceriopstagal, Ceriopsdecandra, Bruguieragymnorhiza, Avicennia Officinalis, Avicennia alba,
1 Classification based on NDVI values.
- 78 -

V. Kale et al., DPSIR Framework for Case Studies in Mumbai and Chennai, India
Aegicerascorniculatum are either endangered or threatened species of mangrove (Sharma et al.
2003; Vijay et al. 2005; other source: Vivek Kulkarni. www.wli-asia- symposium.com). The
associated fauna are Coelenterates: Sea Anemone, Echinoderms – Starfish, Annelids,
earthworms, and molluscs – Shells, Arthropods – crabs, Pisces - Mudskipper fish and sea horses.
Mammals include otter.
Quantitative information on the quality of the ecosystems, area of the habitats within
these ecosystems and changes of these with time are not available. However, due to
anthropogenic activities some of the mangrove species are threatened. The list of the dominant,
endangered and threatened species of mangroves is given below:
Table 3.2. Chennai Metropolitan region – Pallikaranai Wetland Ecosystem.
The coastal and offshore environment of the Coromandel (Chennai) coast also supports
rich biodiversity and has variety of natural ecosystems. The coastal areas of CMR have both living
and non-living marine and coastal resources. The non-living resources include sandy beaches,
coastal dune, etc. and the living resources include flora and fauna. Figure 3.3 gives a descriptive
summary of the major resources in the coastal areas of CMR.
- 79 -

SECOA, Vol. 6. Environmental Stresses and Resource Use in Coastal Urban and Peri-Urban Regions
Figure 3.3. Hierarchical analysis of coastal ecosystems of Chennai. The marshland is an important
ecosystem of Chennai Metropolitan Region. There are no corals or sea grasses along the coast of CMR.
The coastal resources of CMR, include, long sandy beaches, sand dunes, dune ridges and
abundant marine fishes. Beaches and sand dune habitats feature the open coast of CMR. Tidal
flats and mangroves are completely absent in the Chennai Region. So are the corals and sea
grasses. The prominent Marina beach along the Chennai coast is not a natural beach, but was
formed after the construction of Chennai Harbour at the end of 19th century.
However, there is a prominent marshland, which appears to have formed by silting up of
a former coastal lagoon behind a spit or a barrier. The wetland is known as Pallikaranai
marshland (PML) (Figure 3.4). PML is a few meters above the sea level and consists of black mud,
in which many water plants grow. In the 19th century, PML existed as a salt marsh created by the
backwaters of Bay of Bengal. With the construction of Buckingham canal (Figure 3.5) in 1876, the
inflow of sea water virtually stopped, thereafter the copious inflow of rain water turned the
swamp into a freshwater body (Chandramohan and Bharathi 2009).
- 80 -

V. Kale et al., DPSIR Framework for Case Studies in Mumbai and Chennai, India
PML is one of the two major ecological hotspots in the Chennai Metropolitan Area. The
wetland is a low- lying area that is flooded during the northeast monsoon season and is located
in the Kancheepuram District of Tamil Nadu State, southwest of Chennai (Figure 3.5). The partly
saline and largely freshwater wetland extends from the Velachery Road in the east to the
Buckingham Canal in the west. The marshland is characterized by a variety of aquatic grass
species (Figure 3.6) and waterlogged (seasonal and permanent) areas. The most recent flooding
of the marshland and the adjoining residential areas occurred in 2002.
Biodiversity of PML is dominated by over 100 species of plants and various faunal groups,
of which birds, fishes and reptiles are the most prominent. In a recent study, Raj et al. (2010)
recorded the presence of 101 species of resident and migratory birds from the PML. Their study
also revealed that 76 species were breeding residents and 25 winter visitors. About 40 species
were aquatic, while 10 were partly dependent on wetlands. The most common species include
Little Grebe (~ 700) and Black-winged Stilt (~150). According to the workers, the wetland is also
home to nearly threatened bird species such as Spot-billed Pelican Pelecanusphilippensis and
Black-headed Ibis Threskiornismelanocephalus.
Figure 3.4. Map showing location of the Pallikaranai Marshland in Chennai Metropolitan Region. The numbers
show the location of dumping yards and Velachery Rail station and other prominent buildings and institutes.
- 81 -

SECOA, Vol. 6. Environmental Stresses and Resource Use in Coastal Urban and Peri-Urban Regions
Figure 3.5. Google earth image of Pallikaranai Marshland. The Buckingham Canal is also shown. The
prominent plume like feature in the marshland is the garbage dump.
Figure 3.6. Photograph showing the nature of marsh vegetation (grasses) in the Pallikaranai Marshland,
CMR. Note the multi- storied buildings on the margin of the marshland.
- 82 -

V. Kale et al., DPSIR Framework for Case Studies in Mumbai and Chennai, India
The original boundary of the Pallikaranai Wetland was approximately demarcated from
Survey of India (SOI) topographical maps of 1970-71. The 5.8 m resolution remote sensing data
(for post NE monsoon season) were analyzed to derive the area under aquatic vegetation and the
NDVI values. The NDVI values were grouped into three classes – marginally stressed (healthy),
stressed and highly stressed (degraded) vegetation cover (Figure 3.7). The results presented in
Table 3.3 show that the total area covered by vegetation has declined by 3.33 km2 between 1997
and 2008. The area under highly stressed marsh vegetation has almost doubled during this
period. It is important to note that presently the marshland has been invaded by invasive species
such as Prosopisjuliflora and water hyacinth (Care Earth 2010). Using NDVI it is not possible to
distinguish between marshland grasses and water hyacinth.
Table 3.3. Areas under Pallikaranai Marshland vegetation in km2.2
Years Marginally
stressed
Stressed Highly
stressed
Total area covered by
marsh vegetation
Total Area of
PML@
1997 1.71 8.04 0.37 10.86 21.47
2008 1.45 4.88 1.19 7.53 21.47
Change -0.26 -3.16 +0.82 -3.33 --
The morphological changes in the PML are due to growth of residential areas, industries,
IT corridor and garbage dumps. Investigation indicates that the area under garbage dump and
the area impacted by garbage and sewage in 2005 were 57.5 and 137.3 ha respectively (Vencatesan
2007).
The first real effort to assess the environmental status and habitat quality of the
Pallikaranai Marshland was made in 2002, when the Tamil Nadu Pollution Control Board
(TNPCB), commissioned a study to map the extent of the marshland (Vencatesan 2007). The
second attempt to protect the PML ecosystem was made by the Tamil Nadu State government
in April 2007 when the government declared 317 ha of the marshland as reserve forest, and the
responsibility was handed over to the state Forest Department.
In response to a Public Interest Litigation (PIL) by the association of the residents of the
Thoraipakkam and a software company against the Tamil Nadu Government and the Union of
India, the Madras (Chennai) High Court constituted a committee of experts in March 2008. Based
on the recommendations of the committee, the High Court in April 2008 directed the Chennai
2 Classification based on NDVI; @ = based on SOI topographical maps of 1970-71.
- 83 -

SECOA, Vol. 6. Environmental Stresses and Resource Use in Coastal Urban and Peri-Urban Regions
Corporation to establish an integrated waste management facility, remove all encroachments for
the marshland and stop the four municipalities — Pallavaram, Madipakkam, Kottivakkam and
Valasaravakkam — from dumping garbage in the marshland area.
Figure 3.7. Map of PML showing the nature of marsh vegetation. Based on NDVI values derived for 2008.
However, in spite of the public protests and court order, the Chennai Corporation
continues to dump garbage daily, and burn it. The Perungudi Sewage Treatment Plant, located
in the northeast corner, has not improved the situation, as the marshland is believed to be losing
its fresh water characteristic due to letting of untreated sewage water and dumping of garbage.
The burning of refuse is also polluting the air. As a result, it is now believed that the migratory
birds are shifting to other ponds and lakes.
- 84 -

V. Kale et al., DPSIR Framework for Case Studies in Mumbai and Chennai, India
3.2. State and impacts
3.2.1. In Relation to Mangrove Ecosystem
The quality of environment (air, water and soil) has a significant impact on the mangrove forest
ecosystems. Some data on water and air pollution for Greater Mumbai and ring have been
collected by the Maharashtra Pollution Control Board (MPCB). Mumbai City and its environs
suffer from highest degree of pollution in every sector in the whole country. The total estimated
air pollution load is nearly 1500 tons/day in Greater Mumbai. Of this, about 75% is of air pollution
is caused by auto emissions. Groundwater quality data obtained by Central Pollution Control
Board (CPCB) show that the TDS and hardness values are oftentimes above the permissible
limits. Amongst the heavy metals, the concentrations of Zn, Fe, Mn Cr and Cd are higher than
the permissible limits. The sewage and industrial effluents from Greater Mumbai, Thane-Belapur
area and other industrial areas have seriously affected the coastal water quality and made it unfit
for any purpose. The deteriorating quality of coastal waters has adversely affected the coastal
and marine ecosystems, including mangroves.
Figure 3.8. Apartments and slum on the margin of mangrove forest in Mumbai (Source: ManasiKakatkar
- Kulkarni. http://coastalcare.org/wp-content/uploads/2010/08/mangroves-mumbai22.jpg).
There are about 2000 slums in Mumbai. Many of the slums are located in, either on the
margins or within the mangrove areas, seriously affecting the quality of environment (Figure 3.8).
- 85 -

SECOA, Vol. 6. Environmental Stresses and Resource Use in Coastal Urban and Peri-Urban Regions
Figure 3.9. Diagram summarizing State, Pressure and drivers in the case of mangroves in MMR.
The available monitoring data on the environmental quality, however, are limited in
coverage, and data on water quality parameters within the mangrove covered areas are not available.
Therefore, here the assessment of the state (S) is based the on the q, where 0 is least human influence
and 5 is maximum human impact (Figure 3.9).
Coastal zones are particularly vulnerable areas due to high population density, livelihood
dependence on coastal resources, and consequently high pressure on these resources. Furthermore,
people in coastal areas are exposed to several types of natural hazards such as the extreme rainfall
event of July 2005 which revealed the vulnerability of people living in the coastal zone of Mumbai.
The impact of changes in the physical and chemical state of the environment is reflected in the quality
of ecosystems and the welfare of human beings (Kristensen 2004).
- 86 -

V. Kale et al., DPSIR Framework for Case Studies in Mumbai and Chennai, India
3.2.2. In Relation to Pallikaranai Marshland
The quality of environment (air, water and soil) has a significant impact on the marshland
ecosystems. No data are available with TNPCB or Chennai Metropolitan Development Authority
(CMDA). According to Chandramohan and Bharathi (2009), the Pallikaranai's ground and
surface water is extremely polluted. The public garbage dumping yards are responsible for the
pollution. Dumping of garbage and letting out of untreated sewage effluents have adversely
affected the water quality. According to the workers, the water quality was affected due to high
concentrations of chloride and electrical conductivity (EC), concentration of chemical oxygen
demand (COD) in the dumping sites is very high. The presence of water hyacinth in the PML is
a clear indication of high degree of water pollution.
Burning of non-biodegradable waste is the main cause of air pollution in the marshland
area. Air Quality studies in 2001 and 2005 at Pallikaranai by a research group revealed high
degree of air pollution in and around PML (Chandramohan and Bharathi 2009). Monitoring data
on the environmental quality are non-existent. Therefore, here the assessment of the state is based
the on degree of anthropogenic impact, where 0 is least human influence and 5 is maximum
human impact (Figure 3.10).
Coastal zones are particularly vulnerable areas due to high population density, livelihood
dependence on coastal resources, and consequently high pressure on these resources. The impact
of changes in the physical and chemical state of the environment of PML is reflected in the quality
of ecosystems and the welfare of human beings. This is to say that the state may have
environmental or economic ‘impacts’ on the functioning of ecosystems, their life-supporting
abilities, and ultimately on human health and on the economic and social performance of society
(Kristensen 2004). According the Care Earth (2010) report, the impact of Drivers and Pressures is
reflected in the loss of marshland. They have identified three broad patterns (Care Earth 2010):
1. Large tracts of the marsh especially those along Thoraipakkam, Pallikaranai and
Perungudi have been reclaimed into terrestrial habitats and converted into residential
colonies.
2. Habitat fragmentation wherein roads, infrastructure, municipal landfills, sewage
treatment facilities, etc have fragmented the marsh into smaller portions and grossly
impacted the natural drainage pattern.
3. Direct impact due to the unscientific manner of addressing flood control, wherein large
tracts of the marsh have been invaded by invasive species of plants notably
Prosopisjuliflora and Water Hyacinth.
- 87 -

SECOA, Vol. 6. Environmental Stresses and Resource Use in Coastal Urban and Peri-Urban Regions
Figure 3.10. Diagram summarizing State, Pressures and Drivers in the case of marshland vegetation in
PML. For details of methodology see Figure 3.11.
- 88 -
V. Kale et al., DPSIR Framework for Case Studies in Mumbai and Chennai, India
3.3. Drivers and pressures
3.3.1. In Relation to Mangrove Ecosystem
According to Kristensen (2004) the primary driving forces for an individual are human needs
(food, water and shelter). Secondary driving forces are the need for mobility (transport) and
entertainment. Drivers are the underlying causes that lead to pressures on wetlands. With over
12 million people in Greater Mumbai and 7.4 million people inhabiting the outer ring, the driving
forces in MMR are enormous. As per the Environment Status Report of Brihanmumbai (BMC
2008), nearly 60% of the population resided in hutments (slums). Dharavi Slum is the biggest
slum of Asia. It is predominantly over a low- lying wetland. There are over 7000 industries in
Greater Mumbai and the road density is high (4.17 km/km2.). There are two major power plants
within Greater Mumbai. About 37% of the population is employed. These demographic and
socio-economic characteristics describe the driving forces.
Figure 3.11 gives the plot of driving forces, approximately estimated on the basis of
population, production and consumption needs. The assessment of drivers is based on its
relevance, where 0 is least important and 5 is highly important.
The quality of environment has a significant impact on the mangrove forest ecosystem.
Driving forces are responsible for human activities such as transportation or agriculture in order
to meet the needs (Kristensen 2004). Consequently, these activities create enormous pressure on
the mangrove ecosystem as described in Figure 3.11. The main types of pressures observed on
mangrove forest are:
• Change in urban land use to residential and commercial areas,
• Growth of slums,
• Felling of mangrove trees for fuel,
• Large scale dumping of solid waste,
• Effluent discharge by industries, and
• Overexploitation of fisheries.
The assessment of pressures is based on its relevance of a factor, where 0 is least relevant
and 5 is highly relevant.
- 89 -

SECOA, Vol. 6. Environmental Stresses and Resource Use in Coastal Urban and Peri-Urban Regions
3.3.2. In Relation to Pallikaranai Marshland
Driving forces are responsible for human activities to meet the needs (Kristensen 2004).
According to several earlier studies carried out by government and NGOs, the PML is facing the
following massive environmental problems (Vencatesan 2007):
• Fragmentation and reclamation of marshland for urban development.
• Marshland has become the site for garbage dump for south Chennai.
• Disposal of partially treated or untreated sewage in the marshland.
• Loss of habitat due to reclamation and garbage dump.
Consequently these activates create enormous pressure on the marshland ecosystem as
described in Figure 3.12. The assessment of pressures is based on its relevance, where 0 is least
relevant and 5 is highly relevant.
Drivers are any natural (biophysical) or human-induced (socio -economic) factors that
lead directly or indirectly to a change in the wetland ecosystem. With over 4.5 million people in
Chennai and 4.4 million people in the outer ring the driving forces around PML are enormous.
Nearly 19% of the population resided in hutments (slums). About 34% of the population is
employed. These demographic and socio- economic characteristics provide some idea about the
driving forces around PML. Figure 3.12 gives the plot of driving forces, approximately estimated
on the basis of population, production and consumption needs. The assessment of drives is based
on its relevance, where 0 is least important and 5 is highly important (Figure 3.12).
3.4. Responses
3.4.1. In Mumbai
Here, the ‘response’ by society or law makers is the result of an undesired impact and can affect
any part of the chain between driving forces and impacts on mangrove forest, within MMR. All
mangroves are protected under Coastal Regulation Zone Notification (2011). They are protected
legally under the following Acts in Mumbai:
- 90 -

V. Kale et al., DPSIR Framework for Case Studies in Mumbai and Chennai, India
• Maharashtra Felling of Trees (Regulation) Act, 1964.
• Maharashtra Tree Act of 1975.
• Forest Conservation Act 1980.
• Environment Protection Act 1986.
• Coastal Regulatory Zone Notification (2011).
Before 1964 there were no laws of a substantive nature, which would serve as a deterrent
to the destruction of mangroves. In 1964, the Maharashtra Felling of Trees (Regulation) Act was
enacted. The mangroves are protected under this Act.
Further, in 1991 the Coastal Regulation Zone (CRZ) Notification was set in place under
the stringent provisions contained in the Environment Protection Act 1986. Under provisions of
this CRZ Notification, the areas, which were occupied by mangroves, were classified as being in
CRZ-I. This classification made the place very restrictive. In such areas, only those activities,
which were related to ports and harbours and those allied with them, were permitted to be
constructed. All other activities were banned. Any violation of these would not only lead to the
undoing of the construction but also that could lead to penal consequences for imprisonment of
up to 5 years, as provided for under section 15 of the Environment Protection Act, 1986.
Under the new CRZ Notification (2011) mangroves have been classified as “ecologically
sensitive areas” and it is clearly stated in the notification that in case the mangrove area is more
than 1000 m2, a buffer of 50 m along the mangrove shall be provided. However, in spite of these
Acts, systematic hacking of the trees has continued in MMR and elsewhere to clear land for the
construction of multi-storied apartment complexes and other structures. As a result, the
mangrove forests have fast depleted. In this regard, the judiciary again came to the rescue of this
important ecological resource.
In 2005, the Bombay (Mumbai) High court banned destruction of mangroves in
Maharashtra and construction within 50 m of CRZ area. Mangrove Society of India (MSI) and
Conservation Action Trust (CAT) have fought for the conservation of mangrove in Mumbai. The
court has also directed to notify Mangrove areas as protected forests. Hearing Public Interest
Litigation (PIL) filed by the Bombay Environmental Action Group (BEAG) for the conservation
of mangrove, the court put a complete stop to all non-forest activities. Following the court's
orders, the Maharashtra State Government has protected around 5,557 ha of mangrove areas in
Mumbai and Navi Mumbai.
- 91 -

SECOA, Vol. 6. Environmental Stresses and Resource Use in Coastal Urban and Peri-Urban Regions
Though the city’s mangrove cover is shrinking and under threat, the police are yet to take
action on the 23 complaints registered with them since 2005 till date (Hindustan Times, Mumbai,
May 03, 2011) alleging the destruction of this important coastal vegetation, reveals a recent Right
to Information (RTI) query. Complaints are often made by residents who spot the mangrove
being destroyed, so the offenders are often unidentified. The RTI query filed by CAT, reveals that
the police have not identified offenders in 22 of the cases.
Mangrove Conservation Centre: the western bank of the Thane Creek is the single largest
mangrove belt in Mumbai. A substantial tract of mangrove land is adjoining the Godrej & Boyce
Township, Pirojshanagar, in Vikhroli a suburb of Mumbai. The mangrove flora of Pirojshanagar
is well diversified. There are 16 species of mangroves and mangrove associates. The faunal
composition in the area is also equally diverse. Vast area under mangrove has been conserved by
Soonabai Pirojsha Godrej Marine Ecology Centre (SPGMEC). Well diversified and well protected,
these are the last-quality mangroves in the city. The vast expanse of these mangroves serves as a
second lung of the city only after the Sanjay Gandhi National Park which is under immense
environmental pressures.
The SPGMEC has undertaken several measures to protect these mangroves as a part of
environmental and social responsibility. One of the major objectives of the centre is conservation
of the marine diversity (mangrove ecosystem) through research, education/awareness building
and regular monitoring. Simultaneously, centre is engaged in the propagation of various species
of mangrove, developing theme parks on medicinal plants and rare endemic plant species, palms
amongst others.
3.4.2. In Chennai
Here, the ‘response’ by society or law makers is the result of an undesired impact and
can affect any part of the chain between driving forces and impacts on marshland. The process of
removing encroachments has already started in this wetland area and plans are being made to
declare the reserved land as reserved forest. "Declaration of an area as reserved forest” is done in
two phases. In the first phase:
• The area is declared as a reserved land under Section 4 of Tamil Nadu Forest Act. After
this, forest officials survey the area and evict all encroachments in the area.
• Once the area is cleared of illegal structures, it is declared a reserved forest under Section
14 of Tamil Nadu Forest Act.
- 92 -

V. Kale et al., DPSIR Framework for Case Studies in Mumbai and Chennai, India
About 317 ha land in Pallikaranai was declared reserved land in 2007 and the process is
now on to declare it as a reserved forest area.
In response to a Public Interest Litigation (PIL) by the association of the local residents
and a company against the Tamil Nadu Government and the Union of India, the Madras
(Chennai) High Court constituted a committee of experts in March 2008. Based on the
recommendations of the committee, the High Court in April 2008 directed the Chennai
Corporation to establish an integrated waste management facility, remove all encroachments for
the marshland and stop the four municipalities — Pallavaram, Madipakkam, Kottivakkam and
Valasaravakkam — from dumping garbage in the marshland area. However, in spite of the public
protests and court order, the Chennai Corporation continues to dump garbage daily, and burn it.
The Perungudi Sewage Treatment Plant has not improved the situation.
In recent times, concerted efforts have been made to save the Pallikaranai marshland. In
this regard, the local residents, NGOs and naturalists have been making a list of representations
to the concern organizations. Some of the organizations involved are:
• The Madras Naturalists Society (MNS) and Care Earth,
• Save Pallikaranai Marshland Forum and
• Exnora and Pasumai Thayagam.
Such activism seems to have nudged the Environment Ministry into action. The
committee's report is: Withdraw the remaining area from the Corporation's control, (b) Declare
the entire remaining area a sanctuary for wetland birds, (c) Reclaim alienated areas and carry out
afforestation, and (d) The Corporation has to shift its garbage dump to some other location. The
committee has also requested the Central (Federal) Government to speed up inclusion of the PML
in the National Wetlands Conservation Program. Construction of a sewage treatment plant at
Velachery is one of the other recommendations. Similar recommendations were made by another
committee of experts from the Salim Ali Centre for Ornithology and Natural History.
Demanding immediate declaration of the Pallikaranai Marshland as a protected area, the
Save Pallikaranai Marshland Forum (SPMF) staged a hunger strike in October, 2004. The main
demands of the SPMF were that – (a) the Chennai Corporation and the Alandur Municipality
should stop dumping non- segregated garbage, (b) dumping yard should be relocated to an
abandoned quarry, (c) the existing canal should be cleaned and dredged to facilitate the draining
of flood waters, (d) constitution of a `Wetland Authority' for identifying and protecting all water
bodies in the State, and (e) supply of protected drinking water supply to the residents of Mylai
Balaji Nagar.
- 93 -

SECOA, Vol. 6. Environmental Stresses and Resource Use in Coastal Urban and Peri-Urban Regions
4. DPSIR analysis
4.1. Mumbai
In the case of mangrove ecosystem in MMR, based on the principles for indicator development
and the available data for each indicator, the following core indicators were selected for the
calculation of sustainability index:
• Indicators of built-up area (includes, mixed residential and industrial area, slum areas,
port and harbour area, fish landing sites). The built-up area was selected because this is
the major threat to mangroves (D and P).
• Indicators of salt-pan areas. No data on the aquaculture ponds (P) are available. Therefore,
it is assumed that the aquaculture ponds constitute a part of the salt pan areas)
• Indicators of mangrove coverage (S) using NDVI from remote sensing data
Due to paucity of data about other indicator (pollution, etc.) within the mangrove
ecosystem in Mumbai, these indicators have been excluded from the calculation of sustainability
index.
Figure 3.11 gives the DPSIR framework of mangrove ecosystem in Mumbai and Table 3.4
summarizes the DPSIR for mangrove ecosystem in Mumbai.
Figure 3.11. DPSIR frame for the Mangrove ecosystem in coastal wetlands of Mumbai Metropolitan
Region. Built-up area development Salt pans Coastal industrial
development
Driving force
Pressure
State
Impact
Response
Increase of built-up area
Increase of saltpan area
Increase of coastal industrial area
Change of area Change of coverage Decrease of biodiversity
Loss of mangrove forest
Coastal Regulation Zone
Marine and coastal
protected area
Area of mangrove replantation
Pollutant increase
- 94 -

V. Kale et al., DPSIR Framework for Case Studies in Mumbai and Chennai, India
Table 3.4. DPSIR Mangrove ecosystem in Mumbai Metropolitan Region.
DPSIR Indicators Description/Remark
Drivers (D) Salt Pans Presently about 25.64 km2 area is under salt pans in MMR
Sea Ports There are two major ports -
Mumbai Port Trust covers an area of 46.3 ha. In 2007- 08, 5830 ships visited the port. In the same year the port handled about 57 MT cargo traffic.
JNTU Port Trust covers an area of 2500 ha. The port handled 57.3 MT cargo in 2008-09.
Coastal Industrial
Areas
There are many industries and industrial estates in the coastal
areas, but they are mixed with residential and other commercial areas. Information about number, revenue etc. are not available
Slums Large slums are present on the margins or within mangrove
covered areas
Pressure
(P)
Pollutant increase MPCB collects data about air and water pollution. There is
strong evidence that the river and coastal waters are highly polluted and not fit for any purposes (not even swimming and recreations)
Aquaculture pond No data are available
Increase in port
area
There is some increase but no data are available
Increase in
industrial area
There is significant increase, particularly along Thana Creek, but
no data are available.
State (S) Change of area The area under mangrove has declined from 124 km2 in 1997
to about 71 km2 in 2008 as per NDVI analysis.
Coverage change In 1997, 20% area of mangrove area was marginally stressed.
But in 2008 the area had declined to 17%.
Change in
biodiversity
Biodiversity has been severely impacted but no quantitative
data are available.
Impact (I) Loss of Mangrove
forest
NDVI analysis reveals significant loss of about 50 km2 area
under mangrove in the last decade
Decrease of nursery ground
No information available
Decrease of
biodiversity
Biodiversity significantly affected but no data available.
Response
(R)
Wetland Protected
area
5,557 ha of Mangrove areas in Mumbai and Navi (New)
Mumbai has been protected by government.
CRZ Notification (1991 and 2011) mangrove are classified in
Zone I and are completely protected
Ecological
compensation
No information or data available.
- 95 -
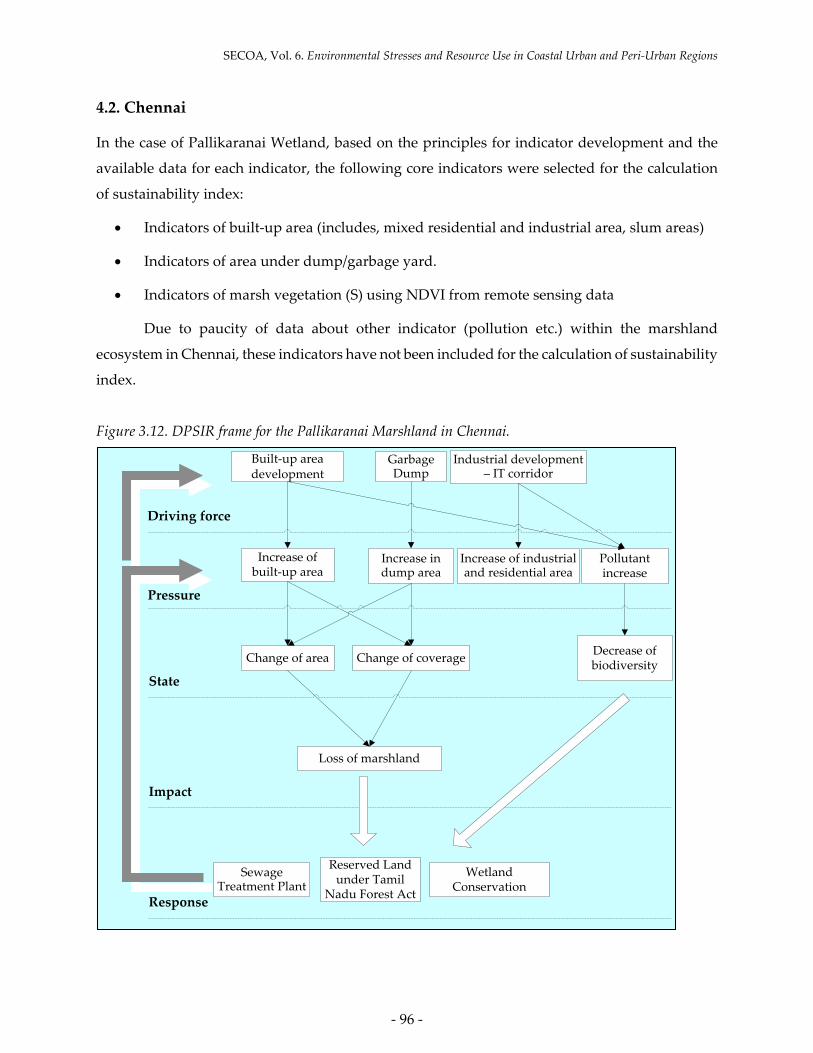
SECOA, Vol. 6. Environmental Stresses and Resource Use in Coastal Urban and Peri-Urban Regions
4.2. Chennai
In the case of Pallikaranai Wetland, based on the principles for indicator development and the
available data for each indicator, the following core indicators were selected for the calculation
of sustainability index:
• Indicators of built-up area (includes, mixed residential and industrial area, slum areas)
• Indicators of area under dump/garbage yard.
• Indicators of marsh vegetation (S) using NDVI from remote sensing data
Due to paucity of data about other indicator (pollution etc.) within the marshland
ecosystem in Chennai, these indicators have not been included for the calculation of sustainability
index.
Figure 3.12. DPSIR frame for the Pallikaranai Marshland in Chennai.
Built-up area development
Garbage Dump
Industrial development – IT corridor
Driving force
Pressure
State
Impact
Response
Increase of built-up area
Increase in dump area
Increase of industrial and residential area
Change of area Change of coverage Decrease of biodiversity
Loss of marshland
Sewage Treatment Plant
Reserved Land under Tamil
Nadu Forest Act
Wetland Conservation
Pollutant increase
- 96 -

V. Kale et al., DPSIR Framework for Case Studies in Mumbai and Chennai, India
The following table summarizes the DPSIR for marshland ecosystems in Chennai. Table
3.5 gives the DPSIR framework of marshland ecosystem in Chennai.
Table 3.5. DPSIR Pallikaranai Marshland Ecosystem.3
DPSIR Indicators Description/Remark
Drivers (D) Residential area New residential areas are coming up rapidly around the
Marshland
Coastal Industrial Areas There are a few industries (commercial and IT) in the peripheral areas, but information about number, revenue etc. are not available
Slums Some slums are present on the margins of marshland
Pressure (P) Pollutant increase There is strong evidence of air and water pollution in the PML
due to dumping of municipal solid waste and construction debris and disposal of untreated sewage water
Garbage Dumping Yard The area under garbage dump and the area impacted by garbage
And sewage in 2005 were 57 and 137 ha respectively
Landfilling There is significant increase but no data are available. Many of
the new residential and commercial establishments are coming
up by landfilling
Increase in industrial and
commercial area
There is significant increase but no data are available.
Increased network of
roads
Multiple roads have fragmented the marshland
State (S) Change of area In 1997 the marsh vegetation covered 10.86 km2 this area
declined to 7.53 km2 in 2008
Change in biodiversity Biodiversity has been severely impacted but no data are
available.
Impact (I) Loss of marshland Significant loss. About 3300 ha area under marshland vegetation lost in the last decade
Decrease of biodiversity Biodiversity significantly affected but no data available.
Response
(R)
Wetland Protected area 317 ha land in Pallikaranai was declared “Reserved Land”
in 2007 by the government. Establishment of Perungudi Sewage Treatment Plant to treat sewage water and reduce pollution.
Ecological compensation No information or data available.
3 Interpretation partly based on Vencatesan (2007), Chandramohan and Bharathi (2009) and Care Earth (2010).
- 97 -

SECOA, Vol. 6. Environmental Stresses and Resource Use in Coastal Urban and Peri-Urban Regions
5. Conclusions
DPSIR, which stands for Drivers, Pressures, State, Impact, and Responses, is an analytical tool
that has been used in this study to understand the causes of changes in wetland ecosystems and
their subsequent impacts, in order to formulate the most appropriate responses.
Mumbai and Chennai are two of the fastest growing metropolitan cities in India. As a
result, phenomenal human population growth and the concomitant socio-economic
development are undoubtedly the two major drivers (D). These two main drivers have been
responsible for variety of pressures on the wetlands in the two cities. This report focuses on major
anthropogenic pressures on mangroves in Mumbai Metropolitan Region and on the Pallikaranai
Wetland in Chennai Metropolitan Region. The pressures (P) include land resource exploitation,
urbanization, industrialization and other development activities. Such activities have led to
changes in the physical, chemical, and biological conditions (S) within the wetlands, which has
led, in turn, to negative ecological and socio-economic impacts (I) including increased threat of
seawater and rainwater flooding, degradation of marine and coastal habitats and decline in
fishery production. The response (R) to these changes include, monitoring of air and water
pollution, control on effluent discharge and municipal solid waste dumping, strict
implementation of laws to curb further landfilling and reclamation of wetlands and intervention
by high court to stop felling of mangrove trees and occupation of wetlands by builders and slums.
In recent times, the public’s environmental protection awareness has increased
remarkably in the two cities. Several non-governmental organizations (NGOs) have taken lead in
collecting valuable information about existing flora and fauna as well as in putting pressure on
the concern government departments for the conservation and protection of wetlands in both the
cities. Sometimes the NGOs have approached the High Court for the protection of wetlands or
have resort to agitation.
In this study, drivers (D), pressures (P), state (S), impacts (I) and response (I) indicators
were used to assess the changes in the wetlands in the two cities. The state of the mangroves in
Mumbai and the marsh vegetation in Pallikaranai wetland were assessed by calculating the NDVI
values for 1997 and 2008. Our analysis reveals that in 2008 about 71 km2 area was occupied by
mangroves in the MMR region. Out of this about 17% is marginally stressed by anthropogenic
activities. Our analysis also reveals that the mangrove covered area in 1997 was nearly 124 km2.
Similarly, in the case of Pallikaranai Marshland, the results indicate that the total area covered by
marsh vegetation has declined by 3.33 km2 between 1997 and 2008. In 1997 the marsh vegetation
- 98 -

V. Kale et al., DPSIR Framework for Case Studies in Mumbai and Chennai, India
covered about 10.5 km2 area. The area under highly stressed marsh vegetation show significant
increase during this period in PML.
Calculation of the sustainability for the mangroves in MMR indicates that the mangrove
ecosystem is undergoing degradation in the metropolitan region as a whole. In 1997, the
mangrove ecosystem was sensitive, because the sustainability index (Imst) was just above 0.5.
However, since then, the Imst values have gone significantly below 0.5 implying that since the
turn of the century the mangrove ecosystem in MMR has shifted from near-sensitive state to
unsustainable condition. Similarly, calculations indicate that the PML wetland ecosystem is also
undergoing degradation, which is not totally surprising. In 1997, the marshland ecosystem was
sustainable, because the index was above 0.5. However, the Imvst values have gone close to 0.5
in 2008 implying that the marshland system is shifting towards the state of unsustainability.
Presently the marshland ecosystem is in the unsustainable state. Therefore, unless some drastic
measures are taken the situation will get completely out of hand. One point to be noted in the
case of PML is that the marsh vegetation sustainability index (Imvst) values for 2008 may be an
overestimate. This is because, presently, the marshland has been invaded by invasive species of
plants such as water hyacinth. The water hyacinth, which is floating vegetation, cannot be
distinguished from the marshland vegetation on the basis of NDVI values. Therefore, the NDVI
values are inflated and so is the sustainability index for 2008. So the area under unsustainable
condition in PML may be even higher.
On the whole, the state of the mangroves in Mumbai and the marshland in Chennai is
going from bad to worst and the negative impacts are becoming more severe. Although human
efforts to protect the coastal wetlands have been put into practice, there still seems to be a long
way before the goal of sustainability can be achieved.
- 99 -

SECOA, Vol. 6. Environmental Stresses and Resource Use in Coastal Urban and Peri-Urban Regions
6. References
BMC 2008. Environment Status of Brihanmumbai 2008-09; Brihanmumbai Metropolitan
Corporation, Mumbai.
Care Earth 2010. Adaptive Management Plan for the Conservation of Pallikaranai Marsh. Report
prepared by Care Earth and City Connect, Chennai. http://www.scribd.com/doc/
54187332/pallikaranai-marsh-management-plan
Chandramohan, B. P. and Bharathi, D. 2009. Role of public governance in the conservation of
urban wetland system: a study of Pallikkaranai Marsh. Indian Society for Ecological
Economics (INSEE), 5th Biennial Conference January 2009.
Kristensen, P. 2004. The DPSIR Framework. Paper presented at the workshop on a
comprehensive / detailed assessment of the vulnerability of water resources to
environmental change in Africa using river basin approach. UNEP Headquarters,
Nairobi, Kenya27-29 September 2004
Munich Re 2005. Megacities – Mega risks trends and challenges for insurance and risk
management. Munich, Germany
Patil, B. N. 2009. Coastal Ecosystem Management in Maharashtra Proceedings of National
Seminar on Coastal Ecosystem Management, Keralapp.36-43.
Raj, P. P. N., Ranjini, J., Dhanya, R., Subramanian, J., Azeez, P. A. and Bhupathy, S. 2010.
Consolidated checklist of birds in the Pallikaranai Wetlands, Chennai, India. Journal of
Threatened Taxa, v. 2, pp. 1114-1118.
Sharma, R. M. Joshi, P. V. and Shindikar, M. 2003. First report of plant gulls (zoocecidia) from
mangrove swamps of Vikhroli, Maharashtra. Zoos’ Print Journal, v. 18, pp. 1217-1219.
Upadhyay, V. P., Ranjan, R. and Singh, J. S. 2002. Human–mangrove conflicts: The way out.
Current Science, v. 83, pp. 1328-1336.
Vencatesan, J. 2007. Protecting wetlands. Current Science., v. 93, pp. 288.290.
Vijay, V., Biradar, R. S., Inamdar, A. B., Deshmukhe, G., Baji, S. and Pikle, M. 2005. Mangrove
mapping and change detection around Mumbai (Bombay) using remotely sensed data.
Indian Journal of Marine Sciences, v. 34, pp. 310-315.
- 100 -

V. Kale et al., DPSIR Framework for Case Studies in Mumbai and Chennai, India
ANNEX
1. List of Acronyms and Units
a.s.l. Above sea level
BEAG Bombay Environmental Action Group
BMC Brihanmumbai (Greater Mumbai) Municipal Corporation
CMDA Chennai Metropolitan Development Authority
CMR Chennai Metropolitan Region
CPCB Central Pollution Control Board
CRZ Coastal Regulation Zone
DPSIR Driving forces-Pressures-State-Impact-Response
ha Hectares
IRS Indian Remote Sensing Satellite
Ist Sustainability index
LISS Linear Imaging Self-Scanning Sensor
MPCB Maharashtra Pollution Control Board
MMR Mumbai Metropolitan Region
MMRDA Mumbai Metropolitan Region Development Authority
NDVI Normalized Difference Vegetation Index
PAN Panchromatic
PML Pallikaranai Marshland
SOI Survey of India
TNPCB Tamil Nadu Pollution Control Board
- 101 -

SECOA, Vol. 6. Environmental Stresses and Resource Use in Coastal Urban and Peri-Urban Regions
2. Mapping of wetlands and development of indexes
The remote sensing data have been used for the mapping of wetlands, mangrove covered areas,
the area under salt pans, built-up area, etc. For land use/cover analysis the non-monsoon season
IRS P6 LISS 4MX images (for 2008), with a spatial resolution of 5.8 m, have been used for both the
cities. Because the images covering the entire metropolitan region were not available for the same
date (due to cloud cover and other technical difficulties), sometimes images for the previous or
the following year were also acquired from the National Remote Sensing Center (NRSC),
Hyderabad, India. Since the IRS P6 LISS 4MX images were not available for the pre-2001 period,
the LISS-III images were merged with PAN images for 1997 to derive images with 5.8 m spatial
resolution. Needless to say some over/ underestimation is likely. In the case of 1997 also, cloud-
free images were not available for the same date/month. Therefore, some images for the previous
and following year have also been used. In order to evaluate the temporal changes in wetlands,
data of minimum three different time points were recommended. Since we had data only for 1997
and 2008, the data for 2003 (roughly the mid-point) were simply interpolated for each
metropolitan ward.
The Normalized Difference Vegetation Index (NDVI), one of the most commonly used
vegetation indices, was derived by analyzing the digital data to demarcate the areas under
mangroves in MMR and the marshland in CMR. The NDVI was calculated from these individual
measurements as follows:
………………….1
where, RED and NIR stand for the spectral reflectance measurements acquired in the
visible (red) and near-infrared regions, respectively. The NDVI values were grouped into three
classes – marginally stressed (healthy), stressed and highly stressed (degraded) vegetation cover.
3. Basic Administrative Units
The NDVI values were calculated for all the coastal wards. There are 111 coastal wards in MMR
and the Pallikaranai Marshland falls in 10 wards of the CMR.
- 102 -

V. Kale et al., DPSIR Framework for Case Studies in Mumbai and Chennai, India
4. Mumbai Metropolitan Region - Mangrove Ecosystem
Figure 3.13. Map showing the distribution and location of mangroves in MMR. Based on 1997 and 2008
NDVI. The inset map shows the change.
4.1. Selection and Calculation of Indicators and indexes for Mumbai
Four of the indicators used for sustainability assessment of mangrove ecosystem are explained
below. All the parameters used in the assessment have been obtained from image processing of
the Indian Remote Sensing satellite digital data for the year 1997 and 2008 for all the 111 wards
in MMR. As we did not have data for any other year, we have interpolated the values of these
parameter for each of the 111 wards by considering the 1997 and 2008 values and assuming that
the rate of change in these categories was uniform. The interpolated values were then used for
sustainability assessment of mangrove ecosystem in 2003 (approximately the mid-point) between
1997 and 2008.
- 103 -

SECOA, Vol. 6. Environmental Stresses and Resource Use in Coastal Urban and Peri-Urban Regions
1. Ima (Index of the area of Mangrove ecosystem at time point t)
Ima = It / Imax............................2
2. NDVImt (Index of the average Normalized Vegetation Index of Mangrove ecosystem)
..................3
3.Ibuilt (Index of the area of built-up expansion)
Ibuilt = (Imax-It)/(Imax-Imin)......................4
4. Isalt (Index of the area of salt pans expansion)
Isalt = (Imax-It)/(Imax-Imin)........................5
The above indices were derived for all the 111 wards separately. The total area in the
coastal wards of MMR is given in Table 3.6 for MMR.
Table 3.6. Area under mangroves, built-up area and the area under salt pans in MMR.
Area under mangrove (km2) Built-up area (km2)4 Area under salt pans (km2)5
1997 2003 2008 1997 2003 2008 1997 2003 2008
123.43 97.39 70.79 173.36 184.84 196.42 16.91 21.28 25.64
4.2. Assessment of ecosystem sustainability
Sustainability index is a good measure of the depletion of a resource over time. The index ranges
between 0 and 1. If the index > 0.5 the system is considered to be sustainable. The index values <
0.5 indicate that the system is not sustainable. The ecosystem is considered as sensitive if the
index value is close to 0.5. The different classes of sustainability are as follows:
0.00 – 0.25: very unsustainable
> 0.25 – 0.50: unsustainable
0.50 – 0.75: sustainable
> 0.75 – 1.00: very sustainable
4 Includes mixed residential and industrial area and slums; port and fishing landing site. 5 Includes aquaculture ponds; Note 2003 estimates are based on interpolated values for the wards.
- 104 -

V. Kale et al., DPSIR Framework for Case Studies in Mumbai and Chennai, India
Index for sustainability assessment of mangrove ecosystem in MMR was evaluated by
using the following formula
……………………………6
The sustainability index values (Imst) for mangrove ecosystem in Mumbai Metropolitan
Region for the years 1997, 2003 and 2008 are given in Table 3.7 and the temporal trend is depicted
in Figure 3.14.
Table 3.7. Sustainability Index (Imst) for the whole area of the mangrove ecosystem in coastal
wetlands of Mumbai Metropolitan Region.
Year 1997 2003 2008
Sustainability Index (Imst) 0.56 0.49 0.41
Figure 3.14. Sustainability tendency of mangrove ecosystem in MMR between 1997 and 2008.
It is evident from Table 3.7 that the mangrove ecosystem is showing unmistakable signs
of degradation in the MMR region as a whole. In 1997, the mangrove ecosystem was sensitive,
because it was close to 0.5. However, since then, the Imst values have gone significantly below
0.5 (Figure 3.14) implying that since the turn of the century the mangrove ecosystem in MMR has
shifted from near-sensitive state to unsustainable condition.
- 105 -

SECOA, Vol. 6. Environmental Stresses and Resource Use in Coastal Urban and Peri-Urban Regions
4.3. Mapping critical areas under unsustainable use
Using the classes given under section “assessment of ecosystem sustainability” the wards under
four sustainability classes are shown in Figure 3.15. The map shows that there were some wards
with very sustainable mangrove cover in 1997. However, in 2008 there are none. Further,
mangrove wards with very unsustainable mangrove areas show a remarkable increase in 2008.
Figure 3.15. Map showing distribution of sustainability index for MMR wards with substantial mangrove cover.
5. Chennai Metropolitan Region – Pallikaranai Wetland Ecosystem
5.1. Selection and Calculation of Indicators and Indexes
Four of the indicators used for sustainability assessment of marshland ecosystem are
explained below. All the parameters used in the assessment have been obtained from image
processing of Indian Remote Sensing satellite digital data for the year 1997 and 2008 for all
the 10 wards in the PML area. As we did not have data for any other year, we have
interpolated the values of these parameter for each ward by considering the 1997 and 2008
values and assuming that the rate of change in these categories was uniform. The interpolated
values were used for sustainability assessment of marshland ecosystem in 2003
(approximately the mid-point) between 1997 and 2008.
- 106 -

V. Kale et al., DPSIR Framework for Case Studies in Mumbai and Chennai, India
1. Imv (Index of the area of Pallikaranai marshland (PML) at time point t)
Imv = It / Imax……………………………7
2. NDVImvt (Index of the average Normalized Vegetation Index of Pallikaranai
Marshland vegetation)
………...8
3. Ibuilt (Index of the area of built-up expansion)
Ibuilt = (Imax-It)/(Imax-Imin)…………9
4. Idump (Index of the area of garbage dump expansion)
Idump = (Imax-It)/(Imax-Imin)…………10
The above four indices were derived for all the 10 wards separately. The total area in
the PML wards of CMR is given inTable 3.8.
Table 3.8. Area under marshland vegetation, built-up area and area under garbage dump yard in PML.
Area under mangroves (km2) Built-up area6* (km2) Area under garbage dump yard (km2)
1997 2003 2008 1997 2003 2008 1997 2003 2008
10.87 8.82 7.53 2.37 3.59 4.81 0.34 0.44 0.54
Assessment of ecosystem sustainability is following the classes of sustainability area
applied for MMR mangrove ecosystem.
6. Index for sustainability assessment of marshland ecosystem was carried out by
using the following formula
…………….11
The sustainability index values (Imvst) for marshland ecosystem in Chennai Metropolitan
Region for the years 1997 to 2008 are given in Table 3.9 and the temporal pattern is displayed in
Figure 3.16.
6 Includes mixed residential and industrial area and slums; Note 2003 estimates are based on interpolated
values for wards.
- 107 -

SECOA, Vol. 6. Environmental Stresses and Resource Use in Coastal Urban and Peri-Urban Regions
Table 3.9. Sustainability (Imvst) for the marshland ecosystem in Chennai.
Year 1997 2003 2008
Sustainability index (Imst) 0.666 0.610 0.554
It is evident from the Table 3.9. that marshland ecosystem is undergoing degradation in
the PML as a whole. In 1997, the marshland ecosystem was sustainable, because the index was
above 0.5. However, the Imvst values have gone close to 0.5 in 2008 (Figure 3.16) implying that
the marshland system is shifting towards the state of unsustainability. It is important to note here,
that the Imvst values for 2008 may be an overestimate. This is because, presently, the marshland
has been invaded by invasive species of plants such as water hyacinth (Care Earth 2010). The
water hyacinth, which is floating vegetation, cannot be distinguished from the marshland
vegetation on the basis of NDVI values. Therefore, the NDVI values are inflated and so is the
sustainability index.
Figure 3.16. Sustainability tendency of Pallikaranai Marshland vegetation in CMR between 1997 and
2008. The question mark indicates the possibility of overestimation of the index value due to presence of
water hyacinth and other invasive plants in recent years.
- 108 -

V. Kale et al., DPSIR Framework for Case Studies in Mumbai and Chennai, India
6.1. Mapping critical areas under unsustainable use
Using the classes given under section “Assessment of ecosystem sustainability” the wards under
four sustainability classes are shown in Figure 3.17. The map shows that the area under very
unsustainable marsh vegetation cover has increased remarkably in 2008.
Figure 3.17. Map of the Pallikaranai Wetland showing distribution of sustainability index in 1997 (inset)
and 2008.
- 109 -

SECOA, Vol. 6. Environmental Stresses and Resource Use in Coastal Urban and Peri-Urban Regions
- 110 -

CHAPTER 4.
Assessment of Natural Resources Use for Sustainable
Development - DPSIR Framework for Case Studies in
Palmachim (Tel Aviv Metropolitan Area) and Carmel
Coast (Haifa Metropolitan Area), Israel
Daniel FELSENSTEIN, Michal LICHTER and TsviVINOKUR

SECOA, Vol. 6. Environmental Stresses and Resource Use in Coastal Urban and Peri-Urban Regions
1. Introduction
This study uses the DPSIR (Driving forces-Pressures-State-Impact-Response) analytic framework
to identify the causal chain of mechanisms impacting the sustainable development of two case
study areas in the metropolitan regions of Haifa and Tel Aviv, Israel. While not a formal model,
the DPSIR framework is a way of conceptualizing the links between the forces that cause
environmental stress and to incorporate economic, social and physical causes in one systematic
structure (EEA 2007). This approach, initially outlined by the OECD (1993) as the PSR framework,
highlights the link between human activity and environmental degradation, underscoring the
role of the former in exerting pressure on the environment thereby changing its state and the area
of available natural resources. The societal response to this change occurs through environmental,
economic and social policy which, in turn, feedback to second round changes to the environment
through further (modified) human activity. The DPSIR approach therefore emphasizes the
interactions between man and the environment (nature-society) and is especially useful for
observing land use change in a causal manner. Generally, it is used as for reporting trends and
their sequential development rather than as a formal analytic tool and its use has also been
criticized for these very reasons (Potschin 2009). Other critiques point to it being an essentially
comparative static approach to land use change bereft of any real dynamics, offering uni-
directional causality and ignoring non-human drivers of environmental change (Rappaport et al.
1998).
In this study, we use DPSIR to identify the factors threatening the areas of natural
vegetation at two locations within the orbit of the case study metropolitan areas: the Palmachim
sand dune area south of Tel Aviv and the Carmel Coast strip south of Haifa. Within each sub-
system we identify the land use change between 1995 and 2009 in term of loss of natural
vegetative cover and try and link this to expanding industrial commercial and residential
development in the surrounding areas. We sub divide the case study area into its constituent local
authorities and examine each separately over the two time points. A sustainability index is
created and observed over the two time periods. The Israeli coast line is characterized by a sandy
shoreline and natural scrub vegetation characteristic of arid and temperate climates. In the
absence of extensive coastal ecosystems (wetlands, salt marshes, tidal flats, estuaries, lagoons,
mudflats, marshes and the like) our focus will be on the threats to the coastal ecosystem that exists
within the natural vegetative cover on the beach areas.
- 112 -

D.Felsenstein, et al., […] DPSIR Framework for Case Studies in Palmachim […] and Carmel Coast […], Israel
2. Materials and methodology
2.1 Sources and data
We assembled GIS (Geographic Information System) and tabular data from various sources: The
Survey of Israel, the GIS Center at the Hebrew University, the Deshe Institute (the research wing
of the Society for the Protection of Nature in Israel)1 and the Central Bureau of Statistics.
GIS layers are used for generating the differences in built up residential areas over the
period between 1995 and 2009. This is also the case for industrial areas incorporated within the
built area polygons. These are also defined as (P) indicators that serve to threaten natural
vegetation areas.
The core indicators of natural vegetation areas are extracted from field surveys
undertaken by the Deshe Institute for 1995 and from a land cover dataset provided by the Survey
of Israel in 2009. The extent of the natural open area in this assessment is presented in Figure 4.1
(vegetation) and Figure 4.6 (natural protected areas). In order to delineate the natural open areas,
we isolate the natural vegetation from the vegetation layer in both time frames including natural
protected areas (that comprise less than 10% of the total area). Thus our vegetation indicator
includes vegetation in natural protected areas as well.
Field surveys of the natural resources and landscape were conducted in each of the case
study areas stated above (Deshe Institute). These surveys determined the ecological sensitivity of
each area to pressures deriving from urban development and infrastructure development (i.e.
roads, railroads, etc) (see Figure 4.7).
The key variables and their units of measurement are:
1. Area of natural vegetation (S), unit: m2.
2. Area of residential and industrial buildings (P) and (D), unit: m2.
The basic administrative units used in the study are municipal areas. Each study site is
subdivided into its constituent local authorities. Areas without jurisdiction generally correspond
to open areas.
The Carmel Coast area divides into the following municipalities:
1 Available at: http://www.deshe.org.il/?pg=votes&CategoryID=180.
- 113 -

SECOA, Vol. 6. Environmental Stresses and Resource Use in Coastal Urban and Peri-Urban Regions
• The Carmel Shore- including some small rural areas.
• The City of Haifa- residential and industrial areas.
• The municipality of TiratHa'Carmel.
• The municipality of Furidis.
• No Jurisdiction.
The Palmachim Case Study subdivides into seven municipal areas:
• Ashdod.
• Bat Yam.
• Gederot.
• GanRaveh- mainly industrial areas.
• Yavneh outskirts- mainly industrial areas.
• Yavneh.
• RishonLetzion.
2.2. Methods
We make use of the DPSIR framework analysis in order to assess the effects of urban development
on natural ecosystems, specifically natural vegetation land cover. We relate large scale human
drivers of change such as population growth and its attendant demand for increased residential,
commercial and industrial land use with pressures such as encroachment of residential and
industrial activities on natural coastal habitats, changes in the area of natural vegetation that
occurs as a result (reduction of natural vegetation cover) and subsequently, the impacts of this on
ecological sustainability of the threatened areas and the institutional response in terms of the
regulatory frameworks for protecting the coastal environment. These elements are outlined in
Figure 4.1. The DPSIR framework leads to the estimation of an outcome indicator that relates to
the ecological sensitivity of the study areas and the way this has changed over the period between
1995 and 2009 given the existing development pressures.
- 114 -

D.Felsenstein, et al., […] DPSIR Framework for Case Studies in Palmachim […] and Carmel Coast […], Israel
Figure 4.1. DPSIR Framework for Israeli Case Studies; Workflow and Relationship between the various elements.
2.3. Defining the study areas
2.3.1. The physical environment of the Israeli Coast
The Coastline: The Nile littoral cell, one of the world's longest cells, runs 650 km along
the southeastern Mediterranean, from Abu Quir Bay near Alexandria, Egypt, to Haifa Bay on the
northern Israeli coast (Zviely et al. 2007). The Israeli coast divides into two main sections: the
southern section from the Gaza Strip to Haifa Bay, and the northern section from Akko
promontory to the Lebanese border. With the exception of Haifa Bay, the Carmel headland and
some small rocky coasts, the coast has a straight shoreline that gradually changes its orientation
from northeast to almost north. Coastal morphology is characterized by aeolianite (locally termed
- 115 -

SECOA, Vol. 6. Environmental Stresses and Resource Use in Coastal Urban and Peri-Urban Regions
“Kurkar”) ridges and dunes (Nir 1976). The dunes are formed by aeolian sand blown landward
from the seashore. From Gaza northward, these dunes are fossilized, creating aeolianite ridges
parallel to the shoreline. North of Tel-Aviv, dunes exist only adjacent to river mouths. The
beaches are relatively narrow; mostly 20 to 100 m in width. Around the river mouths, beach width
can reach 200 to 300 m. In several places the beach almost does not exist and its width is just a
few meters. Most of the coasts are gently sloping, dissipative beaches; few are steep rocky
reflective coasts. The tidal range along the Israeli coast is low (15 to 40 cm) and insufficient to
create sediment-transporting or beach-eroding currents. The tidal regime exhibits a semi-diurnal
periodicity.
The climate is an extreme Mediterranean climate, characterized by dry summers and
periodic winter storms, which account for most of the river flow. Along the coastal plain, rivers
generally flow from east to west. The coastal aeolianite ridges often block the natural outlet of
rivers to the sea, although during the Byzantine era and later, artificial outlets were quarried in
the aeolianite ridges in order to allow their flow to the sea.
Sea-level changes: Klein and Lichter (2009) analyzed annual sea-level records from
several tide gauging stations in the Mediterranean, and concluded that the rise of the sea-level in
the Mediterranean in the 20th century was consistent with the global sea-level rise of 0.5-2
mm/year. However, during 1990-2003, sea-level rise in the Mediterranean was ~10 mm/year. This
rate decreased during the first decade of the 21st century, yet it remained higher than the global
average (Lichter at al. 2010), at 5.8mm/yr between 1992-2010 in Hadera (Rosen 2011)
Coastal Structures: Along the Nile littoral cell coasts, from Abu Quir Bay in the west to
Haifa Bay in the northeast, numerous artificial coastal structures have been built during the 20th
century. Breakwaters at the entrances of harbors, jetties at the mouths of inlets, detached
breakwaters and groins along beaches have all become ever more abundant. These structures
pose an artificial intervention in the natural sediment budget and longshore sediment transport
patterns along the coast. Sand accumulation updrift and erosion downdrift the dominant
direction of longshore currents of large-scale structures (jetties, breakwaters) typically signify the
direction and magnitude of the net transport. Shorelines changes in the vicinity of smaller
structures such as groins usually represent seasonal deviations in transport direction.
- 116 -

D.Felsenstein, et al., […] DPSIR Framework for Case Studies in Palmachim […] and Carmel Coast […], Israel
2.3.2. The study areas
The two study areas represent threatened natural areas within the large metropolitan areas
(Figure 4.2). The Palmachim area lies in both the inner and outer rings of the Tel Aviv
Metropolitan region. In contrast, the Carmel Coast area cuts across the core, inner and outer rings
and its northern point is the southernmost part of the Haifa core. This, of course, has implications
for the development pressures in the two areas.
The Palmachim area comprises much of the northern section of sand dunes of Israel’s
southern coastal plain. It lies south of the Tel Aviv metropolitan area and is wedged between the
growing cities of Rishon Le Tzion to the north, Ashdod to the south and Yavne to the west. The
area of interest comprises 80,000 m2 with 18 km of uninterrupted coastline and is under intense
development pressures. The main threats to the area all derive from residential and industrial
expansion. These include building and construction: both commercial and national initiatives are
planned for the area including a coastal water desalination plant, residential expansion in Rishon
Le Tzion (10,000 units), industrial expansion in the city of Yavneh; and unauthorized motor sport
and vehicular activity along the coast which destroys the fragile ecosystem balance and in
extreme cases can even interfere with drainage systems, wildlife habitats and causes localized
pollution. The Palmachim area is traversed by two streams (Sorek and Lachish) and the land use
is predominantly natural vegetation and sand dunes (36%), followed by built up areas including
industrial zones and utilities (30%) and closed (military) areas (30%). The area is rich in
biodiversity with 820 plant species, 157 bird species, 15 reptile species and 9 types of mammals
in the dunes and surrounding habitats. Additionally, the area hosts 103 types of vegetative cover
and 43% of area categorized as having high botanical value.
The Carmel Coast area is a natural stretch of coast, 32 km long and 4 km wide lying south
of the Haifa Metropolitan area. It starts south of the city of Haifa and runs down the coast through
the town of Atlit until the Dor Beach. It is bounded to the east by the Carmel Mountain Range
and low calcareous sandstone ridges running north- south through the area parallel the shoreline.
The area has its own micro –ecology with unique vegetation and wildlife. Various streams, that
drain from the Carmel Mountain Range, run east-west across the area. The area is characterized
by a wealth of different landscapes such as sand dunes, agricultural lowlands, fish and salt ponds,
quarries and archeological sites.
Development pressures in this area include mostly the construction of residential and
non-residential buildings. Hotel and high-rise apartment building construction on coastline,
- 117 -

SECOA, Vol. 6. Environmental Stresses and Resource Use in Coastal Urban and Peri-Urban Regions
south of Haifa, initiated in the mid 1970’s was executed in the mid 1990’s with the construction
of two high-rise buildings on the southern beachfront of the city of Haifa; residential expansion
of the town of Atlit: the Atlit promontory has both a modern and ancient history as attested by
the many archeological finding in the area. In addition, the salt ponds that are an attraction for
much bird wild-life and acts as a breeding ground have been slated for redevelopment to
accommodate the residential expansion of the town; commercial development of Habonim Beach:
a unique ecological landscape and protected nature reserve; and Infrastructure development:
recent interest in potentially large gas reserves off the Mediterranean coast has led to planning
the requisite infrastructure in the area.
The Carmel Coast, therefore, offers a very diverse set of landscapes both in man-made
artifacts such as archeological remains and natural resources. In addition, environmental surveys
have reported 38 distinct types of vegetation, rich landscapes comprising natural habitats and
intense agricultural production, over 100 reptile species surveyed in the area, one-hundred bird
species and the second largest concentration of sea turtles in Israel.
Figure 4.2(a). Location of Case Studies in Metropolitan Context: Haifa.
- 118 -

D.Felsenstein, et al., […] DPSIR Framework for Case Studies in Palmachim […] and Carmel Coast […], Israel
Figure 4.2(b). Location of Case Studies in Metropolitan Context: Tel Aviv.
3. Natural resources and their exploitation
3.1. State and impacts
Table 4.1 and Figure 4.3 show the extent of the pressures arising from increased urban expansion
and economic activity over the study period. In the Palmachim area, expansion is particularly
pronounced. In most of the area, the developed land cover has nearly doubled and these include
the expansion of some of Israel's fastest growing cities over this period (Ashdod, Rishon Le
Tzion). Overall, the built up areas within the Palmachim study area have expanded by a factor of
more than 2.5 over the study period. Much of this activity has been in the northern section as part
of an urban spillover of the cities of Bat Yam and Rishon Let Tzion Yavneh and Ashdod. It should
be noted, that certain section of the natural environment are classified as closed military areas, a
designation which ‘preserves’ them from residential and commercial intrusion.
A similar picture emerges in the Carmel Coast, where southward expansion of the city of
Haifa has been particularly prominent. In the northern part of the coastal strip the southward
expansion of Haifa has made incursions in the natural area and in the central section around the
- 119 -

SECOA, Vol. 6. Environmental Stresses and Resource Use in Coastal Urban and Peri-Urban Regions
town of Atlit considerable development has occurred over the study period. In contrast to the
Palmachim area, development pressures are scattered throughout the area and the pattern of
initial incursions in 1995 has intensifies by 2009.
The spatial distribution of natural vegetation cover exhibits a mirror image of the patterns
of residential and industrial expansion. Table 4.2 and Figure 4.4 show a consistent picture of a
great reduction of vegetation cover in the case study areas between 1995 and 2009. In Palmachim,
only 25% of the vegetation cover from 1995 remained in 2009. In the Carmel Coast the change is
even more pronounced and results in a 95% reduction over the 15 year period. The continuous
patch of vegetation cover of 1995 in Palmachim became a series of discontinuous patches by 2009.
In the Carmel Coast, the vegetated areas on the eastern section of the study area ostensibly
disappeared, replaced by mainly agricultural incursions which may have preserved the ‘green’
character of the area but disturbed the natural habitats and the rich biodiversity of local wildlife.
At the level of the individual municipal units, this same picture shows an even more
accentuated pattern. In Palmachim, the sub areas divide into two groups. One group experienced
reductions of 50% or less (Gan Raveh, Ashdod and Rishon Le Tzion witnessing a gross addition
due to a boundary change). The other group represents a highly significant vegetation loss at least
85%. The result is a pattern of fragmented islands of discontinuous cover. Obviously this is not a
sustainable development pattern and 2009 probably represents a stage in the gradual reduction
of natural vegetation cover along the Palmachim shoreline.
The situation along the Carmel Coast is even more pronounced. For the 5 sub areas
examined, natural vegetative cover has all but disappeared and in one jurisdiction (Furadis) it is
totally non-existent. As noted before, natural habitats and natural vegetation cover have given
way to intensive agriculture, horticulture and fish farming in most of the areas (Carmel Shore
and the no- jurisdiction sub areas) and to urban expansion (Tirat Hacarmel, Haifa and Carmel
Shore) in others. This has obvious implications for any index of sustainability. The recent
discovery of natural gas off the Carmel coast and the attendant infrastructure development,
storage tanks and industrial facilities poses a further threat to the sustainability of what remains
of naturally vegetated areas.
- 120 -

D.Felsenstein, et al., […] DPSIR Framework for Case Studies in Palmachim […] and Carmel Coast […], Israel
Table 4.1(a). Base Data (P factor): Change in Built up Area (Residential, Commercial and Industrial) by
Local Authority in the Study Areas in 1995 and 2009.
Built Area 1995 2009
Ashdod 514,468 1,034,729
Bat Yam 359,405 478,917
Gderot 39,080 108,928
GanRaveh 282,640 498,265
Yavneh outskirts 22,541 260,461
Yavneh 1,244,365 3,109,018
Rishon Le Tzion 1,709,801 4,203,883
Table 4.1(b). Base Data (P factor): Change in Built up Area (Residential, Commercial and Industrial) by
Local Authority in the Study Areas in 1995 and 2009.
Built Area 1995 2009
Carmel Shore 3,317,127 6,465,662
Haifa 2,281,203 4,698,855
Tirat Ha'Carmel 2,496,734 3,018,428
Furidis 191,891 538,834
No Jurisdiction - 222
Figure 4.3(a). Change in built area in Case Study Areas: Palmachim.
- 121 -

SECOA, Vol. 6. Environmental Stresses and Resource Use in Coastal Urban and Peri-Urban Regions
Figure 4.3(b). Change in built area in Case Study Areas: Carmel Coast.
Table 4.2(a). Base Data: Areas of Natural Vegetation Cover (S factor): Pamachim in 1995 and 2009 by
local authority.
Natural Vegetation Cover
1995 2009 Ashdod 1,149,110 829,658 Bat Yam 8,983,653 121,895 Gederot 4,882,318 1,797
GanRaveh 4,755,680 3,322,902 Yavneh outskirts 6,350,984 1,629,212
Yavneh 8,685,015 548,841 RishonLeTzion - 1,594,681
Table 4.2(b). Base Data: Areas of Natural Vegetation Cover (S factor): Carmel Coast, in 1995 and 2009
by local authority.
Natural Vegetation Cover
1995 2009 Carmel Shore 15,286,204 950,184
Haifa 3,231,470 140,997 TiratHa'Carmel 638,789 92,887
Furidis 322,587 - No Jurisdiction 2,570,962 26,279
- 122 -

D.Felsenstein, et al., […] DPSIR Framework for Case Studies in Palmachim […] and Carmel Coast […], Israel
Figure 4.4(a). Change in Natural Vegetation Area in Case Study Areas: Palmachim.
Figure 4.4(b). Change in Natural Vegetation Area in Case Study Areas: Carmel Coast.
- 123 -

SECOA, Vol. 6. Environmental Stresses and Resource Use in Coastal Urban and Peri-Urban Regions
Coastal Vegetation: The coastal sand dunes of Israel extend along the coastline. The width
of the southern strip is 7 km and it narrows up to 1 km in the north. The total area of the strip is
580 km2. These dunes are characterized by diverse plant communities, including many endemic
species. Most of the species are annuals but many are rare. This is due to the industrial and urban
development along the coastal plain and the destruction of the remaining open dune areas by
tourism, recreation and sand mining (Kutiel 2001).
Prior to 1948, the dunes were utilized by humans in two ways: first, vegetation was used
by the locals as firewood, building materials and livestock grazing; and second, the employment
of traditional ‘‘mawasi’’ agriculture (meaning “suction”, referring to water sucked out to the
surface). Following the establishment of the state of Israel in 1948, vegetation on the sand dunes
was no longer extensively utilized and was therefore able to spread more efficiently on the dunes
(Levin and Ben- Dor 2004). Sand dunes form an important and unique system that can be mobile
or fixed by vegetation, as is the case with the coastal dunes of Israel, which have been undergoing
a process of stabilization since 1948. Levin et al. (2006) found that vegetation and topographic
variables were able to explain more than 65% of the variability found in the spatial and temporal
patterns of sand mobility.
In terms of micro-vegetative environments, the various Deshe Institute surveys of both
areas (Deshe Institute 2011) have identified many species of vegetation (more so in Palamachim
than in the Carmel Coast) represented in the study areas. We have chosen to depict only the broad
land use covers of planted vegetation, orchards, olive groves, cultivated agriculture, plantation
and forests and compare these to the general category of ‘natural vegetation’. While this sacrifices
the richness and diversity of the vegetative cover, we prefer to give an overall macro picture of
the representative vegetative land covers. Figure 4.5 shows that while natural vegetation cover a
similar relative share of the area in both case studies, the difference between them lies in the
predominance of agriculture and cultivated vegetation in the Carmel Coast region.
- 124 -

D.Felsenstein, et al., […] DPSIR Framework for Case Studies in Palmachim […] and Carmel Coast […], Israel
Figure 4.5. Comparative Vegetation Land Cover.
Natural Protected Areas: In the two study areas, areas of natural habitats and wildlife
have rather different statutory status which affects their chances for sustainable development.
The legislative framework for protecting areas of ecological value is via their designation in the
relevant National Outline Plans as national parks, forests or nature reserves. The data presented
in Figure 4.6 has been compiled from these plans. The difference between the two sites is striking.
The existence of planned or designated areas for protection is much more predominant in the
Palmachim areas than in case of the Carmel Coast. This is probably due to the extensive
designation of agricultural land use in the latter which ensures a short term solution against
residential and industrial incursion into open spaces and areas of natural and ecological
importance.
- 125 -

SECOA, Vol. 6. Environmental Stresses and Resource Use in Coastal Urban and Peri-Urban Regions
Figure 4.6. Natural Protected Areas.
Ecological sensitivity was measured by the Deshe Institute surveys for the study area.
Three surveys cover the two study sites. The Carmel Coast area ecological sensitivity map is a
result of compilation of two of studies conducted in the Atlit and Hof Dor areas (Figure 4.7).
Ecological sensitivity is graded on the basis of the following parameters: diversity, spatial
continuity, magnitude (size, area, volume, number) and uniqueness (rarity). Five levels of
sensitivity are determined ranging from low (dark green) to high (red). The general picture is
maintained with respect to this variable as well; the Palmachim area scores much higher than the
Carmel Coast. In the latter, the immediate shoreline, beach and dune areas are considered highly
sensitive whereas the rest of the area gets a low sensitivity score. For Palmachim, the extensive
dune area and unique habitats result in a much more elaborate classification of highly sensitive
areas that account for nearly half of the case study area.
- 126 -

D.Felsenstein, et al., […] DPSIR Framework for Case Studies in Palmachim […] and Carmel Coast […], Israel
Figure 4.7. Ecological Sensitivity.
3.2. Drivers and pressures
The two cases relate to threatened natural areas within the vicinity of the large metropolitan areas
(Figure 4.2). Palmachim lies in both the inner and outer rings of the Tel Aviv Metropolitan area.
In contrast, the Carmel Coast area cuts across the core, inner and outer rings and its northern
point is the southernmost part of the Haifa Metropolitan area core.
The Palmachim area comprises much of the northern section of sand dunes of Israel’s
southern coastal plain. It lies south of the Tel Aviv Metropolitan area and is wedged between the
growing cities of Rishon Le Tzion to the north, Ashdod to the south and Yavne to the east. The
area is under intense development pressure. The main threats to the area, all derived from
residential and industrial expansion are commercial and national construction initiatives and
unauthorized motor sport and vehicular activity along the coast which destroys the fragile
ecosystem balance and can damage drainage systems, wildlife habitats and causes localized
pollution.
- 127 -

SECOA, Vol. 6. Environmental Stresses and Resource Use in Coastal Urban and Peri-Urban Regions
The Carmel Coast area is a stretch of natural environment 32 km long and 4 km wide. The
area has its own micro –ecology with unique vegetation and wildlife. Development pressures in
this area include hotel and high-rise building construction on coastline, residential expansion,
commercial development of beaches and infrastructure development. The area offers a very
diverse set of landscapes including archeological remains and natural resources.
3.3. Responses
In 1983, Israel’s National Outline Scheme for the Mediterranean Coast (NOS 13) was
approved, and together with the country's planning and building law from 1965 became the only
tools that were supposed to protect and manage the coastal areas. During the 1990's, conflicts
regarding tourism, luxury residential projects, etc in the coastal area have resulted in the approval
of a Coastal Environmental Protection Law by the Israeli government in 2004 and the
establishment of the Committee for the Protection of the Coastal Environment (CPCE), as a body
that will integrate and manage coastal conflicts. The law divides the coast into different sections
by jurisdictions, stretching throughout the "Coastal Environment"- a strip stretching from 300 m
landward of the coastline, to 12 Nautical miles seaward and defines a littoral strip of greater
sensitivity; and another strip between one hundred m landward from the coastline to 1 nautical
mile (or to 30 m depth, depending on which is further from the coastline) seaward delineating
the "Coastal Zone”.
4. DPSIR analysis
The DPSIR method is described in the annex. The calculated sustainability index (Isi), presented
in Table 4.3, ranges between 0 and 1, where 0.5 is considered the tipping point between a
sustainable system and an unsustainable system (0-0.5).
Our results for both study areas point to a largely unsustainable system further degrading
over time. This is hardly surprising due to the threatened nature of natural vegetation in the area
and the values of the base data as outlined above. Of all our sub areas, only three were marginally
sustainable in 1995 (Gederot and Bat Yam in Palmachim and Furadis in the Carmel Coast) and
all exhibit a highly unsustainable index for 2009. Obviously, the nature of our base data as
previously noted (only two time points that tend to negative Ip values for 2009) has something to
do with this. However, this still cannot hide the intense development pressures operating in the
area. Only in one sub area (Rishon Le Tzion) does the situation improve over time and this is due
- 128 -

D.Felsenstein, et al., […] DPSIR Framework for Case Studies in Palmachim […] and Carmel Coast […], Israel
to the idiosyncrasy of an administrative decision to do with boundary changes. Even in this case,
Rishon Le Tzion generates a very low level of sustainability on 1995 and this only improves
marginally by 2009. In all sub areas, Isi converges in 2009 to a value <0.25 (see Table 4.3). This
convergence is even more pronounced for the Carmel Coast sub areas than for the Palmachim
zones.
These results show the unequivocal threat on sustainability posed by expanding urban
and economic development in the case study areas. This is hardly surprising as these areas were
chosen a priori because of challenge posed to their natural ecosystems by development processes
along the coastal zone. Our findings serve to underscore the magnitude of the change that has
taken place and the pace at which the natural vegetation in the area is disappearing.
Table 4.3(a). Sustainability Index for Case Study Areas: Palmachim.
1995 2009
Ashdod 0.185 0.162
Bat Yam 0.600 0.105
Gederot 0.600 0.100
Gan Raveh 0.229 0.187
Yavneh outskirts 0.305 0.144
Yavneh 0.494 0.118
Rishon LeTzion 0.100 0.167
Table 4.3(b). Sustainability Index for Case Study Areas: Carmel Coast.
1995 2009
Carmel Shore 0.247 0.108
Haifa 0.344 0.110
Tirat Ha'Carmel 0.224 0.118
Furidis 0.489 0.102
No Jurisdiction 0.247 0.100
- 129 -

SECOA, Vol. 6. Environmental Stresses and Resource Use in Coastal Urban and Peri-Urban Regions
Referring to the second section of our estimation, adding the predicted indicators revealed
an even worse situation in terms of the Sustainability Index, as it continued to drop and even go
below zero values, as can be seen in Table 4.4.
In all of the municipal areas in this prediction, we see a clear and severe degradation of the
sustainability Indexes with time. We cannot explain the negative values we received in any other
manner than great pressures being added in the case study area on the open natural areas.
Table 4.4. Sustainability Index for Palmachim Case Study Areas: predicted Sustainability Index for 2030.
2030
Ashdod -0.732
Bat Yam -0.309
Gederot -0.315
Gan Raveh -0.665
Yavneh outskirts -0.574
Yavneh -0.426
Rishon LeTzion -0.887
Table 4.5. Summary of DPSIR frame for coastal sand dune of Israeli case studies.
No. Case studies
Coastal ecosystem
Driving force Pressure State Impact Response
1 Panachim Tel Aviv
Natural vegetation on sandy coastal
strip
Population, Change in built- up area through residential and
industrial expansion
Change in area covered by natural
vegetation and protected area
designation
Change in sustainability index 1995-
2009
National Outline Plan for Med. Coast, Coastal
Environment Protection Law, 2004 Designation of National Protected Areas
Immigration, Economic
development
2 Carmel Coast-Haifa
Natural Vegetation on sandy coastal
strip
Population growth,
Economic Development
Change in built- up area through residential and
industrial expansion,
incursion of cultivated
agriculture and fishponds
Change in area covered by natural
vegetation and protected area
designation
Change in sustainability index 1995-
2009
National Outline Plan for Med. Coast, Coastal
Environment Protection Law, 2004 Designation of National Protected Areas
- 130 -

D.Felsenstein, et al., […] DPSIR Framework for Case Studies in Palmachim […] and Carmel Coast […], Israel
Table 4.6. Summary of indicators for sustainable use assessment of coastal resources in Israeli case
studies.
No. Case
studies Coastal
ecosystems Indicators Index Assessment statement
1 Palmachim Tel Aviv
Natural vegetation on coastal sand
dunes
Change in natural vegetation cover,
1995-2009
Index of vegetation sustainability, 1995-2009 calculated for 7
sub-areas
Index declined from max value of 0.494 to min value of 0.100 over study period. Indicates low level of sustainability.
Vegetation cover in 2009 was a fragmented patchwork of discontinuous areas.
2 Carmel CoastHaifa
Natural vegetation on coastal sand
dunes
Change in natural vegetation cover,
1995-2009
Index of vegetation sustainability, 1995-2009, calculated for 5
sub areas
Index declined from max value of 0.489 to min value of 0.100 over study period. Initial starting level of sustainability was low and over time virtual disappearance of natural
vegetation.
5. Conclusions
We have used the DPSIR analytic framework to investigate the causal link between pressure from
urban development and the degradation of natural ecosystems. This link has been illustrated for
two case studies using a sustainability index to chart the changes in this link over time. On the
basis of admittedly limited empirical data, we have shown the severe incursion of residential and
industrial land use into coastal areas with diverse natural vegetation can have severe
consequences. At the outset, both case studies were chosen because of their fragile ecological
status so the results are hardly surprising. What perhaps is a cause for alarm is the speed and
magnitude of this process: a seemingly irrevocable change taking place over a relatively short
time span of 15 years.
- 131 -

SECOA, Vol. 6. Environmental Stresses and Resource Use in Coastal Urban and Peri-Urban Regions
6. References
EEA 2007. Europe’s Environment. The Fourth Assessment. EEA, Copenhagen, 452pp.
Klein, M., & M. Lichter 2009. Statistical analysis of recent Mediterranean Sea-level data,
Geomorphology, Geomorphology.107(1-2), 3-9,
Kutiel, P. 2001. Conservation and management of the Mediterranean coastal sand dunes in Israel,
Journal of Coastal Conservation, 7(1), 183-192.
Levin, N., & E. Ben-Dor 2004. Monitoring sand dune stabilization along the coastal dunes of
Ashdod-Nizanim, Israel, 1945–1999, Journal of Arid Environments, 58(3), 335-355.
Levin, N., G. J. Kidron, & E. Ben-Dor 2006. The spatial and temporal variability of sand erosion
across a stabilizing coastal dune field, Sedimentology, 53(4), 697-715.
Lichter, M., Zviely, D., Klein, M., Sivan, D. 2010. Sea-Level Changes in the Mediterranean: Past,
Present, and Future – A Review. In: Seckbach J, Einav R, Israel A (eds) Seaweeds Their
Role Glob. Chang. Environ. Springer Netherlands, pp 3–17
Nir, Y. 1976. Detached Breakwaters, Groins and Artificial Bodies in the Mediterranean Coast and Their Influence on the Israeli Coastal Landform, GSI/2/76. Israeli Geological Institute, Jerusalem. (Hebrew).
OECD 1993. Core set of Indicators for Environmental Performance Reviews. Environment
Monographs 83, OECD, Paris
Potschin M. 2009. Land use and the state of the natural environment, Land Use Policy 26, 170–
177
Rapport, D.J., Gaudet, C., Karr, J.R., Baron, J.S., Bohlen, C., Jackson,W., Jones, B., Naiman, R.,
Norton 1998. Evaluating Landscape Health: Integrating Societal Goals and Biophysical
Processes, Journal of Environmental Management, 53,1-15.
Rosen, S.D. 2011. Assessing Present and Future Mediterranean Sea Level Rise Impact on Israel’s
Coast and Mitigation Ways Against Beach and Cliff Erosion. Coastal Engineering
Proceedings
Zviely, D., E. Kit, & M. Klein 2007. Longshore sand transport estimates along the Mediterranean
coast of Israel in the Holocene, Marine Geology, 238(1-4), 61-73.
- 132 -

D.Felsenstein, et al., […] DPSIR Framework for Case Studies in Palmachim […] and Carmel Coast […], Israel
ANNEX
1. Method
To generate an ecological sensitivity indicator we collected data available from field surveys of
the case study areas (1995, 2009). This data includes, the change (Δ) in the area covered by natural
vegetation (excluding forests, agriculture and plantations) – a State (S) indicator and change (Δ)
in the built up area a Pressure (P) indicator. A sustainability indicator was created for natural
vegetation cover that is causally linked to the expansion of residential and industrial
development. Given the fact that we have only two time periods and to avoid the pitfalls of
negative values for the sustainability index, we implement some (limiting but feasible)
assumptions. These are outlined below.
For each of the (P) indicators (Ip) we calculate the ratio of the delta between maximum
values (Imax) and the values in a given time frame (It) to the delta between maximum and
minimum values (Imin, often equal to zero). The indicators are calculated as follows:
.................1
When calculating the (P) indicator we noticed that the differences between the two time
points were extremely large in most areas. The result of this was that the calculated Ip values for
each area for 2009 were 0, resulting in a negative values for the Index of Sustainability (I). To
avoid this problem, we set an arbitrary Ip for 2009, smaller than that calculated for 1995. This is
justified given the values of the basic data and the extent of residential and industrial land
encroachment on areas of natural vegetation (see below).
The indicator for natural vegetation areas (Inoa) was calculated as follows:
..............2
where Inoa depicts the change ratio in time of the natural vegetation area in the case study
areas. In calculating the vegetation sensitivity indicator we assume that in the worst case scenario,
all areas will be cleared, therefore Imin=0. Given this assumption, the calculation is:
..........................3
- 133 -

SECOA, Vol. 6. Environmental Stresses and Resource Use in Coastal Urban and Peri-Urban Regions
In each of the case study areas we decided to add half of the open area that was left as
‘undefined’ to the Inoa indicator (for the calculation of the Sustainability Index). This is based on
the assumption that not all undefined areas eventually become built areas. The other half was left
undefined. The base data for natural vegetation is in Table 4.2.
To calculate the sustainability index (Isi) for the natural vegetation areas in each of the case
studies, we apply the following expression:
..........................................4
where n depicts the number of indicators, and Ci is the weight of a given indicator. In this
case, we have two indicators, one positive (Inoa) and one negative (Ip). We fix Ip2009, so that Ip2009 ≤
Ip1995. This is justified given the size of the reduction in vegetative areas over the period. The
weight given to each of the indicators was 20% for built area and 80% for natural vegetation areas.
Therefore, the calculation for the sustainability index is:
........5
In line with our above assumptions as to the future state of areas classified as ‘undefined’,
50 percent of this area was added to the natural vegetation area and eventually to the ecological
sustainability index.
- 134 -

CHAPTER 5.
Assessment Of Natural Resources Use for
Sustainable Development - DPSIR Framework for
Case Studies in Civitavecchia, XIII District of
Rome (Ostia) and Pescara, Italy
M. Beccari, E. Rolle, D. Colozza, V. Naso, L. Del Zotto, L. Cedola, F. Rispoli, T. Radice, R. Franco, A. Cattini and M. D'Orazio

SECOA, Vol. 6. Environmental Stresses and Resource Use in Coastal Urban and Peri-Urban Regions
1. Introduction
The Italian research project deals with two case studies: the Rome Metropolitan Area on the
Tyrrenian Coast and the Chieti-Pescara Metropolitan Area on the Adriatic Coast. Following the
initial study and data collection, which dealt with the whole metropolitan areas and with a broad
number of environmental aspects, the scope of the research has been hereafter narrowed to a few
specific issues, highlighted as some of the major “conflicts” to be coped with, as detailed in the
table below. The aim is to analyze and assess the use of the resources for sustainable development
in these coastal urban areas.
Specifically, the research will focus on the analysis of:
- air quality and pollution in the municipality of Civitavecchia (Rome Metropolitan Area).
- coastal water quality in XIII District of Rome.
- air quality and pollution in the municipality of Pescara.
The purpose of the research is to assess the sustainable use of the selected natural
resources, through a qualitative and quantitative understanding of the factors impacting upon
them, and the state of the resources (refer to ANNEX section).
Table 5.1. Natural resources and areas under study.
2. Materials and methodology
2.1. Sources and data
Data is accessed through the reports and databases of Italian Ministries and Municipalities, as
well as national and European Institutes (see reference list).
- 136 -

M. Beccari, et al., DPSIR Framework for Case Studies in Civitavecchia, XIII District of Rome (Ostia) and Pescara, Italy
2.2. Methods
2.2.1 DPSIR Methodology
In the following researches, a DPSIR model has been used to focus the analysis of the
environmental quality. DPSIR is a causal framework for describing the interactions between
society and the environment. This framework has been adopted by the European Environment
Agency. The components of this model are: Driving forces, Pressures, States, Impacts, and
Responses (DPSIR).
As a first step, data and information on all the different elements in the DPSIR chain is
collected. Then possible connections between these different aspects are postulated. Through the
use of the DPSIR modeling framework, it is possible to gauge the effectiveness of responses
(Global International Waters Assessment (GIWA) 2001, European Environment Agency (EEA)
Copenhagen).
Figure 5.1. Complete DPSIR framework (National Environmental Research Institute Denmark).
- 137 -

SECOA, Vol. 6. Environmental Stresses and Resource Use in Coastal Urban and Peri-Urban Regions
2.3. Defining the study area
2.3.1. Civitavecchia
The city of Civitavecchia is located North of Rome, on the Tyrrenian Coast, with a population of
approximately 52.000 people, which has moderately grown over the past ten years. Population
density is of 725 inhabitants/km2, much higher than that of the neighbouring towns and than the
regional average.
Low hills make up most of the territory reaching the border with the sea, where the coast
is stony and rocky; coastal erosion has been taking place over the past few decades and is
particularly evident in the Northern part of the municipality.
The climate is Mediterranean, with mild winters and hot and dry summers, though
regular breezes contribute to mitigate temperatures. Precipitations average 650-700 mm yearly,
unevenly distributed during the year: very scarce in summer, higher during autumn and winter.
Besides urban agglomerations, both industrial and agricultural areas are present, in
addition to infrastructures such as a railway, a highway, a marina and the harbour.
Civitavecchia is a major ferry and cruise sea port, the second biggest in Europe for number
of passengers. It is also seat to two power plants, with a total power output of 3,440 MW. For
these reasons, it is a critical area in terms of emissions of pollutants and air quality.
2.3.2. XIII District of Rome (Ostia)
The XIII District of Rome is located south of Rome and it is the only one that has access to sea. It
covers an area of 150.643 km2, representing one of the largest districts of Rome. It is bordered to
the north with the XII and XV District of Rome, to the south with Tyrrhenian Sea, to the west with
the natural course of the Tiber and the territory of Fiumicino, to the south with the XII District of
Rome and the town of Pomezia. The XIII District has a population of 216,515 residents, probably
underestimated in the summer season when a seasonal and daily tourism from the city core
insists on this territory. The population density is equal to 1,437 inhabitants/km². The 30% of total
area of the XIII Municipality (150 km2) is urbanized. Divided in 10 urban areas, the XIII District
presents on its territory some areas of natural interest, such as Pineta di Castel Fusano (pinewood)
and the Presidential Estate of Castel Porziano, but also areas with high archaeological interest
such as Ostia Antica. This area is critical regarding water management and coastal water quality,
including bathing issues.
- 138 -

M. Beccari, et al., DPSIR Framework for Case Studies in Civitavecchia, XIII District of Rome (Ostia) and Pescara, Italy
2.3.3. Pescara
Pescara is a city on the Adriatic Coast , in the Abruzzo region. It is the capital city of the Pescara
province, with a population of about 120.000 inhabitants and one of the highest population
densities in Italy (3,659 inhabitants/km2). However, these numbers have slightly declined over
the past decades due to the saturation of available spaces. Pescara is nowadays the center of a
metropolitan area where people tend to leave the city to move to nearby towns such as Francavilla
al mare, San Giovanni Teatino, Montesilvano, following a demographic pattern typical of many
modern urban agglomerates.
The city rises in a plain, on the banks of the Aterno-Pescara River which is channeled
through levees into the Adriatic Sea ; still nowadays, areas around the mouth of the river are at
risk of flooding during peak discharge season. The climate is Mediterranean with mild and rainy
winters, hot and dry summers (although dry spells are less severe than, for comparison, those of
Rome case study area). In January, temperatures average between 2°C and 10°C; in August,
between 18°C and 28°C. Precipitations are between 650mm and 700 mm per year. Occasionally,
winter blizzards from the Balkans may bring snow and frost. On the other hand, due to the
proximity of the high massifs of Gran Sasso and Maiella, episodes of the so-called “Favonio” or
“Fhon” may take place: it is a warm wind generating when humid air flows Eastwards over the
mountains under certain conditions, producing a sudden rise of temperature up to 20°C as far as
the coast.
The territory is almost completely urbanized, with the exception of two natural reserves:
the “Pineta” (pine-wood) Dannunziana and the Pineta Santa Filomena (76 ha in total).
The surroundings of the city are seat to several industries, including a plant producing
clinkers registered in the INES-ENER. However, it is the high level of urbanization, coupled with
heavy traffic conditions and limited availability of green areas, which make Pescara one of the
most critical spots in terms of air quality. In 2010, it has become a city with highest level of PM10
amongst all the cities of Europe (according to ISTAT elaboration of data from EEA Airbase).
- 139 -

SECOA, Vol. 6. Environmental Stresses and Resource Use in Coastal Urban and Peri-Urban Regions
3. Natural resources and their exploitation
3.1. State and impact
Although the study focuses on the quality of air and water resources in the three selected areas,
an overall outline of the coastal natural resources and ecosystems is provided below.
3.1.1. The coast of Rome Metropolitan Area
The extension of the coast reaches about 150 km between the municipalities of Nettuno and
Tarquinia. In the north, the coast is rocky and stony between Tarquinia and Santa Marinella, then
sandy as far as Nettuno. From Fiumicino southwards, it is totally flat and runs in a straight line
with the exception of the promontory of Anzio.
The resident population along the coast is around 300,000. However, it peaks at 1.5 million
during summer, other thousands of people commute daily to the seaside during weekends and
summer vacations. In such situations, due to the high quantity of sewage, the drainage system
regularly ends up in overload, thus impacting heavily the condition of water in streams, canals
and the sea.
The aspect of the coast has been deeply impacted by urbanization: houses have gradually
replaced the dunes and the Mediterranean shrubland and form nowadays an almost
uninterrupted residential agglomerate (with the exception of some farmland, parks and military
areas): this happens, for instance, between Santa Marinella and Santa Severa, Torvajanica and
Ardea, Anzio and Nettuno.
Other significant facilities along the coast include: the harbour of Civitavecchia, as well as
several marinas (at Civitavecchia, Santa Marinella, Fiumicino, Ostia, Anzio and Nettuno), the 2
thermal power stations to the north of Civitavecchia and the Fiumicino airport.
Some areas along the coast have been protected from the urban sprawl, thanks to the
creation of parks and reserves: the natural reserves named Litorale Romano (15,900 ha) and Castel
Porziano (5,900 ha) are the major ones. The other protected areas are the Saline di Tarquinia,
Macchiatonda, Palude di Torre Flavia, Tor Caldara, Villa Borghese di Nettuno (totally 550 ha).
On top of this, a shoal - 4 to 8 miles off the coast between Ostia and Torvajanica - has been turned
into a 1,200 ha natural reserve.
Coastal erosion is a problematic phenomenon which has been taking place for several
years, slowly but steadily causing the beaches to shrink, with the sea reaching out roads and
dwellings in some cases. The main cause can be found in the dramatic reduction of the amount
- 140 -

M. Beccari, et al., DPSIR Framework for Case Studies in Civitavecchia, XIII District of Rome (Ostia) and Pescara, Italy
of sediments carried by streams and rivers, due to the presence of dams and to the extraction of
sand from the river bed. This is true in particular for the Tevere, that used to be the main
contributor to the maintaining of the coast and whose delta is now receding with the course of
time. In addition, the construction of wharfs has determined a modification of coastal streams
with further negative consequences on the erosion of beaches. The areas most significantly
affected by such problem are: Northern boundary of Civitavecchia municipality to Torre
Valdaliga, Santa Marinella to Ladispoli, Focene to Castel Fusano, Anzio and Nettuno.
The natural reserves and few other areas of limited extension, preserve what is left of the
kind of ecosystems that used to flourish all along the coast in the past: wetlands, dunes, macchia
mediterranea (maquis shrubland) and hydrophile woods.
3.1.1.1. Wetlands
The need for additional agricultural land, the fight against malaria started at the end of
the 19th century and the more recent intense urbanization, have resulted in a dramatic reduction
of wetlands, whose importance has been revalued only in recent years. According to the Ramsar
convention, in fact, “wetlands are among the world’s most productive environments. They are
cradles of biological diversity, providing the water and primary productivity upon which
countless species of plants and animals depend for survival. They support high concentrations of
birds, mammals, reptiles, amphibians, fish and invertebrate species”. The remaining wetlands
can be either natural or artificial; the most important ones are listed in Table 5.2.
Table 5.2. Wetlands in Rome Metropolitan Area.
Natural or semi-natural environments Artificial environments
Ponds (Pond of Focene) Drainage canals
Pools (Pools of Castel Fusano and Castel Porziano,
“Tumuleti” at Bocca di Leone, Fregene)
Artificial pools (Vasche di Maccarese)
Temporarily flooded fields (“Salicornieti” of the
Tevere delta)
Artificial lakes (Port of Traiano)
These ponds and pools of brackish water are in some cases still surrounded by woods,
where plants and trees typical of the Mediterranean climate often gradually give way to those of
continental climate. Among the former, the important species are evergreen oaks (Leccio –
Quercus ilex, Sughera – Quercus suber); among the latter, there are deciduous oaks (Cerro –
- 141 -

SECOA, Vol. 6. Environmental Stresses and Resource Use in Coastal Urban and Peri-Urban Regions
Quercus cerris, Farnia – Quercus robur). In the coolest and most humid area, there grow Pioppo
(Populus), Frassino (Fraxinus) and Acero (Maple).
3.1.1.2. Dunes
Dunes constitute a transition environment between the sea and the land, in which only
specialized species can survive due to the harsh conditions: salty water and brackish wind, tidal
waves, lack of humus and highly permeable soil. A significant feature of such ecosystem is that
the flora changes moving away from the shore. Closest to the shore, a very limited number of
succulent plants with a very short life cycle, such as the Cakile are found. In an intermediate zone,
there grow plants with more and more deep and branched roots and horizontal growth, in some
cases perennial, which cause dunes to become stable structures as high as 20 m. Furthest from
the shore, the soil is protected by the dunes and humus may pile up, while the water table is less
salty; in some cases, the land may be flooded after heavy precipitations; once again, a variety of
species different from the previous one is found.
3.1.1.3. Macchia mediterranea (maquis shrubland)
In the past, maquis shrubland was found between the dunes and the inner forest; nowadays, in
many cases, it has also replaced woods destroyed by fires in order to make land for pasture. This
kind of shrubland is made of evergreen plants adapted to hot and dry summer conditions (leaves
have a wax layer on the overside and a hairy layer on the underside, to limit transpiration); plants
grow in a very compact pattern, which helps to keep humidity in the soil and safeguards from
strong winds. Usually, it is possible to distinguish a “low” from a “high” maquis: in both, the
same vegetation can be found; closer to the coast, plants form shrubs of limited height, whereas
further to the inside the same plants are higher and may grow as high as trees (Ginepro coccolone
– Juniperus oxycedrus, olivella – Phillyrea angustifolia, ginepro fenicio – Juniperus phoenicea,
corbezzolo – Arbutus unedo, lentisco – Pistacia lentiscus, Erica – Erica multiflora).
3.1.1.4. Hydrophile woods
A typical ecosystem of the coasts is the “Igrofilo” (hydrophile) woods, where trees need high
quantities of water to grow. This kind of woods cover the plains surrounding the swamps, which
are inundated in spring and autumn during heavy rains, forming the so-called “pools”. The most
common trees are the frassino meridionale (Fraxinus oxycarpa), ontano (Alnus glutinosa), pioppo
(Populus), Farnia (Quercus robur). A peculiar feature is the herbaceous flora, which changes
- 142 -

M. Beccari, et al., DPSIR Framework for Case Studies in Civitavecchia, XIII District of Rome (Ostia) and Pescara, Italy
significantly throughout the year depending on the level of precipitations. The remaining woods
are nowadays those of Castel Porziano and Maccarese (delta of the Arrone River).
3.1.1.5. Fauna
The fauna of the varied coastal ecosystems is as rich as its flora, with mammals, birds,
amphibians, fish, reptiles and insects. Among mammals, the predominant species are boars,
deers and Roe deers, martens and beech martens, foxes, European badgers, hedgehogs, crested
porcupine, hares and jackrabbits. Among birds, woods and wetlands provide refuge for both
sedentary and migratory birds: Eurasian jay, little owls, barn owls, common buzzards, Eurasian
woodcock, as well as several charadriiformes and ciconiiformes.
Moreover, at Castelporziano, part of the land in the reserve is dedicated to activities of
stock-breeding of rare equines and cattle (Maremmana breed), of which very few specimen still
remain.
3.1.2. The coast of Pescara Metropolitan Area
The coast is around 40 km long between Città S.Angelo and Ortona and it unfolds as a flat straight
plain with sand beaches as far as Ortona (the Southern boundary of the case study area), with its
slight promontory where the land ends abruptly in front of the Adriatic Sea .
This stripe of land is crossed by the Aterno-Pescara River; around the last 20 km of its
path, there developed the cities of Chieti, San Giovanni Teatino and Pescara, which make up
nowadays a unique urban agglomerate including several industrial facilities, a sea port and an
airport. South Pescara, the Alento and Foro rivers flow to the sea at the municipality of Francavilla
al mare, through alluvial plains highly exploited for agricultural usage.
The intense urbanization of the coast has left very little room for natural ecosystems; the
natural reserves “Pineta dannunziana” (Pescara) and “Pineta Santa Filomena” (between Pescara
and Montesilvano) are the only remains of the vast extensions of “Pinete” (pine woods) and
maquis shrubland which used to cover all of the coastal territory. The flora is mainly
characterized by the presence of Aleppo pines, Maritime pines and Stone pines, as well as (to a
minor extent) the Quercus ilex and the Laurel tree. Several species of migrant and sedentary birds
find refuge in these reserves: Common Tern (Sterna hirundo), Yellow-legged Gull (Larus
michahellis), Black-headed Gull (Chroicocephalus ridibundus), Great Cormorant (Phalacrocorax
carbo), Great Tit (Parus major), Blue Tit (Cyanistes caeruleus) and others.
- 143 -

SECOA, Vol. 6. Environmental Stresses and Resource Use in Coastal Urban and Peri-Urban Regions
3.2. Drivers and Pressures
Driving forces are the factors linked to human activities which indirectly but relevantly affect the
environmental resources, generating environmental problems. Driving forces are sources of
pressures which are those variables directly responsible for the degradation of the natural
resources. As a result of the previous reports and of further analysis of the selected critical areas,
driving forces and pressures have been detected and are summarized in the tables 5.3, 5.4 and
5.5.
General speaking, pressures result from urbanization and high population density (urban
sprawl, emissions in air and water), infrastructures (ports and airport), industrial activities and
energy production.
Table 5.3. Driving forces and pressures in Civitavecchia – summary.
CIVITAVECCHIA
Driving forces Pressures
Demographic growth and urbanization
Population: Civitavecchia has a population of 52,000, up 4% compared to ’02. Population directly contributes to the consumption of natural resources, energy and land and to the production of waste and emissions in air and water.
Transport Port: Civitavecchia is an import seaport for goods (7.6 million tons in ‘09) and passengers (4.1 millions in ‘09); number of cruise ships and passengers has soared over the past ten years. The port is a relevant source of pressure on air (emissions of particulates, nitrogen and sulphur oxides, others). Traffic: motorization rate in Civitavecchia has increased by 10% over the past 10 years and is now 611 vehicles per 1000 population. Traffic affects ambient air quality.
Industrial activities Industry and commerce: production of goods and services is a factor of environmental pressure due to the use of natural resources (energy, water, raw materials) and to waste and emissions.
Energy production Power plants: Civitavecchia is seat to 2 thermal plants, for a total output of 3,440 MW. The plants have an impact on air (combustion gases), water (use of seawater) and soil (mud). Pressure is high, though several technological measures and monitoring means have been put in place to minimize impact.
- 144 -

M. Beccari, et al., DPSIR Framework for Case Studies in Civitavecchia, XIII District of Rome (Ostia) and Pescara, Italy
Table 5.4. Driving forces and pressures in Pescara – summary.
PESCARA
Driving forces Pressures
Demographic growth and urbanization
Population: Pescara has one of the highest densities in Italy (3,659 inhab./km2); the municipality is almost completely urbanized. Remaining natural reserves are very limited, pressure is high on air and water quality (delta of the Aterno river) due to emissions from domestic sources.
Transport Port: it was restructured in ’95, with two additional commercial quays; while traffic of goods is fluctuating, the total number of ships movements has been increasing due to ferry service to Croatia and Albania (572 ship movements, 48,000 passengers in ‘06). Airport: the airport is located 3 km away from Pescara city centre; from ‘01, passengers have more than doubled (408,000 in 2009) following the opening of low cost connection, in the past years, movements averaged 10,500 per year. Pressure from seaport and port is increasing, further expansion of the infrastructures might take place in the coming years. Traffic: motorization rate in Pescara has been decreasing in recent years, but remains high (610 vehicles per 1000 population); though no clear data are available, there is evidence that the number of vehicles circulating during the day is much higher, due to daily commuters from nearby towns. Pressure on air quality is high, several measures are under study in the “PUT” (urban traffic plan).
Industrial activities Industry and commerce: the city of Pescara is an active economic center with activities in manufacturing, constructions, transport and communications, as well as commercial and tourism related ones. The clinker production plant is registered in the INES-ENER report.
Table 5.5. Driving forces and pressures in the XIII District of Rome (Ostia).
XIII District of Rome (OSTIA)
Driving forces Pressures
Demographic growth and urbanization
Population: The XIII Municipality has a population of 216,515 residents, probably underestimated in the summer. The population density is equal to 1,437 inhab/km ². The 30% of total area of the XIII Municipality (150 km2) is urbanized. Water consumption for domestic use Water pollution: The sewer system of XIII Municipality is a singular case. It has been designed and constructed for the collection of sewage, but nowadays it also receives rainwater, under intense rainstorms, the collection network (inadequate to disposal so high flows) goes in crisis and the storm overflows (or emergency by-pass) are activated to protect the pumping stations. Tiber river water quality measured at Ripetta Bridge in Rome, values of BOD5, COD, N-NH4, N-NH3, Ptot, P-PO.
Industry Point source pollution Diffuse source pollution Water abstraction
Agriculture and cattle breeding
Water abstraction Point source pollution Diffuse source pollution
Tourism Recreational boating
- 145 -

SECOA, Vol. 6. Environmental Stresses and Resource Use in Coastal Urban and Peri-Urban Regions
3.3. Responses
Table 5.6. European and national legislation.
Area European legislation National legislation
Am
bien
t air
qua
lity
Directive 2008/50/EC D. lgs 13/8/10 , n. 155
Council Directive 96/62/EC D.lgs. 4/8/99, n. 351
- D.min 1/10/02 n. 261
Council Directive 1999/30/EC D.lgs 2/4/02, n. 60
Directive 2000/69/EC D.lgs 2/4/02, n. 60
Directive 2002/3/EC D.lgs 21/5/04, n. 183
Directive 2004/107/EC D.lgs 3/8/07, n. 152
- Linee guida per la predisposizione delle reti di monitoraggio della qualità dell’aria in Italia (Guidelines for the establishment of air monitoring networks in Italy, APAT CTN-ACE, 2004.)
Stat
iona
ry
Sour
ce
Emis
sion
s Council Directive 2008/1/EC D.lgs 29/6/10, n. 128
Directive 2001/80/EC D.lgs 3/4/06, n. 152
Directive 2000/76/EC D.lgs 11/5/05, n. 133
Table 5.7. Regional decrees and programs applicable to Civitavecchia.
Lazio (applicable to Civitavecchia)
Regional decrees and programs Comments
Program for the improvement of ambient air quality (2009)
Implementation of European directive 96/62/CE.
measures for attaining the limit value in the zones and agglomerations in which the levels of one or more pollutants are higher than such limit value
measure to maintain the levels of pollutants in the zones and agglomerations below the limit values
3.3.1. Pescara
The air related European and national legislation applicable to Pescara is the same as for
Civitavecchia and detailed in Table 5.8. As far as local measures are concerned,
Table 5.8. Regional decrees and programs applicable to Pescara.
Abruzzo (applicable to Pescara)
Regional decrees and programs Comments
Program for the improvement of ambient air quality (DPR 203/88, 09/2003)
The programs aims at identifying the main sources of pollution from transport, industry and domestic sources and developing policies, incentives and controls for the improvement of air quality
- 146 -

M. Beccari, et al., DPSIR Framework for Case Studies in Civitavecchia, XIII District of Rome (Ostia) and Pescara, Italy
4. DPSIR analysis
4.1. DPSIR analysis – Air quality in the municipalities of Civitavecchia and Pescara
This DPSIR frame (Figure 5.2) is meant to provide a general overview of each theme of the
analysis, as well as of the relationship between elements of driving forces, pressures etc.
Figure 5.2. DPSIR frame (Source: EEA, Air pollution in Europe 1990-2000).
4.1.1. DPSIR objective and indicators overview
Environment is a complex reality that can only be understood through the analysis of a broad
range of factors in different fields and with different methods. For these reasons, it is necessary
to develop tools capable of providing information through synthesis of a number of
characteristics: these tools are the indicators.
The selection of DPSIR indicators depends first of all on the scope and objective of the
study. In addition, indicators should be selected considering their relevance, measurability and
analytical meaning (ANPA Selezione di indicatori ambientali per I temi relative alla biosfera).
- 147 -

SECOA, Vol. 6. Environmental Stresses and Resource Use in Coastal Urban and Peri-Urban Regions
Following the above guidelines, the study has started with:
• a clear statement of the objective (with reference to the conflicts described in the
introduction) and
• the choice of the indicators, selected among the core set utilized at international level
(EEA, OECD) and evaluated according to their relevance, measurability and analytical
meaning.
4.1.1.1. Civitavecchia
Demographic indicators (Table 5.9) help identifying the factors of pressure related to
urbanization, in the sense that they express the causes of environmental and sanitary impact.
Pressures directly associated to demographic indicators include road traffic, domestic energy
consumption, waste production and others (Rapporto osservatorio ambientale Civitavecchia
2010). Within the province of Rome, Civitavecchia is one of the municipalities with the highest
population (about 52 thousands), with a continuous though inconstant growth over the past years
(up 4.4% between ’02 and ’09); population density was 725/km2 in 2009 (Figure 5.3). Both
population and density are much higher than that of the surrounding towns.
Table 5.9. Population and Density indicators of Civitavecchia case study areas (Source: CIRPS
elaboration).
Theme Demographic growth Indicator Population, Density
Class of indicator in DPSIR model D
Description Resident population in the municipality Average density of the population in the municipality
Unit Number, Number per km2
Data source ISTAT
Figure 5.3. Population and density Civitavecchia (Source: CIRPS elaboration).
Inha
bita
nts
Year
Inha
bita
nts/
km2
Year
- 148 -

M. Beccari, et al., DPSIR Framework for Case Studies in Civitavecchia, XIII District of Rome (Ostia) and Pescara, Italy
Civitavecchia is an important harbor for goods, ferries (mainly for connections to
Sardegna) and cruise ships. Transport of goods has been fluctuating over the past years, but
remains over 7 million tons per year. Passengers traffic has grown 30% between 2002 and 2009,
despite a slight decrease in 2009 (Table 5.10, Figure 5.4 and Figure 5.5).
Table 5.10. Maritime traffic indicator in Civitavecchia (Source: CIRPS elaboration).
Theme Transport Indicator Maritime Traffic
Class of indicator
in DPSIR model D
Description This indicator reports:
number of passengers per year for each main port; tons of goods transported yearly for each main port
Unit Number, ton
Data source Port authority – Report SECOA
Figure 5.4. Passengers (units) and goods (tons) - Civitavecchia seaport, (Source: www.assoporti.it).
Figure 5.5. Goods shipped (tons) - Civitavecchia seaport, (Source: www.assoporti.it).
Year
Year
- 149 -

SECOA, Vol. 6. Environmental Stresses and Resource Use in Coastal Urban and Peri-Urban Regions
Civitavecchia is a place to seat to two thermal power plants, which make it the third
biggest energy production site in Italy. Both plants have undergone significant modifications in
recent years. After repowering, Torre Valdiliga Sud (TVS) has now two units working in a
combined gas & steam cycle fuelled with natural gas, plus an additional unit for occasional peak
energy demand. Torre Valdiliga Nord (TVN) was converted from fuel oil to coal and natural gas
to increase efficiency. As a result of the governmental assessment process, a number of measures
were decreed to minimize the environmental impact. This included scaling down power output
(4 to 3 units), setting limits for the emissions of NOx, SOx, CO2 and particulates, introducing an
articulated and systematic process for the monitoring of emissions in air and ambient air quality
(Table 5.11, Table 5.12, Figure 5.6).
Both plants are present in the INES-EPER register which records emissions in air and
water from industrial activities of relevant size.
Table 5.11. Power plants indicator for Civitavecchia (Source: CIRPS elaboration).
Theme Energy Indicator Power plants
Class of indicator in DPSIR model
D
Description This indicator measures the number, the power and the fuel type of the electricity power plants.
Unit Number, MW
Data source Report SECOA WP2.1
Table 5.12. Number and fuel type of power plants in Civitavecchia (Source: CIRPS elaboration).
Case study Power plant Type Fuel type Note
Civitavecchia
Torre Valdiliga Nord
Thermal Coal and natural gas
Conversion from fuel oil to coal and natural gas after '08
Torre Valdiliga Sud
Thermal Natural gas and fuel oil
Combined gas & steam cycle, after repowering carried out between '02 and '05
- 150 -

M. Beccari, et al., DPSIR Framework for Case Studies in Civitavecchia, XIII District of Rome (Ostia) and Pescara, Italy
Figure 5.6. Power output of Civitavecchia plants.
Despite the increase in the efficiency of combustion engines and the restrictions set by
European emission standards, vehicles remain a significant source of pollutants. Motorization
rate may be taken as an indirect indicator of emissions related to road traffic (Table 5.13).
Motorization rate in Civitavecchia has been significantly increasing over the past years: the value
in 2009 was 611, up ten percent compared to the year 2000 (Figure 5.7). Such increase, together
with the rise in population, account for an additional few thousands of more vehicles on the
streets.
Table 5.13. Motorization rate indicator in Civitavecchia (Source: CIRPS elaboration).
Theme Transport Indicator Motorization rate
Class of indicator in
DPSIR model P
Description The indicators reports the number of vehicles per municipality
Unit Vehicles per 1000 inhabitants
Data source Regione Lazio
Figure 5.7. Motorization rate – Civitavecchia.
MW
Year
Year
Vehi
cles
per
10
00 in
habi
tant
s
- 151 -

SECOA, Vol. 6. Environmental Stresses and Resource Use in Coastal Urban and Peri-Urban Regions
The harbour is a source of emissions (Table 5.14) because of the ships internal combustion
engines, running during both the docking operations and the stay in port (for electricity
generation). The way pollutants get dispersed depends on several factors, including weather and
wind conditions, but it can be said that emissions may impact locally considering the height of
the ships chimneys (Table 5.15).
Table 5.14. Seaport emissions indicator for Civitavecchia (Source: CIRPS elaboration).
Theme Transport Indicator Seaport emissions
Class of indicator in DPSIR model
P
Description This indicator represents the total amount of emissions associated to ships operations in ports
Unit Mg/year, Kg/year
Data Source ISPRA
Table 5.15. Civitavecchia and Fiumicino seaport emissions.
Pollutant Unit 2000 2005
Benzene Mg 0.98 0.96
Nitrogen oxides (NOx) Mg 1,538.20 1,496.98
Ammonia (NH3) Mg 0.17 0.16
Carbon oxide (CO) Mg 142.51 138.42
PM (< 10 micron) Mg 56.16 56.72
PM (< 2.5 micron) Mg 54.91 55.81
Sulphur oxides (SOx) Mg 1,075.40 361.89
The use of natural gas and coal for power production (Table 5.16) entails the release in
atmosphere of a number of pollutants such as nitrogen oxides, sulphur oxides, particulates,
carbon oxides, ammonia, heavy metals and others. Details of emissions from the main pollutants
for the years 2000 and 2005 can be found in the tables 5.17 and 5.18. It can be noticed that the
overall trend is decreasing, with particular regard to sulphur oxides, particulate matter and
carbon oxide.
- 152 -

M. Beccari, et al., DPSIR Framework for Case Studies in Civitavecchia, XIII District of Rome (Ostia) and Pescara, Italy
Table 5.16. Emissions from industrial plants indicator for Civitavecchia (Source: CIRPS elaboration).
Theme Industrial activities
Indicator Emissions from industrial plants
Class of indicator in DPSIR model
P
Description This indicator refers to the emissions in air from plants catalogued in the INES-ENER
Unit Mg/year, Kg/year
Data source INES-ENER register
Table 5.17. Torrevaldaliga Nord (Civitavecchia case study) power plant emissions.
Pollutant Unit 2002 2003 2004 2005 2006-08 2009
Nitrogen oxides (NOx) Mg/a 5323 5266,5 2973 2074 - 834.74
Sulphur oxides (Sox) Mg/a 10480 10595 5604 3624 - 769.29
Particulate matter Mg/a 654 730.9 443 408 -
Carbon oxide (CO) Mg/a 714.4 622.4 -
Ammonia (NH3) Mg/a 11.7 14.1 - 11.47
Table 5.18. Torrevaldaliga Sud (Civitavecchia case study) power plant emissions (Source: INES register).
Pollutant Unit 2002 2003 2004 2005 2006 2007 2008 2009
Nitrogen oxides (NOx)
Mg/a 533 579 573 1457.1 892.6 1150.4 1149.82 830.8
Sulphur oxides (SOx) Mg/a 925 888 895 825.9 441.3
Particulate matter Mg/a 57 72 83.1 60.6
Ammonia (NH3) Mg/a 0.4 19.3
The regional agency for environmental protection, Arpa Lazio, is responsible for
monitoring the concentration of pollutants in ambient air according to the existing legislation. As
far as Civitavecchia is concerned, due to the presence of the power plants and the harbor, an
elaborated network of monitoring stations was set up in the municipality and in nearby towns,
in order to grasp thoroughly the status of ambient air quality and to assess the effects of emissions
in both the short and long range.
- 153 -

SECOA, Vol. 6. Environmental Stresses and Resource Use in Coastal Urban and Peri-Urban Regions
Arpa Lazio directly controls an air monitoring station within Civitavecchia and another
one in Allumiere, a town 15 km inland. Data reported below refer to the former of these two
stations (from Table 5.19 to Table 5.21, from Figure 5.8 to Figure 5.13). Data from the latter one
show a similar situation and have been screened but not mentioned in this report.
Table 5.19. SO2 Annual mean indicator in Civitavecchia (Source: CIRPS elaboration).
Theme 1 Air Quality Indicator SO2 yearly exceedances
Class of indicator in DPSIR model
S
Description This indicator reports the yearly exceedances of the
threshold established by EU legislation
Unit Number
Data source ARPA Lazio
Figure 5.8. Civitavecchia SO2 - Annual exceedances of the threshold of hourly mean (350µg/m3).
Figure 5.9. Civitavecchia SO2 - Annual exceedances of the threshold of 24 hours mean (125µg/m3).
Year
Num
ber o
f ex
ceed
ance
s
Year
Num
ber o
f ex
ceed
ance
s
- 154 -

M. Beccari, et al., DPSIR Framework for Case Studies in Civitavecchia, XIII District of Rome (Ostia) and Pescara, Italy
Table 5.20. NO2 Annual mean indicator in Civitavecchia (Source: CIRPS elaboration).
Theme 1 Air Quality Indicator NO2 exceedances of hourly mean, values of the annual mean
Class of indicator in DPSIR model S
Description This indicator reports the yearly exceedances of the threshold and the annual mean
Unit Number, µg/m3
Data source Arpa Lazio
Figure 5.10. Civitavecchia NO2 - Annual exceedances of the threshold of hourly mean (200µg/m3).
Figure 5.11. Civitavecchia NO2 - Annual mean (threshold: 40µg/m3).
Table 5.21. Particulate Annual mean indicator in Civitavecchia (Source: CIRPS elaboration).
Theme 1 Air Quality Indicator PM10 yearly exceedances
Class of indicator in DPSIR model
S
Description This indicator reports the yearly exceedances of the
Threshold
Unit Number, µg/m3
Data source Arpa Lazio
Year
Num
ber o
f ex
ceed
ance
s
Year
µg/m
3
- 155 -

SECOA, Vol. 6. Environmental Stresses and Resource Use in Coastal Urban and Peri-Urban Regions
Figure 5.12. Civitavecchia PM10 - Annual exceedances of the threshold of 24 hours mean (50µg/m3).
Figure 5.13. Civitavecchia PM10 - Annual mean (threshold 40µg/m3).
Impact indicators
Undertaking a DPSIR study of ambient air quality, three types of factors are listed among the
possible indicators of impact:
• Hospitalization rate and mortality index (“Il bilancio ambientale territoriale”, Ingegneria
ambientale vol. XXXVII n.12, A. Maffiotti).
• Population exposure to air pollution and associated risk (EEA, “Air pollution in Europe
1990-2000”).
• Air quality index (originally adopted by the US Environmental protection agency).
SSN Lazio, the regional health department, undertook an analysis of the causes of
hospitalization and mortality in the period 1996 to 2008, in Civitavecchia and neighboring
municipalities. According to the final report (Epidemiologic evaluation of the health condition of
population in Civitavecchia and nearby municipalities, 2010), “the area of Civitavecchia has a
complex environmental situation due to the presence of the harbor, the two power plants and
industrial facilities; for this reason, the area is under the spotlight, given that emissions from these
Year
Num
ber o
f ex
ceed
ance
s
Year
µg/m
3
- 156 -

M. Beccari, et al., DPSIR Framework for Case Studies in Civitavecchia, XIII District of Rome (Ostia) and Pescara, Italy
sources might affect health conditions of the population. In such a situation, it is important to
carry out an environmental monitoring aimed at controlling risk factors as well as a continuous
evaluation of health conditions of the population.” In its conclusions, the report states: “from an
integrated analysis of the mortality and hospitalization data, it can be seen that the resident
population of Civitavecchia and nearby municipalities has fewer diseases to the cardiocirculatory
system and an excess of chronic pathologies to the respiratory system (compared to the regional
mean).”
Response indicators
Table 5.22. European and national legislation indicator (Source: CIRPS elaboration).
Theme 1 Air Quality Indicator European and national legislation
Class of indicator in DPSIR model R
Description This indicators summarizes the European and national legislation related to ambient air quality and emissions of pollutants
Unit -
Data source Arpa Lazio, European Environmental Agency
Table 5.23. European and national legislation.
Area European legislation National legislation
Am
bien
t air
qua
lity
Directive 2008/50/EC D. lgs 13/8/10 , n. 155
Council Directive 96/62/EC D.lgs. 4/8/99, n. 351
- D.min 1/10/02 n. 261
Council Directive 1999/30/EC
D.lgs 2/4/02, n. 60
Directive 2000/69/EC D.lgs 2/4/02, n. 60
Directive 2002/3/EC D.lgs 21/5/04, n. 183
Directive 2004/107/EC D.lgs 3/8/07, n. 152
- Linee guida per la predisposizione delle reti di monitoraggio della qualità dell’aria in Italia (Guidelines for the establishment of air monitoring networks in Italy, APAT CTN-ACE, 2004.)
Stat
iona
ry S
ourc
e Em
issi
ons
Council Directive 2008/1/EC D.lgs 29/6/10, n. 128
Directive 2001/80/EC D.lgs 3/4/06, n. 152
Directive 2000/76/EC D.lgs 11/5/05, n. 133
- 157 -

SECOA, Vol. 6. Environmental Stresses and Resource Use in Coastal Urban and Peri-Urban Regions
Table 5.24. Regional decrees and plans indicator in Civitavecchia (Source: CIRPS elaboration).
Theme 1 Air Quality Indicator Regional decrees and plans
Class of indicator in DPSIR model R
Description This indicator provides an overview of the regional decrees and programs aimed at improving the quality of ambient air
Unit -
Data source Arpa Lazio, Regione Lazio
Table 5.25. Regional decrees and programs applicable to Civitavecchia.
Lazio (applicable to Civitavecchia)
Regional decrees and programs Comments
Program for the improvement of ambient air quality (2009)
Implementation of European directive 96/62/CE. - measures for attaining the limit value in the zones and
agglomerations in which the levels of one or more pollutants are higher than such limit value
- measure to maintain the levels of pollutants in the zones and agglomerations below the limit values
4.1.1.2. Pescara
Pescara has a population of about 120,000 inhabitants and one of the highest population densities
in Italy (3,659 inhabitants/km2). Data reported in the Figure 5.14 show that population grew 4.7%
between 2002 and 2003 and remained stable since then. Taking a broader view at the dynamics
of the past decades, the population has slightly declined due to the saturation of available spaces:
Pescara is nowadays the center of a metropolitan area where people tend to leave the city to move
to nearby towns such as Francavilla al mare, San Giovanni Teatino, Montesilvano, following a
demographic pattern typical of many modern urban agglomerates (Table 5.26).
Table 5.26. Population Density indicator for Pescara (Source: CIRPS elaboration).
Theme Demographic growth Indicator Population Density
Class of indicator in DPSIR model D
Description Resident population in the municipality Average density of the population in the municipality
Unit Number, Number per km2
Data source ISTAT
Figure 5.14. Population and density (population/km2) Pescara (Source: CIRPS elaboration).
- 158 -

M. Beccari, et al., DPSIR Framework for Case Studies in Civitavecchia, XIII District of Rome (Ostia) and Pescara, Italy
The Abruzzo International airport is located 3 km from Pescara city centre and is the only
airport in the region. Data collected show an increasing trend in the number of passengers from
2001 onwards, whereas transport of goods and overall number of airplane movements have been
fluctuating in the same period (from Figure 5.15 to Figure 5.17).
Table 5.27. Air traffic indicator within Civitavecchia and Pescara case study areas (Source: CIRPS
elaboration).
Theme Transport Indicator Air traffic
Class of indicator in DPSIR model
D
Description This indicator reports: number of airplanes per year; number of passengers per year; tons of goods transported yearly.
Unit Number, ton
Data source Airport authority – Report SECOA
Figure 5.15. Airport movements - Pescara Airport, (Source: www.abruzzoairport.com).
Year
Inha
bita
nts
Year
Inha
bita
nts/
km2
Year
Num
ber o
f airp
lane
s per
ye
ar
- 159 -

SECOA, Vol. 6. Environmental Stresses and Resource Use in Coastal Urban and Peri-Urban Regions
Figure 5.16. Passengers (units) - Pescara Airport, (Source: www.abruzzoairport.com).
Figure 5.17. Goods shipped (tons) - Pescara Airport, (Source: www.abruzzoairport.com).
The harbor of Pescara was restructured in 1995, with the construction of two additional
quaysand soon new connections by ferry and hydrofoil started. While traffic of goods is
fluctuating, the total number of ships movements has been increasing due to ferry and hydrofoil
service to Croatia and Albania (572 ship movements, 48,000 passengers in ‘06) (Figure 5.18 and
Figure 5.19).
Table 5.28. Maritime traffic indicator for Pescara (Source: CIRPS elaboration).
Theme Transport Indicator Maritime Traffic
Class of indicator In DPSIR model
D
Description This indicator reports:
number of passengers per year for each main port; tons of goods transported yearly for each main port
Unit Number, ton
Data source Port authority – Report SECOA
Year
Pass
enge
rs
Year
Tons
of g
oods
- 160 -

M. Beccari, et al., DPSIR Framework for Case Studies in Civitavecchia, XIII District of Rome (Ostia) and Pescara, Italy
Figure 5.18. Passengers (units) - Pescara seaport, (Source: www.assoporti.it).
Figure 5.19. Goods shipped (tons) - Pescara seaport, (Source: www.assoporti.it).
Table 5.29. Relevant industrial plants indicator for Pescara (Source: CIRPS elaboration).
Theme Industrial activities Indicator Relevant industrial plants
Class of indicator
in DPSIR model D
Description This indicator refers to the number of industrial plants within the municipality, catalogued in the INES-EPER
Unit Number
Data source INES-EPER
Table 5.30. Activities included in INES/ENER register (E-PRTR) Pescara case (Source: CIRPS
elaboration).
Location Facility Activity
Pescara Lafarge Cementi srl / Adriasebina srl Production of cement clinker
Year
Pass
enge
rs
Year
Tons
of g
oods
- 161 -

SECOA, Vol. 6. Environmental Stresses and Resource Use in Coastal Urban and Peri-Urban Regions
Motorization rate (Table 5.31) in Pescara has been fluctuating in the past ten years, always
remaining above the level of 600 vehicles per 1000 population (Figure 5.20). This level is basically
in line with the national average, which is the highest in Europe and can be considered to have
considerable effects in terms of contribution to air pollution.
Table 5.31. Motorization rate indicator for Pescara (Source: CIRPS elaboration).
Theme Transport Indicator Motorization rate
Class of indicator
in DPSIR model P
Description The indicators reports the number of vehicles per municipality
Unit Vehicles per 1000 inhabitants
Data source ISTAT
Figure 5.20. Motorization rate – Pescara (source ISTAT).
Seaport emissions (Table 5.32) in the years 2000 and 2005 reflect the trend of the increasing
activities of the harbor in terms of passengers and ship movements; emissions of nitrogen oxides,
sulphur oxides soared while those of particulates, carbon oxide and benzene also increased (Table
5.33).
Table 5.32. Seaport emissions indicator for Pescara (Source: CIRPS elaboration).
Theme Transport Indicator Seaport emissions
Class of indicator in DPSIR model
P
Description This indicator represents the total amount of emissions associated to ships operations in ports
Unit Mg/year, Kg/year
Data Source ISPRA
Year
Vehi
cles
/100
0 in
habi
tant
s
- 162 -

M. Beccari, et al., DPSIR Framework for Case Studies in Civitavecchia, XIII District of Rome (Ostia) and Pescara, Italy
Table 5.33. Pescara seaport emissions (Source: ISPRA).
Pollutant Unit 2000 2005
Benzene Mg 0.00 0.04
Nitrogen oxides (NOx) Mg 0.16 70.39
Ammonia (NH3) Mg 0.00 0.01
Carbon oxide (CO) Mg 0.06 5.31
PM (< 10 micron) Mg 0.03 2.52
PM (< 2.5 micron) Mg 0.02 2.55
Sulphur oxides (SOx) Mg 0.09 16.94
Emissions associated to the airport (Table 5.34) originate from the take-off and landing of
airplanes and are calculated based on the airplane movements for the zone between ground level
and 1000 m of altitude (ISPRA, National inventory of emissions). Data are available for the years
2000 and 2005 and show an evident augmentation of values; the most relevant emissions are those
of carbon dioxide (+16%), carbon oxide (+55%) and nitrogen oxides (+13%). This is in line with
the increase in airport movements that took place in the same period (+54% between 2001 and
2005) (Table 5.35).
Table 5.34. Airport emissions indicator for Pescara (Source: CIRPS elaboration).
Theme Transport Indicator Airport emissions
Class of indicator in
DPSIR model P
Description This indicator represents the total amount of emissions associated to airplanes landing and taking off at airport
Unit Mg/year, Kg/year
Data Source ISPRA
- 163 -

SECOA, Vol. 6. Environmental Stresses and Resource Use in Coastal Urban and Peri-Urban Regions
Table 5.35. Pescara airport emissions (Source: ISPRA).
Pollutant Unit 2000 2005
Benzene Mg 0.07 0.15
Nitrogen oxides (NOx) Mg 13.61 15.40
Carbon dioxide (CO2) Mg 3488 4060
Carbon oxide (CO) Mg 14.02 21.76
PM (< 10 micron) Mg 0.06 0.09
PM (< 2.5 micron) Mg 0.06 0.09
Sulphur oxides (SOx) Mg 1.12 1.31
The cement clinker plant in Pescara municipality is registered in the INES-ENER report
(Table 5.36). Data related to emissions are shown in the Table 5.37.
Table 5.36. Emissions from industrial plants indicator in Pescara (Source: CIRPS elaboration).
Theme Industrial activities
Indicator Emissions from industrial plants
Class of indicator in DPSIR model
P
Description This indicator refers to the emissions in air from plants catalogued in the INES-ENER
Unit Mg/year, Kg/year
Data source INES-ENER
Table 5.37. LAFARGE ADRIASEBINA S.R.L. emissions (Source: INES register).
Pollutant Unit 2002 2003 2004 2005 2006 2007 2008 2009
Nitrogen oxides
(Nox) Mg/a
636
613
561
744
833
465
404
298
Sulphur oxides (Sox) Mg/a 341 154
Carbon oxide (CO) Mg/a 559 533
Ammonia (NH3) Mg/a 38 38 30
The air monitoring network of Pescara is nowadays composed of 6 stations for detection
of pollutants. The study has focused on the state of ambient air quality in relation to three
- 164 -

M. Beccari, et al., DPSIR Framework for Case Studies in Civitavecchia, XIII District of Rome (Ostia) and Pescara, Italy
pollutants: SO2, NO2, PM10, same as for Civitavecchia. Data coverage is not complete and varies
depending on the years and stations. The Table 5.38 provides an overview of the available data:
Table 5.38. Air monitoring stations and data availability in Pescara (Source: CIRPS elaboration).
Pollutant Station 2002 2003 2004 2005 2006 2007 2008
SO2 Teatro D’annunzio N/A N/A O N/A O O O
NO2
P.za Grue O N/A N/A O O O O
Vit. Emanuele O N/A N/A O O O O
Via Firenze O N/A N/A O O O O
PM10
P.za Grue O N/A O O O O N/A
Via Firenze O N/A O O O N/A N/A
The analysis of available data show a no concern situation for SO2 (Table 5.39), for which
no exceedances of the 24 hours mean were registered in the years 2004, 2006, 2007 and 2008
(Figure 5.21). Data related to the hourly mean, however, are not available.
Thresholds for NO2 and PM10 (Table 5.40 and Table 5.41), on the contrary, were exceeded
by far. In particular, the monitoring station of Vittorio Emanuele registered and annual mean of
NO2 significantly above the threshold in the years 2002, 2003 and 2005 to 2008 (no data for 2004).
The annual mean of PM10 concentration in the station of via Firenze was beyond permissible
limits in all years between 2002 and 2006, though with a decreasing trend and close to the limit
in 2007. In the same location, the number of days when the PM10 24 hours alert threshold was
surpassed peaked to 273 in 2002 and averaged 109 days in the years 2004 to 2006. The station of
Piazza Grue also exceeded significantly the limits of 24 hours threshold in all years between 2002
and 2007 (except 2003, when data is not available) (Figure 5.22 to Figure 5.25).
Table 5.39. SO2 threshold exceedances indicator in Pescara (Source: CIRPS elaboration).
Theme 1 Air Quality Indicator SO2 yearly exceedances
Class of indicator in DPSIR model S
Description This indicator reports the yearly exceedances of the
threshold established by EU legislation
Unit Number
Data source ARTA Abruzzo
- 165 -

SECOA, Vol. 6. Environmental Stresses and Resource Use in Coastal Urban and Peri-Urban Regions
Figure 5.21. Pescara SO2 - Annual exceedances of the threshold of 24 hours mean (125µg/m3).
Table 5.40. NO2 Annual mean indicator in Pescara (Source: CIRPS elaboration).
Theme 1 Air Quality Indicator NO2 exceedances of hourly mean, values of the annual mean
Class of indicator in
DPSIR model S
Description This indicator reports the yearly exceedances of the threshold of hourly mean and the annual mean
Unit Number, µg/m3
Data source ARTA Abruzzo
Figure 5.22. Pescara NO2 - Annual exceedances of the threshold of hourly mean (200µg/m3).
Year
Num
ber o
f ex
ceed
ance
s
Year
µg/m
3
- 166 -

M. Beccari, et al., DPSIR Framework for Case Studies in Civitavecchia, XIII District of Rome (Ostia) and Pescara, Italy
Figure 5.23. Pescara NO2 - Annual mean (threshold: 40µg/m3).
Table 5.41. Particulate Annual mean indicator in Pescara (Source: CIRPS elaboration).
Theme 1 Air Quality Indicator PM10 limits: yearly exceedances of the 24hrs mean, annual mean
Class of indicator in DPSIR model S
Description This indicator reports the yearly exceedances of the threshold for 24 hrs mean and the annual mean
Unit Number, µg/m3
Data source ARTA Abruzzo
Figure 5.24. Pescara PM10 - Annual exceedances of the threshold of 24 hours mean (50µg/m3).
Year
µg/m
3
Year
Num
ber o
f ex
ceed
ance
s
- 167 -

SECOA, Vol. 6. Environmental Stresses and Resource Use in Coastal Urban and Peri-Urban Regions
Figure 5.25. Pescara PM10 - Annual mean (threshold 40µg/m3).
Response indicators
The air related European and national legislation applicable to Pescara is the same as for
Civitavecchia and detailed in Table 5.6. As far as local measures are concerned.
Table 5.42. Regional decrees and plans indicator in Pescara (Source: CIRPS elaboration).
Theme 1 Air Quality Indicator Regional decrees and plans
Class of indicator in DPSIR model R
Description This indicator provides an overview of the regional decrees and programs aimed at improving the quality of ambient air
Unit -
Data source Regione Abruzzo
Table 5.43. Regional decrees and programs applicable to Pescara.
Abruzzo (applicable to Pescara)
Regional decrees and programs Comments
Program for the improvement of ambient air quality (DPR 203/88, 09/2003)
The programs aims at identifying the main sources of pollution from transport, industry and domestic sources and developing policies, incentives and controls for the improvement of air quality
Year
µg/m
3
- 168 -

M. Beccari, et al., DPSIR Framework for Case Studies in Civitavecchia, XIII District of Rome (Ostia) and Pescara, Italy
4.2. DPSIR analysis – Coastal Water Quality in the XIII District of Rome
Figure 5.26. DPSIR frame (Source: EEA, Air pollution in Europe 1990-2000).
- 169 -

SECOA, Vol. 6. Environmental Stresses and Resource Use in Coastal Urban and Peri-Urban Regions
4.2.1. DPSIR Objective and indicators
The selection of DPSIR indicators depends first of all on the scope and objective of the study. In
addition, indicators should be selected considering their relevance, measurability and analytical
meaning.
Following the above guidelines, the study has started with:
• a clear statement of the objective (with reference to the conflicts described in the
introduction). The objective is to understand and evaluate the state and trend of ambient
water quality in relation to its impact on human health and the natural environment, and
• the choice of the indicators, selected among those presented above and evaluated
according to their relevance, measurability, availability and analytical meaning to analyze
the coastal water quality.
In this case study according to the DPSIR method, different indicators have been selected
and analyzed, depending first of all on their relevance and capability of describing accurately
with few of them the physical, chemical and biological quality of coastal water.
Table 5.44. Pressure on coastal water.
P – Pressure
Theme Indicators
Water consumption Water consumption for domestic use (m3/res)
River Water Quality BOD5, COD, N-NH4, N-NH3, Ptot,P-PO
Table 5.45. Water consumption for domestic use indicator within XIII Municipality of Rome.
Theme Water consumption
Indicator water consumption for domestic use (m3/res)
Class of indicator in DPSIR model
P – Pressure
Description water consumption for domestic use (m3/res) in the whole Municipality of Rome. Sampling period: 2000 – 2007
Unit m3/resident
Data source ISPRA elaboration on ISTAT database
Table 5.46. Water consumption for domestic use (m3/res) in the whole Municipality of Rome.
Year 2000 2001 2002 2003 2004 2005 2006 2007
m3/resident 97.5 99.6 96.4 92.7 83.6 83 89.6 87
- 170 -

M. Beccari, et al., DPSIR Framework for Case Studies in Civitavecchia, XIII District of Rome (Ostia) and Pescara, Italy
Figure 5.27. Water consumption for domestic use (m3/res) in Rome (Source: ISPRA elaboration on
ISTAT database).
Table 5.47. Tiber river water quality indicator in the whole XIII Municipality of Rome.
Theme River water quality
Indicator Tiber river water quality measured at Ripetta Bridge in Rome,:BOD5, COD, N-NH4, N-NH3, Ptot, P- PO
Class of indicator in DPSIR model
P – Pressure
Description Tiber river water quality measured at Ripetta Bridge in Rome,: BOD5, COD, N-NH4, N-NH3, Ptot,P-PO . Sampling period: 2000 – 2008
Unit BOD5 O2 mg/l, COD O2 mg/l, N-NH4 mg/l, N-NH3 mg/l, Ptot mg/l,P-PO4 mg/l.
Data source ISPRA elaboration on Regional and ARPA database
Table 5.48. Tiber river water quality, measured at Ripetta Bridge in Rome downtown.
River Municipality Sampling Place Year BOD5 O2
mg/l COD O2
mg/l N-NH4
mg/l N-NH3
mg/l Ptot mg/l
P-PO4
mg/l
Tiber Rome Ponte Ripetta 2000 6.56 0.84 16.58 0.27
Tiber Rome Ponte Ripetta 2001 4.88 0.66 10.77 0.2
Tiber Rome Ponte Ripetta 2002 3.15 4.23 0.72 1.59 0.18
Tiber Rome Ponte Ripetta 2003 4.85 7.62 0.91 1.69 0.25
Tiber Rome Ponte Ripetta 2004 4.4 7.81 0.6 2.17 0.26
Tiber Rome Ponte Ripetta 2005 4.68 7.92 0.69 2.79 0.24
Tiber Rome Ponte Ripetta 2006 4.2 7.57 0.91 2.04 0.23 0.18
Tiber Rome Ponte Ripetta 2007 1.02 1.57 3.95 8.2 0.22 0.17
Tiber Rome Ponte Ripetta 2008 4.39 10.51 0.79 0.18 0.18 0.14
Year
m3 /
resi
dent
- 171 -

SECOA, Vol. 6. Environmental Stresses and Resource Use in Coastal Urban and Peri-Urban Regions
Figure 5.28. Tiber river water quality at Ripetta Bridge in Rome downtown: BOD5, COD, N-NH4, N-
NH3, Ptot,P-PO4 (source: ISPRA elaboration on Regional and ARPA database).
Next, we analyze the state of coastal water, using for brevity only one sampling station,
located as shown in Figures 5.29 and 5.30, for further studies the total sampling stations available
are seven spanning from north to south the coastal water of the whole XIII District of Rome.
This sampling point has been chosen for its relevance to analyze coastal water quality.
Table 5.49. State of coastal water.
S – State Theme Chosen Indicators Coastal Water Quality Fecal Coliforms Transparency pH Bathing water
Figure 5.29. The XIII District of Rome (OSTIA), in red shown the sampling station 2
mg/
l
- 172 -
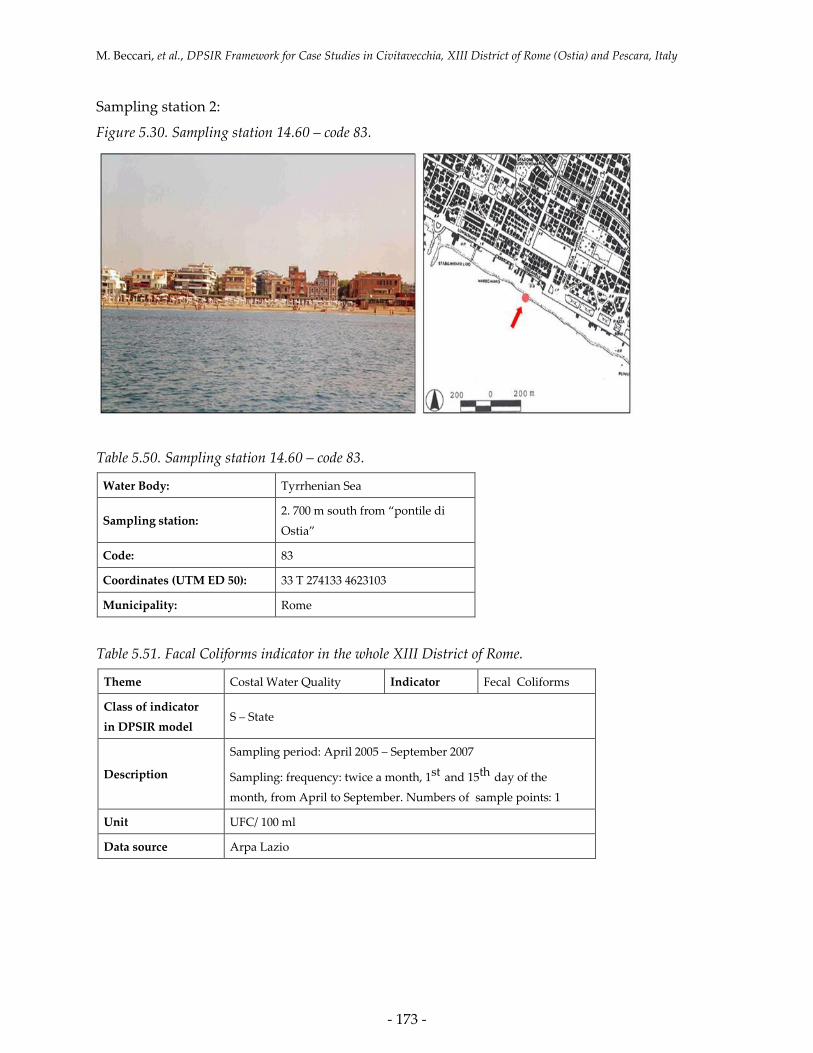
M. Beccari, et al., DPSIR Framework for Case Studies in Civitavecchia, XIII District of Rome (Ostia) and Pescara, Italy
Sampling station 2:
Figure 5.30. Sampling station 14.60 – code 83.
Table 5.50. Sampling station 14.60 – code 83.
Water Body: Tyrrhenian Sea
Sampling station: 2. 700 m south from “pontile di
Ostia”
Code: 83
Coordinates (UTM ED 50): 33 T 274133 4623103
Municipality: Rome
Table 5.51. Facal Coliforms indicator in the whole XIII District of Rome.
Theme Costal Water Quality Indicator Fecal Coliforms
Class of indicator in DPSIR model
S – State
Description
Sampling period: April 2005 – September 2007
Sampling: frequency: twice a month, 1st and 15th day of the
month, from April to September. Numbers of sample points: 1
Unit UFC/ 100 ml
Data source Arpa Lazio
- 173 -

SECOA, Vol. 6. Environmental Stresses and Resource Use in Coastal Urban and Peri-Urban Regions
The presence of fecal coliform bacteria in aquatic environments indicates that the water
has been contaminated with the fecal material of man or other animals. At the time this occurred,
the source water may have been contaminated by pathogens or disease producing bacteria or
viruses which can also exist in fecal material. Some waterborne pathogenic diseases include
typhoid fever, viral and bacterial gastroenteritis and hepatitis A. The presence of fecal
contamination is an indicator that a potential health risk exists for individuals exposed to this
water. Fecal coliform bacteria may occur in ambient water as a result of the overflow of domestic
sewage or nonpoint sources of human and animal waste (Figure 5.31).
Figure 5.31. Fecal Coliforms - 700 m south from “pontile di Ostia” - sampling station 2. – code 83.
Table 5.52. Transparency indicator in the whole XIII District of Rome.
Theme Coastal Water Quality Indicator Transparency
Class of indicator in DPSIR model S – State
Description
Sampling period: April 2005 – September 2007
Sampling: frequency: twice a month, 1st and 15th day of the
month, from April to September. Numbers of sample points: 1
Unit meters, m
Data source Arpa Lazio
- 174 -

M. Beccari, et al., DPSIR Framework for Case Studies in Civitavecchia, XIII District of Rome (Ostia) and Pescara, Italy
Transparency is an important indicator (Table 5.52) from both the chemical and the
biological point of view, considered by current laws as a macro-descriptor for lakes and as a basic
parameter for sea and transitional waters. Water transparency is furthermore one of the features
most sought after by tourists, especially those passionate with diving and is then an effective
information for the enhancement of the touristic offer. Transparency is expressed in meters and
corresponds to the depth until which a white disk, called Secchi disk, remains visible when
submerged. Such method is commonly used to empirically evaluate the sea transparency at a
certain point.
Figure 5.32. Transparency - 700 m south from “pontile di Ostia” - sampling station 2. – code 83.
Table 5.53. pH indicator in the whole XIII District of Rome.
Theme Costal Water Quality Indicator pH
Class of indicator in DPSIR model
S – State
Description
Sampling period: April 2005 – September 2007
Sampling: frequency: twice a month, 1st and 15th day of the
month, from April to September. Numbers of sample points: 1
Unit pH
Data source Arpa Lazio
- 175 -

SECOA, Vol. 6. Environmental Stresses and Resource Use in Coastal Urban and Peri-Urban Regions
The pH (Table 5.53) is the negative logarithm (base 10) of the chemical activity
(concentration in mol•L-1) of the hydrogen ion in solution. The pH scale indicates a neutral
solution at pH 7.0, an acidic solution below 7.0 and an alkaline (basic) solution above 7.0. The pH
of marine waters is usually quite stable (between 7.5 and 8.5 worldwide) and is similar to that of
estuarine waters because of the buffering capacity provided by the abundance of strong basic
cations such as sodium, potassium and calcium and of weak acid anions such as carbonates and
borates. Fluctuations in pH due to anthropogenic influences in aquatic environments are largely
the effects of industrial activities.
Figure 5.33. pH at 700 m south from “pontile di Ostia” - sampling station 2. – code 83.
Table 5.54. Balneability indicator within XIII Municipality Of Rome.
Theme Coastal water quality Indicator Bathing water
Class of indicator in DPSIR model
S –State
Description The indicator values if bathing is allowed in coastal water, according to Italian laws:
- until 30/06/2010 by D.p.r. N.470/82 modified by art. 17 del D.lgs N.116/08
- starting from 01/07/2010 by Decreto 30/03/2010 and D.lgs N.116/08
Sampling period: April 2006 – September 2011
Data source RSA Arpa Lazio, Ministero della Salute
- 176 -

M. Beccari, et al., DPSIR Framework for Case Studies in Civitavecchia, XIII District of Rome (Ostia) and Pescara, Italy
Table 5.55. Limits provided by Decreto 30/03/2010.
Limit values for bathing water for a single sample
Parameters Water body Values
Intestinal Enterococci Sea water 200
n∗/100ml
Escherichia coli Sea water 500 n∗/ 100
Ml
Figure 5.34. Municipality of Fiumicino, bathing and no bathing waters.
Legend:
Bathing water
No Bathing water caused by pollution
No Bathing water caused by issues different from pollution (i.e., ports, military areas,
mouths of rives, etc.)
∗ n = UFC forEN ISO 9308-1 (E. coli) and EN ISO 7899-2 (Enterococchi) o MPN per EN ISO 9308-3 (E.coli) and
EN ISO 7899-1 (Enterococchi).
- 177 -

SECOA, Vol. 6. Environmental Stresses and Resource Use in Coastal Urban and Peri-Urban Regions
Sampling point 2006 2007 2008 2009 2010 2011
58 - 250 m north from foce fosso cupino --- - Foce fosso cupino 309 - 250 m south from foce fosso cupino 310 - 250 m north from foce fosso delle cadute --- - Foce fosso delle cadute 311 - 250 m south from foce fosso delle cadute 60 - 1200 m south from fosso delle cadute 61 – m 250 north from fosso tre denari --- - Foce fosso tre denari 62 – m 250 south from fosso tre denari 324 - 1000 m south from fosso tre denari 63 - 250 m north from foce fiume arrone --- - Foce fiume arrone 64 - 250 m south from foce fiume arrone 66 - 2000 m south from foce f. Arrone 67 - 3500 m south from foce f. Arrone 264 - 500 m north from collettore acque alte e basse 414 - foce collettore acque alte e basse 69 - 250 m south from collettore acque alte e basse 71 - 2000 m south from collettore acque alte e basse 72 - radar --- - Foce fiumara piccola fiume tevere 410 - 250 m south from fiumara piccola 411 - 1250 m south from fiumara piccola --- - Foce fiumara grande fiume tevere
- 178 -

M. Beccari, et al., DPSIR Framework for Case Studies in Civitavecchia, XIII District of Rome (Ostia) and Pescara, Italy
North and South North and South respect to the coastal line
Values lower respect to the currently law
Values higher respect to the currently law
Area with interdicted balneation caused by issues different from pollution (i.d., ports, military areas, mouths of rives, etc.)
Measurements in progress
Figure 5.35. XIII District of Rome, bathing and no bathing waters.
Legend:
Bathing water
No Bathing water caused by pollution
No Bathing water caused by issues different from pollution (i.e., ports, military areas,
mouths of rives, etc.)
- 179 -

SECOA, Vol. 6. Environmental Stresses and Resource Use in Coastal Urban and Peri-Urban Regions
Sampling points 2006 2007 2008 2009 2010 2011
--- - Foce fiumara grande fiume tevere --- - Porto di roma 81 - ostia stabulazione molluschi masone 82 – 850 m north from pontile ostia 83 – 700 m south from pontile ostia 416 - foce canale dello stagno 315 - 550 m south from foce canale dello stagno 86 - 2000 m south from canale dei pescatori 87 - 3000 m north from fosso focetta --- - Spiaggia presidenziale 89 – m 250 north from canale di pantanello --- - Canale di pantanello 90 – m 250 south from canale di pantanello 316 - foce fosso tellinaro 92 - 1600 m south from foce fosso tellinaro
North and south
North and South respect to the coastal line
Values lower respect to the currently law
Values higher respect to the currently law
Area with interdicted balneation caused by issues different from pollution (i.d., ports, military areas, mouths of rives, etc.)
Measurements in progress
- 180 -

M. Beccari, et al., DPSIR Framework for Case Studies in Civitavecchia, XIII District of Rome (Ostia) and Pescara, Italy
5. Conclusions
5.1. Civitavecchia and Pescara
The study has shown that, despite the differences between two case studies as territorial
extension and as socio-economic fabric, both of them have common environmental problems that
are typical of coastal areas.
In particular, the phenomena of environmental pressure are significant. They are due to
the built up area, to the tourist activities and more generally to the anthropogenic activities:
traffic, heating systems and seaport are the main causes of air pollution. In particular the seaport
emissions is the most relevant for the citizens: in fact not only the amount of emissions is relevant
but the “low” height of the chimneys and the proximity to the coast of the ships leads to a relapse
of the emissions in the urban context.
5.2. Municipality of Ostia
The most critical aspect is given by the sewer system that was designed for the collection of
sewage, but nowadays receives also rainwater. Consequently, the sewer system is insufficient to
dispose of the flow rates even when rainfalls are of moderate intensity, thus causing a remarkable
contamination of the natural hydrographic system due to the storm overflow at the pumping
stations. Thus the heavy pollution in the main canals (Canale dei Pescatori e Canale Palocco)
causes an increasing environmental decline of the coastal areas.
- 181 -

SECOA, Vol. 6. Environmental Stresses and Resource Use in Coastal Urban and Peri-Urban Regions
6. References
Canadian Water Quality Guidelines for the Protectionof Aquatic Life – pH EEA core set
indicators 2005.
EC position paper on NO2, SO2, PM, Ozone, benzene.
Environmental observatory Civitavecchia - Analisi statistica dati rete qualita aria
CIVITAVECCHIA EU Council Directive 96 62 EC ambient air quality.
EU Directive 2008 50 EC - ambient air quality European environment agency – Dobris assessment
ISPRA Inventario nazionale emissioni ISPRA 2005
ISPRA Rapporto ISPRA aree portuali e traffico marittimo.
Minister of economic development BEN - Bilancio Energetico Nazionale Minister of
infrastructures and transport – Conto nazionale dei trasporti Municipality of
Civitavecchia – Environmental report.
Servizio sanitario nazionale - Epidemiologic study of the health condition of population in
Civitavecchia.
The European Water Framework Directive and the DPSIR, a methodological approach to assess
the risk of failing to achieve good ecological status A. Borja, I. Galparsoro, O. Solaun, I.
Muxika, E. Marıa Tello, A. Uriarte & V. Valencia, AZTIdTecnalia, Marine Research
Division, Herrera Kaia, Portualdea s/n, 20110 Pasaia, Spain.
The DPSIR Framework, P. Kristensen, National Environmental Research Institute, Denmark
Department of Policy Analysis, European Topic Centre on Water, European Environment
Agency
Websites
National institute of statistics: http://demo.istat.it/
Piemonte region environment agency
http://rsaonline.arpa.piemonte.it/indicatori/index.asp.htm
Municipality of Pescara: www.comune.pescara.it
Agency for the economic and touristic development of the coast of Lazio: http://www.
litoralespa.it/
Minister of infrastructures and transport: http://www.mit.gov.it/
- 182 -

M. Beccari, et al., DPSIR Framework for Case Studies in Civitavecchia, XIII District of Rome (Ostia) and Pescara, Italy
Civitavecchia environmental observatory: http://www.ambientale.org/
Minister of economic development: http://www.sviluppoeconomico.gov.it/
CONVENTION ON LONG-RANGE TRANSBOUNDARY AIR POLLUTION: http://sedac.ciesin.
org/entri/texts/transboundary.air.pollution.1979.html
European Commission – Environment: http://ec.europa.eu/environment/air/index_en.htm
UN Department of economic and social affairs: http://www.un.org/esa/dsd/agenda21/
INES ENER website: http://www.eper.sinanet.apat.it/site/it-IT/
http://www.eea.eu.int/
EEA 2003: Europe’s water: an indicator-based assessment: http://reports.eea.eu.int/topic_
report_2003_1
EEA Indicators: http://themes.eea.eu.int/Speci.c_media/water/reports/indicators
EEA 1999: Environmental indicators: Typology and overview
Technical report No 25. Available at http://reports.eea.eu.int/TEC25/en/tab_content_RLR
EEA European Topic Centre on Water: http://water.eionet.eu.int/
GIWA Causal chain analysis http://www.giwa.net/caus_iss/causual_chain_analyses.phtml
National Environmental Research Institute, Denmark: www.dmu.dk
South Africa - State of the Environment Reporting: Indicators: http://www.environment.
gov.za/soer/indicator/index.htm
Inland water indicators: http://www.environment.gov.za/soer/indicator/Inland_Water.htm
About fecal coliforms: http://water.epa.gov/type/rsl/monitoring/vms511.cfm
http://www.state.ky.us/nrepc/water/wcpfcol.htm
About Water Transparency: http://www.flyby.it/images/brochure/servizi_marittimi/1_water_
quality.pdf
About Water Quality and pH: http://www.h2ou.com/h2wtrqual.htm
About Bathing water: http://www.camera.it/parlam/leggi/deleghe/08116dl.htm
http://www.governo.it/GovernoInforma/Dossier/Rapporto_acque_2010/decreto_2010033
0.pdf
- 183 -

SECOA, Vol. 6. Environmental Stresses and Resource Use in Coastal Urban and Peri-Urban Regions
ANNEX
1. Framework for sustainable development index
Over the past two decades, environmental sustainability has been in the agenda of several
political institutions at the local, national and international level (notably the United Nations and
the European Union). At the same time, a number of relevant organizations, foundations and
research centers have been striving to establish an empirical basis and fact-based framework for
environmental policy making, with particular regard to the definition of indicators of
environmental sustainability (ESI) and environmental development (SDI): “the move toward a
more data-driven empirical approach to environmental protection promises to better enable
policymakers to spot problems, track trends, highlight policy successes and failures, identify best
practices and optimize the gains from investments in environmental protection” (2010
ENVIRONMENTAL PERFORMANCE INDEX Yale University, Columbia University).
In this paragraph, the scope of this research is contextualized within the framework
provided by the EU political background and policies, which have been taken as a reference
guideline. In 2001, during the meeting of the EU Heads of States or Government in Gothenburg,
the sustainable development strategy was endorsed, in an attempt to translate the vague idea of
sustainable development into a concrete operational strategy, which tried to define what
sustainability is and to highlight clearly unsustainable trends in the economic, social and
environmental dimensions.
In 2005, Eurostat issued a report (Measuring progress towards a more sustainable Europe)
with a view to “provide a quantitative analysis to support the process [of strategy review] as well
as to inform the general public about progress achieved since the strategy was adopted in
Gothenburg”. The technical background is a framework “conceived to provide a clear and easily
communicable structure for the SDIs … based on priority policy issues ”and a set of indicators
forming a basis for “regular monitoring of progress in the headline objectives of the sustainable
development strategy”. The framework comprises ten themes, two of which are relevant to the
present work:
- 184 -

M. Beccari, et al., DPSIR Framework for Case Studies in Civitavecchia, XIII District of Rome (Ostia) and Pescara, Italy
Table 5.56. Link between DPSIR theme and EU sustainability framework.
EU framework theme DPSIR theme
Public health Air quality
Management of natural resources Water quality
Land use
The Eurostat report highlights that there are “several priority areas for which no
information or only partial information is currently available”. Lack of data, poor quality data
and data not available at the desired level of disaggregation, undermine a thorough investigation
and data-based understanding of the themes and trends in time; in fact, the report underlines
that many of the indicators listed are actually not available and that their feasibility should be
investigated for further progress.
2. Assessment of natural resources use - Air
Ambient air quality can be assessed based on the concentration of pollutants and indexes can be
developed accordingly. National and regional environmental agencies in several countries
calculate Air Quality Indexes on a daily basis; an Air Quality Index (AQI) is “an index for
reporting daily air quality. It tells you how clean or unhealthy your air is and what associated
health effects might be a concern. The AQI focuses on health effects you may experience within
a few hours or days after breathing unhealthy air” (US Environmental protection agency). Such
AQI is therefore aimed at evaluating short term health risks for the population linked to air
pollution; in some cases, recommendations to the overall population or to certain categories of
people (for instance children and older adults) may be developed in relation to AQI values, to
minimize risks related to high levels of pollutants.
Since AQI values are not available for the two case study areas of Civitavecchia and
Pescara, they cannot be used for the calculation of indexes of sustainability; however, they
provide a reference for such purpose.
Different agencies calculate AQIs with different methods and different pollutants are
taken into account, generally among the following ones: ground level ozone, particle pollution,
carbon monoxide, nitrogen dioxide and sulfur dioxide.
For the calculation of indexes in the two case study areas, the pollutants taken into account
are those for whom measurement of concentrations are available from air monitoring stations:
- 185 -

SECOA, Vol. 6. Environmental Stresses and Resource Use in Coastal Urban and Peri-Urban Regions
NO2, SO2, PM10. The reference values used for calculation and for the annulment of the dimension
are the maximum number of exceedances of thresholds, defined by European legislation.
Calculation of index is explained below:
(1)
Ii : index related to the pollutant
“i”.
Nmax: maximum number of yearly exceedances of threshold, as established by EU
legislation.
Nsup: number of exceedances of the threshold during the year (as measured by the
monitoring station).
An index scores between 0 and 1 when yearly exceedances are below the maximum
established by legislation and is above 1 when exceedances are beyond such maximum. In the
latter case, the index may express “unsustainability”, in the sense that population is at risk of
those health effects associated with long term exposures of the corresponding pollutant. The
three indicators for NO2, SO2, PM10 should be calculated separately.
2.1. Civitavecchia
The tables 5.57 and 5.58 summarize the state indicators for ambient air quality in the years
2002, 2005 and 2009:
Table 5.57. Civitavecchia state indicators for ambient air quality in the years 2002, 2005 and 2009.
Pollutant Reference Indicator Threshold 2002 2005 2009
NO2 Yearly exceedances of the hourly mean 18 0 0 0
SO2 Yearly exceedances of the 24 hours mean 3 0 0 0
PM10 Yearly exceedances of the 24 hours mean 35 NA 4 5
- 186 -
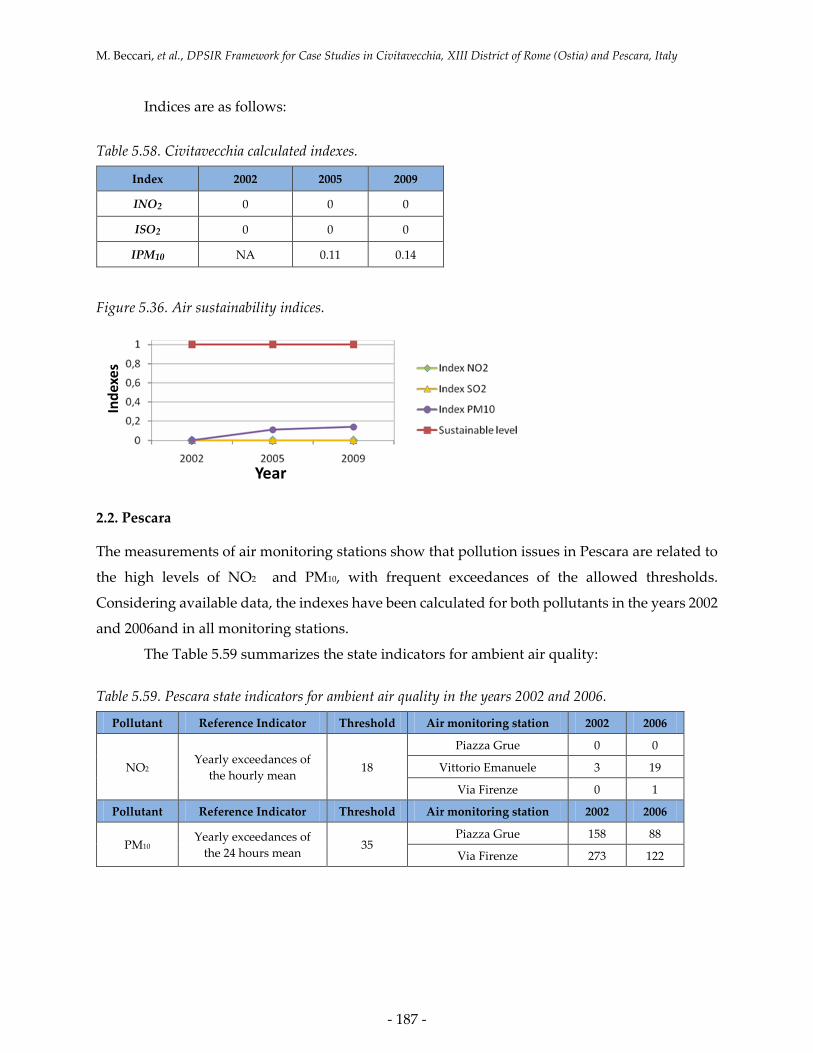
M. Beccari, et al., DPSIR Framework for Case Studies in Civitavecchia, XIII District of Rome (Ostia) and Pescara, Italy
Indices are as follows:
Table 5.58. Civitavecchia calculated indexes.
Index 2002 2005 2009
INO2 0 0 0
ISO2 0 0 0
IPM10 NA 0.11 0.14
Figure 5.36. Air sustainability indices.
2.2. Pescara
The measurements of air monitoring stations show that pollution issues in Pescara are related to
the high levels of NO2 and PM10, with frequent exceedances of the allowed thresholds.
Considering available data, the indexes have been calculated for both pollutants in the years 2002
and 2006and in all monitoring stations.
The Table 5.59 summarizes the state indicators for ambient air quality:
Table 5.59. Pescara state indicators for ambient air quality in the years 2002 and 2006.
Pollutant Reference Indicator Threshold Air monitoring station 2002 2006
NO2 Yearly exceedances of
the hourly mean 18
Piazza Grue 0 0
Vittorio Emanuele 3 19
Via Firenze 0 1
Pollutant Reference Indicator Threshold Air monitoring station 2002 2006
PM10 Yearly exceedances of
the 24 hours mean 35
Piazza Grue 158 88
Via Firenze 273 122
Year
Inde
xes
- 187 -

SECOA, Vol. 6. Environmental Stresses and Resource Use in Coastal Urban and Peri-Urban Regions
Indices are as follows:
Table 5.60. Pescara calculated indices.
Index Air monitoring station 2002 2006
INO2 Piazza Grue 0 0
Vittorio Emanuele 0.17 1.06
Via Firenze 0 0,06
Index Air monitoring station 2002 2006
IPM10 Piazza Grue 4.51 2.5
Via Firenze 7.8 3.49
Figure 5.37. Air sustainability index NO2.
Figure 5.38. Air sustainability index PM10.
3. Assessment of natural resources use - Water
For the purpose of this study a sustainability index has been calculated only for the one sample
station shown before, in order to show the methodology adopted and that could be used for
further analysis; the selected sampling station is number 2, because of its relevance to describe
coastal water quality of whole XIII District, being in a bathing area and far from mouth of rivers.
Year
Inde
xes
Year
Inde
xes
- 188 -

M. Beccari, et al., DPSIR Framework for Case Studies in Civitavecchia, XIII District of Rome (Ostia) and Pescara, Italy
Three indicators, shown before, have been selected to evaluate the indexes:
- fecal Coliforms
- transparency
- pH
Three seasonal indexes have been calculated, spanning from April to September for three
years: 2005, 2006, 2007:
- for the first measurement date, the 1st April
- for the middle measurement date, the 1st July
- for the last measurement date, the 15th September
An annual index has been calculated with data spanning from April 2005 to September
2007
Figure 5.39. Sampling station 14.60 – code 83.
Table 5.61. Sampling station 14.60 – code 83.
Water Body: Tyrrhenian Sea
Sampling station: 2. 700 m right from “pontile diOstia”
Code: 83
Coordinates (UTM ED 50): 33 T 274133 4623103
Municipality: Rome
- 189 -
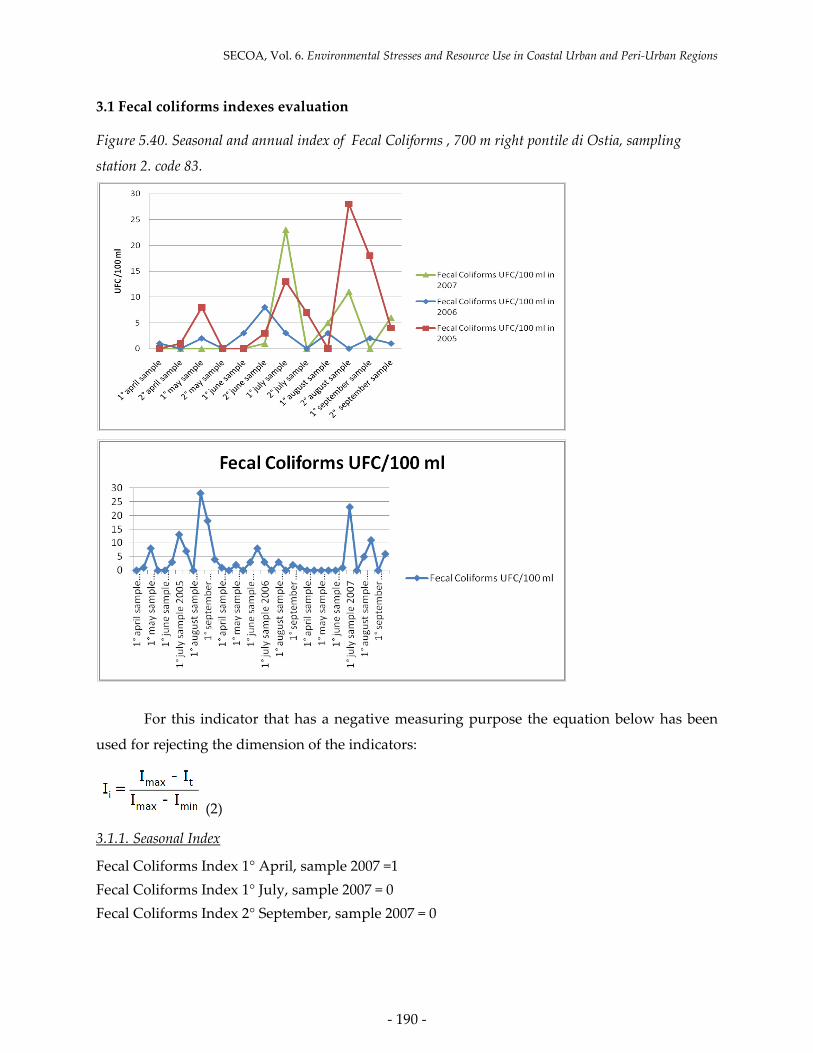
SECOA, Vol. 6. Environmental Stresses and Resource Use in Coastal Urban and Peri-Urban Regions
3.1 Fecal coliforms indexes evaluation
Figure 5.40. Seasonal and annual index of Fecal Coliforms , 700 m right pontile di Ostia, sampling
station 2. code 83.
For this indicator that has a negative measuring purpose the equation below has been
used for rejecting the dimension of the indicators:
(2)
3.1.1. Seasonal Index
Fecal Coliforms Index 1° April, sample 2007 =1 Fecal Coliforms Index 1° July, sample 2007 = 0 Fecal Coliforms Index 2° September, sample 2007 = 0
- 190 -

M. Beccari, et al., DPSIR Framework for Case Studies in Civitavecchia, XIII District of Rome (Ostia) and Pescara, Italy
3.1.2. Annual Index
Fecal Coliforms Index 2° September, sample 2007 = 0,78571
3.2. Transparency indices evaluation
Figure 5.41. Seasonal and annual index of transparency - 700 m right pontile di Ostia, sampling station
2. code 83.
For this indicator that has a positive measuring purpose the equation below has been used
for rejecting the dimension of the indicators:
(3)
- 191 -

SECOA, Vol. 6. Environmental Stresses and Resource Use in Coastal Urban and Peri-Urban Regions
3.2.1 Seasonal Index
Transparency Index 1° April sample 2007 = null Transparency Index 1° july sample 2007 = null Transparency Index 2° September sample 2007 = 1
3.2.2. Annual Index
Transparency Index 2° September sample 2007 = 1
3.3 pH indices evaluation
Figure 5.42. Seasonal and annual index of pH - 700 m right pontile di Ostia - sampling station 2. – code 83.
- 192 -

M. Beccari, et al., DPSIR Framework for Case Studies in Civitavecchia, XIII District of Rome (Ostia) and Pescara, Italy
For this indicator that has a positive measuring purpose the equation below has been used
for rejecting the dimension of the indicators:
(4)
Seasonal index
pH Index 1° April sample 2007 = 0
pH Index 1° July sample 2007 = 1
pH Index 2° September sample 2007 = 0
Annual Index
pH Index 2° September sample 2007 = 0,21
3.4. Evaluation of the sustainability index
It’s possible to calculate the sustainability index Ist by using indicator-weighted average,
not having further information about the index, for this analysis we assume the weight of all
indicators as 1:
= 0,499571 (5)
From the result we obtain, in 2007 (the last year of available data), coastal water ecosystem
is a sensitive point (Imst = 0.499571), needing some measure to maintain or improve its quality.
4. Assessment of natural resources use - Land use analysis of the coastal areas of Rome
and Pescara Metropolitan Area (specific focus on Civitavecchia, the XIII District of
Rome and the city of Pescara)
4.1. The coast of Rome Metropolitan Area
Land use data are taken from the Corine land cover (CLC), which refers to a European project
delivering an inventory of land cover, based on an established nomenclature in the European
member countries. Land cover data are available for the years 1990, 2000 and 2006.
CLC land use data have been intersected with the borders of the municipalities, so that
land use data for each of them could be extracted and analyzed. In the calculation of the
indicators, data were disaggregated as explained in the Table 5.62.
- 193 -

SECOA, Vol. 6. Environmental Stresses and Resource Use in Coastal Urban and Peri-Urban Regions
Table 5.62. CLC nomenclature and indicators used for index calculation.
CLC code CLC nomenclature Type area for indicators calculation
2xx Agricultural areas Agricultural areas
1xx, except for 14x Artificial surfaces, all except for green urban
areas
Artificial areas
3xx
4xx
Forest and semi natural areas
Wetlands
Woods - shrubland – open spaces -
wetlands
Agricultural land has also been taken into account in addition to natural ecosystems,
given its relevance in size and the role it can play in terms of safe-guard of the territory. In this
specific context, a decrease of agricultural land is considered to bear a negative impact on
sustainability in the sense that it is associated to soil consumption for industrial, commercial and
infrastructural purposes.
The analysis presented hereafter focuses on the territory comprised in the coastal
municipalities of Rome Metropolitan Area and Pescara Metropolitan Area. For the purpose of
DPSIR analysis of air quality in Civitavecchia and Pescara, as well as water quality in Ostia, land
cover analysis has been carried out for these three specific areas as well.
Figure 5.43. Corine land cover legend for categories relevant to the case study areas.
4.1.1. Land use overview of the Roman Coast
The area under study stretches along 150 km of coasts and covers 1189 km2 of land of the 11
municipalities between Tarquinia (North) and Nettuno (south). An outlook to the basic
disaggregated data of land cover can already shed light on the general features of the territory: it
is a predominantly agricultural area, with 83,000 hectares (70% of the total land) of crops,
orchards and, to a limited extension, prairies for animal husbandry. Second to that, there is a
- 194 -

M. Beccari, et al., DPSIR Framework for Case Studies in Civitavecchia, XIII District of Rome (Ostia) and Pescara, Italy
significant presence of woods and semi-natural areas, amounting to 18,000 ha (15% of the total),
woods making up the majority of it ha). Artificial land comes third in terms of coverage with
17,000 ha (14,5% of the total); this value can be attributed mainly to urban areas (12,000 ha) and
industrial or commercial areas (4,150 ha), whereas urban green spaces are a mere 532 ha (0,45%
of total). Wetlands are not significant in terms of surface (180 ha), though they are often important
spots for the preservation of biodiversity of flora and fauna and for their relevance as resting sites
for migratory birds. The Table 5.63 shows the values for the years 1990, 2000 and 2006.
Table 5.63. Land use - land cover Roman Coast.
Roman Coast Area (hectares)
Land use 2006 % on total
2000 % on total
1990 % on total
Water bodies 302 0.25% 302 0.25% 307 0.26%
Agricultural land 83137 69.91% 84139 70.75% 85532 71.84%
Woods 13915 11.70% 14683 12.35% 15057 12.65%
Areas with shrub-like vegetation 3809 3.20% 2650 2.23% 2602 2.19%
Open spaces with little or no vegetation 323 0.27% 635 0.53% 54 0.05%
Total - Woods and semi-natural land 18048 15.18% 17968 15.11% 17714 14.88%
Industrial and commercial areas, transport infrastructures
4154 3.49% 3792 3.19% 3556 2.99%
Mining areas, landfills, construction sites 130 0.11% 167 0.14% 222 0.19%
Urban areas 12431 10.45% 11945 10.04% 11262 9.46%
Artificial green (agricultural land excluded) 532 0.45% 546 0.46% 392 0.33%
Total - Artificial areas 17247 14.50% 16449 13.83% 15433 12.96%
Wetlands 180 0.15% 74 0.06% 73 0.06%
Total 118913 100% 118930 100% 119058 100%
- 195 -

SECOA, Vol. 6. Environmental Stresses and Resource Use in Coastal Urban and Peri-Urban Regions
Figure 5.44. Corine land cover, Roman Coast.
4.1.2. Historical background (20th century, before 1990)
As far as the modifications to the ecosystems of the Roman Coast, it is first of all worth taking a
step further back in time, since natural landscapes have been intensively shaped by human
activities since the beginning of the 20th century, far before the first land cover data were made
available in 1990. Coastal ecosystems are those of wetlands, dunes, macchia mediterranea
(maquis shrubland) and hydrophile woods, marked with their presence most of the territory
adjacent to the shore.
In the 1930’s, works of land “amelioration” took place in the “Agro Pontino”, an alluvial
plain South of Rome, at approximately sea level: the area used to be rich of marshes, separated
from the sea by sand dunes, fed by streams draining water from the mountains, with hydrophile
woods growing around swamps above sea level. The area was source of frequent epidemics of
malaria affecting the surrounding towns. In order to combat malaria, works of “bonifica
integrale” were undertaken by the Fascist government, with tens of thousands of workers
involved: kilometers of channels were built and pumping stations were created to channel water
into the sea, areas below sea level were filled. Although the agro pontino is mostly in the
- 196 -
M. Beccari, et al., DPSIR Framework for Case Studies in Civitavecchia, XIII District of Rome (Ostia) and Pescara, Italy
nowadays province of Latina, the territory included in our case study area also undertook
important changes as a result of drainage works: the city of Pomezia was created as a colony to
host families of farmers, especially from Northern Italy, to whom reclaimed land was assigned,
that of Ardea was re-populated and others founded for the same purpose. Drainage works were
undertaken also in the area of the Tevere delta (Ostia) and canals used to convey water through
reclaimed land were constructed in the territory nowadays part of Ostia, Fiumicino and Ardea.
In the 50’s and 60’s, a considerable increment in touristic flux towards the coast for
recreational and leisure purposes triggered urban sprawl in several municipalities, such as
Cerveteri, Pomezia and Anzio and led to a dramatic reduction of natural environments giving
way to settlements used as second homes, often built for mere speculation without sound criteria
and planning: “concrete and asphalt have deeply modified the structure of the coast, maquis
shrubland and dunes have been replaced by houses with panoramic view of the sea and by exotic
vegetal species extraneous to the Mediterranean environment” (La Provincia capitale, 2007-2008).
Nowadays, the resident population along the coast is around 300,000; however, it peaks at 1.5
million during summer; other thousands of people commute daily to the seaside during
weekends and summer vacations. In such situations, due to the high quantity of sewage, the
drainage system regularly ends up in overload, thus impacting heavily the condition of water in
streams, canals and the sea. Other stresses on natural resources are related to the production of
waste and to road traffic.
More recently, the areas surrounding Rome city core have seen a significant increase in
the resident population, up 50% in the last 20 years. Just to mention a few examples: from 37
thousands in 1990 to around 60 thousands in 2010 at Pomezia; from 33 thousands to more than
50 thousands in Anzio over the same period. The reasons are different: it is in part due to a
positive birth rate and to the arrival of immigrants and in part due to a phenomenon defined
“residential osmosis” (where people leave the capital and move to the surrounding
municipalities). In both cases, the choice to settle down outside the core is often motivated by
better conditions for renting and buying dwellings, together with a good availability of services
and quality of life (La Provincia capitale, 2007-2008).
- 197 -

SECOA, Vol. 6. Environmental Stresses and Resource Use in Coastal Urban and Peri-Urban Regions
4.1.3. Land use change between 1990 and 2006
Changes in land use can be seen in the time span between 1990 and 2006: they account for around
2,000 ha, whose usage appear in a different category than in the past.
• Agricultural land dwindled in 2000 and in 2006 again, from an original 85 thousands ha
to 83 thousands.
• Woods and semi-natural areas increased slightly, from 17,714 ha in 1990 to 18,048 in 2006;
however, data drilldown show that shrubland vegetation and open spaces have expanded
at the expense of woods (less 1,000 ha), with an overall deterioration of the quality of the
natural environments.
• Artificial areas have increased from 15,433 ha to 17,247 ha, owing to: augmentation of
urban areas and industrial/commercial areas (plus 1,169 ha and 598 ha respectively
between 1990 and 2006), as well as of urban green spaces (plus 140 ha). Contrary-wise,
mining areas, construction sites and landfills surfaces have reduced from 222 ha to 130
ha.
Although these changes affect an area of limited extension (1.6% of the total surface of the
coastal municipalities), land consumption appears to be a continuous and worrisome
phenomenon, not only for the case study areas but for the whole Italian territory, as highlighted
by the National Observatory on land consumption: “the acceleration of urban sprawl over the
last years is a tangible and undeniable fact, well evident at the eyes of every observer; recent
urbanization appears to be and often takes place disorderly but, most of all, is disproportionate
and has an excessive impact on natural and agricultural areas” (http://www.inu.it/attivita_inu/
ONCS.html). In 2010, land consumption in Lazio Region (which Rome is the capital of) was 9%;
the case of Rome is emblematic, in the past years the Roman Territory has seen a very strong
increase of buildings and constructions (Ambiente Italia 2011, Legambiente).
- 198 -

M. Beccari, et al., DPSIR Framework for Case Studies in Civitavecchia, XIII District of Rome (Ostia) and Pescara, Italy
4.1.4. Land use overview – focus on Ostia and Civitavecchia
Land use in Ostia shows a significantly different pattern from the average values of the whole
Roman Coast, though trends in time are similar.
• Agricultural land amounted to 29% of the total surface in 2006 (4,426 ha). This value has
significantly declined in time, with a loss of almost 700 ha since 1990.
• The XIII district is characterized by important extensions of woods and semi-natural areas
account for a total of 6,408 ha (in 2006), that is 42% of the territory. Between 1990 and 2006
there has been an increase in semi-natural environments with shrub-like vegetation, as
well as open spaces. Parallel to that, woods have lost around 700 ha, often as a
consequence of wildfires: from press review, fires are recorded during the summers of
2000 (260 ha of woods destroyed), 2002 to 2005 and more recently in 2008 (80 ha) and 2011.
• Land consumption related to artificial areas has augmented of 400 ha between 1990 and
2006, almost entirely due to the expansion of urban areas; green spaces were up to 331 ha
in 2006, compared to 242 ha in 1990.
Table 5.64. Land use - land cover XIII District.
Ostia - XIII District Area (hectares)
Land use 2006 % on total 2000
% on total 1990
% on total
Water bodies 181 1.18% 181 1.18% 167 1.09%
Agricultural land 4426 28.89% 4693 30.63% 5103 33.34%
Woods 4739 30.94% 5120 33.42% 5412 35.36%
Areas with shrub-like vegetation 1603 10.47% 758 4.95% 707 4.62%
Open spaces with little or no vegetation 66 0.43% 361 2.36% 0 0.00%
Total - Woods and semi-natural land 6408 41.84% 6239 40.73% 6119 39.97%
Industrial and commercial areas, transport infrastructures 31 0.21% 59 0.38% 24 0.16%
Mining areas, landfills, construction sites 0 0.00% 74 0.48% 81 0.53%
Urban areas 3940 25.72% 3742 24.42% 3571 23.33%
Artificial green (agricultural land excluded) 331 2.16% 332 2.17% 242 1.58%
Total - Artificial areas 4303 28.09% 4207 27.46% 3918 25.59%
Wetlands 0 0.00% 0 0.00% 0 0.00%
Total 15318 100% 15320 100% 15307 100%
- 199 -

SECOA, Vol. 6. Environmental Stresses and Resource Use in Coastal Urban and Peri-Urban Regions
The municipality of Civitavecchia comprises over 7,000 ha of land, most of which are
dedicated to agricultural usage (4,887 ha, 67.52% of the total in 2006); 240 ha of agricultural land
have disappeared between 1990 and 2006, whereas a parallel increase in artificial areas is
recorded over the same time span: an augmentation from 969 ha to 1241 ha, that can be ascribed
to industrial and commercial areas, as well as construction sites. Woods and shrublands covered
638 ha and 471 ha in 2006 respectively, with a limited decrease compared to 1990. No artificial
green spaces can be found.
Table 5.65. Land use - land cover Civitavecchia.
Civitavecchia Area (ha)
Land use 2006 % on total 2000 % on total 1990 % on total
Water bodies 0 0.00% 0 0.00% 0 0.00%
Agricultural land 4887 67.52% 5083 70.23% 5127 70.76%
Woods 638 8.81% 638 8.81% 670 9.25%
Areas with shrub-like vegetation 471 6.51% 449 6.20% 479 6.62%
Open spaces with little or no vegetation 0 0.00% 0 0.00% 0 0.00%
Total - Woods and semi-natural land 1109 15.32% 1087 15.01% 1149 15.86%
Industrial and commercial areas, transport infrastructures 548 7.57% 436 6.02% 387 5.34%
Mining areas, landfills, construction sites 51 0.70% 25 0.35% 0 0.00%
Urban areas 642 8.87% 608 8.39% 582 8.03%
Artificial green (agricultural land excluded) 0 0.00% 0 0.00% 0 0.00%
Total - Artificial areas 1241 17.15% 1068 14.76% 969 13.37%
Wetlands 0 0.00% 0 0.00% 0 0.00%
Total 7237 100% 7238 100% 7246 100%
- 200 -

M. Beccari, et al., DPSIR Framework for Case Studies in Civitavecchia, XIII District of Rome (Ostia) and Pescara, Italy
4.2. Indicators and sustainability index
The indicators selected for the calculation of the sustainability index are:
• Extension of agricultural land,
• Extension of woods and semi-natural environments, and
• Extension of artificial areas (urban green excluded).
In addition to natural ecosystems, agricultural land has also been taken into account, given its relevance in size and the role it can play in terms of safe-guard of the territory; in fact, “agricultural activities have far-reaching effects on the environment by altering natural habitats and affecting landscapes, plants and animals” (europa.eu website). In this specific context, decreases of agricultural land are considered as having a negative impact on sustainability in the sense that they are associated to soil consumption for industrial, commercial and infrastructural purposes.
The meaning of the index is not to provide a complete and exhaustive picture of the way natural resources are handled in a sustainable or unsustainable way; in fact, a much broader range of indicators would be needed in this case, as highlighted for instance in scientific publications supporting the European sustainable development strategy (see Measuring progress towards a more sustainable Europe, Eurostat 2005). Besides, it is debatable whether even the best values of the indicators in the time span 1990-2006 can be taken as a reference for a sound management of natural resources, given that human activities have had long before that a severe impact on the coastal ecosystems.
However, the index proves to be useful as a measure of “relative” sustainability, in the sense that it provides an easily understandable picture of how natural resources still present are dealt with. In particular, given the choice of the indicators, the sustainability index can be considered particularly meaningful to quantify the extent of soil consumption, one of the most critical environmental issues in Italy and in the specific case study areas.
Figure 5.45. Sustainability index, coast of Rome.
- 201 -

SECOA, Vol. 6. Environmental Stresses and Resource Use in Coastal Urban and Peri-Urban Regions
4.3. The coast of Pescara Metropolitan Area
4.3.1. Land use overview of the coast of Pescara Metropolitan Area
The Pescara Metropolitan Area comprises 4 municipalities adjacent to the Adriatic Sea :
Montesilvano, Francavilla al mare, Ortona and Pescara itself, with a total of approximately 50 Km
of coast and 212 km2 of surface. The Table 5.66 summarizes the main features of the territory,
which appears to be predominantly exploited for agricultural purposes, with 15.914 ha of crops
and orchards, as well as farming areas that include natural spaces (2006 data): this corresponds
to almost 75% of the whole area. It must be said that Abruzzo, of which Pescara is part, is mostly
a mountain region (63% of the territory), shaped by the presence of the Appennini range running
parallel to the coast with peaks up to 2,912 m (Gran Sasso d’Italia) and 2,793 m (Maiella). For this
reason, it is in the coastal areas that the highest population density can be found, together with
most of the agricultural and economic activities.
In the second place, artificial areas amount to 4,195 ha (in 2006), roughly 20% of the total.
A closer look at data show that such land consumption is mainly due to city sprawl, with 3,250
ha of urban agglomerates; industrial, commercial and infrastructural areas are 792 ha, whereas
urban green lags behind with 74 ha. Woods and semi-natural land are third in extension with
1,142 ha, the great majority of it being woods. This value constitutes barely 5.37% of the total
surface (in comparison, it is 15% along the Roman Coast)and witnesses the severe impact of
human activities upon coastal natural environments.
In particular, as it appears in Figure 5.46, urban sprawl affects mainly the municipality of
Pescara as well as the stripe of coastal land North and South of it, nowadays with an almost
uninterrupted sequence of buildings and facilities for residential, touristic, industrial and
commercial use.
As far as water bodies are concerned, the nil value for 2006 does not correspond to reality
as four rivers cross the municipalities, flowing from the mountains range into the sea: Aterno-
Pescara, Alento, Saline and Foro. The reduction in the value of water bodies surface from 1990 to
2006 is being checked and investigated and might possibly be due to areas previously subject to
flooding during rainy periods and peak discharge season.
- 202 -

M. Beccari, et al., DPSIR Framework for Case Studies in Civitavecchia, XIII District of Rome (Ostia) and Pescara, Italy
Table 5.66. Land use - land cover Pescara coast.
Pescara coast Area (ha)
Land use 2006 % on total 2000
% on total 1990
% on total
Water bodies 0 0.00% 32 0.15% 201 0.95%
Agricultural land 15914 74.88% 16171 76.01% 16301 76.92%
Woods 977 4.60% 694 3.26% 731 3.45%
Areas with shrub-like vegetation 51 0.24% 241 1.13% 195 0.92%
Open spaces with little or no vegetation 115 0.54% 115 0.54% 155 0.73%
Total - Woods and semi-natural land 1142 5.37% 1049 4.93% 1082 5.10%
Industrial and commercial areas, transport infrastructures 792 3.72% 888 4.17% 780 3.68%
Mining areas, landfills, construction sites 79 0.37% 75 0.35% 75 0.35%
Urban areas 3250 15.30% 2960 13.91% 2653 12.52%
Artificial green (agricultural land excluded) 74 0.35% 100 0.47% 100 0.47%
Total - Artificial areas 4195 19.74% 4023 18.91% 3608 17.02%
Wetlands 0 0.00% 0 0.00% 0 0.00%
Total 21251 100% 21275 100% 21191 100%
Figure 5.46. Pescara Metropolitan Area – land use 2006.
- 203 -

SECOA, Vol. 6. Environmental Stresses and Resource Use in Coastal Urban and Peri-Urban Regions
4.7. Land use overview – focus on Pescara
The Table 5.67 presents land cover data specific to the municipality of Pescara, one of the most
densely populated in Italy (3,659 inhab./km2). As expected, it is a highly urbanized area (1,596 ha
in 2006), with a significant presence of industrial, commercial and infrastructural facilities as well
(388 ha); artificial areas account for 61% of the territory. Agricultural activities are still relevant
in terms of land use, with 1,266 ha (in 2006), 37.5% of the total.
Lack of natural spaces is striking: neither woods nor shrubland are registered in land
cover data. Artificial green spaces were 74 ha in 2006, mainly related to the natural reserve “Pineta
dannunziana” which encompasses areas of maquis shrubland and woods with miscellaneous
trees; the reserve covers an area of 53 ha, 35 of which are the remainder of vast extensions of pine-
woods (over 3,000 ha), gradually replaced since the beginning of the 20th century by buildings
and houses, roads and railways and other facilities and infrastructures.
Table 5.67. Land use - land cover Pescara.
Pescara Area (hectares)
Land use 2006 % on total 2000 % on total 1990 % on total
Water bodies 0 0.00% 0 0.00% 0 0.00%
Agricultural land 1266 37.52% 1301 38.57% 1328 39.81%
Woods 0 0.00% 0 0.00% 0 0.00%
Areas with shrub-like vegetation 0 0.00% 0 0.00% 0 0.00%
Open spaces with little or no vegetation 51 1.50% 51 1.50% 74 2.23%
Total - Woods and semi-natural land 51 1.50% 51 1.50% 74 2.23%
Industrial and commercial areas, transport infrastructures 388 11.49% 453 13.41% 439 13.17%
Mining areas, landfills, construction sites 0 0.00% 0 0.00% 0 0.00%
Urban areas 1596 47.30% 1471 43.60% 1399 41.92%
Artificial green (agricultural land excluded) 74 2.21% 99 2.94% 96 2.87%
Total - Artificial areas 2058 60.99% 2023 59.95% 131934 57.95%
Wetlands 0 0.00% 0 0.00% 0 0.00%
Total 3374 100% 3374 100% 3337 100%
- 204 -

M. Beccari, et al., DPSIR Framework for Case Studies in Civitavecchia, XIII District of Rome (Ostia) and Pescara, Italy
4.8. Land use change between 1990 and 2006
Land cover values in the three years under study show two evident trends already described in
the section of Rome metropolitan area:
• Agricultural land has reduced in extension in the year 2000 and in 2006 again, down 400
ha compared to 1990; though almost 16 thousands hectares still remain, the impact of
urban sprawl on agricultural land is evident.
• Urban agglomerates have augmented at a steady pace, by 300 ha between 1990 and 2000
and a similar amount between 2000 and 2006. Other artificial areas (excluding urban
green) have remained basically stable.
Other changes are related to woods and urban green:
• In the time span between 2000 and 2006, the extension of woods has increased by 283 ha
reaching a total of 977ha, higher than the value of 1990 itself.
• Urban green was stable (100 ha) between 1990 and 2000, but lost 26 h in 2006 Indicators
and index
• The sustainability index for the coast of Pescara has been calculated using the same
indicators and methodology as for the Roman Coast. Comments and limitations
mentioned above apply to this case study as well.
Figure 5.47. Sustainability index, coast of Pescara.
- 205 -

SECOA, Vol. 6. Environmental Stresses and Resource Use in Coastal Urban and Peri-Urban Regions
- 206 -
CHAPTER 6.
Assessment of Natural Resources Use for Sustainable
Development - DPSIR Framework for Case Studies in
Metropolitan Area of Lisbon, Eastern Algarve and
Funchal, Portugal
Ana Rita Sampaio and Raimundo Quintal

SECOA, Vol. 6. Environmental Stresses and Resource Use in Coastal Urban and Peri-Urban Regions
1. Introduction
The chapter deals with the assessment of environmental stresses and resources use for
sustainable development of the three Portuguese case studies (Metropolitan Area of Lisbon, The
Eastern Algarve and Funchal); a brief outline of each case study is provided next. The purpose of
this chapter is to assess the natural resources’ sustainability of these three case studies. The
adopted methodology is guided by a DPSIR framework - Driving Forces- Pressures-State-
Impacts- Responses and encompassed the selection of indicators for index development. A
discussion of the results is provided in the final section of this chapter.
2. Materials and methodology
2.1. Sources and data
The Pressure- State- Response indicators were developed using CORINE Land Cover maps (1996,
2000, 2006) for the case studies of MAL and The Eastern Algarve; and COSRam (2006) for Madeira
which is, at the moment, the only available information. Therefore, it is not possible to compare
data or calculate the same index for Funchal at the moment. Additional maps were produced
with GIS software.
2.2. Methods
The methodology adopted to assess the natural resources of the Portuguese case studies was
guided by a DPSIR framework: Driving Forces- Pressures- State-Impacts-Responses. The
identification of the main issues with regards to the causes of environmental problems (Driving
Forces/Pressures) the quality of the environment (State/Impacts) and the actions (Responses)
undertaken to minimize environmental problems, was grounded on previous work developed
in order to assess coastal environmental status and natural resources use. A description of the
main issues emerged from this assessment is provided in section 3 of this chapter. This analysis
also aided the development of the DPSIR framework for the case studies and the selection of
indicators. For this purpose only indicators of Pressure- State- Response were used for index
development.
The rationale for selecting the core indicators for index development was based on the
assumption that a decrease on coastal wetland area (e.g. salt marches) and on semi-natural areas
(e.g. beaches) lead to the destruction and fragmentation of habitats and, therefore, to a decrease
on the biodiversity of each study area.
- 208 -

A. R. Sampaio, R. Quintal., DPSIR Framework for Case Studies in […] Portugal
The following indicators were selected for the assessment of sustainability on the study
areas:
• Driving Forces / Pressures: urban area; industrial / commercial and transport units;
agriculture; artificial surfaces,
• State / Impact: coastal wetland, beach, dunes, sands, estuaries, coastal lagoons, ecological
important sites, and
• Response: protected area, Natura 2000 Network, response area.
• The three core indicators used in the index development are described as following:
• Artificial surfaces: include urban fabric, industrial, commercial and transport units,
mines, dumps and construction sites, and non-agricultural vegetated areas,
• Ecological important sites: include habitats of the protected areas and Natura 2000
Network, coastal wetland, beach, dunes, sands, estuaries and coastal lagoons,
• Response area: includes areas under Protected areas and Natura 2000 Network, which
are protected by law.
2.3. Limitations
A report published by the Institute for Sustainable Development (Bossel 1999) concluded that
limitations of using indicator frameworks should be acknowledged notably for the following
purposes:
• to provide all essential information about the viability of a system and its rate of change,
and
• to indicate the contribution to the overall objective (e.g. of sustainable development).
An issue that is commonly linked to index development is that it cannot remove a
fundamental deficiency of aggregate indicators, i.e., aggregation may hide deficits in some
sectors, which actually threaten the overall health of the system. Additionally, aggregate
indicators (i. e. indexes) become even more questionable when they require adding apples and
oranges, i.e., items that cannot be measured in the same units.
As Bossel (1999, page 12) observes: “Why not use separate indicators in the first place?”.
Hence, to overcome this issue, in this chapter the analysis of sustainability was not solely based
- 209 -

SECOA, Vol. 6. Environmental Stresses and Resource Use in Coastal Urban and Peri-Urban Regions
on index results and indicators with the same unit (ha) were used. A comprehensive assessment
of each individual indicator was carried out.
The aforementioned report (Bossel 1999) also states that in an attempt to be more
systematic, the PSR (pressure, state, response) frameworks have been widely applied to assess
sustainable development problems. However, the most serious objection to this approach is that
it neglects the systemic and dynamic nature of the processes and their embedding in a larger total
system containing many feedback loops. As observed by Bossel (1999, page 14): “Representation
of impact chains by isolated PSIR-chains will usually not be permissible, and will often not even
be an adequate approximation. Impacts in one causal chain can be pressures, and in another can
be states, and vice versa. Multiple pressures and impacts are not considered. The real, usually
nonlinear relationships between the different components of a chain cannot be accounted for.
States and rates of change (stocks and flows) are treated inconsistently.” Based on these
comments, it is proposed that the results of the sustainability assessment, notably those from the
sustainability index, should be read with care and used to prompt further analysis on the
sustainability of the case studies.
2.4. Defining the study areas
2.4.1. Metropolitan Area of Lisbon (MAL)
The Metropolitan Area of Lisbon (MAL) with 299,565.89 ha is the westernmost European Capital
(Figure 6.1). In 2008, MAL had a population density of 959 inhabitant’s km2, which represents an
increase of 2.24% when compared with 2001 (938 inhabitant’s km2). MAL is divided by the large
Tagus River estuary, leading thus to two spatial units such as the Great Lisbon and the Setubal
Peninsula, also named as southern bank. The area of Tagus Estuary Natural Reserve is protected
by law (DL n.º 565/76, 19th July; DL nº 487/77, 17th November; RCM n.º 177/2008, 24th November)
to assure the conservation of the natural and semi-natural landscape, notably the habitats for
migratory birds. The Tagus estuary is a wetland of international importance, hosting to over
100,000 aquatic birds during winter time, of which 36 (target) species are protected under the
Birds Directive. It is also important for its habitats and fish species, which are protected under
the Habitats Directive.
- 210 -

A. R. Sampaio, R. Quintal., DPSIR Framework for Case Studies in […] Portugal
Figure 6.1. MAL study area.
2.4.2. Eastern Algarve
The Algarve, with 499,474.06 ha, is the southernmost region of Portugal and has a border with
the Alentejo Region (north), the Atlantic Ocean (south and west) and the Guadiana river (east)
which marks the border with Spain (Figure 6.2). Internally, the region is subdivided into two
zones, one to the west (Barlavento) and another to the east (Sotavento). In 2008, the Algarve had
a population density of 86 inhabitant’s km2, which represents an increase of 10% when compared
with 2001 (78 inhabitant’s km2). The Algarve is a strong touristic destination, which is popular
nationally and overseas for its mild climate and popular beaches. Ria Formosa, located in the
Eastern Algarve, is the most important wetland in the south of Portugal, and is protected by
Portuguese law (DL nº373/87, 9th December, DL nº 99-A/2009, 29th April, RCM n.º 78/2009, 2nd
September). It has a large diversity of biotopes - lagoon and terrestrial habitats- which explains
the ecological importance of this area. A significant area of the park consists of the lagoon system,
which holds exceptional natural value, and is a priority Site of Community Importance- (SCI) Ria
Formosa / Castro Marim (PTCON0013), as well as Special Protected Area- SPA Ria Formosa
(PTZPE0017), under the 92/43/CEE and 79/409/CEE Directives. The Ria Formosa’s ecological
importance is also recognized internationally by the Ramsar Convention, Berna Convention and
- 211 -

SECOA, Vol. 6. Environmental Stresses and Resource Use in Coastal Urban and Peri-Urban Regions
Corine Biotope (CORINE/85/338/CEE). Due to its geographical location and natural features, Ria
Formosa is an important site, nationally and internationally, especially for avifauna.
Figure 6.2. Eastern Algarve study area.
2.4.3. Madeira
Madeira Island has an area of 75,852.37 ha and it is administratively divided into 10
municipalities, three in the north (Porto Moniz, Santana and São Vicente) and seven in the south
(Calheta, Câmara de Lobos, Funchal, Machico, Ponta do Sol, Ribeira Brava and São Vicente)
(Figure 6.3). In 2008, the resident population was estimated at 242,760 inhabitants and revealed a
significant asymmetry between the north and south if the island. The oceanic context, in a
subtropical domain, is responsible for the general amenity of climate of Madeira, which is
probably one of the most important reasons for being so well-known to tourists. The most
important protected area on the coast is the Natural Partial Reserve of Garajau, which was created
in 1986 by the Regional Legislative Decree nº 23/86/M of 4th October. This new area of Madeira
Natural Park was the first exclusively marine reserve in Portugal. It extends along 7 km of
shoreline, in the municipalities of Funchal and Santa Cruz. This protected area covers an area of
- 212 -

A. R. Sampaio, R. Quintal., DPSIR Framework for Case Studies in […] Portugal
376 ha and its limits are the line of bathymetric 50 m south, the pier Lazareto at west, the Ponta
da Oliveira for the east and the high tide line to the north. Its primary objective is the protection
of an area of the coastline of Madeira that provides a nursery ground, important for restocking
wildlife.
Another protected area is Pináculo (Special Area of Conservation), which is located 500
m east of Funchal and occupies an area of 33.7 ha. It consists of a cliff with a maximum altitude
of 310 m, composed of basalts and pyroclastic materials of volcanic origin; - Funchal Marine Eco-
Park represents the need to balance recreation with conservation of coastal and marine
ecosystems in the western part of Funchal, where it has the highest concentration of hotels in
Madeira. The City Council proposed the creation of the Funchal Marine Eco-Park, with the status
of Protected Landscape.
Figure 6.3. Funchal Study Area.
- 213 -

SECOA, Vol. 6. Environmental Stresses and Resource Use in Coastal Urban and Peri-Urban Regions
3. Natural resources and their exploitation
3.1. MAL
The following Tables 6.1, 6.2 and 6.3 show an overall increase of the Pressure in the study area,
between 1990 and 2006, because of an increase in artificial surfaces area (more 62.00%), notably
in the urban fabric (more 47.03%) and industrial, commercial and transport units ( more 70.79%)
areas. Conversely, agricultural areas have decreased in the same period (loss of 2.78%). However,
the increase in artificial surfaces areas was not significantly recorded on ecological important sites
such as salt marches, salines and estuaries (Tables 6.1 and 6.2). Indeed, from 1990 up to 2006 the
area of the ecological important sites has remained almost unchanged (loss of 0.34%) and the area
of intertidal flats had actually an increase of 36.61%. Moreover, in the same time-frame (1990-
2006) there was also a significant effort, mainly due to the establishment of Natura 2000 sites, to
increase the protection area of important habitats. The Response area for nature conservation
increased by 22,289.73 ha (168.59%) from 1990 to 2006.
Table 6.1. P-S-R indicators for MAL.
MAL 1990 2000 2006 1990-2006
Area (ha)
PRESSURE INDICATORS
Urban Fabric 560.44 804.77 824.03 263.59 (+47.03%)
Industrial, commercial and transport units 69.43 72.04 118.58 49.15 (+70.79%)
Agricultural areas 10,429.68 10,207.79 10,140.02 -289.66 (-2.78%)
Artificial Surfaces 819,14 1.250,81 1.327,03 +507,89 (62.00%)
STATE INDICATORS
Beach, dunes, sands 254.14 254.14 254.14 0.00 (0.00%)
Coastal wetlands 3301.47 3180.46 3358.74 57.27 (+1.73%)
Salt marshes 1544.01 1451.39 1451.39 -92.62 (-6.00%)
Salines 1270.49 1242.10 1242.10 -28.39 (-2.23%)
Intertidal flats 486.97 486.97 665.24 178.27 (+36.61%)
Estuaries 28,016.37 28,008.32 27,789.85 -226.52 (-0.81%)
Ecological important sites 49,515.80 49,375.12 49,346.35 -169.45 (-0.34%)
RESPONSE INDICATORS
Protected Areas (Tagus Estuary Natural Reserve) 13,221.62 13,221.62 13,221.62 0.00 (0.00%)
Natura 2000 Network - 43,559.97 43,559.97 43,559.97 (100.00%)
Response area 13,221.62 35,511.35 35,511.35 22,289.73 (+168.59%)
- 214 -

A. R. Sampaio, R. Quintal., DPSIR Framework for Case Studies in […] Portugal
Table 6.2. Land use change 1990-2000 (MAL).
1990 2000 Area (ha)
Salt marshes Discontinuous urban fabric 10.5 (0.68%)
Table 6.3. Land use change 1990-2006 (MAL).
1990 2006 Area (ha)
Salt marshes
Discontinuous urban fabric 18.47 (1.20%)
Industrial and commercial units
48 (3.11%)
Green urban areas 25.83 (1.67%)
Salines Industrial and commercial
units 28.38 (2.23%)
Estuaries
Intertidal flats 178.26 (0.64%)
Industrial and commercial units
19 (0.04%)
Sea ports 28.25 (0.06%)
3.2. Eastern Algarve
Similar to MAL’s case study, the following Tables 6.4, 6.5 and 6.6 show an overall increase of the
Pressure on the study area of Eastern Algarve, between 1990 and 2006, because of an increase in
artificial surfaces area (more 40.62%). This increase was mainly due to the urban fabric (more
45.64%) and industrial, commercial and transport units (more 46.00%) areas. Once again, areas
under agriculture have decreased by 10.97% in area. The pressures between 1990 and 2006 were
mainly due to land use change, notably some salines (14.42%) are now subject to airport use (
Tabgle 6.4 and Table 6.5). In spite of this land use change, the area of ecological important sites
remained almost unchanged (more 0.12%) and the area of intertidal flats had actually an increase
of 13.17%. Likewise MAL’s case study, there was also a significant effort, mainly due to the
establishment of Natura 2000 sites, for increasing the protection of important habitats. The
Response area for nature conservation increased by 9,400.56 ha (52.51%) from 1990 to 2006.
- 215 -

SECOA, Vol. 6. Environmental Stresses and Resource Use in Coastal Urban and Peri-Urban Regions
Table 6.4. P-S-R indicators for Eastern Algarve.
EASTERN ALGARVE 1990 2000 2006 1990-2006
Area (ha)
PRESSURE INDICATORS
Urban Fabric 209.32 245.97 304.85 95.53 (+45.64%)
Industrial, commercial and transport units 90.24 115.60 131.75 41.51(+46.00%)
Agricultural areas 3,140.36 2,942.14 2,795.99 -344.37 (-10.97%)
Artificial Surfaces 1046,72 1312,3 1471,89 425,178 (40,62%)
STATE INDICATORS
Beach, dunes, sands 1,804.08 1,786.76 1,796.09 -7.99 (-0.44)
Coastal wetlands 8,181.63 8,258.20 8,258.20 76.5 (+0.94%)
Salt marshes 5,795.36 5,797.17 5,564.34 -231.02 (-3.99%)
Salines 1,442.76 1,517.52 1,626.08 183.32 (+12.71%)
Intertidal flats 943.50 943.50 1,067.78 124.28 (+13.17%)
Coastal lagoons 1,912.18 1,892.65 1,886.20 -25.98 (-1.36%)
Ecological important sites 27,301.48 27,333.92 27,333.93 +32.45 (+0.12%)
RESPONSE INDICATORS
Protected Areas 17,900.92 17,900.92 17,900.92 0.00 (0.00%)
Natura 2000 Network - 23,269.66 23,269.66 0.00 (0.00%)
Response 17,900.92 27,301.48 27,301.48 +9,400.56 (52.51%)
Table 6.5. Land use change 1990-2000.
1990 2000 Area (ha)
Salt marshes Airports 1.70 (0.03%)
Salines 10.36 (0.18%)
Salines Airports 4.34 (0.30%)
Coastal Lagoons Beaches, dunes, Sand 20.41 (1.07%)
Salt marshes 20.20 (1.06%)
- 216 -

A. R. Sampaio, R. Quintal., DPSIR Framework for Case Studies in […] Portugal
Table 6.6. Land use change 1990-2006
1990 2006 Area (ha)
Beaches, sand, dunes
Coastal lagoons 30 (1.66%)
Salines 28.73 (1.59%)
Sea and oceans 22.99 (1.27%)
Salt marshes 2.29 (0.13%)
Salt marshes
Airports 208.03 (3.59%)
Construction sites 102.67 (1.77%)
Salines 637.55 (11.00%)
Salines Airports 208.03 (14.42%)
Coastal Lagoons Beaches, dunes, sand 520.77 (27.23%)
Salt marches 1,754.75 (91.77%)
3.3. Funchal
As mentioned before, the only information available for this site is of the year 2006 only hence
change detection is not possible at the moment.
3.4. Mapping critical areas under unsustainable use
Based on the results shown on the previous sections, there were not significant critical
areas under unsustainable use. Hence, in this section, the analysis is focused on mapping the
areas which had an increased Pressure, between 1990 and 2006, due to the increase of artificial
surfaces area. Therefore, Figure 6.4 shows that in the MAL’s case study an increase on artificial
surfaces area (areas in purple) was more noticeable in the municipality of Cascais. In the other
MAL municipalities the artificial surface area remained almost unchanged. With regards to
Eastern Algarve, the municipalities that recorded the highest urban sprawl were Faro (e.g. areas
surrounding the Airport). However, these results should be read with care as the CORINE maps
used to produce Figure 6.4 and Figure 6.5 only account for changes in land used above 25 ha.
Hence, changes in land use below 25 ha were not accounted in this analysis.
- 217 -

SECOA, Vol. 6. Environmental Stresses and Resource Use in Coastal Urban and Peri-Urban Regions
Figure 6.4. Artificial surface area increase (MAL).
Figure 6.5. Artificial surface area increase (Eastern Algarve).
- 218 -

A. R. Sampaio, R. Quintal., DPSIR Framework for Case Studies in […] Portugal
Figure 6.6. Artificial surface area 2006 (Funchal).
3.5. State and impact
3.5.1. MAL
With an area of approximately 34,000 ha, Tagus Estuary is the largest estuary in the Western
Europe. It has a significant landscape value and is a shelter and nesting area for many species of
resident and migratory birds. With the aim of protecting the ecosystem of human pressures, in
1976 the most sensitive area of the estuary was classified as a Natural Reserve. Later, under the
Birds and Habitats Directive, it gained the status of Special Protection Area and Site of
Community Interest under the Natura 2000 Network. While protected by Portuguese and
European Community law, there are still activities with negative impact, notably on the nesting
bird areas.
Tagus Estuary comprises of salines, salt marshes, intertidal flats, which are important
from the point of ecosystems and economic development. There are four habitats that are
different from others, due to their biological interest, biodiversity and natural value: reeds,
- 219 -

SECOA, Vol. 6. Environmental Stresses and Resource Use in Coastal Urban and Peri-Urban Regions
salines, marshes and intertidal areas. Those classified as reeds comprise of Juncetalia maritime,
which occurs in upper areas of the estuary, i.e. areas of low salinity. These areas are characterized
by Phragmites australis and by a significant colony of birds, such has Acrocephalus scirpaceus
and Acrocephalus arundinaceus; the Ardea purpurea, Ixobrichus minutus and the Circus
aeruginosus, which use reeds for nesting. Salines are man-made structures for salt extraction,
which are important areas for fish and shrimps (e.g. Palaemonetes varians). Insects and larva
provide the essential food for birds and fish; Artemia sp is the most common crustacean in this
habitat.
Salines are sheltered areas that provided refuge and feeding areas during the winter and
nesting areas in the summer. Salt marshes are the old forms of the salines prior to human
transformation of them. Spartinian marritimae is very abundant in Tagus River banks, notably in
the south bank, bridging the gap between the river and the land. These are very resilient
ecosystems because they gradually adapt to human pressures. Moreover, the halophyte
vegetation serves as a refuge and habitat for many species of ecological importance: Anas crecca,
Anser anser and Anas Penelope. The tidal influence is clearly present on the ecosystem, leading
to the development of ecological niches. Intertidal areas are characterized by mudflats and sand
areas exposed at the low tide; they are interspersed with small sandy beaches. The main species
of these areas are Nereis diversicolor, the bivalde Scrobicularia plana, the Hydrobia ulvae and
Cyathura carinata. These are primary consumers that eat microscopic algae, plants and animal
decaying particles and are important food sources to fish, on the high tide, and to birds, on the
low tide; this attest the ecological value of the Tagus Estuary.
The existence of transport facilities and old warehouses along the banks of the estuary
causes a visual barrier effect and generates constraints on access and enjoyment of important
sections of the riverside. Military facilities, some still running, and others obsolete, have a strong
territorial impact by influencing land use. From the north to the south of the river mouth lays a
coastal strip with a strong relationship with the estuary, which serves as the framework but also
conditions the phenomena of sedimentation and erosion, especially in the south of Barra do Tejo.
The extensive sandy beaches and cliffs of soft sea front is a popular attraction for tourists and
MAL residents. Resident population increase and the intense demand for recreational activities
(commercial areas, beaches, sports and parks) trigger high levels of residential and tourism
construction.
- 220 -

A. R. Sampaio, R. Quintal., DPSIR Framework for Case Studies in […] Portugal
3.5.2. Eastern Algarve
The Ria Formosa, extends from Loulé municipality up to Vila Real de Santo António
municipality; it has an area of 18,400 ha providing multiple habitats with a special relevance and
importance in terms of biodiversity protection. Ria Formosa Natural Park was classified as a
protected area in 1987 by the Law DL nº373/87, 9th December. This area comprises important
habitats (flora and fauna), which are subject to significant environmental impacts caused mainly
by urbanization processes and touristic uses. It encompasses five barrier islands that are more
visible in Faro and Olhão municipality: Barreta, Culatra, Armona, Tavira and Cabanas Barrier
Island; these islands work as a natural protection to the salt marshes from the Atlantic Ocean.
Spartina maritima meadows are common in lower marshes, providing the perfect habitat for
crustaceous species with economic value, such as clams (Ruditapes decussatus), cockle
(Cerastoderma edule) and sandeel (Ensis siliqua). In the medium marsh Spartina vegetation gives
place to Arthrocnemum fruticosum, A. glaucum and Suaeda vera. In these areas, there are several
migratory bird species from the northern Europe that spend the winter in the Ria Formosa. These
migratory birds have high biological value and importance to the maintenance of the ecosystem;
some examples of these birds are: Anas platyrhynchos; Anas clypeata Anas crecca; Charadrius
alexandrines, Limosa lapponica, Limosa limosa Himantopus himantopus and the Calidris alpine.
Ria Formosa has an important role in the life cycle of many fish species (e.g. shellfish), as a
breeding and feeding area. The salt marshes, the lagoons and dune habitats provide also unique
conditions for the development of species such as chameleon (Chamaleo chameleon); this is an
endangered species whose distribution in Portugal is restricted to the Eastern Algarve coastline
and barrier islands. Some barrier islands, between the beaches of Faro and Cacela, are occupied
by illegal constructions and precarious housing, which represents permanent fishermen housing
and second residences (mainly for tourism). Rudimentary houses are used for storage of fishing
equipment and other support activities associated with fishery and tourism (e.g. restaurants and
bars). These barrier islands have easy access from the mainland and the natural conditions and
the beach characteristics to attract several users; this situation prints a significant pressure in the
dune habitats. Urban occupation of these areas interferes with dune forming process. In this
process the dunes are feed with sand carried by the wind and intertidal flows. Therefore, houses
and other building structures work as a block element to the natural sand reposition and impair
the ecosystem.
The implementation of resorts and villas on risk areas, very close to the cliffs, especially
significant in the municipalities of Albufeira and Loulé, leads to the speeding up of the erosion
processes. Car parking prints also an impact in terms of sand compaction, notably when it is done
- 221 -

SECOA, Vol. 6. Environmental Stresses and Resource Use in Coastal Urban and Peri-Urban Regions
in at random, and on the dunes and pre-beach, which are sensitive ecosystems. The intensive
trampling through walking on dune ridges, especially during the summer, causes also a negative
impact on dune flora.
3.5.3. Funchal
The main purpose of Natural Partial Reserve of Garajau is to protect the area of Madeira´s coastline that works as a nursery ground, contributing to restocking wildlife coastal areas, preventing thus the desertification of the seabed off the coast of Madeira Island. The reserve area is characterized by a rocky shore, with cliffs of a very steep slope, with altitudes that can exceed 100 m. However, from the Ponta do Garajau and to Ponta da Oliveira, the cliff has a lower but steady altitude, and relatively easy access. The coastal area is characterized by several pebble beaches interspersed with rocky areas. The ocean floor is rocky, at about 22 m deep, from which it is made of sand or crushed shell. The reserve, not only for its geographical location, but mainly for its biological richness and crystal clear and clean waters, has a great significance for recreational, educational and scientific purposes. The Grouper (Epinephelus marginatus) is the main attraction of the Reserve due to their large size and extremely confident and sociable nature. Among the fish species that live on this Reserve it is possible to highlight the Island Grouper (Mycteroperca fusca), the Barred Hogfish (Pseudolepidaplous scrofa), the White Seabream (Diplodus cervinus), the Zebra Seabream (Diplodus cervinus), the Parrotfish (Sparisoma cretense), the Rainbow Wrasse (Coris julis), the Ornate Wrasse (Thalassomma pavo), the Canary Damsel (Abudefduf luridus), the Azores Chromis (Chromis limbata)and the Blacktail Comber (Serranus atricauda).The Common Moray (Muraena helena) and the Dotted Moray (Muraena augusti) are common. Among the crustaceans, the Crab (Grapsus webbi), the Sleepy Crab (Dromia marmorea), and the Atlantic Arrow Crab (Stenorhynchus lanceolanus) are common.Sea urchins (Diadema antillarum, Arabacia lixula, Paracentrotus lividus), sea cucumbers (Holothuria sp.), starfish, brittle stars, sponges (Aplysina aerophoba, Chondrosia reniforbis) and sea anemones (Telmatactis cricoides) can be found on the rocky substrate. On the sandy floors there are big colonies of eels (Heteroconger longissimus). Groups of Devilrays (Mobula mobular), Amberjacks (Seriola spp.), Yellowmouth Barracudas (Sphyraena viridensis), Guelly Jacks (Pseudocarnax dentex) and Bastard Grunts (Pomodasys incisus) may be seen yearly, in very specific seasons, usually from mid-September to October.” (Information Center of the Madeira Natural Park).
The Funchal Marine Eco-Park, with an area of 139 ha, is located on the south coast of Madeira, from the western end of the Port and Ponta da Cruz, bordered to the north by the line of maximum high tide of living water equinoctial and the 30 meter bathymetric at south. The area
- 222 -

A. R. Sampaio, R. Quintal., DPSIR Framework for Case Studies in […] Portugal
of the Marine Eco- Park, is generally rocky, rugged, steep and often inaccessible. With few exceptions the coast is almost all artificially altered due to construction of public and tourist facilities. However, there are areas of the coast that are still in its natural state. The morphology of the coast indicates the absence of sand at shallow depths. The coastline consists of rocky funds, which were originated by the sea attack on cliffs and rocky supply by streams. Within the 30 m isobaths lays the islet of Gorgulho that is 130 m from the coast line and the isle of Forja at about 25 m. The only pebble beach in the entire area lies within the area of the Gorgulho.
The marine fauna of the Marine Eco-Park, similar to the all Madeira Island, has a distinctly European and Mediterranean affinities, notably at the level of groups such as fish and shellfish from the coast. However, it is possible to find elements of both sides of the Atlantic and even from other oceans.
Pináculo - Special Area of Conservation (SAC) is located in the east of Funchal and occupies 33.7 ha. It essentially consists of a cliff with a maximum altitude of 310 m, composed of basalts and pyroclastic materials of volcanic origin. The SAC includes "cliffs with endemic flora of the Macaronesian" and "low formations of Euphorbia close to cliffs, two habitats listed in Annex I to Directive 92/43/EEC. Among the flora and fauna of Pináculo, there are four species of plants (Chamaemeles coriacea, Maytenus umbellata, Andryala crithmifolia, Musschia aurea) and a clam (Discula tabellata) as set out in Annex II of Directive 92/43/EEC to be of Community interest. The bush (Chamaemeles coriacea) has the status of priority species. The cliff at Pináculo operates as a site for nesting seabirds with emphasis on Calonectris diomedea borealis and the Sterna hirundo, which are part of Annex I to Directive 79/409/CEE to be of community interest. The main factors threatening the natural assets of SAC are invasive plants (Arundo donax, Opuntia tuna, Hyparrhenia hirta), destruction of the protected flora by rabbits and rats, fires, real estate pressure and leakage of wastes. Pináculo is partially confronted with Garajau Partial Natural Reserve. At present the Regional Government is developing a new application for Natura 2000 Network with the aim of integrating the two areas into one Special Area of Conservation.
Natural Partial Reserve of Garajau, due to the flash floods and deposition of soil on cliffs, especially since 2010, has been affected by colored waters and lands deposit in the seafloor with a negative impact on flora and fauna. It also recorded a decrease in its touristic appeal, notably with regards to scuba diving that has been affected. Although the Regional Legislative Assembly has not yet adopted the law of their institution, it should constitute an important unit for the sustained development of the coastal segment with greater urban pressure on the municipality. As such it is appropriated to highlight this attempt of creating a protected landscape. Pinánulo is very close to an area of warehouses and inert deposits, in Cancela, and occasional litter deposition.
- 223 -

SECOA, Vol. 6. Environmental Stresses and Resource Use in Coastal Urban and Peri-Urban Regions
3.6. Drivers and pressures
In this section, it is possible to envisage that the main driving forces are linked to an increase of
population, tourism, industry and commerce development, agriculture and ports in the study
areas. Hence, the pressures on natural resources are mainly due to urban sprawl as a result of the
construction of facilities linked to tourism development, industry, commerce and transport and
ports. The tables 6.7, 6.8 and 6.9 show a summary of the main driving forces and pressures
identified for each case study.
Table 6.7. Summary of the main driving forces and pressures for MAL.
DRIVING FORCES PRESSURES
Population - Pressures on resources from population are increasing in the - municipalities of Seixal (14,4%, reference years: 2001-2008) and Cascais (8,41%, reference
years: 2001-2008); - Due to the attractiveness of waterscape, there are new real estate investments concentrated
on the waterfront, which clashes with other land-uses.
Tourism - Pressures on resources from tourism are increasing, notably in Lisbon - and Cascais; - Due to the attractiveness of waterscape, tourism tends to concentrate alongside the coastline
and clashes with other land-uses; - Marine and coastal biodiversity and habitats are threatened by tourism.
Industry and Commerce
- Pressures on resources from manufacturing industries area are - decreasing; - Pressures on resources from retail are increasing, especially in the municipalities of Vila
Franca de Xira, Loures, Lisbon and Seixal; - Deindustrialization creates new opportunities for ‘brownfields’ redevelopment; - Old industrial plants and new retail parks tend to be concentrate on the waterfront and
clashes with other land-uses; - Coastal biodiversity and habitats are threatened by industry and retail.
Agriculture - Pressures on resources from agriculture are especially felt in the east sector of Tagus Estuary (municipalities of Vila Franca de Xira, Montijo and Alcochete).
Ports - Pressures on resources from port activity are meaningful and more - significant in the municipalities of Lisbon and Almada; - Cruise industry is increasingly more noteworthy; - Fishing is losing importance as an economic activity; - Port activity conflicts with other land-uses alongside the coastline; - Marine and coastal biodiversity and habitats are threatened by port activity.
Second homes - Second homes are rising and are one of the main causes for urban - sprawl; - Pressures on resources from second homes are particularly significant in the west sector of
the Tagus Estuary (municipalities of Almada and Cascais); - Coastal biodiversity and habitats are threatened by second homes.
- 224 -

A. R. Sampaio, R. Quintal., DPSIR Framework for Case Studies in […] Portugal
Table 6.8. Summary of the main driving forces and pressures for Eastern Algarve.
DRIVING FORCES PRESSURES
Population
- Pressures on resources are increasing due to population growth; - Recent demographic evolution predicts more population growth in the
near future; - Population growth is mainly concentrated on coastal areas leading to the
urbanization of the seashore.
Tourism
- Tourism is the main industry in the region and one of the main - causes of urban sprawl; - Tourism concentrates alongside the coastline and clashes with other land-
uses; - Marine and coastal biodiversity and habitats are threatened by - tourism and by tourism urbanization.
Industry and Commerce
- Although mining industry is minimal, there was an increase in mineral extraction in the last decade, namely in Albufeira and Loulé;
- Pressures on resources from manufacturing industry and retail area are increasing;
- Industrial and commercial parks are mainly placed in Faro, Loulé and Albufeira, i.e. the same municipalities where population and tourism are mostly concentrated;
- New retail parks tend to concentrate alongside the seashore and clashes with other land-uses;
- Coastal and marine biodiversity and habitats are threatened by industry and retail.
Agriculture - Pressures on resources from agriculture are especially felt inland of the
study area.
Ports and Fishing Fleet
- Pressures on resources from marinas and yacht tourism are increasing; - Fishing is still an important economic activity, namely in Olhão and Tavira
where a solid tradition on conservation industry exists; - Marine and coastal biodiversity and habitats are threatened by port
activity, fishing and vessels.
Second home owners
- Second homes are rising and are one of the main causes of urban sprawl; - Pressures on resources from second homes are particularly significant in
coastal areas; - Coastal biodiversity and habitats are threatened by second homes.
- 225 -

SECOA, Vol. 6. Environmental Stresses and Resource Use in Coastal Urban and Peri-Urban Regions
Table 6.9. Summary of the main driving forces and pressures for Madeira.
DRIVING FORCES PRESSURES
Tourism
- Pressures on resources from tourism are increasing;
- Hotels are mainly concentrated in Funchal municipality and along the coastline, conflicting with other land-uses;
- Marine and coastal biodiversity and habitats are threatened by tourism.
Industry and
Commerce
- Pressures on resources from manufacturing industry and retail are
- increasing;
- Some industrial plants and the modern commercial parks are concentrated in the 500 meter corridor alongside the meanders of the “Socorridos” stream and Cancela (warehouses and inert deposit).
Agriculture - Agriculture is spatially constrained due to orography.
Ports and Fishing
Fleet
- Cruise industry is more and more noteworthy;
- Ports are more and more specialized, the port of Funchal being increasingly devoted to cruise ships;
- Marine and costal biodiversity and habitats are threatened by the cruise industry;
- Commercial ports are losing importance;
- Fishing industry is modest.
3.7. Responses
The area of Tagus Estuary Natural Reserve is protected by law (DL n.º 565/76, 19th July; DL nº
487/77, 17th November; RCM n.º 177/2008, 24th November) to assure the conservation of the
natural and semi-natural landscape, notably the habitats for migratory birds. The Tagus estuary
is a wetland of international importance, hosting to over 100,000 aquatic birds during winter time,
of which 36 (target) species are protected under the Birds Directive. It is also important for its
habitats and fish species, which are protected under the Habitats Directive.
Ria Formosa, located in the Eastern Algarve, is the most important wetland in the south
of Portugal, and is protected by Portuguese law (DL nº373/87, 9th December, DL nº 99-A/2009, 29th
April, RCM n.º 78/2009, 2nd September). It has a large diversity of biotopes - lagoon and terrestrial
habitats- which explains the ecological importance of this area. A significant area of the park
consists of the lagoon system, which holds exceptional natural value, and is a priority Site of
Community Importance- (SCI) Ria Formosa / Castro Marim (PTCON0013), as well as Special
Protected Area- SPA Ria Formosa (PTZPE0017), under the 92/43/CEE and 79/409/CEE Directives.
The Ria Formosa’s ecological importance is also recognized internationally by the Ramsar
Convention, Berna Convention and Corine Biotope (CORINE/85/338/CEE).
- 226 -

A. R. Sampaio, R. Quintal., DPSIR Framework for Case Studies in […] Portugal
The most important protected area on the coast is the Natural Partial Reserve of Garajau,
which was created in 1986 by the Regional Legislative Decree nº 23/86/M of 4th October. This new
area of Madeira Natural Park was the first exclusively marine reserve in Portugal. It extends along
7 km of shoreline, in the municipalities of Funchal and Santa Cruz. This protected area covers an
area of 376 ha and its limits are the line of bathymetric 50 m south, the pier Lazareto at west, the
Ponta da Oliveira for the east and the high tide line to the north. Its primary objective is the
protection of an area of the coastline of Madeira that provides a nursery ground, important for
restocking wildlife. Another protected area is Pináculo (Special Area of Conservation), which is
located 500 m east of Funchal and occupies an area of 33.7 ha. It consists of a cliff with a maximum
altitude of 310 m, composed of basalts and pyroclastic materials of volcanic origin; - Funchal
Marine Eco-Park represents the need to balance recreation with conservation of coastal and
marine ecosystems in the western part of Funchal, where it has the highest concentration of hotels
in Madeira, the City Council proposed the creation of the Funchal Marine Eco-Park, with the
status of Protected Landscape. Regional and national efforts for environmental protection and
sustainable use of natural resources are presented in Tables 6.10, 6.11 and 6.12.
Table 6.10. Environmental laws and institutional framework.
Issues Main legal framework
Protected areas
Protected Areas Network: Decreto-Lei n.º 19/93, 23 January 1993 and Decreto-Lei n.º 227/98, 17th July 1998
Protected Areas Network: Decreto Regional nº 14/82/M, 10 November 1982
Protected Areas Network: Decreto Legislativo Regional nº 11/85/M, 23 May 1985
Natura 2000 Directives: 79/409/CEE and 92/43/CEE
Natura 2000 Directives: Decreto-Lei nº 49/2005, 24th February 2005
Natura 2000 Directives: Decreto Legislativo Regional nº 5/2006/M, 2nd March 2006
Air
Air quality guidelines: Decreto-Lei nº 276/99, 23rd July 1999
States limit values for NO2, PM10, CO, SO2 : Decreto-Lei nº 111/2002, 16th April 2002
States limit values for O3 : Decreto-Lei n.º 320/2003, 20th December 2002
Water
Water quality for bathing: Decreto-Lei nº 236/98, 1st August 1998
Water quality for bathing (criteria): Decreto Regulamentar nº 89, 16th April 2002
Water quality guidelines: Decreto Legislativo nº 243/2001, 05th September 2001
Waste States rules for waste management: Decreto-Lei nº 239/97, 9th September 1997
- 227 -

SECOA, Vol. 6. Environmental Stresses and Resource Use in Coastal Urban and Peri-Urban Regions
Table 6.11. Local and regional environmental policies and plans.
Management Plans
Metropolitan Area of Lisbon’s Case Study
Spatial Planning Regional Plan –Metropolitan Area of Lisbon
Coastline Plan Sintra-Sado
Natural Reserve of the Tagus River Estuary’s Management Plan
Municipality Plans of Cascais, Lisbon, Loures, Oeiras, Vila Franca de Xira, Alcochete, Almada, Barreiro, Moita, Montijo, Seixal
Algarve’s Case Study
Spatial Planning Regional Plan –Algarve
Coastline Plans Vilamoura- Vila Real de Santo António
Natural Park of Ria Formosa’s Management Plan
Municipality Plans of Albufeira, Castro Marim, Faro, Loulé, Olhão, Tavira, Vila Real de Santo António
Funchal’s Case Study
Funchal Marine Eco-Park – Proposal for a Plan of Management. Funchal Municipal Museum (Natural History) and Marine Biology Station of Funchal, Câmara Municipal do Funchal, 2007.
Programme Management and Conservation of Pináculo – Site of Community Importance, Secretaria Regional do Ambiente e Recursos da Naturais da Madeira, 2009.
Plan of Management and Conservation of Ponta de São Lourenço - Site of Community Importance, Secretaria Regional do Ambiente e Recursos da Naturais da Madeira, 2009.
Madeira Water Regional Plan, Tecnical Report (2003) – Instituto da Água e Secretaria Regional do Ambiente e Recursos Naturais, Funchal
Wastewater management of Autonomus Region of Madeira (2001) – Agência Regional da Energia e Ambiente da Região Autónoma da Madeira
Table 6.12. Main strategies in Portugal.
Main strategies/programmes
Spatial Planning Policy National Programme: gives guidelines for the spatial planning in Portugal.
National Strategy for Sustainable Development: aims to promote Portugal’s sustainable development.
FINISTERRA Programme: aims to improve the Portuguese coastline through structural measures, allowing implementing the actions stated in the Coastline Plans
Integrated Management Strategy for the Portuguese Coastal Zones (Response to 2002/413/CE): To provide a policy framework to assure sustainable development in coastal zones.
Polis Litoral (Partnerships between the State and municipalities): aims to recover coastal areas and enhance their environmental and ecological value.
- 228 -

A. R. Sampaio, R. Quintal., DPSIR Framework for Case Studies in […] Portugal
4. DPSIR analysis
The DPSIR framework developed for the three case studies is shown in Figure 6.7, Figure 6.8 and
Figure 6.9. It is possible to envisage that the main driving forces are linked to an increase in
population, tourism development, industrial/ commercial and transport development and
agricultural development. Hence, the pressures on natural resources are mainly due to urban
sprawl as a result of the construction of facilities linked to tourism development, industry,
commerce, transport units and ports. Therefore, driving forces prompt an increase of urban areas,
areas allocated to industrial/commercial and transport units, as well as agricultural area, all
exerting pressure on natural resources and ecosystems. These pressures may trigger a change in
wetland area, as well as areas of beach, dunes, sands, estuaries (e.g. MAL) and coastal lagoons
(e.g. Eastern Algarve). A change in these ecological important sites may lead to environmental
impacts such as loss and fragmentation of important habitats.
The responses to minimize these impacts are linked to regulation, notably the
establishment of Protected Areas (e.g. Tagus Estuary Natural Reserve and Ria Formosa Natural
Park) and Natura 2000 Network sites.
Figure 6.7. DPSIR framework for MAL.
- 229 -

SECOA, Vol. 6. Environmental Stresses and Resource Use in Coastal Urban and Peri-Urban Regions
Figure 6.8. Main strategies in Portugal.
Figure 6.9. DPSIR framework for Madeira.
- 230 -

A. R. Sampaio, R. Quintal., DPSIR Framework for Case Studies in […] Portugal
5. Development of sustainability indicators
The DPSIR framework allowed the selection of indicators to be used on the analysis of the use of
resources:
Driving forces
• Urban development (indicator: area),
• Industrial/ commercial and transport development (indicator: area), and
• Agricultural development (indicator: area).
Pressures
• Urban area (indicator: area),
• Area allocated to industrial/commercial and transport units (indicator: area),
• Agricultural area (indicator: area), and
• Artificial surfaces (indicator: area).
State
• Coastal wetland area ( indicator: area),
• Beach, dunes and sands (indicator: area), and
• Ecological important sites (indicator: area).
Impact
• Coastal wetland area (indicator: area) and
• Flooded areas (only for Madeira’s case study)
Response
• Tagus Estuary Natural Reserve (indicator: area),
• Natura 2000 Network (indicator: area) and
• Response area (indicator: area).
- 231 -

SECOA, Vol. 6. Environmental Stresses and Resource Use in Coastal Urban and Peri-Urban Regions
A simplified DPSIR framework is used for index development, which focus only on
Pressures-State- Impact on the study areas. Based on the principles for indicator development
and the available data for each indicator, the core indicators selected to compute the sustainability
index are: Artificial surfaces (P), Ecological important sites (E), Response area (R).
Assumptions: The rationale for selecting the core indicators for index development is
based on the assumption that a decrease on ecological important sites area (e.g. salt marches)
leads to the destruction and fragmentation of habitats and, therefore, to a decrease on the
biodiversity of each study area. (See annex for indexes).
6. Conclusions
The purpose of this chapter was to assess the natural resources’ sustainability of the three
Portuguese case studies (Metropolitan Area of Lisbon, The Eastern Algarve and Madeira); The
methodology adopted was guided by a DPSIR framework - Driving Forces- Pressures-State-
Impacts- Responses and encompassed the selection of indicators for index development. The
results of this assessment show that MAL, although still having a good level of sustainability, has
been having a steady decline in sustainability since 1990, in spite of an increase in the areas
protected under the Natura 2000 network. This decline in sustainability may be explained by the
significant increase of Pressures due to artificial surfaces areas, notably in the municipality of
Cascais. In the Eastern Algarve case study the Pressures due to artificial surfaces areas only
started to be more noticeable from 2000, notably in Faro municipality, where some salines are
now subject to airport use; this situation led to a slight decline of sustainability in this study area.
As for Funchal, the calculation of index was not possible, once the only data available regards the
year 2006. Therefore, it does not allow the comparison with different years. The data of Corine
Land Cover should be available until the end of this year and only then it will be possible to
compare different years and use the methodology developed for the remaining Portuguese case
studies.
7. References
Bossel, Hartmut 1999. Indicators for Sustainable Development: Theory, Method, Applications A
Report to the Balaton Group. The International Institute for Sustainable Development.
URL: http://www.ulb.ac.be/ceese/STAFF/Tom/bossel.pdf, accessed 16th May 201
- 232 -

A. R. Sampaio, R. Quintal., DPSIR Framework for Case Studies in […] Portugal
ANNEX
1. Methodology and Materials
The equations used for index development are shown in Figure 6.10.
Figure 6.10. Equations used for index development.
2. Analysis of sustainable use of resources
2.1. MAL
The sustainability index was based on core indicators such as artificial surfaces, ecological important sites and response area. As shown in Table 6.13, the reference year of 1990 was used to assess the evolution of sustainability. Although there is still a good level of sustainability in the study area (Figure 6.11), there has been a steady decline since 1990 (from 0.79 to 0.67), in spite of an increase on the areas protected under the Natura 2000 network. From the analysis above, this decline in sustainability may be explained by the significant increase of Pressures due to enlargement of artificial surfaces areas.
Table 6.13. P-S-R indicators for MAL. MAL 1990 2000 2006
Artificial surfaces index 1.00 0.15 0.00 Ecological important sites index 1.00 1.00 1.00
Response area index 0.37 1.00 1.00 Sustainability index (Ist) 0.79 0.72 0.67
Figure 6.11. Sustainability tendency of ecological important sites MAL (1990-2006).
- 233 -
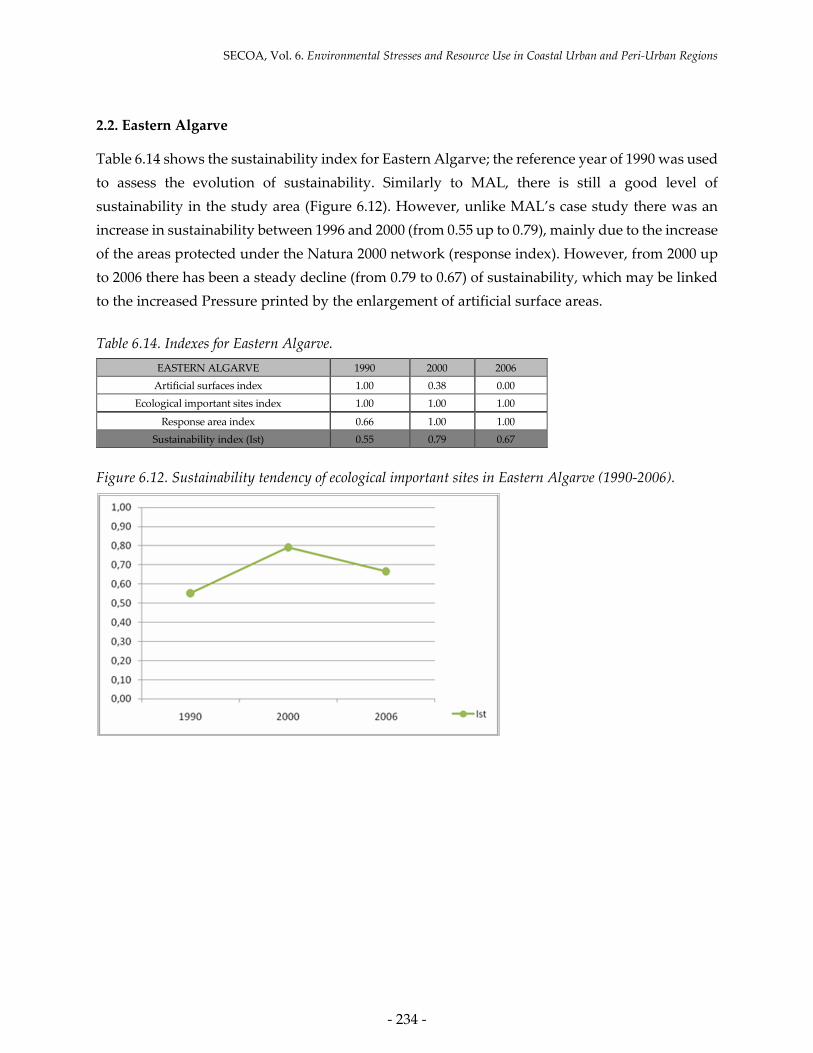
SECOA, Vol. 6. Environmental Stresses and Resource Use in Coastal Urban and Peri-Urban Regions
2.2. Eastern Algarve
Table 6.14 shows the sustainability index for Eastern Algarve; the reference year of 1990 was used to assess the evolution of sustainability. Similarly to MAL, there is still a good level of sustainability in the study area (Figure 6.12). However, unlike MAL’s case study there was an increase in sustainability between 1996 and 2000 (from 0.55 up to 0.79), mainly due to the increase of the areas protected under the Natura 2000 network (response index). However, from 2000 up to 2006 there has been a steady decline (from 0.79 to 0.67) of sustainability, which may be linked to the increased Pressure printed by the enlargement of artificial surface areas.
Table 6.14. Indexes for Eastern Algarve. EASTERN ALGARVE 1990 2000 2006
Artificial surfaces index 1.00 0.38 0.00 Ecological important sites index 1.00 1.00 1.00
Response area index 0.66 1.00 1.00 Sustainability index (Ist) 0.55 0.79 0.67
Figure 6.12. Sustainability tendency of ecological important sites in Eastern Algarve (1990-2006).
- 234 -

CHAPTER 7.
Assessment of Natural Resources Use for
Sustainable Development - DPSIR Framework For
Case Studies in Kungälv (Gothenburg Peri-Urban
Area) and Vellinge (Malmö Peri-Urban Area),
Sweden
Andrea Morf and E. Gunilla Almered Olsson

SECOA, Vol. 6. Environmental Stresses and Resource Use in Coastal Urban and Peri-Urban Regions
1. Introduction
The case studies for SECOA in Sweden comprise Gothenburg and Malmö coastal urban regions, (Figure 7.1). The regions differ in environmental, landscape historical and economic conditions and experience today different environmental challenges in terms of sustainable use of natural resources. Coastal habitats are of high importance in both regions, although they are subject to dissimilar uses and threats. For this study of coastal habitats we have chosen one municipality in each case study region depicted in Figure 7.3 and Figure 7.4, each displaying characteristic features and environmental challenges representative for Swedish peri-urban coastal regions. The two areas selected for this assessment also illustrate differences in scale in relation to environmental problems at various scales and how the scale differences influence coastal management.
The coastal landscape of the Falsterbo peninsula in Vellinge Municipality is analysed in relation to ecological and cultural values and sustainability problems caused by pressure from recreation and development in the coastal zone, which are increasingly aggravated by climate change. The coastal wetlands of Kungälv-Gothenburg constitute representative and vulnerable coastal habitats with multidimensional values threatened not just by use, but also by disuse, making an interesting comparison. There is thus a difference in complexity, with Vellinge including a whole landscape with different habitat types whereas the Kungälv Case focuses solely on coastal wetland habitats. The two peri-urban coastal municipalities are similar in terms of vicinity to large urban areas but the environmental settings and historical land use patterns vary, which contributes to the current difference in challenges elaborated in this study. By comparing these two cases we intend to illustrate how global environmental problems and international environmental policies are reflected differently ‘in the field’. The cases also illustrate the challenges of applying local and national legislation and conservation measures on ecosystems in continuous change – both ecosystem-based and human-induced. The two areas are described below. To facilitate reading, the DPSIR analysis is kept apart, but ends in joint conclusions.
Figure 7.1. Southern Sweden with the case study areas in Kungälv (North) and Vellige (South).
- 236 -

A. Morf and E. G. A. Olsson, DPSIR Framework For Case Studies in Kungälv […] and Vellinge […], Sweden
The purpose of the study has been to assess the sustainability of current uses and ongoing
trends of natural resources in Swedish coastal urban areas, exemplified in coastal wetlands
(Kungälv) and coastal habitats (Vellinge). Climate, a focus area of the SECOA project, will receive
specific attention. A DPSIR perspective is applied to analyze and systematise relevant cause –
effect chains and responses from society to the special situation of these coastal areas. The
application of the DPSIR framework for coastal wetland ecosystems makes it possible to identify
core threats in relation to current measures and policies and to make comparisons between two
highly different regions in Sweden. An additional purpose of the assessment has been to provide
the municipalities with an overview from a new perspective, which may result in insights
facilitating prioritization between management options.
2. Materials and methodology
General methodology
The study is partially based on own data collection and partially on secondary analysis of data
collected by others (according to references in the text). The habitat types were selected based on
the most pressing environmental challenges in the study regions. For further problem and site
specification, the results of the conflict-analyses in Bruckmeier et al. 2011 were included. The
analysis is structured according to a DPSIR-logic (see e.g. EEA 1995; 2001, UN 2001).
2.1. Sources and data
Vellinge
Important documents for a secondary analysis and synthesis of biogeophysical aspects have been:
• Bentz (2009) GIS-based modelling based on a 0.5 m topographic model and ecological
habitat mapping for describing the effects of sea level rise (types/species according to EU-
Habitat/Birds directive) for 9 areas close to the shore of the outer Falsterbo Peninsula
(delimitation according to prominent landscape features).
• SWECO (2011) GIS based modelling on effects of inundations, proposals for mitigation
strategies and measures based on probable sea level scenarios at different time scales
• Blomgren (1999): oceanographic modelling (erosion) and hydrographic and
hydrogeological modelling (groundwater, inundations) partially GIS based.
- 237 -

SECOA, Vol. 6. Environmental Stresses and Resource Use in Coastal Urban and Peri-Urban Regions
• Internet search: CAB, Region Scania, SSSV, Vellinge (incl. films about popular activities):
problem/conflict mapping, drivers, pressures,
• Newspaper search (Sydsvenskan, Expressen): problem/conflict mapping, drivers,
pressures,
The valuation of natural and cultural assets can be both of more natural scientific type
(based on general criteria by way of scientific inventories, red lists etc.) and of a more subjective,
experiential type. The latter type can be assessed using social sciences methods (e.g. interviews,
surveys, valuation, observation and movement mapping). In relation to effects of climate change
on the Falsterbo Peninsula both types are relevant. However, in for the present DPSIR-
assessment, municipal statistics and data on values mapped with natural scientific methods are
used, as other values have so far not been mapped systematically.
Kungälv
Coastal wetlands and their status, threats and management challenges were identified from
environmental planning documents in Kungälv Municipality (Kungälv Municipality 2011,
Naturvårdsplan och friluftsplan 2010, Översiktsplan 2010 för Kungälvs kommun), public maps
(http://gisvg.lst.se/website/gisvg/), plans and management documents for nature reserves
(Länsstyrelsen Västra Götaland, http://www.lansstyrelsen.se/vastragotaland/; Alexandersson
2005) and an unpublished ecological inventory of wetlands for the coastal region (Länsstyrelsen
Västra Götaland 2000).
2.2. Methods
Vellinge
The following methods were used:
• Semi-structured telephone interviews (experts on municipal, regional and county level):
problem & conflict mapping, identifying interesting cases and documents, drivers,
pressures, responses.
• Document analysis of official documents found on authorities’ webpages and draft
versions of reports received from informants: problem/conflict mapping, drivers,
pressures, impacts & status, responses so far.
- 238 -

A. Morf and E. G. A. Olsson, DPSIR Framework For Case Studies in Kungälv […] and Vellinge […], Sweden
• Meetings with conservation experts from CAB and Vellinge Municipality to establish a
preliminary DPSIR framework, developed further by own analysis.
• On-site visit in Malmö, Vellinge Municipality, and the Falsterbo Peninsula (May 2011):
status, pressures.
Kungälv
Main methods have been telephone interviews on the status, threats and management challenges
of the coastal wetlands with officials in the environmental administration of the Kungälv
Municipality and the County Administrative Board, Länsstyrelsen Västra Götaland. A field
survey was performed at each wetland site in April-May 2011. The 13 sites of this study are
marked in Figure 7.4.
Figure 7.2. Gothenburg region including the peri-urban coastal municipalities. The coastal strip with salt
meadows in Kungälv Municipality for this study is marked in white in the figure.
Ku
- 239 -

SECOA, Vol. 6. Environmental Stresses and Resource Use in Coastal Urban and Peri-Urban Regions
2.3. Defining the study areas
Background on the Falsterbo Peninsula in the Vellinge Case
Figure 7.3. Location of Vellinge Municipality in relation to the Malmö case.
Vellinge is an urban fringe municipality of Malmö, located at the southwest tip of Sweden. One
third of its land forms a hammer shaped tip into the Öresund strait and the Southern Baltic – the
Falsterbo Peninsula. Vellinge’s landscape includes both coastal flats and dune landscapes on the
peninsula with relatively low productivity but high biodiversity values and the very fertile,
slightly higher situated southern lowlands on the mainland (CAB Scania 2007). Presently,
Vellinge has ca. 33300 inhabitants, with two thirds living on the peninsula. This peninsula has
been attractive for humans since thousands of years resulting in cultural heritage objects dating
back to the Bronze Age. Moreover, there are high nature conservation and biodiversity values in
the form of large areas of coastal shallow water- and wetland habitats protected by national
conservation schemes and the EU habitats and birds directives (Bentz 2009, Vellinge 2010).
Some areas are subject to regular inundations. This will increase in intensity and
frequency with climate change, thus affecting both ecological and cultural values. Except for the
up to 7 m high sand dunes, the largest part of the peninsula is below 3-4 m over mean sea level
(SWECO 2011). Vellinge’s sandy seashore is prone to erosion and under constant transformation.
Moreover, southern Sweden is slightly sinking, which enhances the need for shoreline protection
and erosion management. Climate change will most likely lead to further heavy storm events and
- 240 -

A. Morf and E. G. A. Olsson, DPSIR Framework For Case Studies in Kungälv […] and Vellinge […], Sweden
higher sea levels and this might happen faster than previously predicted (IPCC 2009). Studying
the problems of climate change and their addressing is highly relevant. Climate related problems
are increasingly important in many municipalities of South Sweden with similar biogeophysical
and demographic conditions. The Falsterbo Peninsula with its high residency-, recreational- and
natural values and its vulnerability to inundations presents these problems in a nutshell - already
today forming a serious challenge for coastal management.
Developing strategies to address climate change and creating an institutional framework
to deal with problems related to climate change in areas with high and conflicting values is
important for authorities on all levels. However, the process is still developing. So far, experts
have mainly described various natural scientific and technical aspects. A more trans-disciplinary
analysis including social scientific aspects is still lacking. Thus, a deepening and broadening of
the analysis seemed both timely for practice and scientifically interesting.
Background on the Kungälv Case
The peri-urban municipality of Kungälv, north of Gothenburg city (Figure 7.2) consists of the
small town of Kungälv and surrounding areas with inland and coastal landscapes. The area is
still responding to the withdrawal of the European continental ice sheet by an ongoing land rise
from the sea expressed as sinking sea-level of approx. 15 cm per century. The region has a long
history of human use since Bronze Age and the contemporary shore line which today is at
considerable distance for the present. Since Prehistoric time people have used the coastal
landscape and its natural resources in a combination of small-scale agriculture and coastal
fishery. The fertile lime-rich marine sediments in the valley troughs have been fundamental for
productive agriculture. The estuary of Nordre älv makes an exceptionally resource rich area with
access to highly productive coastal waters as well as fertile lowlands adjacent to the river suitable
for agricultural production.
Coastal wetlands in this region include salt meadows and wetlands with fresh water
influence at the mouth of small rivers and streams entering the sea. The wetland areas are limited
by bedrock outcrops forming the slopes of the fissure valleys that are characteristic for the
topography in this region. A larger continuous strip of coastal wetlands is located along the outlet
and estuary of the river Nordre älv (Figure 7.4). The coastal wetlands, especially the saline shore
meadows, have been central in the agrarian economy due to their reliable productivity
independent of climatic fluctuations (Gillner 1960).
- 241 -

SECOA, Vol. 6. Environmental Stresses and Resource Use in Coastal Urban and Peri-Urban Regions
Figure 7.4. Coastal wetlands in Kungälv Municipality with the 13 sites indicated by numbers.
Arable land is still a characteristic feature here, although it is mainly used for key
production to feed riding horses and other uses related to the horse keeping activities. Several
golf courses have been established on former arable land. Agricultural activities including
livestock production have decreased significantly and led to still ongoing rapid landscape
changes through tree and shrub invasion on former open grasslands and heathlands that are
important resource areas for the agroecosystems in the region.
Kungälv Municipality is today part of the Gothenburg urban region characterized by
housing and service infrastructure for commuters to the city of Gothenburg. There is a
competition for land for settlements, infrastructure and recreation for the growing population
(Översiktsplan 2010 för Kungälvs kommun). Areas for biodiversity and cultural heritage
conservation coincide with recreational interests in several areas including the coastal wetlands
of Kungälv Municipality.
- 242 -

A. Morf and E. G. A. Olsson, DPSIR Framework For Case Studies in Kungälv […] and Vellinge […], Sweden
3. Natural resources and their exploitation
3.1. State and impacts
3.1.1. The Vellinge Case
The analysis focuses on the outer tip of the Falsterbo Peninsula in Vellinge Municipality – from
the channel outward. It takes a climate change perspective deepening into the interrelation
between ecological values of larger coastal wetland ecosystems (including high biodiversity in
both marine and semidry near-shore habitats) and cultural values in the form of cultural heritage
objects, recreational amenities, and real estate.
Firstly, the different aspects of the analysis are presented separately before assembling
and evaluating in graphical and table form. At the end of the section, conclusions are made in
relation to future problems and yet unaddressed issues. These result from document analysis and
discussion with municipal and regional experts.
The perspective is mainly spatial because: a) it is at present difficult to predict climatic
change in other forms than sea-level rise in relation to topography and currents, b) the effects of
climate change affect the distribution of space between uses (which may need to change in
future), and c) important instruments and strategies to address climate change have spatial
implications (e.g. dams).
Below, the most important values and their status are presented. An overview over both
cultural and natural values is presented in Figure 7.6.
Natural values
Vellinge’s territory includes one of Sweden’s largest marine water areas, mostly shallow water.
The Falsterbo Peninsula has considerable and well-documented natural values - many are of
national and international dignity – for a recent overview see Bentz 2009. Important ecologically
valuable marine habitat types include the Falsterbo “Reef”, shallow sandy shore with varying
sandbanks and eel grass meadows that are ecologically interesting for fish recruitment and wading
birds, and two lagoon areas on the south side of the peninsula (Måkläppen, Ängsnäs). The sandbanks
and surrounding waters are a habitat for two species of seals (Halichoerus grypus, Phoca vitulina). The
narrowest parts of the peninsula are crossed n/s in the west by Ammeränna channel ending in
Ängsnäs Lagoon and farther east by the artificial Falsterbo Channel.
The outer peninsula is also valuable as breeding, resting and wintering place for migrating
birds and waterfowl. Both shallow water areas – not the least Ängsnäs Lagoon – and meadows attract
- 243 -

SECOA, Vol. 6. Environmental Stresses and Resource Use in Coastal Urban and Peri-Urban Regions
migrating birds on their autumn migration, with arctic birds already passing in July and some species
staying during the whole winter. This includes waterfowl, hunters and song birds (Bentz 2009).
Onshore habitats include salt marshes, wetlands, sand dunes and the open heather-landscape
and pine- and oak forests right behind the dunes. The wetlands are habitat for two rare toad species
(Bufo viridis, Bufo calamita). The dunes and their vegetation should be kept in good shape and not
eroded by intensification of recreational uses. This applies also to the open heather landscape (Calluna
vulgaris, Erica tetralix), which needs to be kept open by extensive grazing. The peninsula was
originally forested with oak forest, these were cut down during the 16th Century for building, fencing,
and fuel. Problems with flying sand arose as the forest diminished. During the 19th Century
landowners with summer residencies began to plant pines to prevent sand transport. This was
controversial for those landowners wanting to have cattle grazing and digging for peat. However,
today, peat digging is not an issue anymore, but a view on the sea.
For an overview over the peninsula’s landscapes with valuable types see Figure 7.5. The types
have been delimited from a geographical and landscape perspective using distinctive features in the
landscape and not habitat types. For an overview over the existing valuable habitats a more detailed
analysis in relation to the DPSIR-frame work see Table 7.5 and Table 7.6 in the Annex. Table 7.5
contains a synthesis of the comprehensive study on ecological values and how they are affected by
climate change made by Bentz (2009)1. We will return to this study in the next section. Table 7.6
describes the important EU habitat categories in relation to Natura 2000 and their relevance for the
Falsterbo case.
Figure 7.5. Landscape elements with valuable habitat types on the outer Falsterbo Peninsula (Source: Bentz 2009).
- 244 -

A. Morf and E. G. A. Olsson, DPSIR Framework For Case Studies in Kungälv […] and Vellinge […], Sweden
Cultural values and housing areas
About 20000 people, almost 2/3 of Vellinge’s population, live on to the relatively flat Falsterbo
Peninsula (Skanör, Falsterbo, Ljunghusen and Höllviken; Vellinge Municipality 2008a, 2010).
Based on present day taxation values, the municipality estimates the real estate value of the
peninsula to 2.1 billion €, with Skanör/Falsterbo making 1.7 billion €. This does not include land
values for recreation, beaches, and road infrastructure (Vellinge Municipality, 2008b, p. 21). The
municipality owns more than half of the land on the outer part of the peninsula (ibid.).
As peninsula and its surroundings have been inhabited since thousands of years, Vellinge
is very rich in cultural heritage objects from pre-historic (Iron- and Bronze Age) and historic time.
During Medieval time, Vellinge had almost as many residents as today. Remainders are among
others defense constructions from 1100 and the two churches in Falsterbo and Skanör from the
14th Century. Further culturally interesting objects include the Foteviken Viking Reserve, an open
air museum with year round activities and Falsterbo light house. Later, population declined to
below 10’000. During the 19th Century recreational tourism to the seashore developed resulting
in a revival of the towns and in characteristic hotels, summer cottages and beach houses and a
historical train line out to the old seaside resorts of Falsterbo and Skanör. These objects from the
late 19th and early 20th Century make now part of the attraction and the cultural historical value
of the towns. Many archaeological objects are not even discovered yet, so any construction
onshore and in the water may result in new discoveries (Malmö Kulturmiljö 2008).
Figure 7.6. Overview over valuable habitat types and landscape- & cultural values for the Falsterbo
Peninsula. (Source: A. Morf using documents mentioned in the text above).
- 245 -

SECOA, Vol. 6. Environmental Stresses and Resource Use in Coastal Urban and Peri-Urban Regions
Climate change: present status and predicted impacts for the future
Already today, large parts of the peninsula can be under water for a few hours in connection with
weather-events with westerly winds (CAB Scania 2009). Inundations occur mainly during the low
season (Nov-Feb) SMHI 2008. They can reach up to 1.9 m above the mean sea level (Figure 7.7).
Inundations are likely to occur mainly during winter season even in a closer future, not
when population is highest. At the same time they will within 100 years depart from a ca. 0.7 m
higher sea level and become more frequent (SMHI 2008, SWECO 2011, Blomgren 1999), which
increases the potential for exposure and level of risk. The most important protection measure
besides avoiding new constructions in inundation prone areas is therefore the construction of
dams to break the peaks (see responses).
Figure 7.7. Potential sea-level rise in Vellinge. Legend: Left scale in metres, text showing 100/10/2 year
maximum water levels for 2009 and 2100 (årshögvatten) departing from respective mean water levels for
2009 and 2100 (medelvattenyta) (Source: SWECO 2011).
Potential effects of climate change on natural and cultural values
Merely applying a topographic model and plotting how much area is covered by a sea level rise
in meter intervals (Figure 7.7) indicates how large parts of the coastal wetland areas can be under
water. The high water levels >2 m to be expected on a medium term perspective also affect
inhabited areas. Already the rough map shows how a large part of housing areas (with high real
estate value) and infrastructure are affected by a rising sea level. A detailed analysis was made
by Bentz (2009) and within SECOA (Figure 7.11, 7.12 in the Annex) using 0.5 m steps.
- 246 -

A. Morf and E. G. A. Olsson, DPSIR Framework For Case Studies in Kungälv […] and Vellinge […], Sweden
Figure 7.8. Topographical map of the Falsterbo-peninsula in Vellinge with meter-intervals in relation to
today’s mean water line (Source: CAB 2009).
Climate change may also considerably affect biodiversity values on the peninsula including rare species’ habitats and status of threat (Bentz 2009). Shallow water habitats will increase. The lagoon on Måkläppen will vanish and the Ängsnäs Lagoon will grow considerably. The habitat types of 1110 sublittoral sand banks and 1140 temporarily dry mud & sand flats are already changing today (ibid.). A large area of the lower dune landscape types, coastal marshes, slacks, and grasslands may be affected (for a more detailed analysis see Table 7.5 in the Annex). However, it is important to remember, that these are the existing habitat values and that new habitats may form as the water level rises. Problems may arise in areas with no room for moving – e.g. close to settlement areas where dams have to be set up. There are a number of further uncertainties, such as how a higher temperature will affect the distribution of species and whether the melting of polar ice and Greenland ice will affect the Gulf current and lead to a stop of warm water being transported towards northern Europe.
3.1.2. Coastal wetlands in Kungälv
The coastal wetlands in Kungälv are found at the mouth of small rivers and streams and distinctly limited by rocky outcrops with the exception of the more extensive wetlands bordering the Nordre älv river and the Tofta wetlands which are resulting from a damming exercise in the 19th Century. The coastal wetlands here are not exposed to tidal influence which makes them unique in a western European perspective. However, they experience some water level
- 247 -

SECOA, Vol. 6. Environmental Stresses and Resource Use in Coastal Urban and Peri-Urban Regions
fluctuations due to variations in air pressure and sea water currents. Those wetlands have been used as fodder areas for livestock and were of great economic importance within the preindustrial agroecosystems (Olsson 1991). The plant communities of the saline meadows have high fodder value for grazing livestock and those habitats were considered as the most valuable in the agrarian economy, both due to the fodder value and also to their reliable biomass production irrespective of climate variations (Gillner 1960). They have been mowed for hay crops and grazed by cattle, horses and sheep which have influenced the vegetation, the landscape and all biodiversity dimensions. The time perspective for this usage can be up to 1000 years. The long-term human use (livestock grazing and mowing for winter fodder) of this ecosystem has created specific biodiversity dimensions in terms of bird, insects and plant communities with specific composition and abundance. Their existence is dependent on continuous use or management which has the effect of ecological disturbance factor (Begon et al. 2006) essential for the maintenance of coastal meadow ecosystem and its specific biological diversity.
This use is today changing and partly abandoned. Unmanaged wetlands are characterized by large monospecific stands of reeds (Phragmites communis) and colonization of shrubs in the fresh water influenced parts. The salt meadows remain open.
The coastal wetlands exhibit multiple values. The vegetation with a characteristic zonation along a gradient of salt water influence spanning from Salicornea dominated communities in the shore line via Juncus dominated salt meadows to fresh water influenced species rich meadows with Festuca rubra. Those habitats are of essential importance for the bird fauna, both as crucial feeding and foraging sites for migrating birds during the seasonal migration periods in spring, summer and autumn, as well as breeding habitats. Several breeding bird species need access to open managed wetlands as well as reed stands. Three of the highest ranked ornithological sites (in terms of bird diversity) in the region are found in Kungälv Municipality and are included in this study (Sites 2, 6 and 13, Figure 7.4). Bird species recorded here include a diversity of ducks and wader species and also raptor birds such as peregrine falcon and osprey (Alexandersson 2005). Birds are continuously monitored at those sites (www.svalan.se) and the data stored in the national Swedish species data bank; Artdatabanken. The coastal wetlands are also habitats for a number of redlisted insects and amphibious species. An additional aspect of the coastal wetlands is that they represent important cultural heritage values due to their key position in the pre-industrial agroecosystem (Olsson 1986).
The coastal wetlands in Kungälv constitute large values as recreational areas for visitors using the coastal strip for nature hiking, field biological observation, e.g. bird watching, photographing, fishing from the adjacent rocks etc. A prerequisite for this use is that the shore meadows are open and accessible which they are in the managed state.
- 248 -

A. Morf and E. G. A. Olsson, DPSIR Framework For Case Studies in Kungälv […] and Vellinge […], Sweden
All coastal wetlands in Kungälv are located within the Shoreline protection zone where the national legislation (Miljöbalken 1998:808) generally prohibits building and exploitation activities. Approximately 60% of the coastal wetlands in this region are also protected in nature reserves due to their high biodiversity values, especially their importance for the bird fauna, and also for their combined landscape values. The reserves were established in the period 1974-2005. The main management of the nature reserves is livestock grazing. Unmanaged sites are subjected to successional changes resulting in changed biodiversity status, often declining species number of bird and plant species along with increasing dominance of reed communities.
An overview of the status of the 13 studies sites in Kungälv is presented in Table 7.1.
Table 7.1. Status of coastal wetlands in Kungälv Municipality 2011. Shoreline= Shoreline Protection Legislation;
BH-dirN2000 = Bird and Habitat Directives, and Natura 2000 network, EU-legislation, NR = nature reserve. Site name, nr Habitat types Use Protection status Management needs
1.Aröd: Vallby kile Arable fields surrounding Vallby å; riverine grassland strips
None Shoreline Restoration of wetlands; grazing
2.Ödsmåls kile Ornit. data Salt meadows, wet grasslands,
Livestock grazing
NR; Shoreline; BHdirN2000
Continued grazing
3.Lökebergs kile Phragmites Livestock grazing – one part
Shoreline Restoration of one part; Extended grazing
4.Kroken:Tjuvekile Phragmites dom. None Shoreline Restoration of wetlands; grazing
5.Näset Phragmites dom. Wetlands None Shoreline Restoration of wetlands; grazing
6.Tofta wetlands Ornit. data Wet grasslands, Phragmites areas; Ornit. data
Horse grazing
Management agreement: grazing
Continued grazing
7.Sjöhålan Phragmites dom. Wetlands None Shoreline Restoration of wetlands; grazing
8.Glöskärsviken Salt meadows, wet grasslands, Livestock grazing
NR; Shoreline; BHdirN2000
Continued grazing
9.Fläskholmen Salt meadows, wet grasslands, Livestock grazing
NR; Shoreline; BHdirN2000
Continued grazing
10.Höga: Dalen Salt meadows, wet grasslands, Livestock grazing
NR; Shoreline; BHdirN2000
Continued grazing
11.Överön a: Ornit. data Salt meadows, wet grasslands,
Livestock grazing
NR; Shoreline; BhdirN2000
Continued grazing
12.Överön b: Salt meadows, wet grasslands, Livestock grazing
NR; Shoreline; BHdirN2000
Continued grazing
13.Nordre älv: Harestad
Salt meadows, wet grasslands, Livestock grazing
NR; Shoreline; BHdirN2000
Continued grazing
- 249 -

SECOA, Vol. 6. Environmental Stresses and Resource Use in Coastal Urban and Peri-Urban Regions
3.2. Drivers and pressures
3.2.1The Vellinge Case
For the Vellinge Case , the following important drivers can be identified: a) economic growth and
b) population growth in the Malmö Area lead to development pressure for residency and
recreation in the surrounding municipalities and c) climate change affecting all these activities
and values and eventual mitigation measures.
Important background factors for these drivers are:
• The attractiveness of the coastal landscape due to its natural and cultural values.
• Larger trends in societal values: Many of these values are presently under national and
international protection (natural, cultural, landscape, shoreline, defense, fisheries,
maritime traffic among other), but can also conflict with each other. As the natural and
cultural values of the Falsterbo Peninsula are of international dignity, the regulation of
uses is influenced by trends in national and international policy (EU and international
treaties).
• Accessibility: The Öresund-connection making the larger Copenhagen area and the
continent more easily accessible. The close commuting distance to the regional urban
centres of Malmö and Lund.
a) Economic growth including tourism and recreation activities
According to both economic and population statistics, the Malmö area is an expansive region,
even more so than Gothenburg. During the economic crisis of 2007.2009, the area experienced less
of a decline than other areas of Sweden. Vellinge Municipality’s residents are mostly well off and
well educated. This is even more valid for those with summer residences. Vellinge is one of
Scania’s richest municipalities, mainly due to residents with high income. With regard to mean
income, the municipality ranks 16 in Sweden, in southern Sweden only beaten by Lomma.
Vellinge is highly attractive for summer tourism with thousands of visitors, coming especially for
the seaside. Tourism related services make an important economic sector. Annual bird- and horse
shows and the Viking reserve attract international visitors too.
- 250 -

A. Morf and E. G. A. Olsson, DPSIR Framework For Case Studies in Kungälv […] and Vellinge […], Sweden
b) Population growth
Since 2000, Vellinge Municipality has grown by ca. 3000 persons, resulting in a population of ca.
33,300 residents in 2010 (municipal digital fact sheets). The growth is mainly due to people
moving in and only by one sixth through births. Population growth related problems are
expected increase. By 2025 the municipality expects have 41,000 residents. Thus, there is an
ambition to keep annual growth at a 1%-level in order to be able to adapt both infrastructurally
and socially (Vellinge Municipality 2010, see also responses by municipal spatial planning).
The above drivers a) and b) result in a number of pressures from residency and recreation,
traffic, and tread and wear by recreation.
Box 7.1: Human pressures on the Falsterbo Peninsula
Recreational activities
• Water sports: bathing, sailing, kayaking and canoeing (all seasons), motorboats, water-
scooters and (summer time), kite surfing, windsurfing close to Skanör Harbour (all
seasons), skating (wintertime)
• Horseback riding along trails and on the beach, Falsterbo Horse Show
• Hiking, amber collection at the beach
• Camping: campgrounds and individual camping
• Golf: two golf courses on the peninsula and one close to Ingelstad farther inland.
• Motocross
Building and development activities
• Permanent housing and summer residency
• Commerce and services
• Recreation
• Infrastructure
Sources: Vellinge Municipality 2010, CAB 2010, CAB 2011, interviews, web search.
Development pressure along the coast
Table 7.2 shows the number of buildings close to the shore in 2000 in the coastal zone in strips of
100 m and 300 m. Malmö city is built closer to the seashore than Vellinge. Nevertheless the rather
rural municipality of Vellinge, with small towns on the peninsula has a considerable amount of
- 251 -

SECOA, Vol. 6. Environmental Stresses and Resource Use in Coastal Urban and Peri-Urban Regions
buildings in the 300 m zone. Vellinge has very few buildings 100 m from the mean water line,
which can easily be explained by both enactment of shoreline-protection in the mid 1900s and the
domination of sand and thus instable seashore.
Table 7.2. Buildings within 100 & 300 m from the shoreline in 2000.
Municipalities
Area in ha No of buildings
Area in ha No of buildings
Distance from shore line 100 m 300 m
Lomma 125 157 369 789
Burlöv 6 0 18 0
Malmö 474 259 1164 1519
Vellinge 600 40 1556 959
Source: SCB; statistics homepage
Commuting pressure
Almost half of the population in working age is commuting out: net-commuting from Vellinge to
the surroundings is around -7500 persons per day. The main part commutes to Malmö, Lund or
across the Öresund (Vellinge Municipality 2008a, 2010). Commuting contributes to the
production of climate active gases as it occurs mainly by individual cars. There is a public
transport system with buses, but no railway,
Recreational pressure
The seaside-towns of Falsterbo and Skanör are highly attractive for both summer tourism and
seasonal residency. Well-off people from urban areas far off (e.g. Stockholm, Gothenburg) buy
real estate they only use during summer season. In summertime, the roads towards the peninsula
can be clogged by beach-visitors. An increasing amount of water-scooters, windsurfers, and kite-
surfers compete for space in the water and at the beach. These activities are not necessarily
included in the type of outdoor-recreation originally intended to protect by national interest
areas. Disturbance by noise and high velocities lead to complaints from nature conservation
interests, landowners, bathers, boat people, and local fishers.
- 252 -

A. Morf and E. G. A. Olsson, DPSIR Framework For Case Studies in Kungälv […] and Vellinge […], Sweden
c) Climate change
The threats by climate change include a) sea-level rise (waves, seiche, global sea level rise),
b) the rise of ground water level, and c) coastal erosion (CAB Scania and Blekinge 2008, SWECO
2011, Blomgren 1999). Their occurrence and impacts are moderated by local topography, climate,
and currents. Long-time inundations due to sea-level rise and high water levels onshore are not
much of a problem in the coming decades, but the short peaks might become more frequent soon.
Main season for storm events is at present November-February.
3.2.2. Drivers and Pressures towards wetland change in the Kungälv Case
Drivers
The values of coastal wetlands and saline meadows have been shaped by long-term agrarian use
within the context of the preindustrial agro-ecosystem. Rationalisation of agricultural production
and practices has been ongoing since the beginning of 20th Century in S Scandinavia (Olsson
1991). Particularly since the 1960s this change has been very rapid and resulted in farmland
abandonment. In the beginning of 21th Century in the context of a globalized food market with
pronounced economic competition, there are few possibilities for small scale agricultural
production. The globalized food market, food production systems and change to large-scale
industrial agricultural food production are thus drivers to the agricultural abandonments in the
coastal landscapes. The common agricultural policy within the EU (CAP) which has economically
favored quantitative agricultural production has also been a driver to the above mentioned
agricultural abandonments. The ongoing urbanization to the city of Gothenburg and its peri-
urban regions such as Kungälv Municipality is driving pressures for housing needs, both
permanent settlements and seasonal homes for recreation. Other recreational needs of the
increasing urban population drives demand for leisure space such as golf courses and land use
for the viable horse riding activities that is occupying significant parts of the agricultural land in
the Kungälv Municipality.
Pressures
The most important pressure to the maintenance of the coastal wetland and their multiple values
is abandoned agrarian use in terms of ceased livestock grazing thus leading to successional
changes and biodiversity loss. An increased pressure for settlement at the coast from the urban
centre of Gothenburg and the commuter town of Kungälv is a reality although the existing
national legislation in the Shoreline Protection Law so far has been an effective protection for the
- 253 -

SECOA, Vol. 6. Environmental Stresses and Resource Use in Coastal Urban and Peri-Urban Regions
shoreline habitats. Changes in this legislation towards a more liberal application are under
discussion and could be interpreted as a pending threat to those habitats. Other pressures also
emanating directly or indirectly from the increasing urban population are pressures for harbors
and piers for leisure boats and new roads for increasing access to the shoreline habitats. Also for
such activities the Shoreline Protection Legislation has been a protective shield. Effects on the
ongoing climate change in terms of rising sea water levels are not predicted to be a realistic threat
in this part of Sweden.
3.3. Responses
3.3.1. Responses to pressures in Vellinge
In the following paragraphs, the responses are presented both for municipality and higher-level
authorities (for a time-line see Box 7.3 in the Annex). As mentioned, high dignity conservation
interests overlap with each other and stand against a growing pressure for development for
housing and recreational activities, both for permanent and seasonal residents. The overall-
pressure increases in summer through thousands of visitors to the peninsula. The existing
regulation of uses, not the least the establishment of national priorities can be seen as an earlier
response to pressures (see Box 7.2). However, the national-level strategic goals and sector
interests are not harmonized. This becomes apparent when discussing municipal responses to
climate change.
Prognostics for climate change become increasingly serious (IPCC Copenhagen 2009).
Attempts to address the problems are under way in Sweden, but responses on various levels are
not necessarily coherent. Rather, the existing legal framework has gaps and obstacles for an
efficient addressing of climate related issues.
Moreover, there are numerous uncertainties: a) in relation to physical aspects of climate -
about time-scale of changes and the impacts and probabilities of storm- and inundation events in
future; b) the ecological effects of changes in water level, temperature and weather patterns are
difficult to predict; and c) in relation to social scientific uncertainties, e.g. when present economic
values and investments have to be balanced against potential damages in the future.
- 254 -

A. Morf and E. G. A. Olsson, DPSIR Framework For Case Studies in Kungälv […] and Vellinge […], Sweden
Box 7.2: Responses to conflicts of interest: National interest areas according to the
Environmental Code
Nature conservation: Several nature reserves cover almost the whole territorial waters of
Vellinge and the shore of the outer peninsula, where different conventions and protective
arrangement principles are implemented: protection of biodiversity based on the RAMSAR-
convention, and the EU’s Habitat- and Bird directives, plus nature reserves of national and
regional dignity. This includes protection areas for seals and migrating birds, ecologically
interesting sandy flats, coastal dune and heather landscape, and coastal forests.
Cultural heritage: It covers the agricultural landscape onshore and with a few exceptions the
outer part of the Falsterbo Peninsula. Objects include historical environments on the peninsula
and onshore, specific cultural heritage objects onshore, wrecks in the water and the cultural
landscape including agricultural structures.
National defense: A shooting range on the south-eastern part of the peninsula reaches from
east of Falsterbo out into the water overlapping with the other interests (but out of use).
Shipping: There is a traffic separation area around the fire of Falsterbo Reef (Falsterborev).
Fisheries: A national interest area for fisheries is included.
Outdoor recreation: The whole outer part of the peninsula, outward from the Falsterbo
Channel is of national interest. Besides the classical types of boat-sport, hiking, bathing, and
nature- and bird watching there are numerous new, recreational activities that have not been
evaluated with regard to their impacts on natural and cultural conservation.
Shoreline protection: In order to protect ecologically valuable coastal habitats and ensure
public access for recreation, with few exceptions in the developed areas, almost the whole
shoreline is protected (a band of 100-300 m along the shore), requiring dispensation permit or
detailed development plan if building is to be allowed. So far, shoreline protection has not been
used to prevent development for protecting buildings from natural hazards.
Sources: Vellinge Municipality 2010, CAB 2010, CAB 2011, interviews, web search
- 255 -

SECOA, Vol. 6. Environmental Stresses and Resource Use in Coastal Urban and Peri-Urban Regions
National and regional level responses
Addressing conflicts between development and conservation
Development pressure has already been addressed at an earlier stage in the 1950s through a
Shoreline Protection Act and later in the 1970-80s by establishing national interest areas for
conservation and outdoor recreation on the Falsterbo Peninsula (see Box 7.2 National responses
to conflicting interests). During the 1990s several conservation areas were established. These were
recently harmonised in their delimitation and regulation. Moreover, by way of the Birds- and the
Habitat directive the EU has both enhanced pressure for protection and led to a better knowledge-
base on natural values in the area.
Addressing climate change
The Coherent Swedish Climate- and Energy Policy consists of two governmental bills 2008/09:162
(Climate) and 2008/09:163 (Energy) forming an integrated policy for the period until 2020. The
bills affect Vellinge indirectly over long-term by reductions of CO2 emissions (energy production,
traffic). The mitigation of effects of climate change, through spatial planning with regard to
flooding and landslides is not part of the action plan. The County Administrative Boards have
overarching responsibility to coordinate climate adaptation. They are also responsible for
deciding on appropriate setback lines for future development. The amount of meters above sea-
level varies between CABs but is often in the range of 2.5 m -3.5 m. These lines do not, however,
address how to deal with existing buildings. Further authorities involved are National Land
Survey (new altitude database), Swedish EPA (monitor changes in biodiversity and ecosystem
services), Swedish Geotechnical Institute SGI, the Swedish Meteorological and Hydrological
Institute SMHI, Geological Survey SGU and the Civil Contingencies Agency. Responses on
regional and cross-municipal level include the “Sea-level rise project” by the CAB (2006-8, see
CABs Scania & Blekinge 2008). The municipalities in south Scania have been working with
erosion and inundation for a number of years. This has occurred both by a cross-municipal
collaboration forum including various experts and by way of specific administrative- and
research projects in collaboration with higher-level authorities (SGI, SGU, SMHI) and researchers
(see e.g. Blomgren 2009 for a number of relevant papers).
- 256 -

A. Morf and E. G. A. Olsson, DPSIR Framework For Case Studies in Kungälv […] and Vellinge […], Sweden
Municipal responses - in interaction with higher-level authorities
Vellinge Municipality has to deal with an increasing population pressure and at the same time
protect the natural and cultural assets important for its attractiveness2. The development pressure
on the coast combined with the overlap of higher-level interests and related sector administration
processes require a lot of coordination and provide potential for a variety of conflicts among
diverse constellations of actors. These have to be addressed by the municipality and the County
Administrative Board through spatial planning and sector policy. During the last decade, a
discussion about potential effects of climate change and the placement of dams and measures
against erosion has developed and resulted in a number of reports and conflicts. The municipality
is responsible for safety of buildings in areas covered by detailed development plans.
In relation to strategies for with climate change the municipality is confronted with some
dilemmas:
a) Moving population to the higher land (adaptation strategy) - Sweden’s best agricultural
land
b) Concentration of settlement in order to reduce climate impact of commuting and more
easily mitigate the effects (adaptation) – not in style with the style of settlement in the rural
villages and the old-style seaside resorts
c) Protecting the existing settlement by dams (defense), which has implications for the
natural and cultural values of the peninsula.
a-c) Dams and concentration of future settlement
Vellinge Municipality chooses in the comprehensive plan proposal of 2010 a combined strategy.
In relation to dilemma a) the municipality has decided not to move 2/3 of its population to higher
lands (Vellinge Municipality 2008b, 2010) but to use concentration where possible (slowly and
not allowing too high and too large buildings; b) plus to develop the rail system for public
transport but to mainly rely on a defense strategy for existing cultural and residential values in
spite of conflicts with natural conservation (c). Politicians and municipal experts consider it to be
ineffective and inappropriate to move circa 20’000 citizens farther onshore and to the agricultural
land. The argument for not choosing to move is supported by existing cultural, recreational, and
real estate values (Vellinge Municipality 2008b). Municipal spatial planning is the main
coordinating tool for uses of coastal space in Sweden the 2010 comprehensive spatial plan
proposal is used to describe the strategies. To deal with inundation, the municipality is planning
- 257 -

SECOA, Vol. 6. Environmental Stresses and Resource Use in Coastal Urban and Peri-Urban Regions
to work with two sets of dams around the most important areas (Vellinge Municipality 2010,
interviews) – an inner circle protecting mainly buildings and an outer circle protecting even
cultural values and natural habitats. Dams have impacts not just on the landscape but also on
cultural heritage objects and on biological values. Moreover, some culturally valuable areas are
highly exposed to erosion and difficult to protect by dams (ibid.). The suggested dams are to a
large extent using existing natural and man-made features in the landscape. In some areas new
sections of dams need to be established. Here, conflicts arise between natural and cultural
conservation values. For instance, if historical dams made out of seaweed are to be protected,
new dams need to be erected seaward to the historical ones. This, however, impacts on coastal
meadows. The proposal in the plan is based on a consultancy report co-financed by municipality
and CAB (Malmö kulturmiljö 2008). The medium- and long-term measures suggested have most
impact on natural and cultural values (SWECO 2011, Malmö kulturmiljö 2008) and tend to be
controversial (interviews, CAB 2010). According to latest prognostics (IPCC 2009), Vellinge has
1-2 decades to address these conflicts.
d) Addressing erosion and damage to dunes
Dealing with increasing erosion by regularly reconstructing beaches and dunes
(mitigation). Some of the dunes even function as natural dams, as long as the waves do
not pass the crests (SWECO 2011). However, this requires sand, which the municipality
suggests to take from farther out in its coastal waters. This is controversial with the nature
conservation. In relation to beach- and dune reconstruction the municipality suggests to
re-open an old sand extraction area that is under protection today. This is controversial
with the CAB’s nature conservation section, who claims that meanwhile valuable habitats
have developed (interviews). In March 2011, the nature reserves around the outer
peninsula have undergone specification and harmonization of regulation within the
Falsterbo Peninsula reserve (CAB 20113). Conflicting regulations from other reserves are
abolished. The CAB’s conservation section is critical about all measures that somehow
affect nature conservation values. This affects the municipality’s possibilities to address
the problems.
- 258 -

A. Morf and E. G. A. Olsson, DPSIR Framework For Case Studies in Kungälv […] and Vellinge […], Sweden
e) Integrative spatial planning and management with a climate change perspective
Vellinge Municipality has not been very active with integrative coastal zone management
from another than a sea-level rise-perspective. Swedish municipalities can use
comprehensive planning to steer the uses of both land and water and suggest priorities
with regard to national interest areas. The last conservation- and environmental plan of
Vellinge dates back to the 1990s4. Active regulation and management of water uses has
occurred mainly through the nature reserve process in the responsibility of the CAB. A
comparable municipality, Lomma, has environmental ambitions expressed in documents,
including a management plan for its marine territory. According to interviews this is both
an issue of capacity and priorities and Vellinge intends to develop a water management
plan complement to the 2010 comprehensive plan.
Conclusion: Need for integrative procedures of coordination and conflict resolution
Overall, a number of older unresolved conflicts and new ones arising through the effects of
climate change require attention and appropriate methods, forums, and procedures for
addressing (see also conclusions in Bruckmeier et al. 2011). For example, the CAB as a whole is
not equivocal in its answers to the municipality in relation to priorities between national interests
the nature conservation section stands against the cultural conservation section, and there are no
guidelines for prioritising (CAB 2010, interviews). The CAB, representing different national sector
authorities, would need guidance from above, which is difficult to get, as the national structure
is sector-based without integrative cross-sector planning. There is a need to find a way to
prioritise between national interests. Political priorities may be necessary, because there are no
scientific criteria or well-established procedures to establish priorities5. From a larger perspective,
except for risks and hazards in relation to climate change and the impacts of mitigation measures
on national interests, also the national interest for outdoor recreation can cause recurring
problems when new kinds of activities develop that disturb others and impact on existing natural
and cultural values. These are merely examples where municipal and national interests clash.
Similar problems may arise in relation to regional interests as well (see Malmö settlement
structure case in Bruckmeier et al. 2011).
Climate change requires new constellations of actors to coordinate and collaborate (Anon.
2008). The CAB and the municipalities in Scania are under way with a situation- and problem
- 259 -

SECOA, Vol. 6. Environmental Stresses and Resource Use in Coastal Urban and Peri-Urban Regions
analysis resulting in various reports (see references). But the existing institutional system is not
entirely appropriate to solve the arising problems in an efficient and coherent manner. This will
be discussed further in the conclusions.
3.3.2. Responses to pressures in the Kungälv Case
One of the most influential environmental measures in Sweden has been the installation of the
Shoreline Protection Law in 1965 (Miljöbalken 1998:808). It was a political response to the
increasing pressure on the coastal habitats for housing purposes already in the 1960s and to
ensure free public access to the shoreline. By the installation of nature reserves starting in 1974
(Site 2, Figure 7.4) by the County Administration Board Västra Götaland more than 50% of the
coastal wetlands are protected and under management and restoration. Environmental planning
in the municipality (Kungälv kommun 2010) and in the CABVG aspire to restore current
unmanaged coastal salt meadows and install management by livestock grazing including horse
grazing. The main reason for those measures is the intention to make the coastal habitats more
accessible for visitors. There is also a plan of establishing a coastal trail. The establishment of the
network of Natura 2000 sites all over Europe including the Bird- and Habitat directives has been
a significant positive measure to strengthen the protection of biodiversity and landscape values
of the coastal wetlands. It has also facilitated the funding process from national and EU sources,
for the installation of management measures such as incentives to support livestock grazing on
coastal wetlands. This takes place in all nature reserves in the Kungälv Area. The revised greened
version of CAP, gives economic incentives for biodiversity conservation measures on agricultural
land (CAP ref.). This can be successfully combined with the increasing horse keeping activities
for recreational purposes, characteristic for many peri-urban regions, as in Kungälv.
- 260 -

A. Morf and E. G. A. Olsson, DPSIR Framework For Case Studies in Kungälv […] and Vellinge […], Sweden
4. DPSIR analysis
4.1. DPSIR analysis for Vellinge: climate change and loss of natural and cultural values
on the Falsterbo Peninsula
Below, the overall DPSIR analysis described in the text is presented in Figure 7.9 and in DPSIR
analysis for the Falsterbo Peninsula. The analysis is based on existing proposals for responses to
the effects of climate change and their effects on natural and cultural values and recognizes a
number of uncertainties. specifies the most important factors for different categories and shows
both overall values and specifically analysed ecological habitat values and how they are affected
and what responses are proposed.
Figure 7.9. Overview of DPSIR analysis for the Falsterbo Peninsula including the most important present uses in relation to climate change (Source: analysis by A. Morf).
- 261 -

SECOA, Vol. 6. Environmental Stresses and Resource Use in Coastal Urban and Peri-Urban Regions
Table 7.3. DPSIR analysis for the Falsterbo Peninsula.
Site name Drivers Pressures State Impact Responses
Overall Falsterbo Peninsula - cultural and natural landscape
Present
Urbanisation:
Population growth: amenities attracting people
Increasing tourism & recreation
Öresund bridge: Economic growth
Geological processes (rise/sinking)
Climate & weather
Land consumption
Car traffic (commuting, summer time)
Tread and wear
Temporary inundations
Wave action: erosion & accretion
Little room for expansion of settlement
Congestions during summer
Most projects cause protests
Conflicts between different types of recreation
High real estate prices
Traffic congestion: bad air, bad temper
Segregation
National interest areas: conservation, cultural heritage, recreation
shoreline protection 1952
Spatial planning (municipal)
Channelling traffic & parking
Coastal protection marinas/channel
Future See above
Climate change!
See above, growing
Sea level rise
Groundwater level rise
Wave action
Temperature rise
No room for moving
Little room for spatial expansion
Real estate prices?
Increasing amount of serious storms and inundations
More erosion
Continuing accretion?
Uncertainty: when & how
New urban railway
Enhanced hard protection in channel/harbour
Double ring of dams, pumps, sluices
Beach & dune feeding
Valuable coastal wetlands & dry habitats
A-I (see figs. & annex )
See above
Evolution
Climate change
Geological processes: land sinking, but sand accretion
See above
Climate change: northward expansion of certain biotopes north & inundation of so far drier habitats.
Under protection
Little room for moving: few buffer zones
Uncertainty about impacts and timing
Evolutionary adaptation?
Other responses’ effects on habitats?
Shoreline protection 1952
Natura 2000 areas
Nature reserves with regulation
Channelling uses to certain places and times
Sources: analysis by A.Morf using Anon 2009, Bentz 2009, CAB 2008, Blomgren 1999, Malmö kulturmiljö 2008, SWECO 2011
- 262 -

A. Morf and E. G. A. Olsson, DPSIR Framework For Case Studies in Kungälv […] and Vellinge […], Sweden
DPSIR-Results for the Falsterbo Peninsula in Vellinge Municipality: Issues requiring attention
A number of issues make responses difficult under present institutional and knowledge conditions:
• Paradox in legislation in relation to adaptive management: Instruments according to planning
legislation (PBA) are relatively adaptive, but infrastructure and buildings regulated most
intensively by these instruments are rather constant over time/irreversible, at least once
established. Mobile uses and natural processes will change considerably due to climate
change. These are not regulated by planning-, but by sector legislation such as the
Environmental Code, which deals with dispensation permits, nature conservation,
shoreline protection, watershed management and constructions in the water is relatively
conservative and rigid in its tools. How can municipalities be prepared to take action in
the next 10 years when construction permits for e.g. dams are for maximum 5 years and
may take long time to receive due to controversies?
• Which nature should be protected or how to address climate change in relation to conservation: Is
sea level rise to be considered a natural process allowed to take place or should society
invest to protect coastal marsh habitats (dams, pumps) because there is no time/room to
move them?
• Dealing with uncertainties of climate change with regard to multiple aspects, such as:
a) when storm surges occur and when sea level rise will require action, b) what effects
temperature rise will have on valuable habitat types, c) how changes in weather patterns
will look like in different seasons and how this will affect recreation, d) how sea level rise
and climate threats will affect real estate values and insurance companies’ willingness to
insure certain risks. These uncertainties affect decision-making, e.g. how can spatial
planning have a perspective 50 or 100 years, when everything is uncertain? Many
measures are expensive – which measures should be prioritised? How can authorities
show that they are doing something for the smaller risks in the present and at the same
time address the even bigger long-term problems?
- 263 -

SECOA, Vol. 6. Environmental Stresses and Resource Use in Coastal Urban and Peri-Urban Regions
4.2. DPSIR analysis for the Kungälv coastal wetlands case
Figure 7.10 gives a summary of the drivers, pressures and some possible responses to those,
founded on current ongoing policy directions. The pressures on the wetlands of abandoned
agricultural use in terms of livestock grazing are originating from the globalization of food
production and EU-policies for agricultural production. However, in the EU and in Sweden there
are also policy goals on sustainable resource use in terms of energy, nutrients, water etc., also for
food production. In order to reach those goals regional and local food production will again be
viable and possibilities will open for combinations of needs of urban populations of food,
recreation facilities and coastal access as well as national policies for biodiversity conservation.
Since both biodiversity and cultural heritage values were shaped within the pre-industrial
agroecosystems where the coastal wetlands were central, it is mandatory to maintain some form
of management mimicking the traditional use that can be combined with current societal needs.
Livestock grazing is such management which can be combined with meat production (local food
production), horse riding (recreational needs and coastal access) and biodiversity conservation
(maintenance of the habitats for biological communities).
To conclude, the strong driver for serious pressure to the coastal wetlands in Kungälv
Municipality is of international, global character and not possible to influence with national
policies. However, national policies and incentives can make a change at local and regional scales,
especially in combination with engaged collaboration between administrative authorities in
Västra Götaland and in Kungälv Municipality and local stakeholders (farmers, horse keeping and
other recreation enterprises). Thus such efforts will be important steps in the work for urban-
rural sustainability. It is notable that climatic change is not an urgent threat factor for the coastal
wetlands in Kungälv Municipality
- 264 -

A. Morf and E. G. A. Olsson, DPSIR Framework For Case Studies in Kungälv […] and Vellinge […], Sweden
Table 7.4. DPSIR analysis for the coastal wetlands in Kungälv Municipality. 2011. CAP = Common Agricultural Policy in EU; Shoreline= Shoreline Protection Legislation; BH-dirN2000 = Bird and Habitat Directives, and Natura 2000 network, EU-legislation; NR= nature reserve.
- 265 -
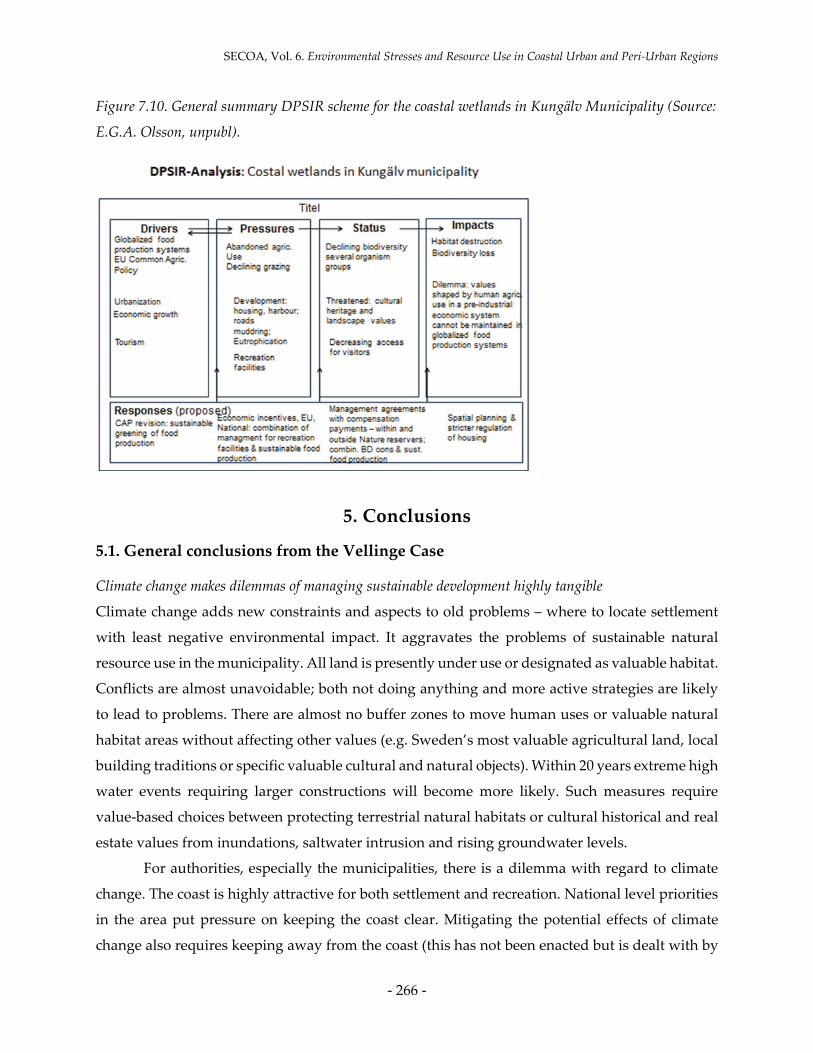
SECOA, Vol. 6. Environmental Stresses and Resource Use in Coastal Urban and Peri-Urban Regions
Figure 7.10. General summary DPSIR scheme for the coastal wetlands in Kungälv Municipality (Source:
E.G.A. Olsson, unpubl).
5. Conclusions
5.1. General conclusions from the Vellinge Case
Climate change makes dilemmas of managing sustainable development highly tangible
Climate change adds new constraints and aspects to old problems – where to locate settlement
with least negative environmental impact. It aggravates the problems of sustainable natural
resource use in the municipality. All land is presently under use or designated as valuable habitat.
Conflicts are almost unavoidable; both not doing anything and more active strategies are likely
to lead to problems. There are almost no buffer zones to move human uses or valuable natural
habitat areas without affecting other values (e.g. Sweden’s most valuable agricultural land, local
building traditions or specific valuable cultural and natural objects). Within 20 years extreme high
water events requiring larger constructions will become more likely. Such measures require
value-based choices between protecting terrestrial natural habitats or cultural historical and real
estate values from inundations, saltwater intrusion and rising groundwater levels.
For authorities, especially the municipalities, there is a dilemma with regard to climate
change. The coast is highly attractive for both settlement and recreation. National level priorities
in the area put pressure on keeping the coast clear. Mitigating the potential effects of climate
change also requires keeping away from the coast (this has not been enacted but is dealt with by
- 266 -

A. Morf and E. G. A. Olsson, DPSIR Framework For Case Studies in Kungälv […] and Vellinge […], Sweden
setback lines). New residents need to find somewhere to stay, increasing the pressure on Scania’s
highly valuable agricultural and green hinterland. National level priorities include conflicts of
goals that are so far unresolved. The pressure is intensified by seasonal migration. There is an
increasing need for coordination in the region of Scania and the whole of Sweden to address
conflicting national and regional interests and deal with climatic change in a coherent manner.
Related local and larger scale issues need to be connected, such as with settlement structure and
infrastructural planning, priorities between national-level interest claims, or coordinating the use
of municipal territorial waters. The regional level responsibility for climate change co-ordination
from a national perspective (by CABs) needs linking up with the political regional level (County
Councils) and municipal decision-making (based on the planning monopoly). In Sweden, the
regional geographical and administrative level is institutionally complex but appears best suited
to make different levels and perspective meet for this purpose, e.g. by using existing tools such
as regional planning according to the Planning and Building Act and creating appropriate forums
to use them.
Wicked problem – difficult to solve – interesting to analyse its management
The issue of coastal wetlands on the attractive Falsterbo Peninsula under the conditions of climate
change and population pressure presents a so-called wicked problem (Rittel & Webber 1973). The
overall problem is highly complex and never finally solved; it may continuously create further
conflicts. Specific conflicts about specific areas and uses arise, get addressed and settled and
return later on in a transformed form (e.g. nature reserve needing to address new uses, see
Bruckmeier et al. 2011). This calls for further observation and analysis in close contact with
authorities and users, both to better understand the interaction between society and nature and –
important for the authorities – to reflect on appropriate measures to mitigate problems and find
workable regulation- and management processes.
Institutional actors on all levels are now assessing the situation and the potential choices.
This applies not just to Vellinge Municipality and its neighbors, those most exposed due to their
geology, but also to Swedish and global society at large. On all levels, appropriate forums for
discussion and decision making need to be established and connected. Most likely the legal
framework needs adaptation and complementing to effectively deal with the expected changes.
- 267 -

SECOA, Vol. 6. Environmental Stresses and Resource Use in Coastal Urban and Peri-Urban Regions
5.2. General conclusions from the Kungälv Case
1. The change of economic importance of the salt meadows from crucial economic
importance in the pre-industrial agro-ecosystems to insignificant importance in modern
agricultural ecosystems has led to general abandoned use of those habitats.
2. Coastal wetlands constitute habitats for valuable biological diversity: birds, insects,
plants. Those specific habitats are depending of management mimicking the ecological
disturbance of traditional use. Abandoned use is thus a serious threat to biodiversity in
coastal wetlands. It is the most burning threat towards biodiversity in this coastal region.
3. New use values for coastal wetlands have appeared in an urbanized economy in the
Kungälv peri- urban region providing recreational facilities such as riding horses. Coastal
wetlands provide fodder areas for horses.
4. Urbanization to the city of Gothenburg and the commuting town of Kungälv drives the
pressure for human recreational access to coastal habitats. The coastal wetlands are
attractive for hiking by foot, riding horses, bird watching, field biologist observations, etc.
5. The pressure for human recreational access in combination with biological conservation
interests of coastal habitats including shore meadows is responded by the municipality
and regional authority by economic investments in restoration activities and reinstalled
livestock grazing
6. General economic development and urbanization drives a pressure for housing and
infrastructure also in the coastal sites. The existing Shoreline Protection Law has so far
been generally successful in regulating this pressure. Increased abundance of settlements
dispersed in the landscape is a challenge to landscapes values and ecosystems, including
water quality.
7. The strong driver of international and global character such as the EU common
Agricultural Policy and global economic market forces influencing Swedish agriculture
and thereby exerting serious pressure to the coastal wetlands is difficult to influence by
national policies. However, national policies and incentives in combination with engaged
collaboration between administrative and local stakeholders can invent successful
responses to the pressures. Such efforts will be important steps in the work for urban-
rural sustainability.
8. Little or no impact by climate change in terms of predicted sea level changes in this region
is apparent.
- 268 -

A. Morf and E. G. A. Olsson, DPSIR Framework For Case Studies in Kungälv […] and Vellinge […], Sweden
5.3. Overall comparison and conclusions
The cases show a number of interesting similarities and differences. The similarities
include:
• Both municipalities are in the “green” urban fringe, attractive for housing and recreation
and commuting to the industrial center.
• In both municipalities there is an old (agri) cultural coastal landscape, cultivated since
prehistoric time, with many traces and archaeological remains of agricultural activities
and settlements. The landscape combines large cultural heritage values with high
biodiversity values in numerous agricultural habitats that still exist – not the least in
coastal wetlands.
• In both case study areas, agricultural land has significantly decreased since the 1950-60ies,
among other due to urbanisation and expansion of infrastructure.
• Both municipalities have a tradition of use as recreational landscapes dating back to the
19th Century – in Vellinge the coastal dune landscape of the Falsterbo Peninsula, and in
Kungälv in the Marstrand Archipelago.
• In both areas, a transformation from mainly agriculture to horse keeping and other
recreational activities (e.g. golf) has occurred6.
The following differences can be identified:
• Due to the topographic, geological and oceanographic differences, the predicted effects of
climate change vary. The Vellinge Case exhibits a number of challenges related to the
combination of climate change effects and effects of urbanization in the larger Malmö
Region. In Kungälv such challenges are not apparent.
• Vellinge has a different topography, better suited for large-scale for agricultural
production away from the coastal shoreline. Most of the coast is already under some kind
of nature protection scheme – mostly nature reserves, unlike in Kungälv.
• Both areas have national interest claims for conservation and recreation. However, in the
Falsterbo Area there are further claims (fisheries, shipping, etc.), and the different uses are
more overlapping physically, which leads to more controversies.
- 269 -

SECOA, Vol. 6. Environmental Stresses and Resource Use in Coastal Urban and Peri-Urban Regions
• The Malmö Area, including Vellinge Municipality, has experienced a fast economic
development during the last decade – due to the Öresund Bridge connecting the cities of
Malmö and Copenhagen and thus linking a megapolis area of some 2 million people. The
Kungälv Area on the other hand, remains a small town although well connected to the
city of Gothenburg (home for commuters). There is a pressure for permanent and
recreational homes also in Kungälv, but less so than in Vellinge.
The following general conclusions can be drawn from the comparison:
• To protect coastal wetland habitats it is important to look at regional particularities, and,
in parallel, be aware of the overall context and check whether the incentives are right (e.g.
national and EU agricultural policy in clinch with environmental policy)
• Addressing the effects of climate change requires a regionally differentiated approach at
the same time as a coupling to regulation and strategies on higher level. Sweden is on its
way, with Scania and the southern and the larger urban municipalities such as
Gothenburg as important drivers. When a new problem like climate change arises, there
are a number of regulatory paradoxes and communication problems to address in the
existing institutional system. This, however, takes time and requires resources, which are
often not available until the water literally rises high.
6. References
Alexandersson. H. 2005. Naturreservatet Nordre älvs estuarium I Göteborg, Kungälv och Öckerö
kommuner. Skötselplan. Management plan for the nature reserve Nordre älvs estuarium.
Länsstyrelsen I Västra Götaland. County Administration Västra Gotaland (CAB VG).
Anon 2008-12-14. SLUTVERSION Stigande havsnivå del 2. Stigande havsnivåer – sakområdes
översikt. Table with overview over topics to assess and regulation to consider in
connection with sea level rise. Internal document. Received from CAB Scania.
Anon 2009-10-08. Vellinge kommun – Landskapstyper/Naturtyper/Biotoper/Habitat (Vellinge
Municipality – landscape types/nature types/biotopes/habitats. Table with natural values
in relation to specific areas. Internal document. Received from Vellinge Municipality.
Begon, M., Townsend, C.R. & Harper, J.L. 2006. Ecology: From Individuals to Ecosystems, 4th Ed.
Wiley-Blackwell. NY.4th edition.
- 270 -

A. Morf and E. G. A. Olsson, DPSIR Framework For Case Studies in Kungälv […] and Vellinge […], Sweden
Bentz, P.G. 2009. Havsnivåhöjning och naturvärden – Falsterbonäset (Sea level rise and natural
values – the Falsterbo Peninsula). Report by Sturnus to CAB Scania and Vellinge
Municipality, Falsterbo (2009-10-30, Vers.rev. 01.00).
BHdir EU.Bird and Habitat directives and the Natura 2000 network.
http://www.coastalwiki.org/coastalwiki/Birds_Directive,_Habitats_Directive,_NATURA
_2000 CABVG.
Blomgren, S. 1999. Hydrographic and Morphologic Processes at Falsterbo Peninsula: Present
Conditions and Future Scenarios. Report No. 1027, Department of Water Resources
Engineering, Lund Institute of Technology, Lund University, Lund Sweden. ISSN 1101-
9824.
Bruckmeier, K. (ed.), Böhler T., Morf A., & Stepanova O. 2011. National Report Sweden:
Identification of resource conflicts in the coastal areas of Gothenburg and Malmö. SECOA
deliverable N 4.2. University of Gothenburg, School of Global Studies, Gothenburg.
CAB Scania (County Administrative Board of Scania) 2007. Det skånska landsbygdsprogrammet:
ett utvecklingsprogram med landskapsperspektiv (The Scanian rural programme: a
development programme with a landscape perspective). Report Skåne i utveckling
2007:10. Malmö.
CAB Scania 2008. Decision on changes in regulation of windsurfing and kite-surfing in the nature
reserve Ljungskogen and Ljunghusens strandbad in Vellinge Municipality. (decision on
surfing zones), 2010-04-08
CAB Scania (Nilermark, K., Gallardo, I., Kristensson, A. & Westlin, K.) 2009. Plan PM Stigande
havsnivå (Planning PM Rising Sea-Level), Report 2009:23, 978-91-86079-65-9
CAB Scania (R. Persson) 2010. Yttrande (Referral on programme for Municipal Comprehensive
Plan for Vellinge Municipality ÖP 2010). Malmö, 2010-08-19.
CAB Scania (Länsstyrelsen i Skåne län, E. Ohlsson) 2011. Beslut: Fastställande av
områdesavgränsning, utökning av area loch Andrade ordningsföreskrifter i
naturreservatet Falsterbohalvöns havsområde, samt upphörande av ordningsföreskrift i
naturresrvatet Ljungskogens och Ljunghusens strandbad, Vellinge kommun (Decision on
changes in delimitation and regulation of the marine and coastal nature reserve Falsterbo
Peninsula in Vellinge Municipality). Decision 2011- 03-10. Attachments included:
CAB Scania and Blekinge 2008. (Mats Åkesson, Anna Kristensson, Anne-Lie Mårtensson, Carina
Burelius & Christer Persson). Stigande havsnivå, konsekvenser för fysisk planering
- 271 -

SECOA, Vol. 6. Environmental Stresses and Resource Use in Coastal Urban and Peri-Urban Regions
(Rising sea-level: consequences for spatial planning). Report 2008:5, ISBN: 978-91-85587-
66-7, Malmö.
CAB Scania: http://www.lansstyrelsen.se/skane/Sv/Pages/default.aspx (homepages on nature
reserves and on climatic change).
CAB (County Administrative Board) Västra Götaland: http://www.lansstyrelsen.
se/vastragotaland/
EEA 1995. Europe’s environment: The Dobris assessment. European Environment Agency.
Copenhagen.
EEA 2001. Environmental signals 2001. European Environment Agency. Copenhagen. EU:
http://ec.europa.eu/environment/nature/natura2000/index_en.htm
Falsterbo Peninsula Nature Conservation - Falsterbonäsets Naturvårdsförening FNF:
http://www.falsterbonaset.se/fnf/falsterbonaset.html
Folkesson, H. (Vellinge Municipality) 2010. Kommer Falsterbonäset att finnas kvar (Will the
Falsterbo Peninsula be still there in the future)? Presentation at the Coastal Meeting
(Kustmöte) Sept. 2010, Vellinge Municipality.
Gillner 1960. Vegetations- und Standortuntersuchungen in den Strandwiesen der Schwedischen
Westkṻste. Acta Phytogeographica Suecica 43.
http://gisvg.lst.se/website/gisvg/
IPCC 2009 (Copenhagen). Working Group I Contribution to the IPCC Fifth Assessment Report.
The Physical Science Basis: Latest Findings to be Assessed by WGI in AR5. 2009.
Kungälv Municipality 2011. http://www.kungalv.se
Länsstyrelsen Västra Götaland 2000. Survey of coastal wetlands in Västra Götaland county.
Unpublished.
Malmö Kulturmiljö (Persson, L., Reisnert, A.) 2008. Kulturmiljöutredning: Kulturmiljövärden på
Falsterborhavlön: En studie av kulturmiljövären relaterat till framtida skyddsvallar mot
översvämning. Skanör och Falsterbo skocknar i Vellinge kommun, Skåne län (Report on
cultural heritage: Cultural values on the Falsterbo Peninsula and the effects of mitigation
of sea-level rise through dams, Skanör och Falsterbo districts in Vellinge Municipality,
Skåne county). Malmö Kulturmiljö, Enheten för kulturmiljövård. Rapport 2008: 022.
Malmö.
Miljöbalken 1998:808. http://lagen.nu/1998:808
- 272 -

A. Morf and E. G. A. Olsson, DPSIR Framework For Case Studies in Kungälv […] and Vellinge […], Sweden
Morf, A. 2006. Participation and Planning in the Management of Coastal Resource Conflicts: Case
Studies in West Swedish Municipalities.Ph.D. Dissertation. Göteborg University, School
of Global Studies, Human Ecology Section, Göteborg. ISBN 91-975290-3-6. 362 p.
Naturvårdsplan och friluftsplan Kungälvs kn. 2010. Plan for Ecological Qualities and Recreation
in Kungälv Municipality. http://www.kungalv.se
Olsson, E.G.A. 1991. Agro-ecosystems from Neolithic time to the present. - in: Berglund. B.E. (ed.)
1991. The cultural landscape during 6 000 years. Ecological Bulletins 41. pp. 293-314.
Olsson, G. (ed.) 1986. Herrön levande odlingslandskap. Tvärvetenskaplig studie av
kulturlandskapets utveckling på Herrön, mellersta Bohuslän - Riksantikvarieämbetet och
Statens Historiska museer. Rapport 1986:3.
Kungälv Municipality 2011. Översiktsplan för Kungälvs kommun. 2010 (Comprehensive Plan
and Assessment of Consequences for Sustainable Development in Kungälv Municipality).
http://www.kungalv.se
Rittel, Horst, and Melvin Webber 1973. Dilemmas in a General Theory of Planning. Policy
Sciences, Vol. 4, pp. 155–169. Elsevier Scientific Publishing Company, Inc., Amsterdam.
[Reprinted in N. Cross (ed.), Developments in Design Methodology, J. Wiley & Sons,
Chichester, 1984, pp. 135–144.]
SCB (Statistics Sweden) 2010. Årsrapport 2010 (Official Statistics of Sweden, Annual report 2010).
Stockholm.
SCB (Statistics Sweden): http://www.scb.se
SEPA protected nature: http://sn.vic-metria.nu/skyddadnatur/indexKarta.htm
SMHI 2008. Nuvarande och framtida vattenstånd i Falsterbokanalen. Rapport 2008:1.
Norrköping.
SOU 2007. Sverige inför klimatförändringarna – hot och möjligheter. Slutbetänkande av klimat-
och sårbarhetsutredningen (Final Report from Climate and Vulnerability Assessment
Committee). SOU 2007:60. Stockholm.
SWECO (Landberg, J., Almström, B., and Hanson, H.) 2011. Vellinge kommun. Höga havsnivåer:
Falsterbonäset samt områdena vid Höllviken/Kämpinge. Handlingsplan för skydd mot
stigande havsnivåer (Vellinge Municipality. High sea levels: the Falsterbo Peninsula and
the areas of Höllviken/Kämpinge. Action plan for protection against rising sea levels).
Report (granskningsexemplar), Malmö, 2011-03-15.
- 273 -

SECOA, Vol. 6. Environmental Stresses and Resource Use in Coastal Urban and Peri-Urban Regions
Swedish Government 2008. A Coherent Swedish Climate- and Energy Policy: Bills 2008/09:162
(Climate) and 2008/09:163 (Energy) to form an integrated policy for the period until 2020.
Stockholm.
UN 2001. Indicators of sustainable development: framework and methodologies. Background
paper no. 3. Commission of Sustainable Development, Division for Sustainable
Development, Department of Economic and Social Affairs, NY.
Vellinge Municipality 2000. Municipal comprehensive plan 2000 (summary).
Vellinge Municipality 2008a. Lokala miljömål; Åtgärdsprogram 2008 (Local environmental
objectives: Action Plan 2008). Adopted by the municipal council 4. February 2009 (to be
evaluated autumn 2010).
Vellinge Municipality 2008b. Skanör och Falsterbo – Vellinge kommun. Boendevärden på Näset.
(Skanör and Falsterbo – Vellinge Municipality: Residential values of the peninsula.
Description of existing residential and recreational values including statistics. Motivation
why the municipality chooses not to leave the area as a consequence of sea level rise but
instead is preparing to defend it against inundations). Miljö &
Stadsbyggnadsförvaltningen, Vellinge, December 2008 (Utkast/draft 2008-12-04). 25 p.
Vellinge Municipality 2010. Municipal comprehensive plan programme draft 2010. NB: Because
of few conflicts from within the municipality, the municipality has decided to directly
proceed to the final public exhibition stage and skip the second publication stage (oral
comm. municipal planner – 2011-05-23).
Vellinge Municipality (websites used regularly 2011): http://www.vellinge.se,
http://www.vellinge.se/kommun-politik/kommunfakta/befolkning/
- 274 -

A. Morf and E. G. A. Olsson, DPSIR Framework For Case Studies in Kungälv […] and Vellinge […], Sweden
ANNEX
Complementary material for the Vellinge Case (boxes, figures, and tables).
Important events in the Falsterbo case: conservation, recreation & climate change:
1952 Shoreline Protection Act: pressure on the shore increases.
The Swedish state decides to protect the shoreline of all of Sweden from development
by establishing a principal shoreline protection 100 m (or 300) from the shoreline.
Through a development ban public access to the shore is enacted. Development is only
allowed based on exemption permits or after spatial planning.
1964 Integration of protection into Nature Conservation Act: shoreline-protection receives
a nature- conservation purpose as well.
1966 onward national spatial planning to take protect important assets and reserve areas for
nationally important uses.
1970s Nature reserves are established around the Falsterbo peninsula: Måkläppen,
Ljunghedens strand, Flommen, Höllviken.
1987 Codification of national interest areas in a Natural Resource Act: Large parts of the
Falsterbo/Skanör peninsula and surrounding seas are declared of national interest for:
Nature conservation, landscape protection and outdoor recreation, fisheries, cultural
heritage.
1987 Planning and Building Act: giving the municipalities the right to dispose over their
territory (municipal planning monopoly) including the territorial waters. Municipal
comprehensive planning can be used to establish priorities between different national-
level interests from a municipal perspective.
1990s Conservation interests are strengthened, partially due to the joining of the European
Union and to Sweden signing other international treaties (EU-birds- and habitat
directives, RAMSAR, Bern Convention, etc.).
1994 South Swedish municipalities, researchers and consultants establish collaboration on
erosion and sea-level rise through the Erosion Damage Centre.
1992 Establishment of nature reserve Falsterbo peninsula and surrounding seas: uses with
high impacts are regulated (e.g. no-go zones for people, rules for behaviour with dogs,
rules in relation to impact on the vegetation and the sandy beaches). A number of
earlier established other nature reserves are partially overlapping (=> problems with
coherence & communication of regulation).
- 275 -

SECOA, Vol. 6. Environmental Stresses and Resource Use in Coastal Urban and Peri-Urban Regions
2000 onward: Integration of environmental law in new code: Environmental Code
New recreational interests develop disturbing people and animals: windsurfing, kite-surfing,
water scooters.
2001 IPCC report predicting slightly higher temperatures, more precipitation and more
frequent storm incidents as most serious effects in the area – by the later part of the
21st Century.
2005 Introduction of regulation for water sports in marine reserve Falsterbo peninsula (no-
go zones & restrictions of velocity in certain areas).
2006-8 CAB Scania initiates project to discuss effects of climate change.
2007 CAB introduces general rules for water scooters (confined to marine fairways and
specifically designated areas, whereof none is within the Falsterbo reserve).
IPCC report: slightly more pessimistic prognostics (change faster).
2008 Final reports from CAB sea-level rise project. Assessment of important issues do
address.
Falsterbo Peninsula 2009 IPCC assessment Copenhagen: higher temperature rise and faster
effects of climate change than foreseen until now (within 20-40 years).
2008 Swedish climate bill (twofold) – focus on exhausts and climate gases and risks/hazards.
The scale is too to help prioritising on local level such as the Falsterbo Peninsula.
2010 The proposal for a municipal comprehensive plan suggests to establish protection
dams in many areas and to expand the harbours of Skanör and Höllviken.. CAB is
critical to dams, but cannot say how to prioritise.
2011 Water & shore: CAB Scania adopts a specified delimitation for the nature reserve
Falsterbo Peninsula and harmonised regulation (abolishing older rules in earlier
established partial reserves). Vellinge is interested in sand-extraction for beach
reconstruction in areas with increasing erosion, which the CAB’s conservation section
is critical against. Municipality wants to skip one public referral stage of the municipal
comprehensive plan as there seems to be broad acceptance. Problems with priorities
in relation to dams against sea-level rise on CAB-level remain unresolved, several
dam- and shutter projects the municipality has applied for are still with the CAB due
to conflicts with nature conservation. Vellinge plans to start planning for its water
resources as an in-depth MCP. The CAB’s new setback lines make it difficult to develop
on the peninsula without special measures. A continuation of the CAB’s sea-level rise
project is under way.
Sources: interviews, municipal comprehensive plans, CAB 2010, CAB 2011, Morf 2006.
- 276 -

A. Morf and E. G. A. Olsson, DPSIR Framework For Case Studies in Kungälv […] and Vellinge […], Sweden
Figure 7.11. Inundation map for Falsterbo PeninsulaFalsterbo Peninsula and Vellinge Municipality Vellinge Municipality (Authors: Knutsson P. & Trang Phuong N.B. unpubl.).
Figure 7.12. Location of proposed dams for Falsterbo Peninsula by Vellinge Municipality. Left: inner rings with medium term priority mainly including settlements. Highest high water level illustrated 2.1m. Right: outer rings with long-term priority, partially including ecologically valuable habitat areas and further cultural heritage values. The highest high water level illustrated 2.4 m (Source: Folkesson 2010).
- 277 -

SECOA, Vol. 6. Environmental Stresses and Resource Use in Coastal Urban and Peri-Urban Regions
Table 7.5. Natural habitat values affected by sea level rise: status and management of valuable coastal
habitats on the outer Falsterbo Peninsula, including water-lands, semi-dry and dry habitats.
Delimitation: from Falsterbo Channel outwards. Focus: present-day coastal wetlands and dry
land habitats. Permanently water covered areas (EU Natura 2000 habitat no. 1100 – see Table 7.6)
are not included in the uses and pressures section. Coastal wet- &
semi-dry lands
Area ha
Habitat types Use, pressures & threats Protection status
Management & maintenance
A South Flommen & Måkläppen
227.9 Sublittoral sandbanks, mudflats, lagoon, drift lines, sand dunes in all stages without forest, humid slacks, species rich dry grasslands, old oak forests Seals like area.
Recreational pressure along beach (partially closed in summer) Climate change: + 0.5m: lagoon and humid slacks vanish. + 1m: drift lines and embryonal dunes vanish Total area of onshore biotopes will decrease by ca 70% and become shallow water habitats
Southern part of Flommen Nature reserve Natura 2000 area Falsterbo Peninsula
Reserves channel recreation & other uses in time & space. Grazing/ cutting of meadows
B North Flommen, Southern Ålasjön
146.3 Sublittoral sandbanks, mudflats, drift lines, salt marshes, sand dunes in all stages without forest, humid slacks
Today: except for dunes (3-7m) below 1 m mean water level. Recreational uses along sand beach Climate change: + 0.5m: salt marshes and humid slacks will vanish. Drift lines and embryonal dunes will decrease by 50-60% + 1m: 40 % left of grey sand dunes Dry/semidry habitats will decrease by ca 70% becoming shallow water habitats
Middle part of Flommen Nature reserve Natura 2000 area Falsterbo Peninsula Falsterbo Peninsula
Reserves channel recreation & other uses. Grazing in salt marshes
C Skanör sand ripples & Bakdjupet
73.7 Sublittoral sandbanks, mudflats with Salicornia, drift lines, salt marshes, sand dunes in all stages without trees, humid slacks
Today: except for grey dunes below 1 m mean water level. Recreational uses along sand beach Climate change: + 0.5m: salt marshes and humid slacks will vanish. Drift lines and embryonal dunes will decrease by 50-60% + 1m: 40 % left of grey sand dunes Dry/semidry habitats will decrease by ca 90% becoming shallow water habitats
Northern part of Flommen nature reserve Natura 2000 area Falsterbo Peninsula Falsterbo Peninsula
Reserves channel recreation & other uses.
D Knösen & Knåvängen
275.4 Sublittoral sandbanks, drift lines, salt marshes, grey and Empetrum covered sand dunes Some forested areas with low Pinus mugo and Betula pendula
Recreational use. Grazing of salt marshes. Erosion due to high waters & waves. Inner part low & inundation prone also due to ground water level. Climate change: + 0.5m: drift lines will vanish, salt marshes will decrease by 70%, permanent sand dunes by 40% + 1m: ca 80% left of Empetrum dunes, rest under water Dry/semidry habitats will decrease by ca 80% becoming shallow water habitats
Western part included in Flommen nature reserve Only to 34% Natura 2000 area Falsterbo Peninsula Falsterbo Peninsula
Seaweed walls Tångvallar: cultural heritage object - man-made, grass covered walls made of seaweed. => protection necessary Grazing necessary.
- 278 -

A. Morf and E. G. A. Olsson, DPSIR Framework For Case Studies in Kungälv […] and Vellinge […], Sweden
Coastal wet- & semi-dry
lands
Area ha
Habitat types Use, pressures & threats Protection status
Management & maintenance
E Coastline Strandbad
? Sublittoral sand banks, beach
Public beach (name) Coastal strip that is publicly accessible between the sea and the shooting range. Climate change: Beach except for dunes be inundated.
Makes boundary between Natura 2000 area in water and
Cleaning of beach
F Skanörs ljung, Ängsnäset, E-part of Falsterbo shooting range
483.8 Sublittoral sandbanks, mudflats, lagoon, sand dunes in all stages without forest, humid slacks, species rich dry grasslands, wet and dry heaths, semi-natural (?) channel
High biodiversity area among other due to Ängsnäs lagoon 85 ha and Ammerännan water course Climate change: + 0.5m salt marshes and migrating dunes decrease by 30-40% + 1 m lagoon will increase by half on the expense of smaller salt marshes, dunes, heaths, slacks, and grasslands
Almost all in Natura 2000 area Falsterbo Peninsula Falsterbo Peninsula & Falsterbo shooting range
Grazing of heath and coastal meadows
G Heath forest between dams (between F and H)
78.8 Empetrum covered dunes and dune forest, species rich dry grasslands, wet and dry heaths, species rich humid and dry grasslands
Biotope types not yet fully described. Grazing, cutting of meadows Climate change: + 0.5 m: no effect + 1 m humid heaths and grasslands reduced by 60-80%
37.8 ha in Natura 2000 area Falsterbo Peninsula Falsterbo Peninsula Rest not protected.
Grazing or cutting of meadows Cutting/burning to prevent overgrowth of heath.
H Hölls beach with Amerikajorden
271.6 Sublittoral sandbanks, drift lines, salt marshes, sand dunes in all stages until Empetrum stage, humid slacks, wet heaths, humid grassland, forest: Betula pendula, Pinus sylvestris
Recreation Grazing Climate change: + 0.5m salt marshes, drift lines, grey dunes decrease by 20-30% (make large part of area!) + 1 m drifting lines, salt marshes, dunes, slacks, wet heaths and grasslands will decrease by 45-95% (depending on type). Existing valuable semi-dry habitats will decrease by ca 60 (0.5m) 80% (1m).
179.3 in Natura 2000 Falsterbo Peninsula Falsterbo Peninsula
Grazing or cutting of meadows Cutting/burning to prevent overgrowth of heath.
I Ljungskogen & Stenudden
28.6 Sublittoral sandbanks and rocks, drift lines, salt marshes, sand dunes in several stages. Seals like area.
Small area close to Falsterbo Channel with dunes up to 7 m. Recreation. Climate change: affecting mainly embryonal migrating sand dunes. Section least affected by sea-level rise due to high dunes – water covered area increasing by 20%.
Natura 2000 Falsterbo Peninsula Falsterbo Peninsula
Channelling recreation
Sources: Anon 2009, Bentz 2009, Vellinge Municipality 2010
- 279 -

SECOA, Vol. 6. Environmental Stresses and Resource Use in Coastal Urban and Peri-Urban Regions
Table 7.6. EU habitat types for Natura 2000.
Table 7.6 describes the important EU habitat categories in relation to Natural 2000 and their
relevance for Fasterbo case. EU-No Habitat type Description Relevance and values in relation to case
study 1110 Sublittoral sandbanks: slightly
covered by sea water all the time
Permanently covered by sea water depth below/= 30m
Few hard bottom (reef) areas in connection with singular smaller or larger rocks or constructions in the
water.
Important habitats for marine species, especially in combination with eel grass
meadows. Not relevant for assessment of
inundation
1140 Mudflats and sandflats not covered by seawater at low
tide (Gyttjebankar)
Shallow, sandy, muddy, often free from macro vegetation, but with
cyanobacteria and diatoms.
In daily contact with seawater, recreationally used.
1150 Coastal lagoons Entirely or partially closed shallow bays, separated from the sea by
thresholds or vegetation limiting water exchange.
Mosaic-like complex of many different habitat types, high biodiversity.
Mostly under protection.
1210 Annual vegetation of drift lines N-rich drift areas with mostly annual vegetation
Close to saltwater
1310 Salicornia and other annuals colonizing mud and sand
(Gyttjebankar)
Periodically inundated, may contain salt deposits
Saltwater influenced, some recreational use (passing)
1330 Salt marshes (1630 Baltic type salt marshes)
Marshy meadows, salinity > 1.5%, partially grazed
Saltwater influenced, cultural landscape through grazing.
2110 Embryonic shifting dunes Early stage of dunes, when deposited by waves and
transported further by wind
Part of the recreationally used beach area.
2120 Shifting dunes along the shoreline with Ammophila
arenaria (white dunes)
Migrating dunes close to shore making chains. White dunes are
higher and not densely vegetated (colour).
Recreationally used, can make parts of the protective walls against inundations,
sensitive to waves.
2130 Fixed coastal dunes with herbaceous vegetation (grey
dunes)
Stabilised coastal dunes Recreational uses (bathing huts often situated here), important for coastal
protection 2140 Decalcified fixed dunes with
Empetrum nigrum Stable coastal dunes, acidified due to loss of minerals, covered with
low/creeping hard vegetation
Important for coastal protection, often used recreationally.
2170 Dunes with Salix repens ssp. argentea (Salicion arenariae)
Stable coastal dunes, eroded down to groundwater level (salix)
Important for coastal protection, often used recreationally.
2180 Wooded dunes of the Atlantic, Continental and Boreal region
Stable, costal, natural forest and forest developed from protective plantations, usually in protected
sites, mainly pine.
Important for coastal- and wind erosion-protection, often used recreationally.
2190 Humid dune slacks Humid slacks within the dune system, caused by erosion down to
the groundwater level.
Important for biodiversity
4010 Northern Atlantic wet heaths with Erica tetralix
In fringe zone of swamps or developed over time through
grazing and burning.
Diversity requires regular grazing/maintenance
6230 Species-rich Nardus grasslands, on siliceous substrates
Dry, acidic substrate, diversity requires grazing or cutting
dito
- 280 -

A. Morf and E. G. A. Olsson, DPSIR Framework For Case Studies in Kungälv […] and Vellinge […], Sweden
EU-No Habitat type Description Relevance and values in relation to case study
6270 Fennoscandian lowland species-rich dry to mesic
grasslands
Dry, acidic substrate, diversity requires grazing or cutting
dito
6430 Hydrophilous tall herb fringe communities of plains and of the montane to alpine levels
Growing along water that is kept open.
Falsterbo & Skanör castle remains, around some archaeological objects.
Smaller areas 6510 Lowland hay meadows
(Alopecurus pratensis, Sanguisorba officinalis)
Developed due to grazing/cutting, often overgrown
Smaller areas, need grazing/cutting
6530 Fennoscandian wooded meadows
Developed due to grazing/cutting, often overgrown.
Need grazing/cutting
9190 Old acidophilous oak woods with Quercus robur on sandy
plains
Low nutrients, dry conditions. In connection with hard winds and
high salinity low forest with poorly developed trees.
Wood not good enough to be cut down in earlier times.
Other nature area types not included in Natura 2000 definitions
Water courses Freshwater Ammerännan, lilla Ammerännan Rocky beaches Stony, where erosion by wind and
waves has taken away fine material and coarse material remains.
Pine forest (on sand) See also forested dunes, dry ground Höllviken, Ljunghusen – even inhabited Birch forest
Beech forest Deciduous forest in more humid
areas To be created
Ruderate areas Not planted areas where pioneer vegetation is establishing itself, often gravel, often building sites
Ridhuset, Skanör, biodiversity values
Avenues Trees planted in rows along roads or on the way to houses, sometimes
for wind protection
Landscape value, birds?
Gardens Depending on maintenance Landscape & recreational values Cemetery Depending on maintenance Landscape & recreational values, close to
Falsterbo & Skanör churches Golf course Depending on maintenance 3 Golf courses in Vellinge, some of them
at times inundated. Parks Depending on maintenance,
Falsterbo stadspark, Nyckelhålsparken
Landscape & recreational values
Sources: Anon. 2009, Bentz 2009, EU-reference lists (Habitats Directive Annex I and II) http://bd.eionet.europa.eu/
activities/Natura_2000/chapter2, SEPA’s interpretation of EU definitions (rev. 2007-06-18).
- 281 -

SECOA, Vol. 6. Environmental Stresses and Resource Use in Coastal Urban and Peri-Urban Regions
Table 7.7. Important rare species mentioned for the Falsterbo Peninsula. Abbreviations in the table: RE: regionally extinct; CR: critically endangered; EN endangered; VU vulnerable; NT near threatened.
Sources: Bentz 2009, EU-reference lists (Habitats Directive Annex I and II) http://bd.eionet.europa.eu/activities/
Natura_2000/chapter2 EU Birds directive123456.
1 Bentz (2009) combines a 0.5 m equidistance topographical model of the peninsula with a habitat mapping. The results include calculations about how much of specific habitat areas are under water if the sea-level rises by 0.5 and 1 m. A specific habitat mapping in GIS-layers is available for most parts of the Natura 2000 areas and nature reserves.
2 This case deepens the Falsterbo conflict described in Bruckmeier et al. 2011 and includes a connection to the settlement structure conflict described in the same deliverable (how rural, urban-fringe municipalities address environmental problems caused by large-scale migration). The case shows the problems from the perspective of a rural municipality additionally threatened by the effects of climate change.
3 There are access limits for visitors during certain times of the year. Water sports have to respect speed limits and no-go areas. Content (see CAB 2011): The purposes of the reserve are “to let the area develop freely based on the marine currents’ eroding and depositing forces on the sandbanks. Animals and plants shall freely colonise the area and develop there.” In order to achieve this a) sand extraction from the water is forbidden and b) disturbances of animals should be minimised. Real estate owners are limited in their uses, which they can be compensated for.
4 The municipal comprehensive plan merely shows the national interest areas (Vellinge 2000, Vellinge 2010, CAB 2010). The municipal environmental action programme (2008) shows only few actions for the two most relevant objectives for the outer Falsterbo Peninsula and its surrounding sea: 10. “Sea in Balance and Living Coast” and 15. “Rich Plant- and Animal Life”. Merely comprehensive planning has tasks - other, more concrete tasks are few and resting. According to an interview with a municipal planner (2011) the necessary studies are expensive and have so far not been top-priority in comparison to sea-level rise.
5 The PBA procedure for municipal plans includes governmental decisions only as a last resort in the case of appeal (detailed development plans). Only the procedure of a MCP can be appealed against, not content.
6 Sources: SCB 2010, official web-statistics using data produced by the Swedish Agricultural Board and municipal comprehensive plans of Kungälv and Vellinge.
No Species Status according to Swedish red list
1364 Halichoerus grypus NT Protected in Sweden
Måkläppen area has largest colony of Southern Baltic
1365 Phoca vitulina EN Protected in Sweden
Måkläppen area has largest colony of Southern Baltic
Birds SPA according to birds directive
Whole of outer peninsula and water area. Flommen nature reserve: bird resting place
Reptiles All protected in Sweden Lacerta agilis VU Protected in Sweden Amphibians All protected in Sweden Bufo calamita EN Protected in Sweden Bufo viridis CR Protected in Sweden Rana esculenta NT Protected in Sweden Plants Iris spuria VU
Protected Nature reserve Flommen (Areas A, B, C)
Eryngium maritimum EN Protected
Nature reserve Flommen (Areas A, B, C)
Oenanthe fistulosa EN Protected
Bupleurum Tenuissimum NT Anthriscus caucalies VU
- 282 -

CHAPTER 8. Assessment of Natural Resources Use for
Sustainable Development - DPSIR Framework for Case Studies in Portsmouth and Thames Gateway,
U.K.
Luciana S. Esteves, Jo Foord and Graham Walters

SECOA, Vol. 6. Environmental Stresses and Resource Use in Coastal Urban and Peri-Urban Regions
List of acronyms and units
BAP UK Biodiversity Action Plan
°C degrees Celsius
c. circa
CD Chart Datum
DCLG Department of Communities and Local Government
DPSIR Drivers-Pressure-State-Impacts-Response
EU European Union
EC European Commission
ha hectares
HRA Habitats Regulations Assessment
Ie environmental impacts
Is socioeconomic impacts
IPCC Intergovernmental Panel for Climate Change
IPPC Integrated Pollution Prevention and Control
IS Index of Sustainability
ISrank Ranking value based on the Index of Sustainability
JNCC Joint Nature Conservation Committee
LDD Local Development Documents
LSOA Lower Layer Super Output Area
PCC Portsmouth City Council
PPS Planning Policy Statement
RIS Relative Index of Sustainability
RISrank Ranking value based on the Relative Index of Sustainability
SAC Special Area of Conservation
SPA Special Protection Area
SECOA Solutions for Environmental Contrasts in Coastal Areas
SIC UK Standard Industrial Classification of Economic Activities
SSSI Site of Special Scientific Interest
UK United Kingdom
- 284 -

L. S. Esteves, et al., DPSIR Framework for Case Studies in Portsmouth and Thames Gateway, U.K.
1. Introduction
Natural habitats in the areas of Portsmouth and Thames Gateway have been greatly modified
during a long history of human occupation. As a result, only a small part of the original natural
coastal habitats still remains, comprising mainly of intertidal flats and saltmarshes. Due to the
importance of these intertidal habitats for biodiversity and supply of ecosystem services, they are
now designated conservation areas of national and international importance. This study uses the
DPSIR framework to assess the sustainability of the intertidal environments within the
boundaries of Portsmouth City Council (PCC) and Thames Gateway, focusing on six statutory
conservation areas (Figure 8.5 and Figure 8.6). These areas are protected by more than one
designation: Ramsar Sites (wetland areas of international importance designated by the
government under the terms of the Ramsar Convention); Special Protection Areas (SPAs are
designated under the European Birds Directive to protect rare and vulnerable species of birds);
Special Areas of Conservation (SACs are designated under the European Habitats Directive to
protect important habitats and their wildlife) and Sites of Special Scientific Interest (SSSIs are
recognised for their nationally important wildlife and/or geology and are legally protected under
the Wildlife and Countryside Act of 1981 and the Countryside and Rights of Way Act of 2000).
Some of these designated areas extend beyond the boundaries of the SECOA study sites, but the
DPSIR assessment will concentrate only on the areas within the project’s study sites (of which the
areal extent is shown in Figure 8.5). As the designated areas overlap and some of the qualifying
features are common to more than one designation, the extent of the SSSIs is used here to assess
current conditions of legally protected intertidal habitats. The DPSIR analysis focuses on changes
occurring within the last two decades and considers previous and long-term factors when they
are relevant to the background condition of the study areas. Although this assessment is focused
at the local level (i.e. within the study areas), national and international drivers and pressures
with significant local influence are also considered.
This study uses the DPSIR framework to assess the sustainability of the intertidal
environments within the boundaries of PCC and Thames Gateway, with focus on statutory
conservation areas (Figure 8.1). Analysis based on the DPSIR framework can contribute to the
protection and the sustainable use of the coastal and marine environment (Turner et al. 2010) by
quantifying the main pressures and economic drivers causing a negative impact and identifying
efficient and cost-effective policy options. The analysis will concentrate on internationally
designated conservation areas to describe the state of the environment (environmental quality),
quantify trends of changes (impacts), analyse the main pressures and drivers of change and, by
- 285 -

SECOA, Vol. 6. Environmental Stresses and Resource Use in Coastal Urban and Peri-Urban Regions
the use of selected indicators, provide a relative comparison of the long term sustainability of
these areas. Six statutory conservation areas are included in this study (Figure 8.5), two in
Portsmouth (Portsmouth and Langstone harbours) and four in the Thames Gateway (Thames
Estuaries and Marshes, Medway Estuaries and Marshes, Swale, and Benfleet and Southend
Marshes). As c. 90% of Foulness lies outside the SECOA study area, it will not be considered in
this assessment.
Figure 8.1. In the UK the DPSIR analysis focuses on intertidal habitats within statutory conservation
areas, as indicated by the blue shaded boxes.
2. Materials and methodology
2.1. Sources and data
• For this study, data was compiled through literature search and by using various sources,
most important are:
• DCLG (Department for Communities and Local Government) - Generalized Land Use
Database of 2001 and 2005.
• Ordnance Survey MasterMap - data were reclassified to enable comparison with
Generalised Land Use Database 2005.
• JNCC (Joint Nature Conservation Committee) – GIS layers of internationally designated
conservation areas (SAC, SPA, Ramsar).
• Natural England – data and reports on the state of conservation of SSSI units.
- 286 -

L. S. Esteves, et al., DPSIR Framework for Case Studies in Portsmouth and Thames Gateway, U.K.
• Office for National Statistics - population growth for the period 2001 to 2009 based on the
Mid-2009 Lower Layer Super Output Area (LSOA) and the number of firms (in 2003 and
2008) at Ward level as provided in the Annual Business Inquiry.
• Meteorological Office.
2.2. Methods
The DPSIR framework is used here to identify the socio-economic drivers that influence
environmental pressures and lead to changes in the state of saltmarshes and mudflats in the two
UK study areas. As part of the DPSIR analysis, the environmental and socio-economic impacts of
the change in the state of the selected intertidal habitats are assessed, in conjunction with the
effects of policy responses. The analysis focuses on changes occurring within the last decade and
considers previous and long-term factors when they are relevant to the background condition of
the study areas. Although this assessment is focused at the local level (i.e. within the study areas),
forces (drivers and pressures) acting at larger spatial scales with significant local influence are
also considered. The structure of the analysis is based on the DPSIR framework proposed by
Turner et al. (1998), which was modified to fit the purpose of this assessment.
Figure 8.2 illustrates the conceptual framework of the DPSIR analysis applied to assess
the sustainability of intertidal habitats within statutory conservation areas of Portsmouth and the
Thames Gateway. The methodological approach started with the identification of the main
drivers influencing the state of intertidal habitats and the resulting environmental pressures.
Together with the main socioeconomic drivers (S), climate change impacts (especially sea-level
rise) are included here due to the considerable pressure they pose on the long-term sustainability
of intertidal habitats. The next step includes the assessment of the environmental pressures (P)
caused by both socioeconomic drivers and climate change impacts and the resulting changes in
the state of the environment (S). The main pressures were identified through a literature search
based on assessments of the conservation of designated areas (i.e. reports from Natural England),
official “state of the environment” reports (e.g. produced by the Environment Agency) and
scientific publications. Changes in the state of the environment will invariably cause direct
environmental impacts (Ie) and these, when significant, lead to socioeconomic impacts (Is). The
realisation of Ie or Is (originated from Ie) calls for responses (R), usually in the form of policies
aiming to lessen the S or reduce the D and P. It is also possible that Ie (sometimes by causing Is)
can directly influence D without the implementation of formal policies.
- 287 -

SECOA, Vol. 6. Environmental Stresses and Resource Use in Coastal Urban and Peri-Urban Regions
Figure 8.2. The DPSIR framework used in the assessment of sustainability of intertidal habitats within
Portsmouth and Thames Gateway.
Selected indicators are used here to quantify changes over time and estimate an index for
the sustainable maintenance of legally protected intertidal habitats. The eight selected indicators
reflect observed changes in relevant D, P, S and Ie. According to Cave et al. (2003), useful
indicators must be: (a) relevant to the issue under consideration (i.e. conservation of intertidal
habitats); (b) practical to measure at the required time and spatial scale; (c) fully and easily
understood and (d) comparable between study sites. The selected indicators are described below
and summarised in Table 8.1.
1. Population growth. It is assumed that population growth is a main driver leading to a
number of interlinked environmental pressures. For example, population growth leads to
coastal development, which results in land use change (e.g. increase in urban areas and
reduction in natural habitats), demand for space (e.g. conflicts of use between
development and nature conservation) and pressure on natural resources (waste
production, water abstraction, deforestation, pollution, overfishing etc.). The population
growth for each SSSI unit was estimated for the period 2001 to 2009 based on the Mid-
2009 Lower Layer Super Output Area (LSOA) data provided by the Office for National
Statistics1. The population within Wards bordering the SSSI was considered to have a
1 http://www.statistics.gov.uk/statbase/Product.asp?vlnk=14357.
- 288 -

L. S. Esteves, et al., DPSIR Framework for Case Studies in Portsmouth and Thames Gateway, U.K.
more direct impact over the conservation areas and was affected more directly by each
SSSI unit. Therefore LSOA units belonging to the bordering Wards were included in the
estimates of population growth.
2. Change in number of industries. This indicator reflects local economic changes, which in
turn influence population mobility and determine the type and intensity of demand for
natural resources (e.g. industrial discharges, traffic, water usage, demand for office space,
land use change etc.). Data on the number of firms at two time points (2003 and 2008) are
available for the study areas from the Annual Business Inquiry, Office of National
Statistics at Ward level only. Areas of economic impact were defined based on the
proximity of economic centres to the SSSI units. The number of industries within the
Wards containing the areas of economic impact was then used to calculate the indicator.
For the purposes of this study the designation of economic impact zones is both initial
and experimental. Further research is required to assess if there is a distance decay effect
in terms of impact. The selection process created overlapping geographies for ‘economic
impact zones’ for the selected case study SSSIs in both Thames Gateway and Portsmouth
(Figure 8.3). The change in the total number of firms and the number of firms in each
broad economic sector (based on the UK Standard Industrial Classification of Economic
Activities, SIC 2003) were calculated for each impact zone.
Figure 8.3. Economic Impact zones of SSSI units in Thames Gateway (left) and Portsmouth
(right).
3. Land use change. Change in land use usually represents environmental pressures, which
occur due to changes in socioeconomic interests. The increase in area of manmade (i.e.
artificial) surfaces and the reduction in extent of natural environment illustrate changes
in the state of the environment. Ordnance Survey MasterMap data were reclassified to
- 289 -

SECOA, Vol. 6. Environmental Stresses and Resource Use in Coastal Urban and Peri-Urban Regions
enable comparison with Generalised Land Use Database 20052 . Reclassification included
assigning different features into two classes: natural or artificial (surfaces). ‘Water’
Polygons have been excluded from the analysis. Although the methodology is simplistic
and limited by edge effects and a number of assumptions in order to fit features into the
two classes, it provides a general indication of the shifting between natural and artificial
areas.
4. Sea level rise. Rising sea levels can directly affect the long-term evolution of intertidal
habitats, especially in areas bordered by fixed coastlines (i.e. urban areas or flood
defences). It is known that, in natural conditions, saltmarshes can cope with sea level rise
by inland migration and vertical accretion. However, the presence of coastal development
prevents inland migration and vertical accretion is often limited by human-induced deficit
in sediment supply. Therefore, sea level rise is the main driver of coastal squeeze, which
is considered one of the main current pressures causing the decline of intertidal habitats.
Here, the relative sea level rise estimated to occur in 50 years based on long-term sea level
trends (estimated from local tide measurements by Woodworth et al. 2009) is used as an
indicator of potential pressure. It is understood that saltmarshes are able to cope with fast
rates of sea level rise if adequate sediment supply is available. Therefore, sea level rise is
used here as a relative measure of potential pressure on the evolution of intertidal habitats
confined by the presence of fixed coastlines.
5. Exposure to waves. Intertidal habitats such as saltmarshes and mudflats develop in
sheltered environments where fine sediments are allowed to settle. The impact of storms
and/or increased wave energy can cause erosion on the edges of saltmarshes. The level of
exposure is determined qualitatively as follows: intertidal habitats along open coasts
exposed to storm waves are assigned the highest value (=1); sheltered environments not
exposed to waves are assigned the lowest value (=0); intermediate values are assigned
based on the percentage of area which is more or less exposed to waves.
6. Loss of saltmarsh areas. Saltmarshes are important intertidal habitats that support
biodiversity and provide essential ecosystem services, such as production of food for
heterotrophs (animals and fungi). A major component of their biological productivity
becomes available to the estuarine nutrient cycles when saltmarsh plant material dies and
2 http://www.communities.gov.uk/publications/planningandbuilding/generalisedlanduse.
- 290 -

L. S. Esteves, et al., DPSIR Framework for Case Studies in Portsmouth and Thames Gateway, U.K.
decays. The organic detritus and especially decomposition products then become
available for uptake by living autotrophs and the cycle continues. A high proportion (the
figure depends on the location) of the recipient autotrophs are unicellular algae inhabiting
the mudflat surface, where they are grazed by small invertebrates (amongst others), that
in turn provide food for, for example, fish and birds. Therefore, saltmarshes are of
importance to carnivorous wetland birds, such as almost all the waders, since they
indirectly feed such birds via the cycle described, even though feeding occurs largely on
the mudflats. The value of mudflats to birds then is much associated with input from
saltmarshes, which can be far distant. However, in terms of associating areas of habitat
with bird numbers, it is the mudflats which are most closely linked, with saltmarshes
providing to some extent roosting sites for birds during high tide. Therefore, there is an
indirect relationship (not easily quantifiable) between saltmarsh area and bird numbers.
Reduction in the area of saltmarshes occurs as a response to natural processes (e.g.
erosion, inundation, climatic variability) and human activities (e.g. land reclamation,
pollution, introduction of exotic species, dredging). Data on saltmarsh losses are restricted
to specific periods in time and the best available options that allow relative comparison
between the SSSI in the two study areas are used here (Table 8.1).
Table 8.1. Summary of indicators used to estimate the relative index of sustainability.
Indicator Measure Period Weight
Population growth % increase in population 2001 to 2009 3
Change in number of industries
% increase in number of firms 2003 and 2008 1
Land use change % increase in artificial areas 2005 and 2011 2
Relative rise in sea level Rise in sea level (cm) observed in 50 years
based on long-term trends Variable (within 20th
century) 2
Exposure to waves Values range from 0 (very sheltered) to 1 (open
coasts directly exposed to the approach of storm waves).
Current exposure to wave climate)
1
Loss of saltmarsh area % loss in saltmarsh area 1971 and 1984
(Portsmouth); 1973 and 1988 (Thames Gateway)
2
Bird count % decline in total bird count 1992/93 to 2008/09 1
State of conservation of SSSI units
% of SSSI areas in unfavourable condition (i.e. destroyed, unfavourable declining and
unfavourable no change)
2008 to 2010 (as in last assessment)
1
- 291 -

SECOA, Vol. 6. Environmental Stresses and Resource Use in Coastal Urban and Peri-Urban Regions
7. Bird count. One of the reasons for statutory protection of the intertidal habitats assessed
here is the support to bird populations of national and/or international importance.
Although there are various proxies that can be used to measure how important certain
areas are to birds, the most common quantifiable parameter is the total number of birds
of all species counted during the year for a specific site. For estimating wetland bird
numbers, large sites such as the Thames estuary are divided into sectors, of a size able to
be covered by an observer over one 3-hour counting period, once per month through the
year. Counts are synchronised so that a large site is counted by several observers in their
different sectors at the same time, to avoid double counting. They are normally conducted
at high tide, when birds are concentrated at roosts. Counts are made of each occurring
species, the annual total is a summation of the individual counts per month. There are
many factors that influence the number of birds in one specific location, especially when
considering migratory birds. Bird numbers are also influenced by weather conditions,
food supply, conditions at remote summer/winter grounds (or en route to such) and bird
movement between adjacent locations of similar habitat. Bird numbers might vary trend-
wise through consecutive years due to changes to environment, which makes bird counts
very useful as proxies for environmental change, particularly since good data are
available for 20-50 years depending on the site. However, much caution needs to be used
before concluding that bird count increases/decreases are directly linked to changes in
environmental quality at specific locations. Wetland birds especially waders need
somewhere to roost at high tide. Waders generally cannot sit on the water in the same
way as ducks, so the site must not be inundated, and should not be covered by tall
vegetation. During neap tides the upper tidal areas of mudflat are often used, during
which time the birds may continue feeding. During spring tides they might use saltmarsh,
but if the vegetation is well-grown and tall this habitat may not be preferred. Waders then
often use agricultural land landward of the sea defences, often the grazing marsh, which
is especially extensive along the Kent shore of the Thames estuary. Changes to land use
can then be significant if tall vegetation as crops comes to dominate potential high tide
roosts. To add further complexity, most waders are present at UK coastal wetlands during
the winter, breeding at much more northerly locations in the summer. Therefore,
wintering populations in the UK also depend on the environmental conditions elsewhere.
- 292 -

L. S. Esteves, et al., DPSIR Framework for Case Studies in Portsmouth and Thames Gateway, U.K.
8. State of conservation of designated SSSI according to Natural England assessment.
Natural England is the organisation responsible for managing the statutory conservation
areas. Assessments are conducted regularly to evaluate the environmental conditions that
support the criteria set for the maintenance of designations. The assessment considers
aspects related to environmental quality, biodiversity, existing pressures, implemented
management measures and observed trends, which gives an indication of the overall state
of conservation. Natural England classifies each SSSI sub-unit into five classes: destroyed,
unfavourable declining, unfavourable no change, unfavourable recovering, favourable.
An area is considered in favourable condition when the special habitats and features are
in a healthy state and are being conserved for the future by appropriate management. An
area in recovering condition means that all necessary management measures are in place
to address the reasons for unfavourable condition; if these measures are sustained, the site
will become favourable over time.
A relative weight was assigned to each indicator (Table 8.1) based on their importance
to the maintenance of the conservation conditions of the intertidal habitats. The weights were
determined based on expert judgement and literature review on the potential effects of relevant
activities or factors. However, a number of tests were conducted to assess the sensitivity of the
method to the exclusion of indicators and their relative weight. The measures used to quantify
indicators’ values reflect the potential for a negative impact. Thus, highest values indicate
increased pressure levels.
2.3. Defining the study area
Both Portsmouth and Thames Gateway study sites are located in southern England (Figure 8.4a).
The Thames Gateway (Figure 8.4b) extends 70 km eastwards along the Thames estuary from the
London Docklands (about 10 km east of central London) to Southend in Essex and Sheerness in
Kent. The Thames Gateway administrative area (Figure 8.4b) covers c. 111,247 ha and has a
population of c.1.45 million people. Population density in the Thames Gateway is spatially
variable and tends to be higher in the boroughs of Greater London and lower eastwards.
Portsmouth (Figure 8.4c) is a coastal city which developed mostly on the Portsea Island,
approximately 112 km southwest of London. Portsmouth City Council (PCC) has an
administrative area of 6,019 ha, of which 4,028 ha (66.9%) is land and 1,991 ha (33.1%) comprise
the Portsmouth (1,431 ha) and Langstone (537 ha) harbours. Portsmouth estimated population is
c. 197,900 inhabitants, resulting in a population density c. 49 inhabitants/ha (or c. 4,947/km2), the
- 293 -

SECOA, Vol. 6. Environmental Stresses and Resource Use in Coastal Urban and Peri-Urban Regions
highest in the country outside inner London. Portsmouth is an important centre of the South
Hampshire sub-region providing employment, leisure, shopping, culture and higher education.
Particularly strong sectors include tourism, education, leisure and retail, marine manufacturing
and information and communications technology. However, Portsmouth shows high
unemployment rates and high numbers of commuters into the city of London.
Figure 8.4. The study areas: Portsmouth and Thames Gateway.
- 294 -

L. S. Esteves, et al., DPSIR Framework for Case Studies in Portsmouth and Thames Gateway, U.K.
Figure 8.5. Names and extent of designated conservation areas within Portsmouth (pink) and Thames Gateway (blue). Note that some of the designated areas extend beyond the boundaries of the study site.
The topography of both areas is mainly flat and low-lying dominated by water features; the river Thames and its tributaries in the Thames Gateway and Portsmouth and Langstone harbours in Portsmouth (Figure 8.5). Based on the Generalised Land Use Database of 2001 (DCLG 2006), the Thames Gateway land use is distributed as follows: greenspace 60.6% (including 20% of agricultural land); water 12.5% (mainly the Thames); domestic buildings 3.3%; gardens 10.4%; non-domestic buildings 2.3%; roads 5.5%; rail 0.5%; paths 0.3%; other 4.8%. Portsmouth is an intensely built up area with c. 58% of the area comprising artificial surfaces (e.g. urban and industrial areas), 19% is wetland and 11% comprises water bodies. Southern England is subjected to continental weather influences that can bring cold spells in winter and hot, humid weather in summer, although the climate is still equable in comparison with adjacent mainland Europe. Weather patterns in Southern England tend to be more settled than in other parts of the UK. The region has a temperate marine climate, with mean annual temperatures around 11°C. January is the coldest and wettest month with average minimum temperatures of 1.4°C and average monthly rainfall of 79 mm, while July is the warmest and driest month with average maximum temperatures of 21.3°C and less than 50 mm of total rainfall. Areas in the Thames Gateway closer to London tend to be warmer than in Portsmouth. Based on the UK Climate Projections’s (UKCP09) central estimate for a medium-emission scenario (equivalent to A1B of the IPCC Special Report on Emission Scenarios), in the southeast of England climate change is expected to result in hotter drier summers, warmer wetter winters, higher sea levels and an increase in extreme events such as heat waves, droughts and floods.
- 295 -

SECOA, Vol. 6. Environmental Stresses and Resource Use in Coastal Urban and Peri-Urban Regions
Intertidal environments comprise some of the most important and sensitive natural habitats in the study areas, most of which are designated conservation areas of international importance. Marshlands have been historically exploited to supply natural resources (e.g. fish, shell-fish, and wildfowl) and have been intensely altered by human intervention (e.g. extraction of salt; sheep grazing; land reclamation for agriculture and urban development). Therefore, the extent of intertidal environments has greatly reduced through time. Although statutory protection has greatly reduced direct negative impact over intertidal environments, these habitats are increasingly threatened by coastal squeeze. Within the PCC administrative area, both Portsmouth and Langstone Harbours are designated conservation areas with the first being intensely modified by human activity, while Langstone Harbour shows better preserved natural characteristics. Five statutory conservation areas dominated by coastal wetlands occur in the Thames Gateway: Thames Estuaries and Marshes, Medway Estuaries and Marshes, Swale (about 72% of the total area), Benfleet and Southend Marshes, and Foulness (only 11% of the total area). The six designated conservation areas included in this assessment are listed in Figure 8.5 (Foulness is excluded as it lies mainly outside the Thames Gateway boundary). Designations tend to overlap (Figure 8.5) and some areas extend beyond the boundaries of the SECOA study sites. The reasons for the SSSI designations included in this assessment are described in Appendix A. Table 8.2 indicates the relative composition of habitats within the Ramsar designated areas (i.e. including areas outside the SECOA study sites).
Table 8.2. Habitat types of the six Ramsar sites within the two study areas.
% of total area Benfleet & Southend Marshes
Medway Estuary & Marshes
Thames Estuary & Marshes
The Swale
Portsmouth Harbour
Chichester & Langstone Harbours
Tidal flats 85.10 58.30 49.60 38.00 59.30 46.00 Salt marshes 6.70 16.80 1.30 5.80 14.00 21.40
Estuarine waters - - - - 21.20 14.10 Seasonally flooded agricultural
land - 13.80 38.60 47.70 - -
Saline/brackish lakes - 4.20 - - 0.30 Brackish/saline lagoons 0.05 0.20 - - 0.30 -
Marine beds (seagrass beds) 5.03 - - - 4.80 1.70 Freshwater lakes/marshes 2.80 0.40 0.70 - - 1.30 Saline/brackish marshes - - 3.20 - - 0.30
Sand/shingle shores - 0.02 0.80 1.00 0.10 0.80 Other 0.05 10.50 1.60 7.50 0.30 14.10
Total area (ha) 2,251 4,697 5,589 6,515 1,249 5,810 Source: Joint Nature Conservation Committee (http://www.jncc.gov.uk/page-1390).
- 296 -

L. S. Esteves, et al., DPSIR Framework for Case Studies in Portsmouth and Thames Gateway, U.K.
3. Natural resources and their exploitation
Here a brief description of the conditions and uses of natural resources in England, with focus on
legally protected conservation areas, is provided. The overview of the current state and past
trends in a broader context is useful as a comparative background for the DPSIR analysis
conducted for the areas of Portsmouth and Thames Gateway.
3.1. State and impact
The six coastal margin habitats (Sand Dunes, Machair, Saltmarsh, Shingle, Sea Cliffs and Coastal
Lagoons) comprise 0.6% of the UK’s land area and provide a total value of ecosystem services
estimated at £48 billion (adjusted to 2003 values), equivalent to 3.46% of Global National Income
(Jones et al. 2011). Although the relative importance varies depending on location, tourism,
leisure and coastal defence are the most economically important ecosystem services provided by
coastal habitats (Jones et al. 2011). While the habitats within the case study areas are varied and
represent the range that occur in southern England, those not completely modified into urban or
agricultural areas are predominantly coastal. The majority of the natural coastal/estuarine
habitats in the two study areas are intertidal mudflats and saltmarshes of national and
international importance, which are designated conservation areas (Figure 8.6). The designated
conservation areas are: Ramsar Sites(wetland areas of international importance designated by the
government under the terms of the Ramsar Convention); Special Protection Areas (SPAs are
designated under the European Birds Directive to protect rare and vulnerable species of birds);
Special Areas of Conservation (SACs are designated under the European Habitats Directive to
protect important habitats and their wildlife) and Sites of Special Scientific Interest (SSSIs are
recognised for their nationally important wildlife and/or geology). The European designated
conservation areas (SPAs and SACs) are protected by law under the EU Habitats and Bird
directives, while SSSIs are legally protected under the Wildlife and Countryside Act of 1981 and
the Countryside and Rights of Way Act of 2000. The areas of the SPA, SAC, Ramsar and SSSI sites
often overlap and some of the qualifying features are common to more than one designation.
Therefore, here the conditions of SSSIs are used to illustrate past trends and current conditions of
protected natural environments.
- 297 -

SECOA, Vol. 6. Environmental Stresses and Resource Use in Coastal Urban and Peri-Urban Regions
Figure 8.6. Statutory conservation areas within the Thames Gateway (left) and Portsmouth (right)
included in this assessment overlap. Areas shown are also designated SSSIs.
As result of a 10-year project aiming to reverse the trend of environmental degradation in
England, at the end of December 2010, the Secretary for the Environment announced that 96% of
the SSSIs were in favourable or recovering conditions (Table 8.3). In comparison, only 57% of the
SSSIs were in the same condition as in 2003 (Natural England 2011). Although there has been a
considerable increase in the percentage of recovering areas, there has been a reduction in the area
of SSSIs in favourable conditions (Table 8.3). According to Natural England (2011), this is partly
due to the use of different monitoring standards and partly due to a decline in the population of
certain species, even though the actual condition of the habitat has remained favourable. This is
the case at a number of intertidal sites where migratory wildfowl are appearing in fewer numbers.
Table 8.3 also shows the conditions of SSSI areas in the counties where the study sites are found.
Greater London is the only one with less than 95% of the areas meeting the target (i.e. showing
favourable or recovering condition). Greater London is by far the most urbanised of the four
counties in Table 8.3 and shows the lower percentage of SSSI in favourable condition. Similarly,
Essex and Kent are the least urbanised and show the largest percentage of SSSI areas in favourable
condition.
- 298 -

L. S. Esteves, et al., DPSIR Framework for Case Studies in Portsmouth and Thames Gateway, U.K.
Table 8.3. Percentage of SSSI areas classified based on their state of conservation.
Condition England Sep 2003
England Dec 2010
Hampshire* Greater* London
Essex* Kent*
Favourable 44.6 37.2 30.4 26.7 57.5 66
Unfavourable recovering 13.7 59.3 66.6 60.7 40.5 31.6
Unfavourable
no change
25.2 2.3 1.3 4.8 1 1.3
Unfavourable declining 16.3 1.2 1.7 7.4 1.0 1.1
Destroyed 0.2 0.0 0.0 0.4 0.0 0.0
Meeting target 58.3 96.5 97 87.4 98 97.6
*As in the latest assessment (last compiled by Natural England on 01 May 2011).
About 254,000 ha of coastal priority habitats under the UK Biodiversity Action Plan
(BAP)3 are within SSSIs, comprising 96% of total coastal habitats in England (Natural England
2011). SSSI coastal habitats meeting the target increased from 76% in 2003 to 98% in 2010 (Natural
England 2011). Table 8.3 shows the conditions of SSSI in the districts located (partially or totally)
within the SECOA study areas and the conditions of the SSSI units included in the DPSIR analysis
(i.e. dominantly comprised by intertidal habitats). Within SECOA districts, only 65% of Greater
London SSSIs are in favourable conditions or recovering (Table 8.4), contrasting with 87% of the
SSSIs meeting the target overall in Greater London county (Table 8.3). However, the largest
percentage of SSSIs in favourable conditions are found within SECOA districts (Table 8.4) when
comparing with the overall figures for the respective counties (Table 8.3), including Greater
London. This might indicate that either conservation areas within SECOA districts are subjected
to lesser pressures than elsewhere in the respective counties or management responses are more
effective. Comparing the SSSIs within the SECOA districts with the ones included in the DPSIR
analysis (Table 8.4), a higher percentage of SSSIs in favourable conditions is found in the latter.
However, this does not always result in a higher percentage of SSSIs meeting the target (e.g.
Essex). Amongst the SSSIs included in the DPSIR analysis, Essex shows the largest percentage
classified as unfavourable declining (7.7%).
3 http://jncc.defra.gov.uk/page-5705.
- 299 -

SECOA, Vol. 6. Environmental Stresses and Resource Use in Coastal Urban and Peri-Urban Regions
According to the Habitats Directive (Article 1), the conservation status of a habitat or
species can be considered to be favourable when:
• The area of habitat is stable or increasing within its natural range;
• The structure and functions of the habitat necessary for its long-term maintenance
continue to exist;
• The population of a species is maintaining itself as viable on a long-term basis
• The natural range of a species is stable; and
• There is sufficient habitat to maintain the species population on a long-term basis.
The trends of impacts and main pressures/drivers impacting on the conditions listed
above are discussed next in a broader context to establish the background for the DPSIR analysis.
Table 8.4. Percentage of SSSI areas classified based on their state of conservation in the districts located
within the SECOA study areas.
Condition Portsmouth Greater London Essex Kent
a b a b a b a b
Favourable 37.83 39.86 42.97 0 77.02 78.06 69.23 68.94
Unfavourable recovering 62.00 59.97 22.21 0 20.76 14.21 28.41 29.12
Unfavourable no change 0 0 1.72 0 0.67 0 1.67 1.24
Unfavourable declining 0.02 0.02 30.78 0 1.55 7.73 0.58 0.57
Destroyed 0.15 0 2.33 0 0.01 0 0.12 0.14
Meeting target 99.83 99.82 65.17 0 97.77 92.27 97.64 98.06
a - in districts within SECOA boundaries; b - considering only the SSSI included in the DPSIR analysis.
England’s biodiversity and the area of natural and semi-natural environments have
declined significantly in the last 50 years, but selected indicators have shown positive overall
trends in the last decade (JNCC 2008; Berry et al. 2011). The 2008 report on progress of the UK
BAP (JNCC 2008) indicates that 40 species are considered to be increasing compared with 42 and
26 in 2005 and 2002, respectively. Eight of the 40 species have been removed from the UK BAP
list because their improvement has met the set targets. Although the rate of decline is slowing for
most species, eight (5% of the priority species) have been lost since the BAP publication in 1994.
The 2008 report (JNCC 2008) shows a less favourable trend for habitats, with 19 considered to be
declining (against 17 in 2005), of which six have been declining at faster rates (three in 2005). The
- 300 -

L. S. Esteves, et al., DPSIR Framework for Case Studies in Portsmouth and Thames Gateway, U.K.
increase in declining habitats is attributed to improved data availability, as these habitats were
classified as having ‘unknown’ trend in 2005.
It is estimated that coastal margin habitats in the UK have reduced in 10% in the last 60
years, mainly due to development and coastal squeeze. However, habitat loss of certain habitats
(i.e. saltmarshes) is considerably higher in some areas (i.e. southeast England). The six habitats
assessed as declining accelerating by the UK BAP report are coastal or marine: mudflats,
saltmarsh, coastal vegetated shingle, maritime cliff and slopes, sheltered muddy gravels and
sublittoral sands and gravels.
Wetlands cover c. 4% of England and because they support a high number of
internationally important species, c. 47% of England’s wetlands are legally protected under SSSI
designation (Berry et al. 2011). About 21% of SSSI wetlands are considered to be in favourable
conditions and 48% are considered to be recovering. Areas of saltmarshes have reduced
considerably in the 20th century, with only a small proportion of the original habitats left. Targets
set for maintaining or enhancing habitats are mostly behind the schedule set by the UK BAP in
2006, with some targets (e.g. saltmarsh habitat recreation) showing no progress (JNCC 2008).
Figure 8.7. Importance of broad habitats for delivering ecosystem services and trends since 1990 (modified from
UKNEA 2011).
- 301 -

SECOA, Vol. 6. Environmental Stresses and Resource Use in Coastal Urban and Peri-Urban Regions
Figure 8.7 illustrates the importance of selected broad habitat types for delivering
ecosystem services and the respective trends in the UK since 1990. The habitat types shown in
Figure 8.7 are relevant to the DPSIR analysis presented later in this report and the trends indicate
whether impacts have intensified or lessen in the period. It is evident that these habitats have
medium to high importance to most of the ecosystem services listed, but the majority has shown
a decline in the services flux, with only one or two showing some improvement in each habitat.
However, there is low confidence in most of the trends. Besides contributing with high
biodiversity, coastal margins are of great cultural and touristic importance in the UK, receiving
over 250 million visits per year, of which about one-third are to natural habitats (UKNEA 2011).
Degradation of coastal habitats and expansion of urban areas has negatively impacted ecosystem
services related to climate regulation, hazards (flood regulation), soil and water quality and noise.
In more recent times, reductions in the intensity of land management for agriculture and
increased efforts in controlling diffuse and point sources or pollution have helped slowing the
decline in many species used as indicators of ecosystem quality. However, these indicators are
based on counts of well-monitored plant and animal species, while little is known about changes
in microorganism assemblages in soils and water, which are essential to sustaining production
(UKNEA 2011).
3.2. Drivers and pressures
A worldwide assessment (Millennium Environment Assessment 2005) has indicated that the key
direct drivers of changes in the state of coastal zones are related to changes in land use and
climate, while the indirect drivers include population growth, economic globalisation and
changes in consumer preferences and diets (all leading to changes in land use and/or pollution).
The UK National Ecosystem Assessment (UKNEA 2011) concluded that the primary drivers of
change in UK ecosystem services in the last 60 years were: land cover change from natural
habitats to farmland; exploitation of natural resources, especially marine fish; air and water
pollution (especially nitrogen, sulphur and phosphorus); and to a lesser extent climate change
and invasive species (including plant pests and animal diseases). Clearly most of the identified
primary drivers are directly linked to population growth and urbanisation and are also related to
globalisation and change in consumer preferences.
The UK population has grown from ca. 50 million in 1950 to c. 62 million today, about
24% in 60 years, and as incomes have also increased, the demand for ecosystem services has never
been greater (UKNEA 2011). During the post-war reconstruction phase in England, agricultural
- 302 -

L. S. Esteves, et al., DPSIR Framework for Case Studies in Portsmouth and Thames Gateway, U.K.
production expanded rapidly with farmed land increasing by 40% from 1940 to 1980 (UKNEA
2011). This occurred at the expense of large areas of semi-natural habitat, which were converted
into arable land. The increase in fertiliser use, particularly nitrogen and phosphorus, has
impacted aquatic ecosystems through runoff (UKNEA 2011). The loss of natural habitats and
water pollution contributed to a long-term trend of declining biodiversity that only recently has
started to reverse.
Similarly to the intensification of agriculture, growth of other sectors (energy, industry,
housing and transport) also caused significant impacts on ecosystems by atmospheric pollution
(e.g. nitrogen and sulphur), loss of habitats through urbanisation and disruption of flood regimes
in river basins and coastal wetlands by water abstraction and engineering works. Despite being
one of the world’s most densely populated countries, most of England’s land is classified as
Arable and Horticultural and Improved Grasslands (Berry et al. 2011). Only c. 14% of the country
comprises of urban areas (according to the Generalised Land Use Database 2005), which have
increased in the last two decades. Between 1991 and 2006, 152,400 ha of new development have
been built, dominantly (75%) on brownfield sites and only 0.4% on undeveloped green belt land
(Natural England 2010).
In more detail, Turner et al. (2010) identify as the main direct drivers and pressures on
coastal and marine ecosystem services: land use change (coastal urbanisation and deforestation
leading to loss of natural habitat); climate change (including sea level rise); pollution and
contamination; mining; poor management of fisheries (overfishing or destructive practices);
invasive species and engineering works. A number of studies have listed the main drivers and
pressures affecting coastal zones over large spatial areas (i.e. globally and regionally). However,
it is likely that the main influencing factors will change and/or have different levels of importance
when the assessment is conducted at national and local scales. Additionally, the time scale and
period of assessment can greatly affect the measured trends and environmental changes, as both
drivers and responses can vary significantly.
Figure 8.8 shows the main threats to priority species and habitats in 2005 and 2008 in
England (JNCC 2008). Priority species and habitats are listed in the UK BAP as being the most
threatened and requiring conservation action. Habitat loss is clearly the main threat to both
species and habitats as it results from land use change caused by different drivers (e.g. agriculture
and infrastructure development). Other threats affecting both species and habitats are global
warming, invasive species and pollution. However, the pressure from habitat loss seems to have
increased more over priority species than habitats, while pollution and global warming are
- 303 -

SECOA, Vol. 6. Environmental Stresses and Resource Use in Coastal Urban and Peri-Urban Regions
perceived to be a greater threat to habitats than species (Figure 8.8). The relative importance of
the threats between 2005 and 2008 has changed more for habitats than for species, especially due
to increasing pressure of global warming and marine pollution and less pressure from habitat
loss due to infrastructure development and fisheries.
Figure 8.8. Most important threats to priority species and habitats in the U.K. (Source: JNCC 2008).
In the last 20 years, it is estimated that sea-level rise caused a 4.5% reduction in the area
of saltmarshes in the UK, which is expected to accelerate in the future mainly due to coastal
squeeze (Jones et al. 2011). Other climate change related impacts relate to changes in temperature
(which can affect shifts in coastal species), rainfall distribution (affecting habitats dependent on
water table) and storminess (increasing sediment mobilisation and rates of coastal erosion).
- 304 -

L. S. Esteves, et al., DPSIR Framework for Case Studies in Portsmouth and Thames Gateway, U.K.
Adequate sediment supply is essential for the development of saltmarshes. Human intervention
such as coastal protection works, building of ports, dredging and land reclamation have altered
sediment budgets and pathways along most coastlines, usually resulting in sediment deficit and
coastal erosion. Steepening of intertidal environments has been observed in the UK by low
waterline migrating landward faster than high waterline (Hansom 2010), which has been used as
an indicator of sediment loss (Jones et al. 2011). Air pollution from nitrogen and sulphur affects
soil and vegetation of coastal habitats, especially in southeast England due to location of pollution
sources. Atmospheric concentrations of sulphur dioxide in urban areas have decreased
significantly since 1950s due to the reduction in the use of coal for domestic heating. Pollution
from nitrogen oxides and dioxides increased between 1940 and 1990 due to the intensification of
agriculture but has reduced since. As a result, eutrophication has reduced and water quality has
improved. Although not included as one of the main threats shown in Figure 8.8, tourism patterns
have been a major driver of coastal change (Jones et al. 2011). In mid-20th century, resort tourism
dominated and high visitor pressure was concentrated at relatively few beach locations (Walton
2000). In the 1970s, the pattern changed to day trips and dispersed visitor pressure to areas a few
hour’s drive from major urban areas (Williams and Shaw 2009). More recent changes in tourism
pressure resulted from the expansion of low-cost airlines (increasing international travel) and
growing interest in outdoor-oriented attractions (e.g. eco-tourism, specialist sports). Both have
contributed to a dispersion of pressure from tourism and collapse of coastal resorts in England.
However, the deep economic recession experienced since 2009 caused a revival of internal
tourism and more traditional seaside resorts. Current trends indicate a continuous increase in
day-visits and short-stays and a slight decrease in long-stays at the coast (Williams and Shaw
2009).
Table 8.5 lists the main pressures affecting coastal wetlands in England and their trends
at different time scales. Some pressures observed in the 20th century have accelerated in the
second half of the century but have decreased or ceased to exist (e.g. land reclamation) in recent
times due to the positive effect of policy responses. This is particularly noticeable in the control
of water pollution, eutrophication, land reclamation and introduction of invasive species.
However, pressures linked to climate change tend to accelerate in the future.
- 305 -

SECOA, Vol. 6. Environmental Stresses and Resource Use in Coastal Urban and Peri-Urban Regions
Table 8.5. Main pressures affecting coastal wetlands in England and their trends at different time scales.
Pressures Long-term (20th
century or longer) Medium-term
(since 1950s)
Recent
(last 20 years)
Future (21st century)
Sea level rise + + + ++
Increase in wave energy + + + ++
Land reclamation + ++ - -
Coastal urbanisation + ++ + -
Change in sediment supply + ++ ++ ++
Coastal engineering ++ ++ ++ ++/+
Dredging ++ ++ ++ +
Water pollution ++ ++ + -
Invasive species ++ ++ + +/-
Tourism/recreation + ++ + ++/+
- decreasing; + increasing; ++ increasing/accelerating
3.3. Responses
The Convention on Biological Diversity4 has triggered a number of policies and laws aiming to
protect species and habitats in Europe and in England. Two main European initiatives have
significantly influenced efforts towards conservation of biodiversity in England: the European
Council Directive 92/43/EEC of 21 May 1992 on the conservation of natural habitats and of wild
fauna and flora (known as the Habitats Directive) and the Directive 2009/147/EC of the European
Parliament and of the Council of 30 November 2009 on the conservation of wild birds (which is
the amended version of the original Directive 79/409/EEC, known as the Birds Directive). The
Habitats Directive was implemented to protect the most seriously threatened habitats and species
in Europe. To do so, member states are required to establish Special Areas of Conservation (SACs)
based on the presence of habitats and/or species of importance to Europe. The Birds Directive
requires member states to establish Special Protection Areas (SPAs) to ensure protection for all
wild bird species naturally occurring in the European Union. In England, in addition to the
European designated conservation areas, the Planning Policy Statement 9: Biodiversity and
Geological Conservation (ODPM 2005a) and Circular 06/2005 (ODPM 2005b) requires that
Ramsar sites (designated under the Convention on Wetlands of International Importance 1971)
4 http://www.cbd.int/.
- 306 -

L. S. Esteves, et al., DPSIR Framework for Case Studies in Portsmouth and Thames Gateway, U.K.
are treated as if they were officially designated European sites for the purposes of assessing
potential detrimental effects caused by development proposals.
The transposition of the Habitats Directive into the UK law was provided by the
Conservation (Natural Habitats, &c.) Regulations 1994 (known as the Habitats Regulations). The
Habitats Regulations was amended by the Conservation (Natural Habitats &c) (Amendment)
Regulations 2007, as a result of the European Court of Justice Ruling of October 2005. The Ruling
found that the Habitats Regulations had failed to correctly implement the intention of the
Habitats Directive in that it only required the application of Habitats Regulations Assessment
(HRA) to projects, as opposed to plans and programmes. The HRA aims to assess the potential
effects of land use plans on the conservation of statutory European designated sites (e.g. SPAs
and SACs). Where negative effects are identified, the precautionary principle should apply and
alternative actions and/or mitigation measures should be considered. As a last option, if it is
impossible to prevent or mitigate the adverse effect, planners and developers must demonstrate,
under the conditions of Regulation 85(C) of the Habitats Regulations, that there are Imperative
Reasons of Overriding Public Interest (IROPI) to continue with the proposal. Since the amended
Habitats Regulations 2007, HRA must be applied to all Local Development Documents (LDD) in
England and Wales. LDD are statutory documents (as part of the Planning and Compulsory
Purchase Act 2004) that describe the strategy and policies of each local planning authority for
development and use of land within their administrative area. At present, local governments in
England are developing their Core Strategy (one of the LDD) setting out their priorities and
objectives for up to 2027.
SSSIs are legally protected under the Wildlife and Countryside Act 1981, as amended by
the Countryside and Rights of Way Act 2000 and the Natural Environment and Rural
Communities Act 2006. Another important step towards biodiversity preservation resulted from
the publication of the UK Biodiversity Action Plan (BAP) in 1994, which by 1999 included 391
priority species and 45 priority habitats.
One of the United Nations Millennium Development Goals5 included reducing
biodiversity loss considerably by 2010 (Target 7b). England’s Biodiversity Strategy (published in
2002) established the mechanisms for achieving the Millennium Goal and the BAP.
European Environmental Directives place a duty on each EU Member State to implement
policies to protect and improve the environment and the health of its citizens. The EU Sixth
5 http://www.undp.org/mdg/goal7.shtml.
- 307 -

SECOA, Vol. 6. Environmental Stresses and Resource Use in Coastal Urban and Peri-Urban Regions
Environment Action Programme of the European Community 2002-20126 includes thematic
strategies to address environmental issues with focus on: waste prevention and recycling; the
marine environment; soil; pesticides; natural resources; the urban environment; and air pollution.
Besides the already mentioned Habitats and Birds directives, other strategies established by the
Environment Action Programme influencing environmental policies in England include:
Directive 96/61/EC7 on integrated pollution prevention and control (IPPC) and the Directive
2000/60/EC8 , known as the Water Framework Directive (WFD). The IPPC requires Member States
to introduce regulations to control pollution from a range of industrial activities, from energy
production to waste management. The transposition of the IPPC Directive into the national
legislation came with the publication of the Pollution Prevention and Control Act 19999
(Lawrence and Isted 2008). The act establishes that emissions to air, land and water from
potentially more polluting installations are regulated by the EA, while activities less potentially
pollutant are regulated by local authorities. Currently, the Environmental Permitting (England
and Wales) Regulations 201010 establishes the conditions for licensing operations involving air,
water and soil waste/pollution production. The WFD came into force in 2000 and became part of
UK law in December 2003. The WFD aims to provide means to protect and enhance the quality
of groundwater, rivers, lakes, estuaries, coastal waters (up to one mile offshore from low-water)
and dependant ecosystems. In England, the EA aims to implement the WFD by:
• improving inland and coastal waters through better land management (especially by
reducing diffuse pollution in urban and rural areas);
• promoting sustainable use and better management of water as a natural resource;
• enhancing habitats for wildlife dependent on water environments.
• assessing the impact of human activity on the water bodies within the 11 River Basin
Districts in England and Wales;
• monitoring the status of water bodies against the set objectives;
• preparing the River Basin Management Plans; and
• taking the lead in drawing up and carrying out the Programme of Measures.
6 http://ec.europa.eu/environment/newprg/strategies_en.htm. 7 http://eur-lex.europa.eu/LexUriServ/LexUriServ.do?uri=CELEX:31996L0061:en:HTML. 8 http://eur-lex.europa.eu/LexUriServ/LexUriServ.do?uri=OJ:L:2000:327:0001:0072:EN:PDF. 9 http://www.legislation.gov.uk/ukpga/1999/24/contents. 10 http://www.legislation.gov.uk/uksi/2010/675/part/2/made.
- 308 -

L. S. Esteves, et al., DPSIR Framework for Case Studies in Portsmouth and Thames Gateway, U.K.
4. DPSIR analysis
4.1. DPSIR Analysis For Assessing The Sustainability Of Saltmarshes And Mudflats
In Designated Conservation Areas Of Portsmouth And Thames Gateway
Figure 8.9 illustrates the conceptual framework of the DPSIR analysis applied to assess the
sustainability of intertidal habitats within statutory conservation areas of Portsmouth and the
Thames Gateway. Although different in many aspects, both Portsmouth and Thames Gate share
the same D-P-S-I-R factors relevant to the conservation of intertidal habitats at the scale in which
the analysis is conducted here (SSSI units). For example, the list of operations types that are likely
to damage the special interest at each SSSI produced by Natural England differs mainly in the
occurrence of only one of the 28 listed operations (see Appendix B). It is expected, however, that
the level of potential impact will be variable between the SSSI areas. Only when analysis is
conducted at a very local level (i.e. SSSI subunits) do important differences occur on the types of
pressures and level of impact. Therefore, a general description of main D-P-S-I-R interactions is
applicable to both areas.
Considering that the EU Habitats and Bird Directives have triggered the statutory
conservation of important intertidal habitats (which is the focus of this analysis), they are listed
here as a main driver positively influencing the state of conservation, but (negatively) increasing
conflicts of use. All other listed drivers are somehow interlinked and tend to conflict with
conservation aims. Sea level rise is an important driver for the long-term evolution of intertidal
habitats. The combination of sea level rise and the presence of coastal development and flood
defences lead to one of the main pressures to the sustainability of intertidal habitats. In natural
environments where adequate sediment supply exists, intertidal habitats can accrete vertically
and migrate inland as a result of sea level rise. However, where the coastline is fixed by the
presence of flood defences or urban development, intertidal habitats cannot migrate inland and
lose area due to increased inundation from rising sea levels (this process is known as coastal
squeeze). Coastal squeeze is one of the main pressures affecting intertidal habitats in Portsmouth
and the Thames Gateway. As a result of coastal development, land use change and land
reclamation lead to a reduction in the extent of intertidal habitats and increase in developed areas.
Water pollution from domestic, industrial and agricultural sources negatively affects the
ecological functioning of intertidal habitats, often reducing biodiversity. According to Natural
England (2011), the habitats within Portsmouth and Langstone Harbours are highly sensitive to
inorganic fertilisers and pesticides and their use should be avoided even in surrounding areas.
- 309 -

SECOA, Vol. 6. Environmental Stresses and Resource Use in Coastal Urban and Peri-Urban Regions
Although eutrophication may still be a chronic problem in some areas, organic and inorganic
pollution has been significantly reduced in the last few decades as a result of environmental
policies (e.g. EU Nitrates and Water Framework Directives). Erosion of saltmarshes and mudflats
due to the effect of dredging, boat waking and/or storms can have considerable impact on the
state of conservation of these habitats. In some of the SSSIs (e.g. Langstone Harbour), the impact
of recreational activities is also of concern.
To better understand the relationships within and between groups of factors in the
generalised DPSIR framework (Figure 8.9), a more detailed analysis is required for the main
influencing factors, such as coastal squeeze (Figure 8.10). Population growth leads to an increase
in developed areas that ultimately requires a change in land use from the substitution of natural
to urban environments. In many cases, land reclamation takes place to create agricultural or
urban areas in locations previously occupied by intertidal environments. In Portsmouth and the
Thames Gateway the coast is dominated by low-lying flood-prone land, where long-term rising
sea levels aggravate the risk of coastal flooding, leading to the construction of flood defences. As
a consequence, the coastline, once dynamic and constantly changing to accommodate the
variability of natural processes, becomes fixed by the presence of urban development and/or
flood defences. One direct effect of increase in developed land is the loss of recreational areas.
The combined effect of land use change and coastal squeeze cause a reduction in the area of
intertidal habitats, the ecosystem services they provide and their overall quality, including the
biodiversity they support. One of the ecosystem services offered by intertidal habitats is natural
flood protection to inland environments (including developed areas). Therefore, reduction in
intertidal habitats will result in less natural flood protection. The status of legally protected
conservation areas is directly related to the maintenance of biodiversity. Reduction of biodiversity
might affect the conditions required for the award of designations and result in declining
conservation status, which can ultimately lead to losing statutory protection. Poor or declining
conditions of conservation affect tourism and recreation linked to bird watching and nature
conservation. As responses to the impacts shown in Figure 8.10, a number of policies have been
implemented. The Planning Policy Statements (PPS) are mechanisms used by the national
Government to incorporate into the planning system a range of requirements set out in
international and national legislations. PPS9 (published in 2005) sets out planning policies on
protection of biodiversity and geological conservation and PPS25 (published in 2006, revised in
2010) concerns with development and flood risk.
- 310 -

L. S. Esteves, et al., DPSIR Framework for Case Studies in Portsmouth and Thames Gateway, U.K.
Figure 8.9. DPSIR Framework for the sustainability of intertidal habitats in designated conservation
areas in Portsmouth and the Thames Gateway.
An example of the current drivers and pressures can be given by the Portsmouth Core
Strategy11, which plans for 12,800 new homes; 301,875 m2 employment floor space; 50,000 m2 retail
floor space; and the necessary associated facilities, services and critical infrastructure for the
period 2006 to 2027. Portsmouth is already densely urbanised with a deficit of green spaces.
Therefore, new development is targeted to occupy previously developed land. However, areas
identified for new developments are at high or very high risk of flooding, increasing the pressure
for enhanced flood protection. As Portsmouth is surrounded by designated conservation areas,
flood protection can only be built or upgraded if it is demonstrated not causing detrimental
impact. Associated with the pressure of new development within Portsmouth area, there is the
planned economic growth for the South Hampshire region, which is likely to increase the
pressure from recreation and leisure, commuters’ population, demand for services and natural
resources (e.g. transport, sewers, waste management, water consumption). The main drivers
affecting the conservation on natural habitats in Portsmouth are: air pollution, recreational
11 http://www.portsmouth.gov.uk/living/7923.html.
- 311 -

SECOA, Vol. 6. Environmental Stresses and Resource Use in Coastal Urban and Peri-Urban Regions
pressure, flood risk, coastal squeeze, habitats degradation, light pollution, urbanisation, water
abstraction/consumption and waste water pollution (UE Associates Ltd 2011). However, the
Habitat Regulation Assessment (HRA) has concluded that water abstraction and waste water
pollution are unlikely to cause any adverse effect on the integrity of statutory conservation sites
and mitigation measures can effectively reduce the negative impact from the other pressures (UE
Associates Ltd 2011). However, climate change is likely to aggravate coastal squeeze and the
conflicts between flood risk management and conservation of intertidal habitats.
Figure 8.10. Detailed DPSIR framework for the impact of population growth and coastal squeeze on
intertidal habitats. Sea level rise rate shown applies to Portsmouth areas.
4.2. Sustainability of natural resources in the study areas
Taking into account that: the DPSIR analysis here focuses on statutory conservation areas; most
pressures show evidence of alleviating; and management measures are generally in place to
maintain and/or improve the current state of conservation, all six SSSI areas are considered to
have sustainable use. (see annex for index). The limitations include (amongst others):
- 312 -

L. S. Esteves, et al., DPSIR Framework for Case Studies in Portsmouth and Thames Gateway, U.K.
• quantification of indicators is based on variable time spans;
• some indicators reflect a direct pressure or impact (e.g. loss of saltmarsh areas), others
cause indirect impact (e.g. change in number of industries) that is not easily quantifiable;
• the index is sensitive to the weights attributed to each indicator;
• same weights were used here for all areas, although it is likely that the importance of
pressures/impacts are spatially variable; and
• the final ranking is likely to change if different time-spans, formulas or indicators are
used.
Figure 8.11. Population changes in the areas adjacent to the SSSI.
Indicators and trends
A brief description of the data and trends used to quantify the indicators for each of the six
designated conservation areas is provided below.
Population growth. All areas have shown an increase in population between 2001 and 2009
(Figure 8.11) ranging from 2.9% (in Benfleet and Southend Marshes) to 15.7% (in Swale). Benfleet
and Southend Marshes show the largest population of all areas but the lowest population growth
(Figure 8.11). Benfleet’s population was stationary and even decreased between 2003 and 2006,
but has increased since. Swale, on the other hand, has the smallest population but the highest
growth in the period (Figure 8.11), which is due mainly to a new housing development in Iwade.
- 313 -

SECOA, Vol. 6. Environmental Stresses and Resource Use in Coastal Urban and Peri-Urban Regions
Although Portsmouth Harbour has larger population in surrounding Wards, it shows a pattern
of population growth similar to Langstone Harbour.
Change in number of industries. All areas showed an increase in the number of firms between
2003 and 2008, with relative increases varying from 5.2% to 17.3% (Figure 8.12). Langstone and
Portsmouth Harbours experienced the largest relative increase in the number of firms of the six
economic impact areas, with Medway Marshes showing the largest increase in the Thames
Gateway (Figure 8.12). The increase in absolute number of firms, however, varies from 269 in the
South Thames Estuary to 792 in the Medway Estuary. Portsmouth Harbour experienced a larger
change in number of firms than Langstone Harbour, but relative growth was larger in the
Langstone Harbour economic impact area. Banking and Financing represented the largest
increase in most areas, except in the Langstone Harbour, where change in number of construction
firms was highest (Figure 8.12). Besides Banking and Finance, most new firms were in
Construction and Public Administration, Health and Education, with the sectors of
Manufacturing and Distribution, Hotel and Restaurants representing the largest reduction in the
number of firms.
Figure 8.12. Change in the number of firms by sector (SIC 2003) within the impact economic area of the six SSSI. The total increase in number of firms from 2003 to 2008 and the percentage in relation to the total number of firms in 2003 is indicated.
- 314 -

L. S. Esteves, et al., DPSIR Framework for Case Studies in Portsmouth and Thames Gateway, U.K.
Land use change. Between 2005 and 2009 a relatively small (0.18% to 1.25%) switch from natural
to artificial surfaces has occurred in the six areas. As expected, due to the already intense
urbanisation, Portsmouth’s areas have shown the smallest change (0.18% in Langstone Harbour
and 0.26% in Portsmouth Harbour). Swale has shown the highest increase in artificial surfaces
(1.25%), which are related to the new housing development in Iwade. The second largest increase
in artificial area was observed in Benfleet and Southend Marshes (0.84%).
Sea-level rise. Rising sea levels and isostatic land subsidence result in the study areas being
subjected to one of the highest rates of relative sea level-rise in the country. Here, (worst-case)
long-term rates of sea level rise estimated by Woodworth et al. (2009) for stations in the study
areas (Table 8.6) are used to estimate the rise in sea levels expected in 50 years (the usual life-time
of coastal defences). Highest rates of sea-level rise are found for Sheerness and Tilbury, along the
Thames. The impact of rising sea levels on the evolution of saltmarshes depends highly on
sediment availability and the presence of coastal defences. However, the magnitude of rates can
be used as a relative comparison of the pressure on intertidal habitats.
Table 8.6. Estimated rise in relative sea level in 50 years based on long-term trends.
Conservation Area Station Trenda 50 yr rise in sea level (cm)
Portsmouth Harbour Portsmouth
2.02 mm yr−1 10.1 Langstone Harbour
Benfleet and Southend Marshes
Southend 1.50 mm yr−1 7.5
South Thames Estuary Tilbury Sheerness
3.03 mm yr−1
2.45 mm yr−1 13.7b
Medway Estuary Sheerness
2.45 mm yr−1 12.2 Swale athe highest rate as estimated by Woodworth et al. (2009); bCalculated by the average of the trends for Tilbury (located west of the area) and Sheerness (located east of the area).
Exposure to waves. Intertidal habitats such as saltmarshes and mudflats develop in sheltered
environments where fine sediments are allowed to settle. The impact of storms and/or increased wave
energy can cause erosion on the edges of saltmarshes. Wave impact is considered to be the main
mechanism causing saltmarsh loss in the Thames estuary (Thames Estuary Partnership 2005). The
level of exposure is determined qualitatively as follows: intertidal habitats along open coasts exposed
to storm waves are assigned the highest value (=1); sheltered environments not exposed to waves are
assigned the lowest value (=0); intermediate values are assigned based on the percentage of area
which is more or less exposed to waves. Both Portsmouth and Langstone harbours are sheltered from
swell waves due to the protective effect of the Isle of Wight and from wind waves due to interaction
- 315 -

SECOA, Vol. 6. Environmental Stresses and Resource Use in Coastal Urban and Peri-Urban Regions
with tidal currents at the narrow harbour entrances and local refraction at the ebb shoals (SCOPAC
2004). Modelling studies calculate that the mean wave height at the entrance of Portsmouth Harbour
is 0.48 m (HR Wallingford 1995) and the maximum significant wave height is 0.8 m, increasing to 1.04
m for a 1 in 200 year recurrence (Halcrow Maritime 2000). Inside the harbour, ship-generated waves
are normally less than 0.40 m high (SCOPAC 2004), but may cause erosion in intertidal habitats due
to the intense vessel traffic. At the entrance of Langstone Harbour, significant wave height is
estimated to be 2.1 m, increasing to 2.58 m for a 1 in 100 year recurrence (SCOPAC 2004). According
to wave data collected at a water depth of 10.2 m CD off the coast of Hayling Island (50°43.9936'N;
00°57.5557'W) between 2003 and 201012, the dominant wave direction is from the south, with
secondary direction from SSE in the autumn and winter and from SSW in the summer. Waves
generally approach the Thames estuary from the north-northeast direction (Halcrow 2010) with high
energy waves approaching from the northeast (Essex and South Suffolk Shoreline Management Plan
2010), but the wave impact is reduced due to the interaction with the complex system of sand banks
in the outer estuary. Wave action is more important in the outer reaches of the Medway and Swale
estuaries, and decreases into the estuary (Halcrow 2010). Limited information is available on
measurement of waves inside the Thames estuary but some studies indicate that wave heights in the
Medway are usually lower than 1 m and extreme waves do not exceed 2 m (CHaMP 2002). Erosion
is observed in the coastline of Southend (Essex and South Suffolk Shoreline Management Plan 2010).
All six conservation areas are somewhat protected from direct wave attack. Although wave heights
at the entrance of Portsmouth and Langstone harbours tend to be higher than waves reaching the
Thames estuary, wave action inside the harbours is reduced. Although higher waves are observed at
the entrance of Langstone Harbour, Portsmouth Harbour is more affected by boat wake. Potentially,
higher wave energy may reach Benfleet and Southend Marshes (as these are exposed to the waves
approaching from east and southeast, and coastal erosion is observed). Therefore, this SSSI was
assigned the highest level of exposure of the six areas (0.6). The Swale and the Medway are located
closer to the outer estuary and, although protected by the Isle of Sheppey and Isle of Grain, they have
some frontage exposed to the waves from the east and northeast. Swale and Medway were assigned
values of wave exposure of 0.5 and 0.4, respectively. The South Thames Estuary and Marshes has its
eastern edge subjected to wave exposure similar to Benfleet Marshes; however, most of its area is
subjected to lower wave action. It is considered here that the South Thames Estuary has a wave
12 Channel Coast Observatory, http://www.channelcoast.org/data_management/real_time_data/charts/? chart=71&tab=stats&disp_option=.
- 316 -

L. S. Esteves, et al., DPSIR Framework for Case Studies in Portsmouth and Thames Gateway, U.K.
exposure value similar to the Medway, while Portsmouth Harbour and Langstone Harbour are
considered relatively more sheltered (value of 0.3).
Loss of saltmarsh areas. Saltmarshes are important intertidal habitats that support biodiversity
and provide essential ecosystem services. Reduction in the area of saltmarshes occurs as a
response to natural processes (e.g. erosion, inundation, climatic variability) and human activities
(e.g. land reclamation, pollution, introduction of exotic species, dredging). In the Thames estuary,
wave impact is considered to have caused most of saltmarsh loss since 1970 (Thames Estuary
Partnership 2005), although many continued to accrete vertically despite relative sea-level rise
(van der Wall and Pye 2004). Historically, saltmarsh areas have been greatly reduced (Figure 8.13)
due to the impact of human activities and only a fraction of the original habitat remains. The
analysis of aerial photographs has indicated a rapid erosion of salt marshes in both Portsmouth
and Langstone harbours between 1946 and 2005 (Cope and Gorczynska 2007). Land reclamation
contributed to saltmarsh loss in Portsmouth Harbour, especially in the period between 1971 and
1984, when approximately 2.5 km2 of intertidal area was reclaimed (based on data obtained from
the Channel Coastal Observatory). From 1946 to 2002, more than 83% of salmarsh areas have been
lost in both Portsmouth and Langstone harbours (Cope et al. 2008). Saltmarsh loss has reduced
greatly in last few decades, mainly as a result from environmental policies and statutory
conservation status. To allow relative comparison between the SSSIs in the two study areas,
indicators values are based on data illustrating saltmarsh loss from early 1970s to mid-late 1980s
are used here. For the area of Portsmouth, saltmarsh losses were measured between 1971 and
1984; for the Thames Gateway losses were measured between 1973 and 1988.
Figure 8.13. Reduction in saltmarsh area in study areas. Data for Portsmouth and Langstone Harbours were obtained from the Channel Coastal Observatory, for the other areas from English Nature (1997).
- 317 -

SECOA, Vol. 6. Environmental Stresses and Resource Use in Coastal Urban and Peri-Urban Regions
Bird count. Figure 8.14 shows the total bird count in the conservation areas. Note that for the
purpose of bird count areas, Thames estuary comprises also the Benfleet and Southend Marshes,
therefore the same data are used to represent both areas in the calculation of the indicators. All
areas have shown a decrease in bird count between 1992 and 2008, except Portsmouth Harbour,
which showed a 32% increase. Variability in the bird count between 1992 and 2008 is high, with
maximum changes ranging from 43% to 68% of total numbers. Changes observed between
consecutive years are also high, especially for Portsmouth Harbour, where bird count can differ
up to 94%. Therefore, indicator values are very sensitive to the time interval considered in the
assessment. Downward trends could be inter-annual variations not linked to changes in
environmental quality. Alternatively, peaks and troughs for 2005-2008 for the
Thames/Medway/Swale areas could be partially due to inter-area movement between years, with,
for example, the Thames Estuary in 2006 being more favoured than both Swale and Medway.
Figure 8.14. Total bird count in the study areas (Data from the British Trust for Ornithology).
State of conservation of designated SSSI according to Natural England assessment. Natural
England is the organisation responsible for managing the statutory conservation areas.
Assessments are conducted regularly to evaluate the environmental conditions that support the
criteria set for the maintenance of designations. Therefore, the assessment considers aspects
related to environmental quality, biodiversity, existing pressures, implemented management
measures and observed trends, which gives an indication of the overall state of conservation.
Natural England classifies the SSSI sub- units into five classes: destroyed, unfavourable declining,
- 318 -

L. S. Esteves, et al., DPSIR Framework for Case Studies in Portsmouth and Thames Gateway, U.K.
unfavourable no change, unfavourable recovering, favourable. Table 8.7 shows the percentage of
the total SSSI area classified under each category. Clearly, Swale shows the most favourable
conditions, while the Medway shows the least areas in favourable conditions. Indicator values
are estimated based on the sum of the areas not meeting the target (i.e. unfavourable no change,
unfavourable declining and destroyed). Therefore, Benfleet is the SSSI with larger percentage of
‘unfavourable’ areas.
Table 8.7. Percentage of total area under each category of state of conservation.
SSSI Favourable Unfavourable recovering
Unfavourable no change
Unfavourable
Declining
Destroyed
Portsmouth Harbour 27.4 72.6 - 0.0 -
Langstone Harbour 24.4 75.6 - - -
Benfleet and Southend
Marshes
78.0 14.2 - 7.7 -
South Thames Estuary 95.3 2.4 0.6 1.8 -
Medway Estuary 0.5 98.8 0.7 - 0.5
Swale 100 - - - -
Mapping of critical areas in unsustainable use
None of the areas in this assessment are considered to be currently in unsustainable use as there
is evidence that environmental quality is improving due to adequate management measures.
However, it is important to emphasise that, in the past, human activities have contributed to the
significant reduction in the area of saltmarshes and only a fraction of the original areas remain.
Additionally, in the future, it is possible that the impacts of climate change, especially sea-level
rise, might result in further reduction in the area and/or quality of intertidal habitats.
Management Status of the Environment and Resources
The intertidal environments assessed here are statutory conservation areas being managed by
Natural England, private owners (i.e. the Ministry of Defence) and in collaboration with other
relevant organisations. Policy responses have contributed to reduce the environmental
degradation experienced during most of the 20th century and now regulate potentially impacting
activities and control intensity of uses. Regular assessment of the environmental conditions of
statutory protected areas conducted by Natural England focus on maintaining and/or improving
the quality of the habitats following the targets set by the UK Biodiversity Action Plan. Examples
of the types of management needed to maintain SSSI include: introducing grazing animals at
- 319 -

SECOA, Vol. 6. Environmental Stresses and Resource Use in Coastal Urban and Peri-Urban Regions
particular times of year; controlling water levels; clearing scrub; removing invasive species etc.
Coastal squeeze seems to be the main threat causing the decline of intertidal habitats and
increasing conflict between environmental conservation and flood risk management.
Management realignment is a preferred management option at some sites, but the need to
maintain flood protection to developed areas might result in the continued loss of intertidal
habitats. In these cases, compensatory habitat recreation is usually required; however, suitable
locations are scarce and not always available locally. Planning permissions have been the cause
of the destruction of some SSSI areas, such as the infilling of a coastal lagoon for the construction
of a car park in the Sheerness Docks (Medway Estuary and Marshes). Statutory conservation and
the provision of legal instruments to regulate and control uses have been paramount for reducing
loss of habitat and species biodiversity.
5. Conclusions
Protective legislation has reduced many of the direct human pressures on coastal habitats,
especially since the 1990s. Although human activities affecting the conservation of intertidal
habitats are now well regulated, coastal squeeze remains as the main threat to the future
sustainability of these ecosystems. Habitat and biodiversity loss affect the delivery of ecosystem
services, causing environmental and economic impacts that cannot always be adequately
measured. In addition to rising sea levels, population growth and economic changes are the main
drivers of environmental change. Eight selected indicators were used to calculate an index of
sustainability for the intertidal habitats within statutory conservation areas in Portsmouth and
the Thames Gateway: population growth, growth in the number of industries, increase in urban
areas, sea-level rise, wave exposure, loss of saltmarshes, bird count and the area of SSSI in
unfavourable conditions. Six conservation areas were analysed: Portsmouth and Langstone
Harbours in the area of Portsmouth and Benfleet Marshes, South Thames Estuary, Medway
Estuary and the Swale in the Thames Gateway. Based on the reduction of a number of pressures
and impacts observed in recent decades and the improvement of overall environmental quality,
all areas are considered to be in sustainable use. The ranking in decreasing order of combined
pressure is: Medway, Langstone Harbour, Portsmouth Harbour, South Thames Estuary, Benfleet
Marshes and the Swale. This ranking indicates the areas which were subjected to the highest
absolute changes based on the selected indicators.
The rankings provide only a qualitative comparison on the level of pressure resulting
from the selected indicators, which could be estimated using a variety of methods. Furthermore,
- 320 -

L. S. Esteves, et al., DPSIR Framework for Case Studies in Portsmouth and Thames Gateway, U.K.
some of the indicators reflect a direct impact on the conservation of intertidal habitats, such as
the loss of saltmarshes. Other indicators have an indirect impact on coastal habitats that are
difficult to quantify and are variable in space and time (e.g. the number of industries). Similarly,
some biodiversity indicators, such as bird counts, fluctuate through time due to factors that are
not intrinsic to the areas being evaluated. Therefore, assumptions that reduction in bird count
results from local environmental degradation are not necessarily correct. A further complicating
factor results from the complex interactions between the indicators. For example, saltmarsh
decline might result in mudflat increase (i.e. saltmarsh has eroded and transformed into mudflat),
which could create greater feeding areas for birds and potentially lead to increases in bird
numbers. In this example, an increase in bird count could result from degradation of saltmarshes,
which is opposed to the assumptions made in the index calculation (i.e. that an increase in bird
count reflects improved environmental conditions).
6. References
Berry, P.; Hopkins, J.; Sajwaj, T.; Austen, M.; Jones, L. and Burnett, E. 2011. Chapter 17: Status and
changes in the UK’s ecosystems and their services to society: a synthesis for England (final
draft). UK National Ecosystem Assessment: Technical Report. 163p.
Cave, R.R.; Ledoux, L.; Turner, R.K.; Jickells, T.; Andrews, J.E.; Davies, H. 2003. The Humber
catchment and its coastal area: from UK to European perspectives. The Science of the Total
Environment, 314- 316, 31-52.
CHaMP 2002. North Kent Coastal Habitat Management Plan. Final Report 2002.
Cope, S.N., Bradbury, A.P. and Gorczynska, M. 2008. Solent Dynamic Coast Project: Main report.
A tool for SMP2. Channel Coastal Observatory TR 10, 405p.
Cope, S. and Gorczynska, M. 2007. Aerial photography report, Portsmouth Harbour
2007.Southeast Strategic Regional Coastal Monitoring Programme TR 12, 13p.
DCLG (Department for Communities and Local Government) 2006. The State of the Gateway: a
baseline for evaluating the Thames Gateway programme, 151p.
English Nature 1997. Greater Thames Estuary Coastal Natural Area Profile NA 67.
Essex and South Suffolk Shoreline Management Plan 2010. Non-technical summary of draft SMP
– March 2010, 32p.
- 321 -

SECOA, Vol. 6. Environmental Stresses and Resource Use in Coastal Urban and Peri-Urban Regions
Halcrow 2010. Medway Estuary and Swale Shoreline Management Plan, Appendix C: Baseline
Estuary Processes, 128p. plus annexes. Available from: http://www.secoastalgroup.
org.uk/assets/SMP%20Isle%20of%20Grain%20to%20South%20Foreland/MEDWAYSWA
LE%20SMP%20FINAL/docs/html/frameset.htm.
HALCROW MARITIME 2000 Portsea Island Coastal Strategy Study, Stage 1, Scoping Study, 2
volumes, Report to Portsmouth City Council, Vol. 1: 136pp; Vol. 2: no pagination.
Hansom, J.D. 2010. Coastal steepening around the coast of Scotland: the implication of sea level
changes. Scottish Natural Heritage Commissioned Report Series, Edinburgh.
HR WALLINGFORD 1995 Pagham Harbour to River Hamble (Coastal) Strategy Study, Volume
1: Pagham Harbour to Portsmouth Harbour, Report EX 3121, Report to Pagham to Hamble
Coast Strategy Group (Lead Authority: Chichester District Council), 134pp, 145 tables and
figures.
Jenkins, G.; Perry, M. and Prior, J. 2009. Climate of the UK and recent trends, Revised edition.
Met Office Hadley Centre UK Climate Projections, ISBN 978-1-906360-05-4. Available
from: http://ukclimateprojections.defra.gov.uk/content/view/816/500/. Accessed on 16
September 2010.
JNCC (Joint Nature Conservation Committee) 2008. The UK Biodiversity Action Plan: Highlights
from the 2008 reporting round. 32p. Available from: http://www.jncc.gov.uk/pdf/
pub2010UKBAPHighlightsReport2008.pdf . Accessed on 7 January 2014.
Jones, L.; Angus, S.; Cooper, A.; Doody, P.; Everard, M.; Garbutt, A.; Gilchrist, P.; Hansom, J.;
Nicholls, R.; Pye, K.;Ravenscroft, N.;Rees, S.;Rhind,P. and Whitehouse, A. 2011. Chapter
11: Coastal Margins(final draft). UK National Ecosystem Assessment: Technical Report.
47p.
Lawrence, D. and Isted, J. 2008. Chapter 21: England & Wales. In: Global Legal Group Ltd,
The International Comparative Legal Guide to Environmental Law: 2008, p. 146-158.
Available from: http://www.freshfields.com/publications/pdfs/2008/may08/ENV08_
Chapter_21_England_Wales.pdf. Accessed on 22 October 2010.
MetOffice 2010. Southern England: climate. Available from: http://www.metoffice.gov.uk/
climate/uk/so/. Accessed on 09/09/2010.
- 322 -

L. S. Esteves, et al., DPSIR Framework for Case Studies in Portsmouth and Thames Gateway, U.K.
Millennium Ecosystem Assessment 2005.Chapter 19 – Coastal Systems.World Resources
Institute, Washington, DC, Island Press. Available from: http://www.maweb.org/
documents/document.288.aspx.pdf. Accessed on 13 May 2011.
Natural England 2010. Green Belts: a greener future, Natural England and the Campaign to
Protect Rural England NE196. Available from: http://naturalengland.etraderstores.com
/NaturalEnglandShop/ne196. Accessed on 12 April 2011.
Natural England 2011. Protecting England’s natural treasures: Sites of Special Scientific Interest.
Report NE306, 39p. Available from: http://naturalengland.etraderstores.com/
NaturalEnglandShop/ne306. Accessed on 12 April 2011.
ODPM (Office of the Deputy Prime Minister) 2005a.Planning Policy Statement 9: Biodiversity and
Geological Conservation. Her Majesty’s Stationery Office, 9p. Available from:
http://www.communities.gov.uk/documents/planningandbuilding/pdf/147408.pdf.
ODPM (Office of the Deputy Prime Minister) 2005b. Government Circular: Biodiversity and
Geological Conservation – Statutory Obligations and their Impact within the Planning
System. Her Majesty’s Stationery Office, 88p. Available from: http://www.communities.
gov.uk/documents/planningandbuilding/pdf/147570.pdf.
Ramsar Convention on Wetlands 2009. What are the Criteria for Identifying Wetlands of
International Importance? http://www.ramsar.org/cda/en/ramsar-about-faqs-what-are-
criteria/main/ramsar/1-36-37%5E7726_4000_0.
SCOPAC 2004. Portsmouth, Langstone and Chichester Harbours. Available from:
http://www.scopac.org.uk/scopac_sedimentdb/hbrs/hbrs.htm#intro.
Thames Estuary Partnership 2005. State of the Thames Estuary report, consultation draft (phase
I), December 2005, 155pp. Available from: http://212.67.202.196/~teprep/dev/
documents/uploaded/document/Draft%20State%20of%20the%20Estuary%20Report.pdf.
Accessed on 01/10/2010.
Turner, R.K.; Hadley, D.; Luisetti, T; Lam, V.W.Y. and Cheung, W.W.L. 2010. An Introduction to
Socio- economic assessment within a marine strategy framework. Defra, London.
Available from: http://archive.defra.gov.uk/environment/marine/documents/legislation/
msf-socioeconomic.pdf.
Turner, R. K., Lorenzoni, I., Beaumont, N., Bateman, I. J., Langford, I. H. and McDonald, A. L.
1998.
- 323 -

SECOA, Vol. 6. Environmental Stresses and Resource Use in Coastal Urban and Peri-Urban Regions
Coastal management for sustainable development: analysing environmental and socio-economic
changes on the UK coast. The Geographical Journal, 164(3), 269-281.
UE Associates Ltd. 011. Habitats Regulations Assessment for the Portsmouth Core Strategy.
Regulation 27 Stage, February 2011. Report No. UE-0046_PCC_AA_10_280211NP. Available
from: http://www.portsmouth.gov.uk/media/HRA.pdf.
UKNEA (National Ecosystem Assessment) 2011.The UK National Ecosystem Assessment:
Synthesis of the KeyFindings. UNEP-WCMC, Cambridge, 86p.
Walton, J.K. 2000. The British Seaside: Holidays and Resorts in the Twentieth Century.
Manchester University Press, Manchester. 216p.
Watson, R. and Albon, S. 2010. UK National Ecosystem Assessment - Draft synthesis of current
status and recent trends. 28p.
Williams A.M. and Shaw, G. 2009. Future play: tourism, recreation and land use. Land Use Policy,
26S, S326–S335.
Woodworth, P.L.; Teferle, F.N.; Bingley, R.M.; Shennan, I. & Williams, S.D.P. 2009. Trends in UK
mean sea level revisited. Geophysical Journal International, 176, 19-30.
- 324 -

L. S. Esteves, et al., DPSIR Framework for Case Studies in Portsmouth and Thames Gateway, U.K.
ANNEX
1. Methodology on indexes
The index of sustainability (IS) is calculated by:
…………..1
Sensitivity tests were conducted by assigning different weights to the indicators and
results showed high variability in the resulting IS. Therefore, it was considered that the
methodology would not warrant the use of IS values as an absolute scale to measure pressure
intensity in each area. As a consequence, the arbitrary use of a threshold value to determine
‘unsustainable use’ becomes meaningless. IS values resulting from 27 selected tests are used here
to provide a comparative ranking of the six areas, which indicates the areas under higher or lower
pressure levels without actually quantifying them. The ranking (Ranki) was estimated for 27
sensitivity tests by assigning value 1 to the area showing highest IS value (i.e. decreasing level of
pressure). The final ranking RankIS was then obtained by calculating the mean (ISrank) of the 27
Ranki values:
…………..2
Additionally, to provide a relative comparison between the pressure levels at the six areas,
a Relative Index of Sustainability (RIS) was estimated. The RIS was calculated by considering the
highest value of each indicator as 100% and the other values as a proportion of the maximum
value. The RIS then indicates the levels of pressure of each area in comparison to the maximum
pressure observed between the six areas. As for the SI, tests of sensitivity were conducted and the
respective RIS values were used to provide a comparative ranking. The same method as described
above was applied and the final ranking was obtained by calculating the mean rank value (RISrank)
from 27 tests.
2. Sustainability of natural resources in the study area
Taking into account that: the DPSIR analysis here focuses on statutory conservation areas; most
pressures show evidence of alleviating; and management measures are generally in place to
maintain and/or improve the current state of conservation, all six SSSI areas are considered to
- 325 -

SECOA, Vol. 6. Environmental Stresses and Resource Use in Coastal Urban and Peri-Urban Regions
have sustainable use. Therefore, here the application of indicators to calculate an index of
sustainability will only provide a relative comparison of the level of pressure and impact affecting
each area. Furthermore, due to limitations of the method, there is no confidence that the index
values can be used to quantify the absolute difference in the level of pressure/impact between the
areas. Index values are used here only to rank the SSSI areas from the most to the least pressured
based on current trends of selected indicators.
Indicators and trends
State of conservation of designated SSSI
Table 8.8 shows the values estimated for each indicator used in the calculation of the
sustainability indexes SI and RSI. Higher values indicate higher pressure. The highest values for
each indicator are shown in red and the lowest values are highlighted in blue. Some indicators
show a large variability between the six areas (e.g. bird count and saltmarsh loss), while others
show a much narrower range of values (e.g. population and number of industries growth). It is
clear that although there is no one area receiving highest pressure from most indicators (red
values), Langstone Harbour and Benfleet show the lowest values (in blue) for three of the
indicators.
Table 8.8. Indicator values used in the calculation of the sustainable index
Indicator Portsmouth
Harbour Langstone Harbour
Benfleet Thames Estuary
Medway Swale
Population growth (%) 5.99 4.90 2.88 7.23 7.20 15.72
Growth in number of industries (%) 12.19 17.26 5.25 9.20 10.06 9.60
Increase in urban area (%) 0.36 0.18 0.84 0.45 0.46 1.25
Relative rise in sea level (cm) 10.1 10.1 7.5 13.7 12.2 12.2
Exposure to waves 0.3 0.3 0.6 0.4 0.4 0.5
Loss of saltmarsh area (%) 78.5 10 28.5 22.5 23.5 0.9
Decline in bird count (%) -32.42 53.46 1.18 1.18 44.53 7.72
Unfavourable state of conservation (%) 0.03 0 7.74 2.38 1.16 0
- 326 -

L. S. Esteves, et al., DPSIR Framework for Case Studies in Portsmouth and Thames Gateway, U.K.
Sustainability of natural resources
It is considered here that currently, all areas have adequate management and implemented
measures that will support their sustainability in the short and medium term. Environmental and
planning policies have reduced considerably the pressures currently affecting the conservation
of intertidal habitats in comparison with past conditions. Therefore, the IS should be interpreted
only as a relative comparison between the ongoing pressures on the conservation of designated
intertidal habitats. The indicator values shown in Table 8.8 and the weights assigned to the
indicators based on expert judgement (Table 8.9) were used to estimate IS and RIS. However,
tests to assess the sensitivity of the method showed high variability in the results. Appendix C
and D show the estimated IS and RIS values, respectively, for each SSSI for the 27 selected tests.
Higher IS values indicate areas subjected to higher pressure levels (i.e. likely to negatively affect
the conservation state of intertidal habitats). IS and RIS values were then used to rank the SSSI
areas in decreasing order of pressure (rank = 1 indicates highest pressure level) and the mean
rank values were used to provide the final ISrank and RISrank for the six areas (Table 8.9). The ISrank
order indicates that the Medway is the area under highest combined pressure, despite the fact it
is not subjected to the highest pressure from any single indicator (see Table 8.8). The Swale,
despite the largest increase in population and urban area, shows the lowest combined pressure.
However, the RISrank order is considerably different: the Swale shows the highest relative pressure
and Porstmouth Harbour the lowest. While the ISrank indicates the changes observed from
absolute measurements; the RISrank reflects the relative intensity of changes compared between
the six areas.
Table 8.9. Mean rank values and final rank based on the Index of Sustainability (ISrank) and the Relative
Index of Sustainability (RISrank).
Portsmouth Harbour
Langstone Harbour
Benfleet Thames Estuary
Medway Swale
Mean rank 3.1 2.0 4.8 4.1 1.5 5.5
ISRank 3 2 5 4 1 6
Mean rank 5.7 4.0 3.1 4.6 2.2 1.5
RISRank 6 4 3 5 2 1
- 327 -

SECOA, Vol. 6. Environmental Stresses and Resource Use in Coastal Urban and Peri-Urban Regions
3. Conclusions
Protective legislation has reduced many of the direct human pressures on coastal habitats,
especially since the 1990s. Although human activities affecting the conservation of intertidal
habitats are now well regulated, coastal squeeze remains as the main threat to the future
sustainability of these ecosystems. Habitat and biodiversity loss affect the delivery of ecosystem
services, causing environmental and economic impacts that cannot always be adequately
measured. In addition to rising sea levels, population growth and economic changes are the main
drivers of environmental change. Eight selected indicators were used to calculate an index of
sustainability for the intertidal habitats within statutory conservation areas in Portsmouth and
the Thames Gateway: population growth, growth in the number of industries, increase in urban
areas, sea-level rise, wave exposure, loss of saltmarshes, bird count and the area of SSSI in
unfavourable conditions. Six conservation areas were analysed: Portsmouth and Langstone
Harbours in the area of Portsmouth and Benfleet Marshes, South Thames Estuary, Medway
Estuary and the Swale in the Thames Gateway. Based on the reduction of a number of pressures
and impacts observed in recent decades and the improvement of overall environmental quality,
all areas are considered to be in sustainable use. Therefore, the index of sustainability is used here
only to provide a qualitative measure of impact/pressure over the six conservation areas in recent
times, which is given in the form of a ranking. The ranking in decreasing order of combined
pressure is: Medway, Langstone Harbour, Portsmouth Harbour, South Thames Estuary, Benfleet
Marshes and the Swale. This ranking indicates the areas which were subjected to the highest
absolute changes based on the selected indicators. However, when a relative index is estimated
based on proportions of the maximum values for each indicator, the ranking is considerably
different. The ranking based on a relative index is: the Swale, Medway, Benfleet, Langstone
Harbour, Thames Estuary and Portsmouth Harbour.
These findings should be considered with caution as the index values and respective
ranking are highly dependent on the indicators used and their relative weights.
- 328 -
L. S. Esteves, et al., DPSIR Framework for Case Studies in Portsmouth and Thames Gateway, U.K.
APPENDIX A: REASONS FOR NOTIFICATION OF DESIGNATIONS
IN THE TWO STUDY AREAS
1. Langstone Harbour SSSI
(http://www.sssi.naturalengland.org.uk/citation/citation_photo/1001182.pdf)
Area: 2,069.4 ha
Date Notified (Under 1949 Act): 1958; Date Notified (Under 1981 Act): 1985
Reasons for Notification:
Langstone Harbour comprises one of the largest areas of mixed saltmarsh on the south coast of England, with an extensive deteriorating cord-grass Spartina anglica marsh. The Zostera angustifolia and Z.noltii beds are among the largest in Britain. The intertidal system is among the twenty most important in Britain as a summer and autumn assembly ground for waders during the moult and post- moult. Dunlin Calidris alpina often exceed 30,000 individuals, or 6% of the British winter population, or 3% of the European and North African wintering population. Grey plover Pluvialis squatarola and black- tailed godwit Limosa limosa achieve numbers which represent 1–2% of the European and North African migration flyway population; and redshank Tringa totanus and ringed plover Charadrius hiaticula do so periodically. At times as many as 20% of the black-tailed godwit, 8% of the ringed plover and 8-10% of the grey plover wintering in Britain are present in the harbour. The total numbers of waders present sometimes exceeds 40,000. In the 1970s and 1980s Langstone Harbour alone has consistently supported in excess of 5,000 wintering dark-bellied geese Branta bernicla, or 5-10% of the world population depending on fluctuating population levels. It has supported up to 2.5% of the European winter population of shelduck Tadorna tadorna and regularly supports substantial numbers of other ducks in autumn and winter.
Farlington Marshes intrudes into the northwest sector of the harbour. Its vegetation is strongly influenced by drainage water from the chalk and by brackish water infiltration. The marshes embrace a variety of habitats – brackish marsh, fresh marsh, a large lagoon with associated reed Phragmites beds, Agrostis stolonifera grassland and scrub. It is a vital high water wader roost for the Harbour and a major feeding ground for Brent geese after the Zostera beds in the Harbour have been consumed. Few comparable sites have survived agricultural improvement on the south and east coasts of England, where the habitat was formerly common: the grassland flora is especially rich for reclaimed silt, and includes over 50 species of grasses.
- 329 -

SECOA, Vol. 6. Environmental Stresses and Resource Use in Coastal Urban and Peri-Urban Regions
2. Portsmouth Harbour SSSI
(http://www.sssi.naturalengland.org.uk/citation/citation_photo/1003174.pdf)
Area: 1,266.09 ha
Date Notified (Under 1949 Act): 1974; Date Notified (Under 1981 Act): 1985; Date of Last
Revision: 29 October 1992 (confirmed 22 July 1993) - extended to include intertidal areas at Brick
Kiln, Forton, Haslar and Tipner Lakes.
Reasons for Notification:
The biological richness and productivity of Portsmouth Harbour is reflected in the numbers of
wetland birds, particularly waders and wildfowl, of which total numbers can exceeded 20,000 at
times. Portsmouth Harbour is of national importance for the numbers of three species of waders
(grey plover, black-tailed godwit and dunlin) it supports and for the overwintering dark-bellied
Brent geese. The intertidal area of Portsmouth Harbour includes 776 ha of mudflats and about
173 ha of cord-grass Spartina marshes. The mudflats support a total fauna of about 60 species of
benthic marine animals, of which about ten occur in very large numbers. The mud surfaces
support extensive beds of eelgrasses Zostera noltii and Z.angustifolia and extensive areas of the
mudflats support a high density of green algae, mainly Enteromorpha species and Ulva lactuca in
summer. The eelgrasses and algae are mutually exclusive in distribution on the mudflats. The
eelgrass beds are among the most extensive in Britain and Portsmouth Harbour is one of only
four intertidal areas on the south coast to support extensive eelgrass beds. The beds have a rich
associated benthic and epiphytic fauna and algal fauna and the eelgrass itself is an important food
of the Brent goose. The cord-grass marshes occur on mudflats in the upper part of the tidal range
and are dominated by Spartina anglica. Since the late 19th century, Spartina anglica has colonised
the accreted mud platforms, which are dissected by ramifying systems of drainage creeks.
However, the plants are dying back and the muddy platforms are eroding and slumping back to
a profile similar to the former mudflat. At the uppermost levels Spartina is replaced locally by
saltmarsh dominated by sea purslane Halimione portulacoides. The nationally scarce golden
samphire Inula crithmoides occurs at the upper limits of sea purslane marsh and at the toe of some
sea walls. The SSSI includes two brackish lagoons adjoining Haslar Lake, but they are located
outside Portsmouth City Council boundary.
- 330 -

L. S. Esteves, et al., DPSIR Framework for Case Studies in Portsmouth and Thames Gateway, U.K.
3. Benfleet and Southend Marshes SSSI
(http://www.sssi.naturalengland.org.uk/citation/citation_photo/1004414.pdf)
Area: 2,099.69 ha
Date Notified (Under 1949 Act): 1955; Date Notified (Under 1981 Act): 1987
Reasons for Notification:
Benfleet and Southend Marshes comprise an extensive series of saltmarshes, mudflats, scrub and
grassland which support a diverse flora and fauna. The south-facing slopes of the downs,
composed of London Clay capped by sand, represent the line of former river cliffs with several
re-entrant valleys. At their foot lies reclaimed marshland, with its associated dyke system, based
on alluvium. Outside the seawalls there are extensive saltmarshes and mudflats, on which
wintering wildfowl and waders reach both nationally (i.e. dunlin, redshank and ringed plover)
and internationally (i.e. dark-bellied brent goose, grey plover and knot) important numbers.
Nationally uncommon plants occur in all of the habitats and parts of the area are of outstanding
importance for scarce invertebrates. The mudflats are colonised by eelgrasses Zostera marina and
Z.noltii which, together with dense patches of Enteromorpha and, together with the rich
invertebrate fauna, provide food for thousands of birds which overwinter on this shoreline. A
survey of Southend Flat during the winter of 1985/86 suggests that, in addition to nationally
important populations of the species already mentioned, this area alone supports nationally
important numbers of bar-tailed godwit and oyster-catcher, whilst redshank reach levels of
international importance. The saltmarsh has a high marsh flora of sea purslane Halimione
portulacoides and common sea-lavender Limonium vulgare, together with sea arrow-grass
Triglochin maritima, common saltmarsh-grass Puccinellia maritima, sea aster Aster tripolium and the
scarce lax flowered sea-lavender Limonium humile. The lower areas and creek edges are noted for
their diversity of glassworts Salicornia spp., including perennial glasswort S. perennis. Golden
samphire Inula crithmoides occurs on the highest parts of the marsh, beneath the sea walls, whilst
small cord-grass Spartina maritimas found on the lowest areas.
The uncommon bithynian vetch Vicia bithynica occurs in the grassland of the downs,
together with hartwort Tordylium maximum, at its only British station, hairy vetchling Lathyrus
hirsutus and slender tare Viciate nuissima. The reclaimed marsh is grazed by cattle and horses. It
is dominated by grasses such as meadow foxtail Alopecurus pratensis and perennial rye-grass
Lolium perenne, and sea clover Trifolium squamosum, strawberry clover T.fragiferum and hairy
buttercup Ranunculus sardous are also present. Uncommon species occur in the dykes, including:
- 331 -

SECOA, Vol. 6. Environmental Stresses and Resource Use in Coastal Urban and Peri-Urban Regions
C. submersum, beaked tassel weed Ruppia maritime, brackish water-crowfoot Ranunculus baudotii
and emerald damselfly Lestes dryas. This combination of scrub, grassland and open water with
vegetated margins provides a habitat for many scarce and notable insects, such as the white-letter
hairstreak Strymonidia w-album and marbled white Melanargia galathea butterflies, the latter
occurring in Essex only along the Thames. Additional interest is provided by the diverse breeding
bird community, including yellow wagtails.
4. South Thames Estuary and Marshes SSSI
(http://www.sssi.naturalengland.org.uk/citation/citation_photo/1003874.pdf)
Area: 5449.14 ha
Date Notified (Under 1949 Act): 1951, 1968; Date Notified (Under 1981 Act): 1984; Date of Last
Revision: 1991.
Reasons for Notification:
The site consists of an extensive mosaic of grazing marsh, saltmarsh, mudflats and shingle
characteristic of the estuarine habitats of the north Kent marshes. The saltmarshes support
characteristic vegetation dominated by the saltmarsh grasses Puccinellia, the glassworts Salicornia,
sea aster Aster tripolium, sea lavender Limonium vulgare and sea purslane Halimione portulacoides,
with nationally scarce plants such as golden samphire Inula crithmoides and Puccinellia fasciculata.
The mudflats have beds of eelgrass including Zostera angustifolia and Z. noltii and the Allhallows
region of the site has areas of vegetated shingle with the nationally scarce sea kale Crambe maritime
present. Freshwater pools and some areas of woodland provide additional variety and
complement the estuarine habitats. The site supports outstanding numbers of waterfowl with
total counts regularly exceeding 20,000. The mudflats attract large numbers of feeding waders
and wildfowl with the site being regularly used by redshank Tringa totanus, knot Calidris canuta
and dunlin Calidris alpina in internationally important numbers. Avocet Recurvirostra avosetta and
ringed plover Charadrius hiaticula regularly exceed nationally important numbers. Species
regularly reaching nationally important numbers in winter include: European white-fronted
goose Anser albifrons spp albifrons, shelduck Tadorna tadorna, gadwall Anas strepera, teal Anas
crecca, pintail Anas acuta, shoveler Anas clypeata, grey plover Pluvialis squatarola, curlew Numenius
arquata and blacktailed godwit Limosa limosa. In addition, nationally important numbers of grey
plover, curlew, black-tailed godwit, redshank and greenshank Tringa nebularia occur during
autumn with redshank maintaining their nationally important numbers on spring passage.
- 332 -

L. S. Esteves, et al., DPSIR Framework for Case Studies in Portsmouth and Thames Gateway, U.K.
During the breeding season the south Thames marshes support an outstanding assemblage of
breeding birds including rare species such as garganey Anas querquedula, pintail, avocet and
bearded tit Panurus biarmicus. Specially protected birds found within the site include hen harrier
Circus cyaneus, short- eared owl Asio flammeus, ruff Philomachus pugnax, common tern Sterna
hirundo, avocet and golden plover Pluvialis apricaria.
5. Medway Estuary and Marshes SSSI
(http://www.sssi.naturalengland.org.uk/citation/citation_photo/1000244.pdf)
Area: 6840.14 ha
Date Notified (Under 1949 Act): 1968; Date Notified (Under 1981 Act): 1984; Date of Last
Revision:1992.
Reasons for Notification:
The Medway Estuary is believed to be the most important area in North Kent for wintering
wildfowl occurring in numbers of international significance (shelduck Tadorna tadorna, brent
goose Branta bernicla, grey plover Pluvialis squatarola, ringed plover Charadrius hiaticula, pintail
Anas acuta, dunlin Calidris alpina and redshank Tringa totanus). Present in nationally important
numbers are: turnstone Arenaria interpres, black-tailed godwit Limosa limosa, curlew Numenius
arquata, great crested grebe Podiceps cristatus, shoveler Anas clypeata, teal Anas crecca, wigeon Anas
penelope and white-fronted goose Anser albifrons. Passage migrants include ruff Philomachus
pugnax, whimbrel Numenius phaeopus and avocet Recurvirostra avosetta. Breeding species include
avocet, shelduck, shoveler, pochard Athyia ferina, mute swan Cygnus olor, tufted duck Athyia
fuligula, teal Anas crecca and gadwall Anas strepera. The saltmarsh serves as a roosting area for
waders at high tide and supporting breeding birds (redshank Tringa totanus, black headed gull
Larus ridibundus and common tern Sterna hirundo). Several scarce plant species include: golden
samphire Inula crithmoides, perennial glasswort Salicornia perennis and one-flowered glasswort
Salicornia pusilla. The estuary is one of the best places in Britain for the study of glassworts. The
grazing marsh has breeding and wintering birds of interest; the former include lapwing Vanellus
vanellus, redshank, pochard, mallard Anas platyrhynchos and gadwall, while in winter large flocks
of many wildfowl and wader species are present.
- 333 -

SECOA, Vol. 6. Environmental Stresses and Resource Use in Coastal Urban and Peri-Urban Regions
6. The Swale SSSI
(http://www.sssi.naturalengland.org.uk/citation/citation_photo/103678.pdf)
Area: 6568.45 ha
Date Notified (Under 1949 Act): 1968; Date Notified (Under 1981 Act): 1984; Date of Last
Revision:1990.
Reasons for Notification:
The habitats comprise chiefly mudflats, saltmarsh, and freshwater grazing marsh, the
latter being intersected by extensive dykes and fleets. The area is particularly notable for the
internationally important numbers of wintering and passage wildfowl and waders. Several
species regularly overwinter in numbers of international importance: wigeon Anas penelope, teal
Anas crecca and grey plover Pluvialis squatarola. Present in winter in nationally significant numbers
are: shoveler Anas clypeata, knot Caladris canutus, dunlin Caladris alpina and spotted redshank
Tringa erythropus. Many of the birds use more than one habitat, some for example feed on the
mudflats at low tide and then move up to roost on the saltmarsh or on fields inland of the sea
wall. The mudflats support over 350 species of invertebrates, some of which are not found
elsewhere in Britain (e.g. polychaete worm Clymenella torquata). The saltmarshes are among the
richest for plant life in Britain and include: the saltmarsh- grasses Puccinellia, the glassworts
Salicornia, sea aster Aster tripolium, sea lavender Limonium vulgare, sea purslane Halimione
portulacoides and common cord-grass Spartina anglica. The scarce small cord- grass Spartina
maritima and the rare golden samphire Inula crithmoides are also found. The grazing marsh
complexes and grassland habitats present a number of scarce and rare species.
- 334 -

L. S. Esteves, et al., DPSIR Framework for Case Studies in Portsmouth and Thames Gateway, U.K.
APPENDIX B
Table 8.10. Operations
likely to damage
the special interest at the SSSI in
the two study
areas.Ref.
Type of Operation
Lang
ston
e13
Port
smou
th14
Swal
e15
Tham
es E
stua
ries
and
M
arsh
esd
16
Med
way
Mar
shes
e17
Foul
ness
f18
Benf
leet
and
Sou
then
d M
arsh
esg1
9
1 Cultivation, including ploughing, rotovating, harrowing, and re-seeding.
2 Changes in the grazing regime (including type of stock, intensity or seasonal pattern of grazing and cessation of grazing).
3 Changes in stock feeding practice.
4 Changes in the mowing or cutting regime (including hay making to silage and cessation).
5 Application of manure, fertilisers and lime.
6 Application of pesticides, including herbicides (weedkillers).
7 Dumping, spreading or discharge of any materials.
8 Burning of vegetation.
9 The release into the site of any wild or feral animal or domestic pig or any plant or seed.
10 The killing or removal of any wild animal, including pest control.
11 The destruction, displacement, removal or cutting of any tree, shrub, hedge, turf or aquatic plant or alga.
12
The introduction of tree and/or woodland management, including afforestation, planting, clear and selective felling, thinning, coppicing, modification of the stand or underwood, changes in species composition, cessation of management.
13 http://www.sssi.naturalengland.org.uk/special/sssi/old/OLD1001182.pdf. 14 http://www.sssi.naturalengland.org.uk/special/sssi/old/OLD1003174.pdf. 15 http://www.sssi.naturalengland.org.uk/special/sssi/old/OLD1003678.pdf. 16 http://www.sssi.naturalengland.org.uk/special/sssi/old/OLD1003874.pdf. 17 http://www.sssi.naturalengland.org.uk/special/sssi/old/OLD1000244.pdf. 18 http://www.sssi.naturalengland.org.uk/special/sssi/old/OLD1002984.pdf. 19 http://www.sssi.naturalengland.org.uk/special/sssi/old/OLD1004414.pdf.
- 335 -

SECOA, Vol. 6. Environmental Stresses and Resource Use in Coastal Urban and Peri-Urban Regions
13a Drainage (including the use of mole, tile, tunnel or other artificial drains).
13b
Modification of the structure of tidal creeks and channels, streams, springs, ditches and drains, including their banks and beds, as by re-alignment, re-grading and dredging.
13c Management of aquatic and bank vegetation.
14
The changing of water levels and tables and water utilisation (including irrigation, storage and abstraction from existing water bodies and through boreholes).
15 Infilling of ditches, drains, ponds, pools or marshes.
16a The introduction of freshwater fishery production and/or management, including sporting fishing and angling.
16b
The introduction of new coastal fisheries or changes in coastal fishing practice or fisheries management and seafood or marine life collection, including the use of traps or fish cages.
17 Reclamation of land from sea, estuary or marsh.
18 Bait digging in intertidal areas.
19 Erection of sea defences or coast protection works, including cliff or landslip drainage or stabilisation measures.
20 Extraction of minerals, including peat, shingle, sand and gravel, topsoil, subsoil, shells and spoil.
21
Construction of roads, tracks, walls, fences, hardstands, banks, ditches or other earthworks, or the laying, maintenance or removal of pipelines and cables, above or below ground.
22 Storage of materials.
23 Erection of permanent or temporary structures, or the undertaking of engineering works, including drilling.
24 Clearance of boulders, large stones, loose rock and shingle, and re-grading of foreshores.
26 Use of vehicles or craft likely to damage or disturb vegetation or fauna.
27 Recreational or other activities likely to damage vegetation or fauna.
28 Changes in game and wildfowl management and hunting practice.
- 336 -

L. S. Esteves, et al., DPSIR Framework for Case Studies in Portsmouth and Thames Gateway, U.K.
APPENDIX C
Table 8.11. Index Of Sustainability (Si) Estimated For Each Area In 27 Tests Of Varying Weights.
Weights Ranking Portsmouth
Harbour Langstone Harbour
Benfleet Thames Estuary
Medway Swale
As in Table 8.2
original 22.00 15.79 12.14 13.52 18.76 11.71
all weights =1 9.38 12.03 6.81 7.13 12.44 5.99
Weight = 2
(all other indicators with weight = 1)
Population 10.13 12.64 7.17 8.03 13.34 7.95
Industries 10.91 14.18 7.47 8.28 13.70 7.19
Urban area 9.43 12.05 6.92 7.19 12.50 6.14
Sea level 10.64 13.29 7.75 8.84 13.96 7.51
Waves 9.42 12.06 6.89 7.18 12.49 6.05
Saltmarshes 19.19 13.28 10.37 9.94 15.38 6.10
Bird count 5.33 18.71 6.96 7.28 18.01 6.95
SSSI state 9.39 12.03 7.78 7.43 12.58 5.99
Population and Sea level 11.39 13.90 8.11 9.75 14.86 9.48
Population and Waves 10.17 12.68 7.25 8.08 13.39 8.01
Population and Saltmarshes 19.94 13.89 10.73 10.85 16.28 8.06
Population and Bird count 6.08 19.32 7.32 8.18 18.91 8.92
Population and SSSI state 10.13 12.64 8.14 8.33 13.48 7.95
Industries and Sea level 12.17 15.45 8.41 9.99 15.22 8.71
Industries and Waves 10.94 14.22 7.54 8.33 13.75 7.25
Industries and Saltmarshes 20.72 15.43 11.03 11.09 16.63 7.30
Industries and Bird count 6.85 20.87 7.62 8.43 19.26 8.15
Weight = 0
(all other indicators with weight = 1)
Population 8.63 11.41 7.42 6.52 11.68 4.02
Industries 7.86 9.87 7.12 6.28 11.33 4.79
Urban area 9.34 12.00 7.67 7.37 12.53 5.83
Sea level 8.12 10.76 6.84 5.72 11.06 4.46
Waves 9.35 11.99 7.70 7.38 12.53 5.92
Saltmarshes -0.43 10.78 4.22 4.62 9.65 5.87
Bird count 13.44 5.34 7.63 7.28 7.02 5.02
SSSI state 9.38 12.03 5.84 6.83 12.29 5.99
- 337 -

SECOA, Vol. 6. Environmental Stresses and Resource Use in Coastal Urban and Peri-Urban Regions
APPENDIX D
Table 8.12. Relative Index Of Sustainability (Ris) Estimated For Each Area In 27 Tests Of Varying Weights.
Weights Portsmouth
Harbour Langstone Harbour
Benfleet Thames Estuary
Medway Swale
As in Table 8.2
original 37.62 47.75 51.15 45.45 53.10 55.45
all weights =1 42.39 51.65 53.44 51.20 58.83 67.95
Weight = 2
(all other indicators
with weight = 1)
Population 46.45 60.25 54.95 52.11 60.39 62.40
Industries 41.22 49.55 59.55 49.95 57.70 67.95
Urban area 46.84 56.97 57.99 57.95 64.23 66.58
Sea level 43.87 54.00 63.65 53.78 61.44 65.87
Waves 50.12 49.35 55.69 49.03 56.84 55.59
Saltmarshes 30.04 60.25 51.43 45.72 63.51 57.25
Bird count 37.67 47.75 63.65 49.29 54.98 55.45
SSSI state 72.47 68.15 75.51 77.53 84.03 104.22
Population and Sea level 32.86 43.86 48.86 39.70 47.38 42.95
Population and Waves 28.80 35.25 47.35 38.78 45.82 48.50
Population and Saltmarshes 34.02 45.95 42.75 40.95 48.50 42.95
Population and Bird count 28.41 38.54 44.31 32.95 41.97 44.32
Population and SSSI state 31.37 41.50 38.65 37.11 44.77 45.03
Industries and Sea level 25.12 46.16 46.61 41.86 49.36 55.31
Industries and Waves 45.21 35.25 50.87 45.17 42.69 53.64
Industries and Saltmarshes 37.58 47.75 38.65 41.60 51.23 55.45
Industries and Bird count 51.60 60.87 60.28 63.70 69.96 79.08
Weight = 0
(all other indicators
with weight = 1)
Population 48.64 57.90 65.94 59.53 67.16 78.37
Industries 54.89 53.24 57.98 54.78 62.57 68.09
Urban area 34.81 64.15 53.72 51.47 69.24 69.75
Sea level 42.44 51.65 65.94 55.04 60.70 67.95
Waves 55.67 69.47 61.79 64.61 71.52 73.53
Saltmarshes 52.70 66.50 67.45 60.44 68.72 72.82
Bird count 58.95 61.85 59.49 55.69 64.13 62.54
SSSI state 38.87 72.75 55.23 52.39 70.80 64.21
- 338 -

CHAPTER 9.
Assessment of Natural Resources Use for
Sustainable Development - DPSIR Framework for
Case Studies in Hai Phong and Nha Trang,
Vietnam
Tran Dinh Lan, Do Thi Thu Huong and Cao Thi Thu Trang

SECOA, Vol. 6. Environmental Stresses and Resource Use in Coastal Urban and Peri-Urban Regions
1. Introduction
The DPSIR (Driver – Pressure – State – Impact – Response) framework basically from PSR
(Pressure - State - Response) model (OECD 1991) is nowadays widely applied in both
geographical and sectoral context, in particular for organizing systems of environmental
indicators (EEA 1995), natural resources and ecosystems (Kristensen 2004). The framework
assumes cause-effect relationships between interacting components of social, economic, and
environmental systems. It is nowadays obvious that not all issues or themes of a report need a
full DPSIR presentation. In many cases, some aggregation of DPSIR elements will only make them
easier to work with and understand. For different groups of themes in the report aggregation of
DPSIR elements is proposed: Driving force and Pressure, State and Impact, and Response. If the
proposed aggregation scheme needs to be adjusted for concrete cases in order to make
presentation simpler, this certainly can be done by the authors of the report who will then
produce a modified framework most convenient for them to use. The DPSIR is regularly
interpreted as a scheme. However, it can be also presented in a tabular form or a descriptive text.
In Vietnamese case studies, the DPSIR framework applied for the two ecosystems of Hai
Phong City (mangroves and coral reefs) and coral reef ecosystem in Nha Trang City to assess the
sustainable use of natural resources in coastal urban areas. These two coastal ecosystems are
typical valuable wetland systems in the two case studies that are under the increasing pressures
caused by socio-economic development. The changes and the degradation have been under the
pressures of the increasing environmental pollution and conversion of coastal natural habitats
into man-made ones. Climate change, especially sea level rise seem to be very serious in Hai
Phong case study in the future. This will make the coastal wetland ecosystem changed in some
complicated scenarios. The responses from the Central Government of Vietnam, local authorities
and communities are very urgent.
2. Materials and methodology
2.1. Sources and data
For this study, data were compiled using various sources with the most important ones of Viet
Nam Red Book, Statistic Year Books of Hai Phong City and Khanh Hoa Province, and researches
by Institute of Marine Environment and Resources. Data including primary and secondary ones
were then organised in a GIS database for multiple purpose uses.
- 340 -

Tran Dinh Lan, et al., DPSIR Framework for Case Studies in Hai Phong and Nha Trang, Vietnam.
2.2. Methods
Data collection and integration: Data collected mainly from existing sources as mentioned above were
produced using various methods employed for the studies to achieve these research purposes. A
small amount of those data was supplemented by complementary surveys implemented by SECOA
team of the Institute of Marine Environment and Resources (IMER) in the two case studies.
Method of data analysis, integration and assessment, cause – effect analysis are used to
achieve research’s objectives. The DPSIR framework is also applied to identify indicators for
interested systems.
Geogrphic information system (GIS) and Remote Sensing technology: Huge data and
information on socio – economy, environment and resources are used as input for developing and
analyzing indicator, index. These data are managed in a GIS database. GIS and Remote Sensing
techniques used in this research include: satellite geometric correction, image interpreter to separate
interested objects, NDVI (Normalize Difference Vegetation Index) calculation by years, layer analysis
and overlay to detect changes with time.
2.3. Defining the study area
Hai Phong is situated on the northeastern coast of Vietnam, about 100 km east of Ha Noi Capital.
It is the third largest city in Vietnam and possesses the largest seaport in the northern part of the
country. It covers an area of 1,519 km2 including two island districts (Cat Hai and Bach Long Vi).
The city area has four major landscapes: karts, hill and low mountains, mountains, and plains.
The karstic landscape is mainly in Cat Ba Islands and Thuy Nguyen District with the height of
10-322 m. The hill and low mountain landscape is in north Thuy Nguyen and covers over 80 km2
with the heights of 15-140 m. The plains are largest of about 900 km2 and the height of 2-10 m.
Total urban area of Hai Phong covers over 50% Hai Phong City area (Figure 9.1). Hai Phong has
a large coastal and sea area, favorable for marine economic development and is the most
important commercial and transportation hub in the northern Vietnam, connecting the northern
provinces to the world market through its seaport system. Other parts of the country are
connected to Hai Phong by road, railway, inland waterways, sea and air links.
Nha Trang is a small city belonging to Khanh Hoa coastal province and 1280 km from Ha
Noi, 535 km from Da Nang, 448 km from Ho Chi Minh City, home to many famous beautiful
spots and landscapes, and is a major tourist center in the country. The city is situated in a valley
surrounded by mountains on three sides: the north, the west, and the south. The city is bordered
by the sea to the east. Cai River of Nha Trang and Cua Be River divide Nha Trang into 3 sections:
the north of Cai River, the south of Cua Be River and the inner part of Nha Trang City is located
- 341 -

SECOA, Vol. 6. Environmental Stresses and Resource Use in Coastal Urban and Peri-Urban Regions
between two rivers. Nha Trang has 19 islands with more than 2,500 households and about 15,000
inhabitants. The largest of those islands is Tre Island with an area of some 30 km2, sheltering the
bay from strong winds and waves (Figure 9.2).
Figure 9.1. Hai Phong case study.
Figure 9.2. Nha Trang case study.
- 342 -

Tran Dinh Lan, et al., DPSIR Framework for Case Studies in Hai Phong and Nha Trang, Vietnam.
3. Natural resources and their exploitation
3.1. State and impact
Hai Phong and Nha Trang City have advantages of rich natural resources: living resources, non-
living resources, human resources, resources of position, etc. However, under the increase of
human activities, natural resources are more and more negatively impacted.
Non biological resource
Hai Phong City
Due to the geological characteristics of the area, there are not many traces of magma activities.
Hai Phong does not have many large mineral mines. According to the results of geological
expeditions, Hai Phong has some natural resources of small reserve such as iron mine in Duong
Quan (Thuy Nguyen District); zinc mine in Cat Ba. In terms of metal resources, there is an iron
mine in Duong Chinh (Thuy Nguyen); coastal mineral sand can be found (at Cat Hai and Tien
Lang). In respect of non-metal resources: there are kaolin mines at Doan Lai (Thuy Nguyen), clay
mine at Tien Hoi, Chien Thang (Tien Lang), several clay points at Kien Thiet (Tien Lang), Tan
Phong (Kien Thuy), Dong Thai (An Hai). Limestone is distributed mainly in Cat Ba, Trang Kenh,
Phi Liet, Dun terry; quartzite and tectonics can be found in some hills of Do Son Area; phosphate
at Bach Long Vi, mineral water is available at Bach Dang Commune (Tien Lang). Salt and sand
are two important resources of Hai Phong, which are concentrated mainly at river islets and on
the sea side of Cat Hai, Tien Lang, Vinh Bao, Kien Thuy, Do Son districts. In Bach Long Vi Island,
there is asphalt stone, a product of oiled oxidation showing some perspectives of oil and natural
gas availability because the continental shelf of Hai Phong occupies one forth of sediment of Third
Epoch of the Gulf of Tonkin with the thickness up to 3,000 m.
Land resources of Hai Phong cover more than 57,000 ha of arable land. The land was
formed mainly by alluvia transported and deposited by the system of Thai Binh River. Due to the
location next to the sea, most of the soil is of alum and saline alum nature and the terrain is a
mixture of low and high land alternated with many low-lying paddies. The variation of climate
negatively affects soil, land and plants causing additional difficulties for agriculture production,
especially plantation.
Moreover, Hai Phong has an advantage of geographic position to develop port and related
activities.
- 343 -

SECOA, Vol. 6. Environmental Stresses and Resource Use in Coastal Urban and Peri-Urban Regions
Nha Trang City
Non biological resources of Nha Trang City are advantage of coastal geographic position with
many beauty landscapes making the city famous as a tourism destination in Viet Nam, even in
the world.
Biological resources
Mangrove ecosystem
Mangrove forest in Hai Phong City is rather diversified in species in comparison with other
provinces in north Vietnam. Mangroves are most in Bach Dang estuary zone of 20.37 ha and
followed by those in Phu Long, Cat Hai and Do Son (Hong 1970). Until years of 90s, the total area
of mangrove forests in Hai Phong were still very large, distributed from Phu Long, Ang Soi, Hoa
Quang, Gia Loc, Van Chan, Hoang Chau (Cat Hai District) to Tam Hung, Phu Le, Pha Le, Lap Le,
Yen Vu island of Thuy Nguyen district, Dinh Vu peninsula; Trang Cat (Hai An); Hop Nghia (Kien
Thuy); Ngoc Hai, Bang La (Do Son); Dong Hung, Tien Hung, Vinh Quang (Tien Lang). However,
due to the reclamation for agriculture and aquaculture, more than 1,000 ha of mangrove forests
were destroyed in Dinh Vu area (Thai 2007). In 2007, the total area of mangrove forest was only
more than 600 ha. Among them, Cat Hai District had more than 200 ha (Thanh 2007) (Figure 9.3
and Figure 9.4).
Mangrove forests in Bach Dang Estuary have very typical structure. The timber
community is in the high tide zone, with typical species are Excoecaria agallocha, Hibicus tiliaceus
and Clerodendron inerme, the following species are Bruguiera gymnorhiza, Kandelia candel and
Aegyceras corniculatum in the middle tide zone. The vanguard communities of mangrove are
Suaeda maritima and Cynodon dactylon.
Mangrove forests in the area have a high biodiversity value at species level. A total of 494
species have been identified, including 36 mangrove species, 16 marine algae species, 4 species of
seagrasses, 306 species of zoobenthos, 90 species of fishes, 5 species of reptiles and 37 species of
birds (waterfowl). Among them, 2 species of algae, 3 species of gastropods, one species of fish, 3
species of reptiles and 3 species of birds are listed in Vietnam Red Book (Trong 1991, 1996).
Recently, mangrove ecosystem in Hai Phong has undergone many pressures from social
economic development activities of the city. Results from assessment of mangrove changes in the
period of 1989-2007 show a lessening trend of mangrove areas (Table 9.1, Figure 9.3, Figure 9.4).
- 344 -

Tran Dinh Lan, et al., DPSIR Framework for Case Studies in Hai Phong and Nha Trang, Vietnam.
There are some reasons of this trend but the popular ones are consequences from aquaculture
activities and port development.
Table 9.1. Mangrove’s areas change in Hai Phong, 1989-2007.
1989-1995 (ha) 1995- 2001 (ha) 2001- 2007 (ha)
State of changes Increase Loss Increase Loss Increase Loss
0 -1,182 1,348 -972 700 -1,168
Equivalent - 1,182 376 - 468
Figure 9.3. Changes of mangrove forest areas in Hai Phong, 1995-2001.
- 345 -

SECOA, Vol. 6. Environmental Stresses and Resource Use in Coastal Urban and Peri-Urban Regions
Figure 9.4. Changes of mangrove forest areas in Hai Phong, 2001 – 2007.
Seagrass ecosystem
Hai Phong
There are 4 species of seagrass in the Hai Phong coastal area. They are scattered in many places.
However, some are concentrated in a large area in Nha Mac ponds (Quang Ninh), Cat Hai, Dinh
Vu and Trang Cat (Hai Phong) (Table 9.2, Figure 9.5).
- 346 -

Tran Dinh Lan, et al., DPSIR Framework for Case Studies in Hai Phong and Nha Trang, Vietnam.
Table 9.2. Some concentrated seagrass beds in Hai Phong.
No Location Areas (ha) Dominated Species
1 Nha Mac ponds 500 Ruppia maritima
2 Dinh Vu ponds 120 Ruppia maritime
3 Trang Cat 60 Ruppia maritime
4 Cat Hai 100 Ruppia maritime
Total 780
(Sources: Tien et al. 2002).
However, because seagrasses have been rarely studied in Hai Phong, the information of
losing area of seagrass beds is very limited. At the moment, most seagrass beds at Dinh Vu ponds
have been destroyed by infrastructure development activities.
Figure 9.5. Distribution of seagrass beds in Hai Phong area
- 347 -

SECOA, Vol. 6. Environmental Stresses and Resource Use in Coastal Urban and Peri-Urban Regions
Nha Trang
Seagrass beds in Khanh Hoa Province are very rich and abundant, not only in the number of
species but also in areas and density, especially species Enhalus acoroides. Data collected recently
show that, seagrass beds are concentrated in Van Phong Bay, Nha Trang Bay, Cam Ranh Bay and
Thuy Trieu Lagoon. They grow from low tide areas to about 10 m deep. In shallow water
surrounding islands or bays, the species Thalassia hemprichii is dominant. However, most of
seagrass beds in Khanh Hoa Province is seriously degraded, especially in Thuy Trieu Lagoon,
My Giang and Ninh Tinh, or completely disappeared (Table 9.3).
Table 9.3. The change of seagrass beds areas in Nha Trang Bay.
Location Areas (1997,1998)
(hectare)
Areas (2001, 2002)
(hectare)
Species composition
% reduced areas
Bai Tien, Hon Chong 10 8 Th, Ho, Hm 20
Dam Gia (Hon Lon, Nha Trang Bay)
10 10 Ea, Th, Hu, Cr, Ho, Hm
0
Song Lo (Nha Trang Bay)
8 6 Ea, Th, Cr, Hu, Ho
25
Be river mouth (Nha Trang Bay)
7 1 Hu, Cr, Ea, Ho 85.71
(Note: Ea: Enhalus acoroides; Th: Thalassia hemprichii; Cr: Cymodocea rotundata; Cs: Cymodocea serrulata; Hu: Halodule
uninervis; Ho: Halophila ovalis; Hm: Halophila minor).
Coral reef ecosystem
Hai Phong
Coral reefs in Hai Phong are distributed in the south-western part of the Cat Ba Island, Long Chau
Island and south Ha Long Bay, from the intertidal area down to 6 m deep. The concentrated
distribution of reef building corals is from one to three meters in depth. The status of coral reefs
recorded through their living covers are provided in Table 9.4.
- 348 -

Tran Dinh Lan, et al., DPSIR Framework for Case Studies in Hai Phong and Nha Trang, Vietnam.
Table 9.4. The cover of living coral at some reefs in Hai Phong.
Reefs Location Living coral
cover (%) Dominated genera
Coc Cheo Cat Ba 44-67 Goniopora, Galaxea, Porites, Favia
Tung Gio Cat Ba 58-67 Pavona, Favites
Cat Dua Cat Ba 46-56 Galaxea, Alcyonacea, Montipora, Favia
Tung Ngon Cat Ba 59-64 Porites, Favites, Goniopora, Pavona
Vung Vua Cat Ba 40-49 Pavona, Porites, Favia, Goniopora
Ba Cat Dai Cat Ba 26-50 Porites, Favites, Galaxea, Goniopora
Hon May Cat Ba 42-50 Galaxea, Montipora, Porites
Ang Tham Cat Ba 52-57 Galaxea, Porites, Acropora, Echinophyllia
Ang Du Cat Ba 40.6 Echynophyllia, Lobophyllia, Symphyllia, Acropora
Cay Bang Long Chau 68 Galaxea, Acropora, Porites, Goniopora, Echinopora
Vung Tau Long Chau 24 Galaxea, Acropora, Porites, Goniopora, Echinopora (Source: Tien et al. 2002, Yet 1999).
Based on the UNESCO’s evaluation table, many coral reefs in Cat Ba and Long Chau could
be listed in average level (living coverage from 25% to 50%) and fine level (living coverage from
50% to 75%). The abundance of living coral is an indication of abundance of fishes and
related animals.
Recently, the living cover of corals in Cat Ba and Long Chau Island has been significantly
reduced (Table 9.5). According to the studies conducted by Institute of Marine Environment and
Resources, the cover percentage of some reefs at Cat Ba such as Tung Gio, Tung Ngon only ranges
from 10 to 40%, Ang Du - 23.7%, some other places have even lower cover or completely zero. At
Long Chau Island, the mean of living cover decreased to 25.6% (Quan 2007).
Table 9.5. Decline of living coral cover in Cat Ba – Ha Long area.
TT Site Cover before 1998
(%)
Cover in 2003
(%)
Percentage of
decline (%) 1 Cong La 29.3 17 42
2 Ang Tham 55.7 7.4 86.7
3 Ba Trai Dao 85.7 44.6 48 4 Van Boi - 31.1 -
5 Hang Trai 78.1 65 16.8
6 Cong Hip - 75.4 -
7 Cong Do 28.3 1 96.5 8 Tung Ngon 64.7 48 25.8
9 Coc Cheo 68.4 55.9 18.3
- 349 -

SECOA, Vol. 6. Environmental Stresses and Resource Use in Coastal Urban and Peri-Urban Regions
The fauna of coral reefs in the area is also an indication of abundance of the species level.
According to previous studies, a list of 1,109 species has been recorded. Among them were 211 species
of coral (170 species of hard coral, 41 species of soft coral and sea fan), 180 species of phytoplankton,
97 species of zooplankton, 70 species of algae, 78 species of annelids, 208 species of mollusks, 76
species of crustaceans, 21 species of echinoderms, 157 species of fishes and 11 species of marine
reptiles and mammals. In the coral reef communities, many species are of high economic value such
as Tu Hai (a species of mollusks) with production around 4-5 tons per year, areas (3,000 tons per year),
groupers (3-5 tons per year) etc (Ken 1998). Some endangered species, which were listed in the
Vietnam Red Book, such as trochids, green mussel, green turtle, hawksbill turtle, sea horses, are also
present in the coral reef ecosystem.
Nha Trang
Nha Trang Bay has 14 islands with about 15 km of coastline, this is an ideal condition for coral
distribution. Recent study results show that, coral reefs distribute at almost all of islands in Nha Trang
Bay, with the structure of semi-fringing and depending on the structure of sea bottom, maximum
depth of 15m. The total area of coral reefs in Nha Trang Bay is about 200 ha.
There are 350 coral species belonging to 64 genera, including 24 species and 5 genera of soft
coral. In comparing to other places, Nha Trang Bay is one of the most abundant locations to the
number of coral species and genera in Vietnam.
The species composition of coral fishes in Nha Trang Bay is also very abundant with 348
species belonging to 146 genera and 58 families. Among them were 77 species only found in Nha
Trang Bay. Mollusks group is also a big one in coral reefs with 106 species, 52 genera and 33 families.
Among them, the families have the highest in number of species are Conidae, Muricidae, Cypraeidae.
Crustacean group has 69 species belonging to 39 genera; Echinoderms group has 27 species, 20 genera
and more than 252 species of seaweeds living on coral reefs have been found in Nha Trang Bay.
The results of surveys conducted at 12 places in Nha Trang Bay show that, the average living
cover of hard coral is 22% (level 2 on the UNESCO’s evaluation table). Among them, the western part
of Hon Mun has the highest living cover, reaching 54% and the lowest is Bai Ran with average living
percentage of 2.2%. In Hon Cau, soft corals cover up to 17% while this figure is ranged between 0 to
3.3% in other locations (Tuan et al. 2002, 2005).
- 350 -

Tran Dinh Lan, et al., DPSIR Framework for Case Studies in Hai Phong and Nha Trang, Vietnam.
3.2. Drivers and pressures
Natural resources changes in negative trend in the two case studies of Hai Phong and Nha Trang
City are due to the influence of both natural hazards and socio-economic development. These
drivers and pressures can be detailed as follows.
Hai Phong
Natural hazards
A natural disaster is the result of when a natural hazard affects human being. Among natural
hazards, typhoons always cause huge damages in coastal zone of Hai Phong. Every year, this
area is under the influence of 2-5 typhoons from June to September. Strong winds in typhoons
with speed reaching 45-50 m/s, heavy rainfall (over 100 mm/day) and storm surges accompanied
by large waves destroy coastal structures and human properties. Computed storm surge reaches
1 m to 3 m. When storm surge falls in spring tide, sea level can rise up 5-6 m and very strong
wave can break out sea dikes and make a deep coastal deformation. Thanks to the protection of
Hai Nan Island and the characteristics of the coastal formation with good shelters, damages due
to typhoons in Hai Phong are consequently less than that experienced in other parts of the north
and the central part of the country.
Earthquakes rarely occur in Hai Phong. The local seismic map indicates that this belt area
belongs to a seismographic zone with a magnitude of 6.1 to 6.5 on the Richter scale.
Population and urbanization
The population of Hai Phong is about 1,841,650 people with average density of 1,212 people/km2.
In urban area (core), population density is very high, reaches to 16,661 people/km2 in Le Chan
District. While population density of rural district (outer ring) is lower: about 1.653 people/km2
for the most crowded district - Thuy Nguyen (Hai Phong Statistic Office 2010).
Urban population accounts for 42% of total population. Population structure indicates the
trend of increasing of urban population with time and converse for rural area. In the period of
1995- 2009, the rate of increase doubled in urban area and it was slightly reduced in rural area
(Figure 9.6). The consequences of population increasing make urbanization faster with
immigration flows from rural area or vicinity provinces/cities. Fast urbanization is generating of
environmental pollution and depletion of resources.
- 351 -

SECOA, Vol. 6. Environmental Stresses and Resource Use in Coastal Urban and Peri-Urban Regions
Figure 9.6. Population trend in rural and urban area of Hai Phong.
Industry
Gross output of industry of Hai Phong has a high developing rate. In the 1996 to 2000 period, the
average rate of increase was 23.65%, and from 2001 to 2005 a slower rate increase occurred
(19.91%).
Figure 9.7. The trend of constituent economic parts to industrial output value.
All industrial fields have a trend of increasing output value. The gross output in 2005
increased by 2.48 times in comparison with that of 2000. Foreign invested industry made the
highest contribution to the whole industrial value of the city (Figure 9.7). The gross output of Hai
Phong’s industry in 2006 was 15,799.3 billion dong, increasing 12.5% from that of 2005. (Hai
Phong Statistics Office 2000, 2005, 2007, 2010).
- 352 -

Tran Dinh Lan, et al., DPSIR Framework for Case Studies in Hai Phong and Nha Trang, Vietnam.
Table 9.6. Structure of gross output of industry.
Year Field
1995 2000 2005 2008
Exploiting industry 1.5 0.55 0.84 0.5
Manufacturing 97.7 98.63 98.71 95.9
Production and distribution of electricity 0.8 0.82 0.45 3.6
Table 9.6 shows that the output value of manufacturing comprises a large percentage with
more than 98% of the total output value of all of the industrial activities. Almost all of these
industries are footwear and metal products.
Up to 2009, in Hai Phong, there were 12,912 industrial enterprises with most of them
concentrated in urban areas and Thuy Nguyen rural district. To date, there exist three big
industrial zones established according to Prime Minister’s decision, including Nomura (153 ha),
Dinh Vu (164 ha) and Do Son (150 ha). Other industrial zones with smaller area were established
according to the Hai Phong People Committee’s decisions. Hai Phong industry has developed
mainly in the south of the city. Many districts have good manufacturing conditions to attract
many kinds of factories, such as Hong Bang, with machinery and shipping, and steel for
construction; Le Chan with small and quiet factories to produce furniture; Ngo Quyen with
frozen fishery; Kien An concentrated on small machinery, motors, footwear and clothes, etc., An
Duong rural districts for chemicals and machinery in Nomura industrial zone; Thuy Nguyen with
cements, colored metals, shipping and ship repairing; and Cat Hai and Do Son with fish sauce
and tourism. Other districts have smaller factories.
Agriculture
The gross output of agriculture for the city was 8,011.9 billion dong in 2009, increased by a 2.4
fold from that of 2005. The largest increase came from cultivation (Table 9.7). This index is quite
high in an industrial city like Hai Phong, and in the future, this trend should decrease.
Table 9.7. The output value of agriculture in the period from 1995 to 2009.
Year Field
1995 2000 2005 2009
Total (billion dong) 1,576.1 2,310.4 3,323.1 8,011.9
Cultivation (billion dong) 1,118.0 1,616.0 2,091.3 4,459.7
Breeding (billion dong) 434.6 648.9 1,159.5 3,374.2
Agriculture service (billion dong) 23.5 45.5 72.3 178.0 Source: Hai Phong Statistic Office 2010.
- 353 -

SECOA, Vol. 6. Environmental Stresses and Resource Use in Coastal Urban and Peri-Urban Regions
The total agricultural area of Hai Phong is about 54,239 ha and decreasing with time.
Comparing with 2000, it shows that the agricultural area decreased by 7,888 ha, this area was changed
to other land uses, such as industry, urbanization, transportation, etc. Of these changes, the foremost
changed occurred to industrial areas. The distribution of elaborate areas brings out in Table 9.8.
Table 9.8. Agricultural area by districts surrounding the ports of Hai Phong.
Administration 2000 2005 2009
Total agriculture area of Hai Phong (unit:ha)
62,127 57,117 54,239
Hong Bang urban district 348 348 199
Ngo Quyen urban district 65 25 -
Le Chan urban district - 213 146
Kien An urban district 1,182 972 993
Hai An urban district - 942 550
Do Son urban district 610 271 962
Duong Kinh urban district - - 1,483
Thuy Nguyen district 11,583 10,918 10,290
An Duong district 7,993 5,669 5,514
An Lao district 7,612 7,280 6,759
Kien Thuy district 9,586 7,764 5,462
Tien Lang district 10,607 10,382 10,098
Vinh Bao district 12,116 11,918 11,403
Cat Hai island district 443 414 379
Bach Long Vy island district - 1 -
Source: Hai Phong Statistic Office 2010.
Aquaculture
Aquaculture and fishery are strong points for economic development of coastal provinces.
Aquacultural activities of Hai Phong are concentrated in Hai An, Do Son, Thuy Nguyen and Tien
Lang districts. In 2009, the total area of water surface for aquaculture was 13,983 ha with fishery
production of 86,843.5 tonnes.
The total value of aquaculture of Hai Phong in the period from 2000 to 2005 increased at
an average rate of about 7.5% per year. The output value from the aquaculture in 2005 was 669.4
billion dong. Of which breeding and catching productions composed of the highest percentage
(99.43% of total value), and service value was low with only 0.57%.
- 354 -

Tran Dinh Lan, et al., DPSIR Framework for Case Studies in Hai Phong and Nha Trang, Vietnam.
Aquatic cultivation in Hai Phong includes marine, brackish and fresh water, with most
areas comprising marine to brackish water (61.51%) with nearly 8,259 ha in 2005, and other areas
of aquatic cultivation in freshwater in smaller areas (38.49% equal to 5.168 ha). According to the
investigation of Institute of Aquaculture Economy and Planning 2005, most of these areas were
concentrated in Tien Lang (2,500 ha), Kien Thuy (2,449 ha), Thuy Nguyen (2,136.7ha), Cat Hai
(1,872.7 ha) and Hai An (2,140 ha). Near the Hai Phong ports, most aquacultural areas belong to
Hai An, Thuy Nguyen, Kien Thuy, Do Son and Cat Hai. The areas contain 65% of the total area
and 66% of the total production of the city (Table 9.9). The main products of aquatic cultivation
in marine and brackish water are shrimp, seaweed, crab, brackish fish and other small kinds as
oysters, mollusks, and in freshwater the main products are freshwater fish and shrimp.
Table 9.9. Some indexes of aquaculture of Hai Phong.
Index Unit 1995 2000 2005 2009
Total value Aquatic cultivation Fishing Fishery Service
Bil dong
191.9 82.4
108.8 0.7
326.0 155.5 169.2
1.3
699.4 383.1 312.3
4.0
946.3 541.9 397 7.4
Total areas for aquatic cultivation Ha 12,458 13,077.0 13,486 13,983
Production of fishing Ton 15,000 23,163 35,279.1 43,102
Production of aquatic cultivation Ton 15,589 19,425.0 34,953.8 43441.5
Source: Hai Phong Statistics Office 2010.
Commerce and service
Commerce and service have decisive role of cargo circulation, service and connection of
production to consumer. For many years, commerce and service of Hai Phong have developed
comprehensively, both in foreign and domestic trade. Trade activities are eventful, amount of
cargo circulation is large with quality higher and higher, contributes to development and transfer
of economic structure, improvement of living standard.
Commercial activities attract many employees and increase much of the output value.
They contribute to solving unemployment problems and improving the living conditions. The
total export value of the city in 2005 was 839.029 thousand USD, twice as much as that of 2000
(Table 9.10).
- 355 -

SECOA, Vol. 6. Environmental Stresses and Resource Use in Coastal Urban and Peri-Urban Regions
Table 9.10. The output value of trade of Hai Phong from 2000 to 2005 (Unit: bill dongs).
Year
Areas 2000 2003 2004 2005
Total 3,934.9 7,707.2 9,467.1 11,362.4
Commerce 6,749.10 7,884.5 8,824.0
Restaurant 470.1 816.3 1,630.5
Tourism 40.4 35.9 32.0
Service 447.6 731.4 875.9
Source: Hai Phong Statistic Office 2008.
The types of exported products are mainly woolen carpets, footwear, paper, frozen pork,
frozen shrimp, fish, ground nuts, peanuts, coffee, rubber products, coconut and rice. The main
import products are urea, chemicals, steel and iron, primary plastics, textile fabrics, cigarette
materials, automobiles, material for sewing, motorbikes, fridges, white sugar and wheat flour.
The service sector of Hai Phong has developed steadily in recent years. From 1996 to 2000,
an average increase of 5.5% in the sector’s GDP contribution was made, slightly lower than the
national average (5.7%). During the period from 2001 to 2005, Hai Phong’s service sector
witnessed a rapid increase in its GDP contribution with an average of 10.3%, over 3% higher than
the national average of the same period (7%). The sector’s contribution to the total GDP of the
city decreased from 52.3% in 1995 to 48.1% in 2000 then increased to 50.4% in 2005 (Hai Phong
People Committee 2007). The service sector of Hai Phong is dominated by transport, storage
service and communications, which accounts for 34.69% of the GDP of the service sector in 2005.
Port and harbour
Hai Phong has a seaport and some small ports as fishing port and port for construction materials.
Thanks to favorable conditions for developing port activities, there are nearly 30 ports and wharfs
operating to serve for factories along Cam – Bach Dang River. Port operation is one of the main
industrial activities of Hai Phong. Hai Phong Port has built and developed for over a century and
it has always played the most important role of the “Gate way” in the north part of the country.
Cargoes of 17 northern provinces and transit cargoes to and from north Laos and south China etc.
have been transferred via the Port of Hai Phong to the markets of many countries and vice versa.
Amount of cargo at ports of Hai Phong was shown in Table 9.11.
- 356 -

Tran Dinh Lan, et al., DPSIR Framework for Case Studies in Hai Phong and Nha Trang, Vietnam.
Table 9.11. Some main indicators of Hai Phong Port.
1995 2000 2005 2009
Total Cargo volume (thous. tonnes) 4515 12,465 14,857 32,825
Of which volume of goods at the main port 4515 7,645 10,512 14,370
Export goods 493 1,234 2,349 2,376
Import goods 2362 3,586 5,197 8,226
Domestic goods 1660 2,825 2,966 3,768
Number of ship entering the port 1,386 1,559 2,011 2,410
Domestic ship 360 542 1,149 1,011
Foreign ship 1026 1017 862 1,399 Sources: Hai Phong Statistics Office 2000, 2007, 2010.
According to the Plan of Development of Economic Belt for Tonkin Gulf Coastal Area till
2020, Hai Phong port will be continued to upgrade and extend. Lach Huyen Port will be
constructed to be the first international gateway port of the northern part of Vietnam, serving the
demand of cargo transportation of north Vietnam and cargo transit of southeast China. Lach
Huyen Port capacity in 2015 will reach 6 million tones of dry cargo and 1 million tonne of liquid
cargo and 24-26 million tones of dry cargo and 9-11 million tones of liquid in 2020, receives ship
of 50,000 – 80,000 DWT. Port of south Do Son will be planed to build.
Transportation
The Hai Phong to Ha Noi railway was built from 1899 to 1906. A segment of the route that passes
through the city includes several stations and a terminal (Hai Phong Railway Station). This
terminal is linked with the ports and some industrial zones.
The road network includes intra-province/city and inter-province roads. The intra-city
network of Hai Phong consists of eight routes connecting the suburban districts (An Duong, An
Lao, Vinh Bao, Thuy Nguyen, Kien Thuy, Tien Lang, etc.). They are mainly third-grade roads
with a total length of about 100.7 km. Traffic flow is modest and roads are in bad condition.
The inter-province roads between Hai Phong and surrounding provinces include Road 5
and Road 10. The total length of Road 5 is 106 km from Cau Chui (Ha Noi) to Chua Ve Port (Hai
Phong). The segment through Hai Phong is 29 km long, 25 m wide with four-lanes. The Road 5
meets the standard of first grade. The total length of Road 10 is 156 km from Bieu Nghi (Quang
Ninh Province) to Nam Dinh Province and linked with Highway One at Ninh Binh Province. The
segment through Hai Phong is 60 km long. Road 10 was rebuilt and completed to second grade
- 357 -

SECOA, Vol. 6. Environmental Stresses and Resource Use in Coastal Urban and Peri-Urban Regions
standard, with average width of 20 m. The old segment through the city was replaced and links
Quoc Tuan Commune, An Lao District to Da Bach Bridge (Thuy Nguyen District) and then
connects to the Ha Noi-Ha Long Road. The urban ring road was completed (linked with Road 5
in 2005) and in operation and generally meets the demand of freightage from Hai Phong Port to
Ha Noi and neighbouring provinces.
Hai Phong has a sea port and some small harbours, which serve as mainly fishing
harbours and building material harbours. In addition, many other small river harbours are
scattered throughout the suburban districts (mainly building material and coal harbours)
servicing the local residents and surroundings.
The capacity of Hai Phong Port was over 13 million tonnes (2005) and can receive ships
with 10,000 Dead Weight Tonnage. Some main indicators of Hai Phong Port in 2005 are as follows:
• Area of cargo storage: 259,000 m2
• Storage capacity: 47,612 thousands tonnes
• Total wharfs/length: 16 wharfs with 2,562 m long.
Hai Phong has two airports, at Cat Bi and Kien An. Cat Bi Airport is about 5 km from the
city centre. It was upgraded in 2005 and can now accept the Airbus 320. Cat Bi Airport can become
an international airport, and has had planning of its development approved by the Prime
Minister.
Tourism
Hai Phong has its own potentials for tourism development in both ecological and cultural
tourism. With advantage of a long coastline with lots of marine landscapes such as Do Son beach,
Cat Ba Archipelago... and a depth long standing culture, Hai Phong tourism will develop
brilliantly if its potentials are used up. However, Hai Phong tourism state is now not correlative
with its potentials.
Statistics data show that total amount of tourists is increasing with time (Table 9.12). In
2009, the number of tourists exceeded 4 million people, nearly double increasing from 2005.
Almost tourists coming to Hai Phong are domestic.
- 358 -

Tran Dinh Lan, et al., DPSIR Framework for Case Studies in Hai Phong and Nha Trang, Vietnam.
Table 9.12. Tourist and hotel activities in Hai Phong.
Index Unit 1995 2000 2005 2009
Number of hotels (over 15 rooms) Hotel 30 77 90 110
Rooms Room 994 3,075 3,545 4,466
Beds Bed 2,019 5,689 6,381 7,850
Utilized times
day
Rooms 151,610 476,010 557,699 803,590
Beds 310,295 860,176 941,835 1,330,000
Number of tourists
Times of passenger
299,584 784,077 2,354,906 3,989,257
Foreign tourist 43,814 256,395 522,796 630,898
Domestic tourist 255,770 527,682 1,832,110 3,358,359
Total turnover Mil dong 94,958 276,464 1,204,531 2,792,991
Source: Hai Phong Statistics Office 2010
Nha Trang City
Natural hazards
On an average, two to three typhoons affect Nha Trang annually. Compared with other coastal
zones in Vietnam, this area is one of the areas least affected by typhoons every year. Typhoons
often land in Nha Trang from September to November.
Eleven typhoons and one tropical low pressure attacked Nha Trang coastal area in the
period of 1976 to 2007. The velocity of the wind is mostly 39-61 km/h (55% total data), 62-88 km/h
(33%), and 89-102 km/h (12%).
In Nha Trang, heavy rain due to typhoons is about 240-340 mm. The precipitations
distribution due to typhoon is mostly of 50-100 mm (44%), 100-200 mm (12%), 200-350 mm (44%).
When the northeast monsoon combines with the tropical convergence, it induces heavy
precipitation and often generates large floods. There are about 2-5 large floods annually. Floods
always happen in a short time of 2-3 days. However, it also causes significant damages, especially
in low land. The historical flood was recognized in Nha Trang in 1964 with flooding time of a
week.
- 359 -

SECOA, Vol. 6. Environmental Stresses and Resource Use in Coastal Urban and Peri-Urban Regions
Figure 9.8. Population trend in rural and urban area of Nha Trang City.
Nha Trang has population of 389,031 people with urban area of 290.130 people and the
rural of 98,901 people and average population density of 1,558 people/km2. Nha Trang City
consists of 19 urban communes and 8 rural communes. Van Thang Commune has highest
population density and Vinh Luong Commune has lowest one. Total number of household in
2009 was 99,498 (Nha Trang Statistics Department 2010). Population in both rural and urban area
have trend to increase lightly with time as shown in Figure 9.8.
Industry
In Nha Trang, the main industry is small scale with three groups:
• The North City Industrial Zone (south Hon Kho – Vinh Thai Commune) consists of 6
factories: Stone Processing Factory 2757, Exporting Rattan Production Factory, 10/5 Wood
Factory, Automobile Repairing Factory, and Dong An Cotton Packing Factory.
• The South-West Industrial Zone (Vinh Phuong Commune) includes 3 weave fabric
factories, CEVCO dyeing factory.
• Tan Binh Industrial Zone (Vinh Nguyen Commune) comprises Tobacco, Factory 202,
Factory 510, Seafood Processing Factory.
In 2009, the gross output of industry was 10,480.143 billion dong (according current price),
of which state economy covered 4,943.538 billion dong and non state economy accounted for
4,948.948 billion dong.
- 360 -

Tran Dinh Lan, et al., DPSIR Framework for Case Studies in Hai Phong and Nha Trang, Vietnam.
Table 9.13. The output value of agriculture of Nha Trang, 1996 – 2009.
Years Field 1996 2000 2005 2009
Total (million dong) 69,295.5 78,640 66,379 65,542
Cultivation (million dong) 42,066.5 42,860 55,514 34545
Breeding (million dong) 27,230 35,780 13,865 28,627
Agriculture service (million dong) - - - 2,370
Agricultural area is about 4,206 ha, including 2,552 ha for annual crops and 1,654 ha for
multi- year crops. Main kinds of crops include sugar cane, peanut, sedge with small production.
For the grain, paddy is the main plant with production of 8,638 tonnes per year (Table 9.13).
Aquaculture
In Nha Trang City, aquaculture takes small part in the economic structure. Production of fishing
in 2009 was 288,627 tonnes and production of aquatic cultivation got 24,692 tonnes (Table 9.14).
Aquaculture, especially for lobster, was perceived as the most profitable economic
activity; hence, there was a dramatic increase in the number of cages as well as in the total area
devoted to aquaculture. Data collected by the Hon Mun MPA pilot project and the Vinh Nguyen
Commune show that there were 1,675 cages in Nha Trang Bay in June 2001, which increased to
2,438 cages in January 2003 (31% increment) and further went up to 5,096 cages by May 2004. The
number of lobster cages thus increased by 204% in three years (from 1675 to 5096).
The dramatic growth of aquaculture caused a number of problems such as inadequate
disposal of aquaculture waste, aesthetic degradation of the bay, marginalized water use rights of
local people, conflicts between aquaculture and tourism, and so on. Recently, some outsiders’
cages located in Vung Me had been removed out of the bay, and islanders’ cages were moved to
farther areas. Some environmental issues have been mitigated, but some social issues still need
to be addressed by the provincial government and other stakeholders. (Thu 2005).
Table 9.14. Some indexes of aquaculture of Nha Trang.
Index Unit 1996 2000 2005 2009
Total value - Aquatic cultivation - Fishing - Fishery Service
Bil. dong
710 122,404 -
59,632 116,664 -
45,053 165,664 6,000
24,692 288,699 2,006
Total areas for aquatic cultivation Ha 242 640 600 200
Production of fishing Ton 20,070 20,080 27,936 36,434
Production of aquatic cultivation Ton 257 738 350 410
- 361 -

SECOA, Vol. 6. Environmental Stresses and Resource Use in Coastal Urban and Peri-Urban Regions
Commerce and service
Commercial and service activities of Nha Trang City mainly concentrate on hotel, restaurant and
other service accompanies. The total number of household that participated in the service was
6,881 and average turnover was 951,000 per household monthly. These activities supplied jobs
for 10,216 people (Nha Trang Statistics Department 2010).
Port and harbour
Nha Trang Port is used as multi-function port to transport passengers and cargo. It was
established in 1976 but until the period of 1992-1995, it made great progress in marketing
mechanism: cargo volume at port and its turnover are increasing with time (cargo volume in 1986
of 250,000 tonnes, in 1996: 426,091 tonnes and 2009: 1,333,446 tonnes). Nha Trang Port has been
approved in the detailed plan for development of seaport group of south Center of Viet Nam
(Table 9.15).
Table 9.15. Some indicators of Nha Trang Port.
2007 2008 2009
1) Cargo volume (tonnes) 1,227,844 1,172,144 1,333,446
a- Export 253,307 218,949 394,994
b- Import 5,028 7,110 29,526
c-Domestic 969,509 946,085 908,926
- Import 848,310 842,868 811,665
- Export 121,199 103,217 97,261
2) Total number of cargo ship 681 629 667
- Domestic 518 526 559
- Foreign 163 103 108
3) Container
- number of trip 43 47 47
- number of container (TEU) 4,556 4,322 3,942
4) Passenger ship
- number of trip 23 19 21
- number of passenger (person) 17,057 17,417 26,313
Source: Nha Trang Statistics Department 2007, 2008, 2010.
- 362 -

Tran Dinh Lan, et al., DPSIR Framework for Case Studies in Hai Phong and Nha Trang, Vietnam.
Transportation
The North-South Railway goes along Khanh Hoa province with a length of 149.2 km. It goes
through Nha Trang City and almost all districts of Khanh Hoa Province. Nha Trang Station is the
main station of the province and has large scale with responsibility of carrying passenger and
cargo from Lam Dong, Buon Me Thuot to the north and south provinces.
In Nha Trang, inter-province roads include: Highway 1A, Highway 26 to Dak Lak and a
new road connected Nha Trang to Da Lat. Intra- province roads include: Nguyen Tat Thanh Street
connecting Cam Ranh Airport to Nha Trang City, Pham Van Dong Street connecting Tran Phu
Street to Highway 1A.
Nha Trang Port is now used as a multi-functional port serving for tourism, passengers
and carrying cargo. Number of passengers going through port is 6,000 people/year and cargo
capacity is 800,000 tonnes/year.
Cam Ranh Airport is 30 km far from Nha Trang City. It is located in the north of Cam
Ranh Peninsula. It has operated since 2004, after closing the old Nha Trang Airport. Cam Ranh
Airport is an international airport with capacity of 1 million of passengers in 2010 and 2 million
in 2020 to meet the requirement of socio- economic development of the south Centre of Viet Nam,
especially for tourism development.
Tourism
Tourism takes the most important role in the economic structure of Nha Trang City (40% of
economic structure). It is one of the famous tourism areas through the country, even in the world
with landscapes such as: Nha Trang Beach, Nha Trang Bay, Thap Ba Ponagar, Vinpearl Land,
Hon Mun MPA… Recently, Nha Trang City has become a brilliant point of tourism development,
contributed to foster the economic development.
According to the report on socio – economic of the first 6 months and plan of the last 6
months of 2009 of Nha Trang, the total gross output of tourism and service activities reached
773.704 billion dong (increasing of 9.75% in comparison with the same period of previous year)
with 776,000 visitors (equivalent 95.86% compared with the same period of previous year). Of
which, 162,000 were foreign tourists.
- 363 -

SECOA, Vol. 6. Environmental Stresses and Resource Use in Coastal Urban and Peri-Urban Regions
3.3. Responses
DPSIR is a causal – effective framework that Responses (R) element includes those from the
central governments and those from local authorities of case studies. Responses normally affect
all other elements of Driving force, Pressure, State and Impact with policy making, legislation,
practical actions to make ecosystem situation better. In fact, the enforcement and effectiveness of
these responses are indicated by the state of the ecosystem. For ecosystems of mangrove and coral
reef in the two case studies of Hai Phong and Nha Trang City, Vietnam, several responses have
been made by the central government of Vietnam such as issuing the Law of Environment
Protection (1994, 2005), Biodiversity Action Plan (BAP), Law of Fisheries and under law related
regulations; Establishment of Marine Protected Area (MPA) system with some pilot MPA
implemented, including Nha Trang Bay MPA, Cat Ba Biosphere Reserve. At local authorities,
Bans on coral collection were issued by Khanh Hoa Provinces that Nha Trang City belongs to and
Hai Phong City. Practical actions in the two case studies such as ecological compensation and
eco- tourism are now at the stage of study with several related projects funded by international,
national and local organizations and governments. The list below shows the responsive efforts
from the central government of Vietnam to environment protection and natural conservation.
- - Laws of Environmental Protection 2005 with chapter VII: Protection of marine, riverine
and other water sources, articles of 57 and 60: Control and treatment of marine and
riverine environment pollution.
- - Relevant protocols, circulars for implementing the Law of Environmental Protection
2005
• Protocol 65/2006/NĐ-CP of the Government on organization and operation of
inspection of the environment and resources.
• Protocol 80/2006/NĐ-CP of the Government on detail regulations and instruction
of implementation of several articles of the Law of Environmental Protection.
• Protocol 21/2008/NĐ-CP of the Government on adjustment, contribution of several
articles of the Protocol 80/2006/NĐ-CP of the Government.
• Protocol 88/2007/NĐ-CP of the Government on drainage in urban area and
industrial zones.
• Protocol 120/2008/NĐ-CP of the Government on river catchment management.
- 364 -

Tran Dinh Lan, et al., DPSIR Framework for Case Studies in Hai Phong and Nha Trang, Vietnam.
• Decision 23/2006/QĐ-BTNMT of the Ministry of Natural Resources and
Environment on issuing the list of hazardous wastes.
• Decision 184/2006/QĐ-TTg of the Prime Minister on approval of national plan to
implementation of Stockholm Convention on permanent organic pollutants.
• Circular 10/2007/TT-BTNMT of the ministry of Natural Resources and
Environment on instruction of quality assurance and quality control in
environmental monitoring.
- - Standards and Regulations
• QCVN 14 : 2008/BTNMT- national technical regulation on domestic waste water.
• TCVN 5945:2005 – Industrial waste water – Waste water standards.
• QCVN 11: 2008/BTNMT- National technical regulation on industrial waste water
of aquaproducts processing.
• QCVN 12: 2008/BTNMT- National technical regulation on waste water from paper
industry.
• QCVN 01: 2008/BTNMT- National technical regulation on waste water of natural
rubber processing industry.
• QCVN 13: 2008/BTNMT- National technical regulation on waste water of garment
industry.
4. DPSIR analysis
The DPSIR framework analysis for natural resources use in the two case studies of Hai Phong
and Nha Trang City is made specifically for valuable coastal wetland ecosystems, including
mangroves and coral reefs that are also typical resources in these case studies.
4.1 Mangrove ecosystem
Mangrove ecosystem is only for Hai Phong case study. This ecosystem is not typical in the
case study of Nha Trang City.
- 365 -

SECOA, Vol. 6. Environmental Stresses and Resource Use in Coastal Urban and Peri-Urban Regions
There are drivers causing pressures on mangrove ecosystem in Hai Phong. Among
them are three driving forces that mainly control the pressures, including aquaculture
development, port development and coastal industrial development (Figure 9.9).
In Hai Phong, aquaculture (D) ponds for shrimp, crab and fish farming, including
extensive, semi-intensive and intensive aquaculture have been developed in mangrove forest
for years. Using food and chemicals for shrimp, crab and fish feeding and treating conditions
in aquaculture ponds makes pollutants increased (P) in species and concentration not only
inside the ponds but also in surrounding mangrove areas due to the unconsumed food and
residues of chemicals. The increase of pollutant species and concentration will create the
change of the environment making consequently changing of biological species and habitats
(S) within mangrove forest. Consequently, the biodiversity of the mangrove ecosystem is
decreased (I) due to the environmental pollution in the mangrove forest. Aquaculture pond
development in Hai Phong needs more places where in many cases mangroves are growing.
Therefore, the area of mangrove forest is converted into aquaculture ponds (P) leading the
loss of mangrove forest area (I) and the change of mangrove coverage (S). Consequently,
nursery ground (I) that is one of the most important services of mangrove ecosystem and
biodiversity (I) will be decreased.
Port development (D) for the last decade in Hai Phong has occupied more and more
area (P) for building port infrastructure and installing port facilities, and also discharged
more pollutants (P) into waters of port and coastal area. These pressures create the same states
of and impacts on mangrove ecosystem as aquaculture development. However, pollutant
species and their concentrations from ports are different from those from aquaculture activity,
e.g. oily pollutant.
Coastal industrial development (D) in Hai Phong associated with port development
needs more and more area (P) and discharges more pollutants to the environment, including
the water environment within mangrove forest, these activities make mangrove ecosystem
changed in area, coverage and biodiversity, and have the same impacts as port development.
For example, the conversion of mangrove ecosystem area into economic zone took place in
Dinh Vu Island of Hai Phong with total about 1,177 ha of mangrove ecosystem and seagrass
beds being converted into industrial zone associated with Hai Phong port system, and
mangrove ecosystem with 359 ha mangrove forest is fully destroyed (Mulder et al. 2004).
- 366 -

Tran Dinh Lan, et al., DPSIR Framework for Case Studies in Hai Phong and Nha Trang, Vietnam.
Figure 9.9. DPSIR framework for the mangrove ecosystem in Hai Phong.
- 367 -

SECOA, Vol. 6. Environmental Stresses and Resource Use in Coastal Urban and Peri-Urban Regions
4.2. Coral reef ecosystem
Coral reef ecosystem in Hai Phong and Nha Trang City case studies has been under the
same major pressures caused by several driving forces and creating a set of critical impacts
(Figure 9.10).
Massive tourism development (D) taking a role as one of the driving forces among
three major driving forces has caused two main pressures of pollution increase (P) due to
tourist wastes and the increase of marine tourist activities (P) such as constructing of
tourist resorts, boat trip to see corals, underwater diving tour, etc. Under these pressures,
coral reef ecosystem has been changed in its area (S), living coral cover (S) and biodiversity
(S). Consequently, coral ecosystem will be narrow down due to loss of coral area (I), the
decrease of living coral cover (I) and the decrease of species biodiversity (I).
Coastal urbanization, including urban development in near shore islands (D)
taking place both in Hai Phong and Nha Trang needs more and more area for settlement
construction (P) and introduces more pollutant species and their increasing concentrations
(P) to the water environment in and surrounding coral reef ecosystem. Consequently, the
coral reef ecosystem in the two case studies has got the same states and impacts as those
caused by massive tourist development.
Coral reef ecosystem is sensitive to increasing sedimentation (P) and environmental
change due to the increase of fresh water (P) flowing into coastal waters where coral is
growing. These pressures are mainly caused by deforestation (D) in catchment areas of
Hai Phong and Nha Trang City besides of heavy rains, and have generated the same states
of and impacts on coral reef ecosystem as the two mentioned above driving forces.
An example indicating the states and combination impacts under those pressures
of the three mentioned driving forces can be taken in Coc Cheo site of Cat Ba Island, Hai
Phong. In the period from 1998 to 2007, coral living cover in this area was decreased from
68.4% (till 1998) to 55.9% (2003) and 53.8% (2007). The percentage of coral species was
decreased by 60-70 from 1998 to 2003 (Lan et al. 2010).
- 368 -

Tran Dinh Lan, et al., DPSIR Framework for Case Studies in Hai Phong and Nha Trang, Vietnam.
Figure 9 10. DPSIR framework for the coral reef ecosystem in Hai Phong and Nha Trang.
- 369 -

SECOA, Vol. 6. Environmental Stresses and Resource Use in Coastal Urban and Peri-Urban Regions
4.3. Indicator development for assessment of natural resources use in case studies
Among diversifying ecosystems within the case studies of Vietnam, mangrove and coral reef ones are
selected for the assessment of sustainable use of natural resources in the coastal areas of the two case
studies of Hai Phong and Nha Trang City. These natural resources are selected due to their values
and particular characteristics in studied areas. Sustainable index for each type of natural resources is
developed from the general formula. Each type of natural resources has its own indicator.
Mangrove forest
Figure 9.11. DPSIR for the mangrove ecosystem in Hai Phong vs. selection of related indicators.
Basically, we focus on the ecosystem of mangrove (natural resources), then P is from D
and I comes from S. Therefore, in most cases, indicators of P, S and R can be representative for
the whole frame of DPSIR in terms of the ecosystem.
Main drivers (D):
- Coastal aquaculture development (indicators of production, area, total revenue).
- Sea port development (indicators of goods throughputs, area of port expansion, number of ship calling at).
- Coastal industrial development (indicators of number of industrial areas, area, total revenue).
Pressures (P):
- Pollutant increase indicators of water and sediment quality
- Increase aquaculture pond area indicator of area
- Increase of port area indicator of area
- Increase of industrial area
State (S):
- Change of area indicator of area
- Coverage change indicator of coverage
- Change in biodiversity biodiversity index (H’)
Impact (I):
- Los of mangrove forest indicator of productivity decrease
- Decrease of nursery ground indicator of area
- Decrease of biodiversity biodiversity index (H’)
Response (R):
- Wetland protected area indicator of area of marine and coastal protected area (MPA)
- Ecological compensation indicator of area of ecological compensation
- 370 -

Tran Dinh Lan, et al., DPSIR Framework for Case Studies in Hai Phong and Nha Trang, Vietnam.
In case of Hai Phong, based on the principles for indicator development and the available
data for each indicator. The core indicators are selected for sustainability index development as
follows:
• Indicators of area (aquaculture pond (P), port expansion (P), industrial zone (P);
mangrove forest (S), MPA (R), ecological compensation (R)),
• Indicators of mangrove coverage (S) using NDVI from remote sensing data.
The other indicators are dependent on the selected indicators, except for the indicator of
water and sediment quality that information and data are not available in the mangrove
ecosystem in Hai Phong. As such, we do not include this indicator into index development.
Coral reef ecosystem
Figure 9.12. DPSIR for the Coral reef ecosystem in Hai Phong vs. selection of related indicators.
Main driving forces (D):
- Coastal massive tourist development (indicators of number of visitors, tourist facilities, total revenue).
- Coastal urbanization (indicators of urban area, municipality size).
- Deforestation (indicators of area).
Pressures (P):
- Pollution increase indicators of water and sediment quality
- Increase of tourist activity indicator of number of tourist boats - Increase of settlement area indicator of area
- Decrease of forest area in catchment
State (S):
- Change of coral reef indicator of area
- Living coral cover change indicator of living coral cover
- Change in species biodiversity biodiversity index (H’)
Impact (I):
- Loss of coral reef area indicator of productivity decrease
- Decrease of living coral cover indicator of living coral cover
- Decrease of species biodiversity biodiversity index (H’)
Response (R):
- Marine protected area indicator of area of marine and coastal protected area (MPA)
- Bans on coral collection number of bans issued
- 371 -

SECOA, Vol. 6. Environmental Stresses and Resource Use in Coastal Urban and Peri-Urban Regions
We focus on the coral reef ecosystem, then P is from D and I comes from S. Therefore, in
most cases, indicators of P, S and R can be representative for the whole frame of DPSIR in terms
of the ecosystem.
In cases of Hai Phong and Nha Trang City, based on the principles for indicator
development and the available data for each indicator. The core indicators are selected for
sustainability index development as follows:
• Indicators of species number in coral reef (S),
• Indicators of living coral cover (S).
The other indicators are dependent on the selected indicators, except for the indicator of
water and sediment quality that information and data are not available in the ecosystem in Hai
Phong and Nha Trang City. As such, we do not include this indicator into index development.
Table 9.16. Summary of indicators for sustainable use assessment of mangrove and coral reef ecosystems
in Vietnamese case studies.
No. Case
studies Coastal
ecosystems Indicators Index
1 Hai Phong
Mangrove
Coral reef
+ Indicators of area (aquaculture pond (P), port expansion (P), industrial zone (P) - Ippia; mangrove forest (S) - Ima, MPA (R), ecological compensation
(R) - Imra
+ Indicators of mangrove coverage (S) using NDVI from remote sensing data - NDVIm
+ Indicator of living coral cover (S) – Icc
+ Indicator of species number in coral reef (S) - Icp
Mangrove sustainable use index - Imst = 1/4*(Ima + Imra NDVIm – Ippia)
Sustainability Index of coral reef ecosystem – Icst = ½ (Icc+Icp)
2 Nha Trang
Coral reef
+ Indicator of living coral cover (S) – Icc
+ Indicator of species number in coral reef (S) - Icp
Sustainability Index of coral reef ecosystem – Icst = ½ (Icc+Icp)
- 372 -

Tran Dinh Lan, et al., DPSIR Framework for Case Studies in Hai Phong and Nha Trang, Vietnam.
5. Conclusions
The DPSIR framework applied for the two ecosystems of Hai Phong (mangroves and coral reefs) and coral reef ecosystem in Nha Trang City is the potential tool for assessment of natural ecosystem as an important component of natural resources system under the impacts of human activities. With DPSIR framework analysis for the ecosystems in both case studies of Vietnam, the ecosystems have been changed (S) and got degraded (I) under more pressures
(P) caused by socio-economic development in coastal and marine areas, though efforts from governments at all levels (R) have been made.
Sustainability index for use of mangrove ecosystem in Hai Phong shows the degradation of the ecosystem meaning that mangrove ecosystem in Hai Phong is not in sustainability. Other ecosystems in Hai Phong (coral reef and tidal flat) and in Nha Trang (coral reef) are in sustainable use but at sensitive point (indices of around 0.5). This means that if no measures for restoring and managing those ecosystems are immediately taken, the ecosystems will be in unsustainable use right away.
6. References
EEA 1995. Europe’s Environment: the Dobris Assessment. European Environment Agency.
Copenhagen.
Hai Phong’s People Committee 2007. Socio-economic development report for 2006. Hai Phong,
Vietnam.
Hai Phong Statistics Office 2010. Hai Phong 55 year construction and development.
Statistical publishing house.
Hai Phong Statistics Office 2000, 2005, 2007, 2008. Statistical Yearbook. Statistical Publishing
House.
Hong, P. N. 1970. Ecological Characters and Distribution of Vegetative System in the Viet Nam
Coastal Zone. Biological Postgraduate Dissertation, 228 p.
Ken, L. V. 1998. Species Composition of Mollusks (Bivalve) Living on Coral Reefs in Quang Ninh
– Hai Phong Marine Area. Marine Resources and Environment Journal. Volume III.
Science and Technique Publishing House, Ha Noi, pp. 199-207.
Kristensen 2004. The DPSIR Framework. Paper presented at the 27-29 September 2004 workshop
on a comprehensive / detailed assessment of the vulnerability of water resources to
environmental change in Africa using river basin approach. UNEP Headquarters, Nairobi,
Kenya.
- 373 -

SECOA, Vol. 6. Environmental Stresses and Resource Use in Coastal Urban and Peri-Urban Regions
Lan, T. D., Chu The Cuong and Do Thi Thu Huong 2010. Development of sustainability indicators
and indices for coastal wetland resources in West Tonkin Gulf. Final project report
preserved in the Institute of marine Environment and Resources, Hai Phong, Vietnam (in
Vietnamese).
Mulder F.D., Tran Dinh Lan and Luc Hens 2004. An Integrated Policy Plan for the Dinh Vu Site:
Initial Proposal. The publication of the project “ Capacity Building for Environment Port
and Water Related Management in Vietnam: Environmental Planning and ISO 14001”.
Nha Trang Statistical Department 2007, 2008, 2010. Statistical yearbook.
OECD 1991. Environmental indicators, a preliminary set. OECD, Paris.
Quan, N. V. 2007. Report on coral reefs of Cat Ba – Long Chau. Document storing in Institute of
Marine Environment and Resources.
Thanh, L. T. 2007. Report on distribution of mangrove forests in Hai Phong. Unpublished report
storing in Institute of Marine Environment and Resources.
Thai, V. D. 2007. The role of mangrove forest on minimizing the impacts of wave high and erosion
in Hai Phong. PhD dissertation.
Thu, H. V. T. 2005. Socio economic impact assessment of the Hon Mun MPA projection local
communities within the MPA. http://www.nhatrangbaympa.vnn.vn.
Tien, N. V., Dang Ngoc Thanh, Nguyen Huu Dai 2002. Seagrasses of Vietnam.
Trong, P. D. 1991. Data of Shrimp Larvae on Mangrove Forests in Yen Lap – Do Son.
Marine Resources and Environment Journal. Volume II. Science and Technique Publishing
House, Ha Noi, pp. 151-154.
Trong, P. D. 1996. Zoobenthos on Mangrove Ecosystem in North-western Part of the Tokin Gulf.
Biological Postgraduate Dissertation, 156 p.
Tuan, V. S., Nguyen Van Long, Hong Xuan Ben, Phan Kim Hoang, Nguyen Xuan Hoa, and Hua
Thai Tuyen 2002. Biodiversity of marine flora and fauna of Nha Trang bay and Hon Mun
MPA - Review of Taxonomic Studies 1930 – 2001. Biodiversity Report No. 3. Hon Mun
MPA pilot project, 49 p.
Tuan, V. S., Nguyen Van Long, Nguyen Xuan Hoa, Hua Thai Tuyen, and Lyndon De Vantier
2005. Biodiversity of marine flora and fauna of Nha Trang bay and Hon Mun MPA – Re-
access 2002-2005. Biodiversity Report No 13. Hon Mun MPA pilot project, 65 p.
Yet, N. H. 1999. The Report of Natural Condition and Biodiversity Value of Long Chau
Archipelago. Document storing in Institute of Marine Environment and Resources
Science and Technique Publishing House, Ha Noi, 250 p.
- 374 -

Tran Dinh Lan, et al., DPSIR Framework for Case Studies in Hai Phong and Nha Trang, Vietnam.
ANNEX
1. Method for developing sustainable index
Sustainable index is developed base on general principles of index development. An index can be
developed from one or many indicators that represented for the subject (system) that needs to
be assessed. So the most important thing is the defining relevant indicators. Relevant indicator can
be defined (or selected) easier after analyzing PSR (DPSIR) model of the system. The following
guide is for developing an index in general:
An index and an indicator include specific, condensed, simple, countable information,
which demonstrate the nature of a system (index) or the nature of a factor, component or a
characteristic of a system (indicator).
Normally, an index can be defined by the combination of indicators. A method for
quantifying identification of an index and/or an indicator is called the method of index
development. Specific information that is immeasurable is not considered as index/indicator, it is
called a factor or a characteristic in some case.
2. Combination of indicators = Index
Index has no unit because different indicators have different unit, so when indicators are combined,
their units need to be rejected.
• Principles for developing an index
- Being quantifiable or to be quantified (weigh) in order to be quantifiable. This is an
objective measure which does not depend on the calculator.
-
- Being simple and easy for calculating, so it is able to determine rapidly and with low
cost and easy to update.
-
- Being able to present for the whole system (for index) or a specific property of the
system (for indicator).
- 375 -

SECOA, Vol. 6. Environmental Stresses and Resource Use in Coastal Urban and Peri-Urban Regions
• Flow chart
General flow chart of index developing
Steps for index development
• Step 1: Analyze structure and function of the system to define which factors need to be
used for assessment. Each factor demonstrates a function or a factor’s characteristic of the
system. Each system can define n factors with n≥1, however n should not too much in
order to avoid complicatedness when calculating the index.
• Step 2: Define how to measure factors. Each factor may have its own unit, from that
identify an indicator for it.
• Step 3: Annulment of the dimension of an indicator. For calculating the index, all the
dimension of indicators needs to be rejected by following equation:
Sum (Ii C (weight))
Ii = It – Imax (positive) or Imax –It (negative)
Averaging Ist at time points (t)
Indicator at time points (t)
Sustainability index (Ist) for an
ecosystem
Ist for a period (p)
(Ii) index derived from each
indicator at time points (t)
- 376 -

Tran Dinh Lan, et al., DPSIR Framework for Case Studies in Hai Phong and Nha Trang, Vietnam.
Where as: Ii: indicator number i
It: value of the indicator i at certain time of the system
Imax: expected value of the indicator i in the system (or the maximum value
during a period)
Imin: minimum value of the indicator i in the system
Equation (1) is used for rejecting the dimension of indicators with positive measuring
purpose. In case of indicators with negative measuring purpose, equation (1) would be as following:
• Step 4: Define the weight of indicator Ci. Indicators Ii may have same (Ci = 1) or different
weight.
• Step 5: Calculate the sustainability index (Ist) by using indicator-weighted average as
follows:
3. Sustainability index calculation for mangrove forest
Sustainability index is calculated by combination of selected indicators according the equation (3).
Indicators seem have the same weight due to each represent a peculiar characteristic of system. The
equation (3) can be written as following:
Where: Imsd: sustainability index of mangrove forest.
Im1: indicator on mangrove area after annulling unit
Im2: NDVI
Im3: indicator on mangrove area after annulling unit
(1)
Imsd = (Im1 + Im2 + Im3)13
Imsd = (Im1 + Im2 + Im3)13
Imsd = (Im1 + Im2 + Im3)13
- 377 -

SECOA, Vol. 6. Environmental Stresses and Resource Use in Coastal Urban and Peri-Urban Regions
Equation (4) was applied to calculate sustainable index of mangrove forest in Hai Phong
City for the year of 1989, 1995, 2001, and 2007. Results of index calculation are shown in Table 9.17.
Table 9.17. Sustainability index of mangrove forest in Hai Phong coastal area.
Year
District 1989 1995 2001 2007
Cat Hai 0.76 0.70 0.62 0.35
Duong Kinh 0.42 0.29 0.32 0.29
Do Son - - 0.44 0.63
Hai An 0.72 0.49 0.36 0.19
Kien Thuy - - 0.60 0.24
Thuy Nguyen 0.63 0.35 0.54 0.45
Tien Lang 0.34 0.36 0.49 0.54
Hai Phong Coastal area (total) 0.67 0.54 0.49 0.42
Sustainability index varies from 0 (worse) to 1 (best). Table 9.17 shows that: in 1989,
mangrove forests at Cat Hai, Hai An have highest values of sustainability use index; Duong Kinh
and Tien Lang have worse values. The value of Imsd for the whole of Hai Phong coastal area equal
0.67 – meaning sustainability use.
In 1999; the Imsd of Cat Hai area was still in sustainability while in Hai An and other
districts, Imsu is in less sustainability (<0.5). Imsd calculated for the whole coastal area of Hai Phong
is 0.54, a little reduction in comparison with 1989.
In 2001, values of Imsu in Do Son, Kien Thuy, Tien Lang, Thuy Nguyen have significant
increase: Do Son and Kien Thuy have planted mangroves and Imsd reach 0.44 and 0.6 correlatively.
The value of Imsd for Hai Phong coastal area is 0.49 – belongs to less sustainability.
Till 2007, the overview of sustainability index has completely changed in comparison with
1989. Imsd of Cat Hai, Duong Kinh, Thuy Nguyen, Hai An, Kien Thuy were in less sustainability.
The values of Imsd in Tien Lang, Do Son were continuing to increase and of sustainability use. The
value of Imsd for Hai Phong coastal area in 2007 was 0.44.
- 378 -

Tran Dinh Lan, et al., DPSIR Framework for Case Studies in Hai Phong and Nha Trang, Vietnam.
Figure 9.13. Map of sustainability use of mangrove forests in Hai Phong 1989 – 1995.
Map of sustainability use of mangrove forest in Hai Phong, 1989.
Map of sustainability use of mangrove forest in Hai Phong, 1995.
- 379 -

SECOA, Vol. 6. Environmental Stresses and Resource Use in Coastal Urban and Peri-Urban Regions
Figure 9.14. Map of sustainability use of mangrove forests in Hai Phong 2001-2007.
Map of sustainability use of mangrove forest in Hai Phong, 2001.
Map of sustainability use of mangrove forest in Hai Phong, 2007.
- 380 -

Tran Dinh Lan, et al., DPSIR Framework for Case Studies in Hai Phong and Nha Trang, Vietnam.
4. Sustainability index calculationfor coral reef
Sustainability index for coral reef is calculated by combination of indicators of number of species and coral cover by following equation.
Icsd = ½ (Ic1 + Ic2) (5)
Where as: Ic1: value of indicator of species after annulling unit. Ic2: value of indicator of cover after annulling its dimension
Hai Phong City
Results of index calculation show that: coral reefs at Coc Cheo, Ba Trai Dao, Hang Trai, Tung Ngon, and Cong La had sustainability index of sustainability. Among them, only Coc Cheo had Icsd with high value (0.82), the remains had values close to the sensitive point of sustainability (around 0.5). Ang Tham and Cong Do got the lowest value of Icsd – at unsustainability (Table 9.18).
Table 9.18. Sustainability index for coral reef in Hai Phong. Cong La Ang Tham Ba Trai Dao Hang Trai Cong Do Tung Ngon Coc Cheo
Hai Phong – Ha Long
Ic1 0.53 0.33 0.49 0.28 0.53 0.39 0.83 Ic2 0.58 0.13 0.52 0.83 0.04 0.74 0.82 Icsd 0.56 0.23 0.51 0.56 0.28 0.56 0.82 0.5
Sustainability index of coral reef for the whole area of Hai Phong – Ha Long is averaged of indices from constituent reefs.
Nha Trang
Due to data limitation, sustainability index for coral reef is calculated for the year of 2009 and 2002 at 4 sites of coral reef in Nha Trang Bay. The results show that, coral reef at Hon Tam and Hon Mieu has sustainability index below threshold (Table 9.19).
Table 9.19. Sustainability index of coral reef in Nha Trang Bay. Bai Bang Hon Tam Hon Mun Hon Mieu
Nha Trang Bay Ic1 0.9 0.4 0.7 0.5 Ic2 0.52 0.2 0.6 0.05 Icsd 0.7 0.3 0.6 0.3 0.5
Sustainability index of coral reef for Nha Trang Bay is calculated by averaging of indices from constituent reefs. Its value equals 0.5 – reach sustainability threshold.
Sustainability index for coral reef in both Hai Phong coastal area and Nha Trang Bay achieved 0.5 – sustainability threshold. However, they are very sensitive because they are at line between sustainability and unsustainability. They will be better if they are protected and reserved or become worse if they suffer any minor negative impact.
- 381 -
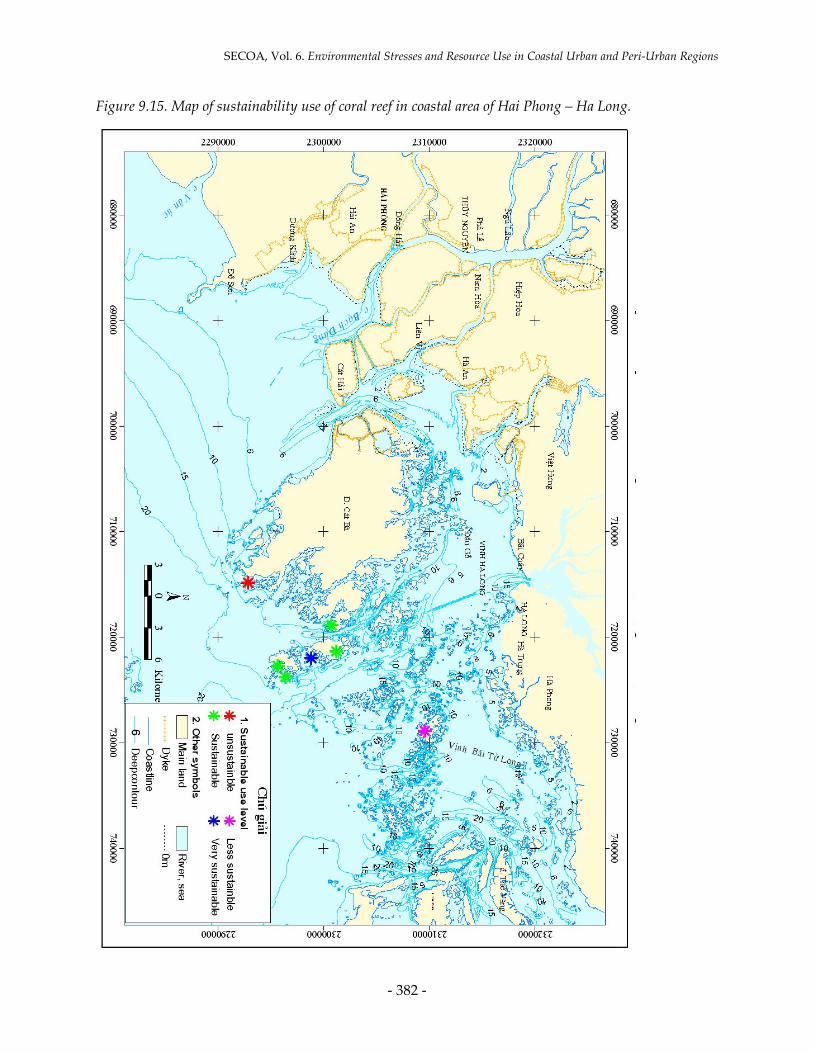
SECOA, Vol. 6. Environmental Stresses and Resource Use in Coastal Urban and Peri-Urban Regions
Figure 9.15. Map of sustainability use of coral reef in coastal area of Hai Phong – Ha Long.
- 382 -

Tran Dinh Lan, et al., DPSIR Framework for Case Studies in Hai Phong and Nha Trang, Vietnam.
Figure 9.16. Map of sustainability use of coral reef in coastal area of Nha Trang.
- 383 -

SECOA, Vol. 6. Environmental Stresses and Resource Use in Coastal Urban and Peri-Urban Regions
- 384 -

CHAPTER 10.
Conclusions: Environmental pressures and
conflicts in urban and peri-urban regions
Tran Dinh Lan

SECOA, Vol. 6. Environmental Stresses and Resource Use in Coastal Urban and Peri-Urban Regions
1. Comparison across the case studies
In relation to the environmental systems/habitats analyzed by the case studies, in most case
studies, natural ecosystems or habitats of coastal wet and dry lands are focused with their most
important roles in case studies. The importance of natural systems or their components is related
to several issues that are socio-economic development, environmental and natural conservation
or simply planning for natural protection due to the commitment of the governments with
international or regional conventions.
Besides of the common points mentioned, there are large differences from case studies to
case studies that can be mainly recognized as follows.
• Difference in types of assessed natural resources: among eight partner countries, assessed
components of natural environment systems in coastal area are different from country to
country. These selected systems are various, from the environmental system of the whole
study area (Belgium case) to some important natural ecosystems (most of case studies) and to
some environmental components and habitats of coastal natural system (cases of Israel, Italy
and the UK). Also, assessed natural systems area changed from coastal wetland ecosystems
and habitats as mangroves, marshlands and coral reefs, sandy beaches to coastal drylands,
vegetation sandy lands, estuary, lagoon, and then to environmental components of the
quality of water and air. These differences are related to the importance of the components of
natural systems in each country and each case study, and the available data and information
that are needed for DPSIR application and analysis.
• Difference in the extent of assessed natural entities: this difference is due to mainly the
limitation of information for DPSIR analysis of each natural entity in study areas. The
extent varied from the whole coastal ecosystem to componential ecosystems of the coastal
ecosystem and more specific to habitats and environmental components. While Belgium
partner has the DPSIR applied for the whole coastal studied area, Vietnam, Portugal,,
Sweden and India have their DPSIR for coastal wetland and dryland ecosystems, Israel
and the UK have taken natural habitats to analyze the DPSIR, and Italy has studied
specific environmental quality and land cover/use.
• Difference in assessed natural resources within a partner country: except for the case studies
of Belgium, Sweden, Israel and the UK, that applied the DPSIR for their components of coastal
natural systems, Vietnam, India and Portugal have selected different natural ecosystems for
their specific case studies. Italy has studied the same part of land use but different
environmental components of water quality and air quality for the two case studies.
- 386 -

Tran Dinh Lan, Conclusions: Environmental pressures and conflicts in urban and peri-urban regions.
2. Synthesis of the most relevant results
2.1. Belgium
Sustainable use assessment using the DPSIR framework is made for the whole coastal ecosystem
which comprises all available ecosystems, including beach, dunes, polders, wetland and forest.
Changes of these coastal ecosystems are closely linked with three main drivers of high density of
population, tourist development and sea port development. These drivers generate the main
pressures on the ecosystems, e.g. environmental pollution, loss of habitats due to expansion of
tourist facility (second home) and eutrophication. Responses from Belgian communities
(authorities, the public etc.) are clearly indicated with environmental quality control, integrated
coastal management, dune decree, biodiversity strategy, and nature protection plan.
2.2. India
The DPSIR framework is applied to assess the state of the mangrove ecosystem in Mumbai and
the marshland ecosystem in Pallikaranai wetland, Chennai. The application of the DPSIR
framework clearly indicates that the ecosystems have changed and degraded substantially under
more pressures caused by socio-economic development in coastal areas. These pressures include
build-up area development, coastal industrial development, salt pans and slums generating
pressures of used area increases and environmental pollution. In order to protect the wetlands in
the two cities, some efforts have been made by government and NGO at different levels,
including coastal regulation zone, wetland conservation, sewage treatment, and mangrove
replantation.
2.3. Israel
The DPSIR analytic framework was used to investigate the causal link between pressure from
urban development and the degradation of natural ecosystems. This link has been illustrated for
two case studies using a sustainability index to chart the changes in this link over time. On the
basis of admittedly limited empirical data, the severe incursion of residential and industrial land
use into sandy coastal zone areas with diverse natural vegetation can have severe consequences.
At the outset, both case study areas were chosen because of their fragile ecological status so the
results are hardly surprising. What is perhaps more concern for alarm is the speed and magnitude
with which this process creates a seemingly irrevocable change taking place over a relatively
short time span (15 years). Responses are the approval of Israel’s National Outline Scheme for the
- 387 -

SECOA, Vol. 6. Environmental Stresses and Resource Use in Coastal Urban and Peri-Urban Regions
Mediterranean Coast (NOS 13) in 1983, Coastal Environmental Protection Law by the Israeli
government in 2004 and the establishment of Coastal Environmental Protection Law by the Israeli
government in 2004.
2.4. Italy
The DPSIR framework is applied for coastal ecosystems focusing on their important components
of land use, water quality and air quality for the two case studies of Italy.
In these case studies, those components as sensitive ones need to be constantly monitored
and protected. The application of the DPSIR framework indicates that the changes, the depletion
of natural resources (land use) in the case studies are under the drivers of urban sprawl for
residential and commercial purposes, new transport infrastructures and the expansion of the
existing ones, such as ports, marinas and the airport, often associated to the development of the
tourist sector, and construction of facilities related to the touristic sector. The degradation of the
environment (the quality of water and air) in case studies is driven by transport facilities (sea port
and airport), industrial activities, urbanization, energy generation (thermo plants), and
agriculture. Responses to negative impacts generated by the drivers include the following of EC
related directives and issuing national directives. Also, air monitoring network has been set up
and a regional program for the improvement of ambient air quality was adopted.
2.5. Portugal
The DPSIR framework is developed for the Portuguese case studies of the Metropolitan Area of
Lisbon (MAL), Eastern Algarve and Madeira. The main driving forces identified are linked to an
increase in population, tourism development, industrial/commercial and transport development
and agricultural development. These driving forces prompt an increase of urban areas; areas
allocated to industrial/commercial and transport units all exerting pressure on natural resources
and ecosystems. These pressures may trigger a change in wetland area, as well as areas of beach,
dunes, sands, estuaries (e.g. MAL) and coastal lagoons (e.g. Eastern Algarve). A change in these
ecological important sites may lead to environmental impacts such as loss and fragmentation of
important habitats. Some of the responses for facing these impacts are linked to regulation and
environmental laws, and more specifically to the case studies, the establishment of the Protected
Areas of Tagus Estuary Natural Reserve (MAL), Ria Formosa Natural Park (Eastern Algarve),
Natural Partial Reserve of Garajau (Madeira) and the Natura 2000 Network sites.
- 388 -

Tran Dinh Lan, Conclusions: Environmental pressures and conflicts in urban and peri-urban regions.
2.6. Sweden
A parallel DPSIR analysis provides a possibility to compare the two municipalities, resulting in
a number of interesting similarities and differences:
Both municipalities are in the “green” urban fringe, attractive for residency and recreation
creating traffic to/from the industrial centre. Both are situated in an old (agri)cultural coastal
landscape, cultivated since prehistoric time, some 5000 years ago, with numerous traces and
archaeological remnants from earlier agricultural activities and settlements. The landscape
includes both high cultural heritage- and high biodiversity values in the remaining man-shaped
agricultural habitats– not the least in relation to coastal wetlands. However, agricultural land has
decreased significantly since the 1950-60ies, among others due to urbanization and expansion of
infrastructure. Both landscapes have been used for recreation since at least the 19th century – in
Vellinge the coastal dune landscape of the Falsterbo peninsula, and in Kungälv the Marstrand
archipelago. In both areas, a transformation from mainly agriculture to horse keeping and other
recreational activities (e.g. golf) is occurring. Both areas are to a large extent already under
protection, including shoreline protection and national interest claims for conservation and
recreation.
Vellinge has a flatter topography and is better suited for large-scale for agricultural
production inland from the sandy shoreline. Most of the coast is already under some kind of
protection scheme – mostly nature reserves. On the Falsterbo peninsula there are further claims
except nature-, culture- and landscape conservation (fisheries, shipping, etc.) and different uses
overlap more, which leads to a higher potential for controversies.
The Malmö area has experienced a fast economic development during the last decade –
due to the Öresund Bridge connecting the cities of Malmö and Copenhagen, linking a megapolis
area of some 2 million people. The Kungälv area on the other hand, remains a small town
although well connected to the city of Gothenburg. There is a settlement pressure for coastal
housing including both permanent and recreational homes also in Kungälv, but much less than
in Vellinge.
Due to the topographic, geological, and oceanographic differences, the predicted effects
of climate change differ considerably. The effects of climate change are less an issue in Kungälv,
whereas the Vellinge case exhibits a number of challenges due to the combination of climate
change and urbanization in the larger region.
- 389 -

SECOA, Vol. 6. Environmental Stresses and Resource Use in Coastal Urban and Peri-Urban Regions
2.7. The United Kingdom
Marshlands have been historically exploited to supply natural resources and have been intensely
altered by human intervention. Therefore, the extent of intertidal environments has greatly
reduced through time, as a consequence of land reclamation, sediment deficit, wave erosion and
sea-level rise. Advances in environmental policy have contributed to reduce the environmental
degradation experienced during most of the 20th century and now potentially impacting
activities are regulated and controlled. In the last two decades, in addition to rising sea levels,
population growth and economic changes were the main drivers of environmental change on the
conservation areas analyzed here. Statutory conservation and the provision of legal instruments
to regulate and control uses have been paramount for reducing loss of habitat and species
biodiversity. However, these habitats are increasingly threatened by coastal squeeze, a
consequence of coastal development and rising sea levels. In the medium to long- term, coastal
squeeze is likely to be the main threat causing the decline of intertidal habitats and increasing
conflict between environmental conservation and flood risk management. Habitat and
biodiversity loss affect the delivery of ecosystem services, causing environmental and economic
impacts that cannot always be adequately measured. Management realignment is a preferred
management option at some sites, but the need to maintain flood protection in developed areas
might result in the continued loss of intertidal habitats. In these cases, compensatory habitat
recreation is usually required; however, suitable locations are scarce and not always available
locally. Six Sites of Special Scientific Interest (SSSI) areas dominated by intertidal habitats were
analyzed here using the DPSIR framework, two are located in Portsmouth (Portsmouth and
Langstone Harbours) and four in the Thames Gateway (Benfleet Marshes, South Thames Estuary,
Medway Estuary and the Swale in the Thames Gateway). Based on the reduction of a number of
pressures and impacts observed in recent decades and the improvement of overall environmental
quality, all six SSSI are considered to be sustainable in the short and medium term. In the future,
it is possible that the impacts of climate change, especially sea-level rise, might result in further
reduction in the area and/or quality of intertidal habitats. Further integration between
conservation and planning objectives (both for urban development and management of flood
risk) at local level is needed to support the long-term sustainability of intertidal habitats.
- 390 -

Tran Dinh Lan, Conclusions: Environmental pressures and conflicts in urban and peri-urban regions.
2.8. Vietnam
The DPSIR framework applied for the two ecosystems of Hai Phong (mangroves and coral reefs)
and coral reef ecosystem in Nha Trang show that the ecosystems have been changed and got
degraded under more pressures caused by socio-economic development in coastal and marine
areas, though efforts from governments at all levels have been made. The changes and the
degradation of the ecosystems in the case studies of Hai Phong and Nha Trang have been under
the pressures of the increasing environmental pollution and conversion of coastal natural habitats
into man-made ones, mainly due to the activities of aquaculture, development of sea ports and
associated industrial zones, massive tourism, urbanization and deforestation. Consequently,
biodiversity, nursery grounds, number of biological species and coral cover have been decreased
and lost. Although sharing mentioned similarities in pressures, drivers and impacts, there are
some differences related to pressures on the coral ecosystems in Hai Phong and Nha Trang. The
higher pressures from massive tourism and urbanization have been recognized in Nha Trang
while deforestation impacts from hinterland seem to be clearer in Hai Phong. Climate change,
especially sea level rise seem to be very serious in Hai Phong case study in the future. This will
make the coastal wetland ecosystem changed in some complicated scenarios.
Responses to the degradation of these valuable ecosystems, several actions have been
taken by the central government of Viet Nam such as issuing the Law of Environment Protection
(1994, 2005), Biodiversity Action Plan (BAP), Law of Fisheries and under law related regulations;
Establishment of Marine Protected Area (MPA) system with some pilot MPA implemented,
including Nha Trang Bay MPA, Cat Ba biosphere reserve. At local authorities, Bans on coral
collection were issued by Khanh Hoa provinces that Nha Trang city belongs to and Hai Phong
City. Practical actions in the two case studies such as ecological compensation and eco-tourism
are now at the stage of study with several related projects funded by international, national and
local organizations and governments.
3. Reflections on the use of the DPSIR model
The DPSIR framework analysis for each natural entity in case studies shows the similarity in
each element of the framework, e.g. D, P, S, I and R. Common driving forces (Drivers - D) that
have driven pressures on assessed natural entities in most case studies are from the development
of industry and transport, and urbanization that is related to population growth and tourism
development. These common drivers are present not only in developing countries as India and
Vietnam but also in developed ones in Europe. Other natural factors of common drivers include
- 391 -

SECOA, Vol. 6. Environmental Stresses and Resource Use in Coastal Urban and Peri-Urban Regions
climate change and sea level rise that are predicted to be very serious in some countries as
Vietnam. Driven by common and different driving forces, most partner countries’ case studies
are under similar pressures (P) of the increase of manmade habitats, including ports (sea port and
airport), tourism facilities, residence area and etc., and pollution increase with the presence and
concentration of pollutants to water, air and soil. Although not all case studies under the
pressures have got the same states (S) and impacts (I), most of case studies have got decreased in
the quality of assessed natural entities and biodiversity.
Beside some similarities, there are several differences in each element of the DPSIR frame
among case studies. The differences are mainly due to the differences that area pointed out in
Item 1, and they can be summarized as follows.
• Difference among partner countries: although sharing some common characteristics as
mentioned earlier, the features of the elements of DPSIR are different from country to
country. In some countries, driving forces and pressures can be specifically identified
(Belgium, Portugal). However, in others, these elements (D and P) are recognized at scale
of socio-economic sectors. It is difficult to analyze these elements in more details due to
lack of information. Some details of states (S) and impacts (I) of assessed natural entities
under pressures are not the same from country to country, even under the same pressures.
The altitude of changes and loss or decrease of assessed natural entities is also different.
• Difference between case studies within a partner country is mainly at detail levels of each
element of the DPSIR.
In relation to responses from partner countries, it can be seen that the similarity and
difference in two groups of countries are European countries and Asian countries. Actions for
protection of the coastal environment and conservation of coastal natural ecosystems and
components are the two common responses that all partner countries have taken. Responses from
European countries are indicated with the commitment of these countries with relevant
international and regional (EU) legislations and actions, and with issuing their own national laws
and regulation and actions. Asian countries have ratified some relevant international legislations
and actions, but mainly developed and issued their national laws and regulations and institution
arrangement, and these countries have received the aids from developing countries, including
European ones to protect, conserve their natural ecosystems and components.
On the application of the DPSIR frameworks, recent studies on DPSIR framework
analysis for assessment of any components or systems worldwide have been more developed
- 392 -

Tran Dinh Lan, Conclusions: Environmental pressures and conflicts in urban and peri-urban regions.
and diversified, e.g. land use and soil degradation (Porta & Poch 2011), biodiversity changes
(Maxim et al. 2007, Svarstad et al. 2007), natural entities (Mourão et al. 2004, Lan 2009) or the
whole environment degradation (Agyemang et al. 2007, Marsili-Libelli et al. 2004) and climate
change (Garnier 2010). Particularly, with the fast development of Geographical Information
System (GIS) tool, DPSIR analysis nowadays in combination with GIS presents some very good
outputs that are much supportive to policy and decision making processes (Mourão et al. 2004).
Within SECOA studies, DPSIR approaches are applied for the whole coastal ecosystems
or specific ecosystems (cases of Belgium, India, Portugal, Sweden and Vietnam), coastal landuse
and landcover (cases of Israel), coastal environments (cases of Italy) and coastal habitats (cases of
the UK), and dealt with various periods of time (past, present and future focusing on climate
change). Although applying for sustainable use assessment of different coastal entities, DPSIR
analysis of the SECOA case studies follows a general framework and deeper development to
build sustainability indices and to map sustainability of assessed entities (Figure 10-1), except for
the cases of Sweden and the UK.
Figure 10.1. General flow chart of sustainable use assessment of coastal natural resources in SECOA project
case studies.
- 393 -

SECOA, Vol. 6. Environmental Stresses and Resource Use in Coastal Urban and Peri-Urban Regions
Coastal natural resources in case studies of both countries of Sweden and the UK were considered as of sustainable use. Therefore, the approach of sustainability assessment was in different from others within SECOA project. For case studies of Sweden, sustainability assessment focused on the impacts of climate change and human activities on specific coastal areas in the future. Then analysis of DPSIR framework was directly used for the assessment without developing sustainability index and mapping. GIS tool was employed to produce maps of some scenarios of climate change and human development in the future. For case studies of the UK, DPSIR framework was analyzed to develop relative indicators of coastal habitat sustainability then to develop maps of comparative sustainability among sites of habitats.
In short, the DPSIR framework employed in SECOA case studies reflects also the diversity in application of the framework to assess the use of natural resources and environments in coastal areas.
4. References
Agyemang I., McDonald A. & Carver S. 2007. Natural Resources Forum 31 (2007) 212–225.
Garnier M. 2010. WP2 Analysis and synthesis of water related impacts. Bridging the gap between
adaptation strategies of climate change impacts and European water policies. Midterm
workshop, Bratislava, May 26-28 2010.
Lan T.D. 2009. Assessment of some marine ecosystems using sustainable utilization indicators in Hai
Phong - Quang Ninh coastal area, Vietnam. Aquatic Ecosystem Health & Management, Taylor
& Francis, 12 (3), p. 243-248.
Marsili-Libelli S., Betti F. & Cavalieri S. 2004. Introducing River Modeling in the Implementation of the
DPSIR Scheme of the Water Framework Directive. Paper presented at the iEMSs 2004
International Congress: "Complexity and Integrated Resources Management" International
Environmental Modelling and Software Society, Osnabrueck, Germany, June 2004.
Maxim L., Spangenberg J.H. & O’Connor M. 2007. Analysis of risks for biodiversity using the DPSIR
framework. Cahiers du C3ED No.2007-02. 25p.
Mourão I., Caeiro S., Costa M.H., Ramos T.B. & Painho M. 2004. Application of the DPSIR model to the
Sado Estuary in a GIS context – Social and Economical Pressures. In Toppen, F., Prastacos, P.
(Ed.) Proceedings of 7th Conference on Geographic Information Science. Crete University Press.
AGILE. 2004, 29 April-1 May, Crete, Greece, p.391 – 402.
Porta J. & Poch R.M. 2011. DPSIR analysis of land and soil degradation in response to changes in land
use. SISS. Spanish Journal of Soil Science, Volume 1, Issue 1. p. 100-115.
Svarstad H., Peterrsen L.K, Rothman D., Siepel H. & Watzold F. 2007. Discursive biases of the environmental
research framework DPSIR, Land Use Policy (2007), doi:10.1016/j.landusepol.2007.03.005.
- 394 -

CHAPTER 11.
Approach to Sustainable Exploitation of Natural Resources
Windpower Development in Coastal Areas –
Social and Environmental Effects
Karl Bruckmeier and Tran Dinh Lan

SECOA, Vol. 6. Environmental Stresses and Resource Use in Coastal Urban and Peri-Urban Regions
1. Introduction – Development and impacts of wind energy systems
The social impacts of windpower, single turbines and windfarms, are closely connected with
the environmental impacts. In the established methodologies of social and environmental
impact assessment (SIA, EIA: see e.g. Barrow 1996) social impacts are understood as changes
affecting the ways of life of people, their culture and community by a development project.
Environmental impacts include pollution and other negative impacts on ecosystems, their
functions and services. In the following focus is laid on social impacts classified in broad
groups of sociocultural impacts, political and economic impacts.
The development of windpower and of other renewable energy sources is a core
component of the transformation of national energy systems towards more socially,
economically and environmentally sustainable forms. Coastal areas are of interest for wind
energy generation as there are often good natural conditions. However, contrasting interests
cause conflicts about the location of wind turbines or large wind energy parks and about
places and areas suitable for windpower. These conflicts hindered or delayed the
establishment of windpower systems. Social and environmental impact assessments (SIA,
EIA) may have included analyses of transformation of conflicts, consensus building and
development of energy systems more generally; but EIA and SIA studies accompanying the
planning and establishment of windpower systems have not always helped to find ways to
mitigate the conflicts. Although windpower is found in many coastal areas the identification
of suitable places requires further on a complicated matching of conflicting interests of the
stakeholders involved and the public interests. With conflicts about land use for windpower
happening more often it can be expected that more attention is paid to conflict analysis and
mitigation in future.
Presently visible limits of industrial energy sources (see e.g. peak oil debate) and the
global climate change brought in recent years intensive search for new energy sources and
development of new energy conversion technologies that result in significant changes in
natural resource use, including land use, in rural and urban coastal areas. The development
of windpower in terms of economic investment, number of turbines, and the percentage of
energy generated from wind advances slowly in many countries. But the energy targets of
the EU indicate for the future accelerated development of windpower. Changes of resource
and energy use that come with windpower as with other forms of the renewables, e.g.
bioenergy production evoke in the introduction phase new conflicts between alternative
- 396 -

K. Bruckmeier, T. D. Lan, Approach to Sustainable Exploitation of Natural Resources Windpower Development in Coastal Areas
forms of land use: e.g. between food production, bioenergy or windpower production,
recreation, nature protection, housing, industrial development. In future there may be also
conflicts about priorities given to single energy sources in the national energy systems, about
subsidizing windpower development, and about the velocity of developing energy from
windpower and other renewables.
Windpower as renewable energy differs from bioenergy production which requires
fertile land for producing energy crops and can evoke conflicts between food and energy
production. Wind energy does not require agricultural land, is even not land-bound as the
development of offshore wind parks shows. But still the social dynamics and interests in the
conflicts about windpower are complex, as are the ecological dimensions. Windpower
development in coastal areas (onshore and offshore windparks) requires matching of
differing interests in land use for production, housing, recreation, nature protection and in
coastal waters it requires to deal with differing interests for fishing, aquaculture, and
recreational use of the water. In the context of the SECOA-theme of urban development
windpower appears as a paradigmatic example of the interaction of rural and urban
development in coastal areas and different interests related: the energy generated in exurban,
rural areas and offshore is not mainly for rural users. The social complexity of the conflicts
involved can be described in terms of rural and urban actors and their interests; the ecological
complexity in terms of ecosystem functions and services.¨
The conflicts developing with the location of wind turbines and windpower plants
tend to overshadow the positive effects of windpower systems. As main advantages of the
energy source can be seen:
• windpower is a non-exhaustible energy source that has no price, except for the
conversion technology;
• it does not generate harmful emissions, residues or greenhouse gases;
• its operation does not need water and does not pollute water;
• it works in every climate, and
• unlike solar energy, it can work day and night.
Negative environmental impacts of windpower systems (e.g. noise, disturbing radio
communication, disturbing birds and fish) seem to be limited. Windpower development has
hitherto often evoked conflicts about the aesthetic of wind turbines and their location close
- 397 -

SECOA, Vol. 6. Environmental Stresses and Resource Use in Coastal Urban and Peri-Urban Regions
to inhabited areas; but, as known so far, it seems to evoke less negative environmental and
social impacts than bioenergy production on agricultural land. Life-cycle analyses and impact
studies of bioenergy production revealed a number of – non-intended – negative
environmental consequences of bioenergy; it may not be as “green and clean” as it may have
been imagined when the ideas developed. Such comparative advantages and other reasons
seem to make windpower in Europe the main component for the renewal of national energy
systems in response to long-term social and ecosystem changes as the vision for 2030 shows:
“Wind energy has the potential to be the cheapest power source in Europe, but like
any emerging technology, it faces significant barriers. The existing market has developed
around heavily subsidized and monopolistically-managed energy sources with very different
characteristics: if wind energy is to penetrate European supply to a significant degree, its
development must be viewed strategically. ... A strong wind energy sector does not only
mean reduced CO2, cleaner air, and secure biodiversity. Sustainable economic growth,
reduced energy import dependence, high quality jobs, technology development, global
competitiveness, and European industrial and research leadership – wind is in the rare
position of being able to satisfy all these requirements.” (TPWind Advisory Council 2006, p.
5)
Development of new energy regimes implies technical as well social changes,
especially changes of life- and consumption styles that are part of the transition to
sustainability. In this process the mitigation of manifold conflicts is required. The conflicts
about windpower location cannot be avoided, but need to be studied to find solutions that
allow for integration of diverging interests and for political strategies to change energy
systems in the interests of all members of society.
- 398 -

K. Bruckmeier, T. D. Lan, Approach to Sustainable Exploitation of Natural Resources Windpower Development in Coastal Areas
2. The state of windpower development in the coastal areas
studied in SECOA
Coastal areas are among the priority areas for windpower location. The reasons are: the
aerodynamic preconditions for windpower establishment (frequency, velocity and strength of
winds) are favourable in many coastal areas, also the possibilities of locating wind turbines (on
land and in the water, with offshore location offering possibilities of large wind parks). In contrast
to this general picture windpower development is presently developed only in some study areas
of the SECOA project. This can be a casual result, a specificity of the local areas chosen for study,
or there may be more systematic reasons and a more differentiated picture of windpower
development (why, where, when, how). To investigate the situations given in the SECOA study
areas we asked the following questions to the national teams:
1. What is the state of windpower development/planning in your case study areas
(windpower at coastal land or in coastal waters)?
2. If there is no windpower existing or planned in your case study areas: what are the
reasons according to your knowledge (e.g. legal, economic, technical, conflicting interests
or conflicts)?
3. Is windpower established or planned in other coastal areas in your country or inside the
country? (please estimate also the dimensions and significance of windpower as part of
the national energy system)
4. How do you see the significance and role of windpower in future coastal development a)
in your case study areas b) in other parts of the national coast?
5. Are there important documents or publications about windpower in coastal development
in your country (in the national language or in English; if yes: please give some important
recent sources)?
Responses from the teams are summarized in Table 11.1 and thereafter discussed in more detail
- 399 -
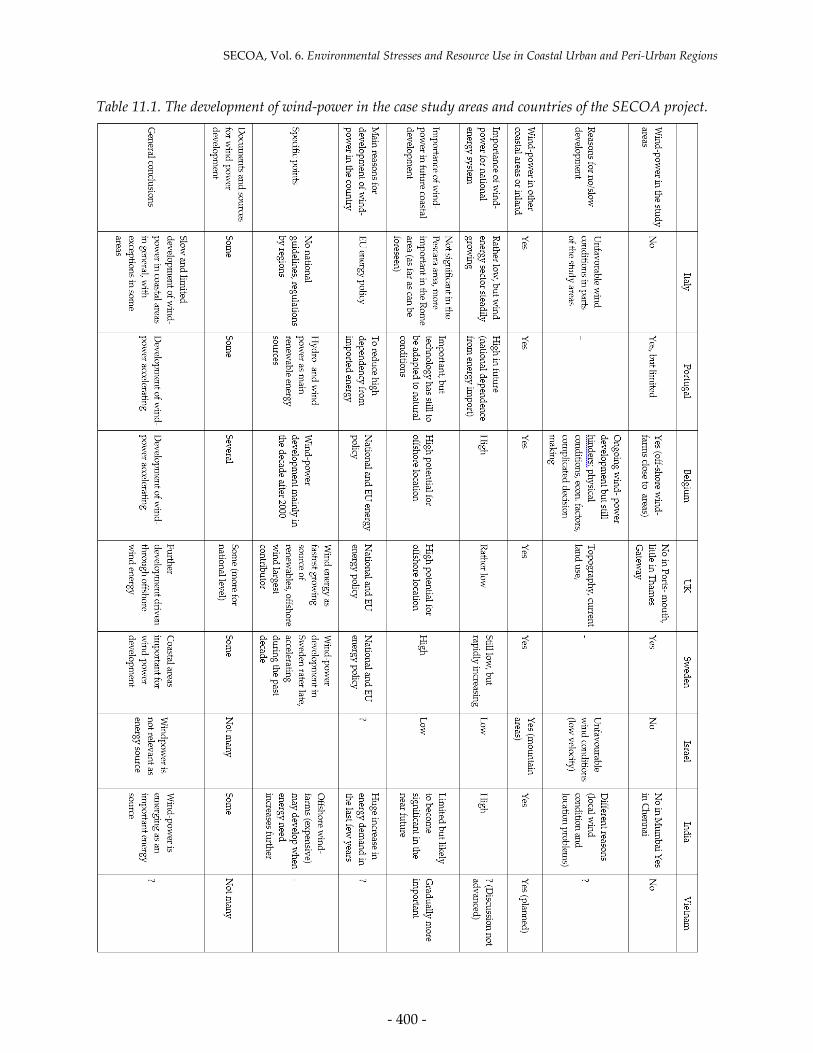
SECOA, Vol. 6. Environmental Stresses and Resource Use in Coastal Urban and Peri-Urban Regions
Table 11.1. The development of wind-power in the case study areas and countries of the SECOA project.
- 400 -

K. Bruckmeier, T. D. Lan, Approach to Sustainable Exploitation of Natural Resources Windpower Development in Coastal Areas
The answers can be summarized as follows: Wind energy systems are missing or
insignificant in most of the coastal study areas in the SECOA project, but the situation is specific
for every area and country and can be understood only when seen in the larger context of energy
policy of the respective country:
1. In Italy there is presently no windpower in the coastal study areas, mainly due to
unfavorable wind conditions in parts of the study areas, but windpower develops in
coastal areas and inland. The present trend in developing windpower as part of the
national energy system it is slow but steady growth. The role of windpower will probably
not been significant in most coastal areas in future.
2. In Portugal wind power has become an important energy source since the year 2000 and
is rapidly developing, in coastal and inland areas (especially in mountain areas in
Northern Portugal). The national aims of energy development indicate high ambitions in
the use of renewable energy sources: it has 45% of national electricity produced, until 2020
31% of final energy consumption (and for electricity 60%). The main driver for
development of windpower and other renewable energy sources in Portugal seems the
scarcity of important energy sources (oil, coal, gas) in the country and the high
dependence for foreign energy sources and import (83% in 2008).
3. In Belgium the development of wind energy happened mainly in the past decade, and
offshore locations will probably be most important (difficulty of locating windpower in
densely populated areas, that is: in large parts of the country).
4. In the UK windpower development is insignificant in the study areas, although in other
parts of the coast and inland windpower development is ongoing, with a somewhat lower
target (compared to EU objectives) to generate until 2020 15% of energy from renewables,
which implies that then 35-40% of electricity should be produced from renewable sources.
In general the natural conditions for windpower location at the coast, especially offshore,
are good and there is a high potential for future development of windpower.
5. In Sweden the development of windpower, in coastal as in inland areas, has for a long
time been insignificant, only in recent years development accelerated. Today windpower
is established or planned in almost all coastal areas and in inland areas, which shows a
significant change of interest among the stakeholders, at national and local levels. Coastal
areas seem of special significance for the future development of windpower, for their
good natural conditions for windpower location as for political reasons (to achieve the
national goal until 2020: 20% of national electricity generation from windpower).
- 401 -

SECOA, Vol. 6. Environmental Stresses and Resource Use in Coastal Urban and Peri-Urban Regions
6. In Israel the development of windpower in coastal areas as in the rest of the country is
insignificant (presently 0.5 % of electricity generated). The available feasibility studies
indicate that only in some mountain areas the development of windpower seems possible
or economically viable. Reasons for its insignificance are natural ones (not enough wind
speed, lack of adequate open areas, unsuitable vegetation cover). Suitable natural
conditions may be given in areas where other interests dominate (e.g. protected areas) or
political ones (e.g. army and defense considerations).
7. In India windpower is up to now insignificant in the study areas (only one windfarm in
Chennai) and will probably not develop quickly there, although windpower is developed
in other coastal areas and in general India is among the countries with high windpower
generation (ranking number four in global comparison). The reasons for no or slow
development of windpower in some coastal areas as the chosen study areas are mainly
natural ones (insufficient wind, difficulties to find suitable locations in or around city
areas).
8. In Vietnam windpower is not existent in the coastal study areas, planned in other coastal
areas, but up to now insignificant in general in the national energy system. It is not yet
clear when and how fast windpower will develop as a component of the national energy
system.
For the non-European countries in SECOA, windpower development is more nationally
dominated and differing between the countries. For Israel with a small territory and not many
favorable natural conditions wind power seems insignificant also in future. For India with a large
territory and heterogeneous conditions the dynamics of windpower development seem more that
of a national strategy and will develop in dependence from growing energy needs. For Vietnam
the significance of windpower is limited up to now; although there is a plan for windpower
development in some coastal provinces, the future development cannot yet been foreseen.
For the European countries in SECOA, all members of the EU, there are also significant
differences between countries, but energy policy is more directed and driven by the EU energy
and sustainability targets that have in recent years supported the development of energy from
renewable sources. The European Council adopted in 2007 new energy objectives that project the
part of renewable energy in European countries to achieve 20% by 2020. The objective was
then included in the Renewables Directive of the EU from December 2008. In the scenarios1 discussed by the European Commission one finds projections of high growth rates.
- 402 -

K. Bruckmeier, T. D. Lan, Approach to Sustainable Exploitation of Natural Resources Windpower Development in Coastal Areas
3. Remarks from the answers
That windpower is not or only to a limited degree developed in many of the study areas chosen
for the SECOA project is not indicative of windpower development in the respective country.
Also in the countries where no windpower was found in the study areas windpower
development happens in other areas and is an established national policy. The main reasons for
selective development seem to be (a) the different significance given to windpower development
in national energy policies and (b) the location question which includes as well environmental
factors (sufficient natural conditions) as social factors (interest conflicts, designation of suitable
areas). The situation given differs strongly from region to region and country to country. Between
the European and non-European countries there are some important differences: the EU members
are subject to EU policies not only national ones in their future development of windpower and
their national energy systems. Furthermore, the energy systems of EU countries are networked
(energy import/export between the EU countries).
• Regarding the social components: Windpower development is not mainly dependent
from natural preconditions (windpower systems are not found in all places where the
natural conditions such as wind velocity etc., are favourable). More important are social
conditions and interests and a policy supporting windpower development. The local
interests for windpower are important but not sufficient to establish windpower; broader
support is required - through national policies, economic interests in windpower by
energy enterprises, and acceptance of windpower by the population. The location of
windpower systems is socially seen a question of successful resolving of interest conflicts
and one about direct and indirect costs of windpower systems (see below).
• Regarding the environmental components: An important point is that energy production
requires space and future development of energy systems is more dependent on land use
than the solutions with the dominant industrial systems that depend from non- renewable
energy. Also for these systems is land use relevant, but it is more invisible or locally
concentrated (e.g. coal mining, oil drilling). In difference to other forms of renewable
energy sources as bioenergy windpower seems less environmentally harmful and more
flexible with regard to location.
• Regarding the technical components: Windpower development in terms of technology
development has advanced, with successive differentiation of technological solutions that
take into account some of the negative impacts found. Further technology development
- 403 -

SECOA, Vol. 6. Environmental Stresses and Resource Use in Coastal Urban and Peri-Urban Regions
and adaptation to local conditions can be expected. There are smaller and larger wind
turbines in use, and the organization varies from single turbines and individual use to
large windparks producing for regional and supra-regional electricity nets. Which
technology and organization form is used in a specific areas is dependent on a variety of
natural conditions and interests. Controversies about large or small turbines, individual
turbines or large windparks may not be generalized, are rather dependent on specific
interests (e.g. that energy enterprises favour large wind parks and offshore location,
expecting the resistance would be less there and large scale system fit better their
economic and investment interests). The technology allows for solutions adapted to the
local situation – size and form of wind turbines can be adapted to the specific natural
conditions of a location area.
• Regarding the development and composition of energy systems: The future development
of energy systems seems, also with the sustainability driven option for renewable sources,
is open and dependent on joint learning of energy actors – consumers, enterprises,
governments, social movements and scientists. The complicated situation with the
development of bioenergy seems to have a non-intended effect for wind energy
development. It may be that the more controversial bioenergy discussion gives for wind
energy better chances to become for the near future a favoured energy candidate for
which more and more actors opt. But the limits of wind power should also be discussed
critically; how much of the total energy production is possible through windpower is an
ongoing debate.
4. An exemplary windpower conflict from the Swedish West Coast
Windpower development is not only a question of finding more and more acceptance by more
and more actors. The way towards its broad social acceptance is one with continuous mitigation
of interest conflicts about land use. Conflict analysis and mitigation are a hitherto neglected
component of social impact assessment. In the SECOA project not many detailed case studies
about windpower location are to be expected. Supplementary to the answers from the different
study areas we give a summarizing description of one windpower conflict from a SECOA study
to illustrate the social dynamics in the process of windpower development. The conflict in
Kungsbacka, metropolitan area of Gothenburg (see Böhler et al., 2011), is a local conflict in its
territorial dimensions and its stakeholders that have specific interests in the use of local land (only
- 404 -

K. Bruckmeier, T. D. Lan, Approach to Sustainable Exploitation of Natural Resources Windpower Development in Coastal Areas
few windpower plants, no big wind energy park). According to the interests of local stakeholders
the conflict is somewhat complicated. It had for some time a classical NIMBY- component as
many conflicts about windpower establishment and location, in Sweden and elsewhere:
windpower can be established everywhere but “Not In My BackYard” (NIMBY). That is, people
are opposing the location of windpower close to where they live. Proposals for locating wind
power evoke conflicts with other inhabitants, users and owners of land. The number and size of
wind turbines may also be a source of conflict – small wind turbines for individual use may evoke
less conflict than large ones and large windpower parks.
The NIMBY component is losing significance in this case where a redefinition of interests
regarding windpower happened in the years when this conflict was unfolding. In former trials
to locate windpower, in this area as in other ones along the Swedish West coast, windpower
planning and development has stuck and never advanced to the final establishment of
windpower plants. It was already stopped or suppressed before it unfolded into more solution-
demanding activities and decisions. Now the planning succeeded and the conflict ended with a
decision to establish windpower. This indicates a significant change of interests among various
stakeholders: a breakthrough towards renewable energy sources, not only at local levels. In this
conflict case - as in others known from European countries in recent years - it is important that
the interests of energy providers and economic firms turned towards windpower, creating a
historically new situation that is more favourable for windpower interests. The dominant
interest-component of the conflict (interests of sustainable resource use against a variety of other
interests – including such of other use of the landscape, but also nature and species protection
interests) is linked with a variety of values and similar, more abstract components of worldviews.
But the conflict should no longer be seen as a value conflict mainly: it has advanced from more
vaguely defined values to more specific and clearly articulated interests of stakeholders, and at
this specific level of interest definition it turned out to be solvable. The conflict is no longer a
chronic one and the duration of the conflict seems to have moved towards a speeding up of
solution efforts and achievements (compared to earlier attempts to establish windpower). The
achievement of solutions for a certain time may influence the course of further windpower
conflicts in the area and elsewhere.
The typological characterization of the conflict in comparison with other windpower and
resource use conflicts analyzed in the Swedish study areas supports the impression that local
resource use conflicts are complex in terms of issues and interests, causes, stages and scale. They
become multi-scale conflicts that imply national and international conflict components although
- 405 -

SECOA, Vol. 6. Environmental Stresses and Resource Use in Coastal Urban and Peri-Urban Regions
these may not be manifest or may not be perceived by the actors involved in the local conflict and
its solution trials. The conflicts analyzed show dilemmas of sustainable development and climate
change adaptation that may become more relevant in future in coastal areas.
However, it is difficult to identify a conflict as a coastal conflict by its very nature.
Conflicts in coastal areas about the use of natural resources and especially about new energy
production from renewable energy sources are rather a combination of different resource use
conflicts that can happen in coastal and inland areas. Only with regard to the climate change and
effects of sea level rise and inundations, there seem to be specific coastal conflicts. The coast is
attractive for settlement, recreation, and in urban areas also for industrial and economic
development (e.g. connected to harbours), and these are main social factors to explain the
intensity of coastal resource use conflicts. National level priorities exercise pressure to keep the
coast clear or limit certain forms of resource use to allow access to beaches for everyone. When
flooded areas enlarge and extreme weather situations happen more often along the coast, the
scenic quality of coastal landscapes may be re-valued in terms of residential decisions and its
attraction for residential purposes may reduce. The mitigation of potential effects of climate
change may require resettlement and migration away from the coast. However, until now, new
residents move into coastal areas. In the area of Gothenburg, this implies that within the city
boundaries new forms of concentrated settlement are sought, e.g. through the transformation of
formerly industrially or commercially used areas for housing.
5. Windpower as part of national energy systems
– long term perspectives
Conflict analysis and mitigation regarding the development and location of wind energy systems
are not interesting for reasons of conflict settlement alone. More important is that conflicts and
their solutions become part of the long-term processes of searching solutions for natural resource
use in terms of sustainable development. A series of long-term social and ecosystem changes is
visible in the development of national energy systems of which the conflicts about new energy
forms are part. Future energy regimes are connected with the “great transition” to sustainability,
but require mitigation of manifold conflicts to achieve that goal. The quantity of renewable
energy sources in national energy systems in European countries is still limited, but as well
national governments as economic actors have redefined their interests for development of
renewable, including windpower systems. This shows a breakthrough in the development of
energy systems that have for long time been dominated by the components of industrial energy
- 406 -

K. Bruckmeier, T. D. Lan, Approach to Sustainable Exploitation of Natural Resources Windpower Development in Coastal Areas
regimes – with the dominant energy sources of coal, oil, gas, and more recently nuclear energy.
Although non-renewable industrial energy resources may already be characterized as out-
phasing, the transformation of energy systems with their different components is a slow and long
process of many decades. The transformation is not controlled by local, regional or national actors
alone, but is influenced by the global economy and its development in dependence from
availability of energy resources (and whether these are payable), although formally and legally
seen energy systems appear as national ones. Also in the EU where more and more regulation
happens at supra-national level, energy development is still dependent from national priorities
and interests. In the final analysis all energy systems are part of a global energy regime that is
today still dominated by industrial, non-renewable energy sources and economic and political
interests concentrated on these conventional energy sources. What is going on presently at
European and EU levels is the beginning of a multi-scale process of changing energy systems,
mainly pushed by the overarching aims of transitions towards sustainability. Whereas the goals
of sustainable development are widely accepted and implemented in public policies - most
countries have national strategies for sustainable development - the transformation of energy
systems as part of this process seems to be more complicated. Although certain countries (e.g.
Canada) have high aspirations to reduce energy consumption and develop renewable energy
sources, no country has so far succeeded to develop a sustainable energy system with
considerable reduction in energy consumption.
With the difficulties of developing future energy systems the interests around windpower
change significantly in present years, especially in European countries. For long time windpower
development was suggested by a limited number of environmental actors mainly, with
arguments for the unlimited availability of the energy source and that it is not polluting the
environment. However, with the advances in establishing windpower, the environmental as the
social impacts and the interests involved are changing. Windpower is no longer an exceptional
technology or a future option, but has become a significant component of national energy systems
and with that the economic interests changed – these were not visible as long as windpower was
a minor or exceptional energy technology. Today windpower is on the way to become a relevant
economic activity, the technology as well the economic organization of windpower systems have
developed significantly and differentiated, and the effects of windpower facilities are known
better.
In Europe the development of windpower systems shows differences – in some countries
e.g. Denmark, Spain and Germany windpower played an important role and the development
- 407 -

SECOA, Vol. 6. Environmental Stresses and Resource Use in Coastal Urban and Peri-Urban Regions
started longer time ago; in other areas, as in Sweden, advances are rather slow. Denmark has
played a pioneering role in the development of windpower technology and in the economic
organization in two forms – in private company based and in co-operative forms where local
citizen own the windpower plants. Looking back at the prior development does, however, not
show all the future problems of windpower development.
Location debate. In the discussion about onshore/offshore location of windpower systems
in Europe further arguments than interest conflicts are discussed, especially the direct and
indirect costs of windpower systems.
“A massive development of offshore windmill farms has been planned along the European coastline.
This raises important questions about the possible effects on the marine environment. Effects during
the construction period may be minimized to a negligible impact if care is taken to avoid areas
containing rare habitats or species. Disturbance caused by noise, vibrations, and electromagnetic
fields during windmill operation may, with present knowledge, be considered to be of minor
importance to the marine environment. The reef effect (i.e. addition of a hard substratum), is believed
to cause the largest impact on the marine environment and at different scales: the micro scale, which
involves material, texture, and heterogeneity of the foundation material; the meso scale, which
involves the revetments and scour protection; and the macro scale, which encompasses the level of
the entire windmill farm. Effects on these scales are discussed in relation to results obtained from
natural habitats, artificial reefs, and other man- made constructions at sea.” (Petersen and Malm 2006,
75)
Regarding the costs for location of windpower offshore or onshore the following results
can be found from a recent literature review: “The optimal location for the future wind power
development is naturally a function of many different variables, which jointly rank one location
compared with other locations. Some of these variables relate to capital costs of wind power
development. It is assessed that on-land installation costs in the UK are between costs 585 and
800 £/kW and 1200 and 1600 £/kW offshore. Everything else being equal, capital costs of offshore
locations are almost twice as high compared with on-land costs. If the offshore wind farm is
located on deep water and at large distances from the shore, the offshore capital costs might be
even larger. These direct costs indicate that on-land development from a purely capital costs of
view might be the most economically attractive solution, even when accounting for better
weather regimes offshore. However, the potential differences in external costs between different
on-land and offshore might change this relation.... potentially, the reduction in environmental
costs associated with locating offshore wind farms at relatively large distances might outweigh
the capital cost increase compared with on-land development, everything else being equal.
However, as mentioned, these values most likely will be dependent on location dependent. ... As
- 408 -

K. Bruckmeier, T. D. Lan, Approach to Sustainable Exploitation of Natural Resources Windpower Development in Coastal Areas
based on the review of the literature available, the stated preferences for location of wind power
development point towards that the environmental costs associated with offshore wind farms
appear to be smaller compared with the environmental costs of on-land wind farms/turbines.
Even though these preferences are sensitive with regard to the specific geographical locations,
the results also point towards that the environmental costs of offshore wind farms can be further
reduced by locating the wind farms at large distance from the coast, though the benefits of doing
so will be marginally decreasing.” (Ladenburg 2009, 179-180).
The ratio of cost benefit analysis may still not give a sole and rational basis for decisions
about location of windpower, beyond the basic conditions of favorable aerodynamic conditions
and on land or offshore location. The points regarding social impacts – heterogeneous interests
and views, conflicts and environmental impacts - noise, disturbing birds and fish - are manifold
and require manifold criteria in location and investment decisions. As with other forms of energy
generation, there is also a significant influence of subsidies, as well for research and development
of the technology, as for subsidies in the use of the technology.
For the long-term development of wind energy systems the following considerations
seem to be important
• More important than technology development, planning of location and establishment of
wind turbines seems to be: to find social acceptance of windpower, e.g. through
participatory planning, citizen, juries, social and environmental impact assessment.
• The question of how to use space – on land and in the sea – comes back in the debate of
energy generation. The debate about location of windpower systems is difficult, as well
for location on land as offshore. Offshore location could be seen as a way to avoid the
difficulties of matching interests of many stakeholders that is required for location on
land. However, to find simple solutions without resistance of some stakeholders is
unrealistic. Windpower cannot only be developed offshore, and solutions for location
offshore and on land need to be sought through processes of mitigating local interest
conflicts. One of the key lessons to be learned from the debate about windpower and
bioenergy as components of future energy solutions is: energy production requires space;
it cannot be done without use of space or land, as may have been the illusion with the
fossil energy sources that drove industrialization.
• Windpower as part of national energy systems is discussed mainly under premises of
continuing high levels of energy consumption, asking: How much of the electricity
- 409 -

SECOA, Vol. 6. Environmental Stresses and Resource Use in Coastal Urban and Peri-Urban Regions
consumed now and in future can be produced by windpower? Presently there is rapid
development of windpower systems and European countries and in some countries the
progress is already high (Spain, Germany); in some national goals of electricity
production from windpower are high (e.g. Sweden: 20% to be achieved until 2020).
• For the long term development of energy systems in the context of sustainable
development the question is not that of maintaining high levels of energy consumption
with the help of new energy sources, but constantly seeking for ways of reducing energy
consumption.
• The framing policies of sustainable development for which windpower is an important
component imply complex and complicated debates about strategies and transitions
towards sustainability. As the process is strongly influenced by national and international
strategies it seems important to take into account local contexts of sustainable
development in such strategies. The case study reported above shows examples for locally
specific factors, as they always need to be taken into account in strategies for sustainable
development. The comparative study of windpower development in Italy and Sweden by
Oles and Hammarlund (2011, p. 481f) shows: the arbitration of “local needs and global
goals” is always required and “local places are never unanimous in their values”;
judgments are required “about which local institutions are legitimate and which not” in
adapting windpower to the landscape.
6. References
Barrow, C.J. 1996. Environmental and Social Impact Assessment. An Introduction. London et al.:
Arnold.
Böhler, T. 2004. Vindkraft, landskap och mening. Gothenburg University, Department of
Environmental and Regional Studies of the Human Condition, Human Ecology Section
(PhD-Thesis in human ecology).
Böhler, T., Bruckmeier, K. Morf, A., Stepanova, O. 2011. National report Sweden. SECOA project,
case studies resource use conflicts. Gothenburg University, School of Global Studies.
European Commission 2008. Offshore Wind Energy: Action needed to deliver on the Energy
Policy Objectives for 2020 and beyond. Communication COM(2008)768fin.
Jessup, B. 2010. Plural and hybrid environmental values: a discourse analysis of the wind energy
conflict in Australia and the United Kingdom (Environmental Politics, 19, 1, 21–44).
- 410 -

K. Bruckmeier, T. D. Lan, Approach to Sustainable Exploitation of Natural Resources Windpower Development in Coastal Areas
Kungsbacka 2009. Översiktsplan för vindkraft. Tillägg till Översiktsplan för Kungsbacka
kommun, ÖP06.
Ladenburg, J. 2009. Stated Public Preferences for On-land and Offshore Wind Power
Generation—A Review (Wind Energy 2009, 12, 171–181).
Morf, A. 2006. Participation and Planning in the Management of Coastal Resource Conflicts.
Gothenburg University, School of Global Studies, Human Ecology Section. PhD- Thesis
in Human Ecology.
NVV (Naturvårdsverket) 2008. Naturvårdsverket och vindkraft i Sverige. Vindkraftseminar
Stickelstad 2008-08-(25-27), presentation by Alexandra Noren.
Oles, T., Hamamrlund, K. 2011. The European Landscape Convention, Wind Power, and the
Limits of the Local: Notes from Italy and Sweden (Landscape Research, 36, 4, pp. 471-485).
Solli, J. 2010. Where the eagles dare? Enacting resistance to wind farms through hybrid collectives
(Environmental Politics, 19, 1, 45–60).
Petersen, J. K., Malm, T. 2006. Offshore Windmill Farms: Threats to or Possibilities for the Marine
Environment (Ambio, 35, 2, 75-80).
TPWind Advisory Council 2006. Wind Energy: A Vision for Europe in 2030. Brussels.
1 “Wind energy will play an essential role in meeting the objectives of the new Energy Policy for Europe. Today
electricity from wind provides a substantial share of total electricity production in only a handful of Member
States, but its importance is increasing: more than 40% of all new electricity generation capacity added to the
European grid in 2007 was wind, making it the fastest growing generation technology except for natural gas
.... The modeling scenario used for the Second Strategic Energy Review ... suggests that wind will represent
more than one third of all electricity production from renewable energy sources by 2020 and almost 40% by
2030, representing an accumulated investment of at least 200-300 billion Euros (or about a quarter of all power
plant investments) by 2030.” (European Commission 2008). The EU policy is ambitious, but there seems no
more strategic debate about how sustainable energy systems can develop and how the presently high levels
of energy use and electricity dependence can be reduced.
- 411 -

SECOA, Vol. 6. Environmental Stresses and Resource Use in Coastal Urban and Peri-Urban Regions
- 412 -

List of Tables and Figures
List of Tables Chapter 1.
Table 1.1. Overview of bio-geo-climatological and landscape features and urban trendsfor the 17 case studies. Vegetation zone data from Walter 1977; climate zones from Köppen in FAO 2006; population data from Williams 2012. 26
Table 1.2. Overview of selected dimensions of the coastal ecosystem for the DPSIR study, DPSIR approach, Drivers, Pressures and Indicators chosen for the 17 case studies. 27
Chapter 2.
Table 2.1. Land use changes between 1990-2006 in Brugge SA and Oostende SA. 49
Table 2.2. Overview of additional nature reserves in the case study area of Oostende. 57
Table 2.3. Overview of additional nature reserves in the case study area. 58
Table 2.4. List of elements of the D-P-S-I-R for the Belgian coastal ecosystems. 59
Table 2.5. Classification of selected indicators into D-P-S-I-R categories. 62
Table 2.6. Data for different indicators. 63
Table 2.7. Calculation of indexes. 69
Chapter 3.
Table 3.1. Areas under mangroves in MMR in km2. 78
Table 3.3. Areas under Pallikaranai Marshland vegetation in km2. 83
Table 3.4. DPSIR Mangrove ecosystem in Mumbai Metropolitan Region. 95
Table 3.5. DPSIR Pallikaranai Marshland Ecosystem. 97
Table 3.6. Area under mangroves, built-up area and the area under salt pans in MMR. 104
Table 3.7. Sustainability Index (Imst) for the whole area of the mangrove ecosystem in coastal wetlands of Mumbai Metropolitan Region. 105
Table 3.8. Area under marshland vegetation, built-up area and area under garbage dump yard in PML. 107
Table 3.9. Sustainability (Imvst) for the marshland ecosystem in Chennai. 108
- 413 -

SECOA, Vol. 6. Environmental Stresses and Resource Use in Coastal Urban and Peri-Urban Regions
Chapter 4.
Table 4.1(a). Base Data (P factor): Change in Built up Area (Residential, Commercial and Industrial) by Local Authority in the Study Areas in 1995 and 2009. 121
Table 4.1(b). Base Data (P factor): Change in Built up Area (Residential, Commercial and Industrial) by Local Authority in the Study Areas in 1995 and 2009. 121
Table 4.2(a). Base Data: Areas of Natural Vegetation Cover (S factor): Pamachim in 1995 and 2009 by local authority. 122
Table 4.2(b). Base Data: Areas of Natural Vegetation Cover (S factor): Carmel Coast, in 1995 and 2009 by local authority. 122
Table 4.3(a). Sustainability Index for Case Study Areas: Palmachim. 129
Table 4.3(b). Sustainability Index for Case Study Areas: Carmel Coast. 129
Table 4.4. Sustainability Index for Palmachim Case Study Areas: predicted Sustainability Index for 2030. 130
Table 4.5. Summary of DPSIR frame for coastal sand dune of Israeli case studies. 130
Table 4.6. Summary of indicators for sustainable use assessment of coastal resources in Israeli case studies. 131
Chapter 5.
Table 5.1. Natural resources and areas under study. 136
Table 5.2. Wetlands in Rome Metropolitan Area. 141
Table 5.3. Driving forces and pressures in Civitavecchia – summary. 144
Table 5.4. Driving forces and pressures in Pescara – summary. 145
Table 5.5. Driving forces and pressures in the XIII District of Rome (Ostia). 145
Table 5.6. European and national legislation. 146
Table 5.7. Regional decrees and programs applicable to Civitavecchia. 146
Table 5.8. Regional decrees and programs applicable to Pescara. 146
Table 5.9. Population and Density indicators of Civitavecchia case study areas (Source: CIRPS elaboration). 148
Table 5.10. Maritime traffic indicator in Civitavecchia (Source: CIRPS elaboration). 149
Table 5.11. Power plants indicator for Civitavecchia (Source: CIRPS elaboration). 150
- 414 -

List of Tables and Figures
Table 5.12. Number and fuel type of power plants in Civitavecchia (Source: CIRPS elaboration). 150
Table 5.13. Motorization rate indicator in Civitavecchia (Source: CIRPS elaboration). 151
Table 5.14. Seaport emissions indicator for Civitavecchia (Source: CIRPS elaboration). 152
Table 5.15. Civitavecchia and Fiumicino seaport emissions. 152
Table 5.16. Emissions from industrial plants indicator for Civitavecchia (Source: CIRPS elaboration). 153
Table 5.17. Torrevaldaliga Nord (Civitavecchia case study) power plant emissions. 153
Table 5.18. Torrevaldaliga Sud (Civitavecchia case study) power plant emissions (Source: INES register). 153
Table 5.19. SO2 Annual mean indicator in Civitavecchia (Source: CIRPS elaboration). 154
Table 5.20. NO2 Annual mean indicator in Civitavecchia (Source: CIRPS elaboration). 155
Table 5.21. Particulate Annual mean indicator in Civitavecchia (Source: CIRPS elaboration). 155
Table 5.22. European and national legislation indicator (Source: CIRPS elaboration). 157
Table 5.23. European and national legislation. 157
Table 5.24. Regional decrees and plans indicator in Civitavecchia (Source: CIRPS elaboration). 158
Table 5.25. Regional decrees and programs applicable to Civitavecchia. 158
Table 5.26. Population Density indicator for Pescara (Source: CIRPS elaboration). 158
Table 5.27. Air traffic indicator within Civitavecchia and Pescara case study areas (Source: CIRPS elaboration). 159
Table 5.28. Maritime traffic indicator for Pescara (Source: CIRPS elaboration). 160
Table 5.29. Relevant industrial plants indicator for Pescara (Source: CIRPS elaboration). 161
Table 5.30. Activities included in INES/ENER register (E-PRTR) Pescara case (Source: CIRPS elaboration). 161
Table 5.31. Motorization rate indicator for Pescara (Source: CIRPS elaboration). 162
Table 5.32. Seaport emissions indicator for Pescara (Source: CIRPS elaboration). 162
Table 5.33. Pescara seaport emissions (Source: ISPRA). 163
Table 5.34. Airport emissions indicator for Pescara (Source: CIRPS elaboration). 163
Table 5.35. Pescara airport emissions (Source: ISPRA). 164
Table 5.36. Emissions from industrial plants indicator in Pescara (Source: CIRPS elaboration). 164
Table 5.37. LAFARGE ADRIASEBINA S.R.L. emissions (Source: INES register). 164
Table 5.38. Air monitoring stations and data availability in Pescara (Source: CIRPS elaboration). 165
- 415 -

SECOA, Vol. 6. Environmental Stresses and Resource Use in Coastal Urban and Peri-Urban Regions
Table 5.39. SO2 threshold exceedances indicator in Pescara (Source: CIRPS elaboration). 165
Table 5.40. NO2 Annual mean indicator in Pescara (Source: CIRPS elaboration). 166
Table 5.41. Particulate Annual mean indicator in Pescara (Source: CIRPS elaboration). 167
Table 5.42. Regional decrees and plans indicator in Pescara (Source: CIRPS elaboration). 168
Table 5.43. Regional decrees and programs applicable to Pescara. 168
Table 5.44. Pressure on coastal water. 170
Table 5.45. Water consumption for domestic use indicator within XIII Municipality of Rome. 170
Table 5.46. Water consumption for domestic use (m3/res) in the whole Municipality of Rome. 170
Table 5.47. Tiber river water quality indicator in the whole XIII Municipality of Rome. 171
Table 5.48. Tiber river water quality, measured at Ripetta Bridge in Rome downtown. 171
Table 5.49. State of coastal water. 172
Table 5.50. Sampling station 14.60 – code 83. 173
Table 5.51. Facal Coliforms indicator in the whole XIII District of Rome. 173
Table 5.52. Transparency indicator in the whole XIII District of Rome. 174
Table 5.53. pH indicator in the whole XIII District of Rome. 175
Table 5.54. Balneability indicator within XIII Municipality Of Rome. 176
Table 5.55. Limits provided by Decreto 30/03/2010. 177
Table 5.56. Link between DPSIR theme and EU sustainability framework. 185
Table 5.57. Civitavecchia state indicators for ambient air quality in the years 2002, 2005 and 2009. 186
Table 5.58. Civitavecchia calculated indexes. 187
Table 5.59. Pescara state indicators for ambient air quality in the years 2002 and 2006. 187
Table 5.60. Pescara calculated indices. 188
Table 5.61. Sampling station 14.60 – code 83. 189
Table 5.62. CLC nomenclature and indicators used for index calculation. 194
Table 5.63. Land use - land cover Roman Coast. 195
Table 5.64. Land use - land cover XIII District. 199
Table 5.65. Land use - land cover Civitavecchia. 200
Table 5.66. Land use - land cover Pescara coast. 203
Table 5.67. Land use - land cover Pescara. 204
- 416 -

List of Tables and Figures
Chapter 6.
Table 6.1. P-S-R indicators for MAL. 214
Table 6.2. Land use change 1990-2000 (MAL). 215
Table 6.3. Land use change 1990-2006 (MAL). 215
Table 6.4. P-S-R indicators for Eastern Algarve. 216
Table 6.5. Land use change 1990-2000. 216
Table 6.6. Land use change 1990-2006 217
Table 6.7. Summary of the main driving forces and pressures for MAL. 224
Table 6.8. Summary of the main driving forces and pressures for Eastern Algarve. 225
Table 6.9. Summary of the main driving forces and pressures for Madeira. 226
Table 6.10. Environmental laws and institutional framework. 227
Table 6.11. Local and regional environmental policies and plans. 228
Table 6.12. Main strategies in Portugal. 228
Table 6.13. P-S-R indicators for MAL. 233
Table 6.14. Indexes for Eastern Algarve. 234
Chapter 7.
Table 7.1. Status of coastal wetlands in Kungälv Municipality 2011. Shoreline= Shoreline Protection Legislation; BH-dirN2000 = Bird and Habitat Directives, and Natura 2000 network, EU-legislation, NR = nature reserve. 249
Table 7.2. Buildings within 100 & 300 m from the shoreline in 2000. 252
Table 7.3. DPSIR analysis for the Falsterbo Peninsula. 262
Table 7.4. DPSIR analysis for the coastal wetlands in Kungälv Municipality. 2011. CAP = Common Agricultural Policy in EU; Shoreline= Shoreline Protection Legislation; BH-dirN2000 = Bird and Habitat Directives, and Natura 2000 network, EU-legislation; NR= nature reserve. 265
Table 7.5. Natural habitat values affected by sea level rise: status and management of valuable coastal habitats on the outer Falsterbo Peninsula, including water-lands, semi-dry and dry habitats. 278
Table 7.6. EU habitat types for Natura 2000. 280
- 417 -

SECOA, Vol. 6. Environmental Stresses and Resource Use in Coastal Urban and Peri-Urban Regions
Table 7.7. Important rare species mentioned for the Falsterbo Peninsula. Abbreviations in the table: RE: regionally extinct; CR: critically endangered; EN endangered; VU vulnerable; NT near threatened. 282
Chapter 8.
Table 8.1. Summary of indicators used to estimate the relative index of sustainability. 291
Table 8.2. Habitat types of the six Ramsar sites within the two study areas. 296
Table 8.3. Percentage of SSSI areas classified based on their state of conservation. 299
Table 8.4. Percentage of SSSI areas classified based on their state of conservation in the districts located within the SECOA study areas. 300
Table 8.5. Main pressures affecting coastal wetlands in England and their trends at different time scales. 306
Table 8.6. Estimated rise in relative sea level in 50 years based on long-term trends. 315
Table 8.7. Percentage of total area under each category of state of conservation. 319
Table 8.8. Indicator values used in the calculation of the sustainable index 326
Table 8.9. Mean rank values and final rank based on the Index of Sustainability (ISrank) and the Relative Index of Sustainability (RISrank). 327
Table 8.11. Index Of Sustainability (Si) Estimated For Each Area In 27 Tests Of Varying Weights. 337
Table 8.12. Relative Index Of Sustainability (Ris) Estimated For Each Area In 27 Tests Of Varying Weights. 338
Chapter 9.
Table 9.1. Mangrove’s areas change in Hai Phong, 1989-2007. 345
Table 9.2. Some concentrated seagrass beds in Hai Phong. 347
Table 9.3. The change of seagrass beds areas in Nha Trang Bay. 348
Table 9.4. The cover of living coral at some reefs in Hai Phong. 349
Table 9.5. Decline of living coral cover in Cat Ba – Ha Long area. 349
Table 9.6. Structure of gross output of industry. 353
Table 9.7. The output value of agriculture in the period from 1995 to 2009. 353
Table 9.8. Agricultural area by districts surrounding the ports of Hai Phong. 354
Table 9.9. Some indexes of aquaculture of Hai Phong. 355
- 418 -

List of Tables and Figures
Table 9.10. The output value of trade of Hai Phong from 2000 to 2005 (Unit: bill dongs). 356
Table 9.11. Some main indicators of Hai Phong Port. 357
Table 9.12. Tourist and hotel activities in Hai Phong. 359
Table 9.13. The output value of agriculture of Nha Trang, 1996 – 2009. 361
Table 9.14. Some indexes of aquaculture of Nha Trang. 361
Table 9.15. Some indicators of Nha Trang Port. 362
Table 9.16. Summary of indicators for sustainable use assessment of mangrove and coral reef ecosystems in Vietnamese case studies. 372
Table 9.17. Sustainability index of mangrove forest in Hai Phong coastal area. 378
Table 9.18. Sustainability index for coral reef in Hai Phong. 381
Table 9.19. Sustainability index of coral reef in Nha Trang Bay. 381
Chapter 11.
Table 11.1. The development of wind-power in the case study areas and countries of the SECOA project. 400
- 419 -

SECOA, Vol. 6. Environmental Stresses and Resource Use in Coastal Urban and Peri-Urban Regions
List of Figures Chapter 1.
Figure 1.1. DPSIR framework - adapted from Rounsevell et al. 2010. 23
Figure 1.2. Over view of SECOA partner countries and the 17 case studies(Source: SECOA webpage [accessed 2013-10-14]). 24
Chapter 2.
Figure 2.1. The conceptual framework of the DPSIR framework indicators(After UNEP and DPCSD 1995). 37
Figure 2.2. The study areas: Brugge SA and Oostende SA. 40
Figure 2.3. Population density in the study area in 2003. 42
Figure 2.4. Evolution of day-tourists 1997-2009 (Vandaele & Callens 2010). 45
Figure 2.5. Number of day-tourists to the coastal communes in 2008, divided by mode of transport (Westtoer 2010). 45
Figure 2.6. Ecosystem vulnerability map of the East coast (1:190.000). Copyright © 2006 Agentschap voor Geografische Informatie Vlaanderen. 54
Figure 2.7. Map showing the biological value of the case studies. Oostende is on the left, Brugge on the right. A darker green coloration signifies a higher biological value. Red areas are of high faunistic value (Copyright © 2010 Agentschap voor Geografische Inform). 55
Figure 2.8. Map showing areas that fall under the Habitat directive (green) and areas that fall under the Bird directive (blue).Copyright © 2010 Agentschap voor Geografische Informatie Vlaanderen. 56
Figure 2.9. Map showing areas that are part of VEN and have a special protective status. Copyright © 2010 Agentschap voor Geografische Informatie Vlaanderen. 56
Figure 2.10. Changes in area of bio-agriculture in the study area between 2001-2007. 63
Figure 2.11. Areas of protected sites in the study areas. 64
Figure 2.12. Forest fragmentation in the study area. 65
Figure 2.13. Trends of different indicators and the Sustainable Index. 66
- 420 -

List of Tables and Figures
Chapter 3.
Figure 3.1. Mumbai and Chennai Metropolitan Regions, India. 72
Figure 3.2. Hierarchical analysis of the coastal wetland ecosystems in Mumbai Metropolitan Region. Tidal flats and mangroves are important ecosystem of MMR. 77
Figure 3.3. Hierarchical analysis of coastal ecosystems of Chennai. The marshland is an important ecosystem of Chennai Metropolitan Region. There are no corals or sea grasses along the coast of CMR. 80
Figure 3.4. Map showing location of the Pallikaranai Marshland in Chennai Metropolitan Region. The numbers show the location of dumping yards and Velachery Rail station and other prominent buildings and institutes. 81
Figure 3.5. Google earth image of Pallikaranai Marshland. The Buckingham Canal is also shown. The prominent plume like feature in the marshland is the garbage dump. 82
Figure 3.6. Photograph showing the nature of marsh vegetation (grasses) in the Pallikaranai Marshland, CMR. Note the multi- storied buildings on the margin of the marshland. 82
Figure 3.7. Map of PML showing the nature of marsh vegetation. Based on NDVI values derived for 2008. 84
Figure 3.8. Apartments and slum on the margin of mangrove forest in Mumbai (Source: ManasiKakatkar - Kulkarni. http://coastalcare.org/wp-content/uploads/2010/08/ mangroves-mumbai22.jpg). 85
Figure 3.9. Diagram summarizing State, Pressure and drivers in the case of mangroves in MMR. 86
Figure 3.10. Diagram summarizing State, Pressures and Drivers in the case of marshland vegetation in PML. For details of methodology see Figure 3.11. 88
Figure 3.11. DPSIR frame for the Mangrove ecosystem in coastal wetlands of Mumbai Metropolitan Region. 94
Figure 3.12. DPSIR frame for the Pallikaranai Marshland in Chennai. 96
Figure 3.13. Map showing the distribution and location of mangroves in MMR. Based on 1997 and 2008 NDVI. The inset map shows the change. 103
Figure 3.14. Sustainability tendency of mangrove ecosystem in MMR between 1997 and 2008. 105
Figure 3.15. Map showing distribution of sustainability index for MMR wards with substantial mangrove cover. 106
Figure 3.16. Sustainability tendency of Pallikaranai Marshland vegetation in CMR between 1997 and 2008. The question mark indicates the possibility of overestimation of the index value due to presence of water hyacinth and other invasive plants in recent years. 108
Figure 3.17. Map of the Pallikaranai Wetland showing distribution of sustainability index in 1997 (inset) and 2008. 109
- 421 -

SECOA, Vol. 6. Environmental Stresses and Resource Use in Coastal Urban and Peri-Urban Regions
Chapter 4.
Figure 4.1. DPSIR Framework for Israeli Case Studies; Workflow and Relationship between the various elements. 115
Figure 4.2(a). Location of Case Studies in Metropolitan Context: Haifa. 118
Figure 4.2(b). Location of Case Studies in Metropolitan Context: Tel Aviv. 119
Figure 4.3(a). Change in built area in Case Study Areas: Palmachim. 121
Figure 4.3(b). Change in built area in Case Study Areas: Carmel Coast. 122
Figure 4.4(a). Change in Natural Vegetation Area in Case Study Areas: Palmachim. 123
Figure 4.4(b). Change in Natural Vegetation Area in Case Study Areas: Carmel Coast. 123
Figure 4.5. Comparative Vegetation Land Cover. 125
Figure 4.6. Natural Protected Areas. 126
Figure 4.7. Ecological Sensitivity. 127
Chapter 5.
Figure 5.1. Complete DPSIR framework (National Environmental Research Institute Denmark). 137
Figure 5.2. DPSIR frame (Source: EEA, Air pollution in Europe 1990-2000). 147
Figure 5.3. Population and density Civitavecchia (Source: CIRPS elaboration). 148
Figure 5.4. Passengers (units) and goods (tons) - Civitavecchia seaport, (Source: www.assoporti.it). 149
Figure 5.5. Goods shipped (tons) - Civitavecchia seaport, (Source: www.assoporti.it). 149
Figure 5.6. Power output of Civitavecchia plants. 151
Figure 5.7. Motorization rate – Civitavecchia. 151
Figure 5.8. Civitavecchia SO2 - Annual exceedances of the threshold of hourly mean (350µg/m3). 154
Figure 5.9. Civitavecchia SO2 - Annual exceedances of the threshold of 24 hours mean (125µg/m3). 154
Figure 5.10. Civitavecchia NO2 - Annual exceedances of the threshold of hourly mean (200µg/m3). 155
Figure 5.11. Civitavecchia NO2 - Annual mean (threshold: 40µg/m3). 155
Figure 5.12. Civitavecchia PM10 - Annual exceedances of the threshold of 24 hours mean (50µg/m3). 156
Figure 5.13. Civitavecchia PM10 - Annual mean (threshold 40µg/m3). 156
Figure 5.14. Population and density (population/km2) Pescara (Source: CIRPS elaboration). 158
- 422 -

List of Tables and Figures
Figure 5.15. Airport movements - Pescara Airport, (Source: www.abruzzoairport.com). 159
Figure 5.16. Passengers (units) - Pescara Airport, (Source: www.abruzzoairport.com). 160
Figure 5.17. Goods shipped (tons) - Pescara Airport, (Source: www.abruzzoairport.com). 160
Figure 5.18. Passengers (units) - Pescara seaport, (Source: www.assoporti.it). 161
Figure 5.19. Goods shipped (tons) - Pescara seaport, (Source: www.assoporti.it). 161
Figure 5.20. Motorization rate – Pescara (source ISTAT). 162
Figure 5.21. Pescara SO2 - Annual exceedances of the threshold of 24 hours mean (125µg/m3). 166
Figure 5.22. Pescara NO2 - Annual exceedances of the threshold of hourly mean (200µg/m3). 166
Figure 5.23. Pescara NO2 - Annual mean (threshold: 40µg/m3). 167
Figure 5.24. Pescara PM10 - Annual exceedances of the threshold of 24 hours mean (50µg/m3). 167
Figure 5.25. Pescara PM10 - Annual mean (threshold 40µg/m3). 168
Figure 5.26. DPSIR frame (Source: EEA, Air pollution in Europe 1990-2000). 169
Figure 5.27. Water consumption for domestic use (m3/res) in Rome (Source: ISPRAelaboration on ISTAT database). 171
Figure 5.28. Tiber river water quality at Ripetta Bridge in Rome downtown: BOD5, COD, N-NH4, N-NH3, Ptot,P-PO4 (source: ISPRA elaboration on Regional and ARPA database). 172
Figure 5.29. The XIII District of Rome (OSTIA), in red shown the sampling station 2 172
Figure 5.30. Sampling station 14.60 – code 83. 173
Figure 5.31. Fecal Coliforms - 700 m south from “pontile di Ostia” - sampling station 2. – code 83. 174
Figure 5.32. Transparency - 700 m south from “pontile di Ostia” - sampling station 2. – code 83. 175
Figure 5.33. pH at 700 m south from “pontile di Ostia” - sampling station 2. – code 83. 176
Figure 5.34. Municipality of Fiumicino, bathing and no bathing waters. 177
Figure 5.35. XIII District of Rome, bathing and no bathing waters. 179
Figure 5.36. Air sustainability indices. 187
Figure 5.37. Air sustainability index NO2. 188
Figure 5.38. Air sustainability index PM10. 188
Figure 5.39. Sampling station 14.60 – code 83. 189
- 423 -

SECOA, Vol. 6. Environmental Stresses and Resource Use in Coastal Urban and Peri-Urban Regions
Figure 5.40. Seasonal and annual index of Fecal Coliforms , 700 m right pontile di Ostia, sampling station 2. code 83. 190
Figure 5.41. Seasonal and annual index of transparency - 700 m right pontile di Ostia, sampling station 2. code 83. 191
Figure 5.42. Seasonal and annual index of pH - 700 m right pontile di Ostia - sampling station 2. – code 83. 192
Figure 5.43. Corine land cover legend for categories relevant to the case study areas. 194
Figure 5.44. Corine land cover, Roman Coast. 196
Figure 5.45. Sustainability index, coast of Rome. 201
Figure 5.46. Pescara Metropolitan Area – land use 2006. 203
Figure 5.47. Sustainability index, coast of Pescara. 205
Chapter 6.
Figure 6.1. MAL study area. 211
Figure 6.2. Eastern Algarve study area. 212
Figure 6.3. Funchal Study Area. 213
Figure 6.4. Artificial surface area increase (MAL). 218
Figure 6.5. Artificial surface area increase (Eastern Algarve). 218
Figure 6.6. Artificial surface area 2006 (Funchal). 219
Figure 6.7. DPSIR framework for MAL. 229
Figure 6.8. Main strategies in Portugal. 230
Figure 6.9. DPSIR framework for Madeira. 230
Figure 6.10. Equations used for index development. 233
Figure 6.11. Sustainability tendency of ecological important sites MAL (1990-2006). 233
Figure 6.12. Sustainability tendency of ecological important sites in Eastern Algarve (1990-2006). 234
- 424 -

List of Tables and Figures
Chapter 7.
Figure 7.1. Southern Sweden with the case study areas in Kungälv (North) and Vellige (South). 236
Figure 7.2. Gothenburg region including the peri-urban coastal municipalities. The coastal strip with salt meadows in Kungälv Municipality for this study is marked in white in the figure. 239
Figure 7.3. Location of Vellinge Municipality in relation to the Malmö case. 240
Figure 7.4. Coastal wetlands in Kungälv Municipality with the 13 sites indicated by numbers. 242
Figure 7.5. Landscape elements with valuable habitat types on the outer Falsterbo Peninsula (Source: Bentz 2009). 244
Figure 7.6. Overview over valuable habitat types and landscape- & cultural values for the Falsterbo Peninsula. (Source: A. Morf using documents mentioned in the text above). 245
Figure 7.7. Potential sea-level rise in Vellinge. Legend: Left scale in metres, text showing 100/10/2 year maximum water levels for 2009 and 2100 (årshögvatten) departing from respective mean water levels for 2009 and 2100 (medelvattenyta) (Source: SWECO 2011). 246
Figure 7.8. Topographical map of the Falsterbo-peninsula in Vellinge with meter-intervals in relation to today’s mean water line (Source: CAB 2009). 247
Figure 7.9. Overview of DPSIR analysis for the Falsterbo Peninsula including the most important present uses in relation to climate change (Source: analysis by A. Morf). 261
Figure 7.10. General summary DPSIR scheme for the coastal wetlands in Kungälv Municipality (Source: E.G.A. Olsson, unpubl). 266
Figure 7.11. Inundation map for Falsterbo PeninsulaFalsterbo Peninsula and Vellinge Municipality Vellinge Municipality (Authors: Knutsson P. & Trang Phuong N.B. unpubl.). 277
Figure 7.12. Location of proposed dams for Falsterbo Peninsula by Vellinge Municipality. Left: inner rings with medium term priority mainly including settlements. Highest high water level illustrated 2.1m. Right: outer rings with long-term priority, partially including ecologically valuable habitat areas and further cultural heritage values. The highest high water level illustrated 2.4 m (Source: Folkesson 2010). 277
Chapter 8.
Figure 8.1. In the UK the DPSIR analysis focuses on intertidal habitats within statutory conservation areas, as indicated by the blue shaded boxes. 286
Figure 8.2. The DPSIR framework used in the assessment of sustainability of intertidal habitats within Portsmouth and Thames Gateway. 288
- 425 -

SECOA, Vol. 6. Environmental Stresses and Resource Use in Coastal Urban and Peri-Urban Regions
Figure 8.3. Economic Impact zones of SSSI units in Thames Gateway (left) and Portsmouth (right). 289
Figure 8.4. The study areas: Portsmouth and Thames Gateway. 294
Figure 8.5. Names and extent of designated conservation areas within Portsmouth (pink) and Thames Gateway (blue). Note that some of the designated areas extend beyond the boundaries of the study site. 295
Figure 8.6. Statutory conservation areas within the Thames Gateway (left) and Portsmouth (right) included in this assessment overlap. Areas shown are also designated SSSIs. 298
Figure 8.7. Importance of broad habitats for delivering ecosystem services and trends since 1990 (modified from UKNEA 2011). 301
Figure 8.8. Most important threats to priority species and habitats in the U.K. (Source: JNCC 2008). 304
Figure 8.9. DPSIR Framework for the sustainability of intertidal habitats in designated conservation areas in Portsmouth and the Thames Gateway. 311
Figure 8.10. Detailed DPSIR framework for the impact of population growth and coastal squeeze on intertidal habitats. Sea level rise rate shown applies to Portsmouth areas. 312
Figure 8.11. Population changes in the areas adjacent to the SSSI. 313
Figure 8.12. Change in the number of firms by sector (SIC 2003) within the impact economic area of the six SSSI. The total increase in number of firms from 2003 to 2008 and the percentage in relation to the total number of firms in 2003 is indicated. 314
Figure 8.13. Reduction in saltmarsh area in study areas. Data for Portsmouth and Langstone Harbours were obtained from the Channel Coastal Observatory, for the other areas from English Nature (1997). 317
Figure 8.14. Total bird count in the study areas (Data from the British Trust for Ornithology). 318
Chapter 9.
Figure 9.1. Hai Phong case study. 342
Figure 9.2. Nha Trang case study. 342
Figure 9.3. Changes of mangrove forest areas in Hai Phong, 1995-2001. 345
Figure 9.4. Changes of mangrove forest areas in Hai Phong, 2001 – 2007. 346
Figure 9.5. Distribution of seagrass beds in Hai Phong area 347
Figure 9.6. Population trend in rural and urban area of Hai Phong. 352
Figure 9.7. The trend of constituent economic parts to industrial output value. 352
- 426 -

List of Tables and Figures
Figure 9.8. Population trend in rural and urban area of Nha Trang City. 360
Figure 9.9. DPSIR framework for the mangrove ecosystem in Hai Phong. 367
Figure 9 10. DPSIR framework for the coral reef ecosystem in Hai Phong and Nha Trang. 369
Figure 9.11. DPSIR for the mangrove ecosystem in Hai Phong vs. selection of related indicators. 370
Figure 9.12. DPSIR for the Coral reef ecosystem in Hai Phong vs. selection of related indicators. 371
Figure 9.13. Map of sustainability use of mangrove forests in Hai Phong 1989 – 1995. 379
Figure 9.14. Map of sustainability use of mangrove forests in Hai Phong 2001-2007. 380
Figure 9.15. Map of sustainability use of coral reef in coastal area of Hai Phong – Ha Long. 382
Figure 9.16. Map of sustainability use of coral reef in coastal area of Nha Trang. 383
Chapter 10.
Figure 10.1. General flow chart of sustainable use assessment of coastal natural resources in SECOA project case studies. 393
- 427 -

SECOA, Vol. 6. Environmental Stresses and Resource Use in Coastal Urban and Peri-Urban Regions
- 428 -

