two non-specific indicators of stress: enamel hypoplasia and
TRANSCRIPT
UNLV Retrospective Theses & Dissertations
1-1-2002
Two non-specific indicators of stress: Enamel hypoplasia and Two non-specific indicators of stress: Enamel hypoplasia and
Harris lines Harris lines
Marta Pilar Alfonso Durruty University of Nevada, Las Vegas
Follow this and additional works at: https://digitalscholarship.unlv.edu/rtds
Repository Citation Repository Citation Alfonso Durruty, Marta Pilar, "Two non-specific indicators of stress: Enamel hypoplasia and Harris lines" (2002). UNLV Retrospective Theses & Dissertations. 1412. http://dx.doi.org/10.25669/32qp-ti96
This Thesis is protected by copyright and/or related rights. It has been brought to you by Digital Scholarship@UNLV with permission from the rights-holder(s). You are free to use this Thesis in any way that is permitted by the copyright and related rights legislation that applies to your use. For other uses you need to obtain permission from the rights-holder(s) directly, unless additional rights are indicated by a Creative Commons license in the record and/or on the work itself. This Thesis has been accepted for inclusion in UNLV Retrospective Theses & Dissertations by an authorized administrator of Digital Scholarship@UNLV. For more information, please contact [email protected].
INFORMATION TO USERS
This manuscript has been reproduced from the microfilm master. UMI films the text directly from the original or copy submitted. Thus, some thesis and dissertation copies are in typewriter face, while others may be from any type of computer printer.
The quality of this reproduction is dependent upon the quality of the copy submitted. Broken or indistinct print, colored or poor quality illustrations and photographs, print bleedthrough, substandard margins, and improper alignment can adversely affect reproduction.
In the unlikely event that the author did not send UMI a complete manuscript and there are missing pages, these will be noted. Also, if unauthorized copyright material had to be removed, a note will indicate the deletion.
Oversize materials (e.g.. maps, drawings, charts) are reproduced by sectioning the original, beginning at the upper left-hand comer and continuing from left to right in equal sections with small overlaps.
ProQuest Information and Leaming 300 North Zeeb Road. Ann Arbor. Mi 48106-1346 USA
800-521-0600
UMI
Reproduced with permission of the copyright owner. Further reproduction prohibited without permission.

Reproduced with permission of the copyright owner. Further reproduction prohibited without permission.
TW O NON-SPECIFIC INDICATO RS OF STRESS:
E N A M E L HYPO PLASIA A N D HARRIS LINES
bv
Marta Pilar A lfonso Durrutv
Bachelor in Anthropology M ajor in Archaeology and Prehistory Universidad de Chile
1995
Professional T itle o f Archaeologist Universidad de Chile
2000
A thesis submitted in partial fu lfillm ent o f the requirements for the
Master o f Arts Degree Department o f Anthropology
College of Liberal Arts
Graduate College University o f Nevada, Las Vegas
August 2002
Reproduced with permission of the copyright owner. Further reproduction prohibited without permission.
UMI Number. 1411271
Copyright 2002 by Alfonso Durruty, Marta Pilar
All rights reserved.
UMI*UMI Microform 1411271
Copyright 2003 by ProQuest Information and Leaming Company. All rights reserved. This microform edition is protected against
unauthorized copying under Title 17. United States Code.
ProQuest Information and Leaming Company 300 North Zeeb Road
P.O. 80x1346 Ann Arbor, Ml 48106-1346
Reproduced with permission of the copyright owner. Further reproduction prohibited without permission.

Copyright by Marta Pilar Alfonso Durruty 2002 All Rights Reserved
Reproduced with permission of the copyright owner. Further reproduction prohibited without permission.

UNTV Thesis ApprovalThe Graduate College University of Nevada, Las Vegas
June 4 20 02
The Thesis prepared by
Marta P. A lfonso
Entitled
Two n o -s p e c i f ic in d ic a to rs o f s t re s s : H a rr is l in e s and Enamel Hypoplasia.
is approved in partial fulfillment of the requirements for the degree of
M arter o f A r ts_______________________________________
Examination Committee Member
mation
Gradiiàfe'College Faculty Remgsentatwe
ination Committee Chah
van o f the Graduate College
u
Reproduced with permission of the copyright owner. Further reproduction prohibited without permission.

ABSTRACT
Two Non-Specific Indicators of Stress: Harris Lines and Enamel Hypoplasia
bv
Marta Pilar A lfonso Durruty
Dr. Jennifer Thompson Committee Chair Professor o f Anthropology
University o f Nevada. Las Vesas
Harris lines (H L) and enamel hypoplasia (EH) are two non-specific indicators o f
stress, commonly used in the reconstruction o f the health status in past and present
populations. The aim o f this study was to determine i f there is a correlation between
these two markers. To achieve this aim. a sample o f 136 individuals from two
archaeological sites ( Az-71 and Az-140) from northern Chile was analyzed. H L and EH
showed no correlation in terms o f presence absence at the individual level. In addition.
H L and EH. by age o f the individual at the time o f the defect formation, showed a
completely different d istribution. The results indicate no correlation between these two
indicators at any level. Instead, the distribution o f Harris lines, by age o f the individual at
the time o f their form ation, show that this indicator is associated w ith growth and not
w ith arrested or slowed associated w ith stressful conditions.
Ill
Reproduced witfi permission of tfie copyrigfit owner. Furtfier reproduction profiibited witfiout permission.
TABLE OF CONTENTS
A B S TR A C T ..................................................................................................................................... üi
L IS T OF G R A P H S ......................................................................................................................... vi
A C K N O W LE G M E N T S ................................................................................................................ ix
CHAPTER I IN TR O D U C TIO N ..................................................................................................1
Theoretical O rientation................................................................................................................ 2Intent And Relevance O f The Study.......................................................................................... 5Chapter Organization And Contents.......................................................................................... 7
CHAPTER II PURPOSE OF THE STURDY.............................................................................8
Problem........................................................................................................................................... 8Hypothesis......................................................................................................................................9
CHAPTER III LITER ATU RE REVIEW : NON-SPECIFIC S K E LE TA L INDICATO RS OF G RO W TH D ISR U P TIO N ......................................................................................................11
Bone Composition. Bone Reaction and T ib ia l G row th ........................................................12Harris L ines ..................................................................................................................................18Dental Development and M ineralization................................................................................ 36Enamel Hypoplasia.....................................................................................................................46Studies About Correlation Between Harris Lines And Enamel Hypoplasia................... 61
CHAPTER rV M A TE R IA LS A N D M E T H O D S ................................................................. 63
Populations Under Study...........................................................................................................63M ateria l......................................................................................................................................... 70M ethods........................................................................................................................................ 72
CHAPTER V RESU LTS...........................................................................................................8 1
Harris L in e s ................................................................................................................................. 8 1Enamel Hypoplasia.....................................................................................................................96Correlation between Harris Lines and Enamel Hypoplasia...............................................107F iltering the N o ise .................................................................................................................... 114
IV
Reproduced with permission of the copyright owner. Further reproduction prohibited without permission.
CHAPTER V I CONCLUS IO N S ............................................................................................118
Harris L ines ................................................................................................................................119Enamel Hypoplasia....................................................................................................................122Correlation between Two Non-Specific Indicators o f Stress: Harris Lines and EnamelHypoplasia.................................................................................................................................. 124Harris Lines Reevaluated..........................................................................................................127
APPENDIX I SAM PLE A N A L Y Z E D .................................................................................131
APPENDIX 2 R ADIO G RAPH ED IN D IV ID U A L S ............................................................. 134
REFERENCES C IT E D ................................................................................................................ 138
V IT A ................................................................................................................................................152
Reproduced with permission of the copyright owner. Further reproduction prohibited without permission.
LIST OF GRAPHS
Graph 1............................................................................................................................................... 16Graph 2...............................................................................................................................................7 1Graph 3...............................................................................................................................................83Graph 4 ...............................................................................................................................................87Graph 5...............................................................................................................................................94Graph 6...............................................................................................................................................98Graph 7........................................................................................................................................... 110Graph 8........................................................................................................................................... 111Graph 9 ........................................................................................................................................... 112Graph 10......................................................................................................................................... 113
VI
Reproduced with permission of the copyright owner. Further reproduction prohibited without permission.
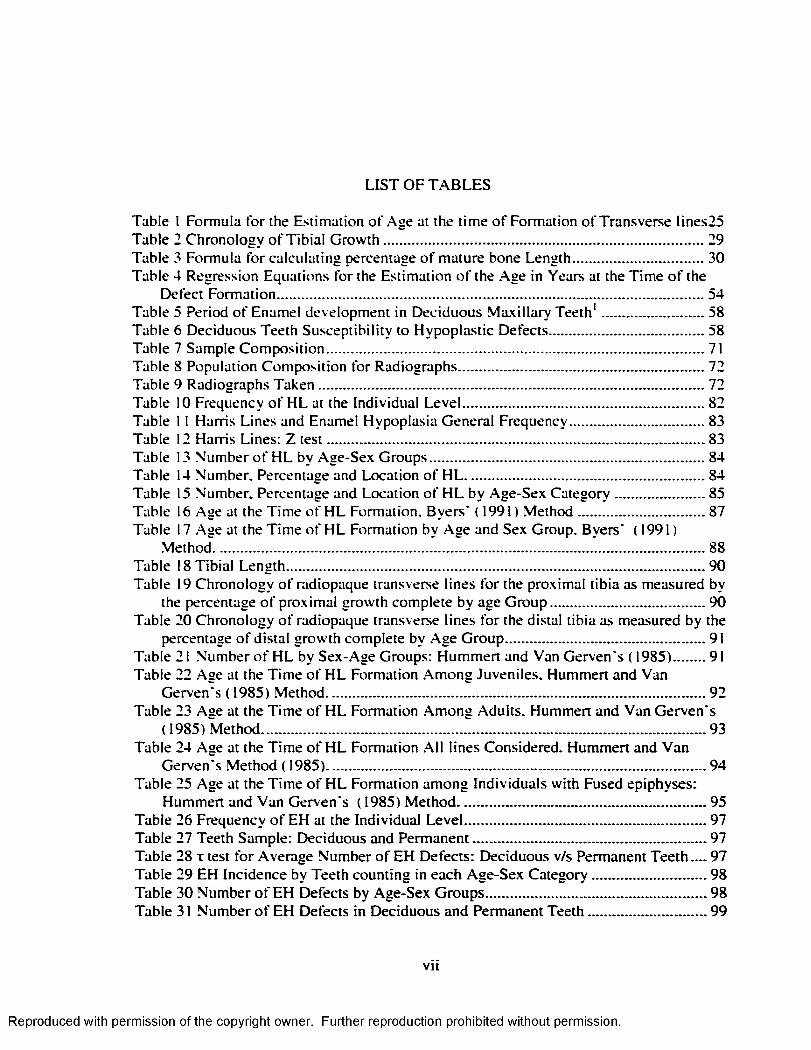
LIST OF TABLES
Table 1 Formula fo r the Estimation o f Age at the time o f Formation o f Transverse lines25Table 2 Chronology o f T ib ia l G row th ........................................................................................ 29Table 3 Formula fo r calculating percentage o f mature bone Length.................................... 30Table 4 Regression Equations for the Estimation o f the Age in Years at the Time o f the
Defect Formation..................................................................................................................... 54Table 5 Period o f Enamel dev elopment in Deciduous M axilla ry T e e th '.............................58Table 6 Deciduous Teeth Susceptibility to Hypoplastic Defects........................................... 58Table 7 Sample Com position........................................................................................................ 71Table 8 Population Composition for Radiographs.................................................................... 72Table 9 Radiographs Taken .......................................................................................................... 72Table 10 Frequency o f H L at the Individual Leve l...................................................................82Table 11 Harris Lines and Enamel Hypoplasia General Frequency......................................83Table 12 Harris Lines: Z tes t........................................................................................................83Table 13 Number o f H L by Age-Sex Groups............................................................................84Table 14 Number. Percentage and Location o f H L ...................................................................84Table 15 Number. Percentage and Location o f H L by Age-Sex Category......................... 85Table 16 Age at the Time o f H L Formation. Byers' (1991) M e thod ................................... 87Table 17 Age at the Time o f H L Formation by Age and Sex Group. Byers' (1991 )
Method....................................................................................................................................... 88Table 18 T ib ia l Length................................................................................................................... 90Table 19 Chronology o f radiopaque transverse lines for the proximal tib ia as measured by
the percentage o f proximal growth complete by age G roup ........................................... 90Table 20 Chronology o f radiopaque transverse lines for the distal tibia as measured by the
percentage o f distal growth complete by Age Group....................................................... 91Table 21 Number o f H L by Sex-Age Groups: Hummert and Van Gerven's ( 1985)..........91Table 22 Age at the Tim e o f H L Formation Am ong Juveniles. Hummert and Van
Gerven's ( 1985) Method.........................................................................................................92Table 23 Age at the Tim e o f H L Formation Among Adults. Hummert and Van Gerven's
(1985) Method.......................................................................................................................... 93Table 24 Age at the Time o f H L Formation A ll lines Considered. Hummert and Van
Gerven's Method ( 1985).........................................................................................................94Table 25 Age at the Time o f H L Formation among Individuals w ith Fused epiphyses:
Hummert and Van Gerven's ( 1985) Method.....................................................................95Table 26 Frequency o f EH at the Individual Leve l...................................................................97Table 27 Teeth Sample: Deciduous and Permanent................................................................ 97Table 28 t test fo r Average Number o f EH Defects: Deciduous v/s Permanent Teeth.... 97Table 29 EH Incidence by Teeth counting in each Age-Sex Category................................ 98Table 30 Number o f EH Defects by Age-Sex Groups............................................................. 98Table 31 Number o f EH Defects in Deciduous and Permanent Teeth................................. 99
VI I
Reproduced with permission of the copyright owner. Further reproduction prohibited without permission.
Table 32 Upper Deciduous Teeth Crown Heights.................................................................. 101Table 33 Lower Deciduous Teeth Crown H e igh ts .................................................................101Table 34 Blakeley and Armelagos ( 1985): Deciduous Dentition A d justed ...................... 101Table 35 Permanent Upper Teeth Crown Heights.................................................................. 101Table 36 Permanent Lower Teeth Crown H e igh ts .................................................................102Table 37 Goodman and Rose ( 1990): Permanent Dentition A d jus ted............................... 103Table 38 Age at Time o f EH Formation Juveniles: Blakeley and Armelagos ( 1985),
Goodman and Rose ( 1990)...................................................................................................103Table 39 Age at Time o f EH Formation Adults: Blakeley and Armelagos ( 1985),
Goodman and Rose ( 1990)...................................................................................................104Table 40 Age at the Time o f EH Formation by Sex-Age Group Among Juveniles:
Blakeley and Armelagos ( 1985). Adjusted Goodman and Rose...................................105Table 41 Age at the Time o f EH Formation by Sex-Age Group Among Adults: Blakeley
and Armelagos ( 1985). Adjusted Goodman and Rose....................................................105Table 42 Paired t-test Goodman and Rose ( 1990) / Goodman and Rose Adjusted.......... 106Table 43 .Age at the Time o f EH formation by Age-Group Goodman and Armelagos
( 1990)/Goodman and Armelagos Adjusted......................................................................107Table 44 C h i' fo r Enamel Hypoplasia and Harris Lines Presence/Absence at the
Individual Level..................................................................................................................... 108Table 45 H L 1-7 years Byer s ( 1990) .Method.........................................................................110Table 46. H L 1-7 years Hummert and Van Gerven's ( 1985) Method............................... 111Table 47. EH in .Adults by Age at the Time o f Formation: Goodman and Rose ( 1990) 112 Table 48 EH in Adults by Age at the Time o f Formation: Goodman and Rose Adjusted
.............................................................................................................112Table 49 H L Smoothing Factor for the Byers’ ( 1990) M ethod........................................ 115Table 50 H L Smoothing Factor for the Hummert and Van Gerven's ( 1985) M ethod... 115Table 51 EH Smoothing Factor for the Goodman and Rose's ( 1990) M ethod..............115Table 52 EH Smoothing Factor for the Goodman and Rose Adjusted M ethod............ 116Table 53 EH Smoothing Factor for the Blakeley and Armelagos's ( 1985) M ethod ........116Table 54 Remaining H L after Subtraction o f the Smoothing Factors................................ 116Table 55 Matches Obtained w ith the different Smoothing Factors and the different
Correction Factors................................................................................................................. 117
vm
Reproduced with permission of the copyright owner. Further reproduction prohibited without permission.
AC KN O W LE G M EN TS
I would like to thank the members o f my committee for their valuable observations
and comments: special thanks to Dr. Thompson and Dr. Benyshek.
.Many people collaborated in this study. I would like to thank the "Museo
.Arqueologico San M iguel de Azapa " and the "L'niversidad de Tarapacâ” fo r a llow ing me
to analyze the collections; special thanks to all the staff at "M A S M A '\ they are generous
in their knowledge and they have given me the g ift o f their friendship; special thanks to
Vivien Standen and Leticia Latorre for radiographing the material.
I would also like to thank L N L V and the .Anthropology Department at U N LV fo r its
valuable support: this research was funded w ith the Edwards and Olswang scholarship.
The Studies Abroad scholarship and the GSA scholarship provided further funding.
Document Delivery Serv ices provided important literature material.
Many thanks to my friends Kapris. Franco and Tomas who gave me a place in their
house and in their heart so I could analyze the material in Arica. To my new friends and
to the ones that I left in Chile, they gave the support, strength and w ill that I needed to
finish this project. I would also like to acknowledge my fam ily: in the distance they have
been able to be present, and to support me every day.
IX
Reproduced with permission of the copyright owner. Further reproduction prohibited without permission.
CHAPTER I
IN TR O D U C TIO N
Skeletal remains give researchers a unique insight into human ecology and adaptation
in the past (Buikstra and Cook. 1980) and w ith this it is possible to reconstruct the ir life
style and the environment that they inhabited. It is not new to say that the environment
that we live in today is extremely different from the one populated by our ancestors. The
environment is not different only in bioenvironmental terms: it is even more different in
cultural ones. W ith this in mind, and considering that humans are bio-cultural beings, we
can overcome the "pristine m yth" that characterized ecological anthropology in the
I970 ’ s (Headland. 1997): this is. to think that "pristine societies" lived in something like
a pertect equ ilibrium w ith their environment (social, biological and abiotic). An idea that
is not only biased by Rousseau's concept about the "noble savage", but that is also
lim ited as a homeostatic model. Humans are always changing, and as they change
socially and cultura lly they impact the surrounding env ironment o f other groups
(M cElroy and Tow nsend. 1996). By understanding that "equ ilib rium " w ith the
env ironment is always an on-going process, we can approach the past w ith questions
about human adaptation and the price that each group have had to pay to live the way
thev did.
Reproduced with permission of the copyright owner. Further reproduction prohibited without permission.

1.1. Theoretical Orientation
In the course o f human evolution different forces have shaped the human body.
Natural selection has modeled human biology by affecting some physical traits that, in
turn, have or have not impacted other traits. The environment where these selective
forces originate include not only the b iotic and abiotic aspects o f the world that we
inhabit, but also comprise the social conditions o f human reality: humans as bio-cultural
beings inhabit an environment that includes the complexity o f the cultural domain
(W iley. 1992: M cElroy and Townsend. 1996).
The "m odeling" o f the human body occurs through adaptation. .Adaptation here w ill
he understand as adjustments that at least in the short term aid the functioning, and
therefore '•urvival. o f an organism (Thomas et al.. 1989). Most studies about human
adaptation have emphasized the concept o f homeostasis as the main goal o f an organism,
and although it is true that internal homeostasis is essential to survival, the relationship
between an organism and its environment is anything but static. Moreover, although
adaptation is usually understood as beneficial (W iley. 1992). the truth is that sometimes
the long-term consequences for an indiv idual or an entire population are not positive.
Moreover, the adjustment may be beneficial for one population but it may have negative
consequences in other, or it may be adv antageous tor one segment o f the population but
disadv antageous fo r the m ajority.
Thus, instead o f understanding adaptation as an event we should better understand it
as a process. .Although adaptation has its benefits it also has costs, and what may seem
beneficial at a certain moment in time, may have deleterious consequences in the future.
When thinking about adaptation then, we usually focus on its positive consequences, but
Reproduced with permission of the copyright owner. Further reproduction prohibited without permission.

adaptation, or the response to stim uli may have deleterious effects also called
maladaptation.
1.1.1 Stress and Adaptation
.Adaptation and stress are interrelated concepts: stress implies the existence o f an
environmental stimulus that produces a reaction in the organism that may o r may not be
favorable. Stress, however, is not the stimulus but the reaction or responses to
environmental forces that deviates the organism from its orig inal state (M cE lroy and
Townsed. 1997). Thus, stress can be defined as the bio-behavioral response (s) to
environmental conditions (Goodman et al.. 1988; L ittle . 1995).
The environmental conditions that produce stress are called stress factors, stressors,
or noxious stim uli. Thus, an env ironmental factor has the capacity to produce a tension in
an organism that requires a response. The response can be adequate and restore the
normal function o f the organism: or. i f it is not adequate, maladaptation occurs, resulting
in precarious health (disease) and in some occasions w ith the death o f the organism
(L ittle . 1995).
The adaptation concept focuses in the positiv e consequences o f stress, the survival
and reproductive benefits that an adequate response to the stim uli can bring to an
indiv idual or population. Stress, however, can result in negative consequences and may
weaken the individual, im plying that the biological costs o f the stress factors are the other
side o f adaptation (mal adaptation).
The process o f adaptation is m ultiple and how well adjusted a human is to its bio-
cultural env ironment depends on a multitude o f processes that are not necessarily
different means to the same goal (Toulm in. 1983: L ittle . 1995). There are. throughout
Reproduced with permission of the copyright owner. Further reproduction prohibited without permission.
life , different patterns o f adaptation: 1 ) genetic (e.g. mutations). 2) developmental, 3)
reversible, seasonal o r flexible. 4) conscious o r calculated. 5) homeostatic o r autonomic,
and 6) evolutive, selective or populational (L ittle , 1995). These mechanisms act together
and can be seen in different aspects: 1 ) genetic success or Darwinian fitness, 2) functional
morphogenesis. 3) physiological responses. 4) social fiex ib ility . 5) cultural cohesion. 6)
intellectual variab ility , and 7) technological refinement (Toulm in. 1983).
Consequently, the stress to w hich an individual is exposed is the result o f different
factors that include natural, cultural, \ocia l environment, and the individual’ s
characteristics (phenotype). .Accordingly, stress is the result o f three factors: 1 )
environmental restrictions. 2) cultural systems, and 3) host resistance (Goodman et al..
1984).
Environmental restrictions include lim ited resources and stress factors that may or
may not be filtered by the cultural system. Thus, the cultural system (e.g. taboos) can
provide the means to buffer the environmental restrictions and therefore, to protect the
individuals: health-enhancing behav ior. The socio-cultural system, however, can also
increase the existing stress factors through behav io r and norms: health-lowering o r i l l-
provoking behavior (Dunn and Janes. 1986). I f the stress is not adequately buffered, its
effects can only be counteracted through host resistance, which is biological (as opposed
to cultural o r social) and varies w ith age. sex. heredity, nutritional well-being and
personal health ( Huss-Ashmore et al.. 1982: Goodman et al.. 1984: 1988).
.Among the individual responses there is a hierarchy: soft tissues are generally the
more rapid ly affected, whereas the osteological response comes later. Therefore, stress
must be not only severe but also long lasting to produce a reaction in the bones (Huss-
Reproduced with permission of the copyright owner. Further reproduction prohibited without permission.

Ashmore et al.. 1982; Goodman et al.. 1984; 1988). The responses at the skeletal level,
however, are lim ited since osteoblasts and osteoclasts can deposit or remove bone
respectively. Because osteological responses are lim ited, different pathogenic agents can
produce the same bone response. In like manner, nutritional stress factors are even more
d ifficu lt to diagnose. Although, some v itam in and mineral deficiencies produce specific
skeletal lesions, studies in osteological collections have shown little evidence o f them
(Roberts and .Manchester. 1995).
Several skeletal stress indicators have been used to ev aluate the health o f present and
past populations. Some o f them arc the result o f specific pathogens, but most o f them are
not. In order to reconstruct or understand the relationship between populations and their
environments, however, we have to keep on asking i f the indicators that we have being
using to determine health status are actually the result o f stressful conditions. We should
also ask whether the information they prov ide is behavioral and not influenced or
determined by other biological factors.
1.2. Intent and Relevance o f the Studv
In the present research, tw o non-specific skeletal indicators o f stress are considered:
Harris lines and enamel hypoplasia. These indicators show the occurrence o f stress events
during the growth and development o f the individual. Analysis o f these indicators, then,
can shed light on our understanding o f past and present populations’ health. Interpretation
o f these indicators, however, can be problematic due to the absence o f agreement about
the method that should be used in their detection and analysis, making their interpretation
Reproduced with permission of the copyright owner. Further reproduction prohibited without permission.
obscure (Byers. I9 9 I ctm ira A llison et al.. 1974; Ensor and Irish. 1995 contra Goodman
and Rose. 1990).
Harris Lines and Enamel Hypoplasia, nevertheless, remain important in
bioarchaeological. anthropological and clin ical studies because unlike other stress
markers, which give a static picture o f the individual, mainly at the time o f its death, they
offer a retrospective record o f infant or childhood stress events.
These indicators, therefore, highlight stress events that affected the individual during
the early stages o f its development. The incidence o f these markers is an indication o f
health w ith in a population, as they, apparently, respond to conditions o f diminished
health.
The intent o f this study is to evaluate the possible existence o f a correlation between
these two indicators, and the alternative explanations for its presence/absence. A positive
correlation between these two markers would show us that they respond to sim ilar
environmental conditions. A negative correlation m ight be the result o f a differential
response. .An absence o f correlation would shed light on the v a lid ity o f these markers as
stress indicators. As these markers are used to reconstruct past and present populations
health status, their evaluation as stress markers can shed light in the valid ity o f those
studies.
In order to accomplish this, two prehistoric populations. Az-140 (Az: Azapa) and Az-
71 (only the immature segment o f the population), from northern Chile were selected,
considering their good preserv ation, sample size and the large number o f immature
individuals w ith dental and skeletal elements preserved.
Reproduced with permission of the copyright owner. Further reproduction prohibited without permission.
W hile this thesis w ill test for the coincidence o f these stress markers, using two
populations o f the same area, future work could well include the examination o f health
among other populations o f this area, o r betw een populations o f the same periods, that
occupied other regions o f the South Central Andes. Thus, the results o f this study have
possible wide implications for the field o f Physical Anthropology and c lin ica l studies.
1.3. Chapter Organization and Contents
This thesis is organized in six chapters. The second chapter, containing the literature
review, considers the two skeletal markers under study. Bone composition, bone growth
and tibial grow th are explained. Harris lines are defined and their mechanism o f
formation, etiology and alternative methods o f study are characterized. A discussion o f
dental development and a description o f enamel deposition precede a defin ition o f enamel
hypoplasia. This section is followed by the description o f enamel hypoplasia formation,
its etiology, and the different methods used in its study. The chapter ends w ith a b rie f
review o f studies that have analyzed the correlation between these two stress indicators.
Chapter III refers to the purpose o f the study, the problem, and the hypothesis under
consideration. Chapter IV corresponds to materials and methods and includes a
description o f the area and the archaeological periods to which the skeletal sample
utilized correspond. Chapter V exposes the results and is organized by indicator. Harris
lines followed by enamel hypoplasia, and concludes w ith the statistical analysis o f the
correlation between these two skeletal markers. Chapter V I contains the conclusions and
the implications o f this study.
Reproduced with permission of the copyright owner. Further reproduction prohibited without permission.
CHAPTER n
PURPOSE OF TH E STU'DY
II. 1. Problem
Paleopathology focuses on the study o f pathological conditions in past populations.
This type o f study can concentrate on one individual, w ith the intention o f elucidating
characteristics o f its life , or on a population in order to identify the env ironmental
conditions to which it was exposed and which it created. In order to do this,
anthropologists must examine different pathological conditions. For this reconstruction o f
the environment to he reliable, though, the skeletal markers used in this endeavor must be
valid and reliable. It is important then, to critica lly evaluate these skeletal markers and
cla rify , as much as possible, their etiology and relation to one another.
Two skeletal markers, enamel hypoplasia and Harris lines, are o f special importance
in paleopathological studies, particularly because they are some o f the few that can
inform us about the health status o f the individuals during childhood development, even
i f they survived into adulthood. Although widely recognized as important, even for
c lin ical modem studies, there is no agreement about the etio logy o f Harris lines. Thus, its
interpretation as an stress indicator is questionable, and its u til ity in the reconstruction o f
past populations’ health status remains debatable (Green et al.. 1985; Baxter, 1986;
Reproduced with permission of the copyright owner. Further reproduction prohibited without permission.
Magennis. 1990 contra Acheson. 1959: Gam et a l„ 1968: Park. 1964: Hummert and Van
Gerven. 1985: Goodman. 1996).
The second marker. EH. also present some problems. A lthough EH etiology is well
known, its interpretation as a stress marker is dubious because sensitivity to its formation
is inter -and inira- tooth specific. Therefore it is questionable to what extent this
d ifferentia l sensitivity biases its appearance in the dental record, and. w ith it. our
understanding o f past populations' health status (Dean 1987: Goodman and Rose. 1990:
Condon and Rose. 1992: W right. 1997: Santos and Coimbra. 1999).
II. 1.1. .Aim o f the Study
The aim o f this study is to tests the existence o f a correlation between these two non
specific indicators o f stress found in skeletal remains: Harris lines and enamel
hypoplasia.
The correlation has to be determined at two levels:
Correlation at the individual level: Coincidence in the presence/absence o f these
indicators.
Correlation at time o f occurrence: I f the correlation is positive it would show that
these two markers respond to the same conditions.
II.2. Hvpothesis
In this study, a correlation between the two stress indicators is estimated by matching
Harris lines w ith enamel. The presence/absence o f a chronological correspondence, is
also evaluated, according to the fo llow ing hypothesis:
HO: There is no correlation.
Reproduced with permission of the copyright owner. Further reproduction prohibited without permission.

10
H 1 : There is correlation (positive or negative) between the two indicators.
The presence o f correlation may indicate that:
1 ) The etiology o f the two indicators is sim ilar:
2) They are equally sensitive to environmental conditions: and.
3) They are equally reliable as indicators o f stress.
Whereas the absence o f correlation may signify that both indicators have:
1) D ifferent etiology:
2) D ifferent sensitive to stressful events: and.
3) Different re liab ility as stress indicators.
Whereas the presence o f a negative correlation may im ply that:
When one developmental system is affected by environmental conditions, the other is
protected.
Thus, the nature o f the correlation between these tw o stress markers can elucidate
their co-occurrence in terms o f presence absence and also in chronological terms.
Reproduced with permission of the copyright owner. Further reproduction prohibited without permission.
CHAPTER m
LITER ATU R E REVIEW : NON-SPECIFIC S K E LE T A L INDICATORS OF G RO W TH
DISRUPTION
Growth layers exist in the structural parts o f many biological systems, and they
usually re fleet a rhythm ic metabolism, which m irror the relationship between biological
systems and the environment (Dean. 1987). Bone and teeth present these layers,
however, a variety o f stressors can permanently alter skeletal growth, teeth development,
and they can also alter bone dimensions, as reflected by Harris lines and enamel
hypoplasia.
The analyses o f other skeletal lesions often show the relationship between health
status and stress markers is complex, and these two indicators are no exception (Saunders
and Hoppa. 1993). Harris lines and enamel hypoplasia, however, are extremely important
because they may be indicative o f childhood conditions (Buikstra and Cook. 1980:
Corrucini et al.. 1985: Hummert and Van Gerven. 1985: Saunders and Hoppa. 1993:
Roberts and Manchester. 1995).
In order to understand what the presence o f these indicators mean we have to analyze
bone growth and enamel deposition and how these two growing processes can be altered
by environmental conditions. It is also necessary to consider how the deviation form
normal growth can result in the appearance o f Harris lines and enamel hypoplasia.
I I
Reproduced with permission of the copyright owner. Further reproduction prohibited without permission.

12
in .I. Bone Composition. Bone Reaction and T ib ia l Growth
III. 1.1. Bone Composition and Bone Reaction
Bone is a connective tissue composed by liv ing cells imbedded in an extracellular
matrix o f collagenous fib rils made rig id by calcium salts. In fact, bone matrix is heavily
calcified, which gives bone its strength. The embedded cells o f the bones are known as
osteocytes (Steinbock. 1976: Cormack. 2001).
Normal bone formation in the growing skeleton, a process known as ossification or
osteogenesis, occurs through two different processes: endochondral and
intramembranous. Endochondral ossification is the major process o f bone growth until
the fusion o f the epiphyses occurs: it consists o f the continuing replacement o f the
cartilage matrix at both epiphyseal plates resulting in the lengthening o f the diaphysis
(Steinbock. 1976: Cormack. 2001).
Long bones, then, continue to lengthen as a result o f interstitial growth o f their
cartilaginous plates. In the growth o f cartilaginous plates, the cartilage production is
compensated by cartilage loss through calcification, visualization, and bony replacement
on the diaphyseal side o f the plate. By growing on one side and becoming replaced by
bone on the other, the epiphyseal plates are progressively separated, lengthening the
diaphysis. Cartilage replacement eventually supersedes cartilage production, so when
bones are approaching fu ll size their epiphyseal plates disappear (Cormack. 2001).
Bone deposition and growth, however, are not the only mechanisms required in the
formation o f properly proportionate bone: bone resorption is also necessary (Steinbock.
1976). Bone resorption is the dissolution o f both the organic matrix and its mineral
content. The osteoclasts appear to play the major role in this process. Osteoclasts secrete
Reproduced with permission of the copyright owner. Further reproduction prohibited without permission.

13
acidic substances that dissolve the bone mineral and lysosomal enzymes that
depolymerize the organic matrix. This extracellular digestion releases minute bone
fragments, which are ingested by the osteoclasts and digested intracellulary (Steinbock,
1976).
Pathological conditions create an imbalance in the normal equ ilib rium o f bone
resorption and formation. Bone reacts then, to abnormal conditions by an increase or
decrease in the normal processes o f bone formation, bone resorption, or a combination o f
the two processes at different locations in the bone (Steinbock. 1976).
HI. 1.2. Growth Plate Structure and Function
During skeletal growth, interposed between the epiphysis and metaphysis is the
cartilage grow th plate, w hich effects longitudinal bone growth (Hunzinker. 1988). The
growth plate is composed o f cartilage. Cartilage is a strong but slightly flexib le semirigid
supporting tissue that plays a key role in the development and growth o f long bone. The
growth plate function is to continue the cartilage growth, which in time is replaced by
bone, providing the growth, at least in length, o f the bone until the adult stature is
obtained (Steinbock. 1976; Cormack, 2001).
The cartilage found in the growth plate corresponds to the hyaline type that contains
cells called chondrocytes. The hyaline cartilage, in the growth plate, is enlarged through
appositional growth, which involves the addition o f new surface layers o f matrix on top
o f the preexisting ones (Cormack, 2001 ).
.Morphological examination o f cells w ith in the growth plate cartilage shows that the
chondrocytes are arranged in axial columns separated from one another by longitudinal
septa o f cartilage matrix. Individual cells w ith in columns are separated by horizontal
Reproduced with permission of the copyright owner. Further reproduction prohibited without permission.
14
septa. The cells w ith in a column represent both the histogenic (a ll originated from a
single stem cell, and thus together comprise a clone) and functional units for longitudinal
bone growth (Hunzinker. 1988).
The growth plate is a unipolar structure, meaning that it grows in one direction only.
There are five zones in the growth plate: 1 ) reserve zone. 2) upper proliferative zone. 3)
lower proliferative zone. 4) upper hyperthropic zone, and 5) lower hyperthropic zone.
The reserve or germinative zone contains cells that accumulate nutrients and may serve
as the stem cells fo r the proliferative zone. This layer is adjacent to the epiphyses, and the
stem cells located in this layer present a low rate o f division compared to the daughter
cells that develop into proliferative chondrocytes. A fter having gone through a finite
number o f mitoses, these cells lose their potential to divide and their genetic program is
abruptly switched to begin a massive hypertrophy (Acheson. 1959: Buckwalterei al..
1985: Hunzinker. 1988).
In the proliferative zone chondrocytes divide rapidly and synthesize extracellular
matrix increasing the volume o f the growth-plate cartilage and producing longitudinal
growth. In the hypertrophic-zone the cells may participate in matrix-synthesis and help to
prepare the matrix fo r m ineralization (Buckwalter et al.. 1985). Once the hypertrophied
chondrocytes have disintegrated, capillaries and osteoblasts invade them, the latter laying
down osteoids around the calcified remnants o f the matrix (Magennis. 1990).
HI. 1.2. T ib ia l Growth
The human pattern o f growth from birth to maturity is qualita tive ly and quantitatively
different from the pattern observed in other mammals and even other primates. Most non
primate mammals grow in size and develop towards sexual m aturity along a continuous
Reproduced with permission of the copyright owner. Further reproduction prohibited without permission.
15
path from birth to adulthood, w ith no biological or mathematically discernible alterations,
in growth trajectory. In humans, however, the pattern o f growth is complex and it
presents characteristics that differentiate it from the pattern observed in other animals.
These differences include: I) a delayed sexual development; and 2) a neurological
development that is. about 907c before sexual maturity is achieved (Bogin. 1999).
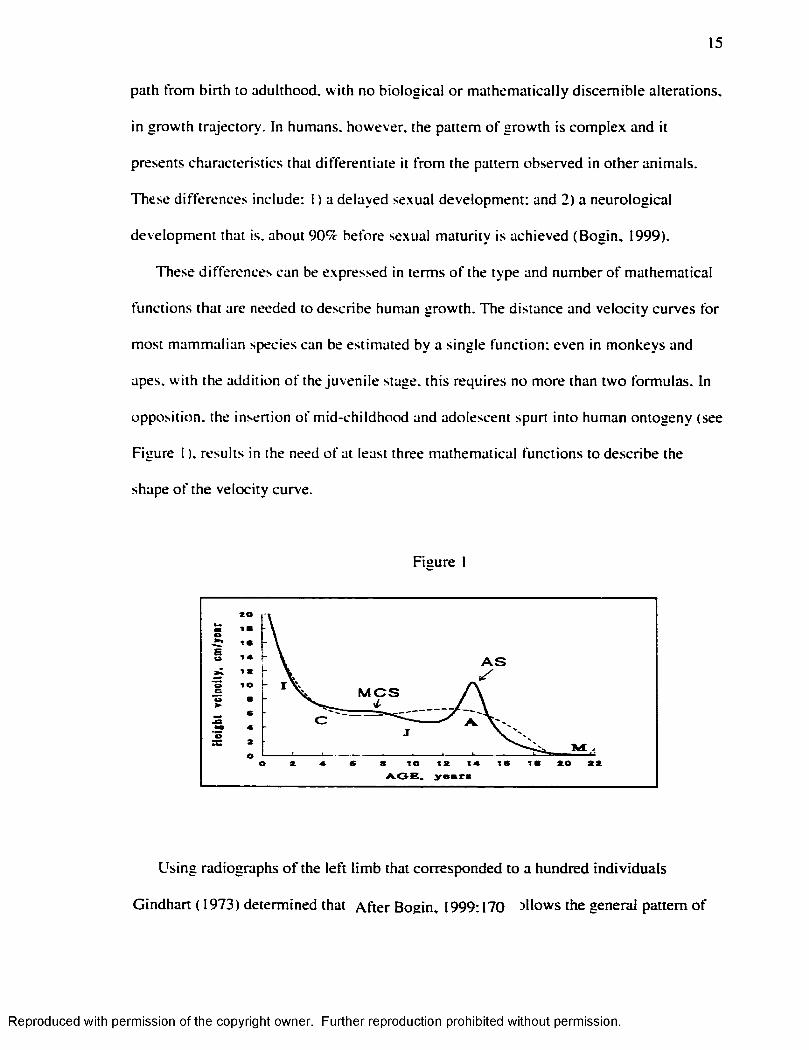
These differences can be expressed in terms o f the type and number o f mathematical
functions that are needed to describe human growth. The distance and velocity curves for
most mammalian species can be estimated by a single function; even in monkeys and
apes, w ith the addition o f the juvenile stage, this requires no more than two formulas. In
opposition, the insertion o f m id-childhood and adolescent spurt into human ontogeny (see
Figure I ). results in the need o f at least three mathematical functions to describe the
shape o f the velocity curve.
Figure I
20
I B
I B
A Stcto
M C S
C
I Br to t2 A.OB» ye*r#
Using radiographs o f the le ft lim b that corresponded to a hundred individuals
Gindhart ( 1973) determined that A fte r Bogin, 1999; 170 allows the general pattern o f
Reproduced with permission of the copyright owner. Further reproduction prohibited without permission.
16
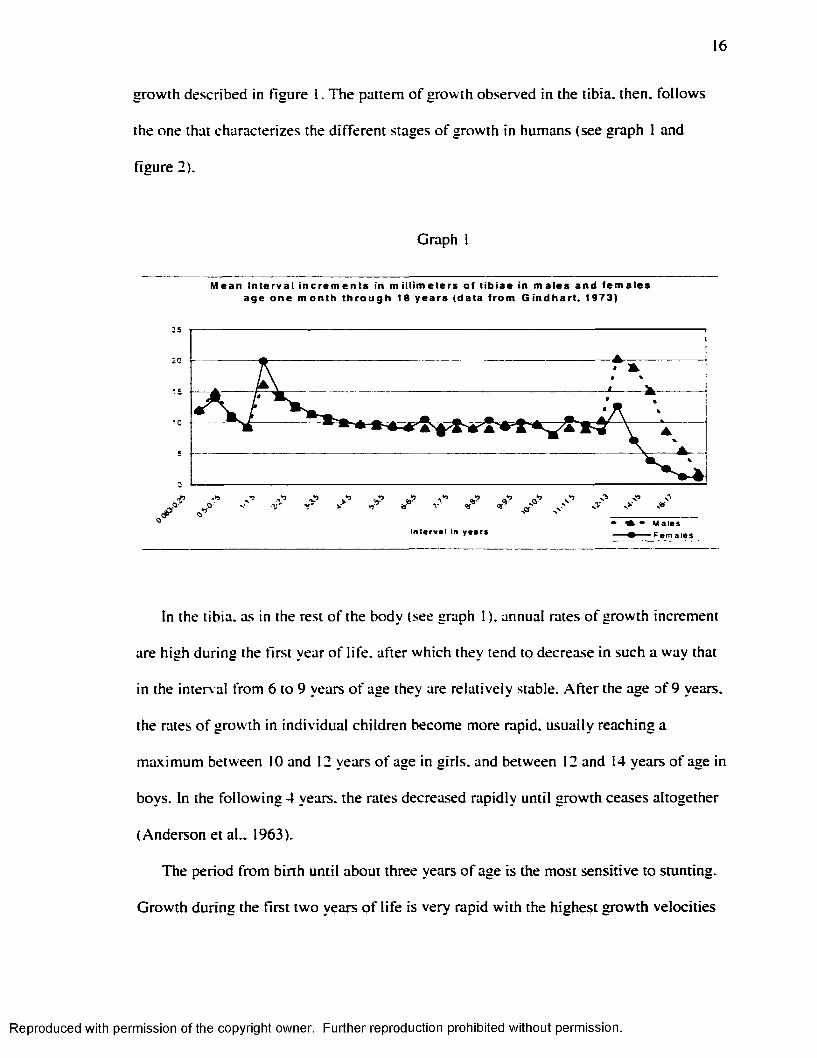
growth described in figure 1. The pattern o f growth observed in the tibia, then, follows
the one that characterizes the different stages o f growth in humans (see graph 1 and
figure 2).
Graph
M ea n In te rva l i n c r e m e n t s in mi l l imete rs of t ib iae in m a le s and f e m a l e s age on e m o n t h t h r o u g h 18 years (data f rom G in d h a r t . 1973)
25
20
O f'
A - Wal esIn te r v a l in y e a rs - F e m a l e s
In the tibia, as in the rest o f the body (see graph 1 ). annual rates o f growth increment
are high during the first year o f life , after which they tend to decrease in such a way that
in the interval from 6 to 9 years o f age they are relatively stable. A fte r the age o f 9 years,
the rates o f growth in individual children become more rapid, usually reaching a
maximum between 10 and 12 years o f age in girls, and between 12 and 14 years o f age in
boys. In the fo llow ing 4 years, the rates decreased rapidly until growth ceases altogether
(Anderson et al.. 1963).
The period from birth until about three years o f age is the most sensitive to stunting.
G rowth during the first two years o f life is very rapid w ith the highest growth velocities
Reproduced with permission of the copyright owner. Further reproduction prohibited without permission.
17
immediately after birth until the year. Thus, the first few years o f life represent a period
when adverse factors can have a significant and lasting effect on growth (Saunders and
Hoppa. 1993).
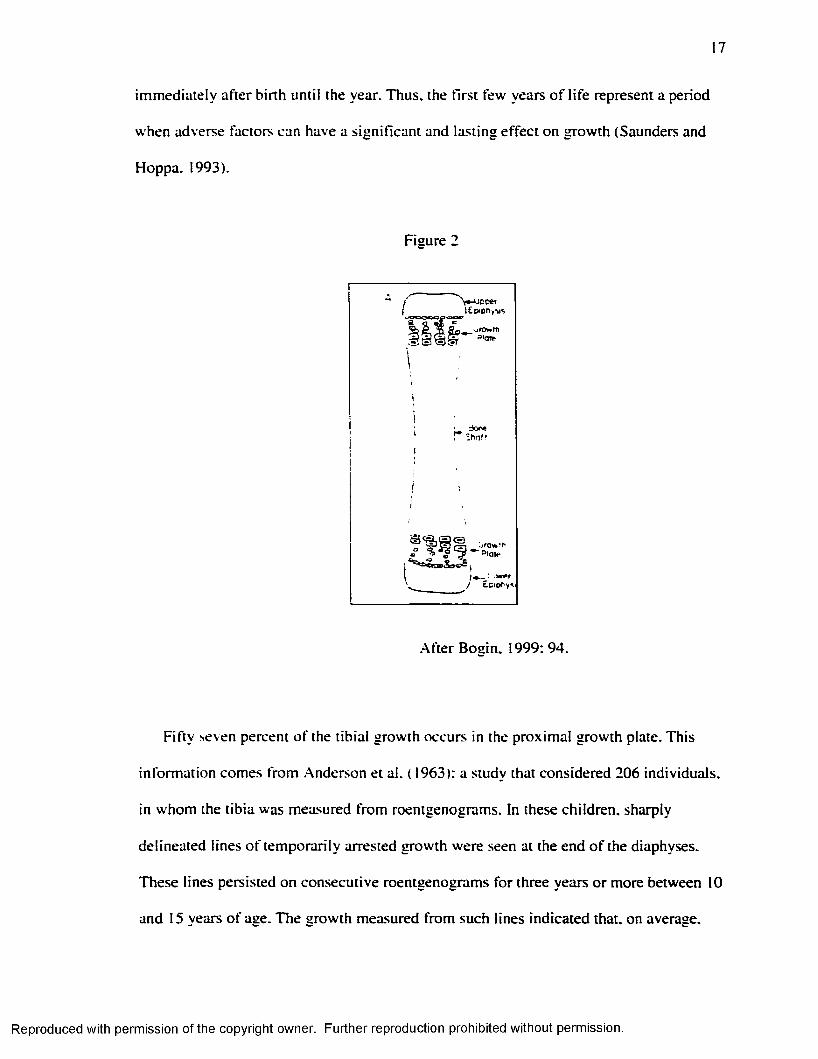
Figure 2
.After Bosin. 1999: 94.
F ifty seven percent o f the tib ia l growth occurs in the proximal growth plate. This
inform ation comes from .Anderson et al. ( 1963): a study that considered 206 individuals,
in whom the tib ia was measured from roentgenograms. In these children, sharply
delineated lines o f temporarily arrested growth were seen at the end o f the diaphyses.
These lines persisted on consecutive roentgenograms for three years or more between 10
and 15 years o f age. The growth measured from such lines indicated that, on average.
Reproduced with permission of the copyright owner. Further reproduction prohibited without permission.
18
57% o f the total tib ia l growth arose at the proxim al metaphysis during this age interval
(Anderson et al., 1963).
Consequently, analyses o f Harris lines need to consider the percentage that each
growth plate contributes, to the length o f the tib ia or any other long bone under study.
III.2 . Harris Lines
Because bone grows and calcifies in an appositional manner, it can record, w ith in its
structure, in the form o f Harris lines, the effects o f disturbances in the body metabolism
( Massler et al.. 1941).
IÎI.2.1. D efin ition
Harris lines (H L ) are a non-specific condition in terms o f etiology. They are identified
as dense, radio-opaque transverse lines, perpendicular to the main axis o f bone growth
that can be seen in radiographs or using cross section samples. The lines are essentially
trabecularly oriented at a right angle in relation to the diaphysis (Gam et al.. 1968:
Buikstra and Cook. 1980: .Martin et al.. 1985: Roberts and Manchester. 1995; Goodman.
1996).
Structurally, transverse lines are strata o f denser and thicker bony trabeculae w ith in
the medullar cavity: these lines are radiographically visib le because o f the increased
mineralization that results from the irregular mineral deposition in the trabeculae. Studies
have shown that the mineralization value fo r these lines is 5-15% above normal bone.
Therefore. H L involve a quantitative alteration o f bone structure and do not constitute
solid disc o f tota lIv different bone (E llio t. 1927: Gam et al.. 1968: Buikstra and Cook.
Reproduced with permission of the copyright owner. Further reproduction prohibited without permission.
19
1980; Hummert and Van Gerven, 1985: M artin et al., 1985: Roberts and Manchester,
1995: Goodman. 1996).
Lines o f increased density may. on occasion, be seen on any o f the tubular bones.
T ib ia , femur and radius, however, tend to be the most affected ones. The distal tib ia
shows lines more frequently than any other bone and. therefore, is the most commonly
used one in this type o f study. .Although the lines have been more com monly studied in
long bones, they have also been detected in the pelvis, the bodies o f the vertebrae, the
ribs, and the nuclei o f the epiphyses (E llio t et al.. 1927).
I I I .2.2. Mechanism o f Formation
A transverse line results from the uncoupling o f osteoblastic and chondroblastic
activ ity where the former continues and the latter (cartilage growth) slows or stops
(Magennis. 1990). As chondroblasts and osteoblasts are different cells that work under
different regulatory controls, different hormones affect them (Green et al.. 1985). Growth
hormone (GH) and one type o f somatomedin, specifically insulin like growth factor I
(IG F-I). are d irectly involved in the growth o f the cartilage plate (Baxter. 1986). Growth
hormone interacts w ith the prechondrocytes promoting their conversion into
chondrocytes, while IGF-I stimulates the m itotic d ivision o f the chondrocytes in the
proliferative zone (Green et al.. 1985).
An overproduction o f GH. circulating levels o f which tend to fluctuate, must be
countered by a diminished production o f IG F -1 in order to avoid chondrocyte mitoses
running out o f control. In that case, and because these mechanisms do not necessarily act
simultaneously on the osteoblasts. H L may form because the osteoclasts continue to
deposit bone (Magennis. 1990).
Reproduced with permission of the copyright owner. Further reproduction prohibited without permission.
20
The mechanism then, would operate as fo llows: i f cartilage growth slows o r stops, the
growth plate becomes thin and compressed, as the chondrocytes (due to a d im inution in
IGF-I) fail to reproduce and mature. The osteoblasts, then, are no longer capable o f
invading the cartilage and are displaced horizontally under the cartilage plate, resulting in
a transverse stratum o f bone (Magennis, 1990).
Line formation, then, can only occur while the bones are grow ing: as the length o f the
bone increases they later appear on the diaphyses ( Buikstra and Cook. 1980: Hummert
and Van Gerven. 1985: Roberts and Manchester. 1995). .After its formation, however, a
line can disappear. Indeed, lines and bands come and go so dram atically that a broad
band is often reduced to a line or even vanishes completely over a period o f years or. in
some instances, months, although some lines do persist from childhood to adulthood.
Moreover, an in itia lly broad band may. in the course o f growth, be reduced to a line o f
less than a m illim eter in w idth. Most commonly, lines and bands appear in early
childhood and then disappear in the course o f bone remodeling as a result o f
subperiosteal apposition and endosteal surface resorption (Harris. 1931: Gam et al..
1968).
in.2.3. Etiology
Line formation appears to be related w ith an increased secretion o f p itu itary growth
hormone and a decreased level o f IG F -1 (Dreizen et al.. 1964: Baxter. 1986). Growth
hormone levels are very high in children suffering from kwashiorkor and other forms o f
malnutrition while circulating IG F-I levels are dim inished by low nutrient intake. As a
result o f this imbalance the bone ceases to grow and a transverse line m ight be formed
(Baxter. 1986).
Reproduced with permission of the copyright owner. Further reproduction prohibited without permission.

21
"When nutritional disturbances in the young animal become so severe that
nutrient material is inadequate to go around, in the economy o f nature the bones are
sacrificed." (Park. 1964).
Thus, under stressful conditions, then, the organs on which continued existence
depends are given preferential treatment, and as a result the bones simply cease to grow.
When the crisis is over the bones proceed to grow again, however, the bone arrest leaves
marks on the bones identified as Harris lines. G rowth arrest needs to be complete, or
nearly complete, fo r line formation; merely slowing o f growth is not sufficient (Park.
1964; Mays. 1995).
Growth retardation is w idely recognized as a response to a lim ited nutrient supply at a
cellu lar level (Acheson. 1959). M alnutrition, however, is not the only possible cause:
infectious conditions, synergistically related to m alnutrition, are another etiological
factor. It is d ifficu lt to separate the impact o f these two conditions on growth, as
malnourished children are more sensitive to infections, due a weakened health state and
reduced host resistance, and infections, in time can result in malnutrition by increasing
the nutrient demands in the body (Saunders and Hoppa. 1993).
The precise etiology o f these lines is varied and controversial, but their formation has
often been associated w ith episodes o f stress like nutritional deficiencies or childhood
diseases. Based on experiments on animals, and observ ations in humans, it has been
showed that H L can result from nutritional stressors, like anemia, rickets, and
deficiencies in vitam in A . C and D. protein m alnutrition, kwashiorkor or general
defective nourishment. Harris lines have also been associated w ith infections such as:
measles, scarlet fever, infantile paralysis, pneumonia, and immunization procedures
Reproduced with permission of the copyright owner. Further reproduction prohibited without permission.
22
(E llio t, et al.. 1927; Harris. 1931; Buikstra and Cook. 1980; Lobdell, 1984; Hummert and
Van Gerven. 1985; M artin et al.. 1985; Roberts and Manchester. 1995; Lewis. 2000).
Other causes, like ingestion o f heavy metals (lead, bismuth and phosphorus) and massive
doses o f vitam in D have also been identified (Park. 1964; Gam et al.. 1968).
In addition, ethanol consumption during the growth period has being recognized as
one o f the triggers o f H L (Gonzalez-Reimers et al.. 1993). Gonzalez-Reimers et al.
( 1993) found that patients who confessed having consumed alcohol during growth period
showed statistically significant more H L than non-consumers. Ethanol intake may cause
H L by leading to an imbalance between energy intake and energy expenditure, due to. at
least in part, the energy-w asteful metabolism o f the microsomal-ethanol ox id iz ing system
(MEO). linked to chronic ethanol consumption.
Harris lines, then, represent periods o f stress that disrupted the normal metabolism
w hile the bones were grow ing in length. In order for a stress event to cause H L it needs to
arrest the growth process o f the bone; H L are. then, interpreted as a growth arrest
indicator (Gam et al.. 1968; Hummert and Van Gerven. 1985; Goodman. 1996).
It is necessary to consider, though, that in many diseases, as in many states o f
malnutrition, bone growth continues even at the expense o f preformed bone. Therefore,
radio-opaque lines are not the invariable consequence o f every impairment o f health
occurred during the grow ing period (Gam et al.. 1968). and the association o f H L w ith
illness, although apparently strong, is far from being a one-to-one correspondence
(Hew itt et al.. 1955).
In fact, some studies have shown that a new line may appear even though no disease
was reported in the previous six months. Longitudinal studies have shown that there is a
Reproduced with permission of the copyright owner. Further reproduction prohibited without permission.
23
low-order association between illness or trauma and the appearance o f a new line (Park,
1964; Gam et al., 1968).
A different interpretation o f the etiology o f H L is offered by Magennis ( 1990).
According to this author it is tme that growth is linked to the formation o f transverse
lines; in fact, regression analysis shows that there is a statistically significant relationship
between growth increment and the occurrence o f a transverse line. But. i f we consider
that nutritional and disease insults are com monly associated w ith slowed growth, then an
association between slowed growth and H L should be expected. However, this
association does not occur; on the contrary H L are usually formed during periods o f rapid
growth (.Magennis. 1990). Growth alone, then, is sign ificantly related to the formation o f
a H L and the results support the notion that greater increment o f growth precedes line
formation (Magennis. 1990). Accordingly. Magennis ( 1990) sustains that the generally
held idea that physiological insults, including diseases and nutritional insults, are the
primary underlying cause o f Harris lines, is questionable.
Indeed, some studies have shown that irrespective o f the presence or absence o f
nutritive failure, the incidence o f H L decreases as the children approach adolescence, and
then, nutritional status per-se is not the determining factor in susceptibility fo r H L. in
growing children (Dreizen et al.. 1956; 1964). Accord ing ly Magennis ( 1990) estimated
that transverse lines reflect tissue level responses to regulation o f growth rate at the
epiphyseal cartilage plate and not necessarily stressful conditions.
III.2.4. A ltem ative Methods o f Analysis
There are two basic types o f Harris lines studies. In the first type o f study, a total
count o f H L is made. The number o f lines per skeleton indicates the health status o f the
Reproduced with permission of the copyright owner. Further reproduction prohibited without permission.
24
individual or the population, during childhood. A second type o f study is characterized by
the attempt made to estimate the age o f the individual at the time o f H L formation (Maat.
1984 ). As the position o f the line reflects the size o f the shaft at the time o f the line
tbrmation. and because long bone growth-rate is known, calculation o f the age o f
formation should be possible.
Age determination o f the occurrence o f these stress episodes may provide:
1 ) Population frequencies and distribution o f lines by specific ages (that can elucidate
some cultural behaviors, e.g.. weaning): and.
2) Evaluation o f the patterns o f lines found w ith in individuals. Indeed, w ith in
individuals, the temporal pattern may be use to analyze the existence o f regular cycles o f
stress, that may be associated w ith seasonal food deprivation (Buikstra and Cook. 1980:
.Martin et al.. 1985: Goodman. 1996: Lewis. 2000).
Different methods for the study o f Harris lines have been developed. A llison et al.
proposed one o f the first methods in 1974. This method assumes that at birth the length o f
the tib ia is o f 90 mm. Therefore, the first step is to measure the tib ia in mm. and then
subtract the 90 mm. The remainder, or growth area, is divided into fifths. Three fifths are
assumed to be located in the proximal end o f the tibia and two fifth in the distal shaft.
Then the distal and the proxim al growth area are divided, respectively into 16 equal parts,
equivalent to the 16 years o f tib ia l growth. The lines located in the prenatal area are not
counted because their interpretation is considered dubious (A llison et al.. 1974). Once the
distance between the line and the proximal o r distal end o f the bone has been taken, the
age o f its formation can be calculated. Although this method present the advantage o f
being simple, it has two m ajor problems:
Reproduced with permission of the copyright owner. Further reproduction prohibited without permission.
25
I ) It assumes a constant rate o f growth o f the tibia; and,
2) It assumes an average o f 90 mm for the length o f the tib ia at birth.
Therefore, this method does not seem the most adequate, o r reliable, for the study o f
Harris lines.
Hunt and Hatch (1981) proposed a different method, which is based in two
assumptions:
1 ) The relative spacing o f proximal and distal transverse lines in older children and
adolescents yields relative growth rates at the proximal and distal cartilages that apply to
all diagnosticable younger ages: and.
2) Variations between individuals and populations in these relative rates can be
neglected.
In order to apply this method it is necessary, in the first place, to determine the
primary center o f ossification. This center is the site where the first diaphyseal bone is
formed in the embryo. Consequently, once the tib ia has been measured in the radiograph
k/2. or the correction factor o f combined epiphyseal sizes, is subtracted from the
maximum length o f a long bone in order to get diaphyseal length. Then, considering that
the contribution o f the proximal growth plate to the total bone length in the tib ia is 57%.
and the distal cartilage is 43%. the researcher should be able to locate the ossification
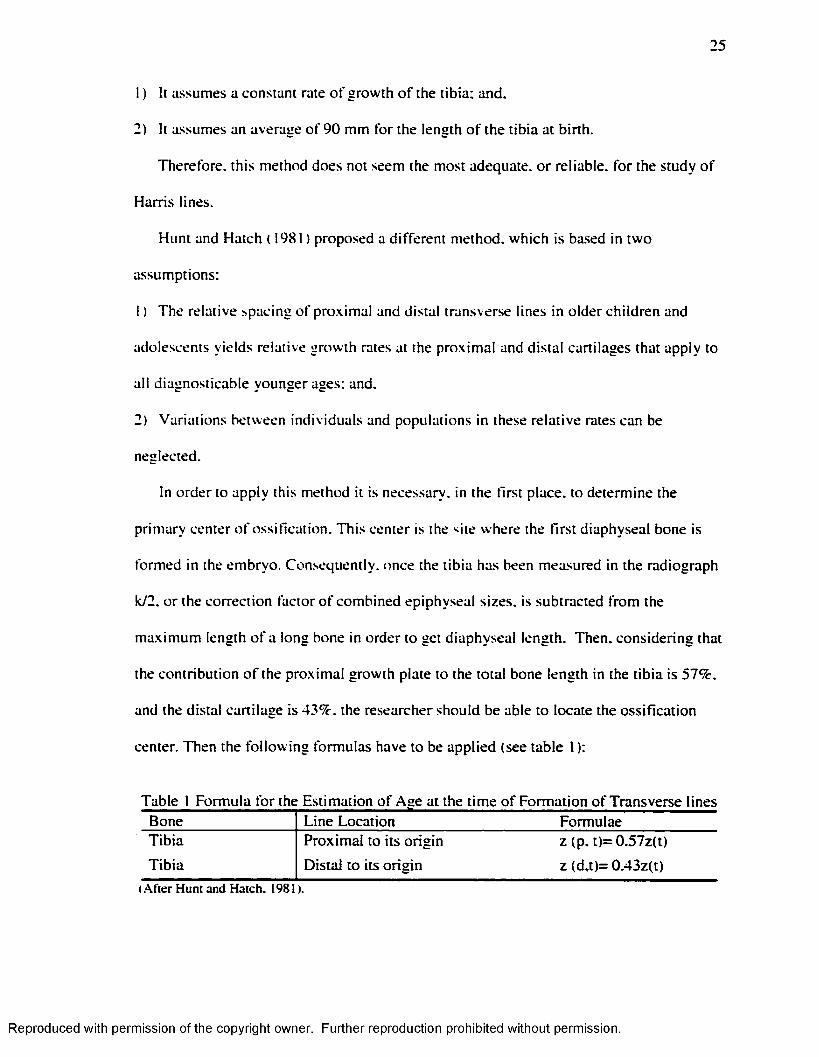
center. Then the fo llow ing formulas have to be applied (see table 1 ):
Table 1 Formula fo r the Estimation o f Ase at the time o f Formation o f Transverse linesBone Line Location FormulaeT ib ia Proximal to its origin z (p. t)= 0.57z(t)
T ib ia Distal to its orig in z (d,t)= 0.43z(t)
( A fte r H u n t an d H a tch . 1 9 8 1 ).
Reproduced with permission of the copyright owner. Further reproduction prohibited without permission.
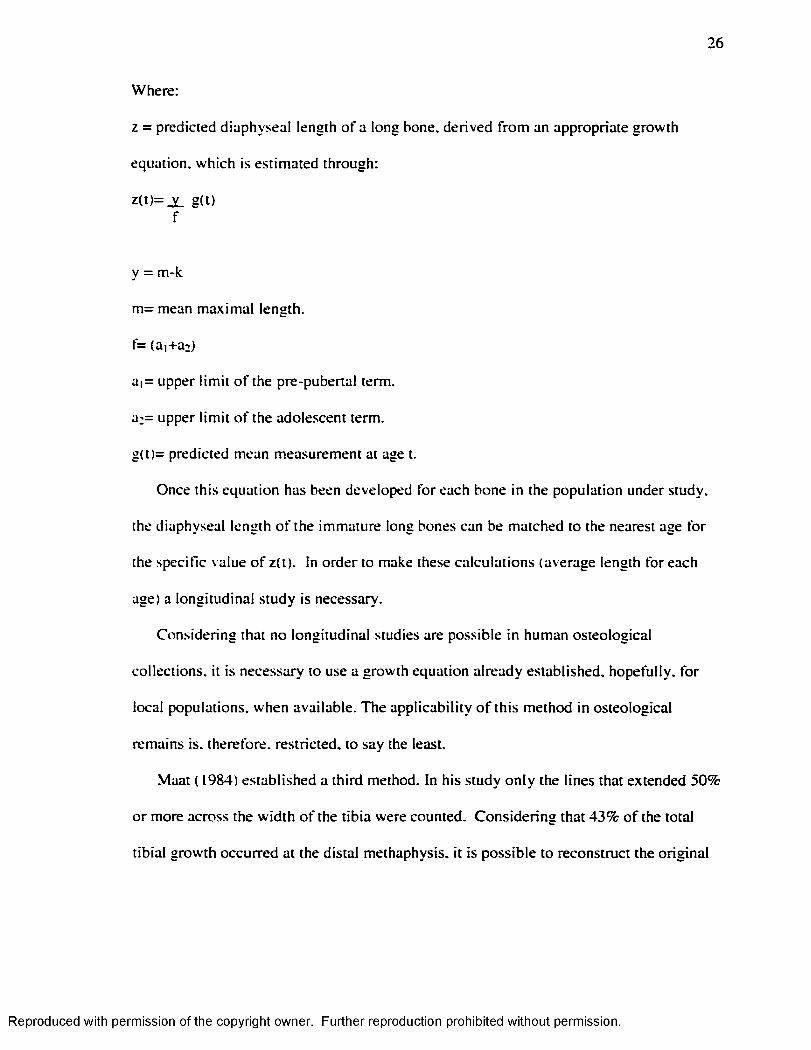
26
Where:
z = predicted diaphyseal length o f a long bone, derived from an appropriate growth
equation, which is estimated through:
z(t)= _y_ g(t) f
y = m-k
m= mean maximal length.
f= (a,+a:)
a,= upper lim it o f the pre-pubertal term.
a;= upper lim it o f the adolescent term.
g(t)= predicted mean measurement at age t.
Once this equation has been developed for each bone in the population under study,
the diaphyseal length o f the immature long bones can be matched to the nearest age for
the specific value o f z(t). In order to make these calculations (average length for each
age) a longitudinal study is necessary.
Considering that no longitudinal studies are possible in human osteological
collections, it is necessary to use a growth equation already established, hopefully, fo r
local populations, when available. The applicability o f this method in osteological
remains is. therefore, restricted, to say the least.
Maat ( 1984) established a third method. In his study on ly the lines that extended 50%
or more across the w idth o f the tib ia were counted. Considering that 43% o f the total
tib ia l growth occurred at the distal methaphysis. it is possible to reconstruct the original
Reproduced with permission of the copyright owner. Further reproduction prohibited without permission.
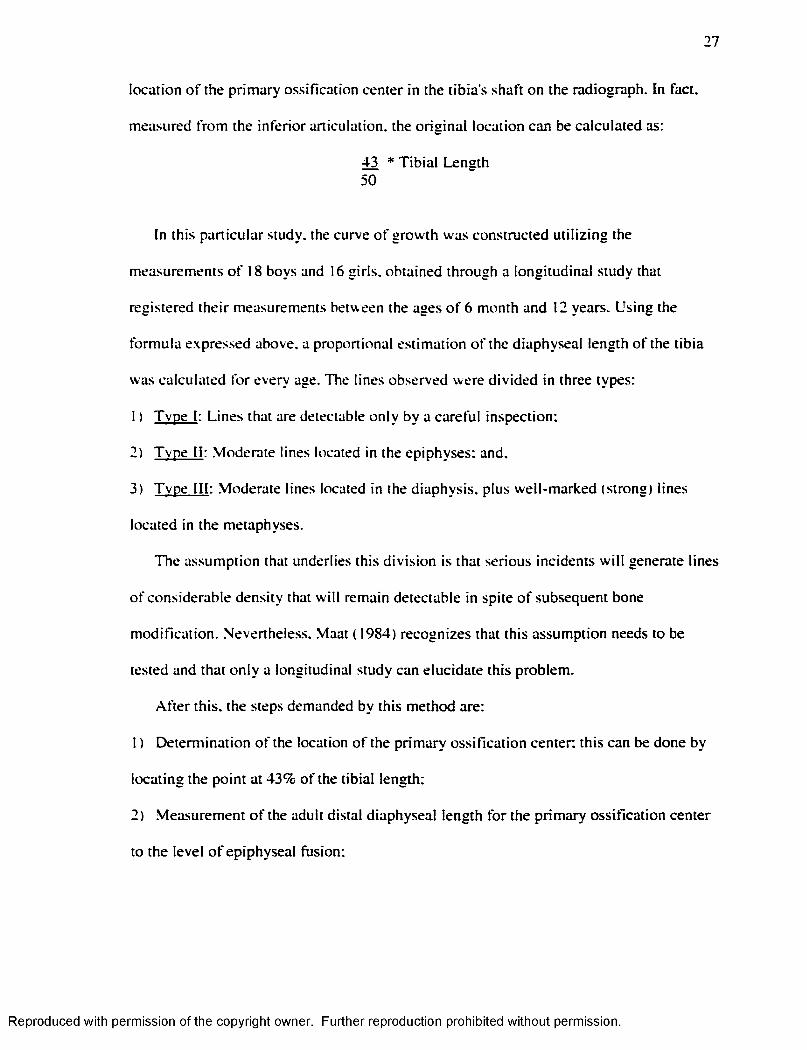
27
location o f the primary ossification center in the tib ia ’s shaft on the radiograph. In fact.
measured from the in ferior articulation, the orig inal location can be calculated as:
43 * T ib ia l Length 50
In this particular study, the curve o f growth was constructed u tiliz ing the
measurements o f 18 boys and 16 girls, obtained through a longitudinal study that
registered their measurements between the ages o f 6 month and 12 years. Using the
formula expressed above, a proportional estimation o f the diaphyseal length o f the tib ia
was calculated for every age. The lines observed were divided in three types:
1 ) Tvpe I : Lines that are detectable only by a careful inspection:
2) Tvpe I I : Moderate lines located in the epiphyses: and.
3) Tvpe I I I : Moderate lines located in the diaphysis. plus well-marked (strong) lines
located in the metaphyses.
The assumption that underlies this d ivision is that serious incidents w ill generate lines
o f considerable density that w ill remain detectable in spite o f subsequent bone
m odification. Nevertheless. Maat ( 1984) recognizes that this assumption needs to be
tested and that on ly a longitudinal study can elucidate this problem.
A fte r this, the steps demanded by this method are:
1 ) Determination o f the location o f the primary ossification center: this can be done by
locating the point at 43% o f the tib ia l length;
2) Measurement o f the adult distal diaphyseal length fo r the primary ossification center
to the level o f epiphyseal fusion;
Reproduced with permission of the copyright owner. Further reproduction prohibited without permission.
28
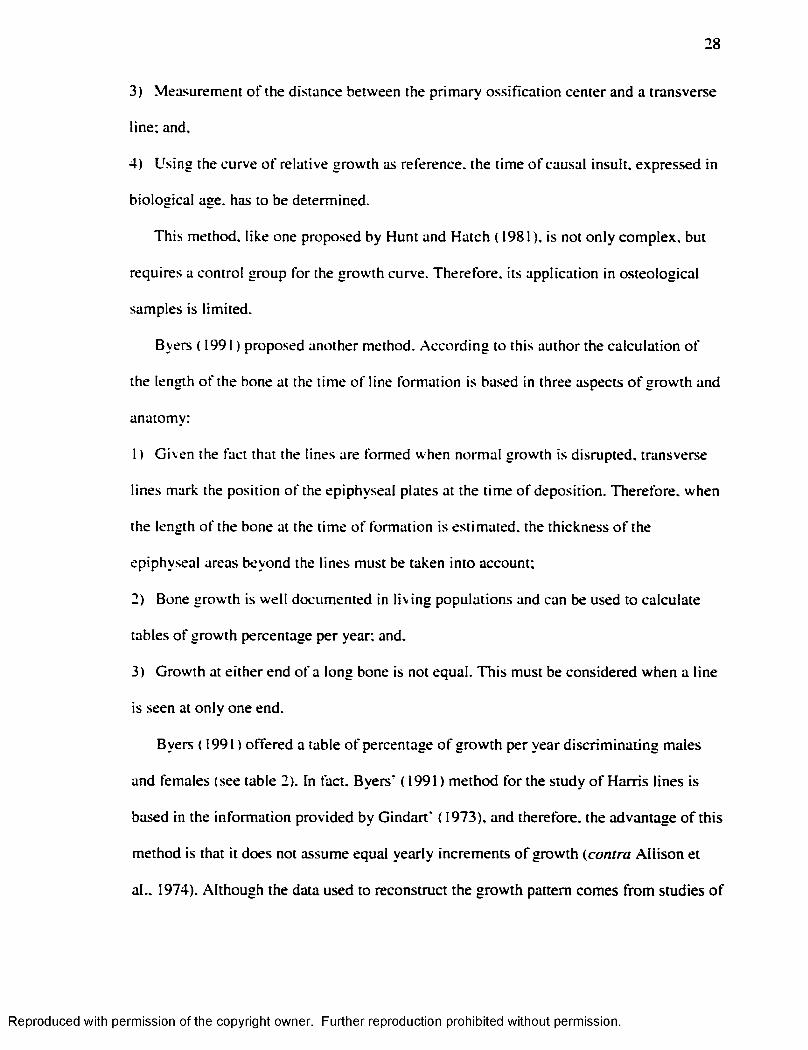
3) Measurement o f the distance between the primary ossification center and a transverse
line; and.
4) Using the curve o f relative growth as reference, the time o f causal insult, expressed in
biological age. has to be determined.
This method, like one proposed by Hunt and Hatch ( 1981), is not only complex, but
requires a control group for the growth curve. Therefore, its application in osteological
samples is lim ited.
Byers (1991) proposed another method. According to this author the calculation o f
the length o f the bone at the time o f line formation is based in three aspects o f growth and
anatomy:
1 ) Given the fact that the lines are formed when normal growth is disrupted, transverse
lines mark the position o f the epiphyseal plates at the time o f deposition. Therefore, when
the length o f the bone at the time o f formation is estimated, the thickness o f the
epiphyseal areas beyond the lines must be taken into account;
2) Bone growth is well documented in liv ing populations and can be used to calculate
tables o f growth percentage per year; and.
3) Growth at either end o f a long bone is not equal. This must be considered when a line
is seen at only one end.
Byers ( 1991 ) offered a table o f percentage o f growth per year discrim inating males
and females (see table 2). In fact. Byers’ (1991) method for the study o f Harris lines is
based in the information provided by G indart’ ( 1973). and therefore, the advantage o f this
method is that it does not assume equal yearly increments o f growth (contra A llison et
al.. 1974). Although the data used to reconstruct the growth pattern comes from studies o f
Reproduced with permission of the copyright owner. Further reproduction prohibited without permission.
29
modem populations, and the method is prone to some error ow ing to genetic and
environmental factors that may influence the growth rate o f one or all bones (Maresh.
1955). it does represent a real growth pattern.
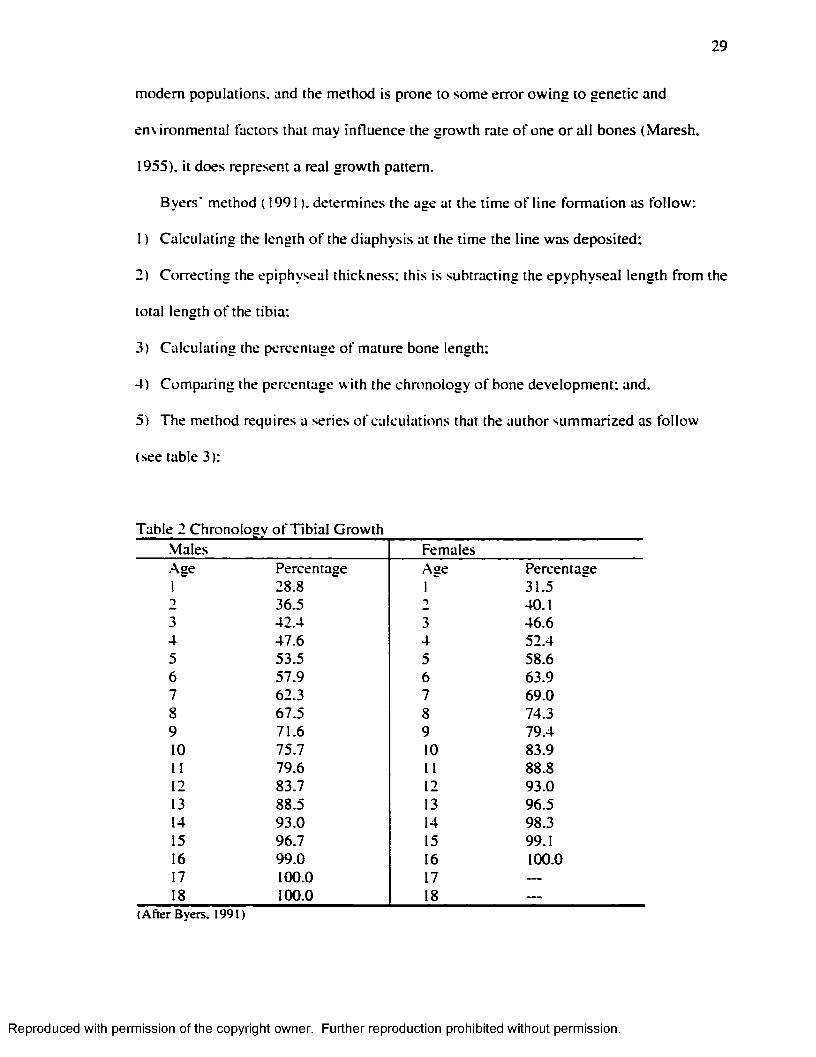
Byers' method ( 1991 ). determines the age at the time o f line formation as fo llow :
1 ) Calculating the length o f the diaphysis at the time the line was deposited:
2) Correcting the epiphyseal thickness: this is subtracting the epyphyseal length from the
total length o f the tibia:
3) Calculating the percentage o f mature bone length;
4) Comparing the percentage w ith the chronology o f bone development; and.
5) The method requires a series o f calculations that the author summarized as fo llow
(see table 3):
Table 2 Chronolosv o f T ib ia l GrowthMales Females.Age1
Percentage28.8
Age1
Percentage31.5
2 36.5 T 40.13 42.4 3 46.64 47.6 4 52.45 53.5 5 58.66 57.9 6 63.97 62.3 7 69.08 67.5 8 74.39 71.6 9 79.410 75.7 10 83.911 79.6 11 88.812 83.7 12 93.013 88.5 13 96.514 93.0 14 98.315 96.7 15 99.116 99.0 16 100.017 100.0 17 ---18 100.0 18 ---
(A fte r B y ers . 1991)
Reproduced with permission of the copyright owner. Further reproduction prohibited without permission.
30
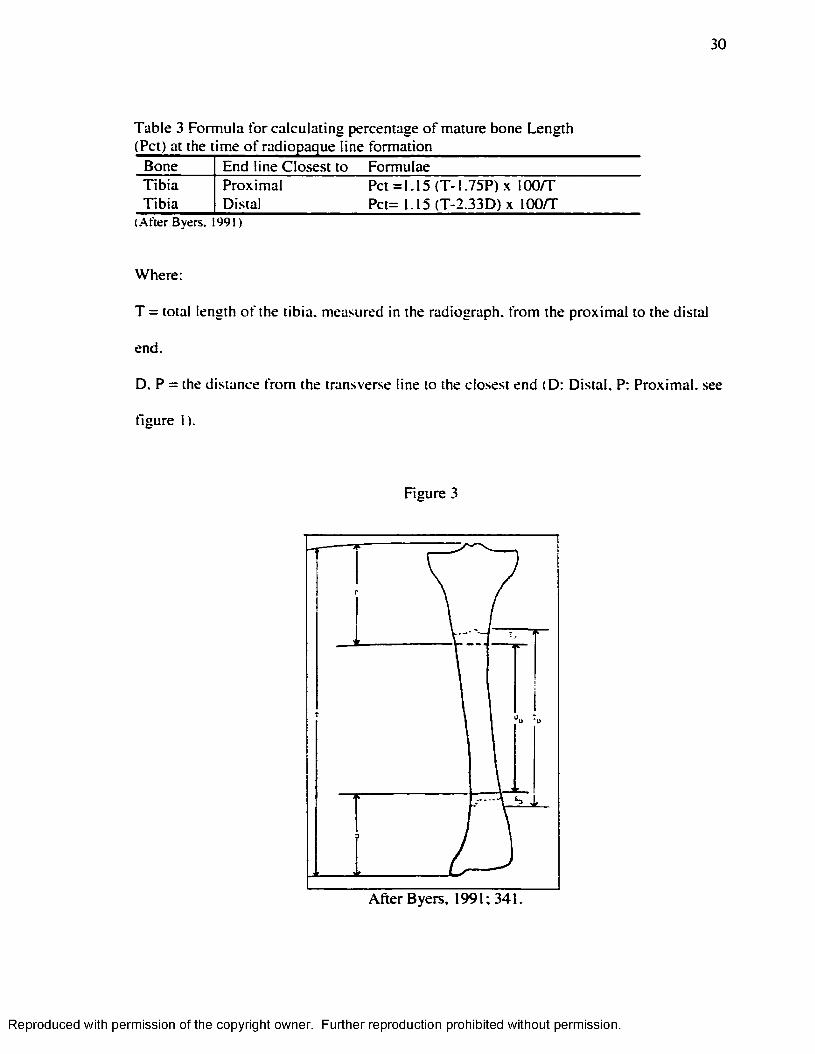
Table 3 Formula for calculating percentage o f mature bone Length
Bone End line Closest to FormulaeT ib ia Proximal Pet =1.15 (T -1 .75P)x 100/TT ib ia Distal Pct= 1.15 (T-2.33D) X lOO/T
(A fte r B yers. 1991)
Where:
T = total length o f the tib ia, measured in the radiograph, from the proxim al to the distal
end.
D. P = the distance from the transverse line to the closest end (D: Distal. P: Proximal, see
figure 1).
Figure 3
A fte r Byers. 1991; 341.
Reproduced with permission of the copyright owner. Further reproduction prohibited without permission.

31
This technique has the advantage that it is simple to execute, and requires on ly two
bone measurements. In addition, it also considers the differences between male and
female, and it adapts to the variable length o f bone in different populations.
Byers' (1991) method is lim ited in that it cannot be applied to juveniles, because their
epiphyses are not yet fused to the diaphysis. Hummert and Van Gerven ( 1985) offered a
method than can be applied to adults and juveniles. In this specific method only lines
located at the distal end o f the diaphysis are considered. This method then can be applied
to subadult bones without fused epiphyses, but w ith known developmental ages. In order
to determine the developmental age o f an individual dental maturity must be assessed.
The method can also be used in adult bones w ith some modifications.
In order to determine the age o f the individual at the time o f line formation the
researcher must determine the distal tib ia l growth pattern for the population and then
estimate the age o f the individual at the time o f the line formation:
In order to establish the distal tib ia ’s growth pattern o f the population the researcher
must:
1 ) Determine the primary center o f ossification, considering that 43% o f the tib ia ’s
growth is distal;
2) Assume that the average length per age category is representative o f the growth
achieved by all children in the population at that age; and.
3) Calculate, based on the growth data. 43% o f the incremental increase in m illim eters
fo r each group and these absolute values have to be converted into percentages o f distal
tib ia l growth achieved annually by each specific age group.
Reproduced with permission of the copyright owner. Further reproduction prohibited without permission.
32
To estimate the age o f the individual at the time o f line formation the steps are:
1 ) For each tibia. 43% o f its diaphysis length must be calculated, to determine the
primary center o f ossification;
2) Then the distance between the line and the ossification center must be measured. The
percentage o f distal growth completed when the transverse line was formed has to be
calculated by d iv id ing the distance between the line and the ossification center by the
distal length o f the tib ia ; and.
3) This value has to be compared w ith the percentages o f distal tib ia l growth estimated
for each specific age group o f the population under study.
In order to apply this method to the adult segment o f the population, the next steps
have to be followed:
1 ) Determine epiphyseal contribution by measuring the epiphyses. This amount has to
be subtracted from the total bone length to delim it the diaphyseal component o f each
tibia; and.
2) A fte r that. 43% o f the diaphyseal length must be calculated and then the prim ary
ossification center has to be located. As w ith subadults all measurements o f lines are
made from this point.
This method has a series o f advantages:
1 ) It considers the d ifferentia l growth at both ends o f the tib ia;
2) It is population specific; and.
3) It can be applied to adults and subadults.
It is highly advantageous that this method can be applied to juveniles considering that
H L are subject o f resorption; therefore, i f only the adult segment is analyzed in a study
Reproduced with permission of the copyright owner. Further reproduction prohibited without permission.
33
the frequencies o f lines formed during the early years w ill be m isleadingly low.
Consequently, stress fo r the early ages, based on transverse lines can only be assessed in
children.
in.2.5. Scoring Harris Lines
Harris lines can be scored using sectional or radiographic records. However.
•Macchiarelli et al. ( 1994) found severe inconsistencies in both sectional and radiographic
records and the m orbid ity index values (total number o f lines/total number o f tibiae).
.According to M acchiarelli et al. ( 1994). these differences are the result o f the natural
resorption o f the lines. In fact, resorption begins shortly after the layer formation, when
the vessels o f the osteoblasts progressively penetrate its central portion. As a result, there
w ill be some differences between the radiographic and .sectional expression o f HL. The
progressive obliteration o f the stratum by bone remodeling determines “ m igration" o f the
HL. and at this level, it is the radiographic record what guarantees the recognition o f a
higher number o f residual Harris lines (Macchiarelli et al.. 1994).
The score o f Harris lines is d ifficu lt, as the study o f Groulleaux-Raoux et al. ( 1997)
have shown. In their study the results show that Harris lines in subjects o f medium
height, that is older children and adolescents, are the hardest to count.
.Although counting H L may be problematic, it is not impossible and it seems
reasonable to fo llow Clark and M ack's ( 1988) advice and count the lines that extend
across at least 30% o f the shaft, and are more than 45° and less than 135° perpendicular
to the shaft.
Reproduced with permission of the copyright owner. Further reproduction prohibited without permission.
34
IH.2.6. Problems in the Interpretation
Harris lines are commonly used to estimate the frequency o f stress episodes. This,
however, is problematic because some studies have shown that the number o f lines do not
correlate w ith the number o f insults the individual had suffered in the past (Marshall,
1968: Buikstra and Cook. 1980). Moreover, studies have showed that a line fo llows a
disease in only 25% o f the cases, whereas 10% o f the lines occurred when no stressful
episode was documented: thus, the presence o f transverse lines in an adult population
does not conclusively point to a rugged childhood (Gam et al.. 1968: Gindhart. 1969:
Lewis. 2000).
Moreover, considering that transverse lines are the subject o f resorption at all ages,
caution should be exercised in their interpretation: the absence o f lines may either reflect
that no lines had ever formed, or that previously formed lines have been resorbed (Harris.
1931: Gam and Schawger. 1967; Buikstra and Cook. 1980; Hummert and Van Gerven.
1985).
Groulleau-Raoux et al. ( 1997) found that there is a progressive decrease in the
number o f Harris lines w ith increasing age; the problem is that resorption is increased in
sick individuals, and therefore the number o f lines does not necessarily reflects the health
status o f the individuals under study (Hatch et al.. 1983).
It is a matter o f controversy whether the thickness o f the line is a measurement o f the
severity or duration o f the stress episode, or whether it relates to individual variab ility in
the thickness o f the cartilage plate and the speed o f chondroblast recovery. A tentative
hypothesis is that thickness may be a function o f growth velocity and the length o f
growth disruption, while density may depend on the severity and completeness o f the
Reproduced with permission of the copyright owner. Further reproduction prohibited without permission.
35
disruption (M artin et al.. 1985; Lewis. 2(X)0). Thickness and degree o f radiopacity.
however, are apparently dependent on the quality o f the radiograph and the time and rate
o f resorption to which they had been exposed.
Age and sex affect not on ly line formation but also the remodeling rates. This makes
the interpretation o f Harris lines even more complex because this means that, between
sexes and age groups, there is a differentia l propensity to form lines and also a
differentia l remodeling rate, which implies that certain age-sex groups would:
1 ) Form fewer lines even i f they are exposed to the same number and intensity o f stress
events; and.
2) Remodel a greater number o f lines that would be erroneously interpreted as the result
o f a better health and/or comparatively m inor exposure to stress events.
I f H L are associated w ith a diminished growth rate, we should expect a correlation
between H L and stunting or lower height. G indhart's study ( 1969). nevertheless, did not
identify any stature difference between groups w ith different degrees o f transverse line
presence, and this was confirmed by the results obtained by Mays ( 1995). A possible
explanation is that in young animals, growth has a tendency to return to its original
trajectory i f circumstances have conspired to push it off-course. a phenomenon called
canalization. Follow ing a period o f arrest, growth w ill, i f suffic ient resources are
available, restart at an accelerated rate, returning the individual to its orig inal growth
curve. Once there, growth slows back to the old trajectory once more, a phenomenon
known as catch-up growth (Mays. 1995). Harris lines, moreover, are not associated w ith
reduced tissue quality, as cortical thickness shows no correlation w ith H L (Van Gerven et
al.. 1985).
Reproduced with permission of the copyright owner. Further reproduction prohibited without permission.
36
Thus, the interpretation o f Harris lines is complicated not on ly because it has been
proved that there is little association between them and childhood diseases, but also
because they are more frequent during periods o f rapid growth in length, and not during
periods o f dim inished growth (Maggenis. 1990; Goodman. 1996).
III.3 . Dental Development and M ineralization
III.3.1. Dental Development
There are. m ainly. 3 phases in the development o f a tooth, the pre-emptive, emptive.
and intra-oral phase (Berkovitz and Moxham. 1989). The pre-emptive phase covers the
period form the in itia l appearance o f the tooth germ to the beginning o f root formation.
During this phase the tooth remains in its developmental intraosseous location and grows
concentrically w ith in its fo llic le , and there is little active bodily movement o f the tooth
axially (Berkovitz and Moxham. 1989). In humans, at 6.5 weeks after conception central
and lateral incisors are already developing in the embryo, and at 8 weeks all the
deciduous teeth are developing. The permanent incisors, canine and premolars, repeating
the developmental sequence o f the ir deciduous predecessors have formed tooth germs by
30 weeks, but dentinogenesis and amelogenesis do not start before birth in the permanent
teeth. In itia lly , permanent teeth occupy the same alveolus as the deciduous ones,
acquiring an independent alveolus and dental fo llic le when the deciduous teeth empt
postnatally (Tongue. 1989).
Tooth emption is the process whereby a tooth moves ax ia lly from its developmental
position w ith in the jaw to emerge into the oral cavity. Em ption is part o f a complex
system, which involves movements in other planes and which continues a ll through the
Reproduced with permission of the copyright owner. Further reproduction prohibited without permission.

37
intraoral stage, in order to maintain the tooth in its functional position (Berkovitz and
Moxham, 1989).
The eruptive phase begins w ith root formation and terminates when the crown first
emerges through the oral mucosa. It is characterized by axial migration o f the tooth,
which involves its active bodily movement. I f the erupting tooth has a deciduous
predecessor, resorption and shedding o f the deciduous tooth must take place to provide an
eruptive pathway. Resorption o f deciduous teeth results from the activ ity o f osteoclast
like cells, termed odontoclasts. The origin o f odontoclasts is unknow n, but it is possible
that like osteoclasts they arise from the fusion o f precursor cells o f the
monocyte/macrophage type. The factors that in itiate, and subsequently influence root
resorption are not fu lly understood, but pressure from the erupting permanent tooth is
generally thought to be important (Berkovitz and Moxham. 1989).
.Another feature associated w ith the eruption o f permanent teeth is the gubemaculum.
In itia lly , each deciduous tooth and its developing permanent successor share a common
alveolar crypt, the permanent tooth being situated lingually. W ith continued growth and
eruption o f the deciduous tooth, the permanent tooth comes to lie w ith in its own crypt
near to the root apex o f the deciduous tooth. However, the crypt o f the permanent tooth is
not complete, there being a canal (the gubemacular canal) in its roo f through which the
dental fo llic le is attached to the overlying oral mucosa.
It has been suggested that the gubemacular cord plays an active role in the
movements o f the erupting permanent teeth through the jaws. During eruption, the
gubemacular cord decreases in length but increases in thickness. Whether the
gubemaculum provides an emptive pathway o r is actively engaged in pu lling the tooth
Reproduced with permission of the copyright owner. Further reproduction prohibited without permission.

38
out has not been established, although it cannot be implicated in the process o f eruption
once the tooth has reached the mucosa. Surgical removal o f the cord, however, does not
prevent eruption o f the permanent tooth (Berkovitz and Moxham, 1989).
The th ird phase, the intra-oral one. is characterized by the eruption o f the tooth
through the oral mucosa into the oral cavity, where it continues to move ax ia lly to attain,
and latter on to keep, its functional position. The maximum eruption rate is I-2m m per
month (Berkovitz and Moxham, 1989).
Tooth emergence may be facilitated by recession o f the mucosa around the erupting
tooth. This is termed passive eruption to distinguish it from active eruption where crown
exposure is due to bodily movement o f the tooth (Berkovitz and Moxham. 1989).
There is considerable controversy concerning the mechanism by which the force (s)
responsible for tooth eruption is (are) generated. There are mainly 3 theories: a)
Contraction o f collagen in the periodontal ligament: proposes that contractional forces are
set up w ith in the oblique fiber system o f the periodontal ligament during collagen
maturation. However, the various explanations offered for the underlying causes o f the
contraction are considered biochemically untenable. Moreover, there is also evidence that
some teeth can erupt in the absence o f a well-organized tlber system; b)
Contraction/M igration o f fibroblasts in the periodontal ligaments: Evidence from tissue
culture suggests that fibroblasts' traction may be important in connective tissue
morphogenesis. Tw o cellu lar activities have been implicated - fibroblast contraction and
fibroblast m o tility . It has been proposed, however, that fibroblast m igration rather than
contraction is responsible fo r tooth eruption, m ainly because teeth showing differences in
their eruptive behavior show no difference in the ir intracellular organelles. The fibroblast
Reproduced with permission of the copyright owner. Further reproduction prohibited without permission.
39
migration theory claims that periodontal fibroblast ligaments near the tooth are polarized
(elongated into the direction o f eruption) and that eruptive force is somehow produced as
a result o f unidirectional cell m igration in an occlusal direction. A number o f authors
have shown that periodontal fibroblast ligaments migrate occlusally. However, not all the
cells migrate, and it is possible that cell m igration is an effect o f eruption and not its
cause. Consequently the discussion focuses on whether o r not periodontal ligament
fibroblasts migrate actively: c) Vascular/Fluid pressures in the tissues around or beneath
the tooth: The eruptive force is generated by blood pressure. The idea is that the eruptive
force derives from the hydrostatic pressures around or beneath the tooth. Hydrostatic
pressure may be exened either by flu id , which is free in the tissue, and/or by flu id , which
is bound to fibers or ground substance. Although it is known that nervous vasomotor
activ ity or vasoactive drugs can influence the behavior o f an eruptive tooth, histological
studies have provided little inform ation about the role o f the vasculature during tooth
eruption. Some studies have shown, however, that an increase in eruption appears to be
associated w ith an increased vascularity (Berkovitz and .Moxham. 1989). Thus, we can
conclude that there is no agreement concerning the forces involved in tooth eruption.
11.3.2. Enamel Deposition and M ineralization
Dental enamel’ s function is to provide a hard, wear-resistant outer coating to the
surface o f the teeth, w ith which masticate food (Boyde. 1989). In human teeth the portion
covered w ith enamel is known as the anatomical crown, which is c lin ica lly that portion o f
the tooth, which has erupted and is visible in the oral cavity. Enamel is thickest over
b iting edges and b iting surface, and thinnest at the neck o r cervix, o f the tooth: it may be
Reproduced with permission of the copyright owner. Further reproduction prohibited without permission.
40
up to 2.3mm thick over the tips o f the cusps, and it is usually 1 - 1.3mm thick over the
lateral surfaces (Boyde. 1989).
Enamel, as well as dentine, the other hard tissues o f the teeth, grows by the formation
o f a layer o f new substance on top o f the old one. This is known as appositionai growth
and is different form proliferative or m ultip licative growth. The former is the result o f
cellu lar secretion, while the latter is the result o f ce llu lar divis ion. The appositionai type
o f growth results in the formation o f layers or rings. The formation o f these layers is
characterized by the regular and rhythmic manner in which it proceeds. Since the
deposition o f the layers is regular, their chronological sequence can be determined
(Schour and Massler. 1940b; Massler et al.. 1941). These incremental lines or rings are
known as perykimata (H illson and Bond. 1987; Boyde. 1989). Perykimata are
overlapping layer lines. These features become increasingly common in progressing from
the crown towards the cervix o f the tooth (Boyde. 1989).
Formation or deposition o f the enamel is d ifferent from its subsequent calcification or
mineralization. The matrix is produced as an extracellular product, and calcification
occurs by the precipitation o f inorganic calcium salts w ith in the deposited matrix
(Massler et al.. 1941). In fact, enamel is hard because o f its very high proportional
content o f a mineral that bears a strong resemblance to hydroxiapatite. a calcium
phosphate. In the mature enamel the mineral component may reach 89-91% by volume
(96-98% by weight), the remaining proportion o f the tissue being occupied by organic
matrix and water. The proportion o f mineral in the tissue increases steadily form the
moment o f inception o f m ineralization, which closely fo llow s the in itia l secretion
(Boyde, 1989).
Reproduced with permission of the copyright owner. Further reproduction prohibited without permission.

41
Dental formation includes: I) form ation o f crown and root (s); and, 2) tooth eruption.
Crown formation includes the apposition o f an organic matrix and its subsequent
mineralization:
I ) M atrix secretion: During this phase the characteristic shape o f the crown is
determined by the incremental apposition o f enamel matrix layer upon layer, from the
dentine-enamel junction to the surface. The enamel matrix consists o f 65% organic
material and water and about 35% o f mineral salts. The ameloblasts begin to secrete the
organic matrix in a thin layer close to the dentin, shortly after dentine deposition has
started (G iro. 1947: .A.Ivarez and Navia, 1989; Kelley and Larsen. 1991; Hillson, 1996).
Two principal protein groups are found w ith in the newly secreted enamel matrix.
These are known as amelogenins (the proteins found during the formative stages o f
enamel) and enamel ins (those proteins which are retained in the mature tissue).
•Amelogenins are inherently unstable proteins while enamelins, on the contrary, are stable
proteins. .Amelogenins are the m ajority in young enamel and d istinctly the m inority in
mature enamel. How amelogenins are removed from mature enamel is something that has
not yet been clarified (Boyde. 1989). but some studies have shown that massive protein
loss, before maturation, should be the main cause (Robinson et al.. 1982).
Follow ing the cessation o f the secretory activ ity o f the ameloblasts. they remain on
the tooth surface until it acquires a high degree o f m ineralization. In the case o f human
permanent teeth, the ameloblasts may be in this functional position even years after
secretory activities had stopped (Boyde. 1989).
Reproduced with permission of the copyright owner. Further reproduction prohibited without permission.
42
It has been established that the normal development o f the enamel is mainly linear,
although some authors have questioned this (Reid and Dean. 2(XX)). However, the major
corpus o f the literature indicates that:
"The normal development o f dental enamel is regular and sequential / . . . / .Development begins w ith the cuspal or incisal aspect o f the rudimentary dental organ, after w hich ameloblasts appose successive "rings” (transverse bands) o f enamel downward toward the cemento-enamel junction (cervical line bordering the tooth) where enamel calcification terminates" (B lakely and Armelagos. 1985:371).
In fact, mature enamel exhibits structural features that reflect its mode o f formation;
the enamel prisms outline the path followed by individual secretory ameloblasts. and the
Retzius lines mark stages in the layered apposition o f enamel. The incremental lines,
therefore, delineate the different layers o f the matrix deposited during the tooth growth.
Each line outlines the surface o f the enamel and the dentine deposited at a particular time.
The completed incremental growth pattern is. therefore, a graphic representation o f
appositionai growth and results from the pattern o f cellu lar activ ity (Schour and Massler.
1940a; Risnes. 1986).
Each transverse band or segment o f enamel represents a specific period in the
individual’ s growth and development. Because each type o f tooth develops during a
different period o f months o r years, the ages during which transverse sections were
apposed can be determined once adjustments are made fo r the peculiar period o f
development covered by each type o f tooth (Sunderland et ai.. 1987).
2) M aturation: The change from the secretory to the maturation function, at least in other
mammals (e.g.. rats) is associated w ith a cytological revolution, which involves the death
and destruction o f many cells, whose remains are phagocytosed by the monocytes
macrophages (Boyde, 1989).
Reproduced with permission of the copyright owner. Further reproduction prohibited without permission.

43
During maturation, organic material and water are removed almost completely and
replaced by mineral salts. This process starts after the enamel matrix has reached fu ll
thickness in the occlusal parts o f the crown. The inception o f mineralization, or
maturation, occurs extremely close to the secretory front, so that there is scarcely a delay
between secretion and the progress o f mineralization into newly produced matrix (G iro,
1947; Robinson and Kirkham. 1986; Alvarez and Navia. 1989: Boyde. 1989; Kelley and
Larsen. 1991; H illson. 1996).
During this phase the crystal previously deposited increases its thickness and the
concentration o f amelogenins in the enamel is greatly reduced (Boyde. 1989). The details
o f calcium transportation through the secretory ameloblast are s till unknown and it is not
known how much enamelin is removed, i f any (Hohling, 1989).
The amino-acid composition changes, reflecting the net increase in enamelin-
amelogenin ratio. The mineral-to-organic ratio also increases, due to the increase in
mineral and the removal o f protein. The water content also reduces dramatically due to
the increase in the size o f the individual enamel crystallites and a reduction o f the
intercrystallite water and organic-matrix filled space (Boyde, 1989).
Maturation o f the enamel, then, involves rapid transport o f calcium and phosphate
(from a rich bloody supply via the enamel organ) and early removal o f the organic
matrix, especially the amelogenin component, w ith an accompanying change in the
amino-acid composition (Boyde, 1989).
There are d ifferent theories on the mechanisms o f maturation. The simplest one
proposes that the force generated by the growth o f the crystals is sufficient to mobilize
the unstable protein matrix gel. However, neither explains why there is an apparently
Reproduced with permission of the copyright owner. Further reproduction prohibited without permission.
44
sudden loss o f organic m atrix that is not paralleled by a matching increase in mineral
uptake, nor the active cyclical changes in the organization o f ameloblasts seen in the
maturation zone, which strongly suggest active cellu lar participation. A different theory
proposes that ameloblasts secrete proteases into the enamel m atrix; however, no protease
has yet been isolated (Boyde, 1989).
III.3 .3. Teeth Developmental Chronology
Deciduous enamel formation begins in uterus and continues for several months after
birth, although is largely an intrauterine process (G iro. 1947; Kelley and Larsen. 1991).
Crowns are partially complete at birth, and total deciduous tooth takes only 2-3 years
from in itia l m ineralization to root completion. The order o f in itia l m ineralization in the
deciduous teeth is: central incisor, lateral incisor, first molar, canine and second molar.
M ineralization o f the central incisor and first molar appear earlier in the m axilla but
subsequent development in the mandible preceded the one in the m axilla (Sunderland et
al., 1987).
First molar and anterior teeth are the first group o f permanent teeth to form . A second
group, premolars and second molars, begin their formation at about 1.5-3.0 years o f age.
A fte r a pause, the third molars begin their formation at about 7 to 10 years o f age. The
upper teeth, as a rule, begin their formation slightly earlier than the lower ones do.
although the lower teeth generally erupt just before the corresponding upper teeth
(Schour and Massler. 1940a; Risnes. 1986; Kelley and Larsen. 1991).
The time required fo r the formation o f permanent tooth crowns, between in itia l
calcification and the crown-completed stage is 2 .1 years fo r first m olar and 2.8 years for
second and third molars. The formation period o f premolar crowns ranges between 3.1-
Reproduced with permission of the copyright owner. Further reproduction prohibited without permission.

45
3.4 years, while in the canine it takes 3.5 years. A t twelve years o f age, the mature root
length has been attained for all permanent teeth, w ith the exception o f the third molar.
Therefore, the calcification o f permanent dentition is, usually, entirely postnatal and the
formation o f each tooth takes 8 to 12 years (Schour and Massler, 1940a; Risnes, 1986;
Kelley and Larsen, 1991 ). Thus, the apposition o f dental enamel is slower in permanent
than deciduous teeth (Risnes. 1986).
The length o f time required for crown development is practically the same in males
and females, w ith differences occurring w ith in a narrow range from 0.02-0.1 years
(Schour and Massler. 1940a; Risnes. 1986). In fact, the variance in attainment o f
developmental stages is the same for males and females (Moorrees et al.. 1963).
Teeth then, have the longest developmental chronology compared w ith any other
organ in the body and unlike other hard tissues they are not subject o f remodeling. In fact,
once a layer is formed it cannot be altered structurally by systemic factors, due to the fact
that formative cells have receded and lost their connection w ith the matrix (Massler et al..
1941 : Sunderland et al.. 1987). Thus, defects in dental formation due to environmental
influences remain throughout the life o f the tooth, and have a c lin ica l value in tim ing
disturbances. However, this tim ing must be related to accurate tabulations o f dental
development. Dental development, indeed, is much less affected than other tissues by
endocrinopathies and other developmental insults. This is shown by studies o f children
w ith m ajor abnormalities in sexual maturation, stature and bone age, who show small
deviations in tim ing o f dental development (Sunderland et al.. 1987). Moreover, tooth
formation tim ing also appears to be comparatively resistant to nutritional effects, as
Reproduced with permission of the copyright owner. Further reproduction prohibited without permission.
46
shown by the low correlation (r= 0 .1-0.2) found between tooth formation and relative
weight, fatness, stature, and bone age (Kelley and Larsen, 1991).
III.4 . Enamel Hypoplasia
As teeth form by continuous incremental growth, any metabolic disturbance to which
the ameloblasts are sensitive w ill cause a layer o f abnormal tissue. I f the disturbance is
transitory, normal dental tissue growth is resumed and the evidence o f the disturbance is
an enhanced incremental growth line, pit or band (Newton et al.. 1984). Developmental
enamel defects, then, are a putative marker o f childhood m orbidity that can be analyzed
by age o f occurrence using a standard calcification chart (Corrucini et al.. 1985).
Because some teeth start to form before birth, others do shortly afterwards, and others
much later during the growth period there is a record o f variation in growth from before
birth until dental maturation (Dean. 1987).
There are different types o f developmental enamel defects. In this particular study
one type w ill be considered; enamel hypoplasia, which is by far the most commonly
studied one (Blakeley and Armelagos. 1985).
in .4 .1. Definition
Dental enamel hypoplasia is a quantitative class o f enamel defect. In general, enamel
hypoplasia ( EH) refers to a deficiency in the amount or thickness o f the enamel, which
results from a deficiency in the enamel matrix composition. The presence o f enamel
hypoplasia, therefore, indicates differences in hardness or quality o f the enamel.
There are different types o f enamel hypoplasia. The defect can present the form o f a
pit. a line o f pits, an irregular group o f pits, a line o r a band. The most severe form o f
Reproduced with permission of the copyright owner. Further reproduction prohibited without permission.
47
hypoplasia is a total deficiency o f the enamel, known as enamel aplasia: this type o f
hypoplasia results from the death o f the ameloblasts prior to, o r at the time of,
differentiation (Goodman and Rose, 1990). The defect is more easily seen in the labial
face o f the teeth, especially in incisors and canines (Clarkson, 1989: Lukacs. 1989;
Goodman and Rose. 1990; Skinner and Goodman. 1992; Roberts and Manchester. 1995;
Lewis. 2000).
II1.4.2. Mechanism o f Formation
Mature dental enamel is a non-cellular tissue constituted by an internal epithelium
formed by the ameloblasts. Mature enamel is fu lly acellular and almost completely
composed o f inorganic salt (>97%). w ith small traces o f remaining protein and water.
A ll developmental defects o f the enamel (DDE) result from disruptions in the process
o f amelogenesis. This occurs when ameloblasts at one particular longitudinal address, on
the developing tooth circumference, are unable to form enamel or the correct thickness o f
enamel ( Boyde. 1989).
I f nutritional insults are imposed early in the formation o f the organic m atrix, the
c lin ical expression w ill be enamel hypoplasia. I f the stress is imposed later, during the
maturation process, the result w ill be a hypocalcification manifested by opaque o r chalky
areas (G iro. 1947; Alvarez and Navia. 1989; Goodman and Rose. 1990). These defects
w ill be preserved, because there is no remodeling process. Consequently, enamel defects
are a permanent and retrospective record o f the stressful events experienced during
childhood (N ik ifo ruk and Fraser, 1981 ; Rose et al.. 1985; Lukacs, 1989; Goodman and
Rose. 1990; Skinner and Goodman. 1992; Roberts and Manchester. 1995; H illson. 1996;
Lewis. 2000).
Reproduced with permission of the copyright owner. Further reproduction prohibited without permission.
48
In the case o f EH, as a result o f the disturbance, the ameloblasts undergo retrogressive
changes. The ir height is shortened and instead o f being cylindrica l, they turn into
cuboidal an even squamosal shape. These changes bring about a complete disruption o f
enamel formation. Later, when the disturbing agent ceases, the ameloblasts adjacent to
the affected ones resume the enamel-building process (G iro, 1947).
Hence, any systemic disturbance that occurs during the enamel formation can disrupt
ameloblast s metabolism. I f a particular ameloblast does not recover from the metabolic
insult, no further enamel w ill be formed by the affected ameloblast. This deficiency in
enamel thickness due to premature degeneration o f the ameloblasts is defined as enamel
hypoplasia, which is observed macroscopically as an area o f depressed enamel (Rose et
al.. 1985). The presence o f multiple enamel defects in a tooth is the result o f periodical
stress events that may be the result o f seasonal scarcity (Cohen and Armelagos. 1984:
H illson. 1996).
The location o f the lesion depends on the period o f calcification in which the
disturbing agent acted, while the extension o f the lesion w ill depend mainly on the span
o f action o f the causative agent. Accordingly, the alterations quite accurately te ll the
onset and duration o f the force that compelled the formation o f the enamel defect.
Consequently, the difference in the period o f maturation and calcification o f various teeth
explains the different location o f the lesion in several teeth in the same dentition (G iro.
1947).
A t a population level, enamel defects register developmental alterations occurred
between 5'*’ month in uterus to 7 years o f age (approximately), w ith a hiatus between the
ages o f 8 and 9 years (usually there is no enamel formation at this age), fo llowed by a
Reproduced with permission of the copyright owner. Further reproduction prohibited without permission.
49
deposition o f the enamel between 10 and 13-16 years old -enamel deposited in the
formation o f the 3"* molar (Rose et al. 1985; Skinner and Goodman. 1992)-. Enamel
hypoplasia, thus, can be present in deciduous and permanent teeth. In fact, damage to
enamel epithelium and formation o f abnormal enamel had been detected in the m ajority
o f perinatal deaths, indicating adverse prenatal influences (Gruenwald. 1973). Chronic
fetal distress, as manifested by a significant subnormal birth weight, is nearly always
associated w ith severe damage to the enamel organ. This hypoplasia then, is not the result
o f an event, which is usually how hypoplasia is interpreted, but a process; in fact, the
presence o f abnormal masses o f enamel, attest for the long duration o f the disturbance
(Gruenwald. 1973). Gruenwald's study demonstrated that enamel epithelium,
specifically the portion that is form ing enamel at the time o f in jury, is h ighly susceptible
to damage. In contrast, the epithelium closer to the apex, which has not yet begun to
function, is structurally unaffected. This structurally unaffected epithelium remains
functionally normal and w ill later be able to lay down normal enamel.
in.4.3. Etiology
Enamel hypoplasia may be the result o f developmental disturbances o f the enamel,
and as such it records the interacting stresses o f nutrition and illness during the period o f
tooth formation (W right. 1997), but it can also have its orig in in some form o f genetic
abnormality. In general terms, the presence o f hypoplasia is an indicator that the
causative agent affected the ameloblast at a defin itive stage o f development, hindering or
completely nu llify ing enamel formation for a more o r less extended period, but a llow ing
the ameloblast to continue the ir work later (G iro, 1947).
Reproduced with permission of the copyright owner. Further reproduction prohibited without permission.
50
During dental development, a variety o f systemic stressors such as moderate
malnutrition (Goodman et al.. 1991 ) and infectious diseases can produce abnormal
enamel growth pattern (Suckling. 1989). Many factors seem to be relevant in the
formation o f developmental enamel defects, but they can be categorized, broadly, in four
major groups:
I ) Hereditary anomalies:
2) Localized Trauma:
3) Nutritional deficiencies: and,
4) Childhood diseases (e.g. measles).
Defects resulting from hereditary causes generally affect all o f the teeth in a set and
are extremely severe. However, individuals w ith hereditary defects are rare (< l% ) in
most contemporary populations, and they are like ly to be even less frequent in prehistoric
populations, because they would have been eliminated through natural selection
(Goodman and Rose. 1990).
Hereditary enamel defects are collectively known under the title o f amelogenesis
imperfecta (W inter and Brook. 1975: Hals, 1962). The main disorder in this group o f
conditions seems to be that o f maturation, so that the tissue, although formed, remains
w ith a high organic m atrix and a low mineral content. It is. therefore, very soft and easily
abraded, flaking o f f from the surface o f what maybe a re latively normal dentine (Boyde.
1989). Amelogenesis imperfecta is associated w ith autosomal dominant, autosomal
recessive, sex-linked dominant and sex-linked recessive conditions. Independent o f
which condition the defect is related w ith , amelogenesis imperfecta is rare ( 1:14.000) and
the severity o f these types o f defects clearly differentiate them from the ones that are the
Reproduced with permission of the copyright owner. Further reproduction prohibited without permission.
51
result o f environmental disturbances (W inter and Brook. 1975). In fact, genetically
determined enamel defects usually affect ail areas o f enamel in contrast to the
environmentally induced hypoplastic defects (Pindborg, 1982).
Defects due to local trauma, local inflammation, and other non-systemic factors may
also be relatively severe, but w ill influence only one tooth or few adjacent teeth
(Suckling. 1989). Its causes include neonatal mechanical ventilation, fa ll and injuries,
gunshot, ritual m utilation, electric bum. irradiation and local infection (e.g. periapical
osteitis; Pindborg. 1982). Defects due to local trauma are like ly to be rare in prehistoric
populations, as most o f the EH identified in paleopathological studies f it a chronological
pattern and appear to be due to systemic metabolic stress (Goodman and Rose, 1990).
The vast m ajority o f EH found in archaeological material f it a pattern o f systemic
metabolic stress (Goodman and Rose, 1990). This type o f defect is like ly to be found on
most, or a ll. teeth developing at the time o f the stress, and the location o f the defects
reflect the relative completeness o f enamel crowns at the time o f the disruption. Current
research has demonstrated that the frequency o f developmental disturbances such as EH
is greatly influenced by the diet quality and quantity (Cook and Buikstra 1979; Corrucini
et al.. 1985: Rose et al.. 1985).
Diet, may be one o f the major causes o f dental enamel hypoplasia, or it may be only
one factor contributing to its appearance (Roberts and Manchester. 1995: H illson, 1996).
In fact, numerous conditions have been shown to cause these defects: diseases that
interfere w ith calcium metabolism like rickets and other conditions like starvation have
been proposed as one o f them. Infectious diseases like measles, rubella, bacterial syphilis,
tetanus, whooping cough, pneumonia, severe gastrointestinal disturbances, fever.
Reproduced with permission of the copyright owner. Further reproduction prohibited without permission.
52
starvation, congenital infection, tuberculosis, hypoparathiroidism, fluorosis and low birth
weight have been identified as some o f it causes also (G iro. 1947; Pindborg, 1982;
Goodman et al.. 1988). In addition, other conditions like haemolitic anemia (usually in
conjunction w ith erithroblastosis fetalis), endochrinopaties (like diabetes m ellitus) and
nephropathies can be the cause o f EH (Pindborg, 1982).
It has been suggested that diseases can cause enamel hypoplasia because they create
new nutritional demands, especially when severe deficiencies in vitamins D o r A act in
conjunction (G iro. 1947). There is. nevertheless, no conclusive evidence that diseases
and/or specific nutritional deficiencies (vitam in A deficiency and scurvy) are the
etiologic causes o f enamel defects (Newton et al.. 1984: Goodman et al.. 1988). There is
no one-to-one relationship between stress events and defect formation: EH appear to have
no specific etio logy, it is merely the reaction o f a particular organ to some general disease
process or processes: "The tooth appears to be a very sensitive indicator o f environmental
disturbance, but quite non-specifically so in that even febrile illness may cause a line to
appear" (Newton et al.. 1984). Therefore, any condition that is o f sufficient constitutional
severity to affect the growing cells o f the body w ill likewise affect the enamel form ing
cells (Samat and Schour. 1942).
Formation o f the defect depends not only upon the nature o f the insult but also on the
stage o f maturation o f the tooth crown: there are certain periods more vulnerable than
others (Buikstra and Cook. 1980: Goodman. 1996). In some occasions, stresses occurred
during the last five months o f gestation, at birth, and the firs t year after gestation can be
recorded by the presence o f enamel defects in deciduous teeth. The presence/absence o f
this indicator on the deciduous teeth are a reflection o f the state o f health o f both mother
Reproduced with permission of the copyright owner. Further reproduction prohibited without permission.
53
and child. Prenatal hypoplasia, though, is uncommon; in uterus calcification normally
takes place homogeneously and completely. It is, apparently, not markedly influenced by
fluctuations in the condition o f the mother, except in cases o f severe maternal illnesses.
However, once out o f this environment, enamel is influenced by the state o f the infant
health (K ronfe ld and Schour. 1939). B irth, in fact, can be registered in dental enamel
through the presence o f an accentuated Striae o f Retzius ( incremental lines: Schour,
1936) that is usually visible at the microscopic level. Studies considering children w ith
normal births, w ith d ifficu lt b irth and children bom w ith cesarean procedure, show that
there is a high correlation (p(a)<O.OOI ) between an increased w id th o f the neonatal line
(N N L ) and pathological conditions (children w ith d ifficu lt birth). The data also shows
that individuals bom w ith cesarean procedure show a significant decrease in the N N L
w idth. The results show that trauma to the ameloblasts is partia lly due to the birth process
itself, partia lly to the change in environment, and it is more com m only found among
socio-economic groups that suffer from protein-calorie m alnutrition (Sweeney et al..
1971 : E li et al.. 1986: 1989). However, there is no agreement as whether o r not the dental
changes indicate a pre or post-natal metabolic disturbance (Levine and Keen. 1974).
II.4.4. A ltem ative Methods o f Analysis
As the chronology o f tooth formation is known, measuring the distance between the
defect and the cemento-enamel junction (CEJ) in the tooth helps to reconstruct when the
defect was formed in the person’s life. In order to do that is necessary to assume that the
rate at which the permanent teeth developed was the same in the past, and that teeth are
universally susceptible to enamel defects (Goodman et al., 1988; Goodman and Rose,
1990: Roberts and Manchester, 1995).
Reproduced with permission of the copyright owner. Further reproduction prohibited without permission.
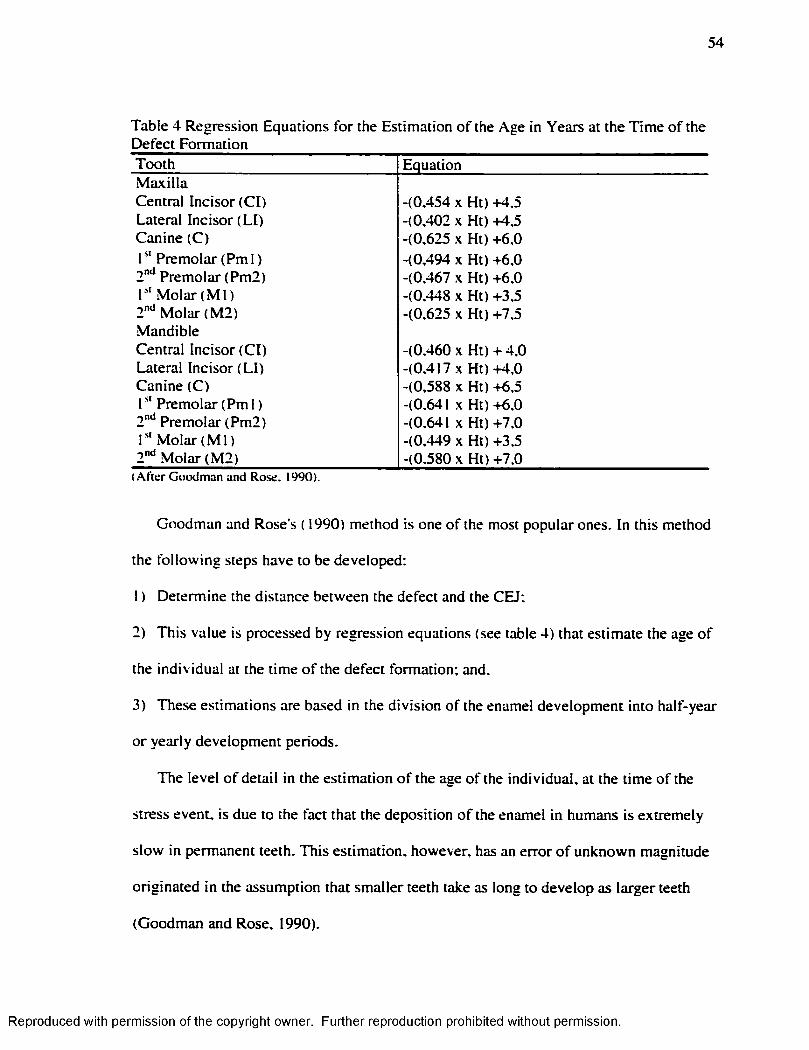
54
Table 4 Regression Equations fo r the Estimation o f the Age in Years at the T im e o f the Defect FormationTooth EquationM ax illaCentral Incisor (C l) -(0,454 X Ht) +4,5Lateral Incisor (L I) -(0,402 X Ht) +4,5Canine (C) -(0,625 X Ht) +6,0r ' Premolar (Pm l ) -(0.494 X Ht) +6,02"*̂ Premolar (Pm2) -(0,467 X Ht) +6.01" M olar (M l) -(0.448 X Ht) +3,52"‘‘ M olar (M 2) -(0,625 X Ht) +7.5MandibleCentral Incisor (C l) -(0.460 X H t) + 4 .0Lateral Incisor (L I) -(0.417 X H t)+4,0Canine (C) -(0,588 X Ht) +6.5r ' Premolar (P m l) -(0,641 X Ht) +6.02"̂ * Premolar (Pm2) -(0.641 X Ht) +7.0r ' ‘ M olar ( M l) -(0,449 X Ht) +3,52"“ M o lar (M 2) -(0,580 X Ht) +7.0
(A fte r G o o d m an an d R o se . 1990).
Goodman and Rose’s ( 1990) method is one o f the most popular ones. In this method
the fo llow ing steps have to be developed:
I ) Determine the distance between the defect and the CEJ:
2) This value is processed by regression equations (see table 4) that estimate the age o f
the individual at the time o f the defect formation: and.
3) These estimations are based in the division o f the enamel development into half-year
or yearly development periods.
The level o f detail in the estimation o f the age o f the individual, at the time o f the
stress event, is due to the fact that the deposition o f the enamel in humans is extremely
slow in permanent teeth. This estimation, however, has an error o f unknown magnitude
originated in the assumption that smaller teeth take as long to develop as larger teeth
(Goodman and Rose. 1990).
Reproduced with permission of the copyright owner. Further reproduction prohibited without permission.
55
Hodges and W ilk inson (1990) have questioned the first assumption. These
researchers examined the lower canines and m axillary central incisors in 34 individuals
o f an archaeological sample and 28 individuals o f a modem collection. In their method,
fo r every defect:
I ) The distance between it and the CEJ was measured in m illimeters:
2) Large enamel defects were measured considering the superior and in fe rio r edge o f the
defect: and.
3) Crown height and the maximum distance from the incisal surface to the CEJ on the
labial surface were measured also. This distance was converted into half-year age
intervals, representing the indiv idual's age-at-stress.
The comparison between their results w ith the ones obtained using Goodman and
Rose’ s (1990) chart showed significant statistical differences between the tw o methods:
most o f the differences between age estimates were on the order o f one half-year interval
(older or younger). Therefore it seems that the first assumption exposed fo r Goodman and
Rose’ s ( 1990) method can be questioned.
Reid and Dean (2000). however, evaluated 115 unworn anterior teeth through
histological examination, and divided the cusp into 10'*’ percentiles. Using this data they
calculated, in days, the time o f in itia l mineralization, the time taken to form cuspal
enamel, and the time taken to form each 10'^ percentile o f crown height. According to
their results there is no evidence that longer crowns take longer to form than shorter ones.
Thus, the discussion about whether or not crown height affects the results is not closed.
Reproduced with permission of the copyright owner. Further reproduction prohibited without permission.
56
Ensor and Irish ( 1995) offered a completely different analysis o f EH. Instead o f try ing
to estimate the age o f formation they tried to account fo r the range o f variab ility in the
duration o f stress. The ir method considered:
1 ) A categorization o f lines and pits as acute events o f stress, while bands were
considered chronic defects. A differentiation based on the assumption that acute episodes
o f stress result in localized hypoplasia, whereas continuous hypoplasia represents a
record o f stress w ithout immediate recovery:
2) An acute hypoplastic defect is o f 0.5 mm or less in w idth, any defect over 0.5 mm in
width was treated as continuous:
3) In order to avoid any error, no tooth w ith more than one third o f the crown worn away
was considered:
4) The hypoplastic defects were recorded by measuring the distance, to the nearest
0 .1 mm. from the CEJ to the center o f each acute hypoplasia, o r to the beginning and
ending o f each continuous defect: and.
5) Each acute hypoplasia received a value o f 0.10. For each chronic hypoplasia, the
percentage o f crown disturbance was calculated by d iv id ing the w idth o f the insult by
two-thirds crown o f the estimated height. The sum o f these values on a crown is called
tooth hypoplastic area (T H A ) w ith which they established the level o f stress present in
the individual.
This method, although interesting, it is not useful fo r the purpose o f this study,
because it does not estimate the age o f the individual at the time o f the defect formation.
However, most o f the methods that do estimate age at the time o f defect form ation are not
applicable to the deciduous dentition. The problem is that as they are formed largely in
Reproduced with permission of the copyright owner. Further reproduction prohibited without permission.

57
the prenatal period and considering that the tib ia starts to develop in uterus, it is
impossible to ignore deciduous teeth in a study whose aim is to compare Harris lines w ith
enamel hypoplasia (B lakely and Armelagos, 1985; Storey, 1992).
There is only one method available in the current literature to establish the age o f the
individual at the time o f the stress event, when the event is register as EH in a deciduous
tooth (B lakely and Armelagos. 1985). This method was developed using a sample o f 50
individuals from the Dickson Mound site, in which ages fluctuated between I and 12
years. The sample was selected according the fo llow ing criteria:
I ) Complete crown enamel development and preservation was required on all the teeth
studied; and.
2) Each individual had to have at least four teeth, i f no defect was present.
The method requires determining:
I )The crown height for each specific tooth type;
2)The vertical w idth o f the transverse segment o f enamel that develops during a single
month. This is established by d iv id ing the crown height by the number o f months that it
takes to develop the crown. This same procedure must be repeated w ith every type o f
tooth considering its specific tim e o f development (see table 5); and.
3)The tim ing o f the defective enamel segment. The distance measured from CEJ to the
defect is divided by the w idth o f a m onthly segment for that tooth. This becomes an
expression o f the number o f months between the occurrence o f the defect and the last
month o f enamel development. F ina lly, the number o f months is subtracted from the
standard developmental month, during which enamel is completed fo r that tooth, g iving
the month o f occurrence. B y the same process, the distance to superior and in ferio r
Reproduced with permission of the copyright owner. Further reproduction prohibited without permission.
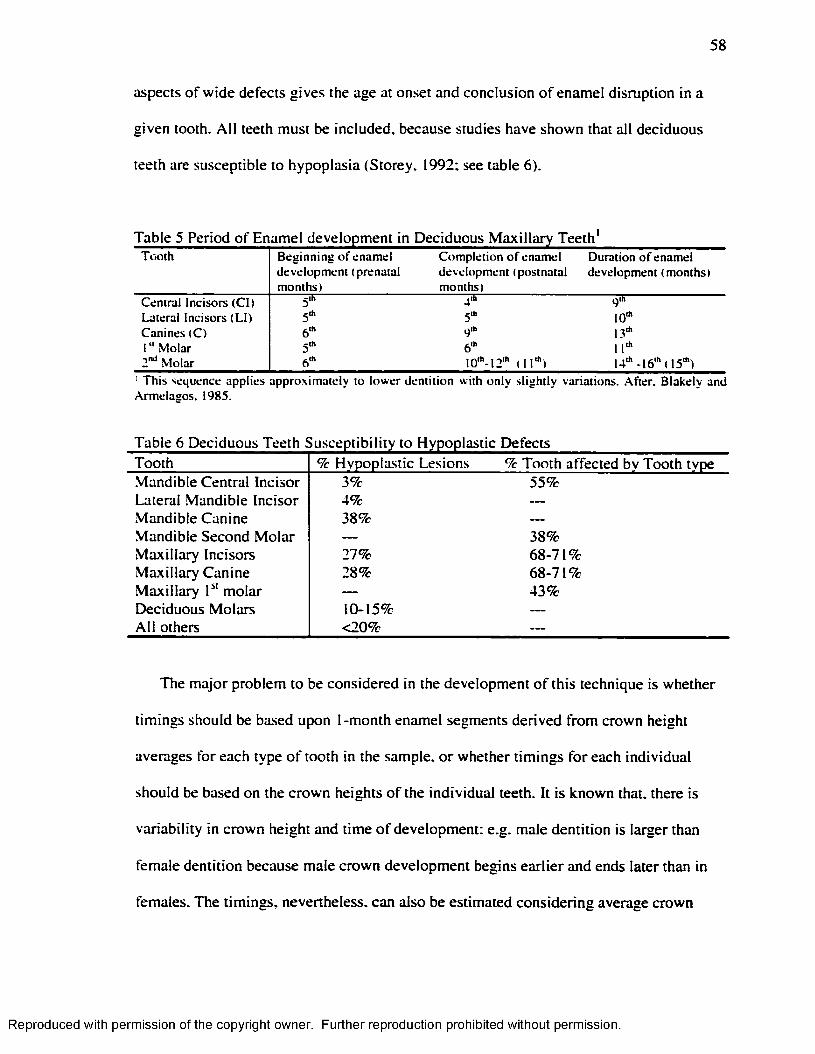
58
aspects o f w ide defects gives the age at onset and conclusion o f enamel disruption in a
given tooth. A ll teeth must be included, because studies have shown that all deciduous
teeth are susceptible to hypoplasia (Storey, 1992; see table 6).
Table 5 Period o f Enamel development in Deciduous M ax illa ry Teeth'T o o th B eg in n in g o f e n am e l
d e v e lo p m e n t (p ren a ta l m o n th s)
C o m p le tio n o f en am e l d ev e lo p m en t ( p o stn a ta l m on ths)
D uration o f enam el d ev e lo p m en t (m on ttis)
C en tra l Inc iso rs (C l) 5'" r g ill
L atera l Inc iso rs (L I) g .h 5Ü, 10*C an in es (C ) 6'" q'h 13*
I " M o la r 5'" 6'" 11*2"^ M olar 6'" 10* .12* (11*) 1 4 * -1 6 * (15*)
■ T h is seq u en ce ap p lie s ap p ro x im a te ly to lo w er d en titio n w ith o n ly s lig h tly v a ria tions. A fte r. B lakely an d A rm elag o s. 1985.
Table 6 Deciduous Teeth Susceptibility to Hypoplastic DefectsTooth % Hypoplastic Lesions % Tooth affected by Tooth typeMandible Central Incisor 3% 55%Lateral Mandible Incisor 4% —
Mandible Canine 38% —
Mandible Second M olar — 38%M axilla ry Incisors 27% 68-71%M axilla ry Canine 28% 68-71%M axilla ry P‘ molar — 43%Deciduous Molars 10-15% --------
A ll others <20% —
The major problem to be considered in the development o f this technique is whether
tim ings should be based upon I-m onth enamel segments derived from crown height
averages for each type o f tooth in the sample, o r whether tim ings fo r each individual
should be based on the crown heights o f the individual teeth. It is known that, there is
variab ility in crown height and time o f development; e.g. male dentition is larger than
female dentition because male crown development begins earlier and ends later than in
females. The tim ings, nevertheless, can also be estimated considering average crown
Reproduced with permission of the copyright owner. Further reproduction prohibited without permission.
59
heights fo r the population, but on ly at the expense o f ob jectiv ity in the assessment o f age
o f defect occurrence. Considering, however, that individual crown height and average
height methods are only s lightly different in their results, it seems that fo r the study o f the
present population, in order to maximize the sample, the average method is more
appropriate.
II1.4. 5. Problems in the Interpretation
Theoretically all teeth whose enamel crowns are developing at the time o f a systemic
insult should bear a corresponding enamel defect. Thus, studies analyzing different teeth
should yield comparable results as long as the tooth crowns examined developed over the
same period o f time. There is a variation, however, in enamel hypoplasia formation that
may occur between different tooth types and between different regions o f the enamel
crown. Therefore, not all teeth and not all segments o f a tooth are equally sensitive to the
environment, therefore sensitivity is differential at inter and intra tooth level. In fact,
susceptibility to enamel defect formation varies w ith the stage o f crown development,
which appears to be related w ith the rate o f enamel deposition. The slower the rate the
greater the susceptibility: enamel tends to be more stable or r ig id (and thus less
susceptible to defect formation) when it is expanding at its greatest rate, and
correspondingly less stable at lower rates. Enamel deposition rates are greater cuspally,
and least cervically. as it has been indicated by perykimata studies. Hypoplastic defects,
then, are most abundant in the middle third o f the enamel o f each tooth (Dean, 1987:
Goodman and Rose, 1990: Condon and Rose. 1992: W right. 1997; Santos and Coimbra.
1999).
Reproduced with permission of the copyright owner. Further reproduction prohibited without permission.
60
In general, the teeth most affected by hypoplasia are the anterior ones. Am ong these,
the most sensitive ones are the lateral incisors and canines o f the mandible. In the
maxilla, central incisors and canines appear to be the most susceptible. A tentative
explanation is that teeth in which the genetic control is strongest may be more like ly to be
hypoplastic because they are less able to alter developmental tim ing (Goodman and
Armelagos. 1985; Goodman and Rose. 1990; Condon and Rose. 1992).
Considering the inter-tooth and intra-tooth segment d ifferentia l sensitivity, the
interpretation o f the age o f peak m orbid ity is complicated. In fact, at d ifferent ages the
speed o f calcification and therefore the susceptibility o f the enamel to environmental
disturbances varies (.Massler et al. 19 4 1 ). Moreover, when crowns o f d ifferent teeth from
one individual are matched, it is clear that one growth disruption causes defects in a
different place in each o f the different tooth crowns being formed at the tim e, w ith a
difference in size and prominence (H illson and Bond. 1997). These differences have
usually been interpreted as the result o f differential susceptibility between tooth classes.
But. it is also possible that the geometry o f the crown growth may be a m ajor factor
because each appositionai zone o f a crown hides a considerable proportion o f enamel
layers. These layers do not appear in the surface, and therefore unless a growth disruption
generates a defect on the surface, no evidence o f hypoplasia is visible fo r that part o f the
crown (H illson and Bond, 1997).
Comparative studies, then, must take into account the type o f tooth analyzed, while
the position o f the defects must be interpreted taking into account that some areas o f the
tooth are more sensitive, before any conclusion about social behavior (e.g. weaning) can
be made. I f hypoplastic defects are biased towards the m iddle period o f amelogenesis fo r
Reproduced with permission of the copyright owner. Further reproduction prohibited without permission.
61
each tooth (W right, 1997), the peak occurrence o f hypoplasia does not d irectly m irror the
tim ing o f the peak stress experienced.
ril.5 . Studies About Correlation Between Harris
Lines And Enamel Hvpoplasia
As indicators o f stress, enamel hypoplasia and Harris lines have partially overlapping
etiologies and a somewhat analogous mechanism o f formation, because both involve the
cessation o r alteration o f normal growth (M cHenry and Schultz. 1976; Clarke, 1982).
McHenry and Schultz ( 1976) found Harris lines w ithout an equivalent enamel defect.
These authors have suggested that Harris lines are formed by insults that are not as severe
or as long lasting as those that cause enamel hypoplasia. In fact, in their study, the
association between radiopaque transverse lines and enamel defects was statistically non
significant. and the results did not change even when only the moderate or severe
hypoplastic defects were considered.
In a study executed by Clarke ( 1982) the ordinary four-cell tables o f contingency
failed to show association between Harris lines and enamel hypoplasia. Nevertheless,
when Chi-square was applied to a two-cell concordance-discordance contingency table, a
significant association between the two indicators was revealed fo r lines and hypoplastic
defects o f all grades. Therefore, according to these results there is a co-occurrence o f
transverse lines and enamel hypoplasia. However, there was no one-to-one correlation
between the two and the ir co-occurrence was interpreted as ind iv idua l’ s dual
susceptibility when they are in a high state o f stress.
Reproduced with permission of the copyright owner. Further reproduction prohibited without permission.

62
According to Maat ( 1984), the problem in the study o f correlation between enamel
hypoplasia and Harris lines is due to the fact that Harris lines are subject to resorption
while hypoplastic defects are not. Therefore, in his conception, it is necessary to check
Harris lines against enamel hypoplasia, and not vice versa. His study showed that there is
a correlation between type I I I lines (moderate lines located in the diaphysis, plus w e ll-
marked lines located in the metaphyses) w ith enamel hypoplasia. Therefore, type I I I lines
represent events disturbing both developmental systems (bone and teeth) w ith in an
individual.
As a consequence Maat ( 1984) considers that an emphasis on type I I I lines m inim izes
the risk o f misinterpretations o f lines as markers o f serious health insults. However, he
recognizes that the less-well marked lines may also represent o rig ina lly well-marked
cases partially obliterated by resorption.
Mays ( 1995) did not find a chronological association between these two indicators o f
stress. His study showed that enamel defects may occur when no corresponding Harris
lines are visible on the bones, while in some cases Harris lines had been found w ithout a
correspondingly enamel defect although they were formed during the period in which the
crowns o f the anterior teeth were growing. Considering that these stress markers are non
specific and the result o f the same biological process (halted bone/enamel deposition)
there should be. at least in theory, a correlation between the two o f them. However, as
presented above, there is no agreement about the presence/absence o f correlation between
these two stress indicators. Thus, it is not only possible but also necessary to develop a
study as the one proposed here.
Reproduced with permission of the copyright owner. Further reproduction prohibited without permission.
CHAPTER IV
M A TE R IA LS A N D M ETHODS
V I. I .Populations Under Study
Two populations were considered for the purpose o f this study. Az-71 (juvenile
segment) and Az-140. These populations inhabited the Azapa valley, during the Early
Intermediate period (B.C.1700-A.D.500) and the M iddle Horizon (A.D.400-1000; see
Figure 4. map 1 and map 2).
V I. 1.1. The Azapa Valley
The Azapa valley is located in the south central Andean region, and is one o f the
occidental valleys (Lumbreras. 1981). These occidental valleys are found in southern
Peru and northern Chile, and are formed as the result o f the action o f rivers and streams.
which originate in the western slope o f the Andes. It is. in fact, the presence o f these
rivers what allows the settlement o f human groups in this area.
The Azapa valley ( 17°30’ -19° 10’ ) is part o f the Atacama Desert where rain is scarce,
daily temperature oscillation is extreme and the vegetation is poor (Sepulveda. 1962:
Villagran et al. 1982). The environmental arid ity is the result o f a set o f variables; over
the waters o f the Pacific Ocean, due to the Humboldt Current, the a ir is cold and humid.
but when the w ind blows over the hot land, the hum id ity evaporates before any cloud can
be formed. In addition, the "C ord ille ra de la Costa” , a massive range o f mountains at the
coast, does not a llow the humid winds from the ocean to reach the valley. Moreover, the
63
Reproduced with permission of the copyright owner. Further reproduction prohibited without permission.
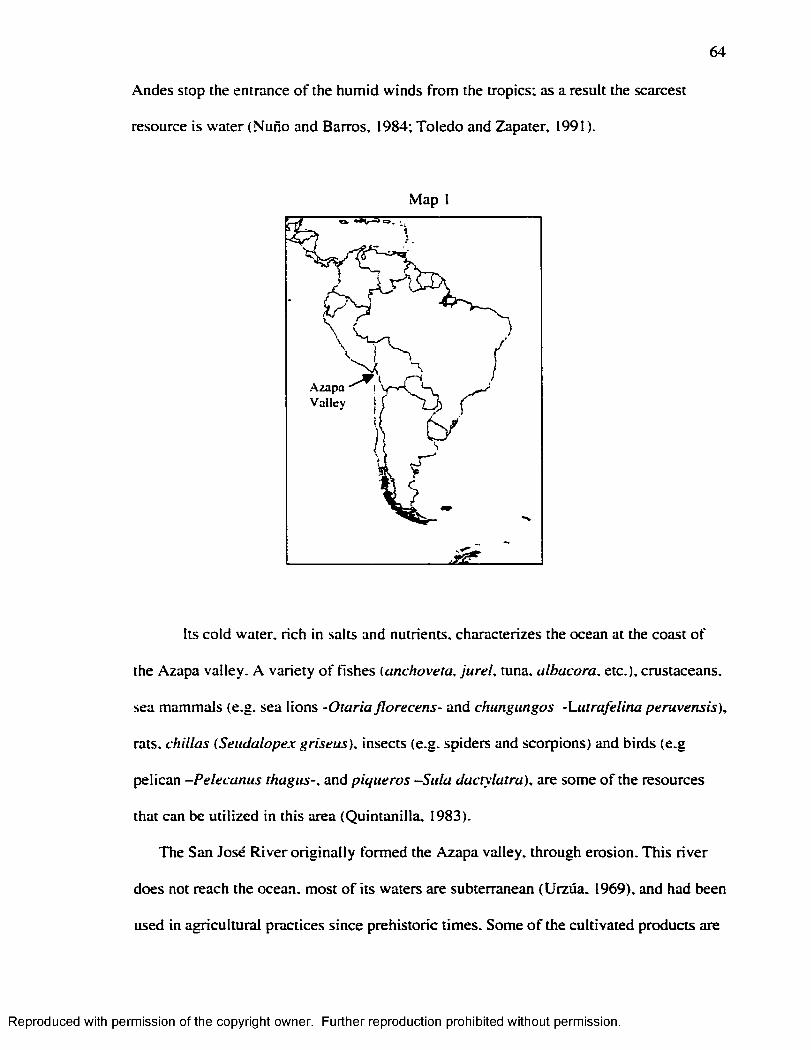
64
Andes stop the entrance o f the humid winds from the tropics; as a result the scarcest
resource is water (Nuno and Barros, 1984; Toledo and Zapater, 1991).
Map
A zap aV alley
Its cold water, rich in salts and nutrients, characterizes the ocean at the coast o f
the Azapa valley. A variety o f fishes (anchoveta. ju re l, tuna, albacora. etc.), crustaceans,
sea mammals (e.g. sea lions -O taria florecens- and chiingungos -Lutrafe lina peruvensis),
rats, chillas {Setidalopex griseus). insects (e.g. spiders and scorpions) and birds (e.g
pelican -Pelecanus thagiis-. and piqueras —Sula dactylatra), are some o f the resources
that can be utilized in this area (Quintanilla. 1983).
The San José R iver o rig ina lly formed the Azapa valley, through erosion. This river
does not reach the ocean, most o f its waters are subterranean (Urzüa. 1969), and had been
used in agricultural practices since prehistoric times. Some o f the cultivated products are
Reproduced with permission of the copyright owner. Further reproduction prohibited without permission.
65
yuca. pumpkin, ch ili, tomato, cotton, avocado and com -Zea mays- (Keller, 1946; Toledo
and Zapater. 1991). Some o f the native threes in the valley are chanar {Geofrea
decorticans), algarrobo (Prosopis atacamensis) and pimiento (Schinus molle:
Quintanilla, 1983). Snakes (e.g.. Dromicus angustilineatus), lizards (Phyllodactylus
inaeqiiallscope and P. he te runts), batrachians (Bufo atacamensis and B. ka linow skii), and
birds (e.g.. Zontrichia capensis antofagastae) are some o f the faunal resources in the
valley (Quintanilla. 1983).
Towards the west, the altitude o f the valley increases, to the point that it disappears in
the slopes o f the Andes (Keller. 1946). where the environmental conditions change, as do
the fauna and flora.
V I. 1.2. Formative Period ( 1700B.C.-500A.D.)
Az-71's population inhabited the Azapa Valley (see map 1 and 2) during the
Formative period ( 1700B.C.-500A.D.). The Formative period can be characterized by the
appearance o f agricultural practices, which were fu lly adopted by I300B.C. The presence
o f irrigation channels shows the existence o f social coordination and organization. The
houses present more permanent characteristics that indicate a lower degree o f m ob ility
among these populations, in comparison w ith the previous. Archaic, period (Nunez.
1989).
Tw o cultural phases are recognized in the Azapa valley for this period: a) Azapa
phase ( 1300B.C.-560B.C.), and b) A lto Ramirez (410B.C.-760A.D.; see figure 4). The
first cultural phase is Azapa. The Azapa groups were mainly hunter-gatherers, but they
also cultivated products such as ch ili, achira, gourds, and sweet potato. The habitational
sites are located close to springs, and the cemeteries are found near to the habitational
sites (Santoro 1980a; 1980b).
Reproduced with permission of the copyright owner. Further reproduction prohibited without permission.
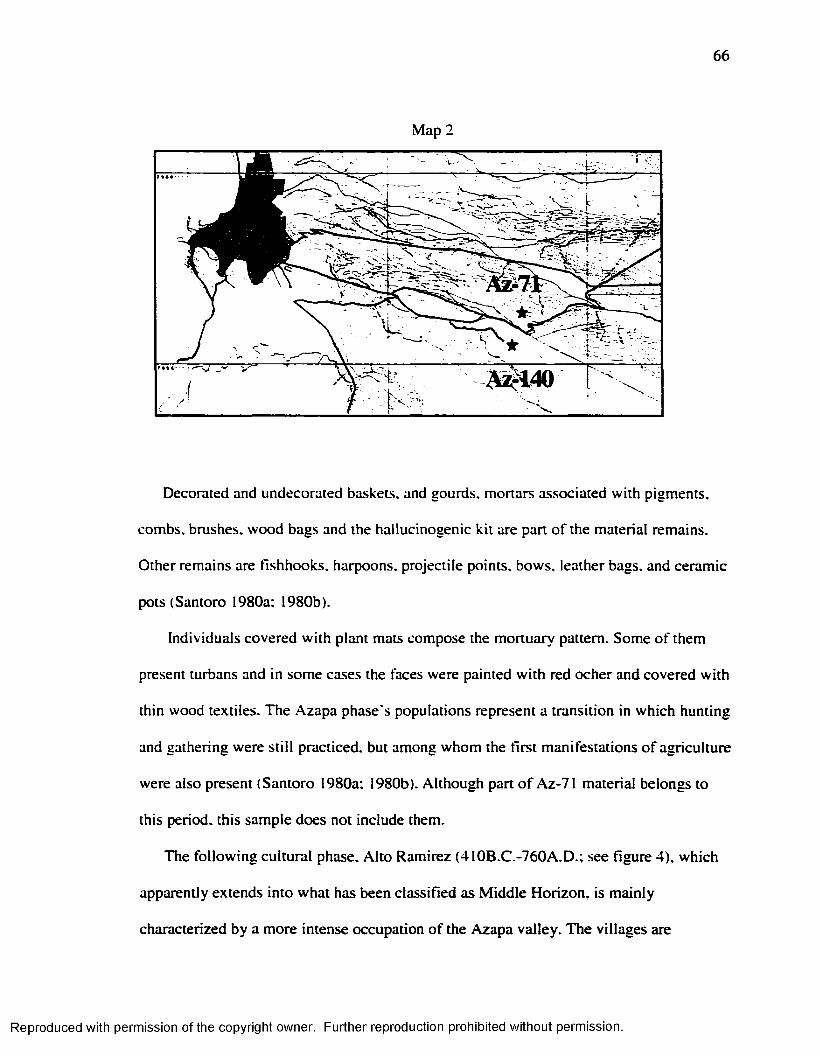
66
Map 2
Decorated and undecorated baskets, and gourds, mortars associated w ith pigments,
combs, brushes, wood bags and the hallucinogenic k it are part o f the material remains.
Other remains are fishhooks, harpoons, projectile points, bows, leather bags, and ceramic
pots (Santoro 1980a; 1980b).
Individuals covered w ith plant mats compose the mortuary pattern. Some o f them
present turbans and in some cases the faces were painted w ith red ocher and covered w ith
thin wood textiles. The Azapa phase's populations represent a transition in which hunting
and gathering were s till practiced, but among whom the first manifestations o f agriculture
were also present (Santoro 1980a; 1980b). A lthough part o f Az-71 material belongs to
this period, this sample does not include them.
The fo llow ing cultural phase. A lto Ramirez (410B.C.-760A.D.; see figure 4), which
apparently extends into what has been classified as M idd le Horizon, is mainly
characterized by a more intense occupation o f the Azapa valley. The villages are
Reproduced with permission of the copyright owner. Further reproduction prohibited without permission.

67
associated w ith burial mounds. The burials were usually sealed w ith plant mats, under
which the funerary bundles were deposited. The bodies were usually flexed, on their side
or seated. Some o f them present hatbands, hats o r turbans, and loincloths. Grave goods
are scarce, and the bodies do not present a direct association w ith them; in some cases the
grave goods are intrusive in the archaeological record. Necklaces (made o f m alaquita or
shells), spindles, baskets, shells, fishes, pottery, mortars, pestles, camel id bones, and
some trophy skulls are part o f the material remains ( Rivera et al.. 1987; Munoz. 1983a;
1883b; 1987. 1989; Nunez. 1989).
A lto Ramirez's populations had a mixed economy in which mandioca. quinoa, beans,
sweet potatoes, com. ynca. and ch ili were cultivated. The use o f tools for agricultural
activities became more common in comparison w ith the previous period, and chanar and
algarrobo flours were part o f the diet. The technology used in the elaboration o f ceramics
was more sophisticated in comparison w ith the Azapa phase (Rivera et al.. 1973; Munoz.
1983a; 1989).
Intensive cultivation o f com . gourd, pumpkin, sweet potato, achira and quinoa.
demonstrate that at this time the adoption o f agriculture was complete, and it was
accompanied by the domestication o f camelids (Nunez, 1989).
The latest moments o f the A lto Ramirez phase can be characterized by the absence o f
burial mounds and grave goods. The bodies were generally deposited in large baskets,
and they show fractures and alterations o f the ir limbs (M unoz, 1983a).
It has been suggested that a ltip lanic populations migrated to the Azapa valley during
the Formative period. The archaeological evidence, however, shows that the importance
o f the foreign products is lim ited, the objects that suggest the present o f an altip lanic
population are scarcely represented in the archaeological record, and up to this moment.
Reproduced with permission of the copyright owner. Further reproduction prohibited without permission.
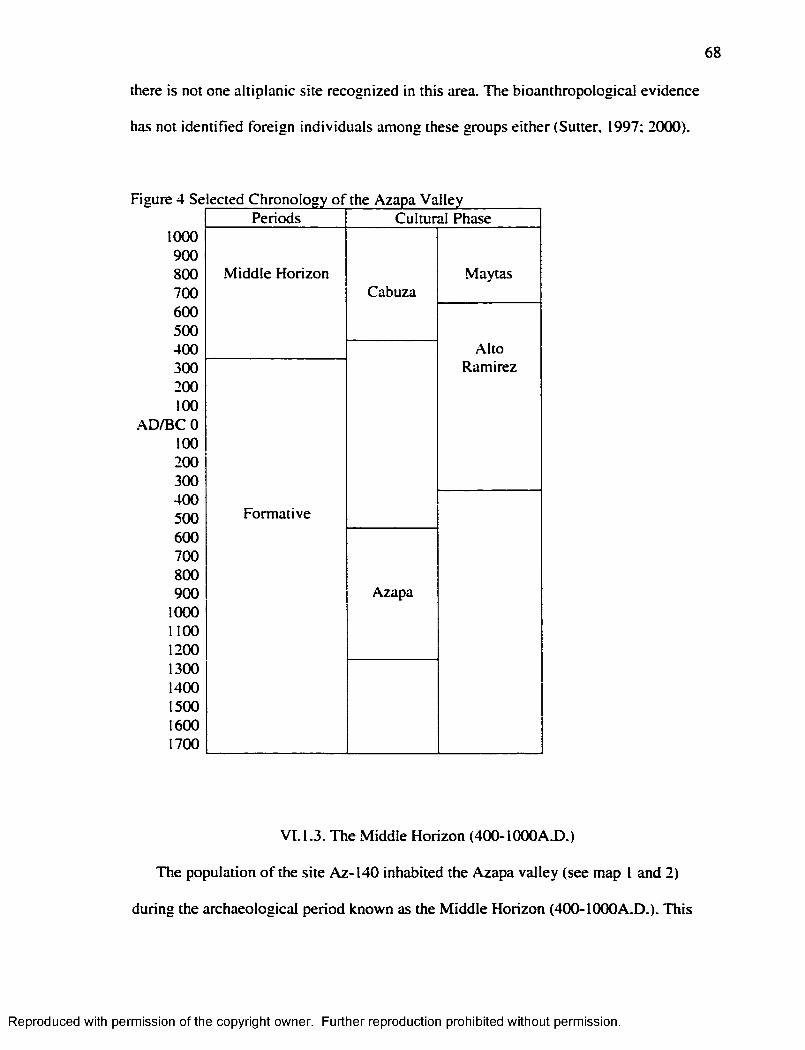
68
there is not one altip lanic site recognized in this area. The bioanthropological evidence
has not identified foreign individuals among these groups either (Sutter, 1997; 2000).
Figure 4 Se
1000 900 800 700 600 500 400 300 200 100
.AD/BC 0 100 200 300 400 500 600 700 800 900
1000 1100 1200 1300 1400 1500 1600 1700
ected Chronology o f the Azapa ValleyPeriods
M idd le Horizon
Formative
Cultural Phase
Cabuza
Azapa
Maytas
A ltoRamirez
V I.I.3 . The M iddle Horizon (400-IOOOAX).)
The population o f the site Az-140 inhabited the Azapa valley (see map I and 2)
during the archaeological period known as the M idd le Horizon (400-I000A .D .). This
Reproduced with permission of the copyright owner. Further reproduction prohibited without permission.
69
period can be characterized by the presence o f populations that practiced farm ing and
herding, while complex social organization is evidenced through the appearance o f elite
groups. Tw o archaeological phases are recognized fo r this period: Cabuza (400-700
A .D .) and Maytas (700-1(XX)A.D.: Munoz. 1983b; Focacci. 1990; Uribe. 1999).
The populations inhabited small villages, located in the high slopes o f the h ills,
characterized by the presence o f rectangular houses. The burials were located next to the
villages, far away from the farm fields. The bodies were flexed, dressed w ith decorated
wool shirts and accompanied w ith varied funerary goods. The tombs were directly
excavated on the earth and present a cylindrical shape ( Munoz. 1983b; Berenguer and
Dauelsberg. 1989; Focacci. 1990; Uribe. 1999). During the M iddle Horizon, in general,
the archaeological remains show a high intake o f com, potato, sweet potato, gourd, beans,
and a m inor intake o f llam a, guanaco. guinea pigs and seafood (Berenguer and
Dau les berg. 1989; Dauelsberg. 1992-1993).
Two archaeological phases are recognized for this period: a) Cabuza (400-1000A.D .)
and b) Maytas (700-1000A .D .). Ceramic types differentiate one phase from the other;
Cabuza presents ceramic pots w ith right angles, plane bases, painted (black over red), and
modeled decoration. There is certain s im ilarity between this ceramic type and the one
produced in the altip lanic site o f Tiwanaku (Munoz. 1983b; Focacci. 1990; Uribe. 1999).
Maytas ceramic type is three-colored, and is currently understand as a transformation o f
the Cabuza style, that has been interpreted as a reaction to the influence o f Tiwanaku
(Uribe, 1999).
It was orig ina lly postulated that during this period altiplanic colonies (Tiwanaku)
were settled in the valley (Murra. 1972; Berenguer, 1975; Focacci, 1982; Nunez and
Dillehay, 1995) as some archaeological remains in the Azapa valley (sites Az-143, Az-
Reproduced with permission of the copyright owner. Further reproduction prohibited without permission.
70
144, and Atoca-1) suggest the influence o f T iwanaku culture in this area. The evidence,
however, does not demonstrate the presence o f altiplanic colonies in the valley, and
bioanthropological studies do not confirm the presence o f these colonies (Goldstein
1995-1996; Sutter, 1997. 2000).
rv.2. Material
The osteological collections that are the subject o f this analysis come from the
archaeological sites o f Az-71 and AZ-140. These collections are curated at the "Museo
San M iguel de Azapa” (M A S M A ) in the Azapa Valley, northern Chile. The composition
o f the collections is described in table 7.
.Az-71's and Az-140's populations inhabited the Azapa valley (see map 2) during two
archaeological periods: Formative period (1700 B.C.-400 A .D .) and the M iddle Horizon
(400-1000 A .D .) respectively. The sample from Az-71 includes only the juvenile
individuals in order to increase the sample size for this age segment. This was considered
necessary in order to identify a possible correlation between the two indicators (H L and
EH), since it may disappear in older individuals due to the process o f resorption that
affects Harris lines.
From these two populations only 136 individuals were analyzed (see table 7 and
graph 2) because o f two restrictions:
1 ) Only the individuals that had at least one observable tooth were considered; and.
2) O f the above sample, on ly the individuals w ith at least one available tib ia were
considered.
Reproduced with permission of the copyright owner. Further reproduction prohibited without permission.
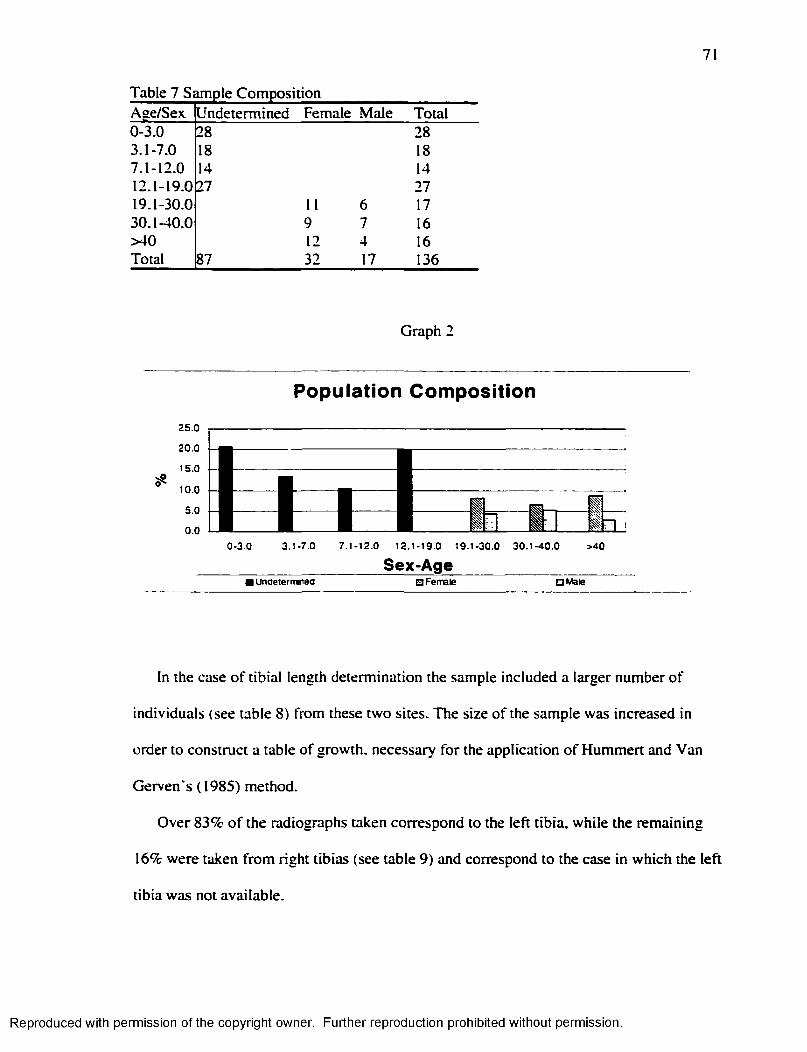
71
Table 7 Sample CompositionAge/Sex Undetermined Female Male Total0-3.0 28 283.1-7.0 18 187.1-12.0 14 1412.1-19.0 27 2719.1-30.0 11 6 1730.1-40.0 9 7 16>40 12 4 16Total 87 32 17 136
Graph 2
Population Composition
I0-3.0 3.1-7.0
B■7.1-12.0 12.1-19.0 19.1-30.0 30.1-40.0
Sex-Age_______ _____>40
I undeiermnea Q Female a Male
In the case o f tib ia l length determination the sample included a larger number o f
individuals (see table 8) from these two sites. The size o f the sample was increased in
order to construct a table o f growth, necessary fo r the application o f Hummert and Van
Gerven's (1985) method.
Over 83% o f the radiographs taken correspond to the le ft tib ia, while the remaining
16% were taken from right tibias (see table 9) and correspond to the case in which the left
tib ia was not available.
Reproduced with permission of the copyright owner. Further reproduction prohibited without permission.
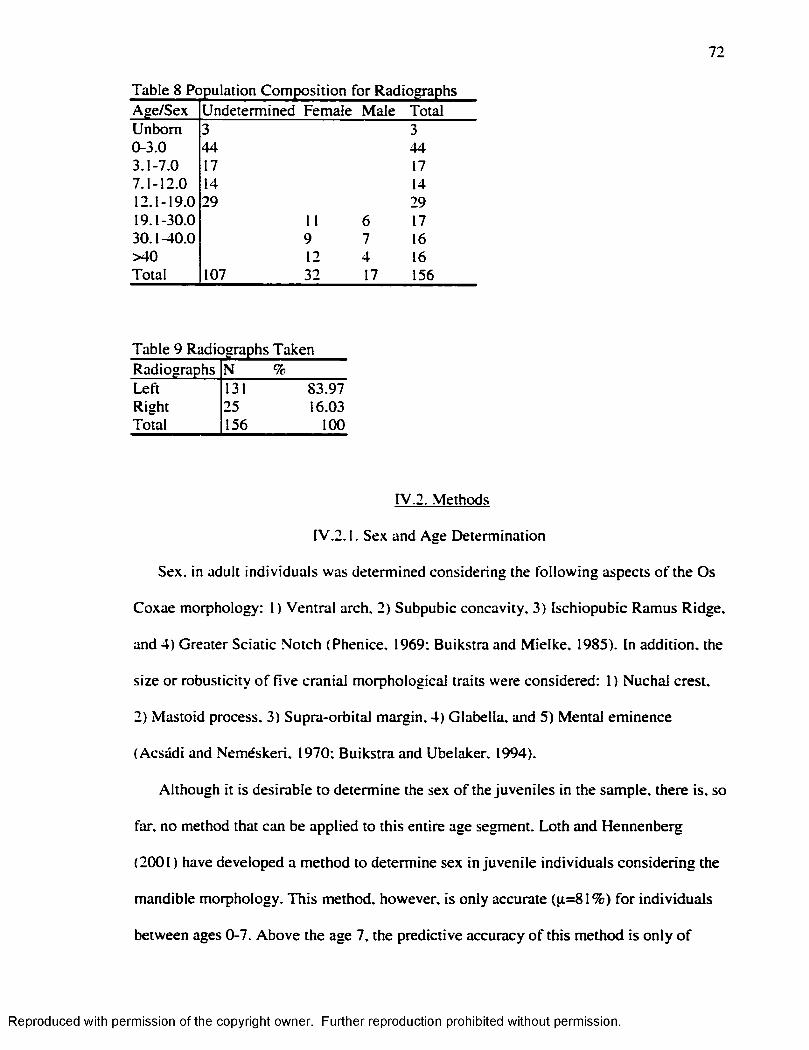
72
Table 8 Population Composition for RadiographsAge/Sex Undetermined Female Male TotalUnbora 3 30-3.0 44 443.1-7.0 17 177.1-12.0 14 1412.1-19.0 29 2919.1-30.0 11 6 1730.1-40.0 9 7 16>40 12 4 16Total 107 32 17 156
Table 9 Radiographs TakenRadiographs N %Left 131 83.97Right 25 16.03Total 156 100
rV.2. Methods
rV.2.1. Sex and Age Determination
Sex. in adult individuals was determined considering the fo llow ing aspects o f the Os
Coxae morphology: 1 ) Ventral arch. 2) Subpubic concavity, 3) Ischiopubic Ramus Ridge,
and 4) Greater Sciatic Notch (Phenice, 1969: Buikstra and M ielke, 1985). In addition, the
size or robusticity o f five cranial morphological traits were considered: 1) Nuchal crest,
2) Mastoid process, 3) Supra-orbital margin, 4) Glabella, and 5) Mental eminence
(Acsadi and Nemeskeri, 1970; Buikstra and Ubelaker. 1994).
Although it is desirable to determine the sex o f the juveniles in the sample, there is. so
far. no method that can be applied to this entire age segment. Loth and Hennenberg
(2001) have developed a method to determine sex in juvenile individuals considering the
mandible morphology. This method, however, is only accurate (p=81% ) fo r individuals
between ages 0-7. Above the age 7, the predictive accuracy o f this method is on ly o f
Reproduced with permission of the copyright owner. Further reproduction prohibited without permission.
73
69%. Schutkowski (1993) offered a second sex determination method fo r juveniles. In
this method mandible and ilium were considered. The analysis showed six traits that were
sexually dim orphic in juveniles: I ) chin 2) anterior dental arcade, 3) gonion, 4) angle o f
the greater schiatic notch. 5) depth o f the greater schiatic notch, and 6) curvature o f the
iliac crest. The method is highly accurate to determine sex in males (95%) but not as
accurate in females (71.4%). In addition, the few individuals o f more than five years o f
age that were analyzed in this study did not show the typical sex-distribution o f these
traits. Therefore, this method is not recommended fo r individuals o f five o r more years o f
age. La Velle ( 1995) compared the breadth o f the ischium and the acetabular regions
among 8 years olds and found significant sex differences. Application o f this method in
the population under study, however, has shown low accuracy (Sutter. 2002 pers. com.).
Among the adults, age was determined considering age-associated changes in the
pubic symphisis, according to Todd’s ( 1921a: 1921b) and Brooks and Suchey's ( 1990)
methods. In addition, age associated changes were evaluated in the auricular surface, and
in the lateral-anterior cranial sutures (M eindl and Lovejoy. 1985; 1989).
The subadult age was determined considering: 1) Dental maturation (Ubelaker.
1989); 2) union o f the prim ary ossification centers (Steele and Bramblett, 1988); and, 3)
union o f epiphyses (M cKem and Steward, 1957; Suchey et al.. 1984; Krogman and Iscan.
1989; Ubelaker. 1989).
Once age and sex o f the individuals was determined, the populations was divided into
the fo llow ing age-sex groups:
•0-3.0
•3.1-7.0
•7.1-12.0
Reproduced with permission of the copyright owner. Further reproduction prohibited without permission.

74
•12.1-19.0
• 19.1-30.0 Female/ 19.1-30.0 Male
•30.1-40.0 Female/ 19.1-30.0 Male
•>40 Female/ >40 Male
IV.2.2. Harris Lines
Harris lines were studied using radiographs, instead o f cutting the bones cross
sectional, for two reasons: 1 ) Harris lines are more visible in radiographs (M achiarelli et
al.. 1994) and 2) radiographs are non-destructive. The radiographs were obtained from
the laboratory in the "Museo San M iguel de Azapa” .
The radiograph equipment utilized in this study was: Portable ProfexRay. model A .
serial 2228 X R A Y . The radiographs were obtained using 85-90volt. m A 2-3. In adults the
time o f exposition was 3-4 seconds, while in juveniles the time varied between 2-3
seconds.
The tibia was selected fo r the identification o f Harris lines because:
1 ) It is the most commonly used bone, so this study can be compared w ith others: and
2) It presents nearly horizontal non-convoluted epiphyses whose shape w ill not
significantly distort the geometry o f a transverse line in relation to the plane o f the X-ray.
The study o f Harris lines was done according to the fo llow ing process:
1 ) I f the two tibias were present, only the le ft one was considered (because it has been
shown that it presents a greater number o f lines, in comparison w ith the right one);
2) In the cases where the left tibia was absent the right one was considered, and its use
was recorded;
Reproduced with permission of the copyright owner. Further reproduction prohibited without permission.
75
3) Determining the presence o f the line: the presence o f a radiopaque line in the
radiograph was counted as a Harris line i f it covered at least 30% o f the shaft w idth, and
only i f the angle was higher than 45° and lower than 135° (C lark and M ack. 1988); and,
4) The lines for both the proximal and distal segments were considered.
Although Hummert and Van Gerven ( 1985) recommend researchers to count only the
lines in the distal shaft, the analysis o f the radiographs showed that some individuals only
presented lines in the proximal end o f the diaphysis. Then, i f the analysis were restricted
only to the distal end. the results would have been biased.
The age o f the individual at the time o f the line formation was calculated according to
the specifications o f the two methods (Hummert and Van Gerven. 1985; Byers. 1991 )
selected in this study.
Several methods have been proposed for the estimation o f the age o f the individual at
the time o f the line formation (A llison et al.. 1974; Hunt and Hatch. 1981; M att. 1984;).
Byers' (1991) method was chosen in this particular study because it offers a series o f
advantages like:
1 ) A table o f percentage o f growth per year (see table 2);
2) It does not assume an average tibia's length at b irth {contra A llison et al., 1974);
3) It differentiates males and females;
4) It considers the different rates o f growth for proximal (57%) and distal (43%) sections
o f the tib ia; and,
5) It is case specific because it considers each individual tibia's length in the calculation.
A second method (Hummert and Van Gerven, 1985) w ill also be applied. This one
has been selected because:
Reproduced with permission of the copyright owner. Further reproduction prohibited without permission.
76
I ) It allows the analysis o f immature remains, although it can also be applied in the adult
segment o f the population;
2) It is population specific, because it demands the construction o f a table fo r the tibia!
growth;
3) It does not assume an average length o f the tib ia at b irth (contra A llison et al.. 1974);
and.
4) It considers the different rates o f growth for the proxim al (57%) and distal (43%)
sections o f the tibia.
Although this method has several advantages in common w ith the one offered by
Byers (1991). its m ajor contribution is its app licability to immature remains. Since Harris
lines are subject to resorption, i f only the adult segment was analyzed, the number o f
lines recognized would be lower due to resorption. Therefore the absence o f correlation
between Harris lines and enamel hypoplasia in the adults would be misleading, and it is
through the analysis o f im m ature' remains that this erroneous conclusion can be avoided.
Hummert and Van Gerven ( 1985) applied their method to the distal end o f the tib ia only.
The analysis o f the radiographs, however, showed that some individuals, especially
juveniles, have H L on ly, o r mostly, on the proximal end. A total o f 87 tib ia 's radiographs
from individuals aged U nborn-19 years o f age were considered in the construction o f
proximal and distal tib ia l growth tables (see Table 19 and Table 20). For both methods,
the tib ia ’s length was measured from the radiograph.
rv.2.3 Enamel Hypoplasia
The fo llow ing steps were used in the analysis o f Enamel Hypoplasia:
1 ) Identify the presence o f an enamel defect;
2) Identify the type o f defect: a) line, b) p it, c) line o f pits, d) group o f pits o r e) band;
Reproduced with permission of the copyright owner. Further reproduction prohibited without permission.
77
3) Measure the distance between the defect and the cemento-enamel junction (CEJ). A
dental caliper was utilized to ensure accuracy; and.
4) Calculate the age o f the individual at the tim e o f defect formation.
Several methods have been proposed fo r the estimation o f the age o f the individual at
the time o f the formation o f the defect (e.g. Hodges and W ilkinson, 1990). In this specific
case. Goodman and Rose' ( 1990) regression equations were applied ( 1990; see table 4).
The Goodman and Rose ( 1990) method was selected over others because:
1 ) It is simple to apply;
2) It does not require a control population (not available for the current study); and,
3) It is the most popular method used in the study o f enamel hypoplasia.
Lim itations o f this specific method include the assumption that crown height and
mean age at enamelization onset and com petition are the same for the population under
study, and the one studied by Goodman and Rose ( 1990; Berti and Mahaney. 1992). The
method was also adjusted for the average crown height per tooth-type in the sample; this
method w ill be referred as “ adjusted Goodman and Rose method” . Mean crown height
per tooth-type was calculated using teeth o f the le ft m axilla and mandible that were
unworn or that presented a m inim um degree o f wear (Rogers. 1984; Smith. 1984). Thus,
two methods. Goodman and Rose ( 1990) and adjusted Goodman and Rose, were applied
in the determination o f the age o f the individuals at the time o f the EH formation in
permanent teeth.
In deciduous teeth, Blakeley and Armelagos' ( 1985) method was applied. In order to
do that the fo llow ing steps were completed:
1 ) Teeth that present less than two degrees o f abrasion (determined using the Smith,
1984 method) were measured fo llow ing Rogers’ indications (1984);
Reproduced with permission of the copyright owner. Further reproduction prohibited without permission.
78
2) According to the previous results, a mean crown height fo r each tooth type was
established and then it was divided into the numbers o f months that i f takes the crown to
develop; and
3) Then, the distance between the enamel defect and the CEJ was converted in years,
according to the previous calculations.
In all the methods, for permanent and deciduous teeth, the fo llow ing assumptions
were accepted:
1 ) The assumed date o f in itia l calcification is valid, although geographical variations due
occur;
2) 4|im/day is the regular mean o f enamel deposition, although incremental growth rates
in excess o f this may occur, and
3) Continual growth o f the tooth crown during its developments occurs, fo r i f the
retreating cell layers rest at any time, then the time scale o f the record is distorted (Levine
et al.. 1979).
rv.2.4. Statistical Analysis
A fte r the data was collected, statistical analyses (descriptive, parametric and non-
parametric) were performed in order to establish whether these two indicators:
1 ) Result from the same environmental conditions;
2) Are equally sensitive to the same environmental conditions;
3) Are equally reliable as indicators o f stressful conditions experienced by past
populations; and,
4) Show a coincidence in the time o f formation.
Descriptive statistic was obtained using Excel 97, while parametric and non-
parametric statistic tests were applied using SPSS 10.1.
Reproduced with permission of the copyright owner. Further reproduction prohibited without permission.
79
The incidence o f H L and EH was first calculated considering the number o f
individuals that presented them. The number o f H L in the distal and proxim al end o f the
tibia was also calculated. In the case o f EH the numbers o f teeth affected in the sample
were calculated along w ith the average number o f defects formed in deciduous and
permanent teeth per tooth affected. In the cases were differences between age-sex groups,
in terms o f the frequency o f EH. were detected Z tests were applied in order to determine
i f these differences were significant. The difference in average number o f EH defects
between deciduous and permanent teeth were evaluated w ith the student t-test (Steel and
Torrie. 1995).
The age o f the individuals at the time o f EH and H L formation was calculated w ith
the methods already described. The results are expressed considering the age-sex groups
and by one-year range in terms o f the age at the time at their formation, except for the
segment <1 which groups in H L and EH formed in uterus and during the 11 months
before the year o f age.
The age at the time o f H L and EH formation was compared in terms o f general
distribution and also specific distribution fo r the adult segment. The results for H L and
EH were then compared. For EH in the deciduous teeth, o r the results obtained w ith
Blakeley and Armelagos* ( 1985) method were grouped w ith the Goodman and
.Armelagos ( 1990) and the Goodman and Armelagos Adjusted method, in order to have a
complete description o f the distribution.
The results obtained w ith the Byers' (1991) method and the Hummert and Van
Gerven's ( 1985) method (considering only the same individuals) were compared using
the t-test fo r paired samples. The same test was applied to compare the results obtained
Reproduced with permission of the copyright owner. Further reproduction prohibited without permission.
80
w ith the Goodman and Rose’s (1990) and Goodman and Rose adjusted method (Steel
and Torrie, 1995).
Between these two markers (H L and EH), at the individual level (presence/absence),
and in order to establish the presence/absence o f correlation a general Chi" test and C hi"
for each sex-age group were obtained. Between these two markers and at the individual
level the d istribution o f age o f the individuals at the time o f EH and H L formation was
compared.
F inally, and in order to remove the noise, the data concerning age o f the individual at
the time o f H L and EH formation, was smoothed by subtracting the average number o f
H L and EH formed at each specific year. The remaining H L were matched w ith the
remaining EH. In order to avoid the danger o f having subtracted the average number o f
H L formed due to stress and not to growth, three correction factors were added to the
residual H L (0.1: 0.2: 0.3). The remaining H L once the correction factor was added, were
matched each tim e w ith the remaining EH. Remaining H L were compared w ith
remaining EH and not the other way around in order to avoid the possibility that the
absence o f HI was due to the resorption process. The proportion o f matches and
disagreements were then compared.
Reproduced with permission of the copyright owner. Further reproduction prohibited without permission.
CHAPTER V
RESULTS
This chapter presents the results o f the analyses o f the radiographed tibias and the
dental enamel o f the sample. First, the Harris lines results w ill be presented, in terms o f
the percentage o f individuals affected and the frequency o f lines. This section w ill be
followed by the results obtained for age o f the individual at the time o f Harris lines
formation. Next, the enamel hypoplasia results w ill be presented, and they include
percentage o f individuals affected and frequency o f the defects. In addition, the results
obtained by percentage o f teeth affected w ill be exposed.
Next, the results o f the analysis o f the correlation between these two indicators w ill
be presented, in terms o f their correspondence at the individual level and in terms o f age
o f the individuals at the time H L and EH formation. A ll the comparisons were carried out
considering the age and sex o f the individuals in the sample.
V. 1. Harris Lines
V.1.1. Harris Line 's Incidence at the Individual Level
The incidence o f Harris lines at the individual level was assessed to determine the
percentage o f individuals that exhibited this particular indicator. The analysis showed that
81
Reproduced with permission of the copyright owner. Further reproduction prohibited without permission.
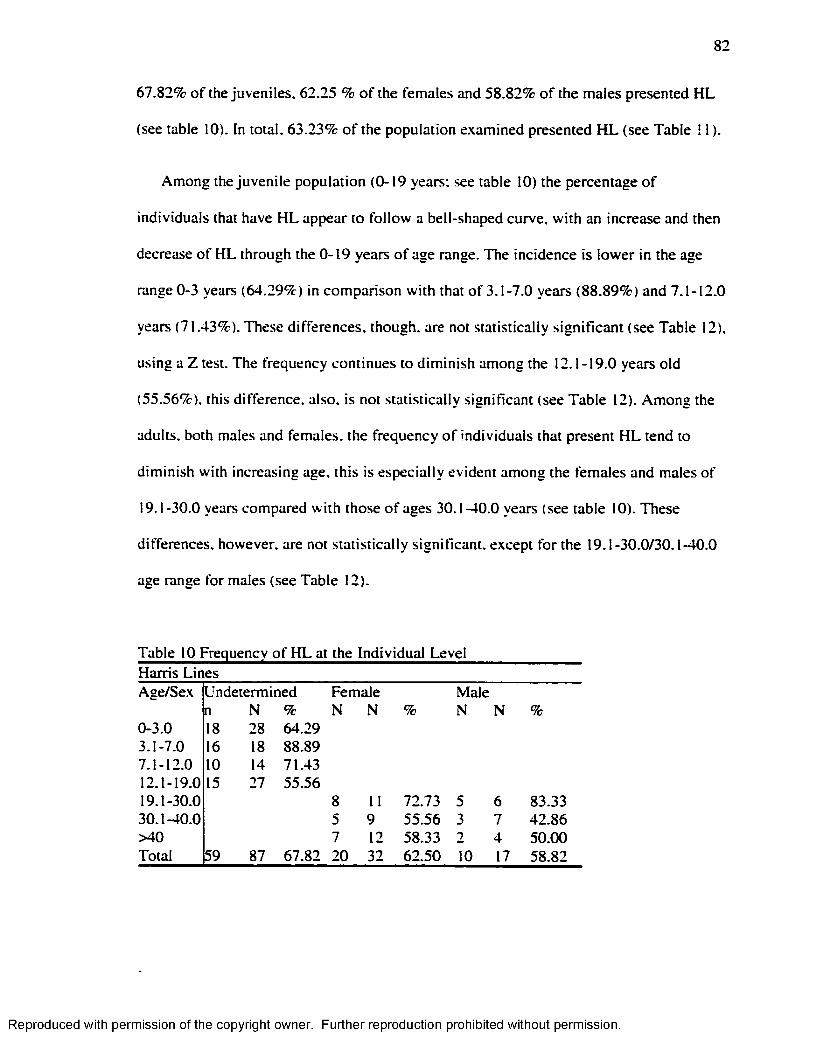
82
67.82% o f the juveniles. 62.25 % o f the females and 58.82% o f the males presented H L
(see table 10). In total. 63.23% o f the population examined presented H L (see Table 11 ).
Among the juven ile population (0-19 years: see table 10) the percentage o f
individuals that have H L appear to fo llow a bell-shaped curve, w ith an increase and then
decrease o f H L through the 0-19 years o f age range. The incidence is lower in the age
range 0-3 years (64.29%) in comparison w ith that o f 3.1-7.0 years (88.89%) and 7.1-12.0
years (71.43%). These differences, though, are not statistically significant (see Table 12).
using a Z test. The frequency continues to dim inish among the 12.1-19.0 years old
(55.56%). this difference, also, is not statistically significant (see Table 12). Among the
adults, both males and females, the frequency o f individuals that present H L tend to
dim inish w ith increasing age. this is especially evident among the females and males o f
19.1-30.0 years compared w ith those o f ages 30.1-40.0 years (see table 10). These
differences, however, are not statistically significant, except fo r the 19.1-30.0/30.1-40.0
age range for males (see Table 12).
Table 10 Frequency o f H L at the Individual Level Harris LinesAge/Sex Undetermined Female Male
n N % N N % N N %0-3.0 18 28 64.293.1-7.0 16 18 88.897.1-12.0 10 14 71.4312.1-19.0 15 27 55.5619.1-30.0 8 11 72.73 5 6 83.3330.1-40.0 5 9 55.56 3 7 42.86>40 7 12 58.33 2 4 50.00Total 59 87 67.82 20 32 62.50 10 17 58.82
Reproduced with permission of the copyright owner. Further reproduction prohibited without permission.
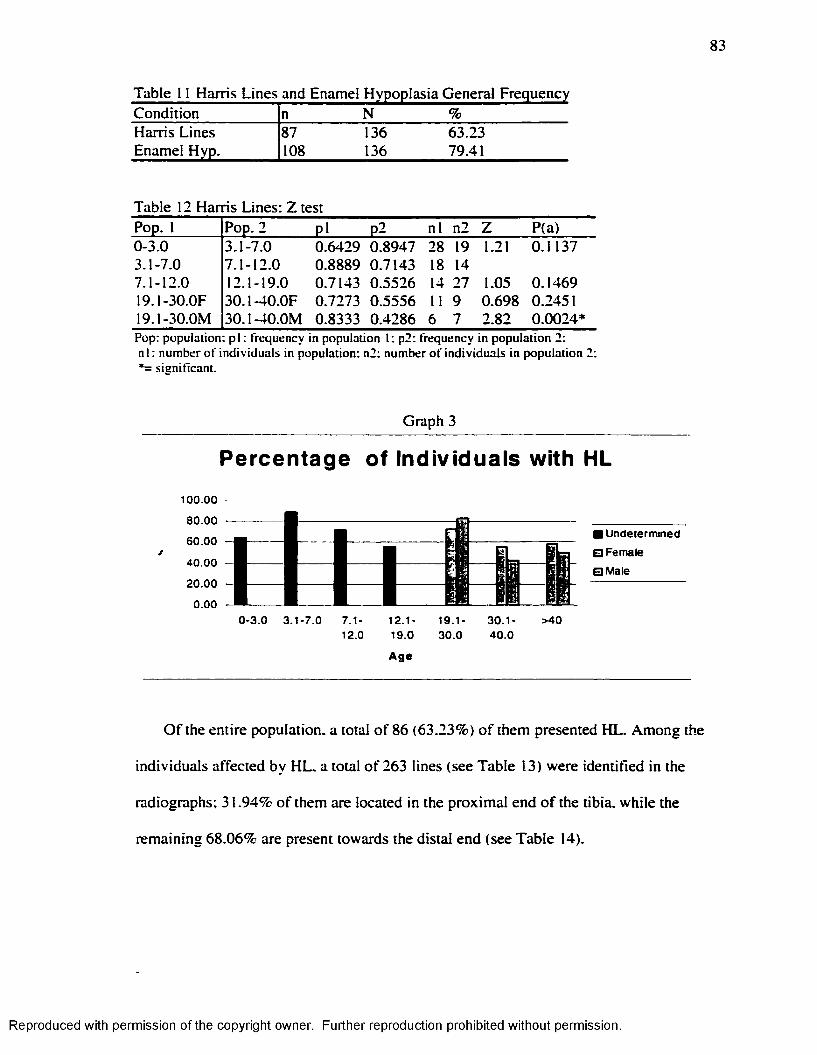
83
Table 11 Harris Lines and Enamel Hypoplasia General FrequencyCondition n N %Harris Lines 87 136 63.23Enamel Hyp. 108 136 79.41
Table 12 Harris Lines: Z testPop. 1 Pop. 2 p i P2 n l n2 Z P(a)0-3.0 3.1-7.0 0.6429 0.8947 28 19 1.21 0.11373.1-7.0 7.1-12.0 0.8889 0.7143 18 147.1-12.0 12.1-19.0 0.7143 0.5526 14 27 1.05 0.146919.1-30.0F 30.1-40.0F 0.7273 0.5556 11 9 0.698 0.245119.1-30.0M 30.1-40.0M 0.8333 0.4286 6 7 2.82 0.0024*P op : p o p u la tio n : p i : frequency in p o p u la tio n 1: p2 : freq u en cy in p o p u la tio n 2 : n I : n u m b e r o f in d iv id u a ls in p o p u la tio n : n2 : n u m b er o f in d iv id u a ls in p o p u la tio n 2: *= sig n ifican t.
Graph 3
Percentage of Individuals with HL
100.00
80.00
60.00
40.00
20.00 -
0.00
■ Undetermined
□ Female
0M ale
0-3 .0 3 .1 -7 .0 7.1-12.0
1 2 . 1 -
19.0
Ag e
19.1-30.0
30 .1 -40 .0
>40
O f the entire population, a total o f 86 (63.23%) o f them presented HL. Among the
individuals affected by H L. a total o f 263 lines (see Table 13) were identified in the
radiographs; 31.94% o f them are located in the proxim al end o f the tibia, while the
remaining 68.06% are present towards the distal end (see Table 14).
Reproduced with permission of the copyright owner. Further reproduction prohibited without permission.
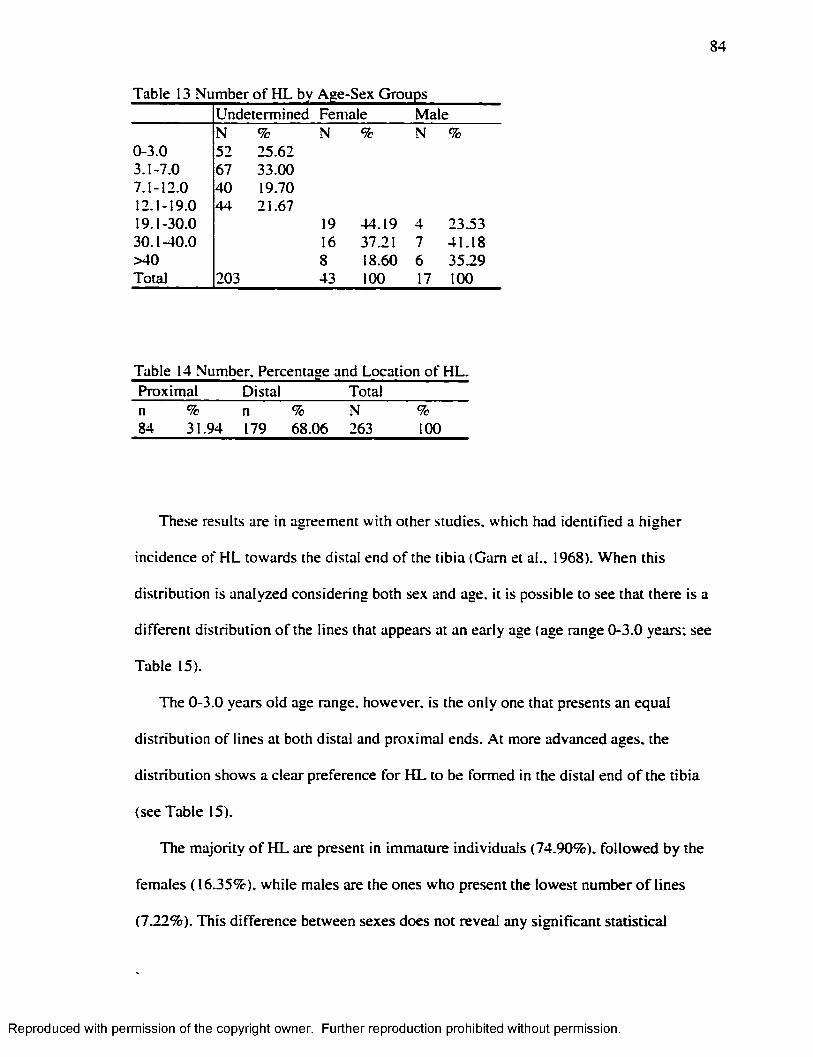
84
Table 13 Number of HL by Age-Sex GroupsUndetermined Female MaleN % N % N %
0-3.0 52 25.623.1-7.0 67 33.007.1-12.0 40 19.7012.1-19.0 44 21.6719.1-30.0 19 44.19 4 23.5330.1-40.0 16 37.21 7 41.18>40 8 18.60 6 35.29Total 203 43 100 17 100
Proximal Distal Totaln % n % N %84 31.94 179 68.06 263 100
These results are in agreement w ith other studies, which had identified a higher
incidence o f H L towards the distal end o f the tib ia (Gam et al., 1968). When this
distribution is analyzed considering both sex and age, it is possible to see that there is a
different distribution o f the lines that appears at an early age (age range 0-3.0 years; see
Table 15).
The 0-3.0 years old age range, however, is the only one that presents an equal
distribution o f lines at both distal and proximal ends. A t more advanced ages, the
distribution shows a clear preference fo r H L to be formed in the distal end o f the tib ia
(see Table 15).
The m ajority o f H L are present in immature individuals (74.90%), fo llowed by the
females ( 16.35%), while males are the ones who present the lowest number o f lines
(7.22%). This difference between sexes does not reveal any significant statistical
Reproduced with permission of the copyright owner. Further reproduction prohibited without permission.
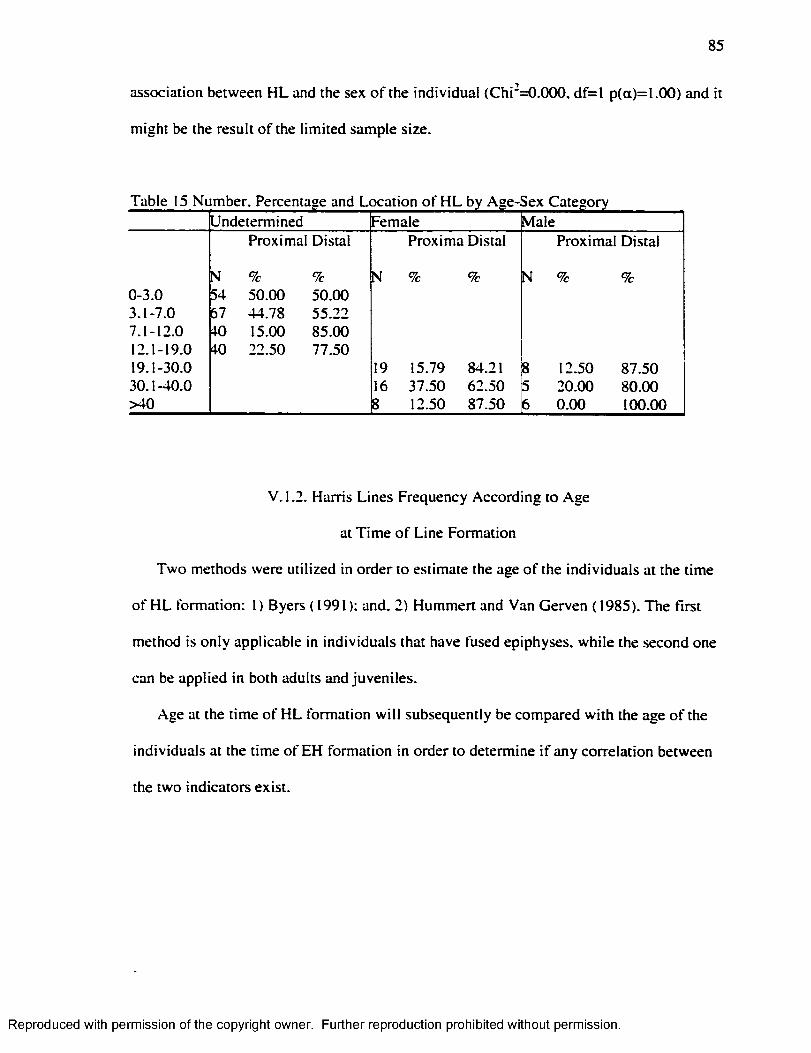
85
association between H L and the sex o f the individual (C h i‘ =0.000, d f= l p(a)=l.OO) and it
m ight be the result o f the lim ited sample size.
Undetermined Female MaleProximal Distal Proxima Distal Proximal Distal
N % % N % % N % %0-3.0 54 50.00 50.003.1-7.0 67 44.78 55.227.1-12.0 40 15.00 85.0012.1-19.0 40 22.50 77.5019.1-30.0 19 15.79 84.21 8 12.50 87.5030.1-40.0 16 37.50 62.50 5 20.00 80.00>40 8 12.50 87.50 6 0.00 100.00
V. 1.2. Harris Lines Frequency According to Age
at T im e o f Line Formation
Tw o methods were utilized in order to estimate the age o f the individuals at the time
o f H L formation: 1 ) Byers (1991): and, 2) Hummert and Van Gerven (1985). The first
method is on ly applicable in individuals that have fused epiphyses, while the second one
can be applied in both adults and juveniles.
Age at the time o f H L formation w ill subsequently be compared w ith the age o f the
individuals at the time o f EH formation in order to determine i f any correlation between
the two indicators exist.
Reproduced with permission of the copyright owner. Further reproduction prohibited without permission.
86
V. 1.2.1. Harris Lines Results:
Byers’ s (1991) Method
The total sample analyzed w ith this method includes males, females, and some
juveniles o f the 12.1-19.0 years old group who presented their epiphyses fused. T h irty -
seven individuals, then, were analyzed w ith this method to determine when the H L
formed. These individuals presented a total o f 81 lines, distal and proximal. Distance to
the closest epiphysis was calculated and then converted into an age o f the individual at
the time o f line formation (see Chapter II fo r an explanation o f the method). F ifty six
(69.14%) o f these lines correspond to female individuals, while 25 (30.86%) correspond
to males.
When all the lines under analysis are considered together, the results show that (see
Table 16) fo r males and females, the age at the tim e o f line formation presents its highest
peak before the first year ( 19.75%) and during adolescence ( 14.81%: see graph 4). W hile
at other ages the incidence o f H L seems more equally dispersed (see graph 3). Before age
1. the individuals, both males (28.00%) and females (16.07%), form the greatest number
o f lines. This trend tends to dim inish towards the age o f 3. and the formation o f the lines
presents a more even, and low , frequency until the age o f 11. A t this point female
individuals present their second peak, while males exhib it this second peak two years
later at the age o f 13 (12.00%: see graph 4).
It is extremely interesting that 37.04% (see table 16) o f the lines were formed before
the age o f three. A number o f studies have shown that there is a common peak age o f
occurrence between the one-to-three years o f age interval in the formation o f H L among
different groups (Clarke and Gindhart, 1981).
Reproduced with permission of the copyright owner. Further reproduction prohibited without permission.
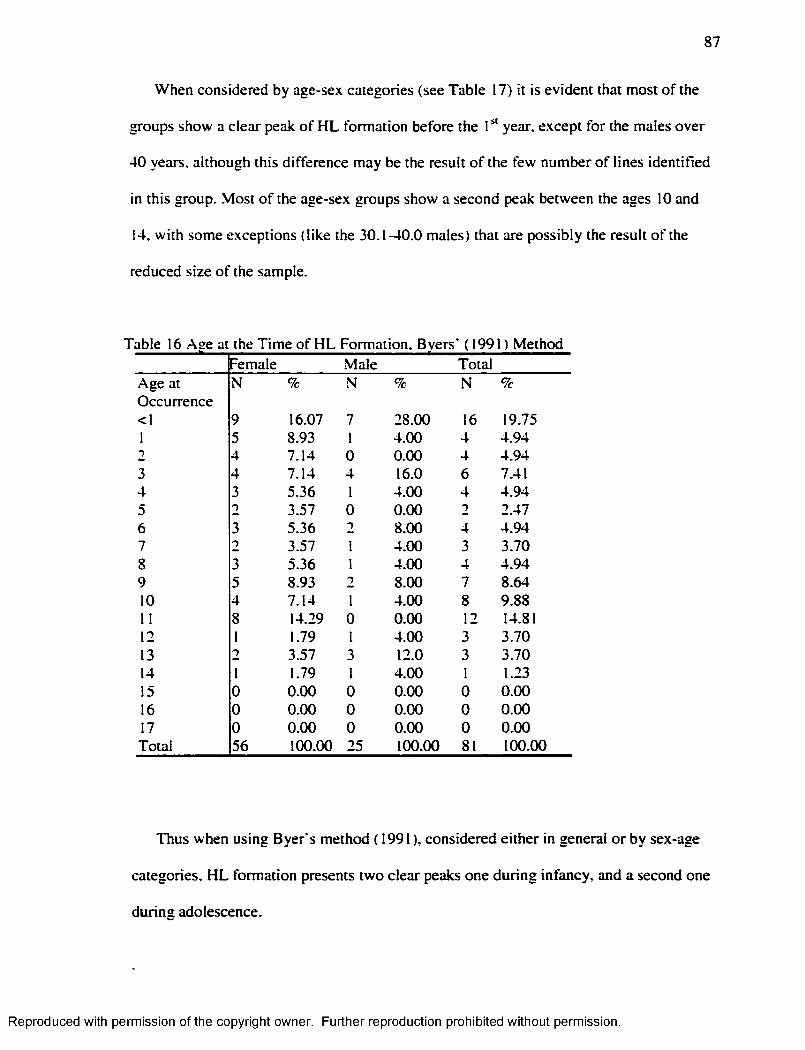
87
When considered by age-sex categories (see Table 17) it is evident that most o f the
groups show a clear peak o f H L formation before the I year, except for the males over
40 years, although this difference may be the result o f the few number o f lines identified
in this group. .Most o f the age-sex groups show a second peak between the ages 10 and
14. w ith some exceptions (like the 30.1-40.0 males) that are possibly the result o f the
reduced size o f the sample.
Table 16 Ase at the Tim e o f H L Formation. Bvers’ (1991) MethodFemale Male Total
Age at Occurrence
N % N % N %
<1 9 16.07 7 28.00 16 19.751 5 8.93 1 4.00 4 4.942 4 7.14 0 0.00 4 4.943 4 7.14 4 16.0 6 7.414 3 5.36 1 4.00 4 4.945 2 3.57 0 0.00 2 2.476 3 5.36 T 8.00 4 4.947 2 3.57 1 4.00 3 3.708 3 5.36 1 4.00 4 4.949 5 8.93 2 8.00 7 8.6410 4 7.14 1 4.00 8 9.8811 8 14.29 0 0.00 12 14.8112 1 1.79 1 4.00 3 3.7013 2 3.57 3 12.0 3 3.7014 1 1.79 1 4.00 1 1.2315 0 0.00 0 0.00 0 0.0016 0 0.00 0 0.00 0 0.0017 0 0.00 0 0.00 0 0.00Total 56 100.00 25 100.00 81 100.00
Thus when using B ye rs method (1991), considered either in general o r by sex-age
categories, H L formation presents two clear peaks one during infancy, and a second one
during adolescence.
Reproduced with permission of the copyright owner. Further reproduction prohibited without permission.
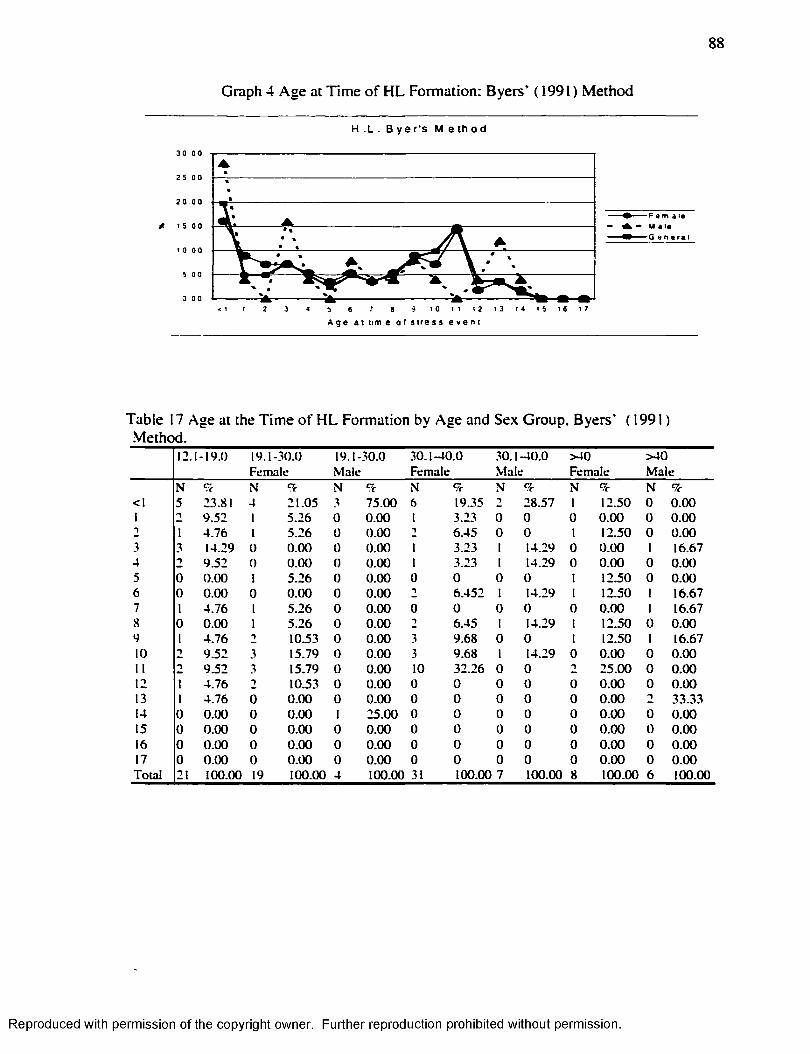
88
Graph 4 Age at T im e o f H L Formation: Byers’ (1991) Method
H . L . B y e r ‘s M e t h o d
3 0 0 0
2 5 0 0
2 0 00
5 0 0
5 t o t t 1 2 1 3 1 4 t S t « t 72 3 5 6 a
. • M a i *
G * n e r a *
A g e a t t i m e o f s t r e s s e v e n t
Table 17 Age at the T im e o f H L Formation by Age and Sex Group. Byers’ (1991 ) Method.
12.1-19.0 19 .1 -30 .0Fem ale
19 .1-30.0M ale
3 0 .1 -4 0 .0Fem ale
30 .1 -4 0 .0M ale
> 40F em ale
> 4 0M ale
N S N T N %- N 9c N 9c N 9c N 9c<1 5 23.81 4 21 .0 5 3 7 5 .0 0 6 19.35 1 2 8 .5 7 1 12.50 0 0 .0 01 n 9 .5 2 1 5 .2 6 0 0 .0 0 1 3.23 0 0 0 0 .0 0 0 0 .0 01 1 4 .7 6 1 5 .2 6 0 0 .0 0 "1 6 .4 5 0 0 1 12 .50 0 0 .0 03 3 14.29 0 0 .0 0 0 0 .0 0 1 3 .23 1 14.29 0 0 .0 0 1 16.674 2 9 .5 2 0 0 .0 0 0 0 .0 0 1 3.23 1 14.29 0 0 .0 0 0 0 .0 05 0 0 .0 0 1 5 .2 6 0 0 .0 0 0 0 0 0 1 12.50 0 0 .0 06 0 0 .0 0 0 0 .0 0 0 0 .0 0 t 6 .4 5 2 1 14.29 1 12.50 1 16.677 1 4 .7 6 1 5 .2 6 0 0 .0 0 0 0 0 0 0 0 .0 0 1 16.678 0 0 .0 0 1 5 .2 6 0 0 .0 0 1 6 .4 5 1 14.29 1 12.50 0 0 .0 09 1 4 .7 6 t 10.53 0 0 .0 0 3 9 .68 0 0 1 12.50 1 16.6710 2 9 .5 2 3 15.79 0 0 .0 0 3 9 .68 1 14.29 0 0 .0 0 0 0 .0 011 9 .5 2 3 15.79 0 0 .0 0 10 32 .26 0 0 ■) 2 5 .0 0 0 0 .0 012 1 4 .7 6 1 10.53 0 0 .0 0 0 0 0 0 0 0 .0 0 0 0 .0 013 1 4 .7 6 0 0 .0 0 0 0 .0 0 0 0 0 0 0 0 .0 0 T 3 3 .3 314 0 0 .0 0 0 0 .0 0 1 2 5 .0 0 0 0 0 0 0 0 .0 0 0 0 .0 015 0 0 .0 0 0 0 .0 0 0 0 .0 0 0 0 0 0 0 0 .0 0 0 0 .0 016 0 0 .0 0 0 0 .0 0 0 0 .0 0 0 0 0 0 0 0 .0 0 0 0 .0 017 0 0 .0 0 0 0 .0 0 0 0 .0 0 0 0 0 0 0 0 .0 0 0 0 .0 0T o ta l 21 100.00 19 100.00 4 100.00 31 100.00 7 100.00 8 100.00 6 100.00
Reproduced with permission of the copyright owner. Further reproduction prohibited without permission.
89
V. 1.2.2. Harris Lines Results: Hummert and
Van Gerven's ( 1985) Method
Hummert and Van Gerven's ( 1985) method was used to obtain H L data from the
younger aged individuals who did not have fused epiphyses. This method was also used
on older individuals, and the results obtained among individuals who presented fused
epiphyses were compared w ith the results obtained w ith the Byers’ (1991) method.
In order to apply Hummert and Van Gerven’s ( 1985) method, two tables o f tibial
growth had to be constructed. These tables o f growth differentiate distal from proximal
growth and. therefore, allow one to estimate the age o f the individual at the time o f line
formation for both distal and proximal HL. Eighty-seven tibias, corresponding to 87
different individuals, ranging between unborn to 19 years o f age were considered (see
Table 18). The diaphyseal length was measured directly from the radiographs.
Follow ing Hummert and Van Gerven’ s ( 1985) recommendation, the two tables fo r
proximal and distal diaphyseal length were constructed (see Table 19 and Table 20). The
sample did not contain any individuals o f 7. 11 or 13 years o f age: those ages were
om itted from the tables 19 and 20.
Because Hummert and Van Gerven’s ( 1985) method is applicable to both juveniles
and adults, all the individuals (N=136: see Table 7) present in the sample, and all the
lines (N=263: see Table 13) identified in them, where analyzed. M ost o f the transverse
lines are present among the juveniles (undetermined sex), fo llowed by females, while the
ones w ith fewest lines are the males (seeTable 21). This difference among males and
females, as already mentioned, is not statistically significant, and m ight be the result o f
the small size o f the sample.
Reproduced with permission of the copyright owner. Further reproduction prohibited without permission.
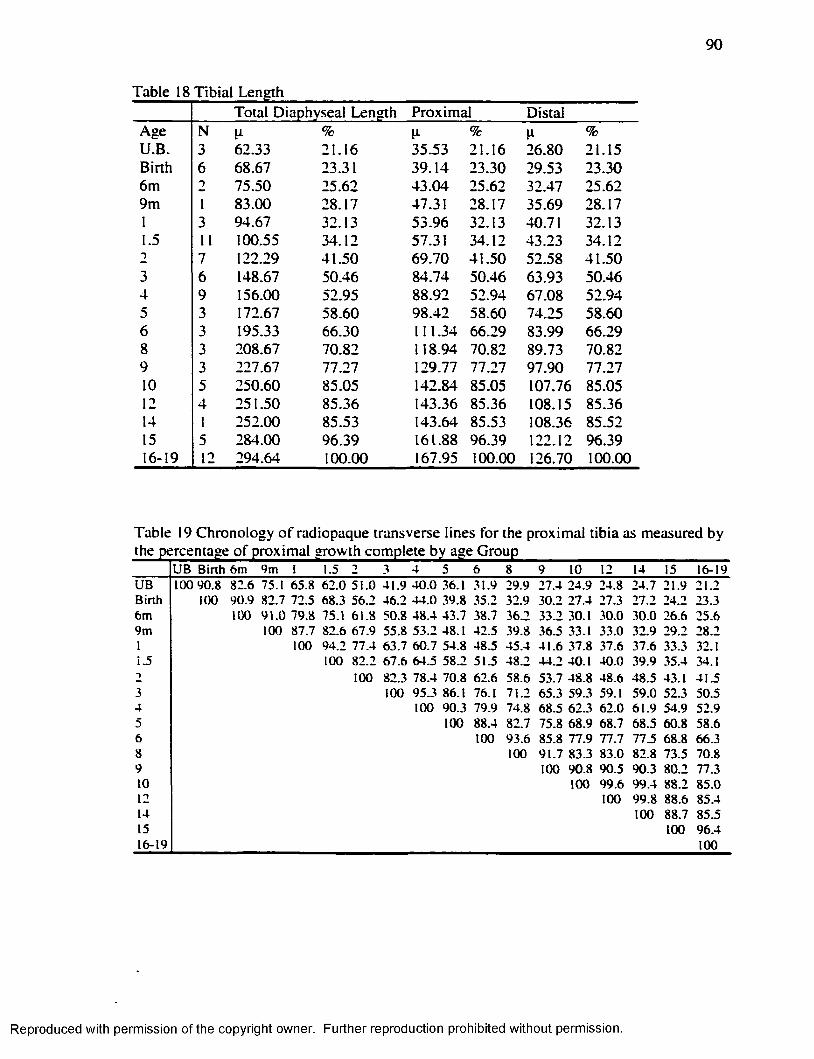
90
Table 18 Tibial LengthTotal Diaphyseal Length Proximal Distal
Age N % 11 % %U.B. 3 62.33 21.16 35.53 21.16 26.80 21.15Birth 6 68.67 23.31 39.14 23.30 29.53 23.306m 2 75.50 25.62 43.04 25.62 32.47 25.629m 1 83.00 28.17 47.31 28.17 35.69 28.171 3 94.67 32.13 53.96 32.13 40.71 32.131.5 11 100.55 34.12 57.31 34.12 43.23 34.122 7 122.29 41.50 69.70 41.50 52.58 41.503 6 148.67 50.46 84.74 50.46 63.93 50.464 9 156.00 52.95 88.92 52.94 67.08 52.945 3 172.67 58.60 98.42 58.60 74.25 58.606 3 195.33 66.30 111.34 66.29 83.99 66.298 3 208.67 70.82 118.94 70.82 89.73 70.829 3 227.67 77.27 129.77 77.27 97.90 77.2710 5 250.60 85.05 142.84 85.05 107.76 85.0512 4 251.50 85.36 143.36 85.36 108.15 85.3614 1 252.00 85.53 143.64 85.53 108.36 85.5215 5 284.00 96.39 161.88 96.39 122.12 96.3916-19 12 294.64 100.00 167.95 100.00 126.70 100.00
Table 19 Chronology o f radiopaque transverse lines for the proximal tib ia as measured by
U B B irth 6m 9m 1 l_5 T 3 4 5 6 8 9 10 12 14 15 16-ISU B ICO 90 .8 82 .6 75.1 65 .8 6 2 .0 5 1 .0 4 1 .9 4 0 .0 .36.1 31.9 29 .9 27 .4 2 4 .9 24 .8 24 .7 21 .9 21 .2B in h 100 9 0 .9 82 .7 72 .5 68 .3 5 6 .2 4 6 .2 4 4 .0 3 9 .8 35 .2 32 .9 30 .2 27 .4 27.3 2 7 .2 24 .2 23 .36m 100 9 1 .0 79 .8 75.1 6 1 .8 50 .8 4 8 .4 43 .7 38.7 36 .2 3 3 .2 30.1 30 .0 3 0 .0 26 .6 25 .69m 100 87 .7 82 .6 6 7 .9 55 .8 5 3 .2 48.1 42 .5 39 .8 36 .5 33.1 33 .0 32 .9 29 .2 28 .21 100 94 .2 77 .4 6 3 .7 6 0 .7 54 .8 4 8 .5 4 5 .4 4 1 .6 37 .8 37 .6 3 7 .6 33 .3 32.1i .5 100 8 2 .2 6 7 .6 6 4 .5 58_2 51.5 4 8 .2 4 4 .2 40.1 4 0 .0 39 .9 35 .4 34.1t 100 82.3 7 8 .4 70 .8 62 .6 5 8 .6 5 3 .7 4 8 .8 4 8 .6 4 8 .5 43.1 4 1 .53 100 9 5 .3 86.1 76.1 71 .2 65 .3 59 .3 59.1 5 9 .0 52 .3 50 .54 100 90 .3 79 .9 74 .8 68 .5 6 2 .3 62 .0 6 1 .9 54 .9 5 2 .95 100 88 .4 82 .7 75 .8 6 8 .9 68 .7 6 8 .5 60 .8 58 .66 100 9 3 .6 85 .8 7 7 .9 77 .7 77_5 68 .8 66 .38 100 9 1 .7 83 .3 83 .0 82 .8 73 .5 70 .89 100 9 0 .8 90 .5 9 0 .3 8 0 .2 77.310 100 9 9 .6 9 9 .4 88 .2 8 5 .012 100 9 9 .8 88 .6 85 .414 100 88 .7 85 .515 100 9 6 .416-19 100
Reproduced with permission of the copyright owner. Further reproduction prohibited without permission.
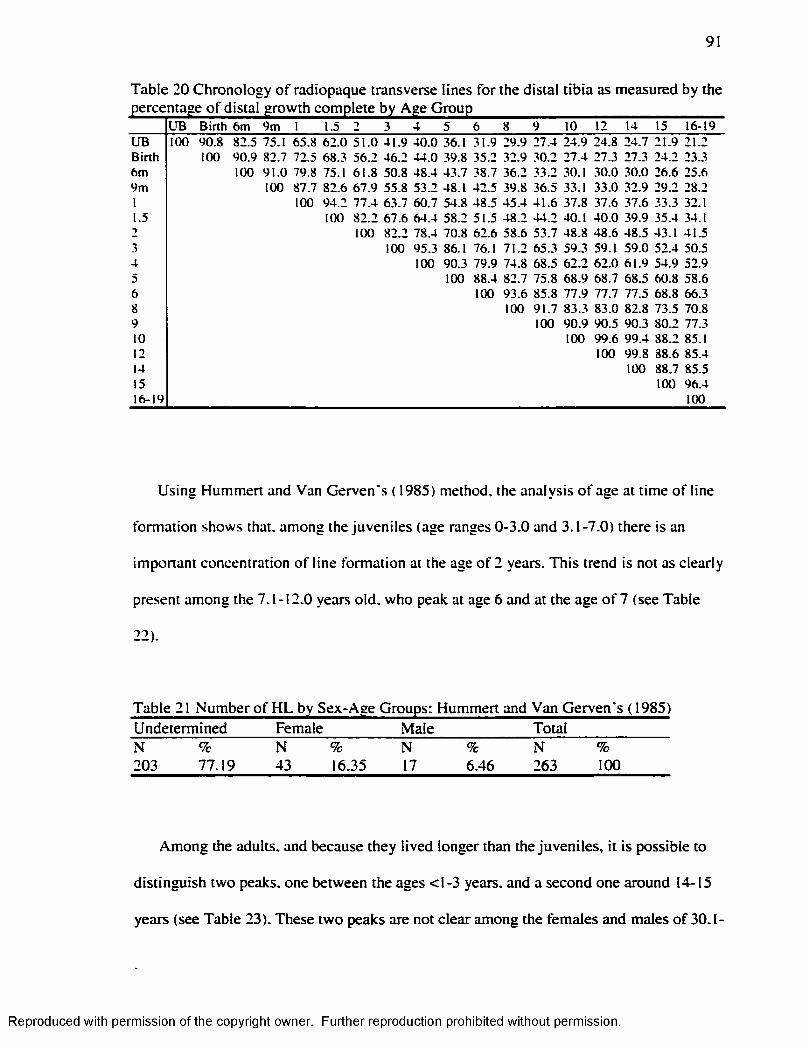
91
Table 20 Chronology of radiopaque transverse lines for the distal tibia as measured by the
U B B irth 6m 9m 1 1.5 3 4 5 6 8 9 10 12 14 15 16-19U B 100 9 0 .8 82_3 75.1 65 .8 6 2 .0 5 1 .0 4 1 .9 4 0 .0 36.1 31 .9 29 .9 27 .4 24 .9 24 .8 2 4 .7 21 .9 21 .2B in h 100 9 0 .9 82 .7 72.5 68 .3 5 6 .2 4 6 .2 4 4 .0 .39.8 3 5 .2 32 .9 3 0 .2 2 7 .4 27 .3 27 .3 24 .2 23.36 m 100 9 1 .0 79.8 75.1 6 1 .8 50 .8 4 8 .4 43 .7 38.7 36 .2 33 .2 30.1 3 0 .0 30 .0 26 .6 25.69 m 100 87.7 8 2 .6 6 7 .9 55 .8 5 3 .2 48.1 42 .5 39 .8 36 .5 33.1 33 .0 32 .9 29 .2 28 .21 100 9 4 .2 7 7 .4 6 3 .7 6 0 .7 54 .8 48 .5 4 5 .4 4 1 .6 3 7 .8 37 .6 37 .6 33.3 32.11.5 100 8 2 .2 6 7 .6 6 4 .4 58 .2 51 .5 4 8 .2 4 4 .2 40.1 4 0 .0 39 .9 35 .4 34.12 100 8 2 .2 78 .4 70 .8 62 .6 5 8 .6 5 3 .7 4 8 .8 4 8 .6 4 8 .5 43.1 41 .53 100 95 .3 86.1 76.1 71 .2 65 .3 59 .3 59.1 5 9 .0 5 2 .4 50 .54 100 90.3 79 .9 74 .8 6 8 .5 6 2 .2 6 2 .0 6 1 .9 54 .9 52 .95 100 88.4 82 .7 75 .8 6 8 .9 68 .7 68 .5 60 .8 58 .66 100 9 3 .6 85 .8 7 7 .9 77 .7 77 .5 68 .8 66.38 100 9 1 .7 83 .3 8 3 .0 82 .8 73 .5 70.89 100 9 0 .9 9 0 .5 90 .3 80 .2 77.310 100 9 9 .6 9 9 .4 88 .2 85.112 100 9 9 .8 8 8 .6 85 .414 100 88 .7 85 .515 100 96 .416-19 100
Using Hummert and Van Gerven's ( 1985) method, the analysis o f age at time o f line
formation shows that, among the juveniles (age ranges 0-3.0 and 3.1-7.0) there is an
important concentration o f line formation at the age o f 2 years. This trend is not as clearly
present among the 7.1-12.0 years o ld. who peak at age 6 and at the age o f 7 (see Table
22).
Undetermined Female Male TotalN % N % N % N %203 77.19 43 16.35 17 6.46 263 100
Among the adults, and because they lived longer than the juveniles, it is possible to
distinguish two peaks, one between the ages <1-3 years, and a second one around 14-15
years (see Table 23). These two peaks are not clear among the females and males o f 30.1-
Reproduced with permission of the copyright owner. Further reproduction prohibited without permission.
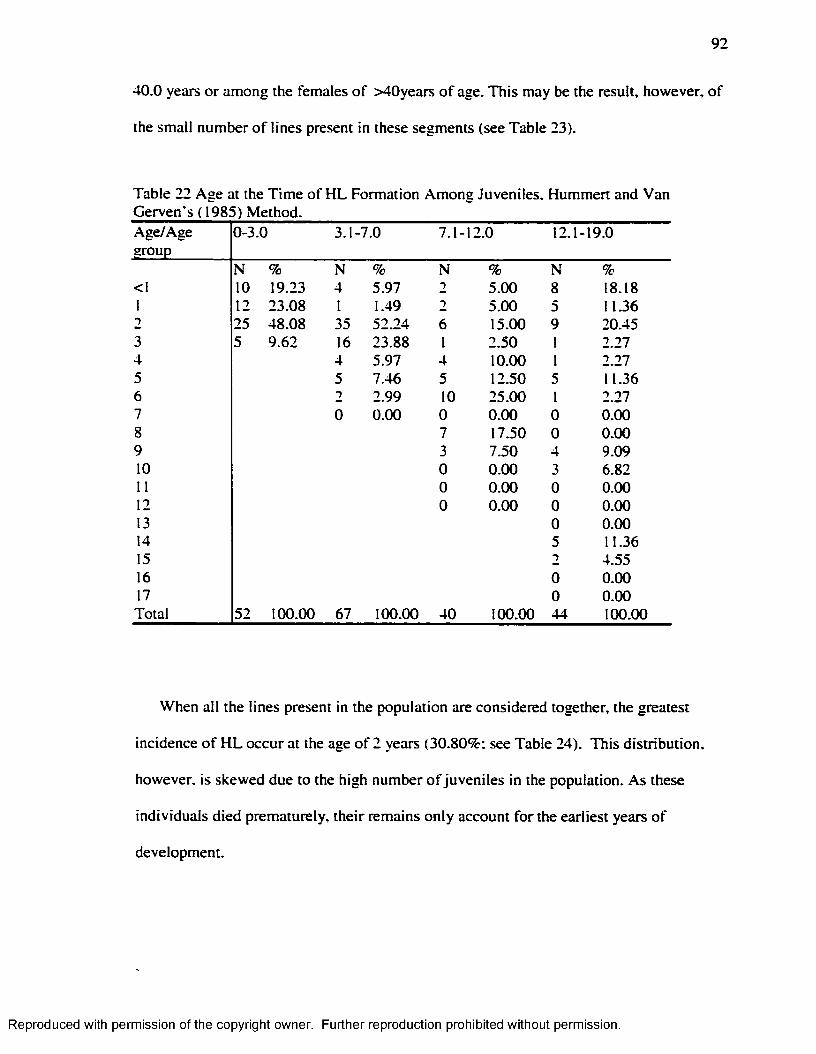
92
40.0 years o r among the females o f >40years o f age. This may be the result, however, o f
the small number o f lines present in these segments (see Table 23).
Table 22 Age at the T im e o f H L Formation Among Juveniles. Hummert and Van Gerven's ( 1985) Method.Age/Agegroup
0-3.0 3.1-7.0 7.1- 12.0 12.1 -19.0
N % N % N % N %<1 10 19.23 4 5.97 2 5.00 8 18.181 12 23.08 I 1.49 2 5.00 5 11.362 25 48.08 35 52.24 6 15.00 9 20.453 5 9.62 16 23.88 1 2.50 1 2.274 4 5.97 4 10.00 1 2.275 5 7.46 5 12.50 5 11.366 2 2.99 10 25.00 1 2.277 0 0.00 0 0.00 0 0.008 7 17.50 0 0.009 3 7.50 4 9.0910 0 0.00 3 6.8211 0 0.00 0 0.0012 0 0.00 0 0.0013 0 0.0014 5 11.3615 2 4.5516 0 0.0017 0 0.00Total 52 100.00 67 100.00 40 100.00 44 100.00
When all the lines present in the population are considered together, the greatest
incidence o f H L occur at the age o f 2 years (30.80%; see Table 24). This d istribution,
however, is skewed due to the high number o f juveniles in the population. As these
individuals died prematurely, their remains only account fo r the earliest years o f
development.
Reproduced with permission of the copyright owner. Further reproduction prohibited without permission.
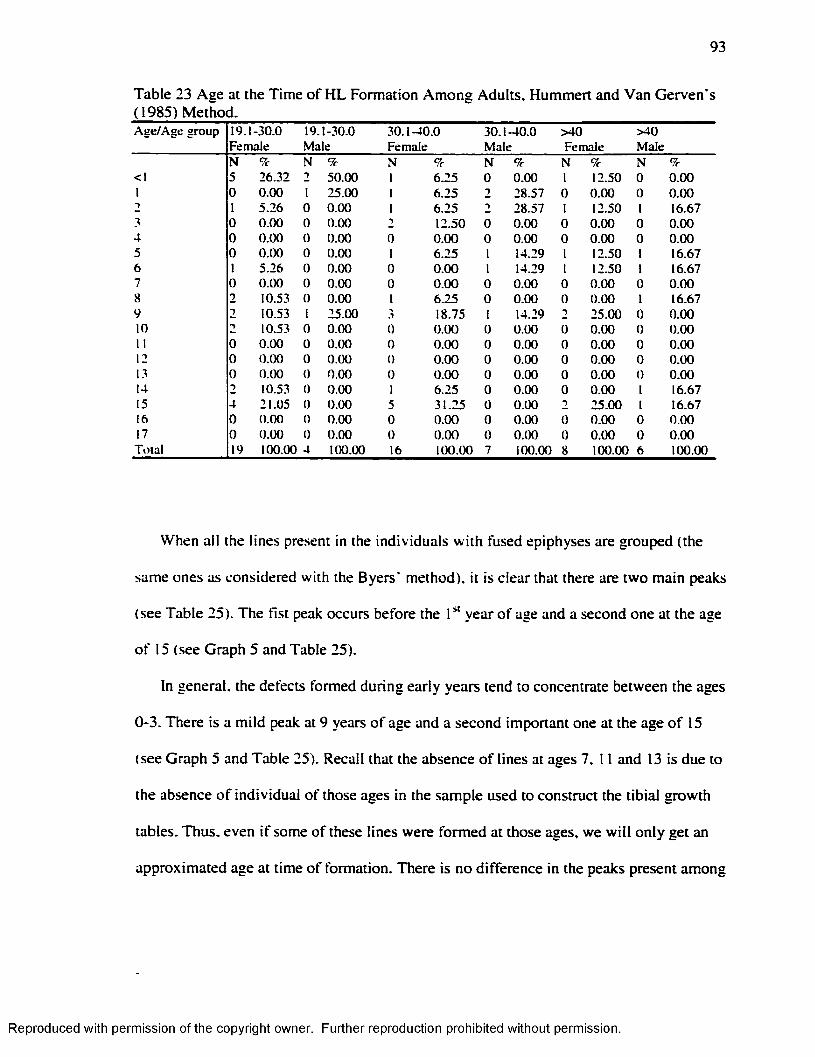
93
Table 23 Age at the Time o f H L Formation Am ong Adults, Hummert and Van Gerven’s ( 1985) Method.A g e /A g e g ro u p 19 . 1-3 0 .0
F em ale19 . 1-30 .0 M ale
3 0 .1 -4 0 .0F em ale
3 0 .1 -4 0 .0M ale
> 4 0F em ale
> 4 0M ale
N 9c N 9c N 9c N 9c N 9c N 9c< I 5 26 .32 T 5 0 .0 0 I 6 .2 5 0 0 .0 0 I 12.50 0 0 .0 0I 0 0 .0 0 I 25 .00 I 6 .2 5 2 2 8 .57 0 0 .0 0 0 0 .0 0■) I 5 .2 6 0 0 .0 0 I 6 .2 5 2 8 .57 I 12.50 I 16.673 0 0 .0 0 0 0 .0 0 2 12.50 0 0 .0 0 0 0 .0 0 0 0 .0 04 0 0 .0 0 0 0 .0 0 0 0 .0 0 0 0 .0 0 0 0 .0 0 0 0 .0 05 0 0 .0 0 0 0 .0 0 I 6 .2 5 I 14.29 I 12.50 I 16.676 I 5 .26 0 0 .0 0 0 0 .0 0 I 14.29 I 12.50 I 16.677 0 0 .0 0 0 0 .0 0 0 0 .0 0 0 0 .0 0 0 0 .0 0 0 0 .0 08 2 10.53 0 0 .0 0 I 6 .2 5 0 0 .0 0 0 0 .0 0 I 16.679 2 10.53 I 25 .00 3 18.75 I 14.29 ■> 25 .00 0 0 .0 010 -) 10.53 0 0 .0 0 0 0 .0 0 0 0 .0 0 0 0 .0 0 0 0 .0 0II 0 0 .0 0 0 0 .0 0 0 0 .0 0 0 0 .0 0 0 0 .0 0 0 0 .0 012 0 0 .0 0 0 0 .0 0 0 0 .0 0 0 0 .0 0 0 0 .0 0 0 0 .0 013 0 0 .0 0 0 0 .0 0 0 0 .0 0 0 0 .0 0 0 0 .0 0 0 0 .0 014 2 10.53 0 0 .0 0 I 6 .2 5 0 0 .0 0 0 0 .0 0 I 16.6715 4 21 .05 0 0 .0 0 5 3 1 .2 5 0 0 .0 0 2 2 5 .0 0 I 16.6716 0 0 .0 0 0 0 .0 0 0 0 .0 0 0 0 .0 0 0 0 .0 0 0 0 .0 017 0 0 .0 0 0 0 .0 0 0 0 .0 0 0 0 .0 0 0 0 .0 0 0 0 .0 0T o ta l 19 100.00 4 100.00 16 100.00 7 100.00 8 100.00 6 100.00
When all the lines present in the individuals w ith fused epiphyses are grouped (the
same ones as considered w ith the Byers’ method), it is clear that there are two main peaks
(see Table 25). The fist peak occurs before the year o f age and a second one at the age
o f 15 (see Graph 5 and Table 25).
In general, the defects formed during early years tend to concentrate between the ages
0-3. There is a m ild peak at 9 years o f age and a second important one at the age o f 15
(see Graph 5 and Table 25). Recall that the absence o f lines at ages 7. 11 and 13 is due to
the absence o f individual o f those ages in the sample used to construct the tib ia l growth
tables. Thus, even i f some o f these lines were formed at those ages, we w ill on ly get an
approximated age at time o f formation. There is no difference in the peaks present among
Reproduced with permission of the copyright owner. Further reproduction prohibited without permission.
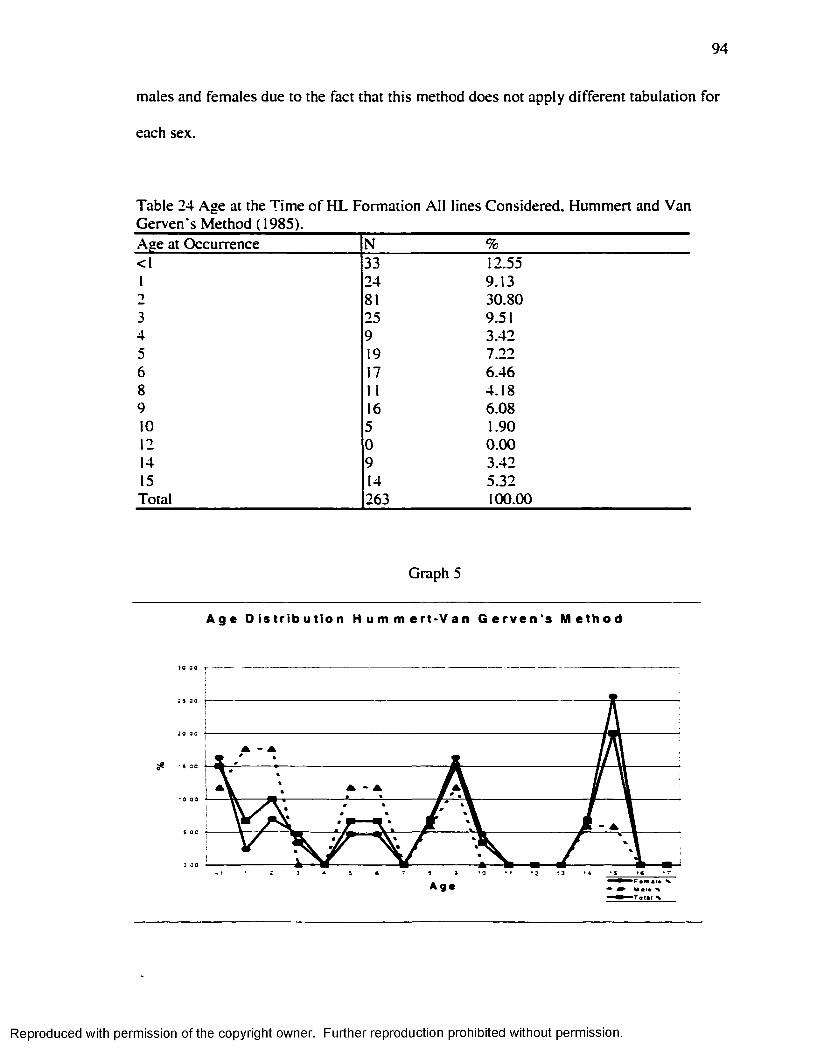
94
males and females due to the fact that this method does not apply different tabulation fo r
each sex.
Table 24 Age at the Time o f H L Formation A ll lines Considered, Hummert and Van Gerven's Method ( 1985).Age at Occurrence N %<1 33 12.551 24 9.132 81 30.803 25 9.514 9 3.425 19 7.226 17 6.468 11 4.189 16 6.0810 5 1.9012 0 0.0014 9 3.4215 14 5.32Total 263 100.00
Graph 5
A g e D i s t r i b u t i o n H u m m e r t * V a n G e r v e n ' s M e t h o d
▲
A g e
Reproduced with permission of the copyright owner. Further reproduction prohibited without permission.
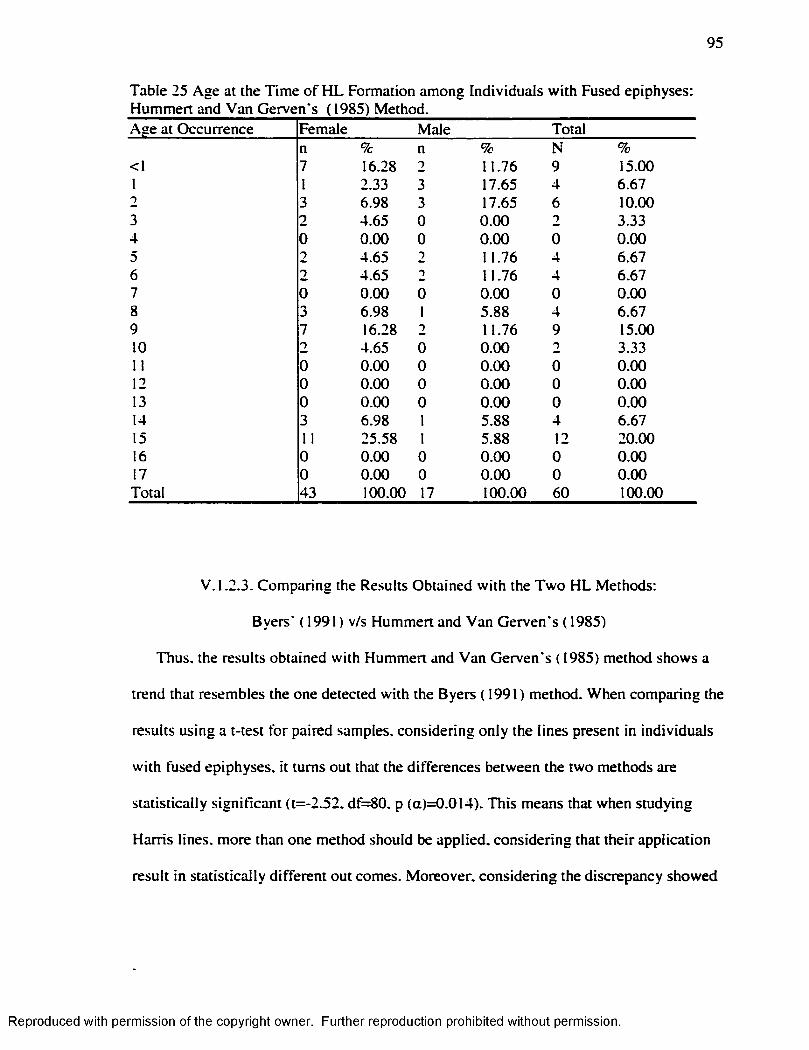
95
Table 25 Age at the T im e o f H L Formation among Individuals w ith Fused epiphyses: Hummert and Van Gerven's (1985) Method.Age at Occurrence Female Male Total
n % n % N %<1 7 16.28 2 11.76 9 15.001 I 2.33 3 17.65 4 6.672 3 6.98 3 17.65 6 10.003 2 4.65 0 0.00 2 3.334 0 0.00 0 0.00 0 0.005 2 4.65 2 11.76 4 6.676 2 4.65 2 11.76 4 6.677 0 0.00 0 0.00 0 0.008 3 6.98 1 5.88 4 6.679 7 16.28 2 11.76 9 15.0010 2 4.65 0 0.00 2 3.3311 0 0.00 0 0.00 0 0.0012 0 0.00 0 0.00 0 0.0013 0 0.00 0 0.00 0 0.0014 3 6.98 1 5.88 4 6.6715 11 25.58 1 5.88 12 20.0016 0 0.00 0 0.00 0 0.0017 0 0.00 0 0.00 0 0.00Total 43 100.00 17 100.00 60 100.00
V. 1.2.3. Comparing the Results Obtained w ith the Tw o H L Methods:
Byers' ( 1991) v/s Hummert and Van Gerven's ( 1985)
Thus, the results obtained w ith Hummert and Van Gerven's ( 1985) method shows a
trend that resembles the one detected w ith the Byers (1991) method. When comparing the
results using a t-test fo r paired samples, considering only the lines present in individuals
w ith fused epiphyses, it turns out that the differences between the two methods are
statistically significant (t=-2.52. df=80. p (a)=0.014). This means that when studying
Harris lines, more than one method should be applied, considering that their application
result in statistically d ifferent out comes. Moreover, considering the discrepancy showed
Reproduced with permission of the copyright owner. Further reproduction prohibited without permission.
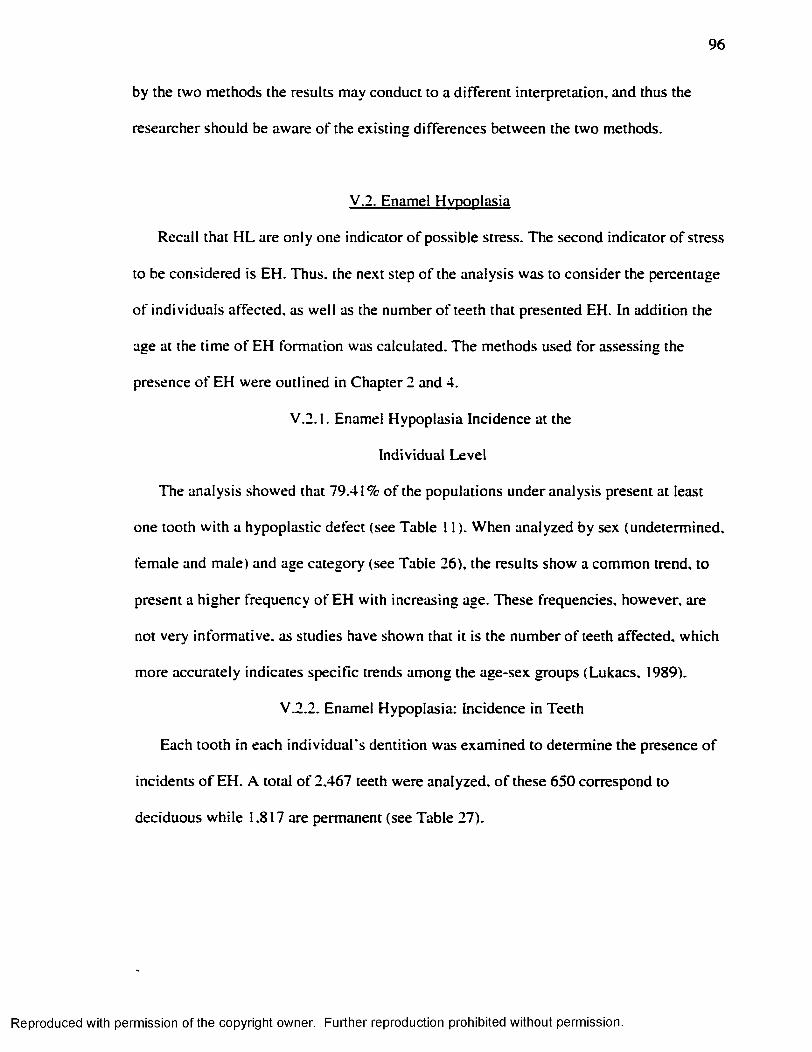
96
by the two methods the results may conduct to a d ifferent interpretation, and thus the
researcher should be aware o f the existing differences between the two methods.
V.2. Enamel Hypoplasia
Recall that H L are only one indicator o f possible stress. The second indicator o f stress
to be considered is EH. Thus, the next step o f the analysis was to consider the percentage
o f individuals affected, as well as the number o f teeth that presented EH. In addition the
age at the time o f EH formation was calculated. The methods used for assessing the
presence o f EH were outlined in Chapter 2 and 4.
V .2 .1. Enamel Hypoplasia Incidence at the
Individual Level
The analysis showed that 79.41% o f the populations under analysis present at least
one tooth w ith a hypoplastic defect (see Table 11 ). When analyzed by sex (undetermined,
female and male) and age category (see Table 26), the results show a common trend, to
present a higher frequency o f EH w ith increasing age. These frequencies, however, are
not very inform ative, as studies have shown that it is the number o f teeth affected, which
more accurately indicates specific trends among the age-sex groups (Lukacs. 1989).
V.2.2. Enamel Hypoplasia: Incidence in Teeth
Each tooth in each ind iv idua l’ s dentition was examined to determine the presence o f
incidents o f EH. A total o f 2.467 teeth were analyzed, o f these 650 correspond to
deciduous while 1.817 are permanent (see Table 27).
Reproduced with permission of the copyright owner. Further reproduction prohibited without permission.
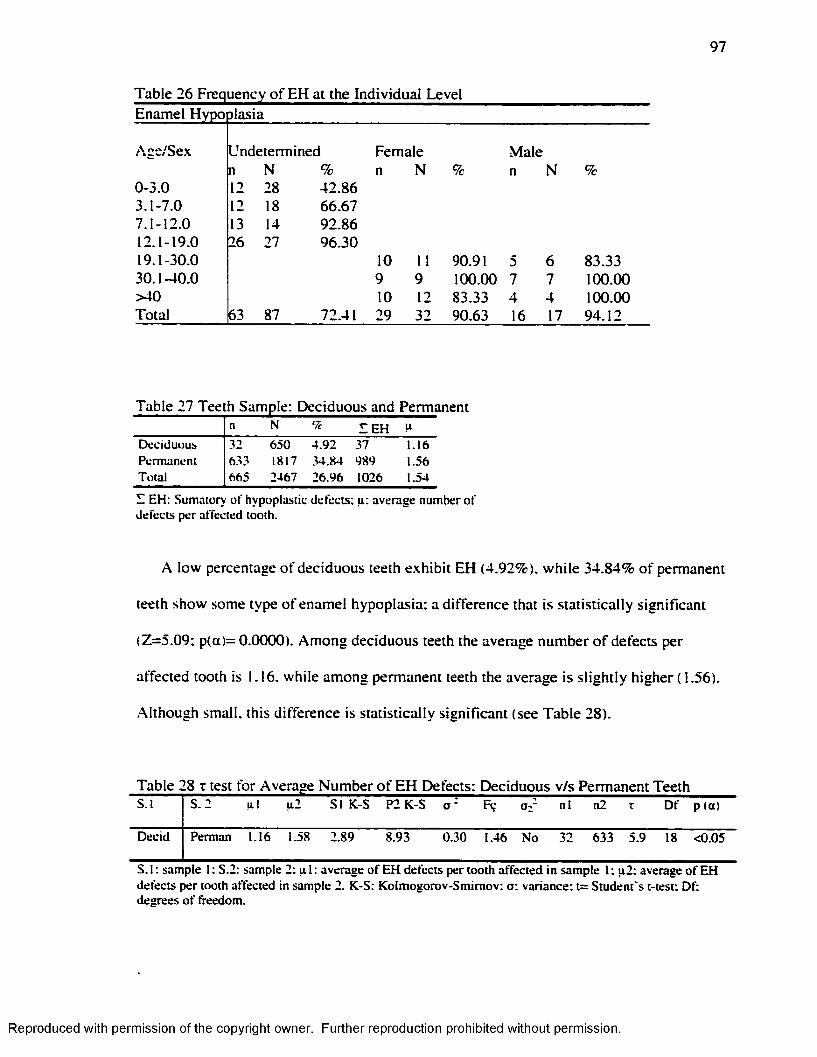
97
Table 26 Frequency of EH at the Individual LevelEnamel Hypo piasia
Age/Sex
0-3.03 .1-7.07.1-12.012.1-19.019.1-30.030.1-40.0 >40 Total
Undeterminedn N %12 28 42.8612 18 66.6713 14 92.8626 27 96.30
63 87
Female n N %
Male n N %
10 11 90.91 5 6 83.339 9 100.00 7 7 100.0010 12 83.33 4 4 100.0029 32 90.63 16 17 94.12
Table 27 Teeth Sample: Deciduous and Permanentn N <7c E E H u
D ec id u o u s 32 6 50 4 .9 2 37 1 .16P erm an en t 633 1817 .34.84 989 1.56T o ta l 665 2467 2 6 .9 6 1026 1.54
E E H : S u m ato ry o f hy p o p las tic d e fe c ts ; u : av e ra g e n u m b er o f d e fe c ts p e r a ffec ted too th .
A low percentage o f deciduous teeth exhibit EH (4.92%). w h ile 34.84% o f permanent
teeth show some type o f enamel hypoplasia: a difference that is statistically significant
(Z=5.09: p(a)= 0.0000). Among deciduous teeth the average number o f defects per
affected tooth is 1.16. while among permanent teeth the average is s ligh tly higher (1.56).
A lthough small, this difference is statistically significant (see Table 28).
Table 28 z test fo r Average Number o f EH Defects: Deciduous v/s Permanent TeethS .l 5 . 2 u l u 2 S I K-S P2 K -S o • Fç Oz n l n2 T D f p (a )
D ecid P erm an 1.16 1.58 2 .89 8 .93 0 .3 0 1.46 N o 32 6 3 3 5 .9 18 < 0 .05
S . I : sam p le I : S .2 : sam p le 2: u 1 : av e ra g e o f E H d e fe c ts p e r to o th a ffe c te d in sa m p le I ; u 2 : av e rag e o f E H d e fe c ts p e r too th a ffec ted in sam p le 2. K -S: K o lm o g o ro v -S m im o v : o r v a ria n c e ; t= S tu d e n t 's t- te s t: D f: d e g re e s o f freedom .
Reproduced with permission of the copyright owner. Further reproduction prohibited without permission.
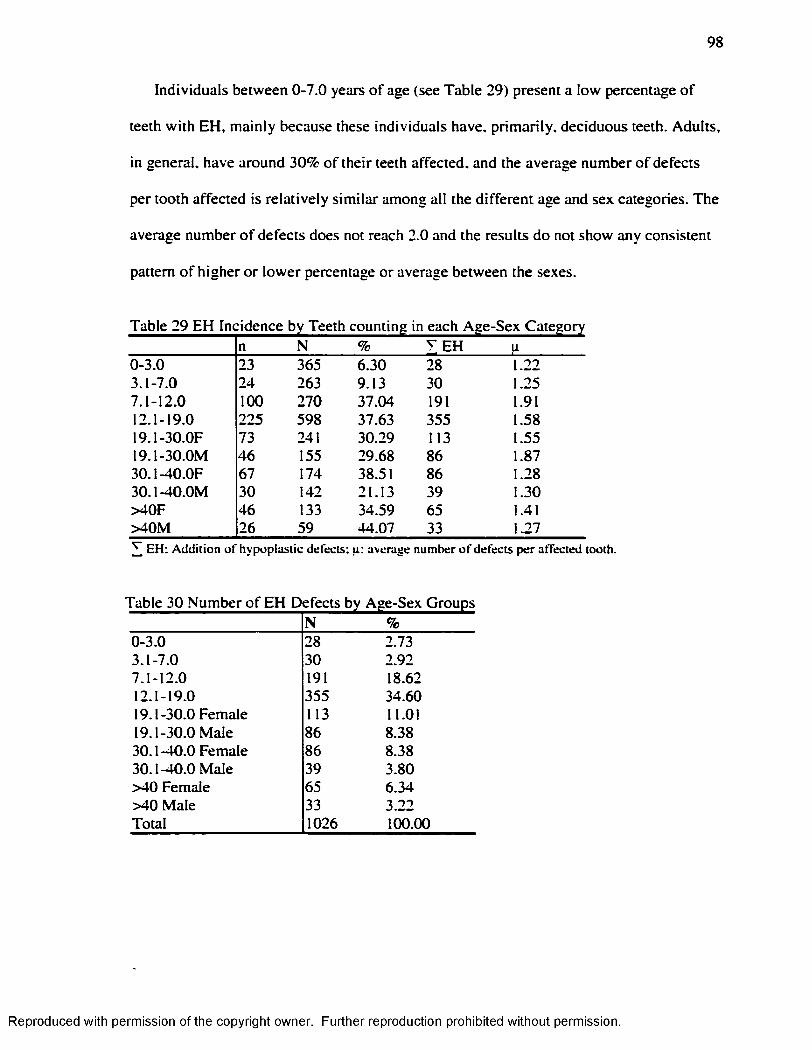
98
Individuals between 0-7.0 years o f age (see Table 29) present a low percentage o f
teeth w ith EH, m ainly because these individuals have, prim arily, deciduous teeth. Adults,
in general, have around 30% o f their teeth affected, and the average number o f defects
per tooth affected is re lative ly s im ilar among all the d ifferent age and sex categories. The
average number o f defects does not reach 2.0 and the results do not show any consistent
pattern o f higher o r low er percentage or average between the sexes.
n N— ...... g
% T E H li0-3.0 23 365 6.30 28 1.223.1-7.0 24 263 9.13 30 1.257.1-12.0 100 270 37.04 191 1.9112.1-19.0 225 598 37.63 355 1.5819.1-30.0F 73 241 30.29 113 1.5519.1-30.0M 46 155 29.68 86 1.8730.1-40.0F 67 174 38.51 86 1.2830.1-40.0M 30 142 21.13 39 1.30>40F 46 133 34.59 65 1.41>40M 26 59 44.07 33 1.27^ E H : A d d itio n o f h y p o p la s tic d e fec ts ; u : av e rag e n u m b e r o f d e fe c ts p e r a ffec ted too th .
Table 30 Number o f EH Defects by Age-Sex GroupsN %
0-3.0 28 2.733.1-7.0 30 2.927.1-12.0 191 18.6212.1-19.0 355 34.6019.1-30.0 Female 113 11.0119.1-30.0 Male 86 8.3830.1-40.0 Female 86 8.3830.1-40.0 Male 39 3.80>40 Female 65 6.34>40 Male 33 3.22Total 1026 100.00
Reproduced with permission of the copyright owner. Further reproduction prohibited without permission.
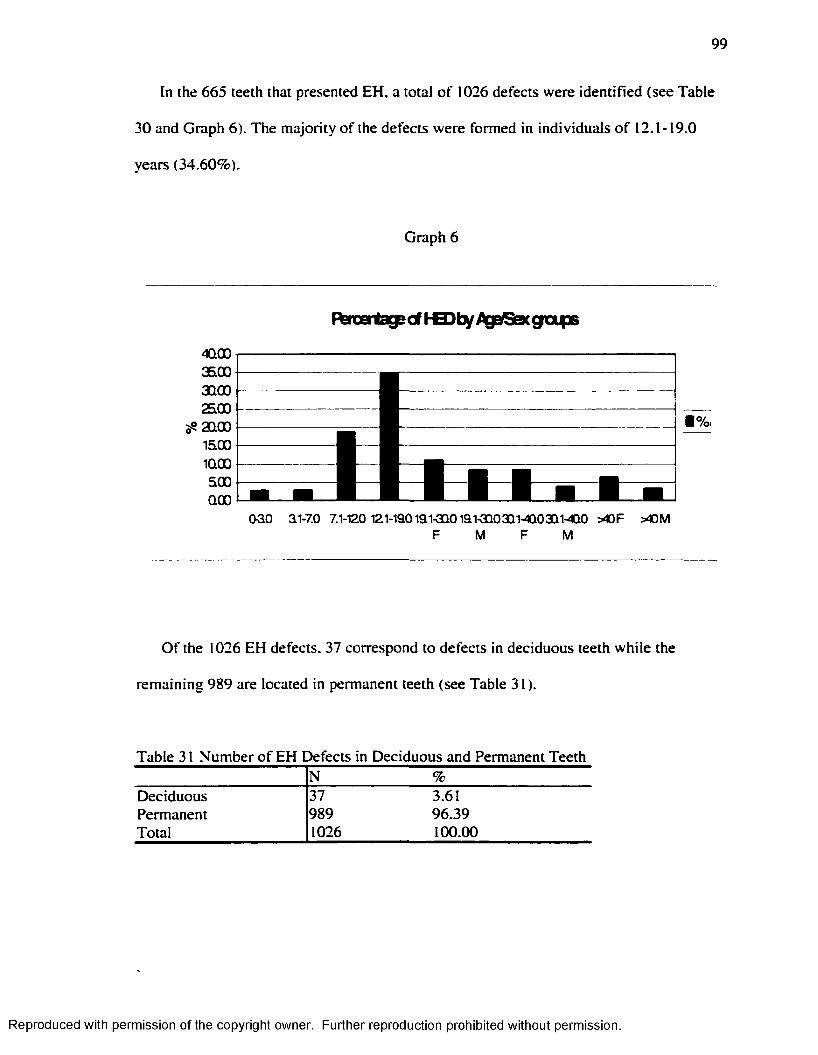
99
In the 665 teeth that presented EH, a total o f 1026 defects were identified (see Table
30 and Graph 6). The m ajority o f the defects were formed in individuals o f 12.1-19.0
years (34.60%).
Graph 6
F^rcatagecf KB)ty AgalSexgafB
4QOO360030002500200015001QOO500OOO
■ %
oao ai-7.o 7.1-120 i2i-iaoiai-aQoiai-aQ03Qi-cio3Qi-4QO > « f > « mM M
O f the 1026 EH defects. 37 correspond to defects in deciduous teeth while the
remaining 989 are located in permanent teeth (see Table 31).
Table 31 Number o f EH Defects in Deciduous and Permanent TeethN %
Deciduous 37 3.61Permanent 989 96.39Total 1026 100.00
Reproduced with permission of the copyright owner. Further reproduction prohibited without permission.
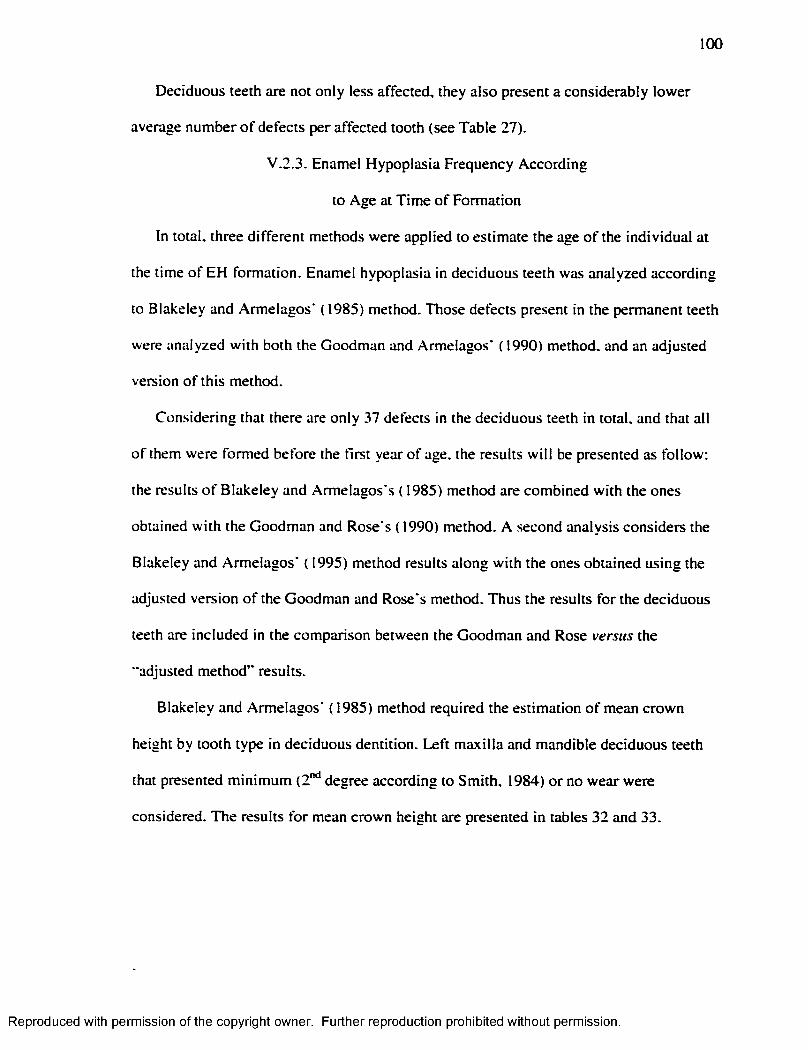
100
Deciduous teeth are not only less affected, they also present a considerably lower
average number o f defects per affected tooth (see Table 27).
V.2.3. Enamel Hypoplasia Frequency According
to Age at Time o f Formation
In total, three different methods were applied to estimate the age o f the individual at
the time o f EH formation. Enamel hypoplasia in deciduous teeth was analyzed according
to Blakeley and Armelagos* ( 1985) method. Those defects present in the permanent teeth
were analyzed w ith both the Goodman and Armelagos* ( 1990) method, and an adjusted
version o f this method.
Considering that there are only 37 defects in the deciduous teeth in total, and that all
o f them were formed before the first year o f age, the results w ill be presented as fo llow :
the results o f Blakeley and Armelagos's ( 1985) method are combined w ith the ones
obtained w ith the Goodman and Rose’s ( 1990) method. A second analysis considers the
Blakeley and Armelagos* ( 1995) method results along w ith the ones obtained using the
adjusted version o f the Goodman and Rose’ s method. Thus the results for the deciduous
teeth are included in the comparison between the Goodman and Rose versus the
’’adjusted method” results.
Blakeley and Armelagos’ ( 1985) method required the estimation o f mean crown
height by tooth type in deciduous dentition. Left m axilla and mandible deciduous teeth
that presented m inim um (2"* ̂degree according to Smith, 1984) o r no wear were
considered. The results fo r mean crown height are presented in tables 32 and 33.
Reproduced with permission of the copyright owner. Further reproduction prohibited without permission.
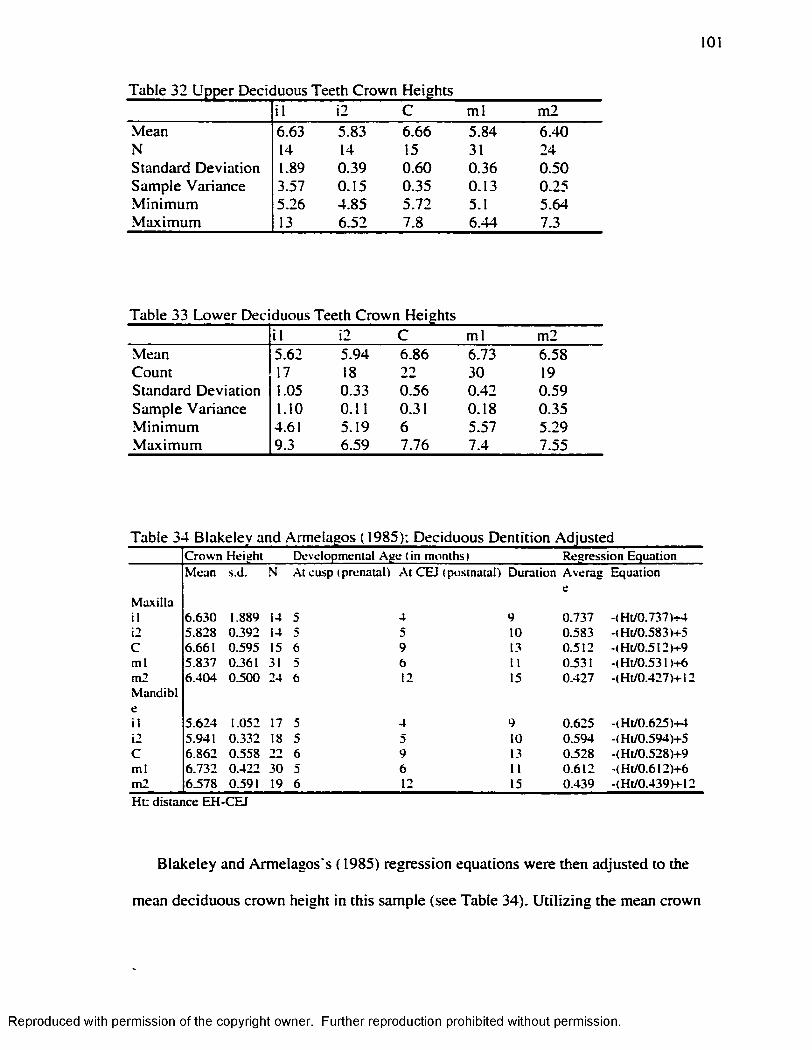
101
Table 32 Upper Deciduous Teeth Crown Heightsi l i2 C m l m2
Mean 6.63 5.83 6.66 5.84 6.40N 14 14 15 31 24Standard Deviation 1.89 0.39 0.60 0.36 0.50Sample Variance 3.57 0.15 0.35 0.13 0.25M in im um 5.26 4.85 5.72 5.1 5.64M axim um 13 6.52 7.8 6.44 7.3
Table 33 Low er Deciduous Teeth Crown Heightsi l i2 C m l m2
Mean 5.62 5.94 6.86 6.73 6.58Count 17 18 22 30 19Standard Deviation 1.05 0.33 0.56 0.42 0.59Sample Variance 1.10 0.11 0.31 0.18 0.35M in im um 4.61 5.19 6 5.57 5.29M axim um 9.3 6.59 7.76 7.4 7.55
Table 34 Blakeley and Armelagos ( 1985): Deciduous Dentition AdjustedC ro w n H eigh t D eve lopm en ta l A g e (in m o n th s) R eg re ss io n E q u a tio nM ean s.d . N .At cu sp ( p ren a ta l) A t C E I ( p o s tn a ta l) D u ra tion A v erag E q u a tio n
M ax illail 6 .6 3 0 1.889 14 5 4 9 0 .7 3 7 -< H t/0 .737)+4i2 5 .8 2 8 0 .3 9 2 14 5 5 10 0 .5 8 3 -(H t/0 .5 8 3 )+ 5C 6 .661 0 .5 9 5 15 6 9 13 0 .5 1 2 4 H t/0 .5 12)4-9m l 5 .8 3 7 0.361 31 5 6 11 0.531 - (H t/0 .5 3 1)4-6m 2M an d ib I
6 .4 0 4 0 .5 0 0 24 6 12 15 0 .4 2 7 -(H t/0 .427)4-12
cil 5 .6 2 4 1.052 17 5 4 9 0 .6 2 5 -(H t/0 .6 2 5 )4 -fi2 5 .941 0 .3 3 2 18 5 5 10 0 .5 9 4 -(H t/0 J9 4 )4 -5C 6 .8 6 2 0 .5 5 8 22 6 9 13 0J528 -(H t/0 .528)4-9m l 6 .7 3 2 0 .4 2 2 30 5 6 11 0 .6 1 2 - (H t/0 .6 12)4-6m 2 6 .5 7 8 0.591 19 6 12 15 0 .4 3 9 -(H t/0 .439)4 -12
H t: d is ta n c e E H -C E J
Blakeley and Armelagos's ( 1985) regression equations were then adjusted to the
mean deciduous crown height in this sample (see Table 34). U tiliz in g the mean crown
Reproduced with permission of the copyright owner. Further reproduction prohibited without permission.
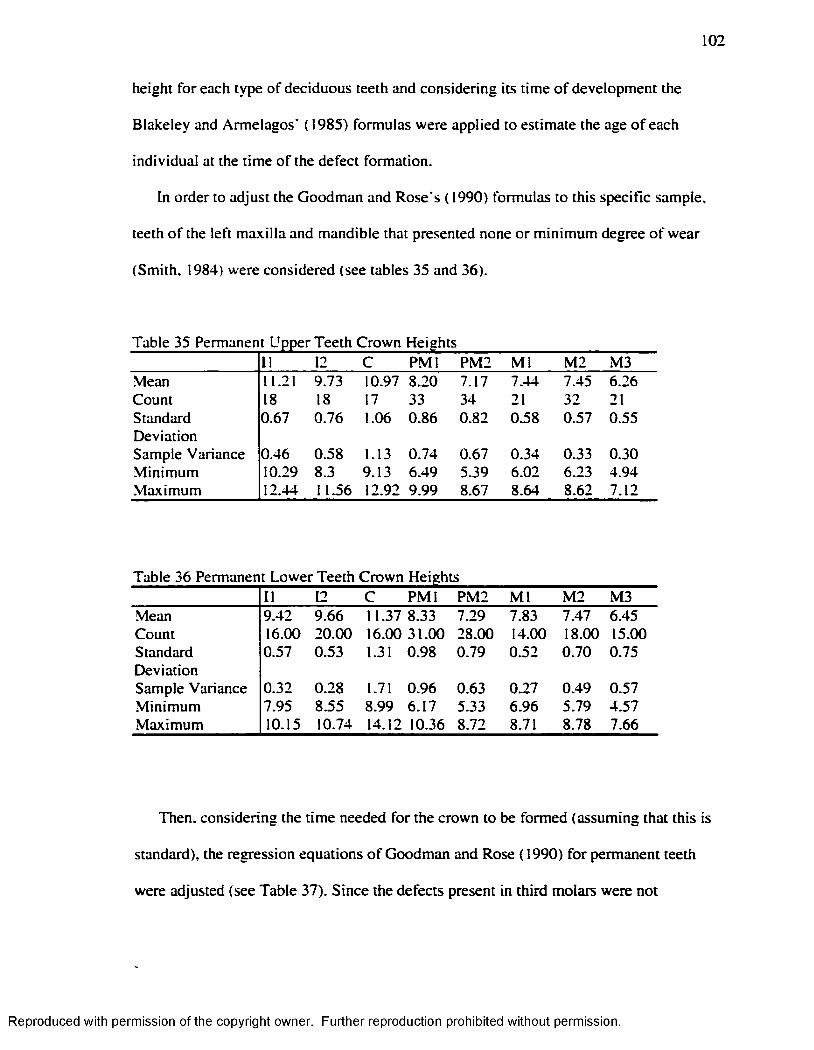
102
height fo r each type o f deciduous teeth and considering its time o f development the
Blakeley and Armelagos* ( 1985) formulas were applied to estimate the age o f each
individual at the time o f the defect formation.
In order to adjust the Goodman and Rose's (1990) formulas to this specific sample,
teeth o f the left m axilla and mandible that presented none or m inim um degree o f wear
(Smith. 1984) were considered (see tables 35 and 36).
Table 35 Permanent Upper Teeth Crown Heights11 12 C P M l PM2 M l M2 M3
•Mean 11.21 9.73 10.97 8.20 7.17 7.44 7.45 6.26Count 18 18 17 33 34 21 32 21Standard 0.67 0.76 1.06 0.86 0.82 0.58 0.57 0.55DeviationSample Variance 0.46 0.58 1.13 0.74 0.67 0.34 0.33 0.30.Minimum 10.29 8.3 9.13 6.49 5.39 6.02 6.23 4.94M axim um 12.44 11.56 12.92 9.99 8.67 8.64 8.62 7.12
Table 36 Permanent Lower Teeth Crown Heights11 12 C P M l PM2 M l M 2 M3
.Mean 9.42 9.66 11.37 8.33 7.29 7.83 7.47 6.45Count 16.00 20.00 16.00 31.00 28.00 14.00 18.00 15.00Standard 0.57 0.53 1.31 0.98 0.79 0.52 0.70 0.75DeviationSample Variance 0.32 0.28 1.71 0.96 0.63 0.27 0.49 0.57M inim um 7.95 8.55 8.99 6.17 5.33 6.96 5.79 4.57M aximum 10.15 10.74 14.12 10.36 8.72 8.71 8.78 7.66
Then, considering the time needed fo r the crown to be formed (assuming that this is
standard), the regression equations o f Goodman and Rose (1990) fo r permanent teeth
were adjusted (see Table 37). Since the defects present in th ird molars were not
Reproduced with permission of the copyright owner. Further reproduction prohibited without permission.
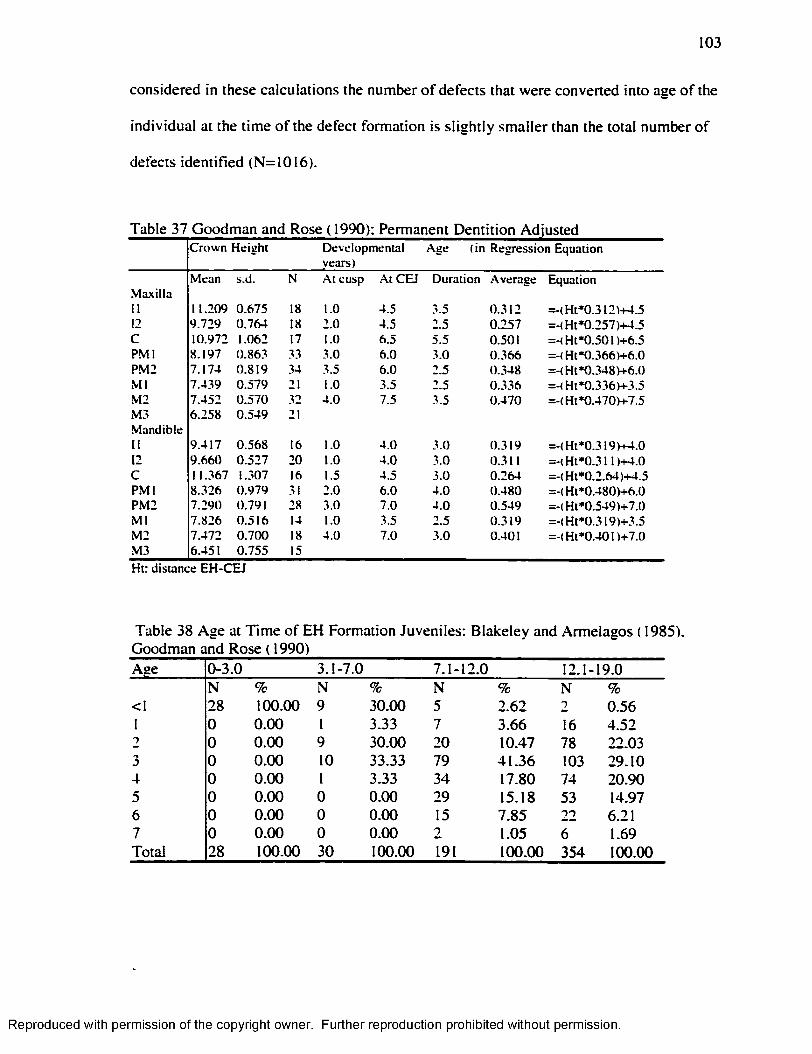
103
considered in these calculations the number o f defects that were converted into age o f the
individual at the time o f the defect formation is s ligh tly smaller than the total number o f
defects identified (N=1016).
Table 37 Goodman and Rose ( 1990); Permanent Dentition AdjustedC ro w n H e ig h t D ev e lopm en ta l
years)A ge ( in R eg ress io n E quation
M ean s.d . N A t cusp .At C E I D u ra tio n A v erag e E quationM axilla11 11.209 0 .6 7 5 18 1.0 4.5 3.5 0 .3 1 2 = -(H t* 0 .3 1 2 )+ 4 .512 9 .7 2 9 0 .7 6 4 18 2 .0 4 .5 2.5 0 .2 5 7 = -(H t* 0 .2 5 7 )+ 4 .5C 10.972 1.062 17 1.0 6 .5 5.5 0.501 =-<H t*0 .501)+6 .5P M l 8 .1 9 7 0 .8 6 3 33 3 .0 6 .0 3 .0 0 .3 6 6 = -(H t* 0 .3 6 6 )+ 6 .0PM 2 7 .1 7 4 0 .8 1 9 34 3.5 6 .0 2.5 0 .3 4 8 = -(H t* 0 .3 4 8 )+ 6 .0M l 7 .4 3 9 0 .5 7 9 21 1.0 3.5 2.5 0 .3 3 6 = -(H t* 0 .3 3 6 )+ 3 .5M 2 7 .4 5 2 0 .5 7 0 32 4 .0 7.5 .3.5 0 .4 7 0 = -(H t* 0 .4 7 0 )+ 7 .5M 3 6 .2 5 8 0 .5 4 9 21M and ib le11 9 .4 1 7 0 .5 6 8 16 1.0 4 .0 3 .0 0 .3 1 9 = -(H t* 0 .3 1 9 )+ 4 .012 9 .6 6 0 0 .5 2 7 20 1.0 4 .0 3.0 0.311 =-(H t*0 .31 D + 4 .0C 11.367 1.307 16 1.5 4 .5 3.0 0 .2 6 4 = -(H t* 0 .2 .6 4 )+ 4 .5P M l 8 .3 2 6 0 .9 7 9 31 2.0 6 .0 4 .0 0 .4 8 0 = -(H t* 0 .4 8 0 )+ 6 .0PM 2 7 .2 9 0 0.791 28 3.0 7.0 4 .0 0 .5 4 9 = -(H t* 0 .5 4 9 )+ 7 .0M l 7 .8 2 6 0 .5 1 6 14 1.0 3.5 2.5 0 .3 1 9 = -(H t* 0 .3 1 9 )+ 3 .5M 2 7 .4 7 2 0 .7 0 0 18 4 .0 7 .0 3 .0 0.401 = -(H t* 0 .4 0 1 )+ 7 .0M 3 6.451 0 .7 5 5 15
Ht: d is tan ce E H -C E J
Table 38 Age at T im e o f EH Formation Juveniles: B lakeley and Armelagos ( 1985), Goodman and Rose ( 1990)Age 0-3.0 3.1-7.0 7.1-12.0 12.1- 19.0
N % N % N % N %<1 28 100.00 9 30.00 5 2.62 2 0.561 0 0.00 1 3.33 7 3.66 16 4.522 0 0.00 9 30.00 20 10.47 78 22.033 0 0.00 10 33.33 79 41.36 103 29.104 0 0.00 1 3.33 34 17.80 74 20.905 0 0.00 0 0.00 29 15.18 53 14.976 0 0.00 0 0.00 15 7.85 22 6.217 0 0.00 0 0.00 2 1.05 6 1.69Total 28 100.00 30 100.00 191 100.00 354 100.00
Reproduced with permission of the copyright owner. Further reproduction prohibited without permission.
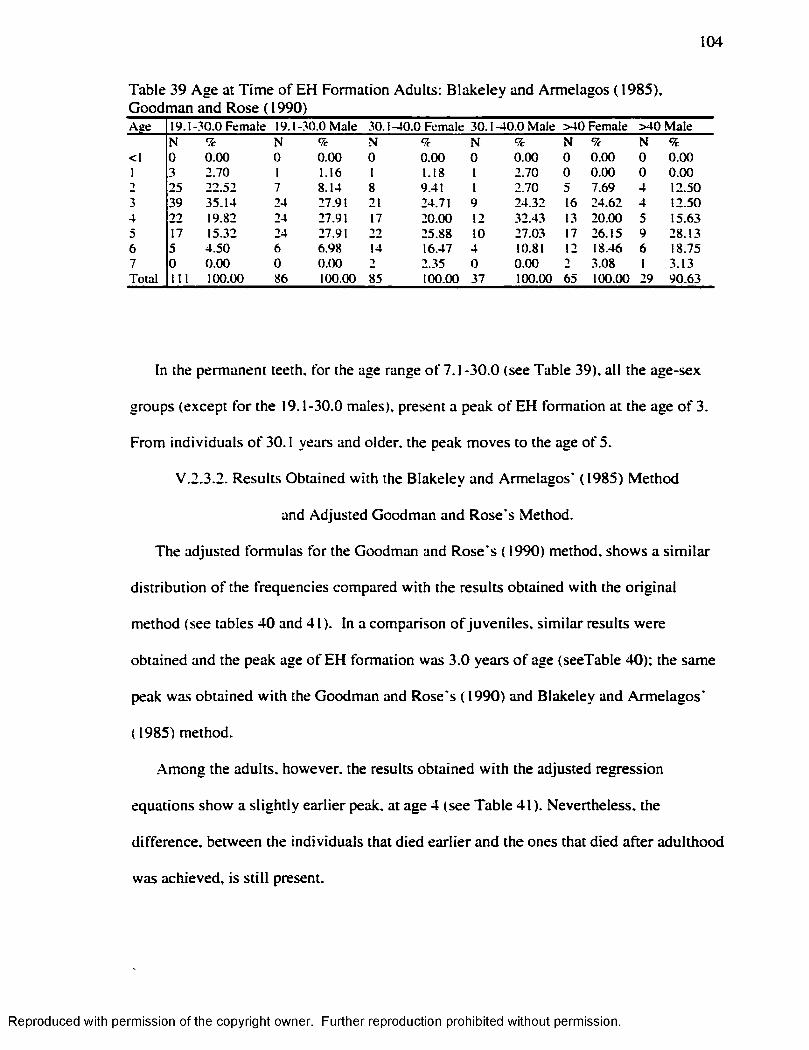
104
Table 39 Age at T im e o f EH Formation Adults: B lakeley and Armelagos (1985), Goodman and Rose ( 1990) _________A ge 19.1 -3 0 .0 F em a le 19.1 -3 0 .0 M ale 30.1 -4 0 .0 F em ale 30 .1 -4 0 .0 M ale > 4 0 F em ale > 4 0 M ale
N % N % N 9c N 9c N 9c N 9c<1 0 0 .0 0 0 0 .0 0 0 0 .0 0 0 0 .0 0 0 0 .0 0 0 0 .0 0I 3 2 .7 0 1 1.16 1 1.18 1 2 .70 0 0 .0 0 0 0 .0 02 25 2 2 .5 2 7 8 .14 8 9.41 1 2 .70 5 7.69 4 12 .503 39 3 5 .1 4 24 27.91 21 24.71 9 2 4 .3 2 16 2 4 .6 2 4 12 .504 2 2 19.82 24 27.91 17 2 0 .0 0 12 32 .43 13 2 0 .0 0 5 15 .635 17 15.32 24 27.91 22 25 .88 10 27 .03 17 2 6 .15 9 2 8 .1 36 5 4 .5 0 6 6 .98 14 16.47 4 10.81 12 18.46 6 18.757 0 0 .0 0 0 0 .0 0 •) 2 .35 0 0 .0 0 1 3 .08 1 3 .13T o ta l I I I 100.00 86 100.00 85 100.00 37 100.00 65 100.00 29 9 0 .6 3
In the permanent teeth, for the age range o f 7.1-30.0 (see Table 39), all the age-sex
groups (except fo r the 19.1-30.0 males), present a peak o f EH formation at the age o f 3.
From individuals o f 30.1 years and older, the peak moves to the age o f 5.
V .2.3.2. Results Obtained w ith the Blakeley and Armelagos* (1985) Method
and Adjusted Goodman and Rose s Method.
The adjusted formulas for the Goodman and Rose s ( 1990) method, shows a s im ila r
d istribution o f the frequencies compared w ith the results obtained w ith the original
method (see tables 40 and 41). In a comparison o f juveniles, s im ilar results were
obtained and the peak age o f EH formation was 3.0 years o f age (seeTable 40); the same
peak was obtained w ith the Goodman and Rose s (1990) and Blakeley and Armelagos*
( 1985) method.
Among the adults, however, the results obtained w ith the adjusted regression
equations show a slightly earlier peak, at age 4 (see Table 41). Nevertheless, the
difference, between the individuals that died earlier and the ones that died after adulthood
was achieved, is s t ill present.
Reproduced with permission of the copyright owner. Further reproduction prohibited without permission.
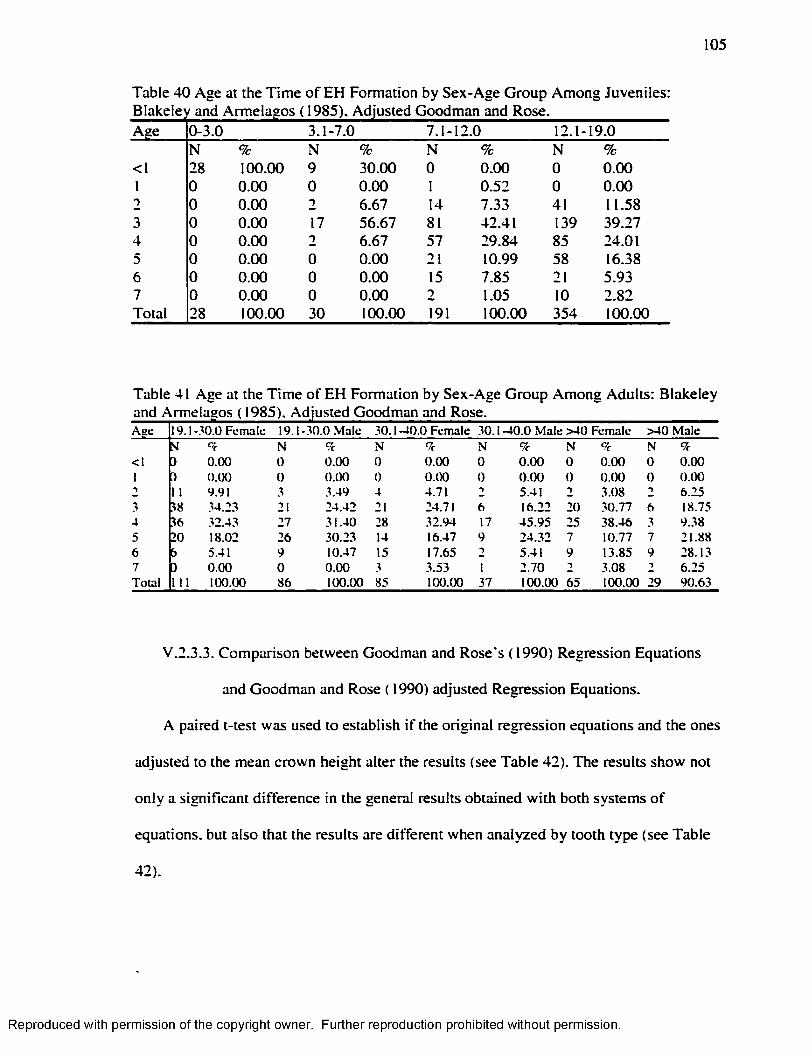
105
Table 40 Age at the Time of EH Formation by Sex-Age Group Among Juveniles:
Age 0-3.0 3.1-7.0 7.1- 12.0 12.1- 19.0N % N % N % N %
<1 28 100.00 9 30.00 0 0.00 0 0.001 0 0.00 0 0.00 1 0.52 0 0.002 0 0.00 2 6.67 14 7.33 41 11.583 0 0.00 17 56.67 81 42.41 139 39.274 0 0.00 2 6.67 57 29.84 85 24.015 0 0.00 0 0.00 21 10.99 58 16.386 0 0.00 0 0.00 15 7.85 21 5.937 0 0.00 0 0.00 2 1.05 10 2.82Total 28 100.00 30 100.00 191 100.00 354 100.00
Table 41 Age at the T im e o f EH Formation by Sex-Age Group Among Adults: Blakeley
A ge 19.1 -30 .0 F em ale 19 .1 -30 .0 M ale 30.1 -4 0 .0 F em ale 30.1 -4 0 .0 M ale > 4 0 F em ale > 4 0 M aleSI N 9c N 9c N 9c N 9c N 9c
< I ) 0 .0 0 0 0 .0 0 0 0 .0 0 0 0 .0 0 0 0 .0 0 0 0 .0 01 ] 0 .0 0 0 0 .0 0 0 0 .0 0 0 0 .0 0 0 0 .0 0 0 0 .0 0
1 1 9.91 3 3 .49 4 4.71 ■) 5.41 -> 3 .08 •> 6 .253 38 34 .23 21 2 4 .4 2 21 24.71 6 16.22 20 .30.77 6 18.754 36 32 .43 27 3 1 .4 0 28 3 2 .9 4 17 4 5 .9 5 25 3 8 .4 6 3 9 .385 20 18.02 26 30 .23 14 16.47 9 2 4 .3 2 7 10.77 7 21 .886 5 5.41 9 10.47 15 17.65 2 5.41 9 13.85 9 28 .137 D 0 .0 0 0 0 .0 0 3 3.53 1 2 .7 0 -) 3 .08 -) 6 .2 5T o ta l 111 100.00 86 100.00 85 100.00 37 100 .00 65 100.00 29 9 0 .6 3
V.2.3.3. Comparison between Goodman and Rose's (1990) Regression Equations
and Goodman and Rose ( 1990) adjusted Regression Equations.
A paired t-test was used to establish i f the orig inal regression equations and the ones
adjusted to the mean crown height alter the results (see Table 42). The results show not
on ly a significant difference in the general results obtained w ith both systems o f
equations, but also that the results are different when analyzed by tooth type (see Table
42).
Reproduced with permission of the copyright owner. Further reproduction prohibited without permission.
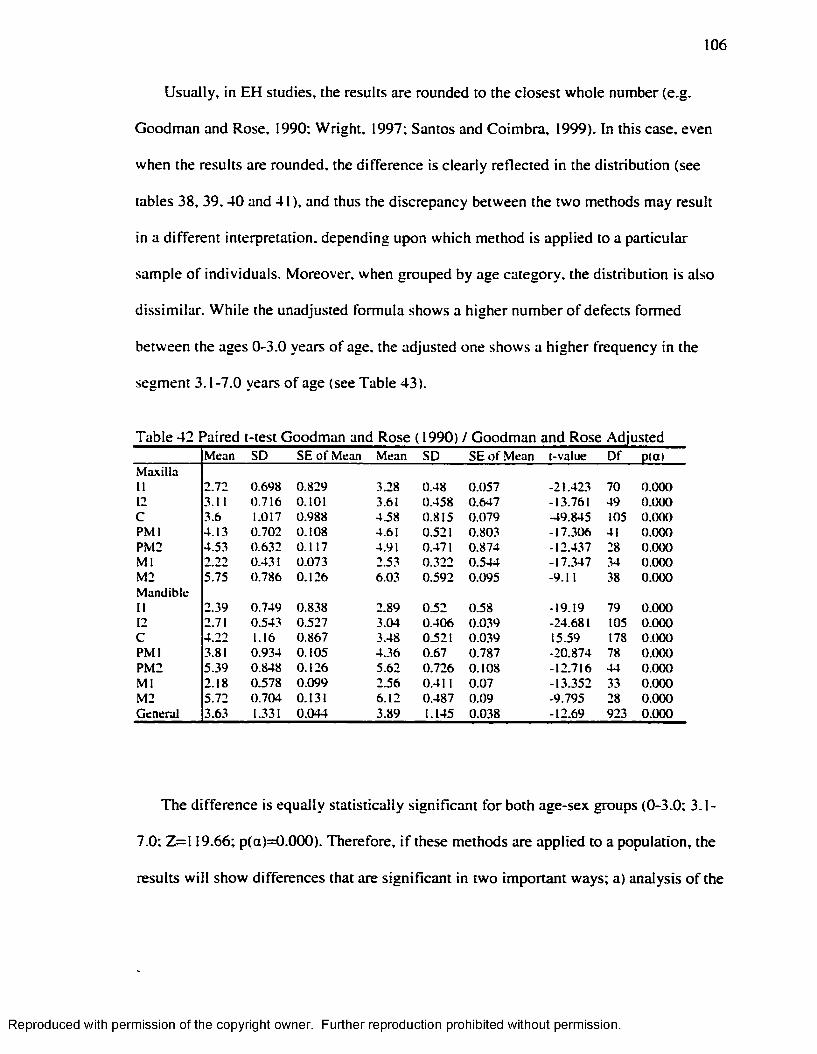
106
Usually, in EH studies, the results are rounded to the closest whole number (e.g.
Goodman and Rose, 1990; W right, 1997; Santos and Coimbra, 1999). In this case, even
when the results are rounded, the difference is clearly reflected in the distribution (see
tables 38, 39 ,40 and 41), and thus the discrepancy between the two methods may result
in a different interpretation, depending upon which method is applied to a particular
sample o f individuals. Moreover, when grouped by age category, the distribution is also
dissim ilar. W hile the unadjusted formula shows a higher number o f defects formed
between the ages 0-3.0 years o f age, the adjusted one shows a higher frequency in the
segment 3.1-7.0 years o f age (see Table 43).
Table 42 Paired t-test Goodman and Rose ( 1990) / Goodman and Rose AdjustedM ean SD S E o f M ean M ean SD S E o f M ean [-value D f p (a )
M ax illa11 2 .7 2 0 .698 0 .8 2 9 3.28 0 .48 0 .0 5 7 -21 .423 70 0 .0 0 012 3.11 0 .7 1 6 0.101 3.61 0 .4 5 8 0 .6 4 7 -13.761 49 0 .0 0 0C 3.6 1.017 0 .9 8 8 4 .58 0 .8 1 5 0 .0 7 9 -49 .845 105 0 .0 0 0P M l 4 .1 3 0 .7 0 2 0 .1 0 8 4.61 0.521 0 .8 0 3 -1 7 .3 0 6 41 0 .0 0 0P M 2 4 .5 3 0 .6 3 2 0 .1 1 7 4.91 0.471 0 .8 7 4 -1 2 .4 3 7 28 0 .0 0 0M l 2 .2 2 0.431 0 .0 7 3 2.53 0 .3 2 2 0 .5 4 4 -1 7 .3 4 7 34 0 .0 0 0M 2 5 .7 5 0 .7 8 6 0 .1 2 6 6 .03 0 .5 9 2 0 .095 -9.11 38 0 .0 0 0M an d ib le11 2 .39 0 .749 0 .8 3 8 2 .89 0 .5 2 0 .5 8 -19 .19 79 0 .0 0 012 2.71 0 .543 0 .5 2 7 3 .04 0 .4 0 6 0 .0 3 9 -24 .681 105 0 .0 0 0C 4 .2 2 1.16 0 .8 6 7 3 .48 0.521 0 .0 3 9 15.59 178 0 .0 0 0P M l 3.81 0 .9 3 4 0 .1 0 5 4 .3 6 0 .6 7 0 .7 8 7 -2 0 .8 7 4 78 0 .0 0 0PM 2 5 .3 9 0 .848 0 .1 2 6 5 .6 2 0 .7 2 6 0 .1 0 8 -1 2 .7 1 6 44 0 .0 0 0M l 2 .18 0 .578 0 .0 9 9 2 .56 0.411 0 .0 7 -1 3 .3 5 2 33 0 .0 0 0M 2 5 .7 2 0 .7 0 4 0.131 6 .1 2 0 .4 8 7 0 .0 9 -9 .7 9 5 28 0 .0 0 0G en era l 3 .63 1.331 0 .0 4 4 3 .89 1.145 0 .0 3 8 -1 2 .6 9 923 0 .0 0 0
The difference is equally statistically significant fo r both age-sex groups (0-3.0; 3.1-
7.0; Z = 1 19.66; p(a)=0.000). Therefore, i f these methods are applied to a population, the
results w ill show differences that are significant in two important ways; a) analysis o f the
Reproduced with permission of the copyright owner. Further reproduction prohibited without permission.
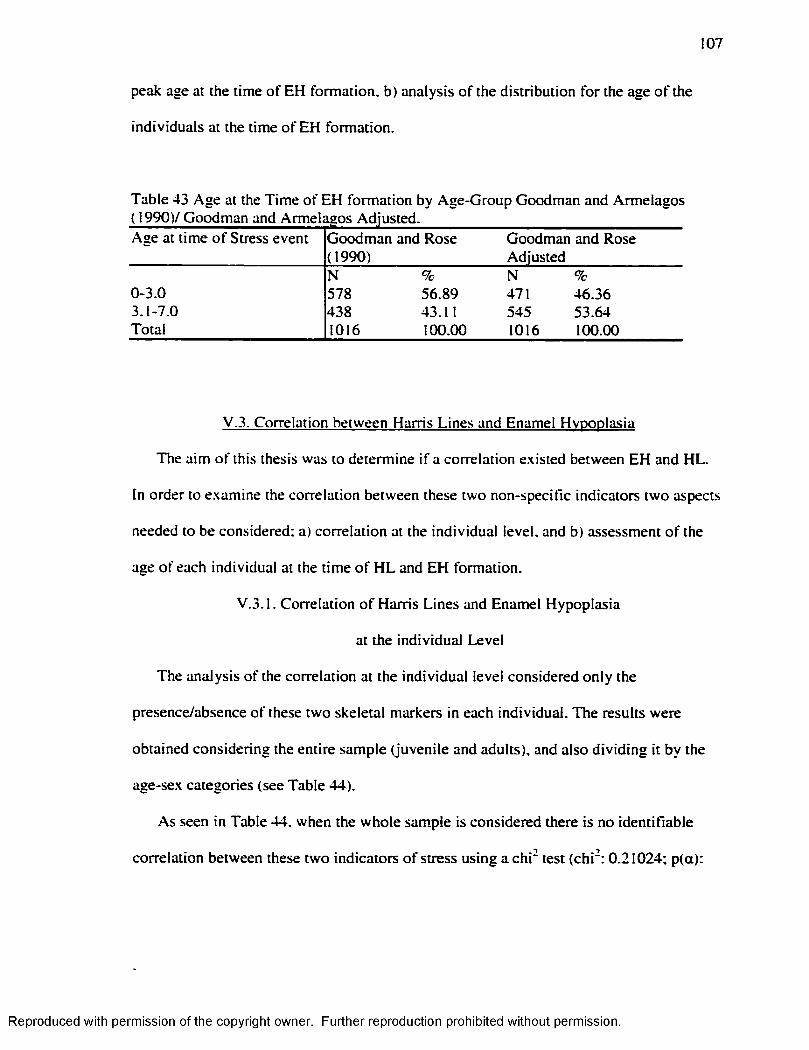
107
peak age at the time o f EH formation, b) analysis o f the distribution fo r the age o f the
individuals at the time o f EH formation.
Table 43 Age at the T ime o f EH formation by Age-Group Goodman and Armelagos
Age at time o f Stress event-g-------- j -------- ---------------Goodman and Rose (1990)
Goodman and Rose Adjusted
N % N %0-3.0 578 56.89 471 46.363.1-7.0 438 43.11 545 53.64Total 1016 100.00 1016 100.00
V.3. Correlation between Harris Lines and Enamel Hvpoplasia
The aim o f this thesis was to determine i f a correlation existed between EH and HL.
In order to examine the correlation between these two non-specific indicators two aspects
needed to be considered; a) correlation at the individual level, and b) assessment o f the
age o f each individual at the time o f H L and EH formation.
V.3.1. Correlation o f Harris Lines and Enamel Hypoplasia
at the individual Level
The analysis o f the correlation at the individual level considered on ly the
presence/absence o f these two skeletal markers in each individual. The results were
obtained considering the entire sample (juvenile and adults), and also d iv id ing it by the
age-sex categories (see Table 44).
As seen in Table 44, when the whole sample is considered there is no identifiable
correlation between these two indicators o f stress using a ch i" test (c h i'; 0.21024; p(a):
Reproduced with permission of the copyright owner. Further reproduction prohibited without permission.
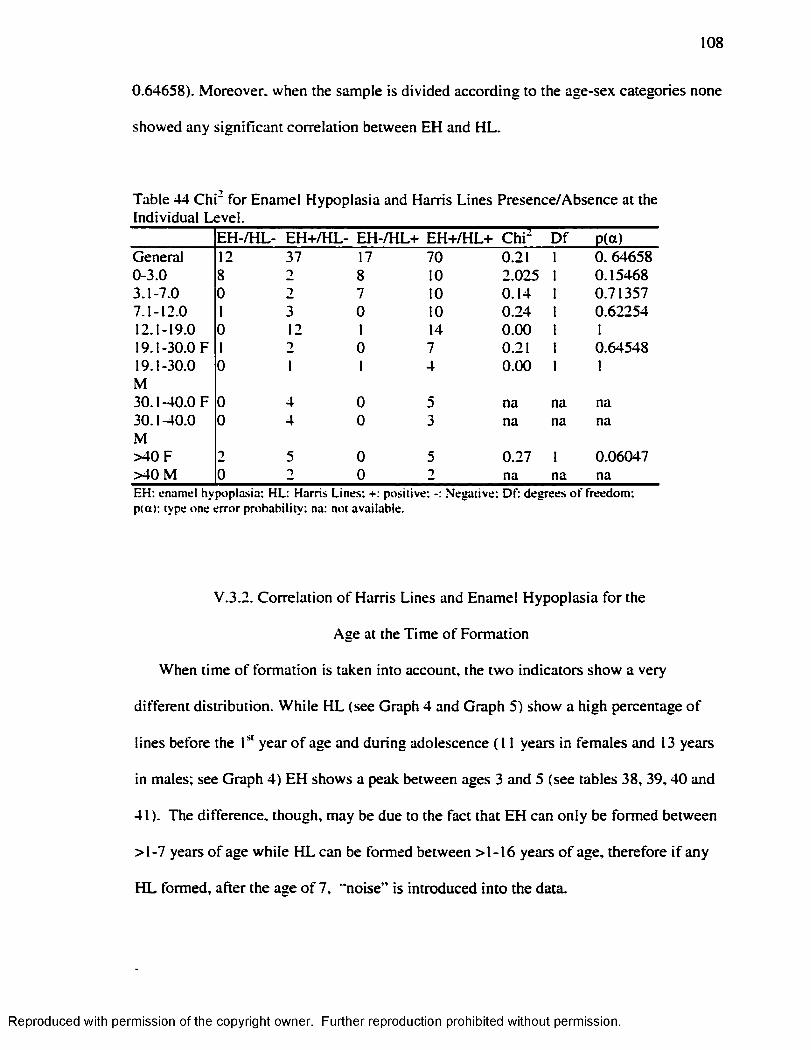
108
0.64658). Moreover, when the sample is divided according to the age-sex categories none
showed any significant correlation between EH and HL.
Table 44 C hi" for Enamel Hypoplasia and Harris Lines Presence/Absence at the Individual Level.
E H -/H L- EH +/H L- EH -/H L+ EH-F/HL+ C h i- D f P(a)General 12 37 17 70 0.21 1 0.646580-3.0 8 2 8 10 2.025 1 0.154683.1-7.0 0 2 7 10 0.14 1 0.713577.1-12.0 1 3 0 10 0.24 1 0.6225412.1-19.0 0 12 1 14 0.00 1 119.1-30.0 F 1 2 0 7 0.21 1 0.6454819.1-30.0 0 1 1 4 0.00 1 1M30.1-40.0 F 0 4 0 5 na na na30.1-40.0 0 4 0 3 na na naM>40 F 2 5 0 5 0.27 1 0.06047>40 M 0 2 0 2 na na naE H : enam el h y p o p las ia : H L: H arris L in es: +: p o sitiv e : N eg a tiv e : D f: d e g re e s o f freedom :p (a ) : type o n e e rro r p ro b ab ility : na: no t ava ilab le .
V.3.2. Correlation o f Harris Lines and Enamel Hypoplasia fo r the
Age at the Time o f Formation
When time o f formation is taken into account, the tw o indicators show a very
different distribution. W hile H L (see Graph 4 and Graph 5) show a high percentage o f
lines before the year o f age and during adolescence ( 11 years in females and 13 years
in males; see Graph 4) EH shows a peak between ages 3 and 5 (see tables 38, 39 ,40 and
41 ). The difference, though, may be due to the fact that EH can on ly be formed between
>1-7 years o f age while H L can be formed between >1-16 years o f age, therefore i f any
H L formed, after the age o f 7, "noise” is introduced in to the data.
Reproduced with permission of the copyright owner. Further reproduction prohibited without permission.
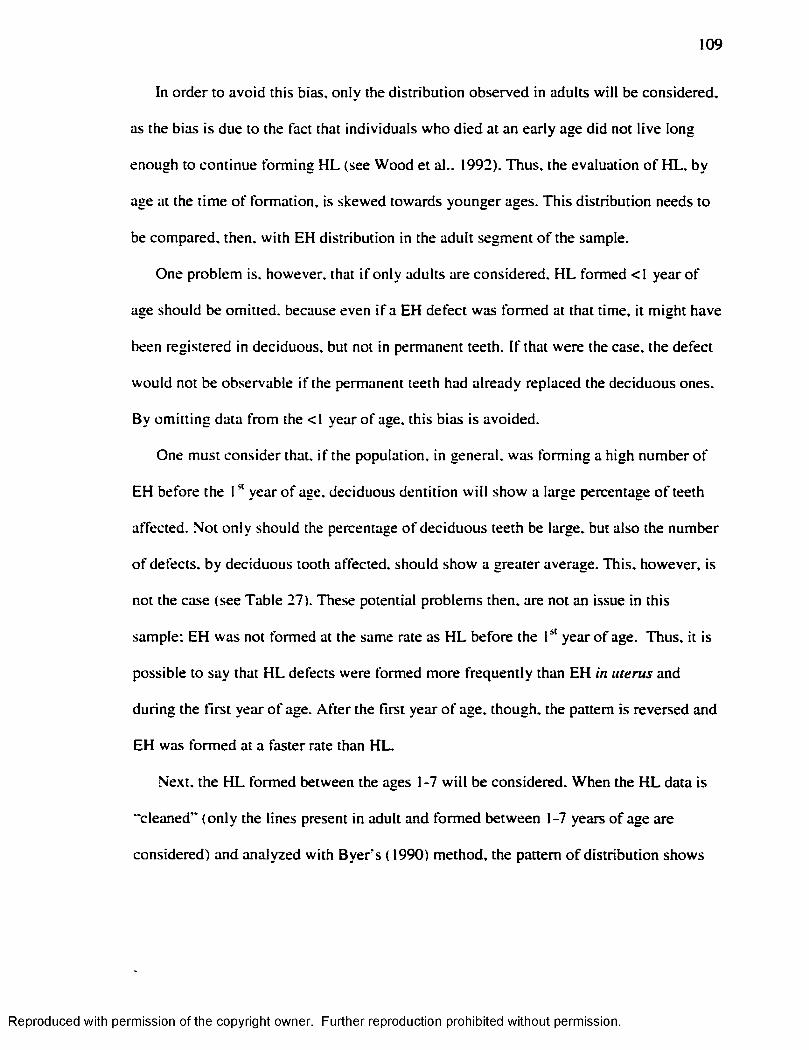
109
In order to avoid this bias, only the distribution observed in adults w ill be considered,
as the bias is due to the fact that individuals who died at an early age did not live long
enough to continue form ing H L (see Wood et al., 1992). Thus, the evaluation o f H L , by
age at the tim e o f formation, is skewed towards younger ages. This distribution needs to
be compared, then, w ith EH distribution in the adult segment o f the sample.
One problem is, however, that i f only adults are considered, H L formed <1 year o f
age should be omitted, because even i f a EH defect was formed at that time, it m ight have
been registered in deciduous, but not in permanent teeth. I f that were the case, the defect
would not be observable i f the permanent teeth had already replaced the deciduous ones.
By om itting data from the <1 year o f age, this bias is avoided.
One must consider that, i f the population, in general, was form ing a high number o f
EH before the 1" year o f age, deciduous dentition w ill show a large percentage o f teeth
affected. Not on ly should the percentage o f deciduous teeth be large, but also the number
o f defects, by deciduous tooth affected, should show a greater average. This, however, is
not the case (see Table 27). These potential problems then, are not an issue in this
sample; EH was not formed at the same rate as H L before the year o f age. Thus, it is
possible to say that H L defects were formed more frequently than EH in uterus and
during the firs t year o f age. A fte r the first year o f age, though, the pattern is reversed and
EH was formed at a faster rate than HL.
Next, the H L formed between the ages 1-7 w ill be considered. When the H L data is
"cleaned” (on ly the lines present in adult and formed between 1-7 years o f age are
considered) and analyzed w ith B ye rs ( 1990) method, the pattern o f distribution shows
Reproduced with permission of the copyright owner. Further reproduction prohibited without permission.
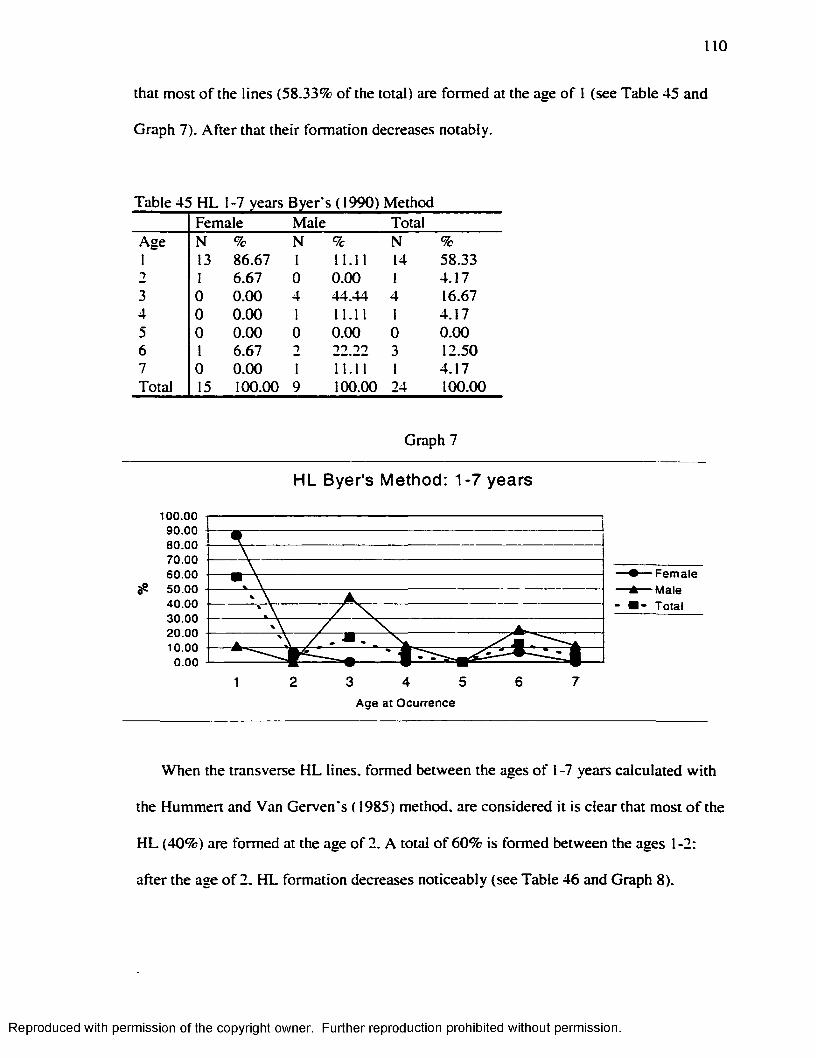
110
that most o f the lines (58.33% o f the total) are formed at the age o f 1 (see Table 45 and
Graph 7). A fte r that their formation decreases notably.
Table 45 H L 1-7 years Byer s (1990) MethodFemale Male Total
Age N % N % N %1 13 86.67 1 11.11 14 58.332 1 6.67 0 0.00 1 4.173 0 0.00 4 44.44 4 16.674 0 0.00 I 11.11 1 4.175 0 0.00 0 0.00 0 0.006 1 6.67 2 22.22 3 12.507 0 0.00 1 11.11 1 4.17Total 15 100.00 9 100.00 24 100.00
Graph 7
HL Byer's Method: 1-7 years
100.009 0 .0 08 0 .0 07 0 .0 06 0 .0 05 0 .0 04 0 .0 03 0 .0 020.0010.00
►— Female 1— Male I - Total
3 4 5Age at Ocurrence
When the transverse H L lines, formed between the ages o f 1 -7 years calculated w ith
the Hummert and Van Gerven's ( 1985) method, are considered it is clear that most o f the
H L (40%) are formed at the age o f 2. A total o f 60% is formed between the ages 1-2:
after the age o f 2. H L formation decreases noticeably (see Table 46 and Graph 8).
Reproduced with permission of the copyright owner. Further reproduction prohibited without permission.
I l l
When EH defects are analyzed fo r the adult population only, the results show a
contrastingly d ifferent distribution in comparison w ith HL. When the Goodman and
Rose's ( 1990) formulas are considered, the m ajority o f EH defects (72.6% o f the total)
are concentrated between the ages 3-5 years (see tables 47 and 48).
Table 46. HI- 1-7 years Hummert and Van Gerven’ s ( 1985) MethodAge/Sex Female Male TotalAge n % n % n %1 2 11.76 4 30.77 6 20.002 7 41.18 5 38.46 12 40.003 2 11.76 0 0.00 2 6.674 1 5.88 0 0.00 1 3.335 3 17.65 2 15.38 5 16.676 2 11.76 2 15.38 4 13.337 * * * * * * * * * *
Total 17 100.00 13 100.00 30 100.00
Graph 8
Hunrmert-Van Gerven: HL formed 1-7 years of age
saoo
axoo
1QOO
aœ5 6 741 2 3
Age at the time of Oajrrenœ
Reproduced with permission of the copyright owner. Further reproduction prohibited without permission.
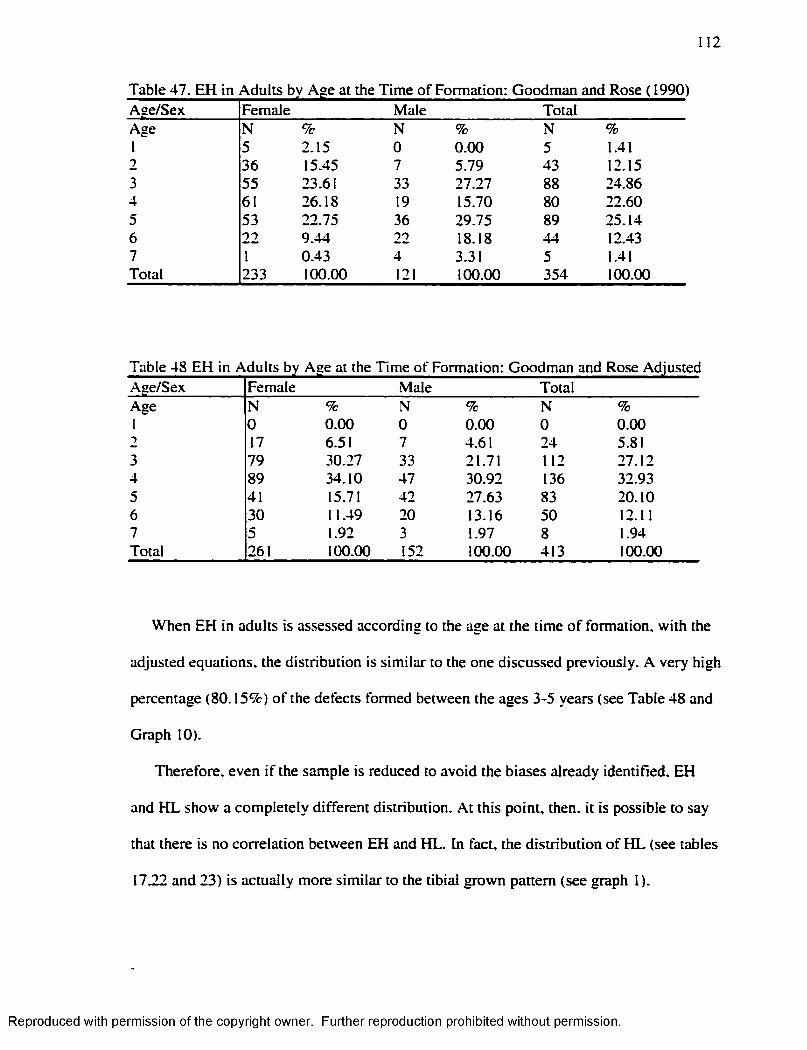
12
Table 47. EH in Adults by Age at the Tim e o f Formation: Goodman and Rose ( 1990)Aae/Sex Female Male TotalAge N % N % N %1 5 2.15 0 0.00 5 1.412 36 15.45 7 5.79 43 12.153 55 23.61 33 27.27 88 24.864 61 26.18 19 15.70 80 22.605 53 22.75 36 29.75 89 25.146 22 9.44 22 18.18 44 12.437 1 0.43 4 3.31 5 1.41Total 233 100.00 121 100.00 354 100.00
Age/Sex Female Male TotalAge N % N % N %1 0 0.00 0 0.00 0 0.002 17 6.51 7 4.61 24 5.813 79 30.27 33 21.71 112 27.124 89 34.10 47 30.92 136 32.935 41 15.71 42 27.63 83 20.106 30 11.49 20 13.16 50 12.117 5 1.92 3 1.97 8 1.94Total 261 100.00 152 100.00 413 100.00
When EH in adults is assessed according to the age at the time o f formation, w ith the
adjusted equations, the distribution is s im ilar to the one discussed previously. A very high
percentage (80.15%) o f the defects formed between the ages 3-5 years (see Table 48 and
Graph 10).
Therefore, even i f the sample is reduced to avoid the biases already identified. EH
and H L show a completely different distribution. A t this point, then, it is possible to say
that there is no correlation between EH and HL. In fact, the d istribution o f H L (see tables
17.22 and 23) is actually more s im ilar to the tib ia l grown pattern (see graph 1).
Reproduced with permission of the copyright owner. Further reproduction prohibited without permission.
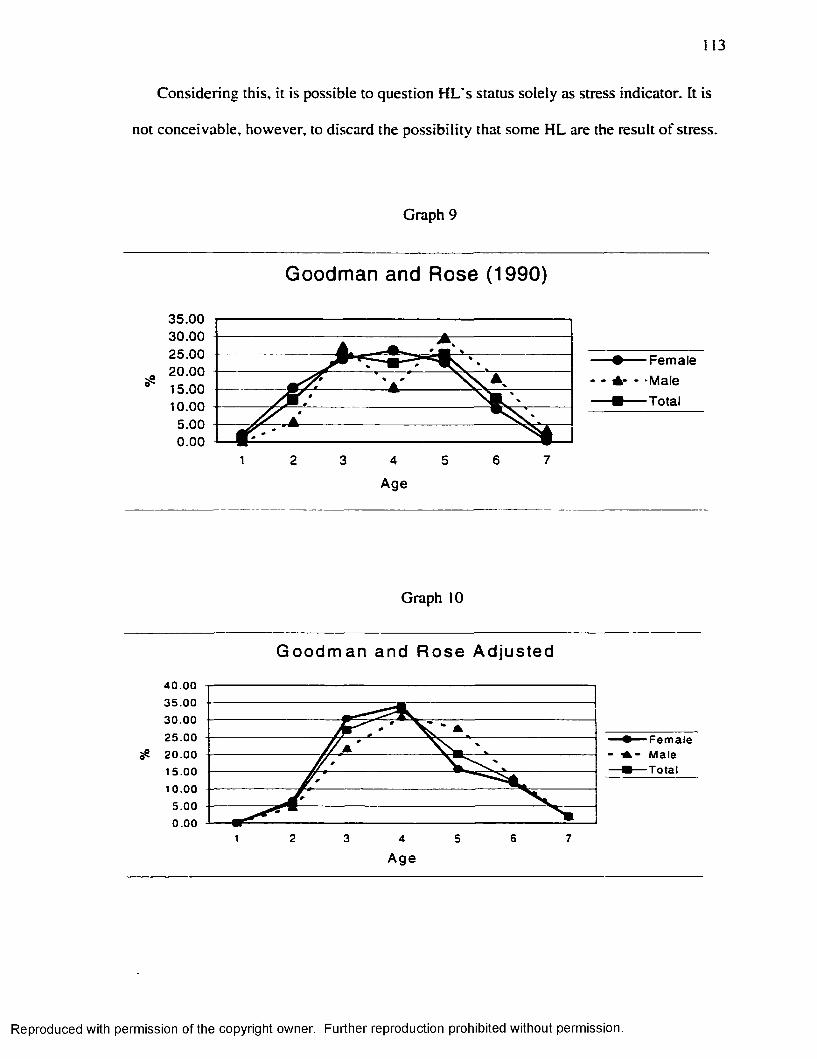
113
Considering this, it is possible to question H L 's status solely as stress indicator. It is
not conceivable, however, to discard the possib ility that some H L are the result o f stress.
Graph 9
Goodman and Rose (1990)
35.0030.0025.00 Female20.00 - - * -Male15.00
Tota10.00
Age
Graph 10
G oodm an and Rose Adjusted
4 0 .0 03 5 .0 030 .00
25 .0 0 Fem ale - Male
Total20.0015.00
10 .00
Reproduced with permission of the copyright owner. Further reproduction prohibited without permission.
114
V.4. F iltering the Noise
I f H L is the result o f growth, but there are some H L that are formed as the result o f
stress, it becomes necessary to remove those lines that are the result o f growth, and match
the residual ones w ith EH defects to see i f they coincide. A t the same time, EH defects
may be the result o f a higher sensitivity and not the product o f stress solely and that
"noise” in the data must also be removed.
In order to avoid these two factors, and considering that sensitivity to stress and
growth are specific to each year o f life , it is assumed that an average number o f EH and
H L are formed each year o f life due to this d ifferentia l sensitivity (EH) and due to growth
(H L). The data available fo r these two indicators then, was smoothed, by subtracting the
specific average number o f H L (see Tables 49 and 50) and EH formed each year by the
individuals (see Tables 51,52 and 53). The remaining HL, were then matched w ith the
remaining EH, to see i f there was any coincidence. H L were match w ith EH and not EH
w ith H L because the number o f EH is larger than the number o f HL, and thus, by
comparing H L w ith EH the probability o f finding a match is increased. The number o f
remaining H L at any specific age in any specific individual was not considered; on ly its
presence/absence was analyzed in the matching process w ith EH.
These smoothing factors were subtracted in a ll the individuals that presented both H L
and EH. These individuals are the only ones where it is possible to find a correlation
between these two indicators. Harris lines formed between the ages <1-7 were considered
in this analysis. Harris lines formed before the year o f age were considered in order to
increase the possib ility to find a match.
Reproduced with permission of the copyright owner. Further reproduction prohibited without permission.
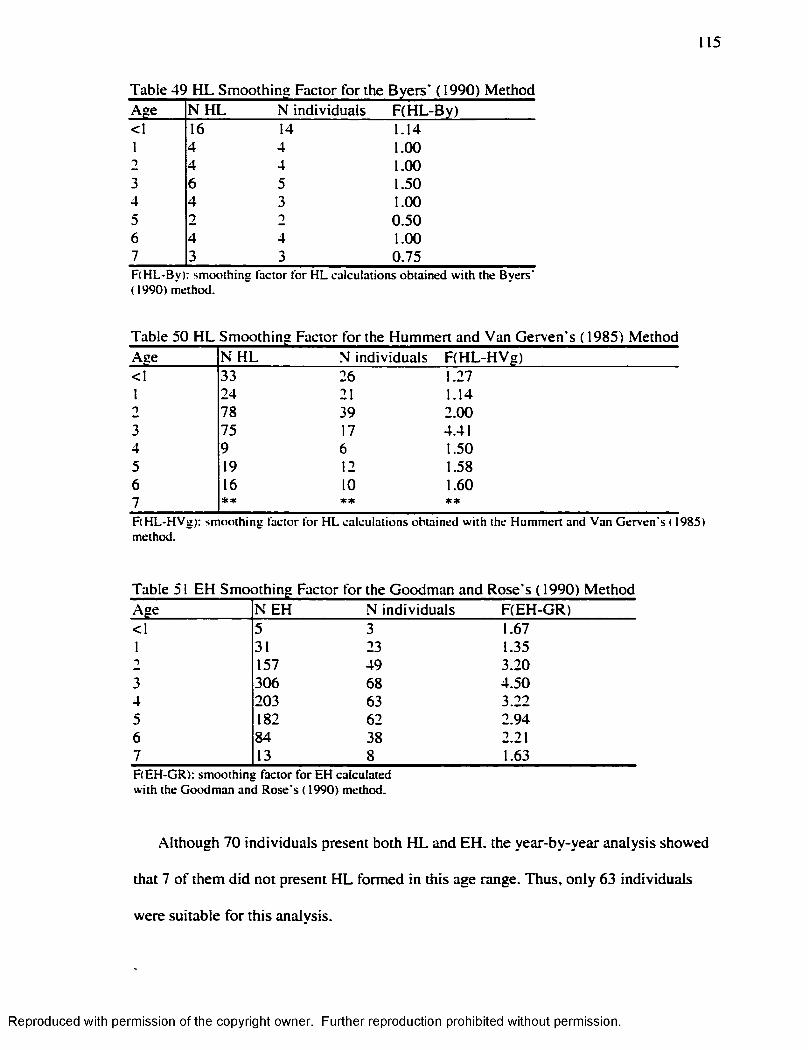
115
Age N H L N individuals F(H L-By)<1 16 14 1.141 4 4 1.002 4 4 1.003 6 5 1.504 4 3 1.005 2 2 0.506 4 4 1.007 3 3 0.75F (H L -B y): sm o o th in g fac to r fo r H L c a lc u la tio n s o b ta in ed w ith the B y e rs ’ ( 1990) m eth o d .
Table 50 H L Smoothing Factor for the Hummert and Van Gerven’s (1985) MethodAge N H L N individuals F(H L-H V g)<1 33 26 1.271 24 21 1.142 78 39 2.003 75 17 4.414 9 6 1.505 19 12 1.586 16 10 1.607 * * * * * *
F (H L -H V g): sm o o th in g fac to r fo r H L ca lc u la tio n s o b ta in ed w ith the H u m m ert an d V an G e rv e n ’s ( 1985) m ethod .
Table 51 EH Smoothing Factor for the Goodman and Rose's ( 1990) MethodAge N EH N individuals F(EH-GR)< I 5 3 1.671 31 23 1.351 157 49 3.203 306 68 4.504 203 63 3.225 182 62 2.946 84 38 2.217 13 8 1.63F (E H -G R ): sm o o th in g fa c to r fo r E H ca lc u la ted w ith the G o o d m a n an d R o se ’s ( 1990) m ethod .
Although 70 individuals present both H L and EH. the year-by-year analysis showed
that 7 o f them did not present H L formed in this age range. Thus, on ly 63 individuals
were suitable fo r this analysis.
Reproduced with permission of the copyright owner. Further reproduction prohibited without permission.
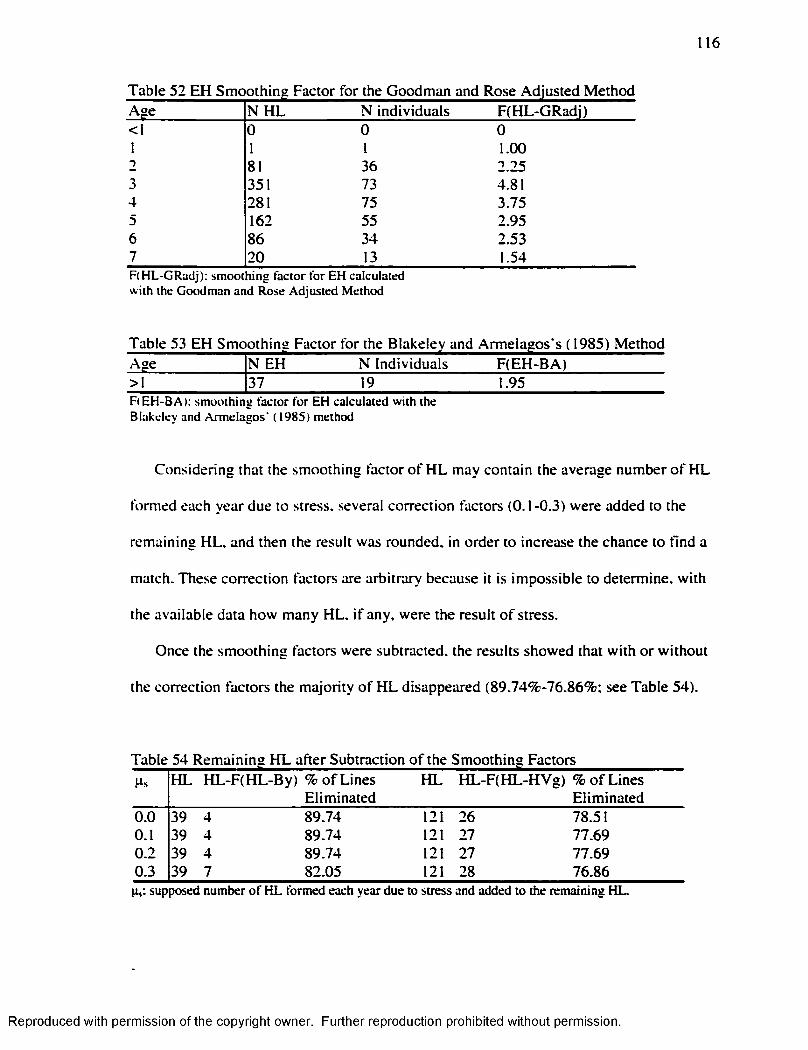
116
Table 52 EH Smoothing Factor for the Goodman and Rose Adjusted MethodAge N H L N individuals F(HL-GRadi)<1 0 0 01 1 1 1.002 81 36 2.253 351 73 4.814 281 75 3.755 162 55 2.956 86 34 2.537 20 13 1.54F (H L -G R ad j): sm o o th in g fa c to r fo r E H ca lcu la ted w ith the G o o d m an an d R o se A d ju s ted M eth o d
Age N EH N Individuals F(EH -BA)>1 37 19 1.95F (E H -B A ): sm o o th in g fac to r fo r E H ca lc u la ted w ith the B lakeley and A rm e la g o s ' ( 1985) m ethod
Considering that the smoothing factor o f H L may contain the average number o f H L
formed each year due to stress, several correction factors (0.1-0.3) were added to the
remaining HL. and then the result was rounded, in order to increase the chance to find a
match. These correction factors are arbitrary because it is impossible to determine, w ith
the available data how many HL. i f any. were the result o f stress.
Once the smoothing factors were subtracted, the results showed that w ith o r w ithout
the correction factors the m ajority o f H L disappeared (89.74^-76.86% ; see Table 54).
Table 54 Remaining H L after Subtraction o f the Smoothing FactorsH L H L-F (H L-B y) % o f Lines H L H L-F (H L-H V g) % o f Lines
Eliminated Elim inated0.0 39 4 89.74 121 26 78.510.1 39 4 89.74 121 27 77.690.2 39 4 89.74 121 27 77.690.3 39 7 82-05 121 28 76.86
su p p o sed n u m b e r o f H L fo rm ed each y e a r d u e to s tre ss an d a d d e d to th e rem a in in g H L.
Reproduced with permission of the copyright owner. Further reproduction prohibited without permission.
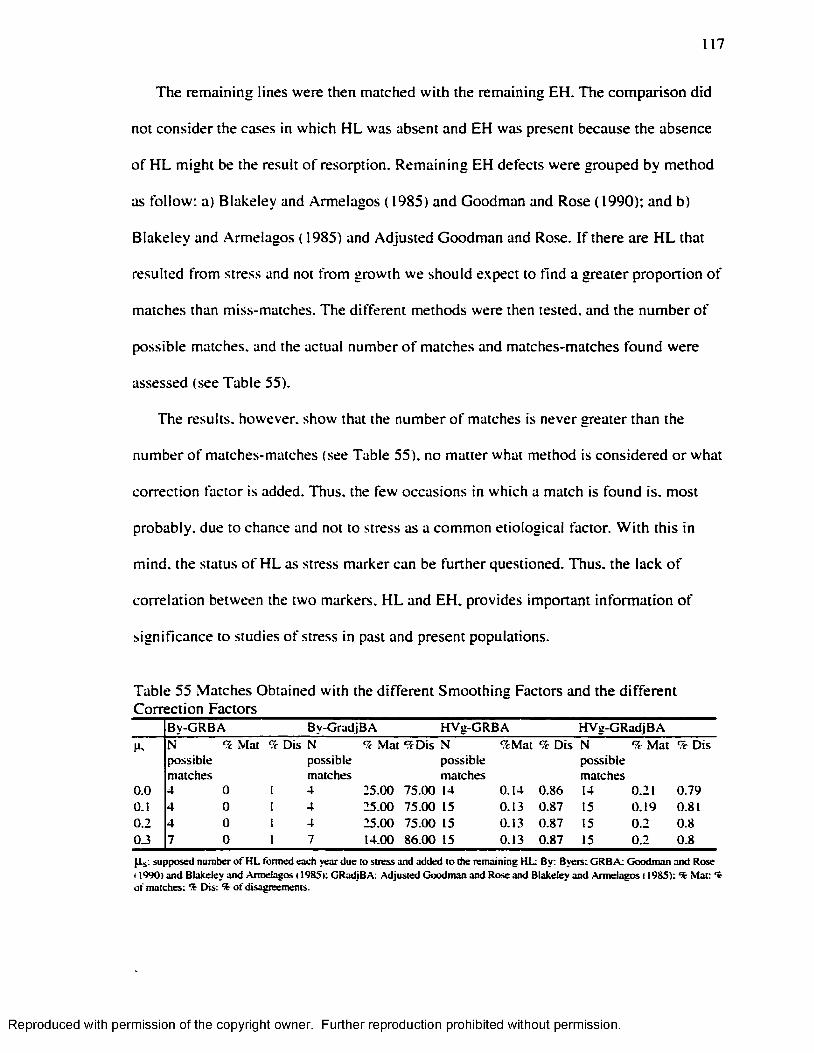
117
The remaining lines were then matched w ith the remaining EH. The comparison did
not consider the cases in which H L was absent and EH was present because the absence
o f H L m ight be the result o f resorption. Remaining EH defects were grouped by method
as fo llow : a) Blakeley and Armelagos ( 1985) and Goodman and Rose (1990); and b)
Blakeley and Armelagos ( 1985) and Adjusted Goodman and Rose. I f there are H L that
resulted from stress and not from growth we should expect to find a greater proportion o f
matches than miss-matches. The different methods were then tested, and the number o f
possible matches, and the actual number o f matches and matches-matches found were
assessed (see Table 55).
The results, however, show that the number o f matches is never greater than the
number o f matches-matches (see Table 55). no matter what method is considered o r what
correction factor is added. Thus, the few occasions in which a match is found is. most
probably, due to chance and not to stress as a common etiological factor. W ith this in
mind, the status o f H L as stress marker can be further questioned. Thus, the lack o f
correlation between the two markers. H L and EH. provides important inform ation o f
significance to studies o f stress in past and present populations.
Table 55 Matches Obtained w ith the different Smoothing Factors and the different Correction Factors
B y -G R B A B y-G rad jB A H V g -G R B A H V g -G R ad jB A
N M at '/c D is N % M at ^ D i s N % M at % D is N % M at % D isp o ss ib lem a tch es
p o ss ib lem atches
p o ss ib lem atch es
p o ss ib lem atch es
0 .0 4 0 I 4 2 5 .0 0 7 5 .0 0 14 0 .1 4 0 .8 6 14 0 .21 0 .7 9O.I 4 0 I 4 2 5 .0 0 7 5 .0 0 15 0 .13 0 .8 7 15 0 .1 9 0.810 .2 4 0 1 4 2 5 .0 0 7 5 .0 0 15 0 .13 0 .8 7 15 0 .2 0 .80 .3 7 0 1 7 14.00 8 6 .0 0 15 0 .13 0 .8 7 15 0 .2 0 .8
Ps supposed number o f H L formed each year due to stress and added to the remaining HL: By: Byers: CRB A: Goodman and Rose 11990) and Blakeley and Armelagos 11985): GRadjBA: Adjusted Goodman and Rose and Blakeley and Armelagos 11985): % Mat: t of matches: % Dis: % o f disagreements.
Reproduced with permission of the copyright owner. Further reproduction prohibited without permission.
CHAPTER V I
CONCLUSIONS
In order to survive, an organism must be able to respond to any changing
environmental conditions. I f the change in the environment occurs while the individual is
growing and developing, certain phenotypic changes m ight occur in response to the
stim uli; a phenomenon called developmental adaptation. Developmental plasticity, then,
especially in humans, carries a high level o f adaptation compared to the one attainable
during adulthood (L ittle . 1995).
Among these phenotypic changes, due to stressful environmental conditions. H L and
EH are recognized in the corpus o f the literature as stress markers (E llio t. 1927; Harris.
1932; Suckling. 1989; Goodman and Rose. 1990; Goodman et al.. 1997; W right. 1997;
Lewis. 2000). According to the literature, although these indicators show certain
sim ilarities in the ir etiology they also present differences:
1 ) Harris Lines can be formed over a longer span o f years (m «ren/5-16 years), than
hypoplasia {in «ren/5-13 years; M artin et al.. 1985); and.
2) Harris lines are affected by resorption and remodeling, a process that does not alter
enamel and thus has no effect on EH (M artin et al.. 1985).
The aim o f this study was to determine the existence o f any correlation between these
two markers. In order to identify i f the two markers were correlated, their incidence was
118
Reproduced with permission of the copyright owner. Further reproduction prohibited without permission.
119
analyzed at the individual level (presence/absence) and the distribution o f the age o f the
individuals at the time o f EH and H L formation. The analyses were carried on each
marker separately, to determine i f any patterns emerged. Then, the two markers were
compared in several analyses to determine i f any correlation existed between them.
V I. 1 ■ Harris Lines
The results obtained in the analysis o f H L considered its presence/absence by
individual and the age o f the individual at the time o f H L formation. A t the individual
level, the results showed that 63.23% o f the sample has HL. A higher percentage o f
juvenile individuals (67.82%) present H L in comparison w ith the adult segment o f the
sample (62.25% in females and 58.82% in males). There are two possible explanations
for such phenomena: a) it is possible that individuals who lived longer had more time to
resorb the lines and that is why they present a smaller number o f H L (Wood et al.. 1992)
or: b) it is possible that, i f H L is the result o f stress, individuals who formed less lines and
thus were exposed to less stressful events during childhood had a better chance to
survive. The second possibility can be elim inated i f H L is not a stress marker.
In general, the distribution o f the transverse Harris lines show that they are more
numerous towards the distal end: this result is in accordance w ith the findings o f other
studies (Gam et al.. 1968). This phenomenon is hard to explain; however, it is possible
that although the tib ia grows faster towards proximal (57%). and thus enhances its ab ility
to form lines, this high rate o f growth may also result in a higher rate o f resorption and
remodeling. The resorption and remodeling process, then, may result in an increased
resorption o f H L towards the proximal end. This interpretation can also explain why
Reproduced with permission of the copyright owner. Further reproduction prohibited without permission.
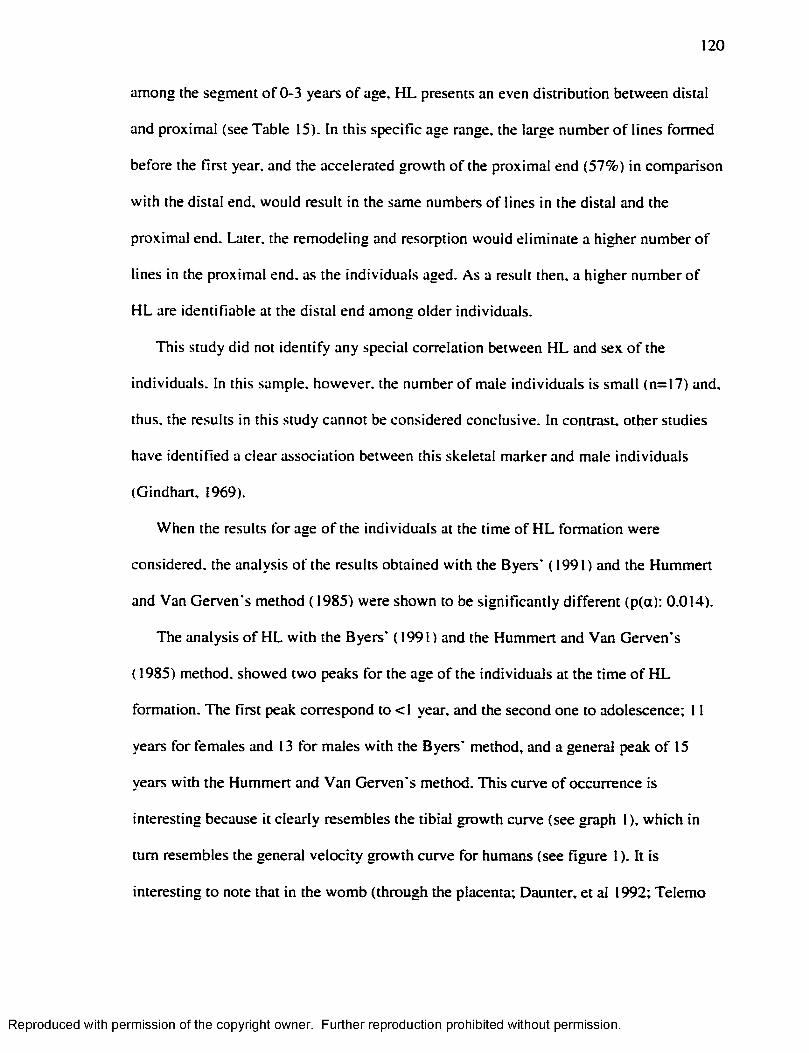
120
among the segment o f 0-3 years o f age, H L presents an even distribution between distal
and proxim al (see Table 15). In this specific age range, the large number o f lines formed
before the first year, and the accelerated growth o f the proximal end (57%) in comparison
w ith the distal end. would result in the same numbers o f lines in the distal and the
proximal end. Later, the remodeling and resorption would elim inate a higher number o f
lines in the proximal end. as the individuals aged. As a result then, a higher number o f
H L are identifiable at the distal end among older individuals.
This study did not identify any special correlation between H L and sex o f the
individuals. In this sample, however, the number o f male individuals is small (n=17) and.
thus, the results in this study cannot be considered conclusive. In contrast, other studies
have identified a clear association between this skeletal marker and male individuals
(Gindhart. 1969).
When the results for age o f the individuals at the time o f H L formation were
considered, the analysis o f the results obtained w ith the Byers' (1991) and the Hummert
and Van Gerven's method (1985) were shown to be significantly d ifferent (p(a): 0.014).
The analysis o f H L w ith the Byers' (1991) and the Hummert and Van Gerven's
( 1985) method, showed two peaks fo r the age o f the individuals at the time o f H L
formation. The first peak correspond to <1 year, and the second one to adolescence; 11
years fo r females and 13 fo r males w ith the Byers' method, and a general peak o f 15
years w ith the Hummert and Van Gerven's method. This curve o f occurrence is
interesting because it clearly resembles the tib ia l growth curve (see graph 1 ). which in
turn resembles the general velocity growth curve fo r humans (see figure 1). It is
interesting to note that in the womb (through the placenta; Daunter. et al 1992; Telemo
Reproduced with permission of the copyright owner. Further reproduction prohibited without permission.
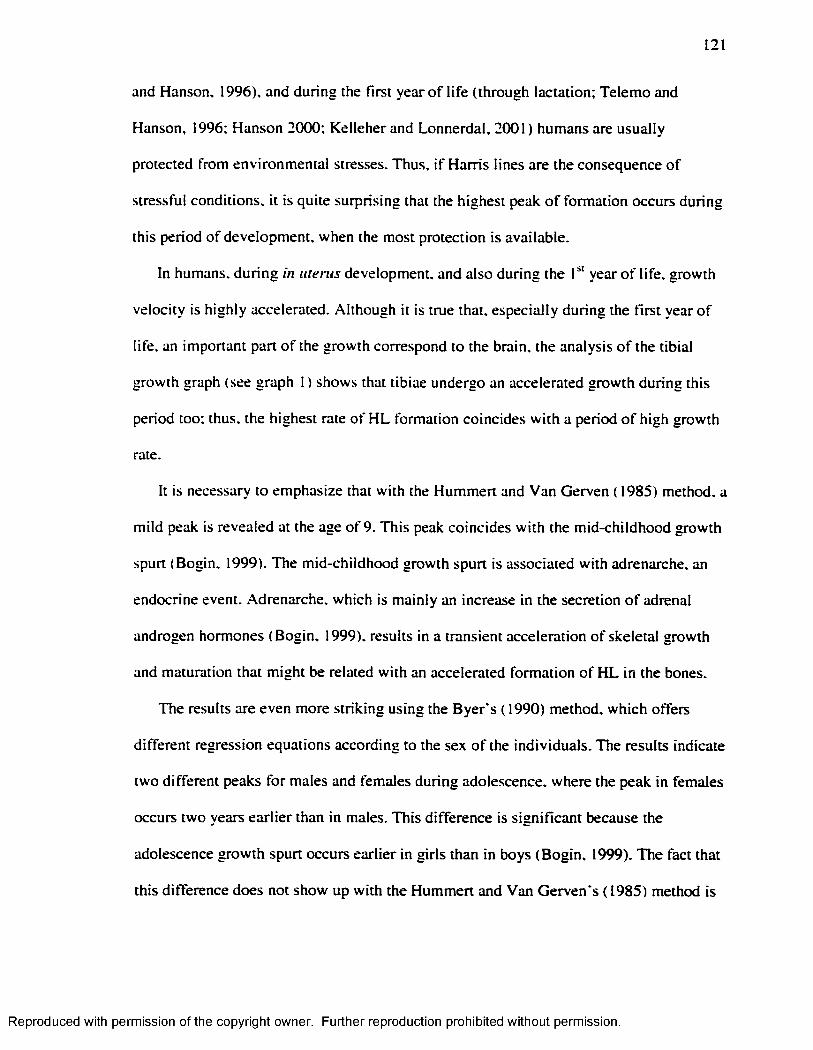
121
and Hanson, 1996), and during the first year o f life (through lactation; Telemo and
Hanson, 1996; Hanson 2000; Kelleher and Lonnerdal, 2001) humans are usually
protected from environmental stresses. Thus, i f Harris lines are the consequence o f
stressful conditions, it is quite surprising that the highest peak o f formation occurs during
this period o f development, when the most protection is available.
In humans, during in uterus development, and also during the year o f life , growth
velocity is h ighly accelerated. Although it is true that, especially during the firs t year o f
life , an important part o f the growth correspond to the brain, the analysis o f the tib ia l
growth graph (see graph 1 ) shows that tibiae undergo an accelerated growth during this
period too; thus, the highest rate o f H L formation coincides w ith a period o f high growth
rate.
It is necessary to emphasize that w ith the Hummert and Van Gerven ( 1985) method, a
m ild peak is revealed at the age o f 9. This peak coincides w ith the m id-childhood growth
spurt (Bogin. 1999). The m id-childhood growth spurt is associated w ith adrenarche. an
endocrine event. Adrenarche. which is m ainly an increase in the secretion o f adrenal
androgen hormones (Bogin. 1999). results in a transient acceleration o f skeletal growth
and maturation that m ight be related w ith an accelerated formation o f H L in the bones.
The results are even more strik ing using the Byer s ( 1990) method, which offers
different regression equations according to the sex o f the individuals. The results indicate
two different peaks fo r males and females during adolescence, where the peak in females
occurs two years earlier than in males. This difference is significant because the
adolescence growth spurt occurs earlier in girls than in boys (Bogin. 1999). The fact that
this difference does not show up w ith the Hummert and Van Gerven's ( 1985) method is
Reproduced with permission of the copyright owner. Further reproduction prohibited without permission.
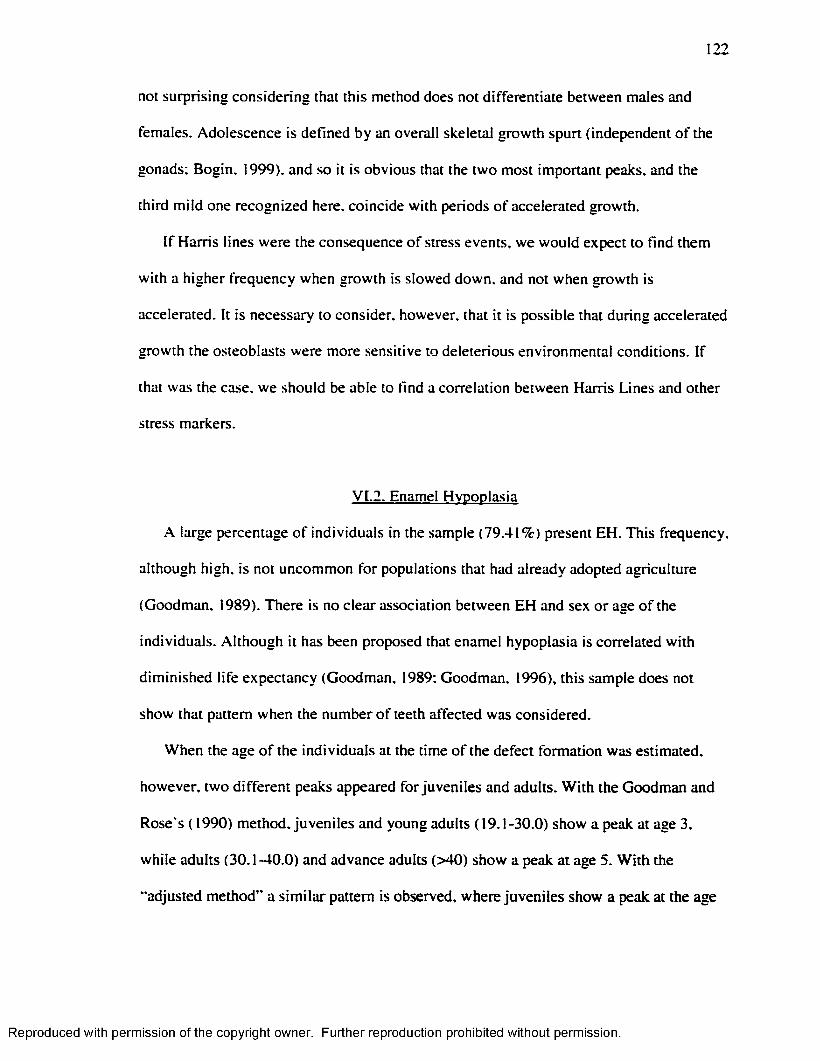
122
not surprising considering that this method does not differentiate between males and
females. Adolescence is defined by an overall skeletal growth spurt (independent o f the
gonads; Bogin, 1999). and so it is obvious that the two most important peaks, and the
third m ild one recognized here, coincide w ith periods o f accelerated growth.
I f Harris lines were the consequence o f stress events, we would expect to find them
w ith a higher frequency when growth is slowed down, and not when growth is
accelerated. It is necessary to consider, however, that it is possible that during accelerated
growth the osteoblasts were more sensitive to deleterious environmental conditions. I f
that was the case, we should be able to find a correlation between Harris Lines and other
stress markers.
V I.2. Enamel Hvpoplasia
A large percentage o f individuals in the sample (79.41%) present EH. This frequency,
although high, is not uncommon fo r populations that had already adopted agriculture
(Goodman. 1989). There is no clear association between EH and sex or age o f the
individuals. A lthough it has been proposed that enamel hypoplasia is correlated w ith
diminished life expectancy (Goodman. 1989; Goodman. 1996). this sample does not
show that pattern when the number o f teeth affected was considered.
When the age o f the individuals at the time o f the defect formation was estimated,
however, two d ifferent peaks appeared for juveniles and adults. W ith the Goodman and
Rose's ( 1990) method, juveniles and young adults (19.1-30.0) show a peak at age 3.
while adults (30.1-40.0) and advance adults (>40) show a peak at age 5. W ith the
"adjusted method” a s im ila r pattern is observed, where juveniles show a peak at the age
Reproduced with permission of the copyright owner. Further reproduction prohibited without permission.
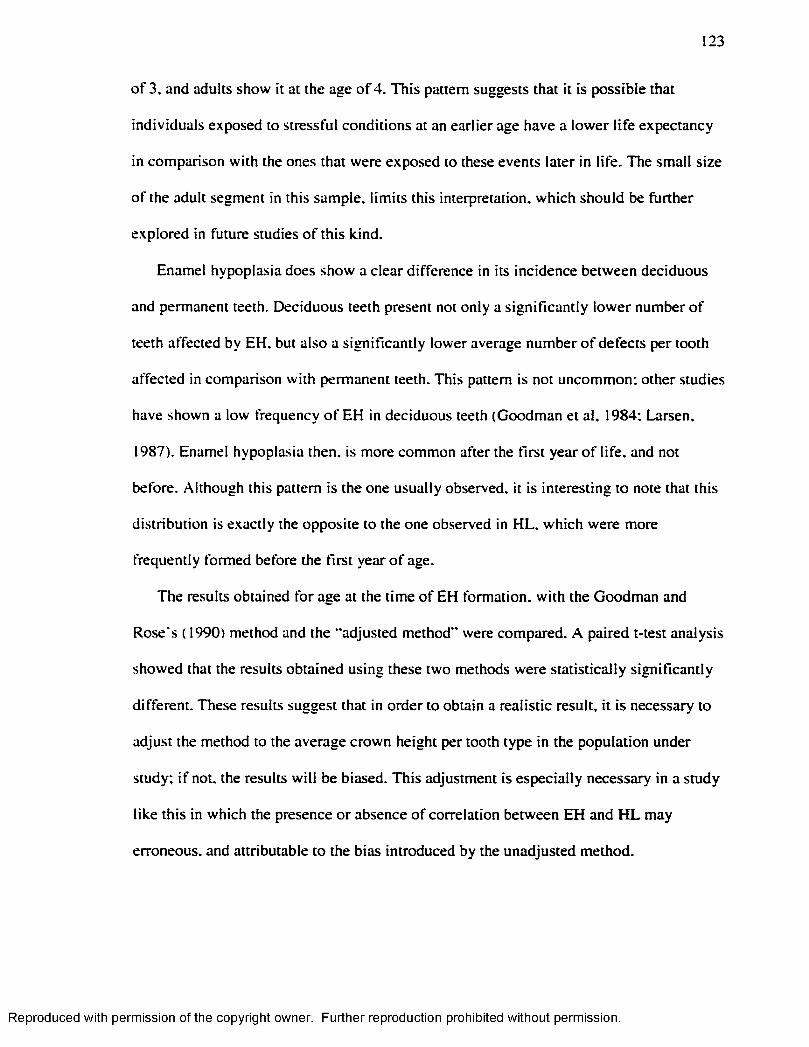
123
o f 3, and adults show it at the age o f 4. This pattern suggests that it is possible that
individuals exposed to stressful conditions at an earlier age have a lower life expectancy
in comparison w ith the ones that were exposed to these events later in life . The small size
o f the adult segment in this sample, lim its this interpretation, which should be further
explored in future studies o f this kind.
Enamel hypoplasia does show a clear difference in its incidence between deciduous
and permanent teeth. Deciduous teeth present not only a s ign ificantly low er number o f
teeth affected by EH, but also a significantly lower average number o f defects per tooth
affected in comparison w ith permanent teeth. This pattern is not uncommon; other studies
have shown a low frequency o f EH in deciduous teeth (Goodman et al. 1984; Larsen.
1987). Enamel hypoplasia then, is more common after the first year o f life , and not
before. Although this pattern is the one usually observed, it is interesting to note that this
d istribution is exactly the opposite to the one observed in H L . which were more
frequently formed before the first year o f age.
The results obtained for age at the time o f EH formation, w ith the Goodman and
Rose's ( 1990) method and the "adjusted method " were compared. A paired t-test analysis
showed that the results obtained using these two methods were statistically significantly
different. These results suggest that in order to obtain a realistic result, it is necessary to
adjust the method to the average crown height per tooth type in the population under
study; i f not. the results w ill be biased. This adjustment is especially necessary in a study
like this in which the presence o r absence o f correlation between EH and H L may
erroneous, and attributable to the bias introduced by the unadjusted method.
Reproduced with permission of the copyright owner. Further reproduction prohibited without permission.
124
V I.3 . Correlation between Two Non-Specific Indicators
o f Stress: Harris Lines and Enamel Hvpoplasia
No correlation between these two indicators was identifiable at the individual level.
The analysis o f the presence/absence o f these indicators showed no association when the
sample was considered as a whole or when each age-sex group was considered
individually. A lthough C h i" was not applicable to the 30.1-40.0 years female and male
segments and the >40 male group, this deficiency in the data is not as significant i f we
consider that the results o f this test showed no significant association between H L and
EH among juveniles. It was juveniles where a positive correlation was expected, since
H L were exposed to resorption fo r a shorter duration.
When the age o f the individuals at the time o f H L and EH formation was analyzed,
the two indicators show a very different behavior. W hile H L showed a high rate o f
formation before the first year o f age. and a second peak towards adolescence. EH shows
a peak between the ages 3 and 5. In H L and EH these trends are va lid for the sample as a
whole and most o f the age-sex groups. These differences, however, m ight have been the
result o f the d ifferentia l range o f years in which EH (< l-7 ) and H L (<1-16) can be
formed. Thus, when the H L formed after the age o f 7 are considered, "noise” is
introduced into the comparison. Another source o f "noise” is the data that came from the
juvenile individuals, especially considering that they constitute 63.97% o f the sample,
which skewed the distribution o f H L toward younger ages.
Although the use o f H L formed before the first year o f age m ight be questioned,
because EH formed at this time rarely appears in permanent teeth, we cannot om it the
fact that there is a very low percentage o f deciduous teeth w ith EH (4.92%). Moreover.
Reproduced with permission of the copyright owner. Further reproduction prohibited without permission.
125
not on ly the percentage, but also the average number o f defects per affected deciduous
tooth ( 1.16) is low. Thus, i f EH was form ing at the same time H L was. that is. at a fast
rate in uterus and during the first year o f life , we would expect a large percentage o f
deciduous teeth affected w ith EH and a high average number o f defects per affected
deciduous tooth, but this does not occur in the sample analyzed.
In order to solve these problems only the H L and EH present in adults, and formed
between the ages 1-7. were considered. Again, the distribution o f the two indicators
showed a completely different behavior. Harris lines showed a high rate o f formation at
age 1 using Byer s (1991) method, and at the age o f 2 w ith Hummert and Van Gerven's
( 1985) method; after the age o f two a very low frequency o f H L is detected. The
distribution o f EH is. in contrast, completely different. When EH defects present in the
adult population are analyzed w ith the Goodman and Rose's ( 1990) method, and then
again w ith the "adjusted” one. the distribution shows that the m ajority o f the defects are
formed between the ages o f 3 and 5 years.
We can conclude then that these two indicators show a completely different
d istribution by age o f formation. It is extremely interesting that no matter how the data
are "cleaned” . H L keeps showing a high peak before or at the first year o f age. Moreover.
Harris Lines are very common before the firs t year o f age and not as common at older
ages. In contrast. Enamel Hypoplasia shows the opposite pattern; it is rarely formed
before the first year o f age and form more commonly after the age o f 2. This distribution,
at least for EH, has been attributed to the protection that the uterine environment and.
later, maternal m ilk provides (Kronfeld and Schour. 1939; Samat and Schour. 1942;
Gruenwald. 1973; Levine and Keen. 1974).
Reproduced with permission of the copyright owner. Further reproduction prohibited without permission.

126
It is w idely known that intra uterine environment and lactation provides the fetus and
the neonate w ith protection (Daunter et al.. 1992; Telemo and Hanson. 1996; Hanson
2000; Kelleher and Lonnerdal. 2001 ). after this period the individual has to develop its
own immune system. Considering that, we would expect to find a low incidence o f stress
markers before the first year o f age, as in the case o f EH. The high incidence o f H L at
this time, however, does not f it this model. I f H L were an indicator o f stress we would
expect to find a low frequency o f H L before the first year and a high incidence after this
period. Moreover, i f H L is the consequence o f stress that results in slowed or stopped
growth, we should expect to find it not only correlated w ith other stress markers (as EH),
but also at times when growth speed is decelerated.
The results obtained here do not fit w ith any o f these expectations. Harris lines are not
associated w ith EH; they do not only show a completely opposite d istribution, but also
H L shows a pattern o f distribution that is s im ilar to the growth curve o f the tibia. These
results are interesting because H L is associated not w ith stopped, o r slowed growth, but
w ith accelerated growth.
It is possible that H L are the result o f growth and not the result o f stress.
Nevertheless, it s till remains possible that some o f the H L were the result o f stress. In
order to assess that possibility the data was "smoothed” by subtracting the average
number o f H L formed each year between the ages <1-7. Enamel hypoplasia was also
smoothed considering that there is inter and intra-tooth d ifferentia l sensitivity to EH.
Thus a greater amount o f EH is formed at specific years during the development o f an
individual. Thus, an average number o f EH formed each vear was also subtracted.
Reproduced with permission of the copyright owner. Further reproduction prohibited without permission.
127
The data were smoothed fo r individuals that presented both EH and H L. Once the
data were smoothed the residual H L were matched against the residual occurrences o f
EH. A larger number o f disagreements than matches were identified; where H L occurred
and no EH formed at the same age in the same individual. In order to om it the possibility
that in the average number o f H L subtracted, the average number o f H L formed due to
stress was included three different correction factors were added to the remaining H L (0-
1-0.3). W ith each correction factor added, the new remaining H L were matched w ith the
remaining occurrences o f EH. The three analyses showed a considerably higher
frequency o f disagreements than matches. The few number o f matches found are. most
probably, the result o f chance, rather than the result o f these two skeletal markers having
stress as a common etiological factor in common.
VI.4. Harris Lines Reevaluated
.Magennis ( 1990) postulated that H L were the result o f an imbalance between G H and
IGF-I. and that this imbalance m ight have been the result o f normal growth, diseases or
protein deficiency that decreased the production o f IG F-I and w ith it the hypertrophy o f
chondrocytes. Thus, according to Magennis ( 1990) it is possible that some H L are the
result o f stressful conditions.
The results obtained in this study do not support the possib ility that H L are the result
o f stressful conditions. Moreover, although Magennis ( 1990) considered the possibility
that a deficiency in IG F-I. due to protein deficiency, m ight result in the formation o f HL.
studies in Rhesus monkeys have shown that a larger mean number, and a greater
Reproduced with permission of the copyright owner. Further reproduction prohibited without permission.

128
percentage o f H L occurred in controls, rather than in protein-restricted infants
(Murchison et al., 1984).
It is possible, then, that H L are not pathological; they m ight instead be the normal
consequence o f growth. Thus they are not a stress indicator and should not be used to
reconstruct o r evaluate the health status o f past and present populations.
There are a number o f hormones and growth factors that are involved in bone growth.
In fact, the hormonal influence on bone formation is understood as the interaction o f
many factors. In the interaction systemic hormones, such as glucocorticoids (GC),
insuline, thyroxine (T^). sex hormones, growth hormone (GH) and growth factors (IG F-I
and IGF-P). play a decisive role (Stracke et al.. 1984).
Growth hormone (GH) expands the pool o f progenitor chondrocytes (Lindahl et al..
1987; Ohlsson et al.. 1992; Siebler et al.. 2001); it stimulates growth, directly, through the
Growth Hormone Receptor (GHR) and indirectly by stimulating IGF-I expression (Sims
et al.. 2000). It also promotes bone formation (M aore t al.. 1993). and collagen
production (Sims et al.. 2000).
Insuline-like growth factor-I ( IG F-I) mediates most o f the effects o f GH. It is a
mitogen that stimulates the clonal expansion, and later the hyperthropy. o f the
chondrocytes (B ik le et al.. 1994). A ll chondrocytes layers produce IG F-I. and the one
produced by the lower layer o f the growth plate targets osteoblasts, and thus it is involved
in bone deposition (Reinecke et al.. 2000). IG F-I is especially important fo r growth in
uterus, when the fetus lacks GH (M ao re t al.. 1993). Moreover, a deficiency in IG F-I
results in hypoplasia o f different organs (Siebler et al.. 2001). Thus, although the
importance o f IG F -I for uterine growth coincides w ith the high number o f H L formed in
Reproduced with permission of the copyright owner. Further reproduction prohibited without permission.
129
uterus that were identified in this study, and therefore w ith Magennis's (1990) theory, the
problem is that i f IG F-I deficiency results in hypoplasia we should find EH associated
w ith HL.
Thyroid hormone (T^) and IGF-p also influence bone growth. Thyro id hormone (T^)
stimulates osteoblast activity, chondrocyte differentiation, and it is indispensable fo r
chondrocyte hypertrophy and vascular invasion o f the growth plate (Siebler et al.. 2001 ).
IGF-P enhances bone formation by intra-membranous ossification in v ivo (Seino. 1994).
None o f these factors or hormones, per se, can explain the increased bone deposition
and vascular invasion, and the decreased mitosis o f the progenitor chondrocytes,
associated w ith the appearance o f HL. Glucocorticoids (GC). however, stimulate
osteoblast activ ity and. therefore, bone production. Although it is apparent that IG F-I and
GH might mediate some o f its actions. GC stimulate insensitivity to GH and IG F-I. and
w ith that it reduces their expression (Siebler et al. 2001). Secretion o f GC may increase
w ith stress but studies in rats have shown no differences between the rats exposed to
stress and the control ones (B ik le et al.. 1994). Thus by stimulating osteoblast activ ity
and reducing GH sensitivity, and thus mitosis in the reserve layer. GC m ight be involved
in the appearance o f transverse lines. This does not mean that this is the on ly hormone
involved in the H L formation, and as long as bone growth at the endocrinological level is
not fu lly understood it is not possible to give a defin ite answer to this question. Further
studies and analysis o f these hormones and growth factors are needed as w e ll as other
studies in H L that may or may not agree w ith the results obtained here.
The purpose o f this study was to investigate the possible correlation between two
recognized stress indicators: Harris lines and enamel hypoplasia. The results indicate that
Reproduced with permission of the copyright owner. Further reproduction prohibited without permission.
130
there is no correlation. Instead, while EH corresponds to possible periods o f
environmental stress, and so it can be considered an indicator o f pathology. Harris lines
do not. Instead they correspond to periods o f growth. These results have important
implications fo r c lin ica l studies and studies in past populations. Future studies w ill not be
able to use H L as an indicator o f stress and therefore a proxy for health in past
populations. Since H L are most probably influenced by rate o f growth in an individual,
their formation at a hormonal and developmental level warrant further investigation.
Reproduced with permission of the copyright owner. Further reproduction prohibited without permission.
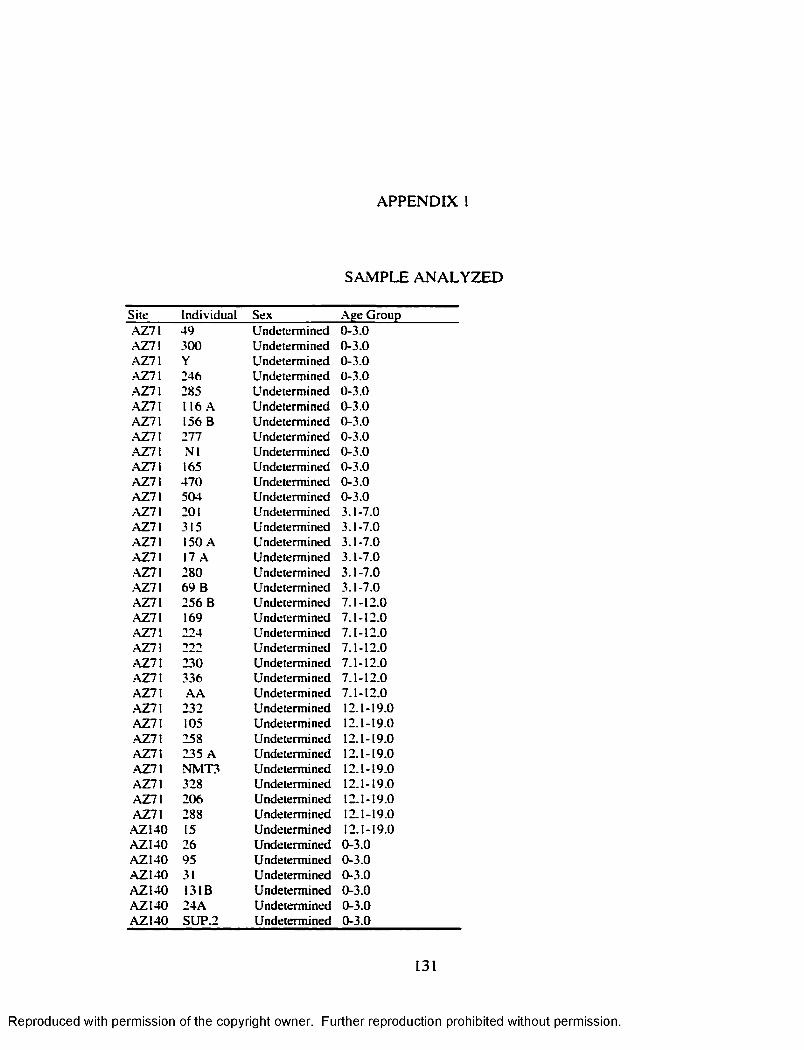
AP PE N D IX I
SAM PLE A N A L Y Z E D
S ite In d iv id u a l S ex A ge G ro u pA Z 7 \ 4 9 U n d ete rm in ed 0 -3 .0. \ Z 7 \ 3 00 U n dete rm ined 0 -3 .0A Z71 Y U n determ ined 0 -3 .0A Z 7 \ 246 U n dete rm ined 0 -3 .0A Z71 285 U n dete rm ined 0-3 .0A Z71 116 A U n determ ined 0-3 .0■AZ71 156 B U n d ete rm in ed 0 -3 .0.AZ7I 277 U n dete rm ined 0 -3 .0A Z 7 \ N l U n dete rm ined 0-3 .0A Z71 165 U n dete rm ined 0 -3 .0A Z 7I 4 7 0 U n dete rm ined 0 -3 .0AZ71 504 U n d ete rm in ed 0 -3 .0A Z 7 \ 201 U n dete rm ined 3 .1 -7 .0A Z 7 I 315 U n dete rm ined 3 .1 -7 .0AZ71 150 A U n d eterm in ed 3 .1 -7 .0•AZ71 17 A U n determ ined 3 .1 -7 .0A Z 7 I 28 0 U n dete rm ined 3 .1 -7 .0A Z 7 I 6 9 B U n d ete rm in ed 3 .1 -7 .0AZ71 25 6 B U n d ete rm in ed 7 .1 -12 .0A Z 7 I 169 U n d ete rm in ed 7 .1 -1 2 .0.AZ71 224 U n dete rm ined 7 .1 -12 .0A Z 7 \ 222 U n dete rm ined 7 .1 -12 .0•AZ71 2 30 U n d ete rm in ed 7 .1 -12 .0-AZ7I 336 U n d ete rm in ed 7 .1 -12 .0A Z 7 \ A A U n d eterm in ed 7 .1 -12 .0.AZ7I 2 32 U n dete rm ined 12.1-19.0A Z71 105 U n d ete rm in ed 12.1-19.0A Z 7 I 258 U n dete rm ined 12.1-19.0A Z71 2 35 A U n determ ined 12.1-19.0-AZ71 N M T 3 U n d ete rm in ed 12 .1-19.0A Z71 328 U n dete rm ined 12 .1-19.0A Z 7 I 2 0 6 U ndete rm ined 12 .1-19.0A Z 7 I 288 U n d ete rm in ed 12.1-19.0
A Z 140 15 U n d ete rm in ed 12 .1-19.0A Z I4 0 26 U n d ete rm in ed 0 -3 .0A Z I4 0 95 U n d ete rm in ed 0 -3 .0A Z 140 31 U n dete rm ined 0 -3 .0A Z I4 0 131B U n determ ined 0 -3 .0A Z I4 0 2 4 A U n d eterm in ed 0 -3 .0A Z 1 4 0 S U P 2 U n d e te rm in ed 0 -3 .0
131
Reproduced with permission of the copyright owner. Further reproduction prohibited without permission.
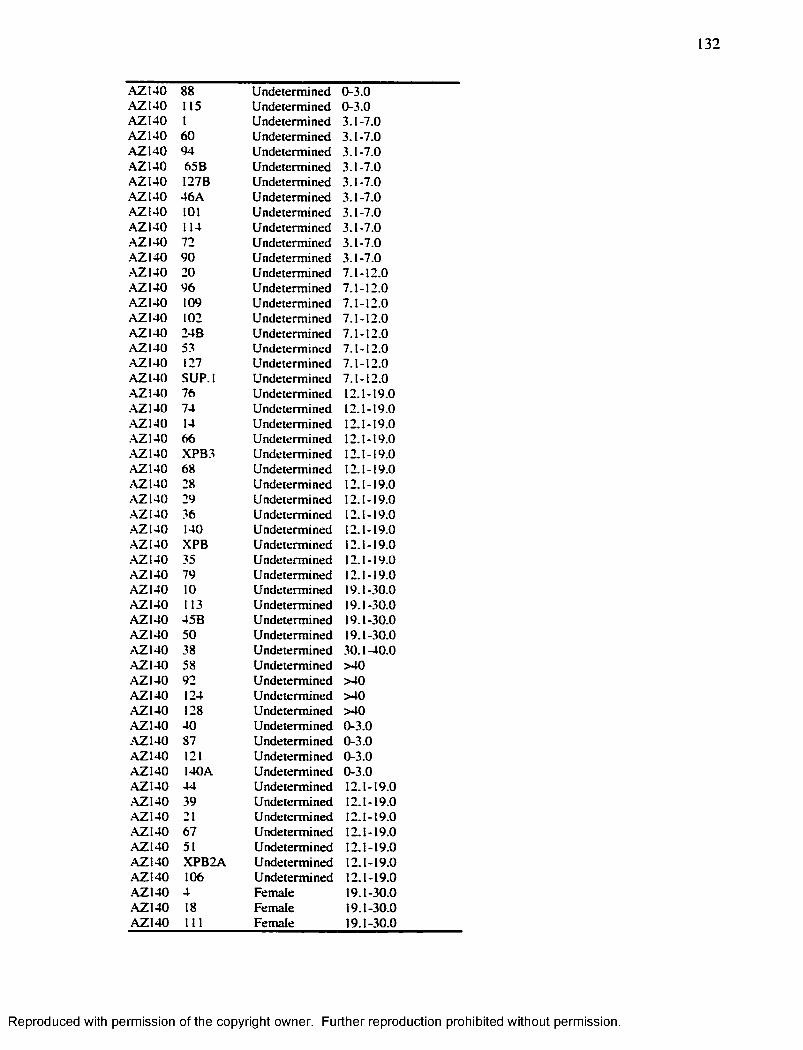
132
A Z 1 4 0 88 U n d e te rm in e d 0 -3 .0A Z I4 0 115 U n d e te rm in e d 0 -3 .0A Z 1 4 0 I U n d e te rm in e d 3 .1 -7 .0A Z I4 0 60 U n d e te rm in e d 3 .1 -7 .0A Z 1 4 0 94 U n d e te rm in e d 3 .1 -7 .0A Z 1 4 0 65B U n d e te rm in ed 3 .1 -7 .0A Z I4 0 I2 7 B U n d e te rm in e d 3 .1 -7 .0A Z I4 0 4 6 A U n d e te rm in ed 3 .1 -7 .0A Z 1 4 0 101 U n d e te rm in e d 3 .1 -7 .0A Z 1 4 0 114 U n d e te rm in e d 3 .1 -7 .0A Z 1 4 0 72 U n d e te rm in e d 3 .1 -7 .0A Z 1 4 0 9 0 U n d e te rm in e d 3 .1 -7 .0A Z I4 0 20 U n d e te rm in e d 7 .1 -1 2 .0A Z 1 4 0 9 6 U n d e te rm in ed 7 .1 -1 2 .0A Z I4 0 109 U n d e te rm in ed 7 .1 -1 2 .0A Z I4 0 102 U n d e te rm in e d 7 .1 -1 2 .0A Z 1 4 0 24B U n d e te rm in e d 7 .1 -1 2 .0A Z I4 0 53 U n d e te rm in ed 7 .1 -12 .0A Z 1 4 0 127 U n d e te rm in ed 7 .1 -1 2 .0A Z 1 4 0 S U P .l U n d e te rm in ed 7 .1 -1 2 .0•AZ140 76 U n d e te rm in ed 12.1-19 .0•AZ140 74 U n d e te rm in ed 12.1-19 .0A Z I4 0 14 U n d e te rm in ed 12.1-19.0A Z I4 0 66 U n d e te rm in ed 12.1-19.0A Z I4 0 X P B 3 U n d e te rm in ed 12.1-19.0A Z 140 68 U n d e te rm in ed 12.1-19 .0A Z 1 4 0 28 U n d e te rm in e d 12.1-19 .0.•\Z140 29 U n d e te rm in ed 12.1-19 .0•A ZI40 36 U n d e te rm in ed 12.1-19.0A Z I4 0 140 U n d e te rm in ed 12.1-19.0A Z I4 0 X PB U n d e te rm in e d 12.1-19 .0A Z I4 0 35 U n d e te rm in e d 12.1-19 .0A Z 140 79 U n d e te rm in ed 12.1-19 .0A Z 1 4 0 10 U n d e te rm in ed 19.1-30 .0A Z I4 0 113 U n d e te rm in ed 19.1-30 .0A Z I4 0 45 B U n d e te rm in ed 19.1-30.0A Z 1 4 0 50 U n d e te rm in e d 19.1-30 .0A Z I4 0 38 U n d e te rm in e d 3 0 .1 -4 0 .0A Z I4 0 58 U n d e te rm in e d > 4 0A Z 140 92 U n d e te rm in e d > 4 0A Z 1 4 0 124 U n d e te rm in e d > 4 0A Z I4 0 128 U n d e te rm in ed > 40A Z 1 4 0 4 0 U n d e te rm in ed 0 -3 .0A Z I4 0 87 U n d e te rm in e d 0 -3 .0A Z I4 0 121 U n d e te rm in e d 0 -3 .0A Z I4 0 140 A U n d e te rm in e d 0 -3 .0A Z I4 0 4 4 U n d e te rm in e d 12.1-19 .0A Z I4 0 39 U n d e te rm in e d 12.1-19 .0A Z I4 0 21 U n d e te rm in ed 12.1-19 .0A Z I4 0 67 U n d e te rm in e d 12.1-19 .0A Z I4 0 51 U n d e te rm in e d 12.1-19 .0A Z 1 4 0 X P B 2 A U n d e te rm in e d 12 .1-19 .0A Z I4 0 106 U n d e te rm in e d 12 .1-19 .0A Z I4 0 4 F em ale 19 .1-30 .0A Z I4 0 18 F em ale 19 .1-30 .0A Z I4 0 111 F em ale 19 .1-30 .0
Reproduced with permission of the copyright owner. Further reproduction prohibited without permission.

133
A Z 140 104 M ale 19 .1-30.0A Z I4 0 78 F em ale 19 .1-30.0A Z I4 0 116 F em ale 19 .1-30.0A Z 1 4 0 107 F em ale 19 .1-30.0A Z 1 4 0 118 F em ale 19 .1-30.0A Z 1 4 0 80 M ale 19 .1-30.0A Z 1 4 0 91 M ale 19 .1-30.0A Z 1 4 0 48 F em ale 19.1-30.0A Z 1 4 0 73 F em ale 30 .1 -40 .0A Z 140 X P B 4 F em ale 30 .1 -4 0 .0A Z I4 0 23 M ale 30 .1 -4 0 .0A Z I4 0 82 M ale 30 .1 -4 0 .0A Z I4 0 122 M ale 30 .1 -4 0 .0A Z 1 4 0 108A M ale 30 .1 -4 0 .0A Z 1 4 0 117 F em ale 30 .1 -40 .0A Z 140 8 F em ale 30 .1 -40 .0A Z 140 41 F em ale 3 0 .1 -40 .0A Z I4 0 100 F em ale 3 0 .1 -40 .0A Z 140 110 F em ale .30.1-40.0A Z 140 120 F em ale 3 0 .1 -40 .0A Z 140 75 M ale 30 .1 -40 .0A Z 1 4 0 97 M ale 30 .1 -40 .0A Z 1 4 0 64A M ale 30 .1 -40 .0A Z 1 4 0 47 F em ale 3 0 .1 -40 .0A Z 1 4 0 7 M ale >40A Z 1 4 0 55 M ale >40.■\ZI40 105 M ale >40A Z 140 5 F em ale >40A Z N O 32 F em ale >40A Z I4 0 56 Fem ale >40A Z I4 0 63 F em ale >40A Z I4 0 125 F em ale >40A Z I4 0 126 F em ale >40A Z 140 112A F em ale >40A Z 140 27 F em ale >40A Z I4 0 M M B F em ale > 40A Z 140 ■» U n d e te rm in ed 3.1-7 .0A Z I4 0 4 2B U n d e te rm in ed 0-3 .0A Z 7 I 271 U n d e te rm in ed 0-3 .0. \ Z 1 \ 6 04 U n d e te rm in ed 0 -3 .0
Reproduced with permission of the copyright owner. Further reproduction prohibited without permission.
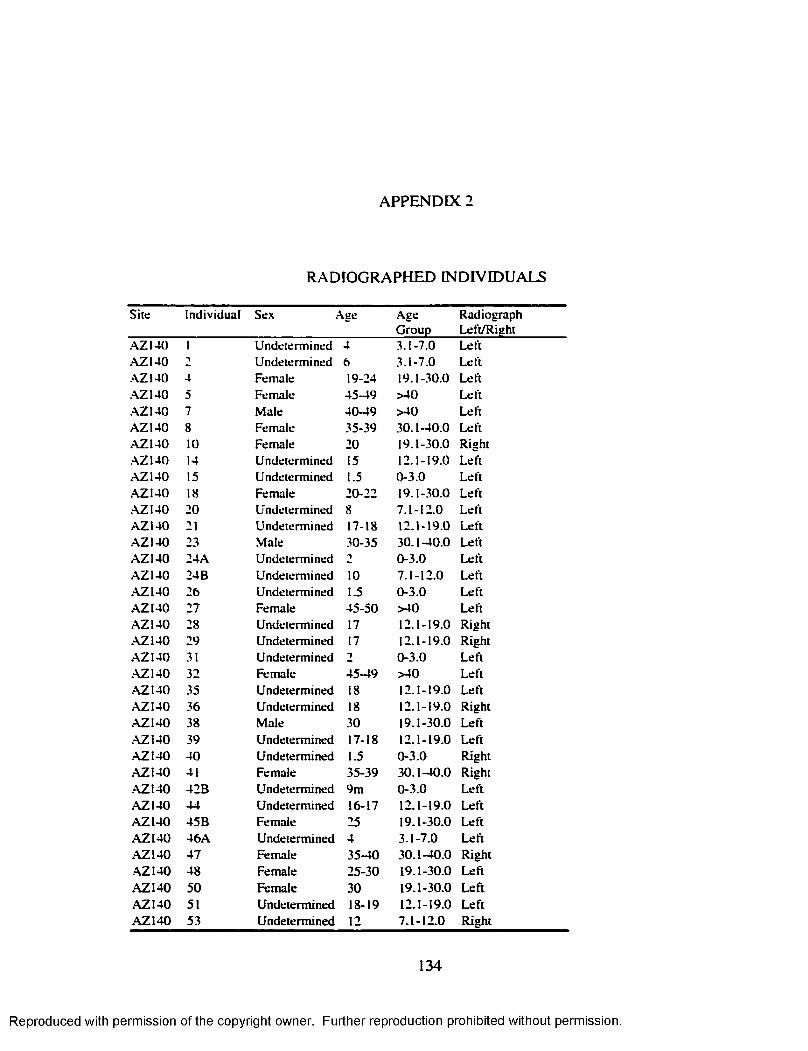
APPENDIX 2
RADIO G RAPH ED IN D IV ID U A LS
S ite In d iv id u a l S ex \ g e A geG ro u p
R ad iog raphL eft/R ig h t
A Z I4 0 I U n d eterm in ed 4 3 .1 -7 .0 L eftA Z 140 U n d e te rm in ed 6 3 .1 -7 .0 L eft.AZ140 4 F em ale 19-24 19 .1 -30 .0 L eftA Z 1 4 0 5 F em ale 45 -4 9 > 4 0 L eftA Z I4 0 7 M ale 40 -4 9 > 4 0 L eftA Z 1 4 0 8 F em ale 35-39 3 0 .1 -4 0 .0 L eftA Z I4 0 to F em ale 20 19 .1 -30 .0 R ightA Z 1 4 0 14 U n d e te rm in ed 15 12 .1 -19 .0 L eftA Z 1 4 0 15 U n d e te rm in ed 1.5 0 -3 .0 L eftA Z 1 4 0 18 F em ale 20-22 19 .1 -30 .0 L eftA Z 1 4 0 20 U n d ete rm in ed 8 7 .1 -1 2 .0 L eftA Z 1 4 0 21 U n d e te rm in ed 17-18 1 2 .1 -19 .0 L eftA Z 1 4 0 23 M ale 30-35 3 0 .1 -4 0 .0 L eftA Z 1 4 0 24A U n d e te rm in ed 1 0 -3 .0 L eftA Z I4 0 24B U n d e te rm in ed 10 7 .1 -1 2 .0 L eftA Z 140 26 U n d ete rm in ed 1.5 0 -3 .0 L eftA Z I4 0 27 F em ale 4 5 -5 0 > 4 0 L eftA Z 1 4 0 28 U n d ete rm in ed 17 12 .1 -19 .0 R ightA Z 1 4 0 29 U n d ete rm in ed 17 12 .1 -19 .0 R ightA Z 1 4 0 31 U n d e te rm in ed 0 -3 .0 L eftA Z 1 4 0 32 F em ale 45 -4 9 > 4 0 L eftA Z 140 35 U n d e te rm in ed 18 12 .1 -19 .0 L eftA Z I4 0 36 U n d e te rm in ed 18 12 .1 -19 .0 R igh tA Z 1 4 0 38 M ale 30 19 .1 -30 .0 L eft•AZ140 39 U n d ete rm in ed 17-18 12 .1 -19 .0 L eftA Z I4 0 4 0 U n d e te rm in ed 1.5 0 -3 .0 R igh tA Z 1 4 0 41 F em ale 35-39 3 0 .1 -4 0 .0 R ightA Z I4 0 4 2B U n d e te rm in ed 9m 0 -3 .0 L eftA Z I4 0 4 4 U n d e te rm in ed 16-17 12 .1 -19 .0 L eftA Z I4 0 4 5 B F em ale 25 19 .1 -30 .0 L eftA Z I4 0 4 6 A U n d e te rm in ed 4 3 .1 -7 .0 L eftA Z I4 0 4 7 F em ale 35-40 3 0 .1 -4 0 .0 R igh tA Z 1 4 0 48 F em ale 2 5 -3 0 1 9 .1 -30 .0 L eftA Z 1 4 0 5 0 F em ale 30 1 9 .1 -30 .0 L e ftA Z 1 4 0 51 U n d e te rm in ed 18-19 1 2 .1 -19 .0 L e ftA Z 1 4 0 53 U n d e te rm in ed 12 7 .1 -1 2 .0 R igh t
134
Reproduced with permission of the copyright owner. Further reproduction prohibited without permission.
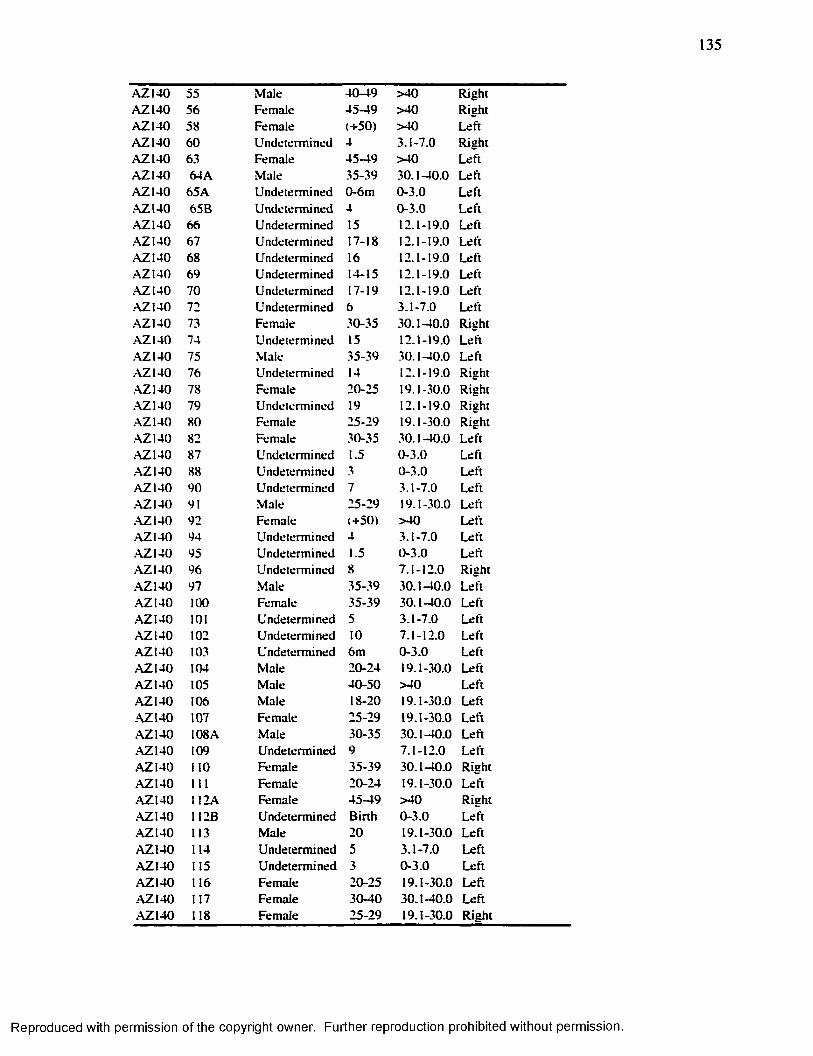
135
A Z 1 4 0 55 M ale 4 0 -4 9 > 4 0 R igh tA Z 1 4 0 56 F em ale 4 5 -4 9 > 4 0 R igh tA Z 1 4 0 58 F em ale (+ 5 0 ) > 4 0 L eftA Z 1 4 0 6 0 U n d e te rm in ed 4 3 .1 -7 .0 R igh tA Z 1 4 0 63 Fem ale 4 5 -4 9 > 4 0 L eftA Z 1 4 0 64A M ale 35-39 30 .1 -40 .0 L eftA Z 140 65A U n d e te rm in ed 0 -6 m 0 -3 .0 L eftA Z I4 0 65B U n d e te rm in ed 4 0 -3 .0 L eftA Z 140 66 U n d e te rm in ed 15 12.1-19.0 L eftA Z I4 0 67 U n d e te rm in ed 17-18 12.1-19.0 L eftA Z I4 0 68 U n d e te rm in ed 16 12.1-19.0 L eftA Z I4 0 69 U n d e te rm in ed 14-15 12 .1-19.0 L eftA Z 140 70 U n d e te rm in ed 17-19 12 .1-19.0 L eftA Z 140 72 U n d e te rm in ed 6 3 .1 -7 .0 L eft.\Z 1 4 0 73 F em ale 30-35 30 .1 -40 .0 R ightA Z 140 74 U n d e te rm in ed 15 12.1-19.0 L eftA Z 140 75 M ale 35 -3 9 30 .1 -40 .0 L eftA Z 140 76 U n d e te rm in ed 14 12.1-19.0 R ightA Z 140 78 F em ale 20-25 19 .1-30.0 R ight.\Z 1 4 0 79 U n d e te rm in ed 19 12.1-19.0 R igh t.\Z 1 4 0 80 F em ale 25-29 19.1-30.0 R ightA Z 140 82 F em ale 30-35 30 .1 -40 .0 L eftA Z 140 87 U n d e te rm in ed 1.5 0 -3 .0 Left•AZ140 88 U n d e te rm in ed 3 0 -3 .0 L eftA Z 140 90 U n d e te rm in ed 7 3 .1 -7 .0 L eftA Z 140 91 M ale 25-29 19.1-30.0 L eft.■\Z140 92 F em ale (+ 5 0 ) > 4 0 L eftA Z 140 94 U n d e te rm in ed 4 3 .1 -7 .0 L eftA Z I4 0 95 U n d e te rm in ed 1.5 0 -3 .0 L eftA Z 140 96 U n d e te rm in ed 8 7 .1 -1 2 .0 R ightA Z 140 97 M ale 35 -39 30 .1 -40 .0 L eftA Z 140 100 F em ale 35 -3 9 30 .1 -40 .0 L eftA Z Ï4 0 101 U n d e te rm in ed 5 3 .1 -7 .0 L eftA Z I4 0 102 U n d e te rm in ed 10 7 .1 -12 .0 L eftA Z 1 4 0 103 U n d e te rm in ed 6m 0 -3 .0 L eftA Z 1 4 0 104 M ale 2 0 -2 4 19.1-30.0 L eftA Z I4 0 105 M ale 4 0 -5 0 > 4 0 L eftA Z 1 4 0 106 M ale 18-20 19.1-30.0 L eftA Z 1 4 0 107 F em ale 25-29 19 .1-30.0 L eftA Z I4 0 108 A M ale 30 -3 5 3 0 .1 -40 .0 L eftA Z 140 109 U n d e te rm in ed 9 7 .1 -1 2 .0 L eftA Z 140 110 F em ale 35 -3 9 30 .1 -40 .0 R igh tA Z I4 0 111 F em ale 2 0 -2 4 19.1-30.0 L eftA Z 140 112A F em ale 4 5 -4 9 > 4 0 R igh tA Z I4 0 112B U n d e te rm in ed B irth 0 -3 .0 L eftA Z 140 113 M ale 20 19.1-30.0 L eftA Z 1 4 0 114 U n d e te rm in ed 5 3 .1 -7 .0 L e ftA Z I4 0 115 U n d e te rm in ed 3 0 -3 .0 L eftA Z I4 0 116 F em ale 2 0 -2 5 19 .1-30 .0 L eftA Z I4 0 117 F em ale 3 0 -4 0 3 0 .1 -40 .0 L eftA Z 140 118 F em ale 2 5 -2 9 19 .1-30.0 R igh t
Reproduced with permission of the copyright owner. Further reproduction prohibited without permission.

136
A Z I4 0 119 U n d e te rm in ed 4 -6 m 0 -3 .0 L eftA Z 1 4 0 120 F em ale 35-39 3 0 .1 -4 0 .0 L eftA Z 1 4 0 121 U n d e te rm in e d 1 3 0 -3 .0 L eftA Z 1 4 0 122 M ale 30-35 30 .1 -40 .0 L eftA Z 1 4 0 123 U n d e te rm in ed B irth 0 -3 .0 R igh tA Z 1 4 0 124 F em ale (+ 5 0 ) >40 L eftA Z 140 125 F em ale 4 5 -4 9 > 40 L eftA Z 140 126 F em ale 4 5 -4 9 > 40 L eftA Z 1 4 0 127 U n d e te rm in ed 12 7 .1 -1 2 .0 R igh tA Z 1 4 0 127B U n d e te rm in ed 4 3 .1 -7 .0 L eftA Z 1 4 0 128 M ale (+ 5 0 ) > 40 L eftA Z 140 131 U n d e te rm in ed 6m 0 -3 .0 L eftA Z I4 0 131A U n d e te rm in ed B irth 0 -3 .0 L eftA Z 140 13 IB U n d e te rm in ed ■> 0 -3 .0 L eftA Z I4 0 140 U n d e te rm in ed 18 12.1-19.0 L eftA Z I4 0 M M B F em ale 4 5 -5 0 >40 L eftA Z 1 4 0 S U P .l U n d e te rm in ed 12 7 .1 -12 .0 L eft.AZ140 S U P .2 U n d e te rm in ed t 0 -3 .0 L eftA Z 140 X PB U n d e te rm in ed 18 12.1-19.0 R igh tA Z 140 X P B 2 A U n d e te rm in ed 18-19 12 .1-19.0 L eftA Z I4 0 X P B 2 B U n d e te rm in ed B irth 0 -3 .0 L eftA Z I4 0 X P B 3 U n d e te rm in ed 15 12.1-19.0 L eftA Z 140 X P B 4 F em ale 30-35 3 0 .1 -4 0 .0 L eftA Z 140 140 A U n d e te rm in ed 1.5 0 -3 .0 R ightA Z 7 \ 8 U n d e te rm in ed 0 -6 m 0 -3 .0 L eftA Z 7 I 17 A U n d e te rm in ed 5 3 .1 -7 .0 L eftAZ71 36 U n d e te rm in ed U nborn U nborn L eftA Z 7 I 48 U n d e te rm in ed B irth 0 -3 .0 L eftA Z71 49 U n d e te rm in ed t 0 -3 .0 L eft.AZ7I 69 B U n d e te rm in ed 7 3 .1 -7 .0 L eft•AZ7I 105 U n d e te rm in ed 16 12.1-19.0 L eft.AZ71 1 1 6 A U n d e te rm in ed 1.5 0 -3 .0 L eftA Z71 150 A U n d e te rm in ed 4 3 .1 -7 .0 L eftA Z 7 I 156 B U n d e te rm in ed 1.5 0 -3 .0 L eftA Z 7 I 165 U n d e te rm in ed 3 0 -3 .0 L eftA Z71 168 U n d e te rm in ed 0 -6 m 0 -3 .0 L eftA Z 7 I 169 U n d e te rm in ed 9 7 .1 -1 2 .0 L eftA Z 7 I 188 U n d e te rm in ed U nborn U nborn L eftA Z 7 I 201 U n d e te rm in e d 4 3 .1 -7 .0 L eftA Z 7 I 2 06 U n d e te rm in ed 16-18 12 .1-19.0 L eftA Z71 2 19 U n d e te rm in ed 6 -1 2 m 0 -3 .0 R igh tA Z71 U n d e te rm in ed 10 7 .1 -1 2 .0 L eftA Z71 22 4 U n d e te rm in ed 9 7 .1 -1 2 .0 L eftA Z 7 I 23 0 U n d e te rm in ed 10 7 .1 -1 2 .0 L eftA Z 7 I 23 2 U n d e te rm in ed 15 12.1-19 .0 L eftA Z 7 I 2 3 5 A U n d e te rm in ed 18 12.1-19.0 L eftA Z71 241 U n d e te rm in ed 0 -6 m 0 -3 .0 L eftA Z71 2 46 U n d e te rm in ed 1 3 0 -3 .0 L eftA Z 7 I 2 5 6 B U n d e te rm in ed 8 3 .1 -7 .0 L eftA Z 7 I 258 U n d e te rm in ed 17 12.1-19 .0 L eft
A Z71 271 U n d e te rm in ed 1 0 -3 .0 L eft
Reproduced with permission of the copyright owner. Further reproduction prohibited without permission.
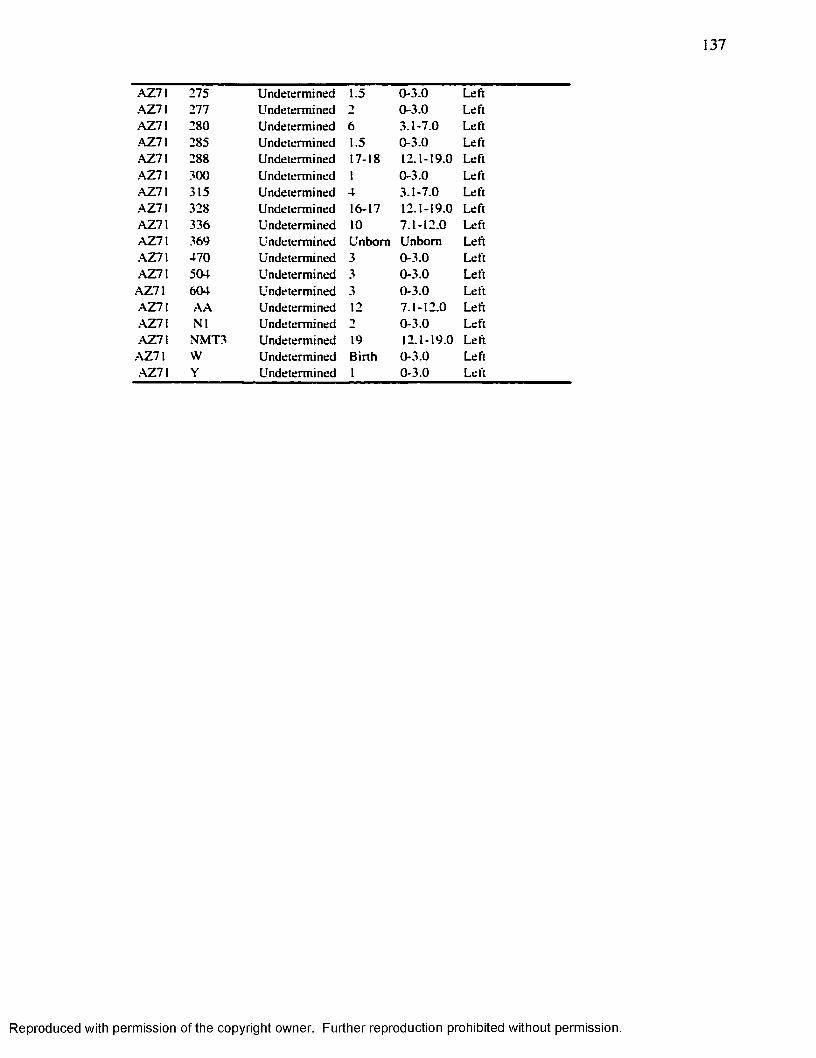
137
A Z71 275 U n d e te rm in ed 1.5 0 -3 .0 L eftA Z 7 I 277 U n d e te rm in ed 2 0 -3 .0 L eftA Z71 2 80 U n d ete rm in ed 6 3 .1 -7 .0 L eftA Z71 285 U n d ete rm in ed 1.5 0 -3 .0 L eftA Z71 288 U n d ete rm in ed 17-18 12 .1 -19 .0 L eftA Z 7 I 300 U n d ete rm in ed 1 0 -3 .0 L eftA Z71 315 U n d ete rm in ed 4 3 .1 -7 .0 L eftA Z 7 I 328 U n d ete rm in ed 16-17 12 .1 -19 .0 L eftA Z71 336 U n d e te rm in ed 10 7 .1 -1 2 .0 L eftA Z71 369 U n d ete rm in ed U n b o rn U n b o rn L eft. \ Z 7 \ 4 7 0 U n d ete rm in ed 3 0 -3 .0 L eft.AZ7I 504 U n d ete rm in ed 3 0 -3 .0 L eft
A Z71 604 U n d ete rm in ed 3 0 -3 .0 L eftA Z71 A A U n d ete rm in ed 12 7 .1 -1 2 .0 L eftA Z71 N I U n dete rm ined 1 0 -3 .0 L eft-AZ71 N M T 3 U n d eterm in ed 19 12 .1 -19 .0 L eft
A Z 7 I W U n d e te rm in ed B irth 0 -3 .0 L eftA Z 7 \ Y U n determ ined 1 0 -3 .0 L eft
Reproduced with permission of the copyright owner. Further reproduction prohibited without permission.
REFERENCES C ITED
Acheson RM . 1959 Effects o f Starvation, Septicaemia and Chronic Illness on the Growth Cartilage Plate and Metaphysis o f the Immature Rat. Journal o f Anatomy 93: 123-130.
Acsddi G Y . Nemeskeri J. 1970 History o f Human L ife Span and M orta lity . Akadémiai Kiadô. Budapest.
A llison MJ. Mendoza D. Pezzia A . 1974 A Radiographic Approach to Childhood Illness in Precolumbian Inhabitants o f Southern Peru. Am . J. Phys. Anthropol. 40:409-416.
Alvarez JO, Navia JM . 1989 Nutritional Status, Tooth Eruption, and Dental Caries: A review. Am . J. C lin . N utrition 49: 417-429.
Anderson M , Green W T, Messner M B. 1963 Growth and Prediction o f Growth in the Lower Extremities. J. Bone and Joint Surgery 45-A ( I) : 1-14.
Baxter RC. 1986 The Somatomedins: Insuline-Like Growth Factor. Adv. C lin . Chem. 25: 49-115.
Berenguer J. 1975 Aspectos Diferenciales de la Influencia Tiahuanaco en Chile. Tesis de Licenciatura en Antropologfa y Prehistoria. Universidad de Chile. Santiago, Chile. (D ifferentia l Aspects o f the Tiahuanaco Influence in Chile. Thesis submitted in partial fu lfillm ent o f the requirements for the degree o f Bachelor in Anthropology and Prehistory. University o f Chile. Santiago, Chile).
Berenguer J, Dauelsberg P. 1989 El Norte Grande en la O rbita de Tiwanaku. (400-1200 d.C.). ( The Big North under the O rb it o f Tiwanaky 400-1200A D ). In: Aldunate C, et al., editors. Culturas de Chile. Prehistoria. Desde sus Ongenes Hasta los Albores de la Conquista (Cultures o f Chile. Prehistory. From its Origins until the Beginning o f the Spanish Conquest). Andrés Bello, Santiago, Chile. P 129-180.
Berkovitz B K , Moxham BJ. 1989 Tissue Changes During Tooth Eruption. In: Oksche A , Vollrath L, editors. Teeth. Springer-Berlag. Berlin, Germany, p 21-71.
Berti PR, Mahaney M C . 1992 Quantification O f The Confidence Intervals For Linear Enamel Hypoplasia In: Goodman A H , Capasso L L , editors. Chronologies. Recent Contributions To The Study O f Enamel Developmental Defects J. Paleopathol., Monographic Publications, 2. p 19-30.
138
Reproduced with permission of the copyright owner. Further reproduction prohibited without permission.
139
Bickle DD , Halloran BP, M orey-Holton E. 1994 Impact o f Skeletal Unloading on Bone Formation: Role o f Systemic and Local Factors. Acta Astronaut. 33: 119-129.
Blakeley M L , Armelagos GJ. 1985 Deciduous Enamel Defects In Prehistoric Americas From Dickson Mounds: Prenatal and postnatal Stress. Am . J. Phys. Anthropol. 66: 371- 380.
Bogin B. 1999 Patterns o f Human G rowth. Cambridge University Press.
Boyde A . 1989 Enamel. In: Oksche A , V o llra th L , e d ito r . Teeth. Springer-Berlag, Berlin, Germany, p 309-473.
Brooks ST, Suchey JM. 1990 Skeletal Age Determination Based On The OS Pubis: A Comparison O f The Acsddi-Neméskeri and Suchey and Brooks Methods. Human Evolution 5: 227-238.
Buckwalter JA, M ower D, Schafer J, Ungar R, Ginsberg G, Moore K. 1985 G row th- Plate-Chondrocyte Profiles and their Orientation. The Journal o f Bone and Joint Surgery 67A: 942-955. '
Buikstra JE, Cook DC. 1980 Paleopathology: An American Account. Ann. Rev. Anthropol. 9: 433-470.
Buikstra JE, M ielke JH. 1985 Demography. D iet, and Health. In: G ilbert R I, M ie lke JH, editors. The Analysis o f Prehistoric Diets, p 359-422.
Buikstra JE, Ubelaker D. 1994 Standards fo r Data Collection from Human Skeletal Remains. Arkansas Archaeological Survey Research Series No. 44.
Byers S. 1991 Technical Note: Calculation o f age at Formation o f Radiopaque Transverse Lines. Am . J. Phys. Anthropol. 85: 339-343.
Clark G A , Mack M . 1988 R e liab ility and Assessment o f Transverse Lines. Human B iology 60 (2): 283-291.
Clarke SK. 1982 The Association o f Early Childhood Enamel Hypoplasias and Radiopaque Transverse Lines in C u ltu ra lly Diverse Prehistoric Skeletal Samples. Human B io logy 54 ( 1 ): 77-84.
Clarkson J. 1989 Review o f Term inology, Classifications, and Indices o f Developmental Defects o f the Enamel. Adv. Dent. Res. 3 (2): 104-109.
Cohen M N , Armelagos GJ (eds). 1984 Paleopathology at the Origins o f Agricu lture. Academic Press Inc., USA.
Reproduced with permission of the copyright owner. Further reproduction prohibited without permission.
140
Cook DC, Buikstra JE. 1979 Health and D ifferentia l Survival In Prehistoric Populations: Prenatal Dental Defects. Am . J. Phys. Anthropol. 51: 649-664.
Condon K. Rose JC. 1992 Inter Tooth And Intra Tooth V a riab ility in the Occurrence o f Developmental Enamel Defects. In: Goodman A H , Capasso L L , editors. Recent Contributions to the Study o f Enamel Developmental Defects. J. Paleopathol. Monographic Publications 2. p 61-77.
Cormack, DH. 2001 Essential H istology. L ippincott W illiam s & W ilk ins , USA.
Corrucini R S. Handler JS, Jacobi KP. 1985 Chronological D istribution o f Enamel Hypoplasia and Weaning in a Caribbean Slave Population. Human B io logy 57 (4): 699- 711.
Dauelsberg P. 1992-1993 Prehistoria de Arica. Dialogo Andino 11/12: 9-31. Universidad de Tarapacâ. Arica, Chile.
Daunter B. Forber K L , Sanderson BM . Morrison J, W right G. 1992 Inhib ition o f B inding Bacteria to Am inochorionic Membranes by Am niotic Fluid. Eur. J. Obstet Gynecol. Reprod. B io l 47 (2): 95-102.
Dean M C. 1987 Growth layers and incremental markings in hard tissue. A review o f the literature and some prelim inary observations about enamel structure in Paranthropus boisei. J. Human Evol. 16: 157-172.
Dreizen S. Currie C, G illey EJ. Spies TD . 1956 Observation on the Association between Nutritive Failure. Skeletal Maturation Rate and Radiopaque Transverse Lines in the Distal End o f the Radius in Children. Am . J. Roentology, Radium Therapy and Nuclear Medicine 68: 709-723.
Dreizen S, Spirakis CN. Stone RE. 1964 The Influence o f Age and Nutritional Status on “ Bone Scar” Formation in the Distal End o f the G row ing Radius. Am . J. Phys.Anthropol. 22: 295-305.
Ensor BE, Irish JD. 1995 Hypoplastic Area Method fo r Analyzing Dental Enamel Hypoplasia. Am . J. Phys. Anthropol. 98: 507-517.
E li I, Samat H. Ta lm i E. Judges H. 1986 The W idth o f the Neonatal L ine in the Primary Enamel and its Use as a Possible Diagnostic Tool in Developmental Disturbances. J. Dent. Res. 65: 256.
E li I. Samat H, Ta lm i E. 1989 Effect o f the B irth Process on the Neonatal L ine in Primary Tooth Enamel. Ped. Dent. 11 (3): 220-224.
E llio t M M , Souther SP, Park EA. 1927 Transverse Lines in X -R ay Plates o f the Long Bones o f Children. B u ll. Johns Hopkins Hosp. 41: 364-388.
Reproduced with permission of the copyright owner. Further reproduction prohibited without permission.
141
Focacci G. 1982 Nue vos Fechados para la Epoca del Tiahuanaco en la Arqueologfa del Norte de Chile (New Dates fo r the Tiahuanaco Phase in the Archaeology o f Northern Chile). Chungara 8: 63-77.
1990 Excavaciones Arqueologicas en el Cementerio AZ-6 Valle de Azapa. 1* Parte. Ease Cabuza (Archaeological Excavaions in the Az-6 Cemetery. Part 1. Cabuza Phase). Chungara 24/25: 69-123. Universidad de Tarapacâ, Arica.
Gam SM, Schawger PM. 1967 Age Dynamics o f Persistent Transverse Lines in the T ibia. Am . J. Phys. Anthropol. 27: 375-378.
Gam SM, Silverman FN. Hertzog KP. Rohmann CG. 1968 Lines and Bands o f Increased Density. Medical Radiography and Photography 44(3): 58-89.
Gindhart PS. 1969 The Frequency o f Appearance o f Transverse Lines in the T ib ia in Relation to Childhood Illnesses. Am . J. Phys. Anthropol. 31: 17-22.
1973 Growth Standards fo r the T ib ia and Radius in Children Aged One Month through Eighteen Years. Am J. Phys. Anthropol. 39: 41-48.
G iro C M . 1947 Enamel Hypoplasia in Human Teeth: An Examination o f its Causes. The Joumal o f American Dental Association 34: 310-317.
Goldstein P. 1995-1996 Tiwanaku Settlement Pattems o f the Azapa Valley. Chile: New Data and the Legacy o f P. Dauelsberg. Didlogo Andino 14/15: 57-73.
Gonzalez-Reimers E. Santoralia-Femdndez E. Moreno-Garcia A . Batista-Ldpez N. Rodnguez-Moreno E. 1993 Harris Lines and Ethanol Consumption During Growth Period. Int. J. Anthropol. 8 (1 ): 21-25.
Goodman A H. M artin DL. Armelagos GJ. Clark G. 1984 Indicators o f Stress from Bone and Teeth. In: Cohen M N . Armelagos GJ. editors. Paleopathology at the Origins o f Agriculture. Academic Press Inc. USA. p 13-49
Goodman A H . Armelagos GJ. 1985 The Chronological D istribution o f Enamel Hypoplasia in Human Permanent Incisor and Canine. Archs. Oral B io l. 30 (6): 503-507.
Goodman A H . Thomas RB. Swedlund AC . Armelagos GJ. 1988 Biocultural Perspectives on Stress in Prehistoric. Historical and Contemporary Population Research. Yearbook o f Physical Anthropology 31: 169-202.
Goodman A H . Rose JCJ. 1990 Assessment o f Systematic Physiological Perturbations from Dental Enamel Hypoplasias and Associated H istio logica l Structures. Year Book o f Physical Anthropology 33: 59-110.
Reproduced with permission of the copyright owner. Further reproduction prohibited without permission.
142
Goodman A H , Martinez C. Chavez A . 19 9 1 N utritiona l Supplementation and the Development o f Linear Enamel Hypoplasias in Children from Tezoteopan, Mexico. Am . J. C lin . Nutr. 53: 773-781.
Goodman A H . 1996 Early L ife Stresses and A du lt Health: Insights from Dental Enamel Development. In: Henry CJK, Ulijaszek SJ, editors. Long-term Consequences o f Early Environment. Growth, Development, and the Lifespan Developmental Perspective, p 163-182.
Green H. M orikaw a M , N ixon T. 1985 A Dual E ffector Theory o f Growth-Hormone Action. D ifferentiation 29: 195-198.
Groulleau-Raoux JL, Crubezy E.. Rouge D. Brugne JF. Saunders SR. 1997 Harris Lines: A Study o f Age-Associated Bias in Counting an Interpretation. Am . J. Phys. Anthropol. 103: 209-217.
Gruenwald P. 1973 Disturbed Enamel Formation in Deciduous Tooth Germs. Archives o f Pathology 95: 165-171.
Hals E. 1962 Dentin and Enamel Anomalies: H isto log ic Observations. In: Genetics and Dental Health: Proceedings o f an International Symposium, held at the National Institutes o f Health. Bethesda. M cGraw & G ill. USA. p 246-260.
Hanson LA . 2000 The M other-O ffspring Dyad and the Immune System. Acta Paediatr.89 (3): 252-258.
Harris H A . 1931 Lines o f Arrested Growth in the Long Bones o f Childhood: Correlation o f H istio logical and Radiographic Appearances in C lin ica l and Experimental Conditions. B r.J . Radiol. 31: 17-22.
Hatch JW . W illey PS. Hunt EE. 1983 Indicators o f Status-Related Stress in Dallas Society: Transverse Lines and Cortical Thickness in Long Bones. M idcontinental Journal o f Archaeology 8: 49-71.
Hew itt D. Westropp C K . Acheson RM. 1955 O xford C h ild Health Survey Effect on Child ish A ilm ents on Skeletal Development. B rit. J. Prev. Soc. Med. 9:179-186.
H illson S. 1996 Dental Anthropology. Cambridge University Press.
H illson. S. Bond S. 1997 Relation o f Enamel Hypoplasia to the Pattern o f Tooth Crown Growth: A Discussion. Am . J. Phys. Anthropol. 104: 89-103.
Hodges DC, W ilk inson RG. 1990 Effect o f Tooth Size on the Ageing and Chronological D istribution o f Enamel Hypoplastic Defects. Am . J. Human B io l. 2: 553-560.
Reproduced with permission of the copyright owner. Further reproduction prohibited without permission.
143
Hôhling HJ. 1989 Special Aspects o f B iom ineralizatin o f Dental Tissues. In: Oksche A , Vo llra th L. editors. Teeth. Springer-Berlag, Berlin , Germany, p 475-524.
Hummert JR, Van Gerven DP. 1985 Observations o f the Formation and Persistence o f Radiopaque Transverse Lines. Am . J. Phys. Anthropol. 66: 297-306.
Hunt EE, Hatch JW. 1981 The Estimation o f Age at Death and Ages at Formation o f Transverse Lines from Measurements o f Human Long Bones. Am . J. Phys. Anthropol.54: 461-469.
Hunzinker EB. 1988 G rowth Plate Structure and Function. Pathol. Immunopathol. Res. 7: 9-13.
Huss-Ashmore R, Goodman A H . Armelagos G. 1982 Nutritional Inference from Paleopathology. In: Schiffer M B . editor. Advances in Archaeological Method and Theory. 5. Academic Press. New York. U.S.A. p 395-474.
Kelleher SL. Lonnerdal B. 2001 Immunological Activ ities Associated w ith M ilk . Adv. Nutr. Res. 10: 39-65.
Keller C. 1946 El Departamento de Arica. M inisterio de Economfa y Comercio. ( The Department o f Arica. National O ffice o f Economy and Commerce). Santiago. Chile.
Kelley. M . A. and C. S. Larsen. 1991 Standards o f Human Tooth Formation and Dental Age Assessment. In: K e lly M A . Larsen CS. editors. Advances in Dental Antrhopology. W illey-L iss Inc. p 143-168.
Krogman W M . Iscan M Y . 1989 The Human Skeleton in Forensic Medicine. Charles C. Thomas. Springfield. Illino is .
Kronfeld R. Schour I. 1939 Neonatal Dental Hypoplasia. J. Am . Dent. Assoc. 26: 18-32.
Larsen CS. 1987 Bioarchaeological Interpretations o f Subsistence Economy and Behavior from Human Skeletal Remains. In: Schiffer M B . editor. Advances in Archaeological Method and Theory. 10. Academic Press. USA. p 339-445.
La Velle M . 1995 Natural Selection and Developmental Sexual Variation in the Human Pelvis. Am . J. Phys. Anthropol. 98: 59-72.
Levine RS. Keen JH. 1974 Neonatal Hypoplasia in Association w ith Symptomatic Neonatal Hypocalcemia. B ritish Dental Joumal 137:429-433.
Levine RS. Turner EP. Dobbing J. 1979 Deciduous Teeth Contain Histories o f Developmental Disturbances. Early Human Development 3/2: 211-220.
Reproduced with permission of the copyright owner. Further reproduction prohibited without permission.
144
Lewis M . 2000 N on-Adult Paleopathology. Current Status and Future Potential. In: Cox M , Mays S, editors. Osteology in Archaeology and Forensic Sciences, p 39-57.
Lindahl A . Isgaard J. Carlsson L. Isaksson OGP. 1987 D ifferentia l Effects o f Growth Hormone and Insuline-Like Growth Factor I on Colony Formation o f Epiphyseal Chondrocytes in Suspension Culture in Rats o f D ifferent Ages. Endocrinology 12 (3): 1061-1069.
L ittle M . 1995 Adaptation, .Adaptability, and M ultid isc ip linary Research. In: Boas N T. W olfe LD . editors. B iological Anthropology. The State o f Science. International Institute o f Human Evolutionary Research. Central Oregon University, p 121-145
Lobdell JF. 1984 Harris Lines: Markers o f Nutrition and Disease at Prehistoric U tqiaguik V illage. A rtie Anthropology 21 (1): 109-116.
Loth. SR. Hennenberg M. 2001 Sexually D imorphic Mandibular Morphology in the First Few Years o f L ife . Am J. Phys Anthropol. 115: 179-186.
Lukacs JR. 1989 Dental Paleopathology: Methods for Reconstructing Dietary Pattems.In: Iscan M Y . Kennedy KA R . editors. Reconstruction o f L ife from the Skeleton. Alan R. Liss Inc. p 261 -282.
Lumbreras LG. 1981 Arqueologfa de la America Andina (Andean America Archaeology). M illa Batres Ed. Lima.
Maat GJR. 1984 Dating and Rating o f Harris Lines. Am . J. Phys. Anthropol 63: 291-299.
Macchiarelli R. Bondoli L. Censi L. Hemdndez M K . Salvadei L . Sperduti A . 1994 Intra and Interobserver Concordance in Scoring Harris Lines: A Test on Bone Sections and Radiographs. Am . J. Phys. Anthropol. 95: 77-83.
Magennis A L . 1990 Growth and Transverse Line Formation in Contemporary Children. Dissertation, U. o f Massachusetts in Partial Fulfillm ent o f the Requirements for the Degree o f Doctor o f Philosophy.
M aor G, Hochberg Z. Silbermann M . 1993 Insuline-like G rowth Factor-I Accelerates the Proliferation and D ifferentiation o f Cartilage Progenitor Cells in Cultures o f Neonatal Mandibular Condyles. Acta Endocrinol. (Copehn) 128 (1); 56-64.
Maresh M . 1955 Linear G rowth o f Long Bones o f Extremities from Infancy through adolescence. Am . J. Dis. Child. 89: 725-742.
Marshall W A . 1968 Problems in Relating the Presence o f Transverse Lines in the Radio to the Occurrence o f Disease. In: Brothwell DR, editor. Symposia o f the Society o f the Study o f Human B iology, V o l. 8. New York, p 245-261
Reproduced with permission of the copyright owner. Further reproduction prohibited without permission.
145
M artin D L , Goodman A H . Armelagos GJ. 1985 Skeletal Pathologies as Indicators o f Quality and Quantity o f Diet. In: G ilbert RI. M ielke JH, editors. The Analysis o f Prehistoric Diets: 27-279.
Massler M , Schour I. Poncher HG. 1941 Developmetal Pattern o f the Child as Reflected in the Calcification Pattems o f the Teeth. Am . J. Dis. Child. 62: 33-67.
Mays SA. 1985 The Relationship between Harris Line Formation and Bone Growth Development. Joumal o f Archaeological Science 12: 207-220.
1995 The Relationship between Harris Lines and other Aspects o f Skeletal Development in Adults and Juveniles. J. Archaeol. Sc. 22: 511-520.
M cElroy A . Townsend PK. 1996 Medical Anthropology in Ecologie Perspective. West V iew Press.
Meindl RS. Lovejoy CO. 1985 Ectocranial Suture Closure: A Revised Method for the Determination o f Skeletal Age at Death Based on the Lateral A nterio r Sutures. Am . J. Phys. Anthropol. 68: 57-66.
1989 Age Changes in the Pelvis: Implications for Paleodemography. In: Iscan M Y . editor. Age Markers in the Human Skeleton. Charles C. Thomas. Springfield. Illino is, p 137-168.
McHenry H M . Schulz PD. 1976 The Association between Harris Lines and Enamel Hypoplasia in Prehistoric C a lifom ia Indians. Am . J. Phys. Anthropol. 44: 507-512.
McKem T . Steward TD . 1957 Skeletal Age Changes in Young American Males. Analyzed from the Standpoint Identification. Technical Report EP-45. Headquarters. Quartermaster Research and Development Command. Natick. Massachussets.
Moorrees CFA. Fanning EA. Hunt EE. 1963 Age Formation Stages fo r Ten Permanent Teeth. J. Dental Res. 42: 1490-1502.
Munoz I. 1983a La Fase A lto Ramirez del Extremo Norte de Chile. Asentamientos Aldeanos en los Valles Costeros de Arica ( The A lto Ramirez Phase in the Northem Part o f Chile. V illage Settlements in the Coastal Valleys o f Arica). Documentes de Trabajo 3: 124-151. Unversidad de Tarapacâ. Arica. Chile.
1983b El Poblamiento Aldeano en el Valle de Azapa y su Vinculacidn con Tiwanaku. Arica-Chile. (The Peopling in V illage Settlement in the Azapa Valley and its Relation w ith Tiwanaku. Arica-Chile) Documentes de Trabajo 3: 43-93. Unversidad de Tarapacâ. Arica, Chile.
1987 Enterramientos en Tûmulos en el Valle de Azapa: Nue vas Evidencias para D é fin ir la Fase A lto Ramirez en el Extremo Norte de Chile (Tum uli Cemeteries in the Azapa
Reproduced with permission of the copyright owner. Further reproduction prohibited without permission.
146
Valley. New Evidence to Define the A lto Ramirez Phase in Northem Chile). Chungara 19: 93-127.
1989 El Periodo Formativo en el Norte Grande (100 a.C.-500 d.C.). (The Formative Period in the B ig North. 100BC-500AD) .In: Aldunate C et al., editors. Culturas de Chile. Prehistoria. Desde sus Origenes hasta los Albores de la C iv ilizacion. (Cultures o f Chile. Prehistory. From its Origins until the Beginning o f the Spanish Conquest). Ed. Andres Bello. Santiago, Chile, p 107-128.
Murchison M A , Owsley DW , Riopelle AJ. 1984 Transverse Line Formation in Protein- Deprived Rhesus Monkeys. Human B io l. 56 (1): 173-182.
M urra. J. 1972 El Control Vertical de un M axim o de Pisos Ecoldgicos en la Economfa de las Sociedades Andinas (Andean Societies' Vertical Control o f a M axim um Number o f Ecological N iches). In: Formaciones Economicas y Polfticas del Mundo Andino. (Economic and Political Formations o f the .Andean W orld). Instituto de Estudios Peruanos, Lima, p 23-43.
Newton RW. Levine RS. Turner EP. Barson AJ. 1984 The Sensitivity o f the Developing Tooth Germ to Systemic Disturbances. Early Human Development 9: 269-273.
N ik ifo ruk G. Fraser D. 1981 The Etio logy o f Enamel Hypoplasia: A U n ify ing Concept. The Joumal o f Pediatrics 98 (6): 888-893.
Nunez L. 1989 Hacia la Produccion de Alimentes y la V ida Sedentaria (Towards Food Production and Sedentary L ife). In: Aldunate C. et al., editors. Culturas de Chile. Prehistoria. Desde sus Ongenes hasta los Albores de la C iv ilizaciôn. (Cultures o f Chile. Prehistory. From its Origins until the Beginning o f the Spanish Conquest). Ed. Andres Bello. Santiago. Chile, p 81-105.
Nunez L. D illehay T. 1995 M ovilidad Giratoria. Arm onfa Social y Désarroilo en los Andes Méridionales: Patrones de Trâfico e Interacciôn Econômica. (Spiral M ob ility , Social Arm ony and Development in the Southem Andes: Pattems o f Exchange and Economie Interaction). Universidad del Norte, Antofagasta.
Nufio S. Barros A . 1984 La Tierra en que V ivim os. Una Historia Natural. (The W orld We Live In. A Natural History). Editoria l Antartica. Santiago, Chile.
Ohlsson C, Nilsson A . Isaksson O, Lindahl A . 1992 G rowth Hormone Induces the M ultip lica tion o f the S low ly C ycling Germinal Cells o f the Rat T ib ia l G rowth Plate.Proc. Natl. Acad. Sci. 89: 9826-9830.
Park EA. 1964 The Im printing o f Nutritional Disturbances. Pediatrics 33: 815-862.
Phenice T . 1969 A New ly Developed Visual Method o f Sexing the Os Pubis. Am . J.Phys. Anthropol. 30: 397-301.
Reproduced with permission of the copyright owner. Further reproduction prohibited without permission.
147
Pindborg JJ. 1982 Aetio logy o f Developmental Enamel Defects not Related to Fluorosis. Int. Den. J. 32. 123-134.
Quintanilla V. 1983 Biogeografia. Coleccion Geografica de Chile. Instituto Geografico M ilita r. Santiago, Chile.
Reid DJ, Dean M C . 2000 B rie f Communication: The T im ing o f Linear Hypoplasias on Human Anterior Teeth. Am . J. Phys. Anthropol. 113: 135-139.
Reinecke M . Schmid AC, Heyberger-Meyer B, Hunzinkes EB, Zapf J. 2000 Effect o f Growth Hormone and Insuline L ike Growth Factor I (IG F-I) on the Expression o f IGF-1 Messenger Ribonucleic Acid and Peptide in Rat T ib ia l Growth Plate and A rticu la r Chondrocytesin V ivo . Endocrinology 141 (8): 2847-2853.
Risnes S. 1986 Enamel Apposition Rate and the Prism Periodicity in Human Teeth. Scandinavian J. Dent. Res. 94: 394-404.
Rivera M , Soto P. U lloa L, Kushner D. 1973 Aspectos sobre el Désarroi lo Tecnoldgico en el Proceso de Agriculturizaciôn en el Norte Prehispano, especial mente A rica (Chile). (Aspects o f Technological Development and the Adoption o f .Agriculture in the Prehispanic North, especially Arica- Chile). Chungara 3: 79-107.
1987 Tres Fechados Radiometricos de Pampa A lto Ramfrez. Norte de Chile (Three Radiocarbon Dates in “ Pampa .Alto Ramirez” . Northem Chile). Chungara 18: 7-13.
Roberts C. Manchester K. 1995 The Archaeology o f Disease. Comell University Press. Ithaca. USA.
Robinson C. K irkham J. Briggs HD. Atkinson PJ. 1982 Enamel Proteins: From Secretion to Maturation. Joumal o f Dental Research 61: 1490-1495.
Robinson C. K irkham J. 1986 The M atrix Proteins o f Dental Enamel -A n Overview. Calcified Tissue Intemational 39; A 9 -A 1 1.
Rogers SL. 1984 The Human Skull: Its Mechanics. Measurements, and Variations. Charles C. Thomas, Springfield, Illino is.
Rose JC. Condon KW . Goodman A H . 1985 Diet and Dentition: Developmental Disturbances. In: G ilbert RI. M ielke JH. editors. The Analysis o f Prehistoric Diets, p 281- 305.
Santoro C. 1980a Estratigrafia y Secuencia Cultural Funeraria Fases: Azapa, A lto Ramirez y Tiwanaku (Arica-Chile). (Stratigraphy and Mortuary Cultural Sequence. Azapa. A lto Ramirez and T iwanku Phases). Chungara 6: 24-45.
Reproduced with permission of the copyright owner. Further reproduction prohibited without permission.
148
1980b Fase Azapa. Transicion del Arcaico aJ Désarroi lo In icia l de los Valles Bajos de Arica. (The Azapa Phase, a Transition from the Archaic Period towards the In itia l Development o f the Lower Valleys). Chungara 6: 46-56.
Santos RV. Coimbra CEA. 1999 Hardships o f Contact: Enamel Hypoplasias in Tupf- Mondé Amerindian From The Brazilian Amazonia. Am . J. Phys. Anthropol. 109: 111- 127.
Samat BG. Schour I. 1942 Enamel Hypoplasia (Chronologic Enamel Aplasia) in Relation to Systemic Disease: A Chronologic. Morphologic and E tio log ic Classification. Jour.Am . Dent. Assoc. 29: 67-75.
Saunders SR. Hoppa RD. 1993 G rowth D efic it in Survivors and Non-Survivors: Biological M orta lity Bias in Subadult Skeletal Samples. Yrbook Phys. Anthropol. 36: 127-151.
Schour I. 1936The Neonatal Line in the Enamel and Dentin o f Human Deciduous Teeth and First Permanent Molar. The Dental Cosmos 23: 1946-1955.
Schour I. Massler M . 1940a Studies In Tooth Development: The G rowth Pattem o f Human Teeth. J. Am. Dental Assoc. 27: 1918-1931.
Schour I. Massler M . 1940b Studies In Tooth Development: The G rowth Pattem o f Human Teeth. Part I. J. Am . Dental Assoc. 28: 1778-1793.
Schukowski. H. 1993 Sex Determination o f Infant and Juvenile Skeleton: I. Morphognostic Features. Am . J. Phys. Anthropol. 90: 199-205.
Seino Y. 1994 Cytokines and Growth Factor which Regulate Bone Cell Function. Acta Astronaut. 33: 131-136.
Sepulveda S. 1962 Regiones Geograficas de Chile. Apartado de la Geografia Econdmica de Chile, vol. IV . Corporacidn de Fomento a la Produccidn. (Geographical Regions o f Chile. Supplement o f the Economic Geography o f Chile, vol. IV . Productivity Enhancement Corporation).
Siebler T. Robson H. Shaler SM . W illiam s GR. 2001 Glucocorticoids. Thyro id Hormone and Growth Hormone Interactions: Implications for the G rowth Plate. Hormone Res. 56 (Suppl 1): S7-S12.
Sims N A . Clement-Lacroiz P. Da Ponte F. Bouali Y . B inart N, M origg l R. G offin V. Coshigano K. G aillard-Kelly M . Kopchick J. Baron R and K e lly PA. 2000 Bone Homeostasis in Growth Hormone Receptor-Null M ice is Restored by IG F -I but Independent o f Stat5. J. C lin . Invest. 106 (9); 1095-1103.
Reproduced with permission of the copyright owner. Further reproduction prohibited without permission.
149
Skinner M , Goodman A H . 1992 Anthropological Uses o f Developmental Defects o f Enamel. In: Saunders SR. Katzenberg M A . editors. Skeletal B io logy o f Past People: Research and Methods. W iley- Liss, Inc. p 153- 174
Smith H. 1984 Pattems o f M olar Wear in Hunter- Gatherers and agriculturalists. Am . J. Phys. Anthropol. 63: 39-56.
Steel R. G. D. and J. H. Torrie. 1995 Bioestadistica: Principios y Procedimientos. McGraw - H i l l . Mexico.
Steele DG. Bramblett C A . 1988 The Anatomy and B iology o f the Human Skeleton.Texas A & M University Press, College Station, Texas.
Steinbock, RT. 1976 Paleopathological Diagnosis and Interpretation. Charles C. Thomas Publisher, USA.
Stracke H, Schulz A, M oeller D, Rossol S and Schatz H. 1984 Effect o f Growth Hormone in Osteoblasts and Demonstration o f Somatomedin-C/IGF-I in Bone Organ Culture. Acta Endocrin. (Copenh) 107 (1); 16-24.
Storey R. 1992 Pattems o f Susceptibility to Dental Defects in the Deciduous Dentition o f a Precolumbian Skeletal Population. In: Goodmand A H and Capasso LL , editors. Recent Contributions to the Study o f Enamel Detects. J. Paleopathol. 199: 171-183.
Suchey JM , Owings PA. W iseley D V . Noguchi TT . 1984 Skeletal Aging o f Unidentified Persons. In: Rathbum T A . Buikstra. JE. editors. Human Identifications: Case Studies in Forensic Anthropology. Charles C. Thomas. Springfield. Illino is, p 278-297.
Suckling GW.1989 Developmental Defects o f Enamel-H istorical and Present-Day Perspectives o f their Pathogenesis. Adv. Den. Res. 3 (2): 87-94.
Sunderland EP. Smith CJ. Sunderland R. 1987 A Histiological Study o f the Chronology o f In itia l M ineralization in the Human Deciduous Dentition. Archs. Oral B io l. 32 (3): 167-174.
Sutter R. 1997 Dental Variation and Biocultural A ffin ities among Prehistoric Population from Coastal Valleys o f Moquehua Peni. and Azapa. Chile. Dissertation, Depart ament o f Anthropology. University o f M issouri-Columbia.
2000 Prehistoric Genetic and Culture Change: A Bioarchaeological Search fo r Pre-Inka A ltip lano Colonies in the Coastal Valleys o f Moquehua. Peru, and Azapa, Chile. Latin Am . A n tiqu ity 11 ( 1 ): 43-70.
Sweeney EA . S a ffir AJ, de Leon R. 1971 Linear Hypoplasia o f Deciduous Incisor Teeth in Malnourished Children. Am . J. C lin . Nutr. 24: 29-31.
Reproduced with permission of the copyright owner. Further reproduction prohibited without permission.

150
Telemo E, Hanson LA . 1996 Antibodies in M ilk . J. Mammary Gland B io l. Neoplasia. 1 (3): 243-249.
Thomas RB. Gage TB. L ittle M A . 1989 Reflections on Adaptive and Ecological Models. In: L ittle and Haas editors. Human Population B io logy. A Transdisciplinary Science. P 296-319
Todd TW . 1921a Age Changes in the Pubic Bone I: The Male W hite Pubis. Am . J. Phys. Anthropol. 3: 285-334.
1921b Age Changes in Pubic Bones III: The Pubis O f The White Female. IV : The Pubis o f the Female W hite-Negro Hybrid. Am . J. Phys. Anthropol. 4: 1-70.
Toledo X . Zapater E. 1991 Geografia General y Regional de Chile. (General and Regional Geography o f Chile). Universitaria ed. Santiago. Chile.
Tongue CH. 1989 Tooth Development - General Aspects. In: Oksche A , Vo llra th L. editors. Teeth. Springer-Berlag. Berlin , Germany, p 1-20.
Tou lm in S. 1983 The Natural Past and the Human Future: An Introductory Essay. In: Ortner DJ. editor. How Humans Adapt a B iocultural Odyssey. Smithsonian Intemational Symposia Series, p 11-33
Ubelaker D. 1989 Human Skeletal Remains. 2"*̂ edition. Taraxacum Press. Washington D .C .
Uribe M . 1999 La Ceramica de A rica 40 Anos Despues de P. Dauelsberg. (The Arica Ceramic. 40 Years after P. Dauelsberg). Chungara (In Press).
Urzüa L. 1969Arica Puerta Nueva. (A rica. New Portal). Andre's Bello ed. Santiago. Chile.
Van Gerven DP. Hummert JR. Burr DB. 1985 Cortical Bone Maintenance and Geometry o f the T ib ia in Prehistoric Children from Nubia 's Batn el Hajar. Am. J. Phys. Anthropol. 66: 275-280
V illagran C. Kalin M . Amesto J. 1982 La Vegetacion de un Transecto A ltitud ina l en los Andes del None de Chile ( 18°-19°S). (The Vegetation in an A ltitud inal Transect in the Andes o f Northem Chile. 18°-19°S) In: Unesco. El Ambiente Natural y las Poblaciones Humanas en los Andes del Norte Grande de Chile (A rica lat. 18°28’ S.).(The Natural Environment and the Human Populations in the Andes o f Northem Chile. A rica lat. 18°28' S.) p 13-23.
W iley AS. 1992 Adaptation and the B iocultura l Paradigm in Medical Anthropology. M edical Anthropology Quarterly 6 (3): 216-236.
Reproduced with permission of the copyright owner. Further reproduction prohibited without permission.
151
W inter GB. Brook A H . 1975 Enamel Hypoplasia and Anomalies o f the Enamel. Den. C lin . North Am . 19: 3-24.
W ood JW, M ilner GR, Harpending HC. Weiss K M . 1992 The Osteological Paradox. Problems o f Inferring Prehistoric Health from Skeletal Samples. Current Anthropology 33 (4): 343-370.
W right LE. 1997 Inter Tooth Pattems o f Hypoplasia Expression: Implications for Childhood Health in the Classic Maya Collapse. Am . J. Phys. Anthropol. 102: 233-247.
Reproduced with permission of the copyright owner. Further reproduction prohibited without permission.
VITA
Graduate College University o f Nevada, Las Vegas
Marta P ilar A lfonso Durruty
Local Address:3950 Koval Lane #2172Las Vegas, Nevada, 89109. USA
Home Address:Recife # 1927. Vitacura Santiago. 6670906, Chile
Degrees:1995 Bachelor in Anthropology M ajor in Archaeology and Prehistory. Departamento de Antropologfa. Facultad de Ciencias Sociales. Universidad de Chile. (Department o f Anthropology. College o f Social Sciences, University o f Chile).
2000 Professional T itle : Archaeologist. Departamento de Antropologfa, Facultad de Ciencias Sociales. Universidad de Chile. (Department o f Anthropology. College o f Social Sciences. University o f Chile).
Special Honors and Awards:2000 “ T ftu lo Profesional de Arqueologo con D istincion M axim a” (Professional Degree o f Archaeologist. Magna Cum Lauda).1996 Graduated as best student o f the Class. Distinguished among archaeologists and cultural anthropologists.
Publications:A lfonso, M .2000 Continuidad y Tranformacidn: Condiciones de Salud Oral en las Poblaciones de la Costa y el Valle de Azapa (9000-l(XX)a.p.) (C ontinu ity and Transformation: Oral Health Conditions in the Coastal and Inland Populations o f the Azapa Valley. 9000-1000BP). Unpublished Thesis. Departamento de Antropologfa, Facultad de Ciencias Sociales, Universidad de Chile. (Department o f Anthropology, College o f Social Sciences. University o f Chile).
152
Reproduced with permission of the copyright owner. Further reproduction prohibited without permission.
153
1998 Adaptaciones Costeras de las Poblaciones Prehispànicas del Extremo Norte de Chile: Opciôn Cultural o Marginalidad Social? (Coastal Adaptations among the Prehispanic Populations o f Northem Chile: Cultural Choice o f Social Marginality?). In: Actas del m Congreso Chileno de Antropologia: 668-683. (H I Meeting o f Chilean Anthropology; 668-683).
1997 Inferencia Social por Medio de la Patologia Oral. (Social Inference Trough Oral Pathology). In: Actas del X IV Congreso de Arqueologia Chilena: 589-606. (X IV Meeting o f Chilean Archaeology: 589-606)
1996 Uso Arqueolôgico de la Patologia Oral. D ieta y Subsistencia en una Poblacion Alfarera de Chile Central; “Los Coiles 136”. (Archaeological Use o f Oral Pathology. Diet and Subsistence in a Population with Ceramic Production o f Central Chile). Final Report o f the Internship. Departamento de Antropologia, Facultad de Ciencias Sociales, Universidad de Chile. (Department o f Anthropology, College o f Social Sciences, University o f Chile).
Alfonso M , Trejo V.2000 Iv i Tangata. Puesta en Valor de los restos Oseos Humanos de Isla de Pascua (Our Bones. Curation o f Human Remains in Eastern Island). I2p. Rev. Conserva (in press).
Sole M L, Alfonso M , Avalos H , Rodriguez J.1995 Organizacion Social, Salud y Enfermedad: Los Coiles 136, un Cementerio Alfarero de Chile Central (Social Organization, Health and Disease: “Los Coiles 136” a Cemetery o f the Ceramic Period in Central Chile). In: Actas del X m Congreso Nacional de Arqueologia Chilena. Tomo H Comunicaciones; 227-236. (X m National Meeting o f Chilean Archaeology. Volume II. Comunications; 227-236).
Sole M L, Alfonso M , Rodriguez J, Becker C.1996 1995Valle Hermoso, Ochocientos Anos de Historia; Calidad de vida y Organizacion Social a través de la Evidencia Esqueletal. ( “Valle Hermoso”, Eight Hundred years o f History: Quality o f L ife and Social Organization through Skeletal Evidence). In: Actas del X m Congreso Nacional de Arqueologia Chilena. Tomo H Comunicaciones: 217-226. (Xm National Meeting o f Chilean Archaeology. Volume II. Comunications: 217-226).
Reproduced with permission of the copyright owner. Further reproduction prohibited without permission.