secrets of economic indicators
TRANSCRIPT


“Bernie Baumohl has written a “must read” educational and reference book that every individual investor willfind indispensable for watching, monitoring, and interpreting the markets. The daily flow of high-frequency eco-nomic indicators is the stuff that makes financial markets move and that can signal the big trends that make orbreak investor portfolios. Most important, Bernie’s long experience in reporting economics for Time Magazinehelps make the “dismal science” lively and interesting.”
—Allen Sinai, President and Chief Global Economist, Decision Economics, Inc.
“This is the most up-to-date guide to economic indicators and their importance to financial markets in print.The coverage of less-reported indicators, especially those from non-government sources, is hard to find else-where. The inclusion of the actual published tables helps the newer student of the markets find the data in thepublic release. For anyone trying to follow the economic data, this should be next to your computer so that youcan understand and find the data on the Internet.”
—David Wyss, Chief Economist, Standard and Poor’s
“Economic statistics, employment data, Federal Reserve surveys. Think they are boring? Think again! They candrive markets into a frenzy, causing billions of dollars to be made or lost in an instant. Bernie Baumohl brilliantly,clearly, and, yes, entertainingly describes what every investor and business manager should know about economicindicators: which ones move markets, how to interpret them, and how to use them to spot and capitalize on futureeconomic trends. The Secrets of Economic Indicators is an extraordinary and insightful work—an enormouslyimportant contribution to the body of financial literature. Read it and then keep it on your desk. Consult it the nexttime you are deluged with a flurry of economic statistics. Your understanding certainly will be enhanced and yourportfolio will likely be as well.”
—Robert Hormats, Vice-Chairman, Goldman Sachs (International)
“Bernie Baumohl has accomplished something of real value in The Secrets of Economic Indicators. He has success-fully de-mystified the world of financial and economic news that bombards us in our daily lives. Both professionalinvestors and casual observers of the world of finance and economics will be grateful for what he has done. The constant stream of heretofore bewildering news from the world of business and finance can now be easily under-stood. Every businessperson or investor should keep a copy of Baumohl’s book close-at-hand as he or she catches up on the business, stock market, and economic events of the day. It is great, at long last, to have someone who haseliminated what may have been so perplexing to so many and to have done so with such remarkable clarity.”
—Hugh Johnson, Chief Investment Officer, First Albany
“If you want to make money investing, this is an essential trend-tracking tool that will help get you to the bank.This book is the real deal. Bernard Baumohl miraculously breaths life into deadly economic indicators and bor-ing statistics . . . he knows what he’s talking about and his expertise proves it.”
—Gerald Celente, Director, The Trends Research Institute
“Baumohl has a gift for taking a complicated subject and allowing it to read like a fast-moving novel. My confi-dence in reading and understanding economic indicators as portrayed in this book made me realize the possibili-ties this information holds for improving my personal net worth as well as navigating my business toward higherprofits. I recommend this book if you care about your future finances.”
—Morris E. Lasky, CEO, Lodging Unlimited, Inc.—manager and consultant for $6 billion in hotel assets;Chairman, Lodging Conference; Chairman, International Hotel Conference
“I find Baumohl’s writing fascinating. In addition to the famous indicators, he includes many that I hadn’t heardof. I really appreciate that he tells you exactly where to find each indicator on the Web. Just about anyone who’sserious about understanding which way the economy is headed will want to read this book. It could be a classic.”
—Harry Domash, Columnist for MSN Money and Publisher, Winning Investing Newsletter
“I think this is an excellent book. It’s well written, accessible to a variety of readers, deals with an interesting andimportant subject, and covers the topic well. It deserves to get a lot of notice and use.”
—D. Quinn Mills, Alfred J. Weatherhead Jr., Professor of Business Administration, Harvard Business School
01Baumohl_Ch00.qxd 8/3/04 7:31 AM Page 1

01Baumohl_Ch00.qxd 8/3/04 7:31 AM Page 2

The Secrets ofEconomic Indicators
01Baumohl_Ch00.qxd 8/3/04 7:31 AM Page i

In the face of accelerating turbulence and change, business leaders and policy makers need new ways of thinking to sustain performance and growth.
Wharton School Publishing offers a trusted source for stimulating ideas from thought leaders who provide new mental models to address changes in strategy, management and finance. We seek out authors from diverse disciplines with a profound understanding of change and its implications. We offer books and tools that help executives respond to the challenge of change.
Every book and management tool we publish meets quality standards set by The Wharton School of the University of Pennsylvania. Each title is reviewed by the Wharton School Publishing Editorial Board before being given Wharton’s seal of approval. This ensures that Wharton publications are timely, relevant, important, conceptually sound or empirically based, and implementable.
To fit our readers’ learning preferences, Wharton publications are available in multiple formats, including books, audio, and electronic.
To find out more about our books and management tools, visit us at whartonsp.com and Wharton’s executive education site, exceed.wharton.upenn.edu.
01Baumohl_Ch00.qxd 8/3/04 7:31 AM Page ii

The Secrets ofEconomic IndicatorsHidden Clues to Future Economic Trends and
Investment Opportunities
Bernard Baumohl
01Baumohl_Ch00.qxd 8/3/04 7:31 AM Page iii

Library of Congress Catalog-in-Publication: 2004105831
Publisher: Tim Moore
Executive Editor: Jim Boyd
Editorial Assistant: Rick Winkler
Marketing Manager: Martin Litkowski
International Marketing Manager: Tim Galligan
Managing Editor: Gina Kanouse
Project Editor: Michael Thurston
Design Manager: Sandra Schroeder
Cover Design: Nina Scuderi
Composition: The Scan Group, Inc.
Interior Design: The Scan Group, Inc.
Manufacturing Buyer: Dan Uhrig
2005 by Pearson Education, Inc.
Publishing as Wharton School Publishing
Upper Saddle River, New Jersey 07458
Wharton School Publishing offers excellent discounts on this book when ordered in quantity forbulk purchases or special sales. For more information, please contact: U.S. Corporate andGovernment Sales, 1-800-382-3419, [email protected]. For sales outside of the U.S.,please contact: International Sales, [email protected].
Company and product names mentioned herein are the trademarks or registered trademarks of theirrespective owners.
All rights reserved. No part of this book may be reproduced, in any form or by any means, without permission in writing from the publisher.
Printed in the United States of America
First PrintingISBN 0-13-145501-X
LOC 2004105831
Pearson Education Ltd.
Pearson Education Australia Pty., Limited
Pearson Education South Asia Pte. Ltd.
Pearson Education Asia Ltd.
Pearson Education Canada, Ltd.
Pearson Educacion de Mexico, S.A. de C.V.
Pearson Education—Japan
Pearson Education Malaysia, Pte. Ltd.
01Baumohl_Ch00.qxd 8/3/04 7:31 AM Page iv

WHARTON SCHOOL PUBLISHING
C. K. PrahaladTHE FORTUNE AT THE BOTTOM OF THE PYRAMIDEradicating Poverty Through Profits
Yoram (Jerry)Wind, Colin Crook, with Robert GuntherTHE POWER OF IMPOSSIBLE THINKINGTransform the Business of Your Life and the Life of Your Business
Scott A. ShaneFINDING FERTILE GROUNDIdentifying Extraordinary Opportunities for New Ventures
01Baumohl_Ch00.qxd 8/3/04 7:31 AM Page v

WHARTON SCHOOL PUBLISHINGEditorial Board
■ Dr. David C. SchmittleinIra A. Lipman ProfessorProfessor of MarketingDeputy Dean, The Wharton SchoolChair of the Editorial Board
■ Dr. Yoram (Jerry) WindThe Lauder Professor, Professor of MarketingDirector, The Wharton FellowsDirector, SEI Center for Advanced Studies in ManagementWharton Editor, Wharton School Publishing
■ Dr. Franklin AllenNippon Life Professor of FinanceProfessor of EconomicsCo-Director, Financial Institutions Center
■ Dr. Peter CappelliGeorge W. Taylor Professor of Management Director, Center for Human Resources
■ Dr. Thomas DonaldsonMark O. Winkelman Professor
■ Dr. Richard J. HerringJacob Safra Professor of International BankingProfessor of FinanceCo-Director, Financial Institutions Center
■ Dr. John C. HersheyDaniel H. Silberberg ProfessorProfessor of Operations and Information Management
■ Dr. Paul R. KleindorferAnheuser-Busch Professor of Management ScienceProfessor of Decision Sciences, Economics, and Business and Public PolicyCo-Director, Risk Management and Decision Processes Center
■ Dr. Ian C. MacMillanFred R. Sullivan ProfessorProfessor of ManagementDirector, Sol C. Snider Entrepreneurial Research Center
■ Dr. Andrew MetrickAssociate Professor of Finance
■ Dr. Olivia S. MitchellInternational Foundation of Employee Benefit Plans ProfessorProfessor of Insurance and Risk Management and Business and Public PolicyExecutive Director, Pension Research CouncilDirector, Boettner Center for Pensions and Retirement Research
■ Dr. David J. ReibsteinWilliam Stewart Woodside ProfessorProfessor of Marketing
■ Kenneth L. ShropshireDavid W. Hauck ProfessorProfessor of Legal Studies
■ Dr. Harbir SinghEdward H. Bowman Professor ofManagementCo-Director, Mack Center for Technological Innovation
■ Dr. Michael UseemThe William and Jacalyn Egan ProfessorProfessor of ManagementDirector, Center for Leadership and Change Management
Ex-Officio Members■ Kathleen C. McClave
Associate Dean, Marketing and Business DevelopmentManaging Director, Wharton School Publishing
■ Timothy C. MooreVice PresidentFTPH/Wharton School Publishing/Reuters Editor-in-Chief
The Editorial Board of Wharton School Publishing is comprised of the following members from the senior faculty of the Wharton School. The Editorial Board ensures all manuscripts and materials meet Wharton’s standard by addressing important topics with ideas and insights that are • Relevant • Empirically based• Timely • Conceptually sound• Implementable in real decision settings
01Baumohl_Ch00.qxd 8/3/04 7:31 AM Page vi

To my mother, Eva Baumohl, a Holocaust survivor; and in memory of my father, Naftali Baumohl
01Baumohl_Ch00.qxd 8/3/04 7:31 AM Page vii

01Baumohl_Ch00.qxd 8/3/04 7:31 AM Page viii
ix
C o n t e n t s
Acknowledgments xiii
Preface xvii
C H A P T E R 1 The Lock-Up 1U.S. Economic Indicators 6International Economic Indicators 13
C H A P T E R 2 A Beginner’s Guide: Understanding the Lingo 17Introduction 17Annual Rates 17Business Cycle 18Consensus Surveys 19Moving Average 20Nominal Dollars Versus Real Dollars (Also Known as
Current Dollars Versus Constant Dollars) 20Revisions and Benchmarks 21Seasonal Adjustments 22
C H A P T E R 3 The Most Influential U.S. Economic Indicators 25
EmploymentEmployment Situation 25Weekly Claims for Unemployment Insurance 38Help-Wanted Advertising Index 42Corporate Layoff Announcements 45Mass Layoff Statistics (MLS) 48
Consumer Spending and ConfidencePersonal Income and Spending 52Retail Sales 62E-Commerce Retail Sales 67Weekly Chain Store Sales 70Consumer Credit Outstanding 75Cambridge Consumer Credit Index 80Consumer Confidence Index (Conference Board) 86Survey of Consumer Sentiment (University of Michigan) 91ABC News/Money Magazine Consumer Comfort Index 94UBS Index of Investor Optimism 97
01Baumohl_Ch00.qxd 8/3/04 7:31 AM Page ix
National Output and InventoriesGross Domestic Product (GDP) 100Durable Goods Orders 116Factory Orders 123Business Inventories 130Industrial Production and Capacity Utilization 137Institute for Supply Management (ISM)
Manufacturing Survey 147Institute for Supply Management (ISM)
Non-Manufacturing Business Survey 154Chicago Purchasing Managers Index (Business Barometer) 157Index of Leading Economic Indicators (LEI) 161
Housing and ConstructionHousing Starts and Building Permits 169Existing Home Sales 175New Home Sales 181Housing Market Index: National Association of
Home Builders (NAHB) 187Weekly Mortgage Applications Survey and the
National Delinquency Survey 191Construction Spending 195
Regional Federal Reserve Bank SurveysRegional Federal Reserve Bank Reports 198Federal Reserve Bank of New York: Empire State
Manufacturing Survey 199Federal Reserve Bank of Philadelphia: Business
Outlook Survey 205Federal Reserve Bank of Kansas City: Manufacturing
Survey of the 10th District 209Federal Reserve Bank of Richmond: Manufacturing
Activity for the Fifth District 213Federal Reserve Bank of Chicago: National Activity
Index (CFNAI) 216The Federal Reserve Board’s Beige Book 219
Foreign TradeInternational Trade in Goods and Services 223Current Account Balance (Summary of International
Transactions) 237
Prices, Productivity, and WagesConsumer Price Index (CPI) 245Producer Price Index (PPI) 255
x Contents
01Baumohl_Ch00.qxd 8/3/04 7:31 AM Page x
Employment Cost Index 262Import and Export Prices 268Productivity and Costs 275Employer Costs for Employee Compensation 282Real Earnings 286Yield Curve 289
C H A P T E R 4 International Economic Indicators: Why Are They So Important? 295
German Industrial Production 298German IFO Business Survey 300German Consumer Price Index (CPI) 302Japan’s Tankan Survey 306Japan Industrial Production 312France Monthly Business Survey (INSEE) 317Eurozone—Manufacturing Purchasing Managers Index (PMI) 320Global—Manufacturing Purchasing Managers Index 320OECD Composite Leading Indicators (CLI) 326China Industrial Production 329Brazil Industrial Production 334
C H A P T E R 5 Best Web Sites for U.S. Economic Indicators 339Schedule of Releases 339Economic News 339The U.S. Economy 339Consumer Behavior 340Employment Conditions 341Home Sales and Construction Activity 342International Trade 342Inflation Pressures 343Federal Reserve Surveys 343The Federal Budget 344Interest Rates 344Money and Credit 344U.S. Dollar 344One-Stop Shopping for Economic Statistics 345Other Useful Sources on the Web 345
C H A P T E R 6 Best Web Sites for International Economic Indicators 347Calendar of Releases for Foreign Economic Data 347Sources of Global Economic News 347Economic Statistics from Other Countries 347Best Megasites for International Economic Statistics 353
Index 355
xiContents
01Baumohl_Ch00.qxd 8/3/04 7:31 AM Page xi

01Baumohl_Ch00.qxd 8/3/04 7:31 AM Page xii

xiii
A c k n o w l e d g m e n t s
One gratification that comes with completing a book is that I now get a chance to thankthose who I relied on for advice, contacts, and support along the way. To be sure, thereare many people to thank. So many, in fact, that mentioning all their names would greatlylengthen the size of this book. Still, there are some that deserve special mention becausethey were so giving of their time and in their counsel.
I must begin by breaking with some tradition. It is customary practice in these pagesto reserve thanking your family until the end. However that order makes little sense to mein this case. My family deserves top billing here because I relied on their support themost these last two years. From day one I expropriated a room in our home and turned itinto an impassable maze of documents, newspapers, and boxes. Indeed we can no longerrecall the color of the carpet underneath. Moreover, during the last two years, when I waswriting or traveling, the burden of overseeing family and household matters fell largelyon my wife, Debbie. She was the one who got our three girls off to school every morning,prepared their lunches, helped with their homework, chauffeured them to play dates, metwith teachers, accompanied them for doctor check-ups, got them ready for bed, paid thebills, and so much more. Without a doubt, this book would not have been possible with-out her support and love. Nor will I ever forget how my daughters, Ashley, Rachel, andNicole, tried to help me in the first days by printing up “do not disturb” signs and thentaping them outside my door. From beginning to end, my family provided the best homeenvironment for me to carry out this project, and for that I will always be grateful.
I am also indebted to Carolina Buia (writer, television journalist) and MarcLieberman (NYU economics professor). Both listened to my ideas, read the initial treat-ment of the book, and opened some very important doors to the publishing world. I alsobenefited greatly from the experience and wisdom of others, including Adam Cohen (NewYork Times), Jordan Goodman (personal finance author), Dan Kadlec (TIME), JeffreyLiebenson (KMZ Rosenman), Larry Moran (Bureau of Economic Analysis, CommerceDepartment), Michael Panzner (HSBC Securities), David Skidmore (Federal ReserveBoard), as well as Sue Hensley and Gary Steinberg (Department of Labor).
There are two people I’d like to name who were not involved in the preparation ofthis book, but were nevertheless enormously important to me because I learned so muchfrom them about economic journalism. They are Bill Saporito, TIME’s exceptionallygifted business editor, and the late George Church (TIME and the Wall Street Journal),who was a brilliant writer on all topics but none more so than on economics. I view boththeir works as the benchmark in excellent writing and editing.
01Baumohl_Ch00.qxd 8/3/04 7:31 AM Page xiii

Acknowledgments
Finally, one of the luckiest things to have happened to me was to work with JimBoyd, my editor at Prentice Hall. Writing a book the first time can be a daunting experi-ence but Jim made the process so much easier with his intelligent guidance and sense ofhumor. It was a real privilege working with him. I also want to thank Michael Thurston,project editor at Pearson Education, who supervised the production of this rather compli-cated book.
Let me make one last note. Though I made every effort to make sure this book isaccurate, I alone am responsible for any follies that might have slipped through.
xiv
01Baumohl_Ch00.qxd 8/3/04 7:31 AM Page xiv

A b o u t t h e A u t h o r
Bernard Baumohl is director of The Economic Outlook Group, a consulting firm thatevaluates global economic trends and risks. He was an award-winning TIME magazineeconomics reporter for two decades and covered the domestic and international economyfrom TIME’s New York and Washington bureaus. As an economist for EuropeanAmerican Bank, he monitored and developed forecasts of U.S. economic activity. He alsoserved as an analyst for the Council on Foreign Relations. A frequent guest on televisionand radio, he has lectured on economics and journalism at New York University andDuke University. A recipient of the John Hancock Award for Excellence in FinancialJournalism, Baumohl has a master’s degree in international affairs and economics fromColumbia University.
xv
01Baumohl_Ch00.qxd 8/3/04 7:31 AM Page xv

01Baumohl_Ch00.qxd 8/3/04 7:31 AM Page xvi

P r e f a c e
“You want to write a book about what? Economic indicators? How did you come up withthis death wish?”
That was the first response I got after telling a colleague at TIME what I was up to.She, too, was a financial journalist, and so I expected some sage advice and support. Wecontinued our conversation over lunch. “Did I hear you correctly?” she asked, stillincredulous. “We are talking about you writing a book on economic statistics right?” Yes,I nodded, and then went on to explain why this idea had been percolating in my mind formonths. I knew it was a tough topic to write about, but I was ready to take it on. She lis-tened patiently to my reasoning and then let loose a barrage of suggestions.
“First, let’s get real here. To make this work, a book on economic indicators has tobe sexy. Edgy. Really funny. Get in some lurid details about consumer prices. Tell somelascivious tales about industrial production and capacity utilization. Toss in lots of jokeson durable goods orders. Then there’s the humor that just springs at you when writingabout foreign trade and non-farm productivity. And . . . hey, shouldn’t you be takingnotes on all this?”
The appetite I came to the restaurant with was suddenly gone. Not because she waspoking fun at the idea. Just the opposite. Beneath all that sarcasm was a genuine messagethat I knew had to be taken seriously. The subject of economic indicators can be lethallyboring because of its impenetrable jargon and reliance on tedious statistics. I realizedfrom that brutal lunch encounter that my biggest challenge in writing this book was notsimply to identify and describe the world’s most influential economic indicators, but tomake the whole subject approachable and even—dare I say it—interesting. My purposefrom the start was to reach out to those who had little or no experience navigating themaze of key economic statistics and to dispel the notion that you need to have an eco-nomics degree, an MBA, or a CPA to understand what these indicators tell us about theeconomy and how we can use them to make better investment and business decisions.
The broader question, of course, is why do this book at all? Why should anyone out-side the economics profesion even care about economic indicators? Why is it importantfor the average person to know how many new homes are under construction, whetherfactories produced more or fewer goods in the latest month, or whether executivescharged with buying raw material for their companies are increasing their orders or cut-ting back? Why bother with any of this stuff? Why not let the experts sort out the mish-mash of economic numbers and tell us what it means?
xvii
01Baumohl_Ch00.qxd 8/3/04 7:31 AM Page xvii
Preface
Indeed, most Americans have little desire to follow such esoteric measures. They arecontent to rely on the insights of their investment advisers or hear television pundits museendlessly about the economy and the financial markets. Other than that, few show interestin probing any further. However, that attitude changed abruptly in 2000 with the bursting ofthe stock market bubble and the collapse of the dot.com sector. Investors were sickened andthen angered by the resulting loss of trillions of dollars in personal wealth. It made no dif-ference whether the money was in one’s personal savings, a 401(k), or a pension. No invest-ment escaped unscathed. The decimation was universal, and for Americans, it became apainful and sobering reminder of just how much one’s financial well-being was staked tothe risky business of stocks and bonds.
Perhaps the most troubling revelation to come out of this awful experience was howutterly dependent ordinary investors had allowed themselves to become on so-called“experts” for virtually all investment advice. It turned out that these very “experts”—veteran portfolio managers and long-time professional market watchers—failed miser-ably in their responsibility to help protect the assets and curb the losses of their investingclients. Worse still, investors became justifiably furious when they realized they were alsobeing lied to by some of the companies they had invested in and even by the brokeragefirms with whom they had entrusted their hard-earned money.
The result was predictable. Disillusioned by the ineffectual advice of their brokers,the seemingly endless revelations of corporate fraud, and the biased research reports putout by some well-known Wall Street firms, a growing number of Americans have sincedecided to venture out into the investment world by themselves, trusting their owninstincts rather than someone else’s. These investors are emboldened by the fact that theycan now access a huge assortment of information resources from home and work. Theycan even access it while traveling. There is today an unprecedented abundance of eco-nomic and financial news and analysis instantly available to anyone, anytime. Thisincludes virtually 24/7 radio and television coverage of business news and, of course,hundreds of useful Web sites that offer valuable data as well as varied perspectives on theoutlook for the financial markets and the economy.
How do the economic indicators fit into all this? Why should investors—or businessexecutives, entrepreneurs, and ordinary workers—pay particular attention to these reports?Because they are the vital barometers that tell us what the economy is up to and, moreimportantly, in what direction it is likely to go in the future. These indicators describe theeconomic backdrop that will ultimately affect corporate earnings, interest rates, and infla-tion. They can also influence the future cost of financing a car or a house, the security ofour jobs, and our overall standard of living. Even business leaders are under pressure tomonitor the economic indicators more closely. Knowledge of economic conditions in theU.S. enables CEOs to make decisions with greater confidence on whether to buy moreequipment, increase inventories, hire workers, or raise fresh capital. In addition, for firmscompeting in the global marketplace, international economic indicators are of particularimportance because they allow executives to assess business opportunities abroad.
xviii
01Baumohl_Ch00.qxd 8/3/04 7:31 AM Page xviii
Preface
But how do you begin to evaluate these economic reports? There is such a bewilderingvariety of economic statistics in the public domain that following them all can be harmful toyour health. New sets of economic numbers come out every day, week, month, and quarter,and they often tell conflicting stories about what’s going on in the U.S. In addition, stocks,bonds, and currencies react differently to economic indicators. Some economic news cancause tremors in the financial markets, while other news produces no reaction at all. Manyindicators have no forecasting value whatsoever, while others have established a trackrecord for being able to predict how the economy will behave during the next 12 months.
Moreover, different indicators originate from different sources. The U.S. governmentpumps out loads of economic data through agencies such as the Commerce Department’sBureau of Economic Analysis and the Federal Reserve Board. However, there are alsonumerous private groups that release market-moving indicators. One of the best known isThe Conference Board for its Consumer Confidence and Leading Economic Indicatorsseries. In addition, the National Association of Realtors reports monthly data on existinghome sales, and Challenger, Gray and Christmas, the outplacement firm, tallies the num-ber of announced corporate layoffs each month. Note that these sources just gauge U.S.economic activity. When you look at the assortment of economic indicators released byother countries, the quantity of information available becomes simply mind-numbing.
Clearly there is too much economic information out there, and not all of it is useful.So what do you focus on? How does an investor, a CEO, or even an economist decidewhich of the many gauges of business activity are worth tracking? Which indicators packthe greatest wallop in the financial markets? Which ones are known for doing the best jobpredicting where the economy is heading? These are the key questions I will try toanswer in this book.
The book is organized in a way that I believe makes the most sense for the reader.Chapter 1, “The Lock-Up,” begins with the drama that typically surrounds the release ofa sensitive economic indicator. After the embargo is lifted and the economic reportflashes across computer screens around the world, reaction to the latest news by globalmoney markets can affect the financial well-being of every American.
One cannot successfully write a book on economic indicators without at least gentlyintroducing a few basic economic terms. I tried in Chapter 2, “A Beginner’s Guide:Understanding the Lingo,” to define as painlessly as possible those key phrases and con-cepts that are essential to know when reading about economic indicators.
The essence of the book begins with Chapter 3, “The Most Influential U.S.Economic Indicators.” Here, all the major U.S. economic indicators are evaluated, andeach one is discussed in a format designed to answer these vital questions:
• Why is this indicator important to know? • How is it computed? (Sure, not everyone will want to get into the nitty-gritty
details of how economic indicators are put together. Nevertheless, by understandingthe underlying methodology of how they are calculated, one is better able to appre-ciate the usefulness of these indicators as well as their shortcomings.)
xix
01Baumohl_Ch00.qxd 8/3/04 7:31 AM Page xix
Preface
• What does the economic indicator have to say about the future? The purpose of thisquestion is twofold. The reader is first shown how to become familiar with the offi-cial report and its accompanying tables. Particular emphasis is placed on highlight-ing the most interesting and useful data points in the economic release. Second,guidance is given on how to locate valuable clues in the tables that may offer read-ers a heads-up on how the economy might perform in the months ahead. To makethis task easier, copies of actual releases are included with most indicators coveredin this book. Virtually all the economic releases mentioned are available on theInternet for free. One can read them on their respective Web sites or download thereleases as PDF files. (Note that Internet addresses for the economic indicators areincluded in this book.)
• How might bonds, stocks, and the dollar react to the latest economic reports? Thefinancial markets often respond differently to economic data. Much depends on thespecific indicator released, how timely it is, whether investors were surprised by thenews, and what else is going on in the economy at the time.
Chapter 4, “International Economic Indicators: Why Are They So Important?” exam-ines the 10 most influential foreign economic indicators. Because the U.S. economy andits financial markets are closely integrated with the rest of the world, one can no longerafford to ignore measures of economic activity in other countries. If the economies ofother nations are growing, they’ll buy more from U.S. producers. On the other hand, poorgrowth abroad bodes ill for many large U.S. companies and their employees. In addition,American investors interested in buying foreign stocks and bonds for their own portfoliosshould track foreign economic indicators to identify those countries and regions in theworld that might offer the most attractive returns.
Chapter 5, “Best Web Sites for U.S. Economic Indicators,” is evidence of how muchtimes have changed. Not too long ago, anyone interested in obtaining a set of current andhistorical economic statistics had to purchase them from a private number-crunchingfirm. The more stats you wanted, the more costly it was. Today, nearly all this data can beaccessed instantly on the Internet for free! The democratization of economic statisticsgives everyone, from the experienced professional to the weekend investor, the opportu-nity to download, read, and analyze economic information. In this chapter, I’ve assem-bled what I think are among the best and most authoritative Web sites for economic data.Again, all are free, though some may ask users to register.
Chapter 6, “Best Web Sites for International Economic Indicators,” is a compilationof Web sites that enable the reader to quickly locate foreign economic data that mightotherwise be tough to find. However, there’s one important caveat to keep in mind: Nocountry collects and disseminates as much high-quality economic information as theU.S. Its breadth and integrity make it the gold standard in the world. Although there is avast amount of international economic data on the Web, one has to approach suchsources with caution. There are issues concerning language (many are not in English),
xx
01Baumohl_Ch00.qxd 8/3/04 7:31 AM Page xx

Preface
comprehensiveness, accuracy, and timeliness. In this chapter, I’ve listed sites on theInternet that in my judgment are the best and most trustworthy for international eco-nomic data—and that are available in English! Once again, every site listed is free, atleast at the time of this writing.
Finally, let me close by saying that this book was fun to write largely because Ilearned a great deal in the process. It was not meant to be a textbook or some intellectualtreatise on the economy. My purpose throughout was to help people get a better under-standing of how to look at economic indicators, why they can be so influential, what theymight tell us about the future, and how people can best utilize all that information. If Ihave accomplished this in some way, then it was worth all the swearing and tempertantrums I went through every time my computer crashed in the course of this endeavor.
Bernard BaumohlMay 2004
xxi
01Baumohl_Ch00.qxd 8/3/04 7:31 AM Page xxi

01Baumohl_Ch00.qxd 8/3/04 7:31 AM Page xxii

C H A P T E R 1
The Lock-Up
Shortly after dawn on most weekday mornings, a strange ritual takes place in WashingtonD.C. Two dozen select men and women leave their homes, grab their newspapers, andrush off to spend part of the day under virtual house arrest. Yes, house arrest—as in incar-ceration. Precisely where they go to be confined can vary day to day. It could be in adilapidated government building one morning and a high-tech office complex the next.Regardless of the location, what occurs in all these places is always the same. They entera strict, prison-like setting where contact with the outside world is cut off.
One Friday morning, this same group climbs a long set of steps to the side entranceof a sleek, white-stone building on 3rd Avenue and C Street in the heart of the nation’scapital. Armed guards greet them at the entrance for a security check; from this point on,everyone has to wear their ID tags at all times. The visitors proceed across a lobby, downa quiet narrow corridor, eventually stopping in front of a locked, heavy wooden door. Agovernment official awaits them and quickly opens the door to reveal a drab, windowless,L-shaped room 40 feet long and some 10 feet across. It is empty except for two dozenplain-looking orange and chrome chairs, each resting alongside a row of narrow cubicle-like desks. A digital clock that rests high on the wall breaks time down to seconds. It is7:30:15 a.m., and already 12 people have found their way into the “lock-up” room. Moreare expected within the next 15 minutes. All who enter dutifully sign their names on aspecial sheet.
Despite its austere appearance, there is an atmosphere of calm in the room, at leastfor now. Some visitors talk excitedly about the previous night’s televised basketballgame. Others are either chatting on cell phones or checking their Palm Pilots for mes-sages. A few keep to themselves by catching up on the morning paper or downing a quickmuffin and coffee. Everyone in the room, however, makes a point of always knowing thetime, with some people eyeing the digital clock so frequently that their actions may bemistaken for nervous tics.
As the time approaches 8 a.m., there is a palpable change in mood. Gone now are thesounds of light conversation; these sounds are replaced by the din of laptops firing up.Everyone appears to be focused on what is about to occur.
02Baumohl_Ch01.qxd 8/3/04 7:32 AM Page 1

At 7:55 a.m. sharp, a government official walks in and picks up a wall phone to callthe Naval Observatory, home to the Vice President of the United States. It is also thelocation of the ultra-accurate atomic clock. She listens intently for a few seconds and thenabruptly hangs up without saying a word. The individual then inserts a key into a lock onthe wall, which allows her to adjust the digital clock to the precise second. With the cor-rect time now set, the official then turns around to make a terse announcement.
“Please turn off all cell phones and Palm Pilots, and disconnect laptops from yourtelephone lines.”
To make sure everyone complies, the official walks across the room and eyes eachdesk. Meanwhile a second federal employee arrives carrying copies of a highly sensitivegovernment report. Each one is placed facedown on an empty desk.
Then it begins.At precisely 8 a.m., the door to the lock-up room clicks shut. From this point on, all
those inside are out of touch with the rest of the world. No one is permitted to leave. Nocalls or messages can come into or out of the room. Security is tight. A guard stands byoutside, ready to use force if anyone attempts to sneak out.
What secret is the government protecting? Is the CIA about to begin a classified brief-ing on intelligence activities? Are Congressional investigators huddling to hear the newestterrorist threat? No. All these precautions are taken for one reason. The government isabout to release numbers. Statistics. More precisely, economic statistics. The visitors in theroom are business reporters representing news organizations from around the world, andthis morning they’re working out of the Department of Labor’s secure press room.
Why such tight secrecy? Because in the next few seconds, these journalists will be thefirst to lay their eyes on one of the country’s most sensitive economic measures—themonthly report on employment conditions. It can shed fresh light on whether the U.S.economy is growing or facing a slowdown. Did the number of Americans who have jobsrise or fall in the latest month? Have hourly wages gone up or did they drop? Did peoplework more hours or less? These statistics might not seem particularly earthshaking to mostAmericans, but they can and do whip the global stock, bond, and currency markets into afrenzy. For individual investors and professional money managers, the information in thejobs report can mean the difference between having a winning or losing portfolio. It alsoexplains the need for the security measures. Individuals getting such hot figures ahead oftime can make a quick bundle of money because they know something of which no oneelse in the financial markets is yet aware. To prevent such abuses, the government guardsthese and dozens of other key economic indicators as tightly as a military base. It alsoimplements a carefully controlled procedure to disseminate sensitive economic news.
8:00:00 The instant the door is shut, reporters dive in to grab the latest release onemployment conditions, which up to now had been facedown. They have just 30 minutesto read, digest, and write their stories on how the job market changed during the previ-ous month. Most of the journalists arrived that morning with the expectation that the
2 Chapter 1 • The Lock-Up
02Baumohl_Ch01.qxd 8/3/04 7:32 AM Page 2
3Chapter 1 • The Lock-Up
employment release would carry dismal economic news, with the number of people with-out jobs rising—a troubling sign the economy was weakening. At least that was the opin-ion of most professional forecasters whom these reporters consulted just days earlier.
But on this particular morning, the employment report stuns everyone. Those in thelock-up room read with amazement that companies actually hired workers in far greaternumbers than anyone expected. Moreover, other figures inside the report appear to corrob-orate signs the economy is doing quite well. Wages are rising and factory overtime isincreasing. Far from slowing, the latest evidence indicates the economy is actually pickingup steam. It is astounding news of which the rest of the world is yet unaware.
As the digital clock continues its silent countdown, reporters working on the storysuddenly face some urgent questions. What’s really happening in the economy? Whywere so many “experts” caught off guard? What does this mean for future inflation andinterest rates? How might the stock, bond, and currency markets react to the news?
Though the latest jobs report was unexpected, these journalists are not completelyunprepared. As is their routine, a day or two earlier they showered private economistswith questions that covered a variety of hypothetical employment scenarios. What does itmean if the job market worsens? What if it actually improves? Now the reporters arefrantically searching through their interview notes to help them file their stories.
8:28:00 A Labor Department worker in the lock-up room notifies televisionreporters that they can now leave under escort to prepare for their live 8:30 broadcast ofthe jobs report.
For the remaining journalists in the room, there is just a brief warning: “Two minutesleft!” By now, most have pieced together their initial version of the story—the headline,the opening sentences, key numbers, and the implications for the economy. All that’s leftare some last-minute fact checking and a word tweak here and there.
8:29:00 “One minute. You can open your telephone lines—BUT DO NOTTRANSMIT!”
The level of tension is not just high in the lock-up room, for at that moment, moneymanagers and traders in New York, Chicago, Tokyo, Hong Kong, London, Paris, andFrankfurt are riveted to their computer screens, anxiously waiting for the release of thecrucial jobs report. It’s a stomach-churning time for them because investment decisionsthat involve hundreds of billions of dollars will be made the instant the latest employmentnews flashes across their monitors. Why such worldwide interest in how jobs fare inAmerica? For one, many foreign investors own U.S. stocks and bonds, and their valuescan rise or fall based on what the job report says. Second, the international economy isnow so tightly interconnected that a weak or strong jobs report in the U.S. can directlyimpact business activity in other countries. If joblessness in America climbs, consumerswill likely purchase fewer cars from Germany, wine from France, and clothing fromIndonesia. In contrast, a jump in employment means households will have more incometo spend on imports, and this can stimulate foreign economies.
02Baumohl_Ch01.qxd 8/3/04 7:32 AM Page 3
8:29:30 “Thirty seconds!” The fingers of reporters hover over their computer’sSend button, ready to dispatch the latest employment news to the world. On-air reportersare also prepared to deliver the news live.
8:29:50 An official counts the final seconds out loud.“Ten . . . nine . . . eight . . . seven . . . six . . . five . . . four . . . three . . . two . . . one!”8:30:00 “Transmit!” Reporters simultaneously hit the Send buttons on their key-
boards. In seconds, electronic news carriers, including Bloomberg, AP, Reuters, andJapan’s Kyodo News, release their stories. Television and cable news stations, such asCNBC, Bloomberg TV, CNN, and MSNBC broadcast the report live. A second or twolater, computer screens around the globe carry the first surprising words: “Jobs unexpect-edly rose the previous month, with the unemployment rate falling instead of rising!”
For journalists in the lock-up room, the stress-filled half-hour grind is over, and theyare now free to leave. But the work has just begun for those in the investment community.
At the Chicago Board of Trade (CBOT), where U.S. Treasury bonds and notes aretraded, news of the strong job growth sparks pandemonium. Bond traders were so surethey would see a deterioration in the job market that many had bet millions on such anoutcome. These traders bought bonds for clients prior to the government’s release onunemployment and expected to earn a quick bundle of money based on the followingstrategy: If the number of people employed fell, it would drag down consumer spending.That, in turn, would slow the economy, reduce inflation pressures, and cause bond pricesto turn up and interest rates to fall, thereby guaranteeing traders an easy profit.
The strategy was sound, but they bet on the wrong horse. Instead of laying off work-ers, companies were substantially adding to their workforce. The economy was not slow-ing, but demonstrating remarkable strength, and those bond traders who hoped to make afast buck for their customers now face losing lots of money. With more people gettingjobs, household income increases, and that leads to greater spending and borrowing. Thepresence of a more robust economy heightens concerns of future inflation and rising inter-est rates. The result: Bond prices begin tumbling and interest rates start climbing. In orderto cut their losses, hundreds of floor traders at the CBOT are now screaming, jumping upand down, flailing hand signals in a desperate attempt to rid themselves of bonds whosevalues are fast eroding.
Stock investors are also dazed by the news and jump into action. A drop in unemploy-ment is bullish for the economy. More consumer spending translates into higher businesssales and fatter corporate profits, which can lift share prices. However, because the NewYork Stock Exchange, the world’s largest marketplace for equities, doesn’t start trading foranother hour (9:30 a.m.), money managers rush to buy stock index futures on the ChicagoMercantile Exchange (CME), where S&P 500 and NASDAQ contracts are traded electron-ically virtually 24 hours a day, five days a week. Action here occurs at lightning speed,with orders being executed in just 3/10 of a second—faster than the blink of an eye. Theenthusiasm of traders in the pre-market hours is a harbinger of things to come. By noonthat day, stocks across the board reach their highest prices in months.
4 Chapter 1 • The Lock-Up
02Baumohl_Ch01.qxd 8/3/04 7:32 AM Page 4
At the same time, the New York Mercantile Exchange explodes into action.Commodity specialists in the cavernous trading room are also caught off guard by thejobs report and are now gesturing wildly and barking out orders to buy oil and gasolinecontracts on the expectation that a resilient economy will drive up demand for fuel in thefuture. After all, as business activity accelerates, factories operate longer hours and usemore electricity. Business and leisure travel should pick up as well. Airlines will usegreater amounts of fuel. The positive jobs report will encourage more shopping andweekend getaway trips, resulting in greater gasoline consumption. Thus, moments afterthe Labor Department releases the news on jobs, the futures prices of gasoline, heatingoil, and other types of fuel shoot up.
Meanwhile, in currency markets across Asia and Europe, news of the rebound inU.S. jobs makes the dollar a more attractive currency to own. Foreign investors arealways keen on placing their money wherever they can earn a better payoff in the globalmarketplace. This morning, with U.S. interest rates and stocks both heading higher, own-ing American securities makes the most sense. Foreigners proceed to load up on U.S.equities and bonds, causing the dollar to climb in value against other currencies.
Back in Washington, hours earlier an emissary from the Labor Department deliveredan advance copy of the employment release in a sealed package to the President’s topeconomic adviser. White House officials now huddle to discuss ways to spin the positivejobs report for political gain. How should the president comment on it? Does the employ-ment news require a change in public policy? How can it be used to support the adminis-tration’s economic plan? What impact might it have on the federal budget?
Unquestionably the single most important institution to evaluate the crucial employ-ment report is the Federal Reserve. Economists there also see the release before it goespublic. They begin to scrutinize the data to detect any stress or imbalance in the labormarket that could destabilize the economy. Fed experts ponder whether the unemploy-ment rate is falling so fast that it will drive wages higher and fire up inflation pressures.As they pore over the jobs statistics, a secret but informal discussion commences insidethe Fed on whether a change in interest rate policy is needed.
It has been a hectic morning for investors, policymakers, and reporters. But whatabout the vast majority of Americans? How did they respond to the turn of events in theemployment report? Did they drop everything at 8:30 a.m. and rush off with paper andpen to the nearest television or radio to take notes on how the economy changed themonth before? Not likely. In sharp contrast to all the frenetic activity in world financialmarkets, most households were preoccupied with carrying out the routines of daily life—getting ready for work, sending kids off to school, or doing some early shopping beforethe crowds show up at the supermarkets. Let’s face it—the data released on jobs is justtoo remote and abstract to be of much interest to them. However, that doesn’t mean theemployment news will not affect them; everyone in the country will in some manner be touched by what transpired in the financial markets after the jobs report went public.
5Chapter 1 • The Lock-Up
02Baumohl_Ch01.qxd 8/3/04 7:32 AM Page 5
It makes no difference whether one is a business owner, a retiree, a housewife, anemployee, a homeowner, or a renter. All will eventually feel the fallout from the newsthat came from the Labor Department’s press room that morning. That fallout will pro-duce a mixture of both favorable and unfavorable developments.
What might the benefits be? Clearly, rising employment is positive for the economy.The more American workers earn, the more they have to spend on goods and services. Aslong as there’s no danger of the economy’s expanding so fast that it threatens higher infla-tion, everyone gains from rising employment. Furthermore, the government spends less onunemployment benefits, which eases the strain on the federal budget. Now for the badnews. You’ll recall that when the government released its surprisingly strong jobs report, itspooked bond traders into selling Treasury securities, which quickly drove up interest rates.With the cost of credit going up, banks and other lenders have little choice but to raise theirrates on home mortgages and car loans. Even existing homeowners holding variable-ratemortgages now have to dig deeper into their pockets to make higher monthly payments.There’s more bad news. Remember how commodity investors at the New York MercantileExchange reacted by bidding up the price of oil and other kinds of fuel? That will shortlyspill in the retail sector, which means drivers will end up paying extra for gas and home-owners will shell out more for heating oil. Plane travel becomes more expensive too as air-lines boost fares to offset the higher cost of aviation fuel.
Now let’s return to positive consequences. In foreign exchange markets, the dollar’svalue jumped in response to the jobs news. A stronger U.S. currency is good for Americanconsumers because it lowers the price of imports such as foreign-made cars, home elec-tronics, and perfumes. That, in turn, puts pressure on U.S. firms to keep their own pricesdown, all of which helps contain U.S. inflation. Americans traveling overseas also can purchase more with each dollar. However, here’s the flip side to a muscular greenback: Ifyour job depends on selling products in foreign markets, you could be in trouble. A strongdollar makes U.S.-made goods more expensive in other countries, and foreign buyersmight want to look elsewhere for better deals.
U.S. ECONOMIC INDICATORS
It may be hard to believe all this action and reaction can be triggered by just a single sta-tistic. If you multiply that by more than 50 economic indicators that are released everyweek, month, or quarter, you begin to understand why the stock, bond, and currency mar-kets are in a perpetual state of motion. Among the other influential economic indicatorsthat can rattle financial markets are consumer prices, industrial production, retail sales,and new home construction. It is precisely because these indicators can so easily sway thevalue of investments that the government takes extraordinary steps to control the flow ofsensitive economic information.
That wasn’t always the case. Thirty years ago, barely any guidelines applied to therelease of economic reports. A lock-up room was a term reserved for prisons, not pressrooms. The lack of strict ground rules on the publication of these influential statistics
6 Chapter 1 • The Lock-Up
02Baumohl_Ch01.qxd 8/3/04 7:32 AM Page 6
created the perfect climate for abuse. Politicians tried to control the release of economicnews to score points with voters. When President Nixon heard the CommerceDepartment was about to go public with an upbeat figure on housing starts, he pressedthe agency to time the release for maximum political effect. On those occasions wheneconomic figures turned out to be a liability, Nixon sought to hold up the report untilsuch time he believed its release would get little notice.
Even Wall Street firms realized that big money could be made off the economicnumbers given the lax supervision of their release. Some brokerages went so far as todish out large amounts of money to reporters who were willing to leak economic news tothe firm’s traders before writing about it. Anyone who got an advance peek at the eco-nomic statistics stood to gain millions in a matter of minutes by knowing which stocksand bonds to trade. Eventually this blatant manipulation of the economic indicators led afurious Senator William Proxmire to schedule Congressional hearings in the 1970s onhow these reports are released. Later that decade, the government set up a strict calendarthat included rigid rules on how economic data would be distributed. Today, nearly everymajor economic indicator is released under tight lock-up conditions, which has enhancedthe integrity of how the public gets such sensitive information. Trading based on insideinformation of economic indicators is now virtually unheard of.
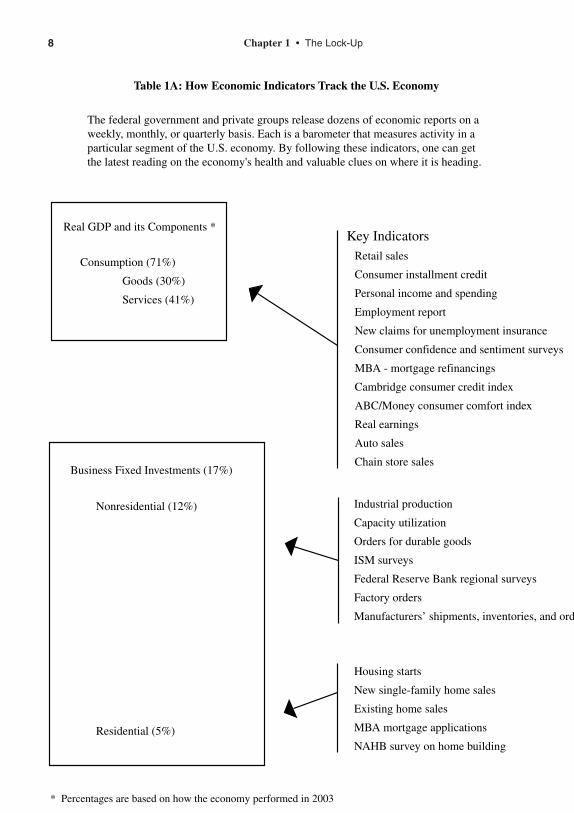
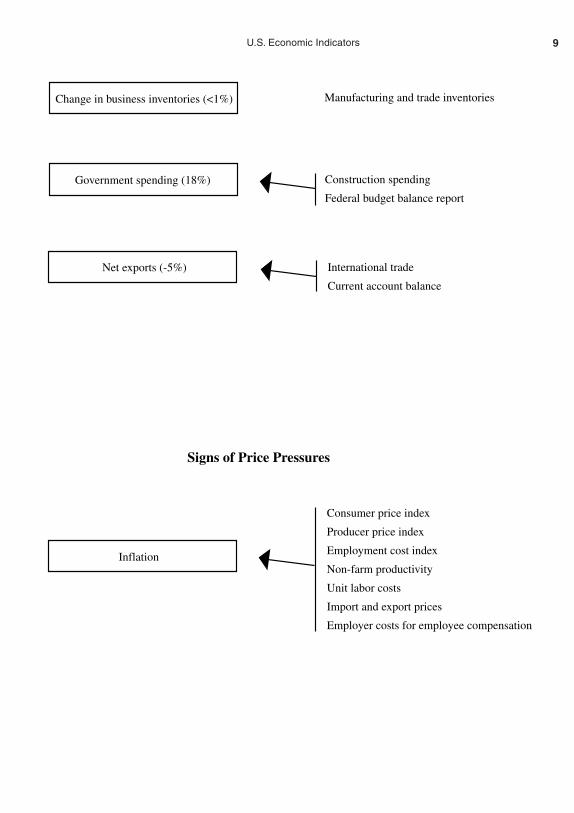
This still leaves us with the most important task of all, though. How do you decipherwhat all these indicators actually tell us about the economy? After all, at least four key eco-nomic indicators are released on a weekly basis, 43 every month, and nine each quarter. Dowe really need so many measures? Absolutely. The U.S. is the largest and most complexeconomy in the world. No single indicator can provide a complete picture of what the econ-omy is up to. Nor is there a simple combination of measures that provide a connect-the-dotspath to the future. At best, each indicator can give you a snapshot of what conditions arelike within a specific sector of the economy at a particular point in time (see Table 1A).Ideally, when you piece all these snapshots together, they should provide a clearer picture ofhow the economy is faring and offer clues on where it is heading.
Yet even if you took the time to absorb every bit of economic information and moni-tored each squiggle in the indicators, don’t expect to uncover a crystal-ball formula thatcan single-handedly forecast what consumer spending, inflation, and interest rates will doin the months ahead. That’s because there are some important caveats when dealing witheconomic indicators. First, they often fail to paint a consistent picture of the economy.Different indicators can simultaneously flash conflicting signals on business conditions.One can show the economy improving, while another may point to a clear deterioration.For example, the government might report a drop in the unemployment rate, normally abullish sign for the economy. However, a different employment survey might show a dayor two later that companies are laying off workers in record numbers. You’re now pre-sented with two contradictory portraits on labor market conditions, both covering thesame time period. Which should you believe?
7U.S. Economic Indicators
02Baumohl_Ch01.qxd 8/3/04 7:32 AM Page 7
8 Chapter 1 • The Lock-Up
The federal government and private groups release dozens of economic reports on a weekly, monthly, or quarterly basis. Each is a barometer that measures activity in a particular segment of the U.S. economy. By following these indicators, one can get the latest reading on the economy's health and valuable clues on where it is heading.
02Baumohl_Ch01.qxd 8/3/04 7:32 AM Page 8
9U.S. Economic Indicators
02Baumohl_Ch01.qxd 8/3/04 7:32 AM Page 9

The confusion doesn’t stop there. Another complication, one especially maddening toinvestors and economists, is that people can behave counterintuitively. Just look at two osten-sibly related reports: consumer confidence and consumer spending. The first measures thegeneral mood of potential shoppers; if they are upbeat about the economy, it stands to reasonthey will spend more. If there is widespread gloom and uncertainty about the future, logicwould lead you to believe people will curb their spending and save money instead. However,that’s not the way it plays out in the real world. There appears to be little relationshipbetween these two measures. During the mild 2001 recession, consumer confidence keptplummeting throughout the year, reaching levels not seen in decades. Yet these same con-sumers not only refused to cut back on spending that year, they bought homes and cars at arecord pace. Obviously, one cannot determine the outlook for consumer spending just bymonitoring the psychological state of American households. The inclination to spend is influ-enced by many factors, including personal income growth, job security, interest rates, and thebuild-up in wealth from the value of one’s home and the ownership of stocks and bonds.
There is also the quandary that comes with abundance. Everyone—from the profes-sional money manager down to the mom dabbling part time in the markets—can be over-whelmed by the statistical minutia out there. How do you discern which indicators areworth watching and which ones to view with skepticism or even ignore? How does aninvestor employ economic indicators to help choose which stocks and bonds to buy andsell, and when? Which measures should a business forecaster follow to spot coming eco-nomic trends? What key indicators should corporate chiefs rely on to help them decidewhether to hire new workers or invest in new equipment?
You can find the answers to these questions in subsequent chapters, but clearly someeconomic indicators are far more telling than others. Generally, the most influential statis-tics, those most likely to shake up the stock, bond, and currency markets, possess some ofthe following attributes:
• Accuracy: Certain economic measures are known to be more reliable than others inassessing the economy’s health. What determines their accuracy is linked to how thedata is compiled. Most economic indicators are based on results of public surveys.Getting a large and representative sample is thus a prerequisite for accuracy. Forinstance, to measure the change in consumer price inflation, the government’s Bureauof Labor Statistics sends out agents and conducts telephone interviews every month tofind out how much prices have changed on 80,000 items and services at 23,000 retailoutlets around the country. To calculate shifts in consumer confidence, the ConferenceBoard, a business research organization, polls 5,000 households each month.
Another variable is the proportion of those queried who actually came back withanswers. How quickly did they respond? The bigger and faster the response, thebetter the quality of the data and the smaller the subsequent revisions. If an indica-tor has a history of suffering large revisions, it generally carries less weight in thefinancial markets. After all, why should an investor buy stocks or a company hireadditional workers when the underlying economic statistic is suspect to begin with?
10 Chapter 1 • The Lock-Up
02Baumohl_Ch01.qxd 8/3/04 7:32 AM Page 10
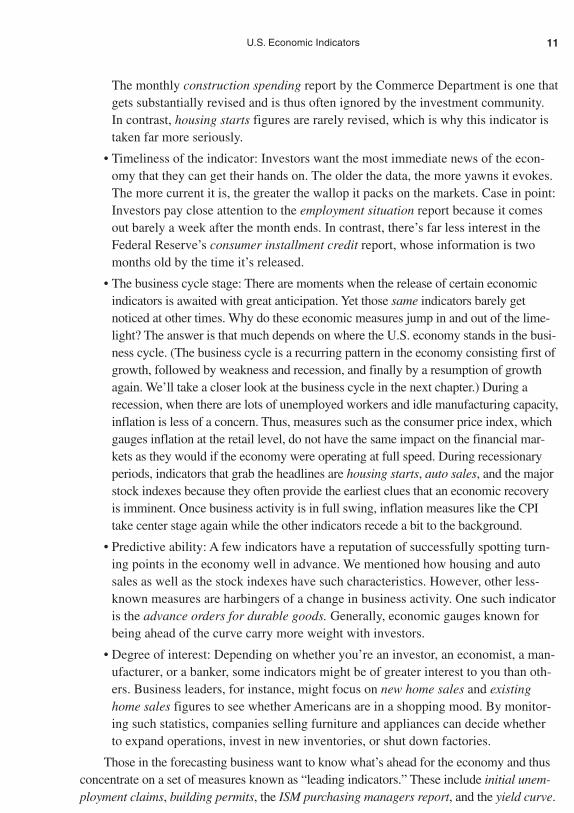
The monthly construction spending report by the Commerce Department is one thatgets substantially revised and is thus often ignored by the investment community.In contrast, housing starts figures are rarely revised, which is why this indicator istaken far more seriously.
• Timeliness of the indicator: Investors want the most immediate news of the econ-omy that they can get their hands on. The older the data, the more yawns it evokes.The more current it is, the greater the wallop it packs on the markets. Case in point:Investors pay close attention to the employment situation report because it comesout barely a week after the month ends. In contrast, there’s far less interest in theFederal Reserve’s consumer installment credit report, whose information is twomonths old by the time it’s released.
• The business cycle stage: There are moments when the release of certain economicindicators is awaited with great anticipation. Yet those same indicators barely getnoticed at other times. Why do these economic measures jump in and out of the lime-light? The answer is that much depends on where the U.S. economy stands in the busi-ness cycle. (The business cycle is a recurring pattern in the economy consisting first ofgrowth, followed by weakness and recession, and finally by a resumption of growthagain. We’ll take a closer look at the business cycle in the next chapter.) During arecession, when there are lots of unemployed workers and idle manufacturing capacity,inflation is less of a concern. Thus, measures such as the consumer price index, whichgauges inflation at the retail level, do not have the same impact on the financial mar-kets as they would if the economy were operating at full speed. During recessionaryperiods, indicators that grab the headlines are housing starts, auto sales, and the majorstock indexes because they often provide the earliest clues that an economic recoveryis imminent. Once business activity is in full swing, inflation measures like the CPItake center stage again while the other indicators recede a bit to the background.
• Predictive ability: A few indicators have a reputation of successfully spotting turn-ing points in the economy well in advance. We mentioned how housing and autosales as well as the stock indexes have such characteristics. However, other less-known measures are harbingers of a change in business activity. One such indicatoris the advance orders for durable goods. Generally, economic gauges known forbeing ahead of the curve carry more weight with investors.
• Degree of interest: Depending on whether you’re an investor, an economist, a man-ufacturer, or a banker, some indicators might be of greater interest to you than oth-ers. Business leaders, for instance, might focus on new home sales and existinghome sales figures to see whether Americans are in a shopping mood. By monitor-ing such statistics, companies selling furniture and appliances can decide whetherto expand operations, invest in new inventories, or shut down factories.
Those in the forecasting business want to know what’s ahead for the economy and thusconcentrate on a set of measures known as “leading indicators.” These include initial unem-ployment claims, building permits, the ISM purchasing managers report, and the yield curve.
11U.S. Economic Indicators
02Baumohl_Ch01.qxd 8/3/04 7:32 AM Page 11

Investors in the financial markets also have their favorite indicators; the specificmeasures they watch depend on what assets are at greatest risk. Those trading stocksfocus on indicators that foreshadow changes in consumer and business spending becausethey can affect future corporate profits and the price of shares (see Table 1B). For bondtraders, the looming concern is not company profits but the outlook for inflation andinterest rates. Any evidence suggesting that inflation might accelerate can hurt bonds.(See Table 1C for the economic indicators most sensitive to the bond market.) Players inthe currency markets look for economic news that can drive the dollar’s value up ordown. Signs pointing to a robust U.S. economy, for example, normally lure foreigners toinvest in this country, especially if the other major economies show comparatively littlegrowth. That lifts the greenback’s value against other currencies. (See Table 1D for themeasures most likely to move the dollar.)
Table 1B: Economic Indicators Most Sensitive to Stocks
Rank Indicator Page
1 Employment Situation Report (Payroll Survey) 25
2 ISM Report—Manufacturing 147
3 Weekly Claims for Unemployment Insurance 38
4 Consumer Prices 245
5 Producer Prices 255
6 Retail Sales 62
7 Consumer Confidence and Sentiment Surveys 86 and 91
8 Advance Report on Durable Goods 116
9 Industrial Production 137
10 GDP 100
Table 1C: Economic Indicators Most Sensitive to Bonds
Rank Indicator Page
1 Employment Situation Report (Payroll Survey) 25
2 Consumer Prices 245
3 ISM Report—Manufacturing 147
4 Producer Prices 255
5 Weekly Claims for Unemployment Insurance 38
6 Retail Sales 62
7 Housing Starts 169
8 Chicago Purchasing Managers Report 216
9 Industrial Production/Capacity Utilization 137
10 GDP 100
12 Chapter 1 • The Lock-Up
02Baumohl_Ch01.qxd 8/3/04 7:32 AM Page 12
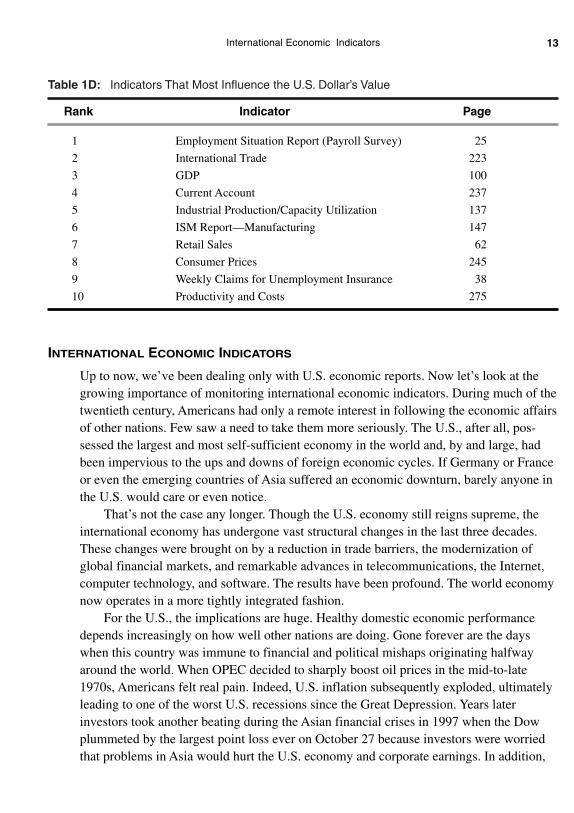
Table 1D: Indicators That Most Influence the U.S. Dollar’s Value
Rank Indicator Page
1 Employment Situation Report (Payroll Survey) 25
2 International Trade 223
3 GDP 100
4 Current Account 237
5 Industrial Production/Capacity Utilization 137
6 ISM Report—Manufacturing 147
7 Retail Sales 62
8 Consumer Prices 245
9 Weekly Claims for Unemployment Insurance 38
10 Productivity and Costs 275
INTERNATIONAL ECONOMIC INDICATORS
Up to now, we’ve been dealing only with U.S. economic reports. Now let’s look at thegrowing importance of monitoring international economic indicators. During much of thetwentieth century, Americans had only a remote interest in following the economic affairsof other nations. Few saw a need to take them more seriously. The U.S., after all, pos-sessed the largest and most self-sufficient economy in the world and, by and large, hadbeen impervious to the ups and downs of foreign economic cycles. If Germany or Franceor even the emerging countries of Asia suffered an economic downturn, barely anyone inthe U.S. would care or even notice.
That’s not the case any longer. Though the U.S. economy still reigns supreme, theinternational economy has undergone vast structural changes in the last three decades.These changes were brought on by a reduction in trade barriers, the modernization ofglobal financial markets, and remarkable advances in telecommunications, the Internet,computer technology, and software. The results have been profound. The world economynow operates in a more tightly integrated fashion.
For the U.S., the implications are huge. Healthy domestic economic performancedepends increasingly on how well other nations are doing. Gone forever are the dayswhen this country was immune to financial and political mishaps originating halfwayaround the world. When OPEC decided to sharply boost oil prices in the mid-to-late1970s, Americans felt real pain. Indeed, U.S. inflation subsequently exploded, ultimatelyleading to one of the worst U.S. recessions since the Great Depression. Years laterinvestors took another beating during the Asian financial crises in 1997 when the Dowplummeted by the largest point loss ever on October 27 because investors were worriedthat problems in Asia would hurt the U.S. economy and corporate earnings. In addition,
13International Economic Indicators
02Baumohl_Ch01.qxd 8/3/04 7:32 AM Page 13
who would have imagined that a bond default by Russia in 1998—a country with aneconomy the size of Illinois and Wisconsin combined—would be considered so grave athreat to world financial markets that the Federal Reserve was under pressure to orches-trate a global rescue plan to calm investors worldwide?
Just how dependent have American companies become on other nations for profitsand job creation? The numbers speak for themselves. Nearly half the earnings of S&P500 firms come from business generated outside the U.S. More than 22 million Americanworkers—nearly two in 10 jobs—are linked to foreign trade. One out of every four dol-lars generated in the U.S. economy is based on trade. What this all boils down to is thatforeign economic indicators should be followed with the same regularity, interest, andscrutiny as the domestic indicators. If foreign economies do well, U.S. firms are in a bet-ter position to sell more exports, earn more money, and keep millions of American work-ers employed. By closely monitoring the international indicators, U.S. companies canseek out new foreign markets or decide whether to expand (or shut down) facilities over-seas. American investors can diversify their portfolios more smartly by identifying andpurchasing those foreign stocks and bonds that might offer a lucrative return.
Another important reason to monitor the performance of other major economies isthat it helps us check the mood of foreign investors. As long as they view the U.S. as asafe and attractive place to invest, capital from abroad will continue to flow into thiscountry, and that is vital for the well-being of the U.S. economy. Foreign investors playan indispensable role in financing U.S. economic growth by lending this country an aver-age of nearly $2 billion a day—money that goes into buying stocks, bonds, and otherAmerican assets. Why does the U.S. need to borrow such huge sums from other nations?Because consumers and the federal government together spend so much on cars, comput-ers, military hardware, and health care (to name just a few items) that there’s little domes-tic savings left over. Yet savings is the lifeblood that keeps an economy healthy. It’s usedto finance productive investments, such as building efficient factories and funding theresearch and development of new and better products. Without adequate savings, the U.S.would be incapable of showing healthy long-term growth.
To make up for the shortfall in domestic savings, the U.S. has to lure the surplus sav-ings of other countries. In addition, while all that foreign capital entering the U.S. haskept the economy humming, serious risks come with being so dependent on overseascreditors. America’s total foreign debt has skyrocketed in the last decade from $50 billionto a staggering $1.5 trillion—the most of any nation in the world. In the process, foreign-ers have acquired an ever-increasing share of U.S. assets; they own 40% of all U.S.Treasury issues, 24% of American corporate bonds, and about 15% of all equities. Shouldthe mood of those investors turn sour on the U.S. market—something that can occur ifthere is poor expectation of investment returns here as compared with other countries—itcould spark a sell-off of American stocks and bonds by foreigners.
14 Chapter 1 • The Lock-Up
02Baumohl_Ch01.qxd 8/3/04 7:32 AM Page 14
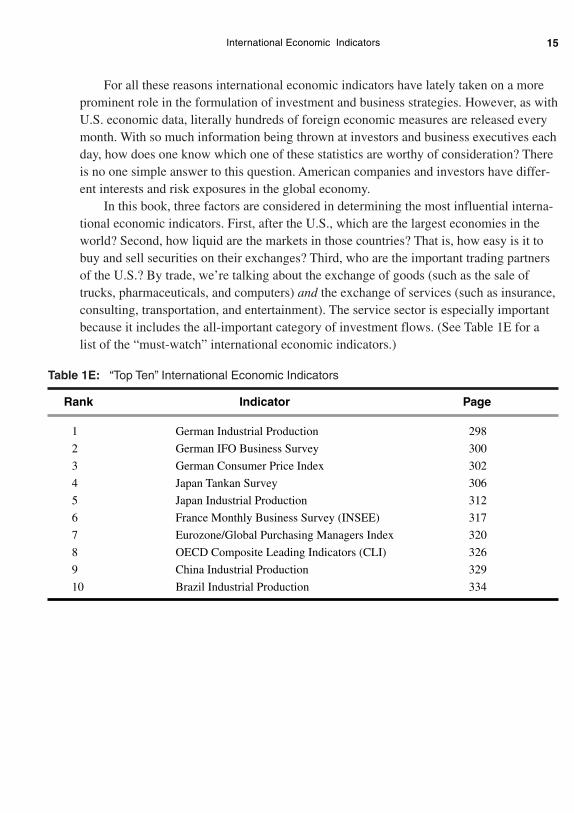
For all these reasons international economic indicators have lately taken on a moreprominent role in the formulation of investment and business strategies. However, as withU.S. economic data, literally hundreds of foreign economic measures are released everymonth. With so much information being thrown at investors and business executives eachday, how does one know which one of these statistics are worthy of consideration? Thereis no one simple answer to this question. American companies and investors have differ-ent interests and risk exposures in the global economy.
In this book, three factors are considered in determining the most influential interna-tional economic indicators. First, after the U.S., which are the largest economies in theworld? Second, how liquid are the markets in those countries? That is, how easy is it tobuy and sell securities on their exchanges? Third, who are the important trading partnersof the U.S.? By trade, we’re talking about the exchange of goods (such as the sale oftrucks, pharmaceuticals, and computers) and the exchange of services (such as insurance,consulting, transportation, and entertainment). The service sector is especially importantbecause it includes the all-important category of investment flows. (See Table 1E for alist of the “must-watch” international economic indicators.)
Table 1E: “Top Ten” International Economic Indicators
Rank Indicator Page
1 German Industrial Production 298
2 German IFO Business Survey 300
3 German Consumer Price Index 302
4 Japan Tankan Survey 306
5 Japan Industrial Production 312
6 France Monthly Business Survey (INSEE) 317
7 Eurozone/Global Purchasing Managers Index 320
8 OECD Composite Leading Indicators (CLI) 326
9 China Industrial Production 329
10 Brazil Industrial Production 334
15International Economic Indicators
02Baumohl_Ch01.qxd 8/3/04 7:32 AM Page 15

02Baumohl_Ch01.qxd 8/3/04 7:32 AM Page 16

C H A P T E R 2
A Beginner’s Guide:Understanding the Lingo
INTRODUCTION
Every field of study has its own jargon, an assortment of words or phrases with whichone has to grow familiar to understand the subject. Economic indicators are no different.You will regularly come across certain terms and expressions when dealing with meas-ures of economic performance. No need to worry, though. The language of economicindicators is fairly straightforward if you give it a chance. In many cases their meaningand significance are surprisingly obvious. So let’s proceed with some of the most com-mon concepts you’ll encounter when reading about these indicators.
ANNUAL RATES
You’re cruising down the highway at 65 miles per hour. Whether your destination is actu-ally 65 miles away is not important. What counts is what your speedometer tells you: Ifyou keep up this driving pace for a full hour, you will travel about 65 miles.
The term “miles per hour” is used to measure relative speed. A similar relationshipexists with economic indicators. A common way to compare how fast the economy isgrowing is to measure changes in activity in the form of annual rates. For instance, thegovernment might report that autos were selling at a 14 million vehicle annual rate theprevious month. That doesn’t mean automakers sold 14 million cars and trucks the monthbefore; it’s how many will be sold if last month’s pace were maintained for each of thenext 12 months. Why do it this way? The reason is experts find it easier to look at per-formance on a yearly basis.
The methodology used to annualize a figure is simple enough: To turn a monthlylevel into an annual rate, simply multiply it by 12. If you have two months of data thatyou want to annualize, multiply it by 6. If it’s a quarterly change—which is how the GDPis reported—multiply the three-month change in activity by 4. Thus, whenever you see aneconomic indicator reported in an annual rate, it is telling you what will happen if thatpace were sustained for a full 12 months.
03Baumohl_Ch02.qxd 8/3/04 7:33 AM Page 17
BUSINESS CYCLE
Like human nature, the economy has its ups and downs. At times the economy can growrobustly, with household income rising, consumers happily spending, and companies hir-ing and expanding their business. However, there also are periods when the economylooks tired, with growth barely perceptible. There’s less consumer shopping and little, ifany, new business investment under way. In the most extreme case, the economy actuallyshrinks, which is what happens in a recession. Over time, however, recessions give wayto a fresh round of economic activity. These swings, from good times to awful times andthen eventually back to good times again, are roughly what we mean by a business cycle.
Why does the economy have such cycles? Why not have steady, continuous, non-stop growth? After all, that should make everyone happy.
The reason the economy is condemned to undergo business cycles is because it’sonly natural. An open economy is essentially a reflection of human behavior with mil-lions of people making decisions every day. What should they buy? How much can theyspend? Is it time to invest in stocks? Corporate leaders face different issues. Is it time tohire workers? Rebuild inventories? Buy another company?
Occasionally consumers and businesses make mistakes that can have broader eco-nomic consequences. Households might have borrowed so much that they’re having diffi-culty servicing their debt. Banks could see their profits slip as loan defaults rise. Retailersmight miscalculate by loading up their stockrooms with new goods just when consumersare cutting back on spending. If the mistakes are grave enough and widespread, they canlead to an economic downturn with people being laid off. Fortunately, the governmenthas several tools at its disposal to revive growth again, such as lower interest rates, taxcuts, and greater federal spending.
The business cycle itself has five phases. The first phase refers the highest point ofoutput the economy achieves just before it gets into trouble and turns down. After thepeak comes phase two, which is the recession itself, a painful process whereby the econ-omy actually shrinks. It saps the wealth and confidence of households and causes all sortsof financial distress for business. Such economic contractions can last six months or aslong as several years. The third phase is reached when the economy finally hits bottom, apoint known as the recession trough. The fourth occurs after the economy stops shrinkingand resumes it growth path, or recovery. Finally, when the level of economic activity (oroutput) pushes past the previous high point, the business cycle marks the fifth and lastphase, often referred to as the expansion.
Because a recession is an integral part of the business cycle, it’s important to definejust what we mean by that term. Many economists and journalists declare a recessionwhen there are two back-to-back quarters of negative GDP growth. Those quarters equalsix consecutive months where the economy is shrinking. However, that is a rough, finger-in-the-wind assessment. The real task of determining when a recession begins and ends is
18 Chapter 2 • A Beginner’s Guide: Understanding the Lingo
03Baumohl_Ch02.qxd 8/3/04 7:33 AM Page 18
left to a select group of academic economists working under the National Bureau ofEconomic Research (NBER), a non-governmental and nonpartisan think tank based inMassachusetts. They make the call on whether the economy has turned down or up byevaluating several key economic indicators, such as job growth, personal income, indus-trial production, as well as the quarterly GDP figures.
According to the NBER, there have been 32 business cycles in the U.S. since 1854,with the average recession lasting 17 months. Since World War II, there have been 10business cycles with recessions averaging only 10 months long—which means the econ-omy is now achieving longer periods of growth before getting into trouble. Just why theeconomy has been experiencing fewer recessions lately is a topic of debate among econo-mists, though most attribute it to improved economic policymaking in Washington com-bined with a more versatile business sector.
CONSENSUS SURVEYS
You’re all set to go out for a leisurely walk. Weather forecasters have predicted sunnyskies and warm temperatures, so you head out in shorts and leave the sweater at home.Ten minutes later a heavy thunderstorm erupts, followed by colder air. You quicklyscramble back for a change of clothing, all the while cursing the forecasters. How couldthey have gotten it so wrong?
Money managers encounter similar experiences, except that instead of weather, theytend to rely on surveys that feature forecasts from experts on what an upcoming eco-nomic indicator will report. If the actual economic news falls in line with expectations,there is generally little market reaction to the news because investors already anticipatedit. By getting it right, those forecasters demonstrated that they have a good grasp on whatthe economy is up to. However, had the news about the economy turned out to be radi-cally different from what private experts predicted, money managers would have rushedin to readjust their investment positions. These abrupt moves can potentially shake up thevalue of stocks, bonds, and currencies. Why such violent market reactions? Any majordeparture from expectation means something is going on in the economy for which theexperts failed to account. Naturally this brings fresh uncertainty about current and futureeconomic conditions. The bigger the gap between consensus expectations and reality, thelarger the backlash in the financial markets.
Who puts out these consensus surveys, and how are they done? Many financial wireservice organizations, such as Bloomberg, Dow Jones, Reuters, and Market NewsInternational, produce their own consensus surveys by polling economists for their pre-dictions on key upcoming economic indicators. These indicators include consumer prices,producer prices, industrial production, retail sales, capacity utilization, and others. Themethodology used is fairly simple: The responses of individual business economists arebasically averaged out, and that becomes the consensus forecast.
19Consensus Surveys
03Baumohl_Ch02.qxd 8/3/04 7:33 AM Page 19
Chapter 2 • A Beginner’s Guide: Understanding the Lingo20
MOVING AVERAGE
There’s great temptation to jump to a conclusion about the economy’s health from justone month’s data, but that’s not a wise practice. Economic numbers can be faulty, inaccu-rate, or at the very least, misleading because of unusual events such as a major laborstrike or severe weather conditions. Such situations can diminish the reliability of an eco-nomic indicator in the short term, so it’s important to use caution when extrapolatinginformation from just a single month’s data.
To get a truer sense of the underlying trend in the economy, it’s far better to rely on amoving average of economic numbers. Simply put, a moving average is a computation inconstant motion because it always averages data for the most recent fixed number ofmonths. As a result, the average changes with the introduction of each new monthlyreport. For example, let’s say consumer price inflation shot up 1% in the most recentmonth. Obviously a rise of that magnitude could raise lots of red flags. However, beforeanyone panics, it’s far more prudent to consider inflation’s actual trend by looking at itsmoving average over the past three or six months. To do this, simply add up the inflationchanges over the last three or six months and divide by the total number of months youconsidered. When the next set of inflation figures are released a month later, recalculatethe moving average by including the new figure in the equation and discarding the oldestmonthly data so that you are always averaging the latest three- or six-month periods. Thevirtue of moving averages is that they smooth out random fluctuations and make long-term trends clearer. One disadvantage of a moving average is that it’s a lagging indicator.Averages are slower to respond when there’s a genuine change in the economy’s direction.
NOMINAL DOLLARS VERSUS REAL DOLLARS (ALSO KNOWN AS CURRENT
DOLLARS VERSUS CONSTANT DOLLARS)
Anything measured in dollars can be looked at in two ways. Nominal dollars (alsoreferred to as current dollars) represents the actual amount of money spent or earned overa period of time. You’ll see stories mentioning how American factory workers receivedtotal pay hikes of $500 million, or a 5% increase, in the last 12 months. Or perhaps youread that company A reported income from sales of sweaters climbed to $220 million thatyear, up from $200 million the year before, or a jump of 10%. These figures are based innominal dollars.
However, nominal (or current) dollars gives you only part of the story. What’s miss-ing is how inflation can distort such numbers. Let’s go back to the example of the earn-ings of factory workers. They might have seen their pay jump by 5% in nominal terms,but before anyone celebrates, someone should ask this question: “What if the price ofgoods and services (i.e., inflation) rose by 4% during that same period?” In that case, thewages of these workers rose by a less-than-impressive 1% in real (or constant) dollars. Inother words, the actual increase in purchasing power these workers gained from their payhike was far smaller than 5%.
03Baumohl_Ch02.qxd 8/3/04 7:33 AM Page 20
Let’s now look at company A. It noted that sales revenue jumped by 10%. However,that doesn’t necessarily mean it sold 10% more sweaters. In fact, the firm ended up sell-ing the same number of sweaters both years. The only reason it received more money inthe second year is because the company raised the price of sweaters by 10%. Thus, theincrease in real (constant) dollar sales was actually zero!
Nominal dollars simply reflects the present value of goods and services exchanged inthe marketplace. However, real dollars tells you the true value of goods and services pro-duced or sold because it strips out the effects of inflation. When economists and investorswant to compare the performance of the economy over different time frames, they gener-ally look at both measures—nominal and real. They note the change in the size of theeconomy in nominal dollars because that points to what individuals, businesses, and thegovernment actually spent. However, to find out if the economy genuinely expanded byproducing more in quantity or volume, economists and investors look at the numbers inreal-dollar terms.
REVISIONS AND BENCHMARKS
Traders and money managers are always hungry for the very latest piece of economicnews. The more timely the information, the more influential it is; and the faster investorscan get their hands on it, the quicker they can act.
Therein lies the problem. Government agencies and private groups that supply eco-nomic data to the public are under tremendous pressure to get it out quickly, and that’s noteasy. Every week or month, depending on the economic indicator, statisticians follow arigid schedule to query sources in the field, collect the raw responses, organize the data,readjust for seasonal factors, perhaps recalculate the numbers to adjust for inflation, andthen write some introductory comments about the results before finally releasing it to thepublic. It’s a hurried process where accuracy and completeness take a backseat at times togetting the information out on deadline. For this reason the first release of many economicindicators contains pieces of data that are far from reliable and thus considered preliminary.
Of course, to many investors, it makes little difference whether the initial data is reli-able. They’ll trade on these numbers anyway because the figures represent the very latestinformation they can get on the economy. Later, though, as more information is receivedand after statisticians have had a chance to review their computations, the preliminaryfigures undergo one or more revisions. Though revisions to earlier data are also read byinvestors, they generally do not spark much trading because by then the informationrefers to a time period that has long since passed. Investors usually focus on the future,not the past. Economists, however, take revisions more seriously because the new figurescan affect their forecasts of economic activity.
Benchmark changes are different from monthly revisions. The latter is an ongoingeffort to make the statistical results more accurate, especially if there was insufficienttime to gather all the data. However, benchmark changes come about once a year or so
21Revisions and Benchmarks
03Baumohl_Ch02.qxd 8/3/04 7:33 AM Page 21
when the government introduces new seasonal adjustment factors or decides to undertakea formal change in the methodology itself. Benchmark revisions can affect economic datagoing back five, 10, or even more years to allow for historical comparisons.
SEASONAL ADJUSTMENTS
Before most economic indicators are released, they are calculated to reflect seasonaladjustments. What are seasonal adjustments? The simplest way to answer this question iswith an example. It’s no surprise that consumers do a lot more shopping during theNovember/December holiday period than at other times of the year. In addition, when theChristmas shopping season is over, retail sales often slow in January and February. Theseseasonal shifts in consumer spending patterns are quite common. They’re temporarychanges that have nothing to do with the business cycle.
Let’s look at another example. In the spring when schools close, the number of peo-ple getting jobs surges as students enter the workforce to earn money over the summer.By mid-August, the process is reversed and employment drops off as students leave theworkforce and return to school. Again, these fluctuations in employment are perfectlynormal and are not indicative of a fundamental change in the economy’s health. Evenindustrial production tends to fall in July as automakers shut down plants that month toretool their assembly lines for the new model year. No one should conclude this slow-down in industrial output means that the manufacturing sector is in trouble. These are allroutine seasonal shifts that take place in the economy.
How do you differentiate changes that are the result of normal seasonal factors fromthose that represent a more serious problem in the economy? That’s where the seasonaladjustment process comes in. Government experts look at economic data going back fiveto 10 years to identify recurring trends. These trends are changes in economic activitythat have nothing to do with the broader business cycle but that can be explained byshort-term external factors (such as summers, winters, and major holidays). After observ-ing such patterns, officials come up with a formula that factors out variations in the eco-nomic numbers attributable to seasonal changes. This enables private economists andinvestors to discern economic events that should be viewed as normal from those that areout of the ordinary.
Seasonal adjustments, however, are far from perfect. You could have abnormal eco-nomic data even after seasonal adjustments are considered, and it still doesn’t necessarilysignal a turning point in the economy. Blizzards, floods, terrorism, labor strikes, andmajor bankruptcies are all unpredictable shocks that can have an impact on economicoutput, but their effects are almost always short-lived. Moreover, these incidents are easy
22 Chapter 2 • A Beginner’s Guide: Understanding the Lingo
03Baumohl_Ch02.qxd 8/3/04 7:33 AM Page 22

to identify as the cause behind any sharp deviation in business activity. By and large, sea-sonal adjustments are important to analysts because they can help identify true deviationsfrom the normal course of activity in the economy.
Now that we have reviewed some of the most widely-used terms that accompany eco-nomic indicators, we’re ready to move on to the next chapters. What are the world’s mostinfluential economic indicators, and how do you get the most out of these statistics? Howdo you locate them? Interpret them? Most important of all, where can you find the cluesthat can tip you off on how the economy might perform in the future?
23Seasonal Adjustments
03Baumohl_Ch02.qxd 8/3/04 7:33 AM Page 23

03Baumohl_Ch02.qxd 8/3/04 7:33 AM Page 24
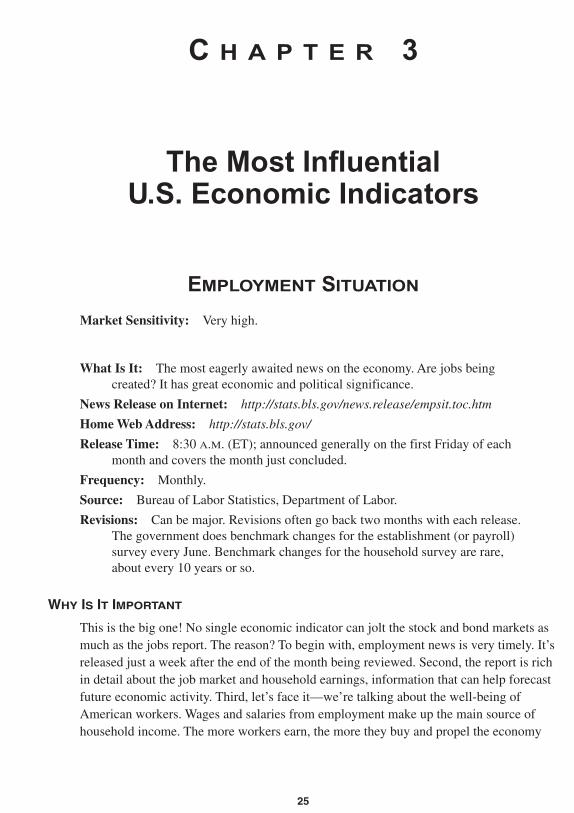
25
C H A P T E R 3
The Most Influential U.S. Economic Indicators
EMPLOYMENT SITUATION
Market Sensitivity: Very high.
What Is It: The most eagerly awaited news on the economy. Are jobs beingcreated? It has great economic and political significance.
News Release on Internet: http://stats.bls.gov/news.release/empsit.toc.htm
Home Web Address: http://stats.bls.gov/
Release Time: 8:30 A.M. (ET); announced generally on the first Friday of eachmonth and covers the month just concluded.
Frequency: Monthly.
Source: Bureau of Labor Statistics, Department of Labor.
Revisions: Can be major. Revisions often go back two months with each release.The government does benchmark changes for the establishment (or payroll)survey every June. Benchmark changes for the household survey are rare,about every 10 years or so.
WHY IS IT IMPORTANT
This is the big one! No single economic indicator can jolt the stock and bond markets asmuch as the jobs report. The reason? To begin with, employment news is very timely. It’sreleased just a week after the end of the month being reviewed. Second, the report is richin detail about the job market and household earnings, information that can help forecastfuture economic activity. Third, let’s face it—we’re talking about the well-being ofAmerican workers. Wages and salaries from employment make up the main source ofhousehold income. The more workers earn, the more they buy and propel the economy
04Baumohl_Ch03.01-03.12.qxd 8/3/04 7:44 AM Page 25
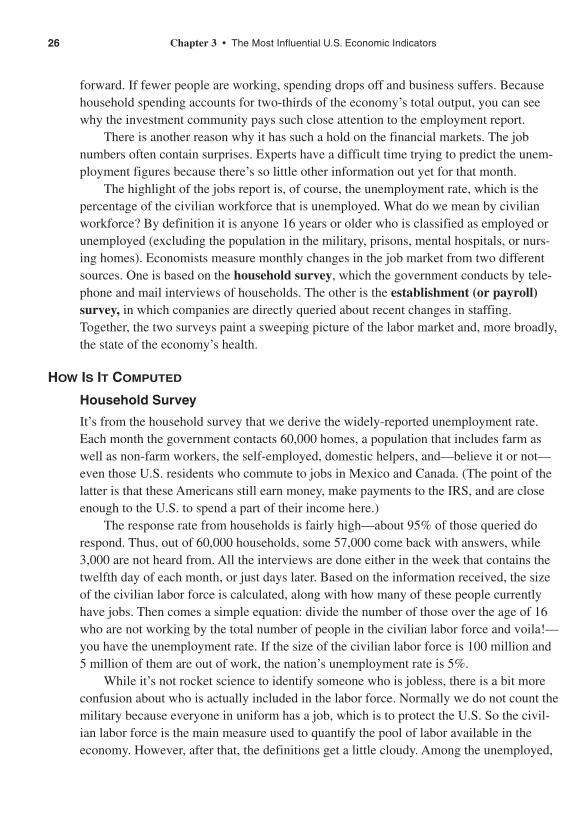
forward. If fewer people are working, spending drops off and business suffers. Becausehousehold spending accounts for two-thirds of the economy’s total output, you can seewhy the investment community pays such close attention to the employment report.
There is another reason why it has such a hold on the financial markets. The jobnumbers often contain surprises. Experts have a difficult time trying to predict the unem-ployment figures because there’s so little other information out yet for that month.
The highlight of the jobs report is, of course, the unemployment rate, which is thepercentage of the civilian workforce that is unemployed. What do we mean by civilianworkforce? By definition it is anyone 16 years or older who is classified as employed orunemployed (excluding the population in the military, prisons, mental hospitals, or nurs-ing homes). Economists measure monthly changes in the job market from two differentsources. One is based on the household survey, which the government conducts by tele-phone and mail interviews of households. The other is the establishment (or payroll)survey, in which companies are directly queried about recent changes in staffing.Together, the two surveys paint a sweeping picture of the labor market and, more broadly,the state of the economy’s health.
HOW IS IT COMPUTED
Household Survey
It’s from the household survey that we derive the widely-reported unemployment rate.Each month the government contacts 60,000 homes, a population that includes farm aswell as non-farm workers, the self-employed, domestic helpers, and—believe it or not—even those U.S. residents who commute to jobs in Mexico and Canada. (The point of thelatter is that these Americans still earn money, make payments to the IRS, and are closeenough to the U.S. to spend a part of their income here.)
The response rate from households is fairly high—about 95% of those queried dorespond. Thus, out of 60,000 households, some 57,000 come back with answers, while3,000 are not heard from. All the interviews are done either in the week that contains thetwelfth day of each month, or just days later. Based on the information received, the sizeof the civilian labor force is calculated, along with how many of these people currentlyhave jobs. Then comes a simple equation: divide the number of those over the age of 16who are not working by the total number of people in the civilian labor force and voila!—you have the unemployment rate. If the size of the civilian labor force is 100 million and5 million of them are out of work, the nation’s unemployment rate is 5%.
While it’s not rocket science to identify someone who is jobless, there is a bit moreconfusion about who is actually included in the labor force. Normally we do not count themilitary because everyone in uniform has a job, which is to protect the U.S. So the civil-ian labor force is the main measure used to quantify the pool of labor available in theeconomy. However, after that, the definitions get a little cloudy. Among the unemployed,
26 Chapter 3 • The Most Influential U.S. Economic Indicators
04Baumohl_Ch03.01-03.12.qxd 8/3/04 7:44 AM Page 26
the government includes in its labor force only those who are actively looking for work.Any jobless person who is so discouraged by the poor employment prospects that he orshe is not actively seeking employment is excluded from the labor force count and thus isnot reflected in the main unemployment rate. (To be fair, the employment report doespublish a separate unemployment rate that includes even discouraged workers, but thislittle-known figure is buried deep in the 25-page release. You’ll see precisely where in thenext section, The Tables: Clues on What’s Ahead for the Economy.)
The data in the household survey can be quite valuable to anyone doing research ondemographics and marketing. It breaks down the population of those who have jobs—andthose who do not—by age, sex, ethnicity, educational achievement, and marital status.The highest jobless rate is usually found among teenagers, both male and female. That’sfollowed by blacks, Hispanics, and then whites. The lowest unemployment has tradition-ally been married men. Clearly, lots of useful information can be gleaned from the data.However, one should bear in mind that the household jobs survey has one serious vulner-ability. Its integrity is based on the answers given by household members, and they mightnot always be accurate.
Establishment Survey
The establishment survey—often referred to as the payroll survey—is considered by manyto be a better employment measure than the household survey, and it has consequentlygrabbed most of the attention of the press and money managers around the world. What’sspecial about it? The information it gathers on the job market comes directly from businessestablishments, not households. The Bureau of Labor Statistics gets in touch with 400,000companies and government agencies. These entities employ more than 40 million workers,or about 45% of total non-farm employment. The information is obtained by both mail andtelephone, and it is collected using the same mid-month schedule as the household survey.Given the large number of places to contact, only 60% to 70% of the responses make itback in time for the first scheduled release of the employment numbers. The reason for theinitial low response is that small businesses are notorious for being late with their replies,yet these firms traditionally are the first to hire and fire workers. As more of them eventu-ally submit their answers, the response rate climbs to the mid-80% range, which forms thebasis of subsequent revisions in each of the next two months.
The establishment survey includes all persons on the payroll of non-farm businesses,non-profit groups, and local, state, and federal government offices. Even residents ofMexico and Canada who travel to their jobs in the U.S. are counted. That last groupmight strike some as bizarre. Remember, however, that all the establishment survey doesis tally the number of jobs created or lost in the U.S. business and government sectors,regardless of who filled those posts. The only groups excluded from the establishmentsurvey are farm workers, the self-employed, and domestic help.
27Employment Situation
04Baumohl_Ch03.01-03.12.qxd 8/3/04 7:44 AM Page 27
Chapter 3 • The Most Influential U.S. Economic Indicators28
What makes the establishment survey such a favorite among economists and investorsis that it contains a veritable gold mine of data on the latest changes in employment andincome, information that can reveal much about how well the U.S. economic machine isworking. To give you a sense of the richness of the data in the payroll numbers, the gov-ernment looks at more than 500 different industries. Among the most important statisticsfrom the report is the net number of new jobs formed or lost in the latest month. How longdid the average workweek last? How much overtime was generated? What were the aver-age hourly and weekly earnings in the month, and how do they compare to earlier periods?The establishment survey also breaks down many of these issues by geographic locationsand by specific industries, so you can quickly tell which businesses and regions in thecountry are doing well and which appear to be in a slump.
An interesting question arises at this point. Because the household and establishmentsurveys are based on two different sources, to what extent do they agree with what’s hap-pening in the employment market? It should come as no surprise that they occasionallytell conflicting stories. For instance, if the unemployment rate, a figure derived from thehousehold survey, drops one month, it gives the impression that the economy is improv-ing and that more people are finding jobs. Yet the establishment survey may simultane-ously report that tens of thousands of jobs were actually lost that month.
Why do the two measures occasionally diverge? The reason is they each probe the jobmarket from different perspectives. The household survey collects data on working-ageindividuals, while the establishment survey doesn’t bother with age. It merely asks compa-nies if they hired new workers. Second, the two surveys have separate guidelines. Thehousehold poll includes both farm and non-farm workers, the self-employed, and domestichelp. In contrast, the establishment survey covers a narrower population segment by look-ing only at non-farm workers in the economy; it excludes the others.
Another key difference between the two surveys is that the establishment reportmakes no distinction between full and part time work. Remember, its main focus is toreport how many jobs were created. If one individual has two part-time jobs, the house-hold survey counts that as one employee, but the establishment survey considers it twojobs. Thus, if 100 new positions were created according to the establishment survey, itdoesn’t necessarily mean 100 people found new employment. One individual could beholding multiple part-time jobs. Thus, it is easy to see why the two reports might conflict.However, that doesn’t undermine their validity. Each survey has important informationabout the economy that the other lacks. In any event, over the long run, both the house-hold and establishment numbers do move in tandem.
THE TABLES: CLUES ON WHAT’S AHEAD FOR THE ECONOMY
Let’s look at those nuggets of information in the official release that can provide freshinsight on current labor market conditions and what they say about the economy’sfuture direction.
04Baumohl_Ch03.01-03.12.qxd 8/3/04 7:44 AM Page 28
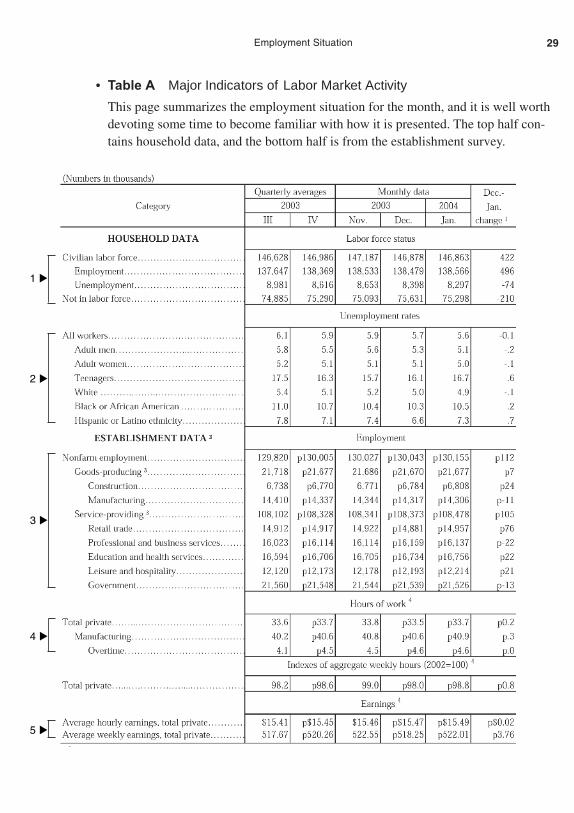
29Employment Situation
• Table A Major Indicators of Labor Market Activity
This page summarizes the employment situation for the month, and it is well worthdevoting some time to become familiar with how it is presented. The top half con-tains household data, and the bottom half is from the establishment survey.
▲
1
▲
2
▲3
▲
4
▲
5
04Baumohl_Ch03.01-03.12.qxd 8/3/04 7:44 AM Page 29
30 Chapter 3 • The Most Influential U.S. Economic Indicators
(1) This section has the latest count on the size of the civilian labor force and thenumber of those who are, and are not, employed. The far right column is thechange in the figures from one month to the next. Of all the numbers in this sec-tion, the most interesting to watch are changes in household employment. Thiscan be a sensitive leading indicator of an economy turning up because householdemployment also captures the self-employed and the people they hire, some-thing the payroll survey doesn’t do. Both the number of self-employed and thoseworking for small start-up firms tend to increase at a faster rate than the rest ofthe labor market in the early stages of a recovery. Thus, as a recession nears itsend, keep an eye on household employment; it may start to climb well before thepayroll statistics do.
(2) Here you’ll find the latest monthly unemployment rates for all workers, alongwith a demographic breakdown of that population. Many economists often referto the unemployment rate as a lagging indicator, which means it responds slowlyto changes in the economy. As a result, they say, there is little one can divinefrom it about the future. However, that’s not quite the case. By and large, theunemployment rate itself is of no use in forecasting an economic recovery.Joblessness can remain stubbornly high as long as two years after a recessionends because most employers are reluctant to add to their payrolls unless they’reconvinced the economy is genuinely on a solid growth path. Another reason forthe slow rebound in job creation is that companies have made great strides inoperating more efficiently. Thanks to the widespread use of computerized equip-ment, better inventory management, and greater foreign outsourcing of produc-tion, employers can more easily raise output without hiring back U.S. workers inthe numbers they once did.
Where the unemployment rate can serve as a leading indicator is by warning of animpending downturn in economic activity. Since the early 1980s, the increased useof sophisticated software and electronic networking has allowed firms to respondmuch more quickly than in the past to changes in the demand for goods and serv-ices. As soon as executives detect signs of a softening in business activity, they actfaster to control costs. Because labor is the single largest expense to companies,layoffs are now occurring months before the onset of a recession. In the1990–1991 recession, the jobless rate began to climb three months before businessactivity turned down. And when the 2001 recession started, the unemployment ratebottomed out a year earlier. Thus, this indicator is capable of acting as an earlywarning system that the economy may be in trouble.
04Baumohl_Ch03.01-03.12.qxd 8/3/04 7:44 AM Page 30
31Employment Situation
One last point about the unemployment rate—on average, about 150,000 newpeople of working age enter the labor force every month simply because of thenation’s population growth and from students who graduate. This means that theeconomy needs to create that many jobs each month on average just to keep theunemployment rate from rising. Most economist seem to agree that to producethat many new positions every month, the economy must over time expand by at least a 3–4% annual rate. Should growth fall below that pace, fewer jobs arecreated, and the unemployment rate will climb higher.
(3) Want to know which economic statistic generates the most excitement in thestock and bond markets every month? It’s the monthly change in non-farmemployment from the establishment data. All the figures in this section arederived from payroll records and represent the strongest evidence of whether thecountry is creating jobs. Many analysts evaluate the strength of the economy onthe basis of how many net new positions have been formed. However, one has tobe careful about jumping to conclusions. The change in the number of non-farmjobs created includes positions in government. To find out what is happening inthe private business sector, one has to subtract the government’s contributionfrom total non-farm payroll. Here’s an illustration of why that could be impor-tant. Let’s say the establishment survey shows the number of non-farm jobsdropped by a net 50,000 workers in one month. A troubling sign for the econ-omy? Not necessarily. It could be that the business community was strongenough to create 30,000 net new jobs in the month, but that was offset when thegovernment laid off 80,000 positions in the same period (30,000 – 80,000 =–50,000). In this example, the business community was healthy enough to add30,000 workers, but that was overshadowed by cutbacks in government jobs.Thus, it’s important to keep an eye on how federal, state, and local governmentsinfluence overall non-farm employment.
(4) Differences in hours worked is another advance indicator of future economicactivity. If you want to get a preview of the economy’s direction, follow thechanges in average hours worked in a week. It correlates very closely with over-all output (GDP) and also changes in personal income. If the number of hoursworked increases for three consecutive months, it’s a strong sign that businesswill soon accelerate hiring. Should the number of hours worked show a pro-longed decline, expect layoffs and cutbacks in business and consumer spending.The number of hours worked in manufacturing is especially sensitive to anyshift in the public’s demand for goods. When average weekly manufacturing
04Baumohl_Ch03.01-03.12.qxd 8/3/04 7:44 AM Page 31
32 Chapter 3 • The Most Influential U.S. Economic Indicators
hours dips below 41, it’s often an indication that the economy is struggling,while 41.5 hours and above suggests business activity is moving into highergear. In recent history, average hours worked in manufacturing has ranged froma recession-level 40.1 to a robust 41.9 hours.
Inside the employment report, you’ll also find Table B-2 (not shown), whichbreaks down hours worked for over 30 industry groups. This information can tipoff investors on the health of specific sectors in the economy. For example, ifaverage weekly hours in the building industry drops, it could lead a fall in hous-ing starts, cause higher unemployment among construction workers, and hurtother firms whose fortunes are linked to home building.
Overtime hours are another excellent indicator of future employment and GDPtrends. During periods of economic uncertainty, instead of hiring new workers,companies might ask existing employees to put in extra hours. If overtimeincreases and that pace is sustained for at least three months, firms will be underpressure to consider hiring again. Overtime can be quite costly to a company,and, let’s face it, at some point you will exhaust your present employees anddiminish the quality of their work. Thus, rising overtime is a precursor to newpermanent hires. Weekly manufacturing overtime normally fluctuates within anarrow range of between four and five hours. If it slips below four hours a weekfor a few months, layoffs might increase. A consistent reading above 4.5 over-time hours presages new hiring.
(5) At the bottom of Table A are the average hourly and weekly earnings for themonth. The value of these measures should be obvious. If worker income rises,it bodes well for future spending. More elaborate information on hourly andweekly earnings can be found in Table B-3 (not shown), which looks at pay byselected industries. Rising earnings can reveal those industries that are doingwell and where there might be a growing scarcity of experienced workers.
04Baumohl_Ch03.01-03.12.qxd 8/3/04 7:44 AM Page 32
33Employment Situation
• Table A-5 Employed Persons by Class of Worker and Part-Time Status
(6) Figures on part-time employment tell an interesting tale that is often missed byanalysts. When it’s hard to get suitable full-time work, many people have nochoice but to accept part-time employment. This table shows the number of peo-ple in the non-farm economy who have accepted part-time work for economicreasons, which means they could not locate suitable full-time positions. A steadyupward trend in the numbers suggests that the economy is still weak and unableto generate enough full-time posts to satisfy job seekers. Should the number offorced part-time workers decline, it means that enough full-time jobs are becom-ing available to encourage part-timers to leave their posts.
• Table A-9 Unemployed Persons by Duration of Unemployment
(7) Another very good barometer of economic activity can be found in Table A-9,which shows not just the size of the unemployed population, but how longthey’ve been without jobs. The length of time unemployed in the table rangesfrom less than five weeks to 27 weeks and more. The latter is particularly note-worthy because by then, most unemployment insurance benefits have expired.Thus, a rise in the number of people in this last category is especially alarming.A falling trend in the duration of the unemployed is a portent that the worst ofthe economy’s troubles is over and a recovery might be under way.
Nearby is another important statistical clue: the average length of time of beingjobless. During the booming 1990s, the average duration of unemployment wasjust 13 weeks; nowadays, an economic slump can extend that idle period to morethan 19 weeks.
04Baumohl_Ch03.01-03.12.qxd 8/3/04 7:44 AM Page 33
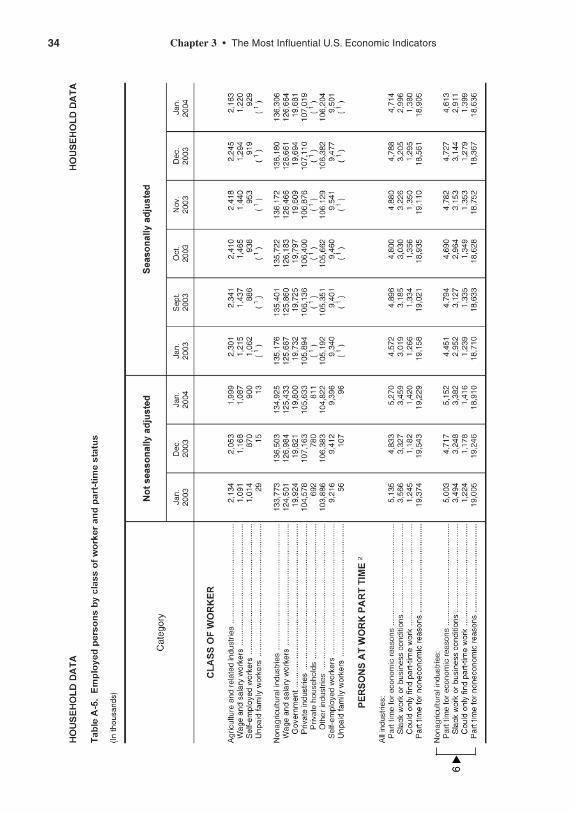
34 Chapter 3 • The Most Influential U.S. Economic Indicators
▲
6
04Baumohl_Ch03.01-03.12.qxd 8/3/04 7:44 AM Page 34
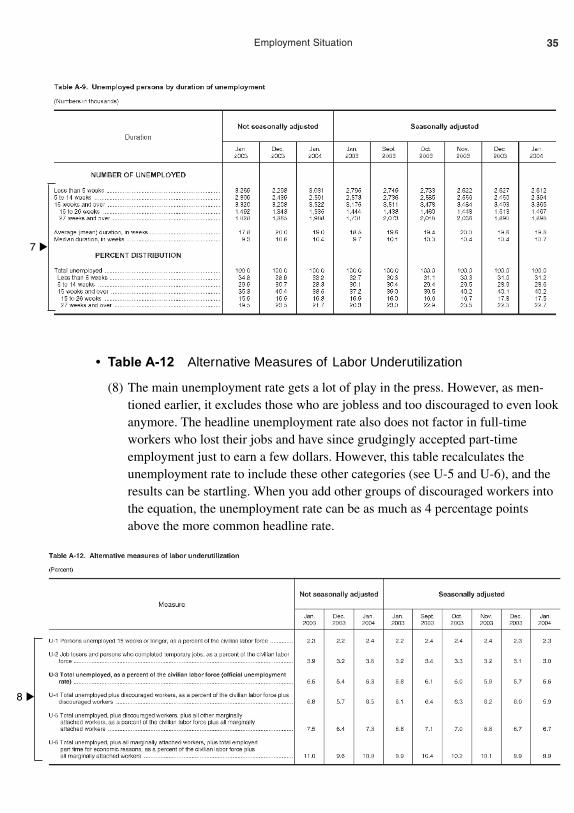
35Employment Situation
• Table A-12 Alternative Measures of Labor Underutilization
(8) The main unemployment rate gets a lot of play in the press. However, as men-tioned earlier, it excludes those who are jobless and too discouraged to even lookanymore. The headline unemployment rate also does not factor in full-timeworkers who lost their jobs and have since grudgingly accepted part-timeemployment just to earn a few dollars. However, this table recalculates theunemployment rate to include these other categories (see U-5 and U-6), and theresults can be startling. When you add other groups of discouraged workers intothe equation, the unemployment rate can be as much as 4 percentage pointsabove the more common headline rate.
▲
7
▲
8
04Baumohl_Ch03.01-03.12.qxd 8/3/04 7:44 AM Page 35
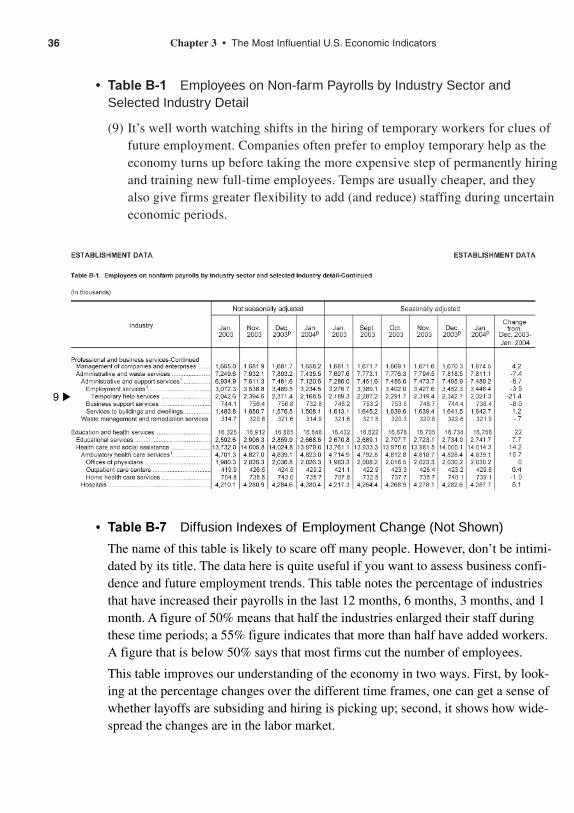
36 Chapter 3 • The Most Influential U.S. Economic Indicators
• Table B-1 Employees on Non-farm Payrolls by Industry Sector andSelected Industry Detail
(9) It’s well worth watching shifts in the hiring of temporary workers for clues offuture employment. Companies often prefer to employ temporary help as theeconomy turns up before taking the more expensive step of permanently hiringand training new full-time employees. Temps are usually cheaper, and theyalso give firms greater flexibility to add (and reduce) staffing during uncertaineconomic periods.
• Table B-7 Diffusion Indexes of Employment Change (Not Shown)
The name of this table is likely to scare off many people. However, don’t be intimi-dated by its title. The data here is quite useful if you want to assess business confi-dence and future employment trends. This table notes the percentage of industriesthat have increased their payrolls in the last 12 months, 6 months, 3 months, and 1month. A figure of 50% means that half the industries enlarged their staff duringthese time periods; a 55% figure indicates that more than half have added workers.A figure that is below 50% says that most firms cut the number of employees.
This table improves our understanding of the economy in two ways. First, by look-ing at the percentage changes over the different time frames, one can get a sense ofwhether layoffs are subsiding and hiring is picking up; second, it shows how wide-spread the changes are in the labor market.
▲
9
04Baumohl_Ch03.01-03.12.qxd 8/3/04 7:44 AM Page 36
37Employment Situation
MARKET IMPACT
Bonds
Traders get quite agitated when there’s a strong jobs report, especially if it’s unexpected.The news can portend accelerating inflation and rising interest rates, both of which areanathema to bondholders. Thus, be prepared for a sell-off in fixed income securities whenjob creation is surging. How far bond prices will fall and how much yields will risedepends on many factors, but the most important is where the economy happens to be inthe business cycle. If the U.S. has just managed to climb out of recession, a jump inemployment will likely have only a modest effect on bond prices because there’s noimmediate danger of inflation. However, if employment accelerates when the economy isalready operating at or near peak capacity, prepare to see a steep drop in bond prices andsharply higher interest rates.
In contrast, a series of weak employment reports reflects a more sluggish economy,which is bullish for bond prices and means interest rates will head lower.
Stocks
News of robust employment can make equity investors positively giddy. As the numberof people holding jobs increases and the workweek expands, employees easily slip intothe role of consumers and spend more money. The result: Expectations rise that businesssales and profits will pick up in the future. This can set the stage for a rally in the equitymarket. The only exception is if the economy is overheating with interest rates and infla-tion turning up. The higher cost of borrowing will hurt companies and undermine stockprices.
Little or no growth in employment is generally seen as bad for stocks. The worry isthat households will be less inclined to shop. Weak sales can shrink corporate income andearnings, thereby reducing the incentive to own shares.
Dollar
Employment news can greatly influence the dollar’s value in currency markets. A vigor-ous jobs report could drive interest rates higher, which makes the dollar more attractive toforeign investors. They can now earn more interest income by owning U.S. Treasurysecurities. On the other hand, an anemic jobs report softens demand for U.S. currencybecause it spells trouble for American stocks and puts downward pressure on rates, bothof which make the dollar less appealing to foreigners.
04Baumohl_Ch03.01-03.12.qxd 8/3/04 7:44 AM Page 37
WEEKLY CLAIMS FOR
UNEMPLOYMENT INSURANCE
Market Sensitivity: High.
What Is It: Tracks new filings for unemployment insurance benefits.
News Release on Internet: www.ows.doleta.gov/unemploy/claims_arch
Home Web Address: www.ows.doleta.gov
Release Time: 8:30 A.M. (ET) every Thursday; covers the week ending theprevious Saturday.
Frequency: Weekly.
Source: Employment and Training Administration, Department of Labor.
Revisions: Minor changes.
WHY IS IT IMPORTANT
Experts have paid closer attention to this indicator in the last few years even though it hasbeen around since 1967. Improved monitoring by the Labor Department has made theseries more accurate in gauging labor market conditions. The main appeal of the joblessclaims report is its timeliness. Figures on new filings for unemployment benefits arereleased every week and are based on actual reports from state agencies around the country.As a result, analysts view this statistic as a good coincident indicator, meaning it accuratelyreflects what is presently going on in the economy. However, its greatest value is how first-time claims for unemployment insurance can influence future economic activity. If a largenumber of people are losing their jobs every week and applying for unemployment com-pensation, this will eventually dampen consumer spirits, slash their spending, and causebusiness to pare back investments. For this reason, the weekly claims report for unemploy-ment benefits is one of the components in the forward-looking Index of Leading EconomicIndicators. (See the section on Leading Economic Indicators later in the book.)
But let’s take a step back for a moment. What exactly do we mean by “new claims forunemployment benefits”? Whether the economy is growing or not, it’s a fact of life thatpeople lose jobs every day. Companies close money-losing factories, get bought out bycompetitors, and in some instances just go belly-up. Many of their former employees areeligible to collect unemployment insurance for as long as 26 weeks in most states.Occasionally laws are passed that extend the pay period by another 13 weeks or so. The realissue, however, is that if the number of people filing for unemployment benefits increasesevery week or remains at a high level, it’s a worrying sign that the economy is ailing. Incontrast, a sustained decline in initial claims for benefits points to an economy on the mend.
38 Chapter 3 • The Most Influential U.S. Economic Indicators
04Baumohl_Ch03.01-03.12.qxd 8/3/04 7:44 AM Page 38
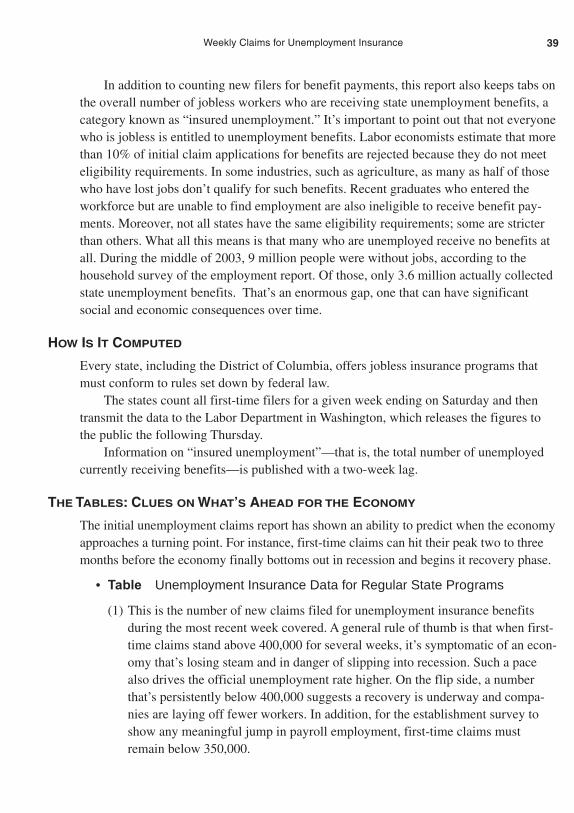
In addition to counting new filers for benefit payments, this report also keeps tabs onthe overall number of jobless workers who are receiving state unemployment benefits, acategory known as “insured unemployment.” It’s important to point out that not everyonewho is jobless is entitled to unemployment benefits. Labor economists estimate that morethan 10% of initial claim applications for benefits are rejected because they do not meeteligibility requirements. In some industries, such as agriculture, as many as half of thosewho have lost jobs don’t qualify for such benefits. Recent graduates who entered theworkforce but are unable to find employment are also ineligible to receive benefit pay-ments. Moreover, not all states have the same eligibility requirements; some are stricterthan others. What all this means is that many who are unemployed receive no benefits atall. During the middle of 2003, 9 million people were without jobs, according to thehousehold survey of the employment report. Of those, only 3.6 million actually collectedstate unemployment benefits. That’s an enormous gap, one that can have significantsocial and economic consequences over time.
HOW IS IT COMPUTED
Every state, including the District of Columbia, offers jobless insurance programs thatmust conform to rules set down by federal law.
The states count all first-time filers for a given week ending on Saturday and thentransmit the data to the Labor Department in Washington, which releases the figures tothe public the following Thursday.
Information on “insured unemployment”—that is, the total number of unemployedcurrently receiving benefits—is published with a two-week lag.
THE TABLES: CLUES ON WHAT’S AHEAD FOR THE ECONOMY
The initial unemployment claims report has shown an ability to predict when the economyapproaches a turning point. For instance, first-time claims can hit their peak two to threemonths before the economy finally bottoms out in recession and begins it recovery phase.
• Table Unemployment Insurance Data for Regular State Programs
(1) This is the number of new claims filed for unemployment insurance benefitsduring the most recent week covered. A general rule of thumb is that when first-time claims stand above 400,000 for several weeks, it’s symptomatic of an econ-omy that’s losing steam and in danger of slipping into recession. Such a pacealso drives the official unemployment rate higher. On the flip side, a numberthat’s persistently below 400,000 suggests a recovery is underway and compa-nies are laying off fewer workers. In addition, for the establishment survey toshow any meaningful jump in payroll employment, first-time claims mustremain below 350,000.
39Weekly Claims for Unemployment Insurance
04Baumohl_Ch03.01-03.12.qxd 8/3/04 7:44 AM Page 39

(2) Do not use a single week’s data on initial claims to interpret a trend. The weeklyseries can be quite erratic. Weeks containing holidays can easily distort the dataon filings. A four-day workweek, for example, can reduce claims by as much as20,000, only to have them surge the following week because they now includethose who didn’t have a chance to apply before. The solution is to look at initialclaims based on a four-week moving average, which is reported here. The four-week average smoothes out the volatility of the weekly numbers.
(3) Another big issue for economists and politicians is whether the total number ofpersons collecting unemployment insurance has been increasing or decreasingover time. A figure of 3 million to 3.5 million and climbing is indicative of amalfunctioning economy. Consumer confidence suffers in such an environment,as does business investment. Economists also wonder what effect all these bene-fit payments will have on federal and state budgets. Perhaps the gravest concern,though, involves those who lost their jobs and are ineligible to receive unem-ployment aid for one reason or another. Jobless workers collecting unemploy-ment insurance at least have some funds to spend, which can soften the harmfuleffects of an economic downturn. However, if total unemployment climbs (inthe household survey) at a faster rate than those collecting unemployment insur-ance, it means a growing proportion of people out of work may have to get bywithout any state financial support, and that could lead to serious social disloca-tions. Without the safety net of benefit payments, many turn to the undergroundeconomy or even to crime for money.
(4) The “insured unemployment rate” is another statistic worth mentioning, albeitbriefly. It’s the proportion of those currently collecting unemployment insurancecompared with the total number of American workers who would be eligible toreceive these benefits. While the investment community mostly ignores this fig-ure, a few economists follow its performance so that they can compare it withthe official unemployment rate in the household data.
40 Chapter 3 • The Most Influential U.S. Economic Indicators
▲
2
▲
1
▲
3
▲
4
04Baumohl_Ch03.01-03.12.qxd 8/3/04 7:44 AM Page 40
MARKET IMPACT
Bonds
The fixed income market reacts favorably when the number of new filings for unemploy-ment insurance picks up, especially if it jumps by more than 30,000 applications. A rise infirst-time claims points to a weaker economy and diminishing inflation pressures. Whatunnerves bond investors is a continuous drop in claims because it hints at a sturdier eco-nomic climate ahead. That can prompt fresh concerns of future inflation and lead to lowerbond prices and rising yields.
Stocks
Equities tend to fare badly when there’s a persistent increase in jobless claims. Thoughsuch a report would lower interest rates, which is normally a positive for stocks, evidenceof a serious deterioration in the labor market augurs poorly for the economy, corporateprofits, and share prices.
Dollar
Falling interest rates make the dollar less attractive to hold, especially if yields are higherin other countries. Thus, a steady climb in initial claims that stems from a languishingdomestic economy might turn foreign investors away from U.S. securities and therebyweaken the dollar’s value in foreign exchange markets.
41Weekly Claims for Unemployment Insurance
04Baumohl_Ch03.01-03.12.qxd 8/3/04 7:44 AM Page 41

HELP-WANTED ADVERTISING INDEX
Market Sensitivity: Low.
What Is It: A measure of newspaper ads with job openings.
News Release on Internet:www.conferenceboard.org/economics/helpwanted.cfm
Home Web Address: www.conferenceboard.org
Release Time: 10:00 A.M. (ET); released the last Thursday of the month andcovers the previous month.
Frequency: Monthly.
Source: The Conference Board.
Revisions: Tends to be minor.
WHY IS IT IMPORTANT
Why track help-wanted advertisements in newspapers? It turns out to be a reasonable pre-dictor of the economy’s direction. When classified ads for jobs increase, it signifies grow-ing confidence in the business community about upcoming sales and profits. The brighterthe outlook, the more likely employers will accelerate hiring. Should the number of adsfor jobs shrink, it is an indication that companies are getting nervous about the future.Concerns that business may turn sour in the months ahead will cause firms to postpone orcancel hiring plans.
This index, which has been around since the Truman Administration (1951), seemslike a natural to excite investors. It reflects business confidence and possesses some pre-dictive value. However, the measure has lost some luster in recent years. Traders showlittle reaction to it because the release comes out so late in the month—long after theemployment numbers do—and they both cover the same period. Moreover, the number ofjob advertisements in newspapers has waned in recent years. Firms are instead resortingto less costly ways to find new workers, such as placing ads directly on their own corpo-rate Web page or using online job sites.
Nevertheless, to economists and business leaders, the index of help-wanted ads is aneffective indicator that can help corroborate other signs of whether the economy isstrengthening or ailing.
HOW IS IT COMPUTED
The Conference Board, a New York business research group, surveys 51 leading newspa-pers from major cities across the country and computes a monthly index based on the vol-ume of such advertisements. Every job ad is given the same weight regardless of whether it
42 Chapter 3 • The Most Influential U.S. Economic Indicators
04Baumohl_Ch03.01-03.12.qxd 8/3/04 7:44 AM Page 42

seeks one employee or several, part-time or full-time, a CEO or a minimum-wage fast-foodserver. Geographically, the focus is on newspaper ads in nine regions in the country:Mountain, Pacific, West North Central, West South Central, South Atlantic, East SouthCentral, East North Central, Middle Atlantic, and New England. In computing the index,the Conference Board gives more weight to areas with larger labor markets.
The Conference Board currently uses 1987 as it baseline year (with an index value of100). Since the start of the 1990s, the help-wanted index, which is seasonally adjusted,has ranged from about 100 during periods of strong economic growth all the way down tothe 30s when business activity showed few signs of life.
THE TABLES: CLUES ON WHAT’S AHEAD FOR THE ECONOMY
This index stands out as a fairly good early warning system of an economy stumblingtoward recession. Help-wanted advertising generally peaks months before the economydoes because employers shut down hiring fairly quickly if they suspect a softening busi-ness climate ahead. For instance, the index fell throughout 2000, just before the onset ofthe 2001 recession.
However, don’t count on this indicator to give you a heads up on when an economyemerges from recession. Companies do not post job advertisements the instant economicactivity revs up. Instead they tend to push existing employees to work longer hours in theearly stages of a recovery until it becomes obvious that to meet the surge in demand, newworkers will have to be found. Yet even then, employers don’t rush in with new ads.Many firms first try to rehire those who were initially laid off. Thus, any pick-up in help-wanted advertising usually comes long after the recession has ended.
• Table National Index of Help-Wanted Advertising
43Help-Wanted Advertising Index
▲
Source: The Conference Board, used with permission.
04Baumohl_Ch03.01-03.12.qxd 8/3/04 7:44 AM Page 43

Besides noting the latest national index, figures are also provided for the two previousmonths and the year-ago level. Economists have noted a correlation between thechanges in help-wanted ads and changes in the employment numbers from the Bureauof Labor Statistics. When help-wanted ads pick up, the employment numbers jumpone or two months later. The lag occurs because it takes a few weeks for people torespond to such advertisements, be interviewed, have their credentials checked out,and finally get hired. Thus, the job ads index can serve as a leading indicator of pay-roll growth (from the establishment survey), which the financial markets watch veryclosely. This process also works in reverse; when help-wanted ads fall off, the unem-ployment rate starts to climb shortly thereafter. With fewer jobs being touted, theeconomy has a harder time absorbing all those people just entering the labor force.
MARKET IMPACT
Bonds
Not much reaction. This indicator arrives late and merely reinforces data already outthere. Rarely does the index itself precipitate activity among bond traders.
Stocks
Very little impact. Stocks have already discounted economic trends from earlier statisticalreleases.
Dollar
Has virtually no impact on the foreign exchange markets.
44 Chapter 3 • The Most Influential U.S. Economic Indicators
04Baumohl_Ch03.01-03.12.qxd 8/3/04 7:44 AM Page 44
CORPORATE LAYOFF ANNOUNCEMENTS
Market Sensitivity: Low.
What Is It: Counts layoffs announced by public companies.
Home Web Address: www.challengergray.com (data is available only throughsubscription).
Release Time: 10 A.M. (ET); published a week after the end of the referencemonth.
Frequency: Monthly.
Source: Challenger, Gray & Christmas.
Revisions: No revisions are made to previously released data.
WHY IS IT IMPORTANT
Since the 1980s, there has been a continuous wave of mergers, plant closings, restructur-ings, and consolidations. Such corporate changes are to be expected in an open, competi-tive, and dynamic economy. But one very painful by-product of all this activity has beenthe existence of massive layoffs. Displaced workers now must spend weeks and months,sometimes even longer, trying to find new jobs. The resulting loss of income can devas-tate the financial health of households and sharply curtail consumer spending. Even thosestill clinging to their jobs tend to grow uneasy as they wonder about their own security.Such widespread uncertainty and stress can put consumers in a very sour mood, and ifthis mood is felt on a large-enough scale, layoffs can even drag an economy into reces-sion. So monitoring trends in corporate layoffs can be useful if one wants to anticipatechanges in the economy’s performance.
One firm that does just that is Challenger, Gray & Christmas (CGC), an outplace-ment firm based in Chicago. The Challenger group scans public information records forannouncements on corporate layoffs and then tallies it up along with a commentary onthe latest trends. (As of May 2004, the company also began tracking hiring announce-ments.) However, there is no free access to the Challenger corporate layoff report on theInternet. Paid clients of CGC are the first to receive the data, which is released the firstweek of the month. Those who seek to get the information for free will have to rely onbusiness news Internet sites such as Bloomberg, CNBC, and CNN.
HOW IS IT COMPUTED
CGC culls a variety of sources for announced layoffs, including press releases, newspa-pers, and trade papers, and then adds them up. Their research covers publicly tradedfirms, though a few large private companies are also counted whenever possible. Thefocus is on comparing the volume of layoffs on a month-to-month basis and with earlieryears. The data is also divided by industry and on a regional basis.
45Corporate Layoff Announcements
04Baumohl_Ch03.01-03.12.qxd 8/3/04 7:44 AM Page 45
THE TABLES: CLUES ON WHAT’S AHEAD FOR THE ECONOMY
There are no tables to review here because Challenger has not made them available tonon-subscribers. But the press obtains highlights of the report and gives it ample cover-age. By and large, the investment community and economists view these layoff figureswith only limited interest. For one, the numbers are not fresh. They’re based on corporatestatements that were made weeks earlier. Second, several other publicly-released indica-tors on joblessness are considered to be more informative. These include the WeeklyClaims for Unemployment Insurance, the U.S. Labor Department’s own Mass Layoffsreport, and the Employment Situation release.
Nor can you draw any firm conclusions from the Challenger layoff survey.Announced job eliminations are usually carried out not in a matter of weeks, but spreadout over many months or even years. Should the economy bounce back during that time,some of these announced layoffs might not happen at all. Another problem is the way theChallenger report breaks down layoffs by geographic region. It’s based mostly on thelocation of the company’s headquarters, yet many of these layoffs can take place else-where, even outside the U.S.
The main question is whether layoff announcements can be utilized as a leadingindicator of turning points in the economy. The answer is probably not. Since the 1980s,job elimination programs have become a permanent part of the American business land-scape and can now occur in significant numbers at every stage of the business cycle. Justlook at the last decade: not only did we see companies shed workers during the reces-sion of the early 1990s, but we also saw them continue to slash payrolls during the pow-erful growth years later in the decade.
MARKET IMPACT
On a slow news day, investors might take note of the Challenger report. Otherwise, itsimpact on the market is negligible.
Bonds
Theoretically, a large and unexpected jump in layoffs in the country can be interpretedas a bullish sign for the fixed income market. Workforce reductions on a grand scalecan reinforce the notion that a slowdown in economic activity is under way. However,for more than a decade, layoffs have taken place in significant numbers without regardfor the business cycle. What’s more, the Challenger report is based on dated informa-tion which the market has, in all likelihood, already discounted.
46 Chapter 3 • The Most Influential U.S. Economic Indicators
04Baumohl_Ch03.01-03.12.qxd 8/3/04 7:44 AM Page 46

Stocks
Equity investors rarely initiate trades based solely on the Challenger report.Shareholders respond to news of layoffs the moment they are first made public by thecompanies themselves.
Dollar
This report has no impact on the foreign exchange markets.
47Corporate Layoff Announcements
04Baumohl_Ch03.01-03.12.qxd 8/3/04 7:44 AM Page 47
MASS LAYOFF STATISTICS (MLS)
Market Sensitivity: Low.
What Is It: Measures actual layoffs in business and government.
News Release on Internet: www.bls.gov/mls
Home Web Address: www.bls.gov
Release Time: 10 A.M. (ET); report is out four weeks after the end of the month.
Frequency: Monthly.
Source: Bureau of Labor Statistics, Department of Labor.
Revisions: Data is revised for the last two months.
WHY IS IT IMPORTANT
There are presently two major sources of information on layoffs. One is the Challenger,Gray & Christmas survey, which was discussed in the preceding section (“CorporateLayoff Announcements”). Their data, however, covers only announced corporate layoffs;they don’t follow up to see if these job elimination plans were fully carried out. Yet com-panies have been known to reduce or even cancel publicized job cuts once businessimproves. Thus, the more relevant issue might be tallying the layoffs that actuallyoccurred! To locate data on actual layoffs, you have to turn to the government’s ownBureau of Labor Statistics which releases a monthly report appropriately titled “MassLayoff Statistics (MLS).” Though the report is not widely known to investors and eco-nomic researchers, it contains information that can have a direct bearing on future house-hold spending and economic growth.
The MLS report tracks mass layoff “events.” An event is defined as each time a com-pany or a government agency lays off 50 or more workers at a single location within afive-week period. (For example, if GM lets go 70 workers in its Detroit auto plant andanother 100 at a second GM plant in Ohio, and American Airlines in Chicago cuts itspayroll by 200 all in the same workweek, the BLS counts them as three “events” involv-ing 370 jobs.) The agency totals all mass layoff events each month along with the numberof jobless workers who filed for unemployment insurance as a result of those job cuts. Inaddition, the agency categorizes layoffs by the length of their duration (30 days or lessout of work versus 31 days or more). It then breaks down all the data by industry andgeographic location. There’s a lot of information here that can be of value to investorsand business leaders who want to track the magnitude of actual layoffs, see which indus-tries and regions in the U.S. are ailing, and find out where there may be a surplus ofskilled, but unemployed, workers.
48 Chapter 3 • The Most Influential U.S. Economic Indicators
04Baumohl_Ch03.01-03.12.qxd 8/3/04 7:44 AM Page 48
HOW IS IT COMPUTED
The BLS first contacts state agencies for the latest initial unemployment insurance claims.It then sorts through the data to find out how many of those who filed a claim were theresult of mass layoffs. Companies and government agencies are also contacted to see howmany of the job eliminations lasted 31 days or longer. After compiling the numbers, theBLS publishes two reports. One is the monthly “Mass Layoff Statistics,” which is whatthis section is about, and the other is a quarterly release known as the “Extended MassLayoffs” report. The latter deals with employees who have been separated from their jobsfor more than a month. (This quarterly report is also available on the same Web site.)
The data is not seasonally adjusted, so it is difficult to distinguish between cyclicaland seasonal layoff activity.
THE TABLES: CLUES ON WHAT’S AHEAD FOR THE ECONOMY
During the last 15 years, job cutbacks involving large numbers have occurred at virtuallyevery stage of the business cycle, thus diminishing the value of layoff reports as a fore-casting tool. Nevertheless, while it lacks use as a leading indicator, the MLS report hasother valuable information that cannot be found elsewhere.
• Table 1 Mass Layoff Events and Initial Claimants for UnemploymentInsurance
(1) The Events column tells you how many instances there were of mass layoffs inthe month. Each instance is defined as a single action that led to the eliminationof at least 50 employees during a five-week period, regardless of the duration oftheir separation.
(2) Here’s where you’ll find the monthly and quarterly totals for the number of per-sons who put in claims for unemployment insurance as a direct result of thoseevent-triggered layoffs. This column might look puzzling at first becausemonthly totals for initial claims for unemployment benefits appear way belowwhat you would expect, given the higher number of people filing for joblessbenefits each week (see the section on Weekly Claims for UnemploymentInsurance). The reason for this is that only 10% of all first-time claims for bene-fits are the result of mass layoff events involving at least 50 people within a five-week period. Most layoffs that lead to unemployment claims represent numbersthat are less than 50 persons per incident.
(3) The extended mass layoffs, which are available only as a quarterly series, repre-sent only those events that have led to layoffs that lasted more than 30 days. Itextracts these figures from the two columns on the left. These statistics can helpyou see whether actual layoffs are intensifying or abating.
49Mass Layoff Statistics (MLS)
04Baumohl_Ch03.01-03.12.qxd 8/3/04 7:44 AM Page 49
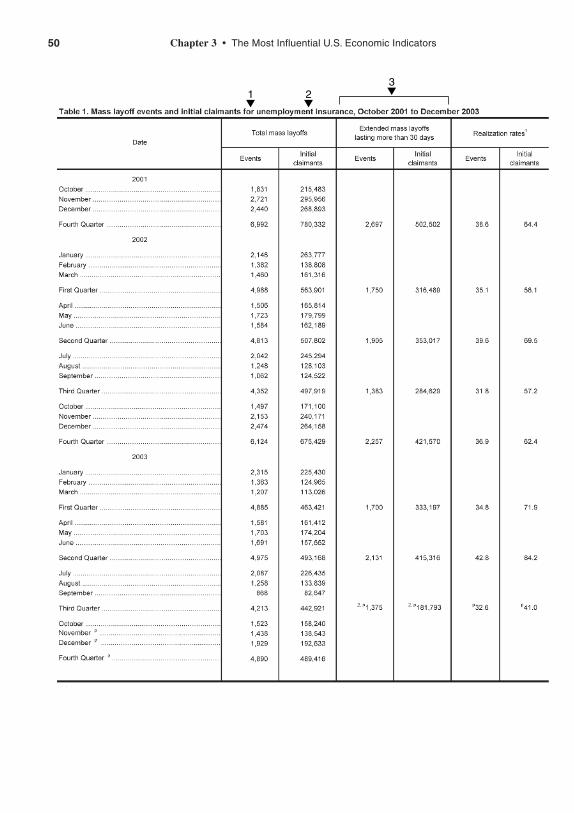
50 Chapter 3 • The Most Influential U.S. Economic Indicators
▲1 ▲2
▲3
04Baumohl_Ch03.01-03.12.qxd 8/3/04 7:44 AM Page 50
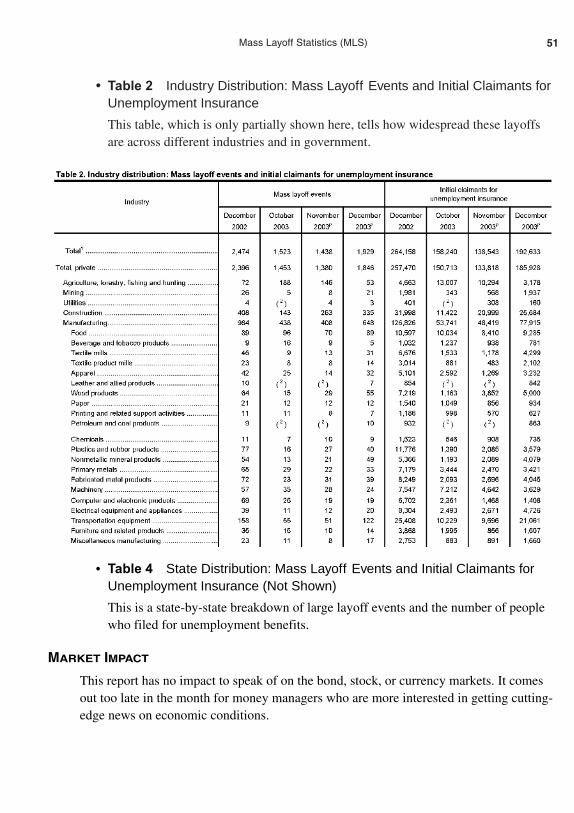
• Table 2 Industry Distribution: Mass Layoff Events and Initial Claimants forUnemployment Insurance
This table, which is only partially shown here, tells how widespread these layoffsare across different industries and in government.
51Mass Layoff Statistics (MLS)
• Table 4 State Distribution: Mass Layoff Events and Initial Claimants forUnemployment Insurance (Not Shown)
This is a state-by-state breakdown of large layoff events and the number of peoplewho filed for unemployment benefits.
MARKET IMPACT
This report has no impact to speak of on the bond, stock, or currency markets. It comesout too late in the month for money managers who are more interested in getting cutting-edge news on economic conditions.
04Baumohl_Ch03.01-03.12.qxd 8/3/04 7:44 AM Page 51
PERSONAL INCOME AND SPENDING
Market Sensitivity: Medium.
What Is It: Records the income Americans receive, how much they spend, andwhat they save.
News Release on Internet: www.bea.doc.gov/bea/newsrel/pinewsrelease.htm
Home Web Address: www.bea.doc.gov
Release Time: 8:30 A.M. (ET); data is made public four or five weeks after theend of the reported month. (The Bureau of Economic Analysis expects tohave this report out two weeks earlier by 2006.)
Frequency: Monthly.
Source: Bureau of Economic Analysis, Department of Commerce.
Revisions: After the initial release, data on income, spending, and savingsundergoes revisions for the next several months as more completeinformation comes in. The magnitude of the changes is usually modest.Annual revisions are normally done every summer (in July or August), andbenchmark changes occur every four or five years to incorporate new data aswell as changes in methodology.
WHY IS IT IMPORTANT
Consumers rule the economy, plain and simple. Without their active participation, businessactivity would quickly come to a standstill. Consumer expenditures are the main drivingforce of sales, imports, factory output, business investments, and job growth in the U.S.But to be able to spend, people need to have a reliable stream of income. As long as per-sonal income rises at a healthy clip, so will spending. If income growth turns sluggish,consumers will curb their shopping. Though other factors, such as inflation and the changein household wealth due to stock and real estate values, can influence when and how muchconsumers spend, the most important determinant over time is personal income.
The government breaks down the personal income and spending report into threemajor categories: personal income, expenditures, and savings.
Personal Income
Personal income represents the money households receive before taking out taxes. Ofcourse, what really counts is how much spendable money consumers have left after per-sonal taxes and non-tax payments are removed. This is known as disposable personalincome (DPI). Income itself can originate from several sources:
• Wages and salaries: What companies pay employees; it’s the largest single contrib-utor, representing 56% of all income.
52 Chapter 3 • The Most Influential U.S. Economic Indicators
04Baumohl_Ch03.01-03.12.qxd 8/3/04 7:44 AM Page 52

53Personal Income and Spending
• Proprietors’ income (8%): A fancy term for self-employed that includes both farmand non-farm businesses, such as store owners, private-practice doctors, independ-ent plumbers, lawyers, and consultants.
• Rental income (1.4%): Represents earnings people receive from renting or leasingreal estate (as long as this is not their primary business).
• Dividend income (4.4%): Money stockholders get from corporations.
• Interest income (11%): Comes from investments in interest-bearing securities suchas Treasury securities and corporate bonds.
• Transfer payments (13%): Payments received from federal and state governments,such as social security payments, unemployment benefits, and food stamps.
• Other labor income (6.2%): A catchall that includes employer-paid contributionslike worker life insurance, health plans, and pensions.
Excluded from personal income are any profits households receive from the sale ofassets such as stocks, bonds, or real estate.
Personal Spending, Formally Known as “Personal ConsumptionExpenditures”
There are just two things you can do with your income—you either spend it or save it.The average household spends about 95 cents of every dollar received, and it’s this highlevel of consumption that fuels two-thirds of all economic activity. It’s the reason whypersonal consumption expenditures (PCE) grabs the big headlines when the personalincome report comes out. PCE is not only the most comprehensive measure of consumerspending, far more than retail sales, it’s also the largest component in the GDP. Thus,swings in PCE can lead to major shifts in the business cycle.
On what are people spending their money? Three broad product categories are high-lighted under PCE: durable goods, nondurable goods, and services. Durable goods areoften expensive products that last three or more years and can include cars, refrigerators,washing machines, and so on. Because these items are costly and last a long while,durable goods make up the smallest share of consumer spending, some 12%–14%.Nondurable goods have a life span of less than three years and cover commodities suchas food, clothing, and books. Purchases of nondurable goods account for 30% of allspending. The third category—services—is the fastest growing component of consumerpurchases, jumping from 40% in the 1960s to about 60% now. Services includes medicaltreatment, haircuts, legal fees, movies, air travel, and so on.
Personal Savings
Savings is what’s left after spending on goods, services, and interest payments on creditcards and loans. Subtract all these monthly outlays from disposable personal income andthe remainder is what’s left for savings, money that usually ends up in savings deposits,bank CDs, money market accounts, stocks, and bonds.
04Baumohl_Ch03.01-03.12.qxd 8/3/04 7:44 AM Page 53
In addition to the dollar amount of savings, it’s also useful to know the percentage ofdisposable personal income that is saved; this is known as the personal savings rate. Forinstance, if you save $5 out of every $100 in disposable personal income, the savings rateis 5%. Back in the 1960s and early 1970s, households were relatively thrifty and main-tained a savings rate often above 8%, which meant they saved at least $8 out of every$100 of after-tax income received. By the end of the 1990s, however, the savings rateplummeted to below 3%. Why the drop? The dramatic run up in stock prices during thedecade boosted household wealth so much that people felt little need to set aside savings.With the collapse of the stock market bubble in 2001, however, such thinking came to anabrupt halt. Not only were people horrified by the loss in their investments, but they alsobegan to regret their decade-long neglect of adding to savings. Fearful that they might nothave enough money for emergencies or retirement, Americans sought to replenish theirsavings and the savings rate has since rebounded.
HOW IS IT COMPUTED
Gathering data for the personal income report is a hellish statistical task. The Bureau ofEconomic Analysis, the agency whose job it is to calculate personal income and spend-ing, has to collect information from many sources in and out of government. For instance,numbers on wages and salaries come from the monthly employment report. Transfer pay-ments, such as social security income, veterans’ benefits, and unemployment insurance,are derived from the Social Security Administration, the Veterans Administration, and theTreasury and Labor Departments. Income from stock dividends is extrapolated from theU.S Census Bureau, IRS records, and quarterly income statements filed by corporations.Interest income is based on Treasury publications as well as figures from the FederalReserve’s Flow of Funds. Money earned from self-employment and rental income has tobe estimated from other government sources. All this just to compute personal income!
For numbers on personal spending, the agency looks at retail sales data (excludingautos). The amount Americans spend on motor vehicles is based partly on reports fromauto manufacturers. Expenditures on services are also complicated. Consumer spendingon air travel comes from the Air Transport Association; healthcare outlays are based onthe Labor Department’s employment data. In some cases, such as payments for dentalservices and haircuts, the BEA’s only recourse is to do a simple straight-line calculationthat assumes an automatic increase for such outlays each month. This might not be themost precise measure of consumer expenditures, but the methodology is supported byyears of testing and practice. In any event, the government eventually revises all thesenumbers as more complete data becomes available.
Both personal income and personal consumption expenditures are seasonallyadjusted and presented in both current dollars (which is not adjusted for inflation) andconstant dollars (which removes the effects of inflation). The monthly figures are alsoannualized to show how they would perform should the trend continue for a full year.
54 Chapter 3 • The Most Influential U.S. Economic Indicators
04Baumohl_Ch03.01-03.12.qxd 8/3/04 7:44 AM Page 54
55Personal Income and Spending
As for the savings level, no fancy tricks here. It’s strictly a residual number; savings iswhatever remains after you subtract total consumer outlays from personal disposable income.
THE TABLES: CLUES ON WHAT’S AHEAD FOR THE ECONOMY
• Table 1 Personal Income and Its Disposition (Months)
(1) This first table records monthly dollar amounts of personal income and outlays incurrent dollars and at annualized rates. Each of the major contributors to incomeis presented here: wages and salaries, other labor income (from fringe benefits atwork), proprietors’ income (self-employment), rental income, dividend income,and transfer payments. The latest figures on income are accompanied by sevenmonths of previous data so that you can see how they’ve changed over time.
By studying the growth in personal income, you can get some insight into futuretrends in consumer spending. But one has to be careful about generalizing here.The relationship between income and spending is not as simple as it once was.Since the mid-1990s, consumer outlays have also been greatly influenced by one’sperception of personal wealth. Spending can accelerate if households see the valueof their financial and real estate investments growing, a phenomenon known as thewealth effect. For example, economists estimate that for every dollar increase inthe value of one’s stock portfolio, consumers spend an additional 3–6 cents. A one-dollar rise in value of other types of wealth (such as real estate) raises spending by2–4 cents. Of course, when the economy looks bleak and the value of these assetsstart to tank, you get the negative wealth effect, where the loss in householdwealth can result in a dramatic cutback in spending—especially if personal sav-ings have been depleted. Thus, changes in household wealth can play an importantrole in determining consumer spending behavior.
Two other points need to be made about personal income. Year-end wages andsalary amounts can be distorted because that is when companies distributebonuses, which often cause a brief spike in monthly income. Second, transferpayments, such as social security, produce a blip in personal income data inJanuary when the government tacks on extra dollars to reflect a cost-of-livingadjustment (COLA). The precise increase in the COLA amount depends on theyearly change in consumer prices (see the section on the Consumer Price Index).It is measured from October of one year through September of the next. If infla-tion rose by 3% over those 12 months, social security recipients will see a simi-lar increase in their checks the following January.
04Baumohl_Ch03.01-03.12.qxd 8/3/04 7:44 AM Page 55
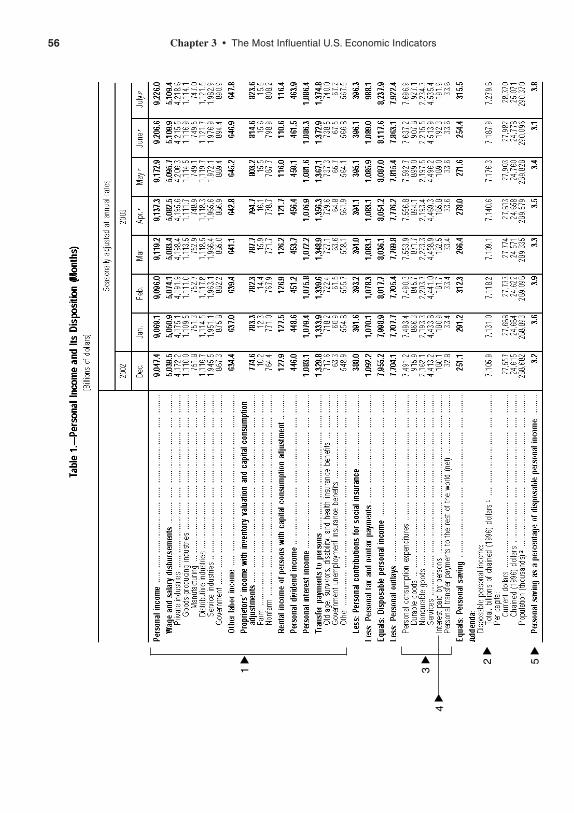
56 Chapter 3 • The Most Influential U.S. Economic Indicators
▲
1
▲
2▲
3
▲
4
▲
5
04Baumohl_Ch03.01-03.12.qxd 8/3/04 7:44 AM Page 56
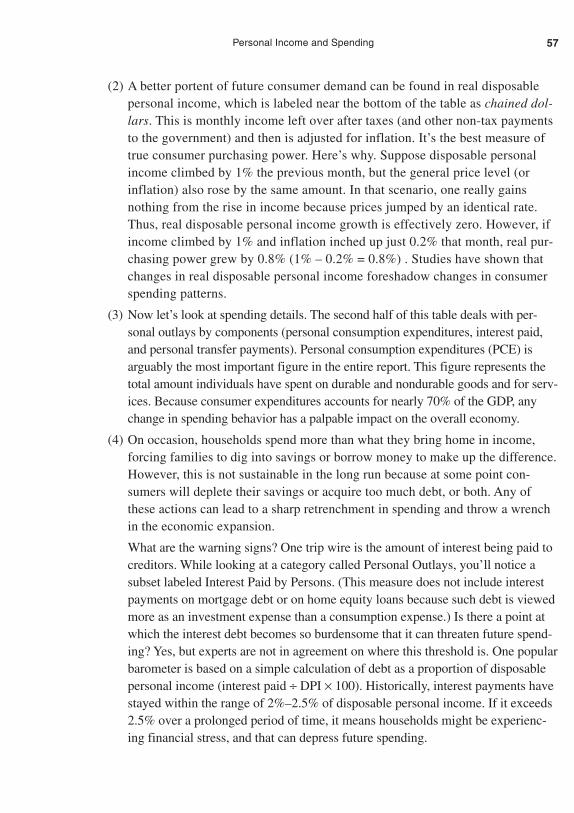
(2) A better portent of future consumer demand can be found in real disposablepersonal income, which is labeled near the bottom of the table as chained dol-lars. This is monthly income left over after taxes (and other non-tax paymentsto the government) and then is adjusted for inflation. It’s the best measure oftrue consumer purchasing power. Here’s why. Suppose disposable personalincome climbed by 1% the previous month, but the general price level (orinflation) also rose by the same amount. In that scenario, one really gainsnothing from the rise in income because prices jumped by an identical rate.Thus, real disposable personal income growth is effectively zero. However, ifincome climbed by 1% and inflation inched up just 0.2% that month, real pur-chasing power grew by 0.8% (1% – 0.2% = 0.8%) . Studies have shown thatchanges in real disposable personal income foreshadow changes in consumerspending patterns.
(3) Now let’s look at spending details. The second half of this table deals with per-sonal outlays by components (personal consumption expenditures, interest paid,and personal transfer payments). Personal consumption expenditures (PCE) isarguably the most important figure in the entire report. This figure represents thetotal amount individuals have spent on durable and nondurable goods and for serv-ices. Because consumer expenditures accounts for nearly 70% of the GDP, anychange in spending behavior has a palpable impact on the overall economy.
(4) On occasion, households spend more than what they bring home in income,forcing families to dig into savings or borrow money to make up the difference.However, this is not sustainable in the long run because at some point con-sumers will deplete their savings or acquire too much debt, or both. Any ofthese actions can lead to a sharp retrenchment in spending and throw a wrenchin the economic expansion.
What are the warning signs? One trip wire is the amount of interest being paid tocreditors. While looking at a category called Personal Outlays, you’ll notice asubset labeled Interest Paid by Persons. (This measure does not include interestpayments on mortgage debt or on home equity loans because such debt is viewedmore as an investment expense than a consumption expense.) Is there a point atwhich the interest debt becomes so burdensome that it can threaten future spend-ing? Yes, but experts are not in agreement on where this threshold is. One popularbarometer is based on a simple calculation of debt as a proportion of disposablepersonal income (interest paid ÷ DPI × 100). Historically, interest payments havestayed within the range of 2%–2.5% of disposable personal income. If it exceeds2.5% over a prolonged period of time, it means households might be experienc-ing financial stress, and that can depress future spending.
57Personal Income and Spending
04Baumohl_Ch03.01-03.12.qxd 8/3/04 7:44 AM Page 57
(5) Further down the table is the personal savings rate. This figure is interesting butnot of great forecasting value. By definition, savings does not include any appre-ciation in the value of one’s stocks, bonds, or real estate portfolio. Thus, anyonewho invested in real estate or in the equity market over the last twenty yearswould have seen their household wealth increase, yet that wealth would notshow up as part of personal savings.
Does it pay to track savings at all? Only if there’s a precipitous change up ordown in savings. An abrupt movement in either direction can indicate a growingconcern among households over their financial future. A sudden climb in thesavings rate occurs when people become increasingly nervous about theirincome and job security. And the more money that is put away for savings, theless is available for shopping. By the same token, a sharp fall in the personalsavings rate can be troubling as well. If spending continues to outpace income,households raid their savings to make up the difference, and that too can haveominous consequences for the economy down the road. So a sharp climb or fallin the personal savings rate should be investigated further. By itself, it’s unclearwhat impact it will have on the economy in the short term.
• Table 2 Personal Income and Its Disposition (Years and Quarters) (Not Shown)
This table lists the same categories as Table 1 but presents the data in year totals andquarters. This enables you to avoid the short-term volatility in the numbers.
• Table 5 Personal Income and Its Disposition, Percent Change fromPreceding Period
(6) Table 5 has one category that deserves particular attention—expenditures ondurable goods. It consists of high-priced consumer products (such as cars andappliances) that last three years or more. Because they tend to be pricey andoften involve financing, orders for consumer durable goods are extremely sensi-tive to swings in the economy. Rising wages and job stability stimulate ordersfor durable goods, which, in turn, leads to a step-up in production by business.However, durable goods orders drop like a stone if there’s just a whiff of troubleahead for the economy. For that reason, this product group has become an excel-lent predictor of economic turning points. Orders for durable goods begin to trailoff about 6 to 12 months before the onset of a recession, and they pick up amonth or two before a recession ends and recovery begins.
58 Chapter 3 • The Most Influential U.S. Economic Indicators
04Baumohl_Ch03.01-03.12.qxd 8/3/04 7:44 AM Page 58
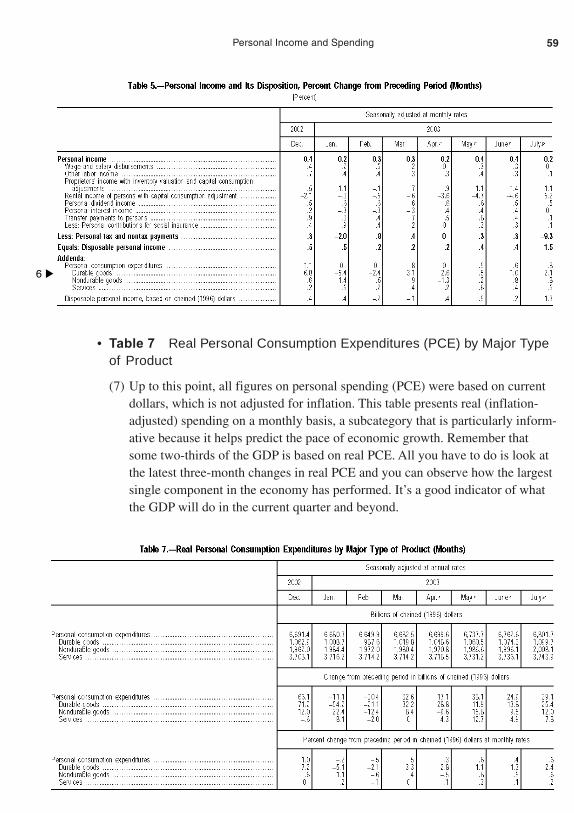
• Table 7 Real Personal Consumption Expenditures (PCE) by Major Typeof Product
(7) Up to this point, all figures on personal spending (PCE) were based on currentdollars, which is not adjusted for inflation. This table presents real (inflation-adjusted) spending on a monthly basis, a subcategory that is particularly inform-ative because it helps predict the pace of economic growth. Remember thatsome two-thirds of the GDP is based on real PCE. All you have to do is look atthe latest three-month changes in real PCE and you can observe how the largestsingle component in the economy has performed. It’s a good indicator of whatthe GDP will do in the current quarter and beyond.
59Personal Income and Spending
▲
6
04Baumohl_Ch03.01-03.12.qxd 8/3/04 7:44 AM Page 59
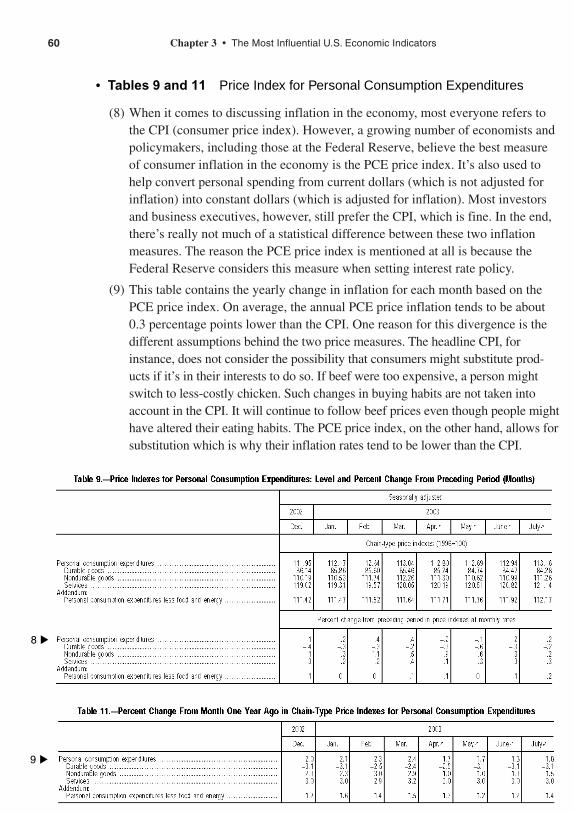
(8) When it comes to discussing inflation in the economy, most everyone refers tothe CPI (consumer price index). However, a growing number of economists andpolicymakers, including those at the Federal Reserve, believe the best measureof consumer inflation in the economy is the PCE price index. It’s also used tohelp convert personal spending from current dollars (which is not adjusted forinflation) into constant dollars (which is adjusted for inflation). Most investorsand business executives, however, still prefer the CPI, which is fine. In the end,there’s really not much of a statistical difference between these two inflationmeasures. The reason the PCE price index is mentioned at all is because theFederal Reserve considers this measure when setting interest rate policy.
(9) This table contains the yearly change in inflation for each month based on thePCE price index. On average, the annual PCE price inflation tends to be about0.3 percentage points lower than the CPI. One reason for this divergence is thedifferent assumptions behind the two price measures. The headline CPI, forinstance, does not consider the possibility that consumers might substitute prod-ucts if it’s in their interests to do so. If beef were too expensive, a person mightswitch to less-costly chicken. Such changes in buying habits are not taken intoaccount in the CPI. It will continue to follow beef prices even though people mighthave altered their eating habits. The PCE price index, on the other hand, allows forsubstitution which is why their inflation rates tend to be lower than the CPI.
60 Chapter 3 • The Most Influential U.S. Economic Indicators
• Tables 9 and 11 Price Index for Personal Consumption Expenditures
▲
8
▲
9
04Baumohl_Ch03.01-03.12.qxd 8/3/04 7:44 AM Page 60
61Personal Income and Spending
MARKET IMPACT
The personal income report gets only a lukewarm reception from the financial markets.By the time it’s released—which is quite late in the month—investors have alreadyreceived some news on individual income and spending from the employment report andthrough the retail sales data. Thus, the late publication date for personal income andspending has diminished the value to traders.
Bonds
Fixed income investors prefer to see listless growth in both income and spending. Anydata that affirms sluggishness in the economy is expected to support higher bond pricesand lower yields. On the flip side, accelerating gains in income and especially in personalconsumption will agitate bond traders. It points to rapid economic growth ahead andhigher inflation, a scenario that might eventually force the Federal Reserve to raise short-term interest rates. Thus, a larger-than-expected jump in household spending can induce asell-off in the bond market with the price of fixed incomes dropping and yields climbing.
Stocks
Investors in the equity market can be expected to react differently from their colleaguesin bonds. Higher personal income and spending are viewed favorably in the stock marketbecause they fuel more economic activity and fatten corporate profits. That’s a far betterscenario than anemic income growth and weakening expenditures, which portend a strug-gling economy and soft profits.
Of course, there is an important caveat here. Stock investors will run from the mar-kets if the data shows personal consumption surging when the economy is already operat-ing at or close to maximum speed; this raises the prospect of accelerating inflation andhigher interest rates, which are anathema to both stock and bond investors.
Dollar
Foreign exchange investors are likely to respond to the personal income and spendingnumbers. A healthy increase in both bodes well for the U.S. dollar. High consumerdemand encourages more growth and puts upward pressure on interest rates. That makesthe dollar more attractive to foreign investors, particularly if it results in a greater returnon investment than other currencies. A weaker-than-expected report on consumer spend-ing presages lower interest rates, and that’s often bearish for the dollar.
04Baumohl_Ch03.01-03.12.qxd 8/3/04 7:44 AM Page 61
RETAIL SALES
Market Sensitivity: High.
What Is It: First report of the month on consumer spending; capable of bigsurprises.
News Release on Internet: www.census.gov/svsd/www/advtable.html
Home Web Address: www.census.gov
Release Time: 8:30 A.M. (ET); available about two weeks after the month ends.
Frequency: Monthly.
Source: Bureau of the Census, Department of Commerce.
Revisions: Can be huge from month to month. Each release also contains broadrevisions of the two previous months to reflect more complete information.Annual benchmark changes are released in March and can go back threeyears or more.
WHY IS IT IMPORTANT
Remove three legs from a table and, well, it isn’t much of table after that. If you imaginethe U.S. economy being the table and consumer spending accounting for three of its fourlegs, you’ll understand why the investment community is so super-attentive to any indica-tor that provides insight into the mood and behavior of shoppers. Consumer spendingmakes up 70% of all economic activity—and retail sales account for a hefty one-third ofthat. If consumers can keep cash registers ringing, it is a sign of overall economic growthand prosperity. To monitor such expenditures, the Census Bureau calls upon thousands ofretailers each month for their latest sales numbers. As a result, investors and economistssee the retail sales report as one of the best indicators of change in consumer spendingpatterns. An unexpected swing in its numbers can sway the price of stocks and bonds.
But retail sales also has certain shortcomings. It only represents spending on goods,such as those found at department stores, auto dealers, gas stations, and food serviceproviders such as restaurants. The report tells us nothing about what’s being spent onservices such as air travel, dental care, haircuts, insurance, and movies. Yet the servicebusiness makes up about two-thirds of all personal expenditures. Furthermore, retail salesis measured only in nominal dollars, which means no adjustment is made for inflation.That makes it difficult to tell if consumers actually purchased additional goods or simply
62 Chapter 3 • The Most Influential U.S. Economic Indicators
04Baumohl_Ch03.01-03.12.qxd 8/3/04 7:44 AM Page 62
paid more to cover the higher prices charged by merchants. Finally, the initial monthlyretail sale releases, known as the advance report, tend to be extremely volatile and thusmisleading. It’s not unusual for the government to report that retail sales fell one month,only to have them revise it later to show an increase.
Nonetheless, the government has made some progress in modernizing this economicseries. For instance, the retail sales report now includes purchases made through theInternet, but it does not break down those online numbers in this release. To find howmuch consumers bought over the Internet, one has to look at the Commerce Department’squarterly E-Commerce report (see the next section on E-Commerce Retail Sales).
HOW IS IT COMPUTED
Surveys are sent out randomly to 5,000 large and small retailers around the country.These establishments receive them about three days after the month ends and are sup-posed to respond within a week or so. However, fewer than 50% of the retailers mailthem back in time. Still, the government reviews the data to prepare the advance retailsales report—the first of three releases for that month. This advance report offers aquick and dirty assessment of changes in consumer spending patterns. Another 8,000retailers are polled days later to develop a more complete picture of what shoppers aredoing. Results from that survey lead to the first statistical revision, which is known asthe preliminary version. Four weeks later comes the final report with additional revi-sions based on the inclusion of all who responded. Generally, of the 13,000 surveyed,70–75% respond.
Dollar figures are compiled from total receipts of retail sales, after subtracting formerchandise returned by customers and for rebates. Also excluded are sales taxes, excisetaxes, and finance charges from department store credit cards.
The dollar amounts in the report are not annualized; what you see represents theamount consumers spent on goods during that particular month. Retail sales figures are,however, adjusted for seasonal variations, such as how many holidays there were in themonth and the impact winters traditionally have on retail sales.
THE TABLES: CLUES ON WHAT’S AHEAD FOR THE ECONOMY
There’s a risk in relying too much on the advance estimates of retail sales because theyare based on a relatively small sampling. A more accurate sense of the underlying trend inconsumer spending patterns can be discerned by monitoring sales on a three-month mov-ing average basis or by looking at the last three months worth of data and comparing itwith the same three-month period the year before.
63Retail Sales
04Baumohl_Ch03.01-03.12.qxd 8/3/04 7:44 AM Page 63
• Table 2 Percent Change in Estimated Advance Monthly Sales for Retailand Food Services, by Kind of Business
(1) Just how much more—or less—did people buy from retailers in the last fewweeks? This answer can be very revealing. Shifts in consumer spending behaviorcan provide useful insight into the present mood of American households. Thiscolumn records the percentage change in retail spending by shoppers in each ofthe last two months and for their latest 12-month period. However, keep in mindthat these figures are all in nominal dollars; there is no adjustment for inflation.Because economic performance is based on real (inflation-adjusted) growth rates,we have to see if there has been a genuine increase in the volume of retail goodssold. One way to do this is to use the monthly or yearly percentage change inconsumer prices and subtract that from the equivalent change in retail sales. Theresult is a good approximation of the real percentage change in retail sales. Forexample, if retail sales increased by 6% in the latest 12-month period and infla-tion as measured by consumer prices climbed by 3% during this time frame, onecould surmise that consumers actually purchased 3% more goods in the past yearand the remaining 3% rise in retail sales came simply from paying higher prices.
Aside from getting a sense of how well retailers are doing, this section also givesyou a heads-up on what future GDP growth might be. Retail sales is used to com-pute Personal Consumption Expenditures (see the section on Personal Income andSpending), which is the most important component in calculating the nation’sGDP. In fact, changes in real GDP correlate well with changes in real retail sales.
(2) Roughly 25% of total dollars spent on retail sales goes toward purchases ofmotor vehicles and auto-related products. This auto category, however, can beextremely volatile from month to month and can distort the larger retail salespicture. To offset this, there is a separate line in the report (“Total, excludingmotor vehicle and parts”) where the government strips out the auto spendingcomponent so one can better track the underlying trend in consumer spending.
(3) Because geopolitical events and domestic oil refining capacity can greatly influ-ence how much drivers pay for gasoline, it is wise to monitor this category ofspending as well and see how it affects total retail sales. For instance, a jump inconsumer outlays is not necessarily indicative of healthy economic growth if it’sthe result of a surge in gasoline prices. Indeed, over time, high gas prices depressspending in other retail sales sectors.
64 Chapter 3 • The Most Influential U.S. Economic Indicators
04Baumohl_Ch03.01-03.12.qxd 8/3/04 7:44 AM Page 64
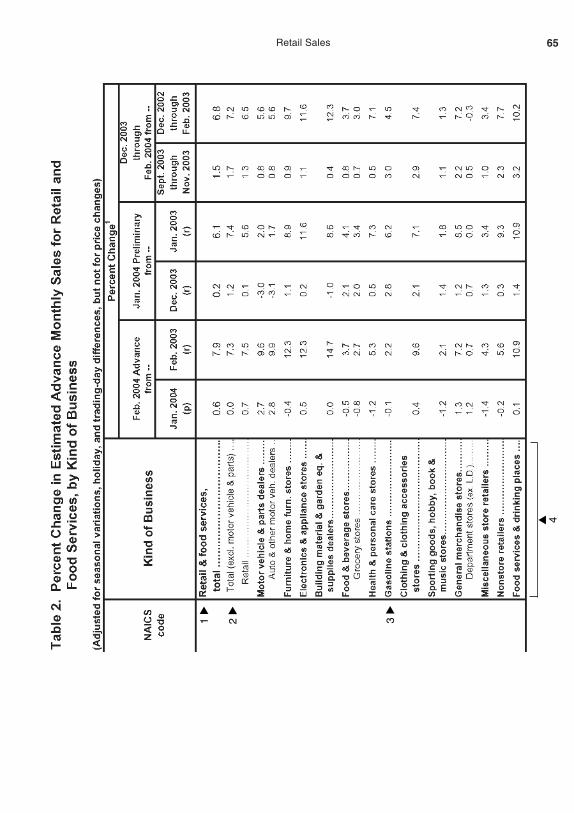
65Retail Sales
▲
1
▲
2
▲
3
▲ 4
04Baumohl_Ch03.01-03.12.qxd 8/3/04 7:44 AM Page 65
(4) This table also shows how various consumer-based industries fared from changesin retail sales. By looking at the performance of individual producers, one can seewhich sectors benefited the most in the latest period and whether one or twoindustries were chiefly responsible for the rise or fall in overall retail sales.
MARKET IMPACT
Though unreliable, the advance report on retail sales still manages to stir up the financialmarkets.
Bonds
Money managers in the fixed income market get all nervous when shoppers are having toogood a time in stores. A jump in retail sales suggests consumers are in a buying mood. Thiscould accelerate economic growth, a scenario that’s likely to lower bond prices and liftyields. A weak or falling retail sales report can set the stage for bond prices to rise.
Stocks
Participants in the equity markets closely monitor activity in the consumer sector of theeconomy. Healthy retail sales increase corporate revenues and profits, both of which arepositive for stock prices. If retail sales are paltry, however, it raises questions about whatconsumers are up to and whether business earnings can be sustained. Such uncertaintiesplace downward pressure on stock prices.
Dollar
Players in the currency markets find the retail sales report a tricky indicator to analyze.While foreigners prefer to see American consumers in a shopping mood because thatwould firm up interest rates (which is bullish for the dollar), an overly strong retail sales number can also spell trouble for the greenback because many of these goods areimported. Given the already massive U.S. trade deficit, a jump in imports also increasesdemand for non-dollar currencies to pay for all these foreign products—and that canpotentially hurt the dollar.
66 Chapter 3 • The Most Influential U.S. Economic Indicators
04Baumohl_Ch03.01-03.12.qxd 8/3/04 7:44 AM Page 66
E-COMMERCE RETAIL SALES
Market Sensitivity: Low.
What Is It: Measures sales of retail goods purchased through the Internet.
News Release on Internet: www.census.gov/mrts/www/current.html
Home Web Address: www.census.gov
Release Time: 10 A.M. (ET); released about seven weeks after the end of thequarter being covered.
Frequency: Quarterly.
Source: Census Bureau, Department of Commerce.
Revisions: Each report comes with revisions for the prior quarter.
WHY IS IT IMPORTANT
The bursting of the Internet bubble on Wall Street in 2000 eviscerated the portfolios ofmany investors. However, those who thought the dot.com collapse would also scare peo-ple away from shopping online turned out to be flat wrong. Thanks to cheaper and morepowerful PCs and the proliferation of high-speed broadband services, Americans are find-ing the experience of shopping by the Internet more efficient and rewarding. There’s noneed to worry about traffic jams, red lights, and battling for parking spots. You can docomparison shopping as well as purchase products online right from your home or office,and many merchants provide free shipping. The government has been tracking onlineretail sales since late 1999, and the data shows Internet purchases have been steadilyclimbing, grabbing a bigger slice of consumer dollars in the process.
There is one downside risk, however. Consumers give up a lot of personal informa-tion ordering online and worry that their electronic identities will be either misused byvendors or stolen. This concern should eventually fade with the use of more sophisticatedsecurity software that can protect sensitive data and from new legislation that sharplyrestricts what online retailers can do with your personal records.
While the main monthly retail sales report by the Census Bureau already includese-commerce sales, the government does not break out that data separately. Sales bybarnesandnoble.com are counted in the general merchandise component along with allother sales made by Barnes and Noble bookstores. Sales of Internet-only stores, suchas Amazon, are mixed in with other types of non-store retailers, such as mail-ordercatalog firms.
67E-Commerce Retail Sales
04Baumohl_Ch03.01-03.12.qxd 8/3/04 7:44 AM Page 67
It’s only in this quarterly e-commerce sales report where the details of online shop-ping are featured. One point to keep in mind is that not all online sales are included inthis report. Just as the monthly retail trade data excludes services (such as travel agenciesand financial services), they are also kept out of the e-commerce sales data.
Besides the Census Bureau, it’s helpful to know that other private organizationsoccasionally provide free reports on Internet commerce. They include
• Forrester Research (www.forrester.com)
• comScore Networks (www.comscore.com)
• Nielsen/Netratings (www.nielsen-netratings.com)
HOW IS IT COMPUTED
Online sales estimates by the Census Bureau are based on the same monthly survey usedfor the general monthly retail trade report. Some 13,000 retail firms are asked to sepa-rate out their e-commerce sales. By definition, an e-commerce sale is counted only whencustomers place the order online. It’s not necessary for them to actually pay for the itemsover the Internet. If they mail a personal check as payment for what was purchasedonline, it is still considered an e-commerce transaction. Online auctions are also classi-fied as e-commerce sales, but only commissions and fees generated from the auction areincluded, not the value of the products auctioned.
THE TABLES: CLUES ON WHAT’S AHEAD FOR THE ECONOMY
• Table 1 Estimated Quarterly U.S. Retail Sales: Total and E-Commerce
E-commerce retail sales are expected to become an important marker for the retailtrade industry. A quick study of this table tells why. By comparing total retail sales andits e-commerce component, it becomes clear that online sales are capturing an ever-increasing share of all retail sales. While e-commerce still accounts for a small per-centage of total retail sales, its growth is expected to dramatically accelerate in thenext five to ten years and become an important indicator of consumer spending trends.
68 Chapter 3 • The Most Influential U.S. Economic Indicators
04Baumohl_Ch03.01-03.12.qxd 8/3/04 7:44 AM Page 68
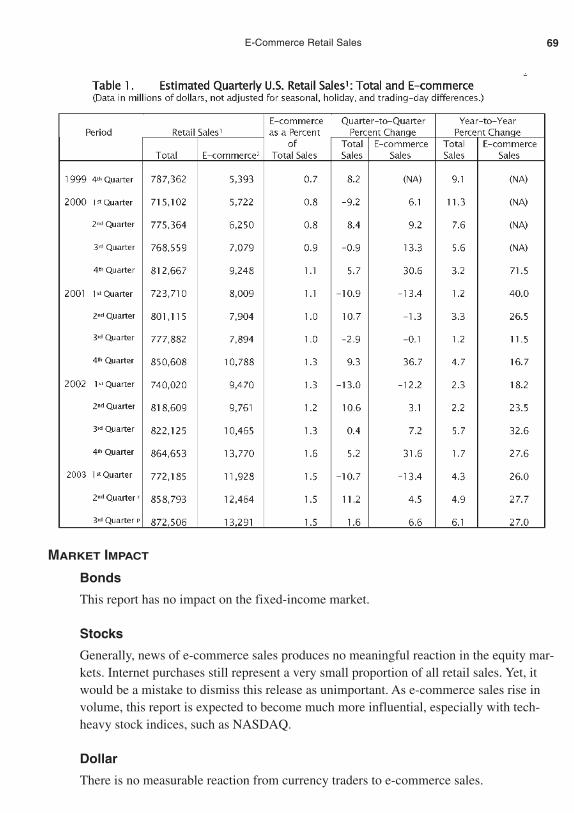
MARKET IMPACT
Bonds
This report has no impact on the fixed-income market.
Stocks
Generally, news of e-commerce sales produces no meaningful reaction in the equity mar-kets. Internet purchases still represent a very small proportion of all retail sales. Yet, itwould be a mistake to dismiss this release as unimportant. As e-commerce sales rise involume, this report is expected to become much more influential, especially with tech-heavy stock indices, such as NASDAQ.
Dollar
There is no measurable reaction from currency traders to e-commerce sales.
69E-Commerce Retail Sales
04Baumohl_Ch03.01-03.12.qxd 8/3/04 7:44 AM Page 69
WEEKLY CHAIN STORE SALES
Market Sensitivity: Medium.
WEEKLY CHAIN STORE SALES SNAPSHOT
What Is It: A weekly retail sales tracking measure of major department stores.
News Release on Internet: www.chainstoreage.com/industry_data/
Home Web Address: www.chainstoreage.com
Release Time: 7:45 A.M. (ET). The weekly survey is released on Tuesdays forthe week ending the prior Saturday. The monthly survey is published on thefirst or second Thursday of the following month.
Frequency: Weekly and monthly.
Source: ICSC (International Council of Shopping Centers)/UBS.
Revisions: Weekly figures are not revised; the monthly report undergoes somerevisions to reflect more complete data.
THE JOHNSON REDBOOK AVERAGE
What Is It: A quick glance at weekly sales at key department and chain stores.
News Release on Internet: No free access. Available only to paid clients. Seepress stories for the latest chain store sales.
Home Web Address: www.redbookresearch.com
Release Time: 8:55 A.M. (ET); every Tuesday for the week ending the priorSaturday. The monthly report is released the first Thursday of the new month.
Frequency: Weekly and monthly.
Source: Redbook Research.
Revisions: Not on weekly figures. Monthly numbers are revised as more dataarrives.
70 Chapter 3 • The Most Influential U.S. Economic Indicators
04Baumohl_Ch03.01-03.12.qxd 8/3/04 7:44 AM Page 70
71Weekly Chain Store Sales
WHY IS IT IMPORTANT
Want immediate feedback on how consumer spending has fared the last few days? Whowouldn’t given the critical role shoppers play in the economy. Two competing reports try toprovide near-real-time weekly assessments of consumer buying activity in large retail chainstores. One is the Johnson Redbook Average, which is produced by Redbook Research. Theother is a joint undertaking by the International Council of Shopping Centers and UBS, aglobal financial services firm, and is called the ICSC-UBS Weekly Chain-Store SalesSnapshot. Both reports take a similar approach to getting a read on consumer shopping.They contact department and discount chain stores every week for a quick assessment ofsales performance. Both release their reports on Tuesday and cover the week ending theprevious Saturday. Both also publish monthly chain store sales data. The two surveys lookat comparable store sales, which means that in order to be included in the survey, the storeshave to be open for at least a year. What’s different between the two surveys are the num-bers of stores represented in their results and their precise methodologies.
One question that bubbles right to the surface is how these chain store surveys differfrom the government’s official monthly retail sales report. The answer is they’re very dif-ferent. The retail sales release put out by the Census Bureau represents a broad sample ofretailers, both large and small, while the chain store results are based mainly on purchasesat department stores that have multiple outlets around the country. These stores includeMacy’s, Sears, Wal-Mart, and Target. A second point to consider is that while investorsare always hungry for the most current news on consumer spending, department storesales make up just 10% of all household expenditures. People lay out lots more money oncars, vacations, entertainment, health care, food, and a host of other goods and services.Thus, chain-store sales, while a good gauge of current shopping trends, are not a veryeffective indicator of future consumer spending. Nevertheless, investors and economistslike to follow the chain store series because there aren’t many reports that describe salesactivity with such immediacy.
HOW IS IT COMPUTED
International Council of Shopping Centers and UBS (ICSC-UBS)
This weekly report first became available in 1994 and is based on hard sales data by justtwo large department stores, Wal-Mart and Target. Information is then extrapolated toreflect probable sales activity for about 80 chain stores. ICSC-UBS then creates an indexthat reflects changes in sales for the past week and also from year-ago levels. A seasonaladjustment calculation allows for some week-to-week analysis, though year- to-year com-parisons are more reliable.
04Baumohl_Ch03.01-03.12.qxd 8/3/04 7:44 AM Page 71
Unlike the weekly report, the monthly chain store sales survey is authored entirelyby the International Council of Shopping Centers (not in collaboration with UBS) and isbased on hard sales data from close to 80 establishments, including specialized chainssuch as The GAP and Abercrombie & Fitch. Because they have broader coverage, themonthly chain store figures can serve as a rough leading indicator of future non-autoretail sales in the government series. The first set of numbers on the monthly sales is pre-liminary because not all of the retailers have released their data. A month later, however,the ICSC produces a final number which is based on more complete data.
The Johnson Redbook Average
The Johnson Redbook Average monitors weekly sales trends by contacting a handful (theprecise number is not revealed) of large general merchandise retailers. For example, bycontacting Wal-Mart, the Redbook can get sales information not only from Wal-Mart’smain brand stores, but also from its affiliated discount chain, like Sam’s Club. All told,the Johnson Redbook Average contacts retailers that have more than $250 billion inannual sales. With the data in hand, Redbook then puts together a sales-weighted averageindex and produces two main reports. One is weekly, which is used primarily for year-on-year comparisons. Though it is possible to monitor sales performance from week to week,these numbers are not seasonally adjusted, so it is hard to make any meaningful compari-son given the volatility in this series.
The monthly numbers are seasonally adjusted, making comparisons between monthsand for the year more meaningful. Yet even the monthly index can bounce around quite abit, especially during key seasons, such as in August with back-to-school shopping and inDecember with the holiday season. Most investors focus on the weekly figures becausethey are current and can provide an early glimpse of whether consumers are in a shoppingmood. Those who follow the monthly reports tend to be more interested in the financialhealth of retailers for stock-picking purposes; they are not necessarily interested in itsvalue as a broader economic indicator.
THE TABLES: CLUES ON WHAT’S AHEAD FOR THE ECONOMY
• ICSC-UBS Weekly Chain-Store Sales Snapshot
(1) This graph gives you an idea of how weekly sales have been performing relativeto a 16-week, moving-average trend line.
(2) The table lists the results of the latest weekly sales activity, how it compared toprevious weeks, and the year-ago performance.
72 Chapter 3 • The Most Influential U.S. Economic Indicators
04Baumohl_Ch03.01-03.12.qxd 8/3/04 7:44 AM Page 72
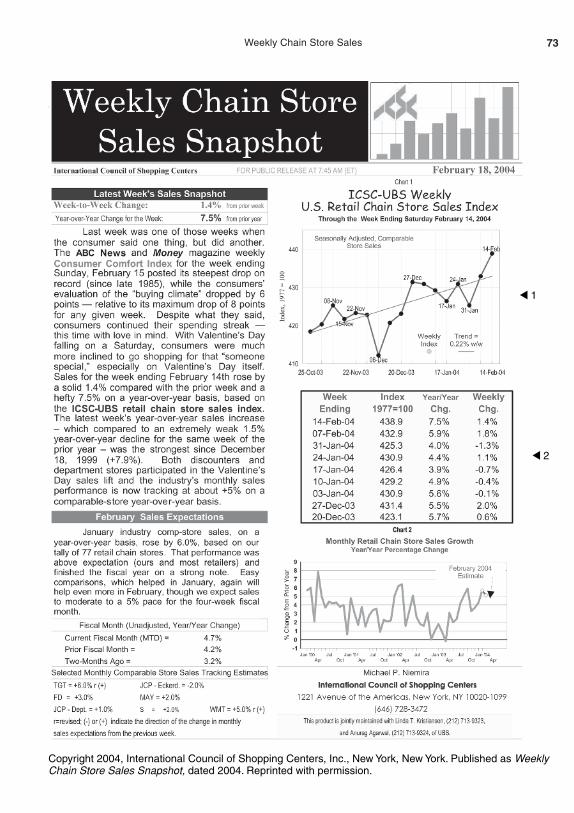
73Weekly Chain Store Sales
▲ 1
▲ 2
Copyright 2004, International Council of Shopping Centers, Inc., New York, New York. Published as WeeklyChain Store Sales Snapshot, dated 2004. Reprinted with permission.
04Baumohl_Ch03.01-03.12.qxd 8/3/04 7:45 AM Page 73

• The Johnson Redbook Average
Survey reports and charts are available only to clients. Others can find the Redbookresults in the press.
MARKET IMPACT
Bonds
Participants in the fixed-income market monitor, if casually, the Redbook and the ICSC-UBS chain store sales reports because they are a good finger-in-the-wind measure of con-sumer spending behavior. If you know what consumers are doing at shopping malls, ittells you something about their appetite to spend. Strong department store sales can makebond investors queasy because of their implications for the economy and inflation. On aslow financial news day, such a report can depress bond prices and cause yields to creephigher. However, traders are usually looking at other larger economic or political news sothe chain store sales report often slips into the background.
Stocks
Investors in equities pay more attention to chain store numbers than their colleagues inthe bond market. The weekly and monthly sales figures can set the tone for the retailindustry as a whole. Healthy chain store sales growth could result in bigger corporateprofits and that often translates into higher stock prices. Second, these statistics providesome insight into which retailers are doing well and which are ailing, allowing investorswith exposure in the retail sector to shift their money accordingly.
Dollar
Currency markets do not react to the chain store sales numbers.
74 Chapter 3 • The Most Influential U.S. Economic Indicators
04Baumohl_Ch03.01-03.12.qxd 8/3/04 7:45 AM Page 74

CONSUMER CREDIT OUTSTANDING
Market Sensitivity: Low.
What Is It: Tracks monthly changes in consumer installment debt.
News Release on Internet: www.federalreserve.gov/releases/g19
Home Web Address: www.federalreserve.gov
Release Time: 3:00 P.M. (ET); approximately five to six weeks after the monthbeing reported.
Frequency: Monthly.
Source: Federal Reserve Board.
Revisions: Can be large from month to month.
WHY IS IT IMPORTANT
The consumer installment debt release usually evokes little more than a yawn from theinvestment community. For one, it comes out quite late, nearly two months after the fact.By then, numerous other reports on consumer outlays for the same month have alreadycome out. Moreover, the release itself arrives mid-afternoon, just as traders are looking toclose their orders for the day. So it shouldn’t be surprising if these professional investorsfind it hard to get worked up about news on consumer credit. Nevertheless, it would be amistake to dismiss this report, for it has lots of useful information that can add to our under-standing of the financial health of consumers and of the future course of the economy.
By definition, consumer installment debt is virtually any debt taken on by individualsthat is not secured by real estate. What kind of debt are we talking about? There areessentially two types. One is revolving credit, with which most everyone is familiar. Theyinclude credit cards issued by banks, retail stores, and gasoline companies. Whether youpay all your credit card balance at once without incurring interest charges or spread thepayments out for months with finance charges, it is all considered revolving credit.However, credit card usage makes up only 40% of all consumer installment debt. The restis non-revolving credit. This consists of outright loans to finance the purchase of autos,boats, mobile homes, vacations, home improvement, and education. It also includes therefinancing of existing debt. Consumer installment credit does not include any loan that iscollateralized by real estate, so home mortgages and home equity loans are not counted inthis series. Motor vehicle leases are also excluded.
75Consumer Credit Outstanding
04Baumohl_Ch03.01-03.12.qxd 8/3/04 7:45 AM Page 75
If the amount of consumer credit outstanding increases for the month, it meanshouseholds have borrowed more than they paid off in that period and reflects greater per-sonal spending. When households feel secure about their jobs and income, they becomemore comfortable with taking on new debt. On the other hand, if the economic climateworsens, people tend to be far more cautious about borrowing. Historically, consumerborrowing and spending tend to rise and fall together. In the short term, though, personaldebt can fluctuate quite a lot because of other factors, such as prices, temporary loss ofincome, and changes in consumer confidence levels.
However, a vital piece of information is missing in this report. The Federal Reservedoes not explicitly quantify how much new credit was extended to consumers or theamount of debt that was paid off. It publishes only the net change in indebtedness. Thus,analysts are left wondering whether the monthly change in credit outstanding occurredbecause people took out lots more debt or cut back on their repayments, or both. Forexample, say the total amount of outstanding consumer debt increased from $100 billionto $103 billion in one month, a net rise of $3 billion. However, it’s unclear whether peo-ple borrowed an additional $3 billion more and made no repayment on earlier loans orborrowed as much as $15 billion that month but also repaid $12 billion in old loans for anet change of, once again, $3 billion. This crucial missing piece of data keeps analystsfrom drawing any firm conclusion on future spending patterns.
Another factor that prevents consumer installment debt from being a reliable leadingindicator of household spending is that consumers prefer using credit cards simplybecause they’re more convenient to carry than money. If credit users pay off their entirebalance every month, all they’re doing is replacing cash with credit. In the data, this canregister as a temporary increase in revolving credit, but it won’t necessarily result ingreater spending.
HOW IS IT COMPUTED
To compile the consumer installment numbers, the Federal Reserve obtains informationfrom banks, finance companies, S&Ls, credit unions, and other types of lending institu-tions. The data is then totaled and seasonally adjusted. The dollar amounts are not annual-ized; they represent the actual outstanding balance at the end of the month. Revisions onconsumer installment debt can be substantial, so use the preliminary figures with caution.To better detect a genuine shift in the pace of borrowing, one has to evaluate the data overa three-to-six-month time frame.
THE TABLES: CLUES ON WHAT’S AHEAD FOR THE ECONOMY
• Table Consumer Credit Outstanding
(1) This line shows total consumer credit outstanding in dollar amounts as of theend of the last several months, quarters, and years. Below is the breakdown ofthe two main components: revolving and non-revolving debt.
76 Chapter 3 • The Most Influential U.S. Economic Indicators
04Baumohl_Ch03.01-03.12.qxd 8/3/04 7:45 AM Page 76
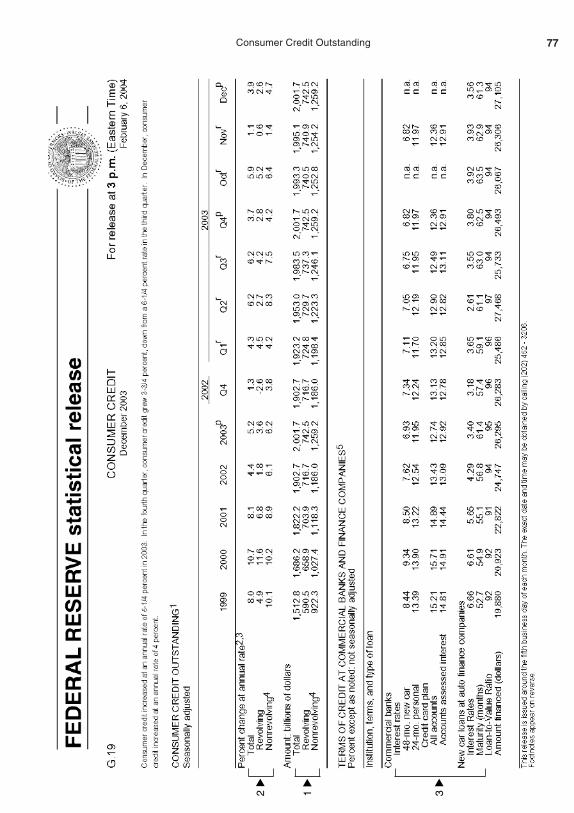
77Consumer Credit Outstanding
▲
2
▲
3
▲
1
04Baumohl_Ch03.01-03.12.qxd 8/3/04 7:45 AM Page 77

78 Chapter 3 • The Most Influential U.S. Economic Indicators
A couple of pointers here. Growth in consumer credit can have positive as wellas negative consequences for the economy. We’ve already noted that a signifi-cant expansion in borrowing can lead to greater spending and thus stimulate eco-nomic activity. On the flip side, if households accumulate too much debt relativeto their income growth, they will slash spending and use a greater portion oftheir future income to pay off some of this swollen debt, a shift that can reducesales and slow the economy. The question becomes at what point does the levelof debt get so high as to strain household finances? Experts disagree on this.One indication of trouble can be seen by comparing total consumer installmentdebt with the annualized amount of personal income that month (see the sectionon Personal Income and Spending). Since the 1960s, consumer debt has gener-ally settled within a range of 14% to 18% of personal income. By the 2001recession, however, it jumped to more than 19%. Generally, when the ratioexceeds 17%, credit card delinquencies start to accelerate and this serves as awarning that households are beginning to struggle with their debt load.
If household debt levels are high at a time when interest rates are climbing or asunemployment increases, the ramifications for the economy can be quite serious.Loan applications for non-revolving credit will quickly plummet because con-sumers are reluctant to purchase expensive items, such as a car or a boat, giventhe high cost of borrowing and the uncertain outlook of their income. However,there’s an interesting twist here. Revolving credit will likely stay strong evenunder such unsettling conditions. Why is that? Because consumers initially loaththe notion they have to lower current living standards even if the economicclouds look threatening. It’s not easy to suddenly cut back on discretionaryactivities such as dining out, taking weekend trips, and going to malls and themovies. Most of these activities are paid for with revolving credit. In addition,households can’t give up spending on staples such as cell phone usage, pharma-ceuticals, and food. Thus, in the early stages of economic or financial stress, it’svery possible to see non-revolving credit drop off sharply, while revolving creditmight show little or no slowdown.
(2) The percent change is annualized in this part of the table, and that allows you tomake quick comparisons over time whether the pace of indebtedness is acceler-ating, slowing, or falling.
(3) Generally, the greater the demand for consumer credit, the greater the pressureon interest rates to rise. In this table, we see what level of interest rates financialinstitutions charge for different types of borrowings. Credit card debt carries thehighest interest rate, and during difficult economic times, the burden of servicingthat debt can pinch household balance sheets. The result: Credit card delinquen-cies and even personal bankruptcy filings begin to increase.
04Baumohl_Ch03.01-03.12.qxd 8/3/04 7:45 AM Page 78
To get the latest reading on credit card delinquencies, go to the American BankersAssociation site, which publishes this data every March, June, September, and December:www.aba.com/Press+Room/PR_ReleasesMenu.htm.
For the most current numbers on personal bankruptcy filings, check out the AmericanBankruptcy Institute’s site: www.abiworld.org/template.cfm?section=news_room.
MARKET IMPACT
The consumer credit outstanding data arrives nearly two months late, long after otherconsumer spending reports are out. That’s why this economic indicator doesn’t set themarkets on fire when it’s released.
Bonds
Though fixed income investors normally do not react to these debt numbers, an unex-pected jump in borrowing can upset the bond market. It means households are more will-ing and able to buy consumer goods, which can accelerate economic growth, raise theprospect of higher inflation, and place upward pressure on interest rates.
Stocks
The equity market’s response is mostly muted. Eyebrows will go up, however, if theconsumer installment credit report shows a sustained contraction in borrowing. It hintsof rising household financial stress which could lead to cutbacks in spending and thusfewer sales.
Dollar
The U.S. currency is unaffected by the data on consumer installment debt. Foreignexchange traders have adjusted their portfolio well in advance of this indicator because ofother, more timely reports on consumer expenditures.
79Consumer Credit Outstanding
04Baumohl_Ch03.01-03.12.qxd 8/3/04 7:45 AM Page 79
CAMBRIDGE CONSUMER CREDIT INDEX
Market Sensitivity: Low.
What Is It: Measures how individuals are handling consumer debt.
News Release on Internet: www.cambridgeconsumerindex.com/index.asp?content=survey
Home Web Address: www.cambridgeconsumerindex.com
Release Time: 8:30 A.M. (ET); comes out the fifth business day of every month,the same day the Federal Reserve releases consumer credit outstanding.
Frequency: Monthly.
Source: Cambridge Credit Counseling Corp.
Revisions: Figures are not revised.
WHY IS IT IMPORTANT
Economists have always been befuddled by consumers. No matter how hard they try topredict consumer behavior, forecasters generally end up with egg on their faces, humbledtime and again by one of nature’s immutable laws: people are inherently unpredictable.Yet many in the economics profession still cling to the notion they’re just an equation ortwo away from coming up with a formula that will allow them to prognosticate futurepatterns of consumer spending and borrowing. Who could blame them for trying? Rightnow, about half a dozen indicators released by the government and private groups claimto foretell consumer activity. Their results have been mediocre at best. The latest entryinto the field is the Cambridge Consumer Credit Index (CCCI), but this one may actuallybe on to something and thus worth watching. Given its brief track record, the CCCI hasthe potential of being an important economic indicator and a major market mover in theyears ahead.
The CCCI, which debuted in December 2001, is the only major survey that regularlyexplores the mind-set of Americans regarding their personal debt. Its core question focuseson one of the most influential determinants of current and future consumer expenditures:Do you plan to take on more debt in the near future, or reduce your debt load?
Why is this issue so important? Credit fuels economic activity, and when we’re talkingabout consumers using credit, we’re referring to a force in the economy that accounts formore than two-thirds of the GDP. Indeed, between 2001 and 2003, consumers were respon-sible for about 90% of the growth in the economy. Given this background, it’s important toknow whether Americans intend to continue borrowing—a sign that’s normally bullish forthe economy—or are planning to pay off some IOUs and lower their debt burden—anaction that may reduce future outlays and slow business activity. The Cambridge ConsumerCredit Index can thus be viewed as a forward-looking economic indicator.
80 Chapter 3 • The Most Influential U.S. Economic Indicators
04Baumohl_Ch03.01-03.12.qxd 8/3/04 7:45 AM Page 80

HOW IS IT COMPUTED
Every month, the Cambridge Credit Counseling Corp., a firm that helps over-indebtedAmericans reduce their IOUs, releases the results of a poll that tracks consumer senti-ments about credit. Some three to five days before the report is published, the companysurveys more than 1,000 randomly selected households representing an assortment ofdemographic groups. The definition of debt in this report is precisely the same one theFederal Reserve uses in its consumer credit outstanding series. It includes revolvingcredit, such as credit cards, retail store cards, and gasoline cards, and non-revolvingcredit, which is essentially loans used to finance purchases of cars, boats, vacations, andeducation. Excluded from this debt series are any loans that are secured by real estate.
Those queried are asked three main questions concerning their handling of personal debt:
1. In the past month, have you taken on a lot more debt or a little more debt, or haveyou paid off a little debt or paid off a lot of debt?
2. In the next month, do you anticipate that you will take on a lot more debt, take ona little more debt, pay off a little debt, or pay off a lot of debt?
3. In the next six months, do you anticipate making a major purchase such as a car,appliance, education, medical procedure, furniture, or carpeting that will requireyou to take on a lot of debt or a small amount of additional debt? (Respondents aretold to exclude the purchase of a home or other mortgage-type debt.) Or over thenext six months do you anticipate that you will pay off a small amount of debt or alarge amount of debt?
A diffusion-like index is computed from the answers to each question. The result is anumber that can range anywhere from 0 (where everyone says they are paying off debt)to 200 (where everyone is taking on more debt). A figure of 100 is considered neutral;that is, half the respondents say they were adding to debt and half remarked they werepaying off debt. Thus, an index below 100 means that more people are reducing theirhousehold debt level than adding to it. If the index climbs above 100, more Americansare adding to their debt than paying it off. Finally, an average is taken of the three keyquestions to come up with the headline index, called the “overall credit index.”
In addition to the preceding questions, there’s a fourth, stand-alone query that isbased on a topical issue. This wild-card question has in the past touched on subjects suchas the level of burden caused by student loans, how a war with Iraq will affect consumerborrowing, and what individuals think about bankruptcy reform legislation.
THE TABLES: CLUES ON WHAT’S AHEAD FOR THE ECONOMY
Cambridge Credit Counseling publishes its monthly survey results on the Web for free,and they are loaded with information on what households plan to do about debt. Somehighlights of the report are listed in the following pages.
81Cambridge Consumer Credit Index
04Baumohl_Ch03.01-03.12.qxd 8/3/04 7:45 AM Page 81
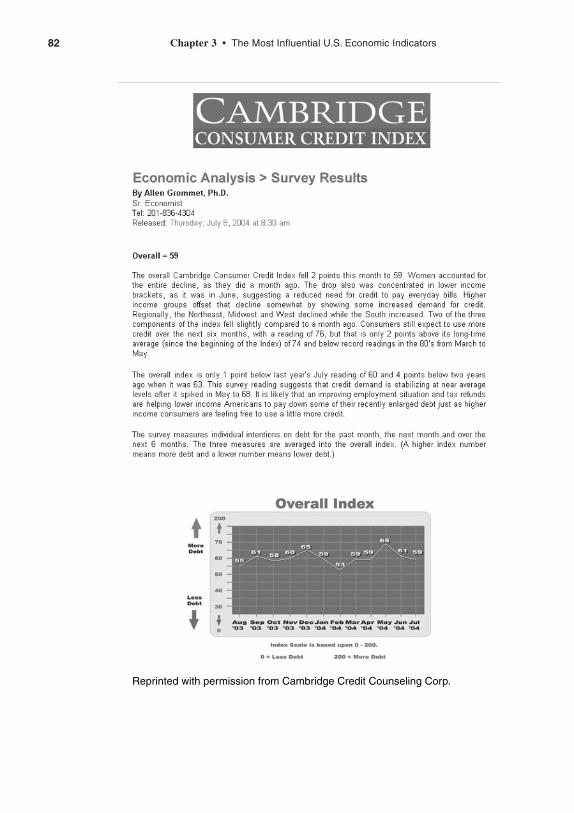
82 Chapter 3 • The Most Influential U.S. Economic Indicators
Reprinted with permission from Cambridge Credit Counseling Corp.
04Baumohl_Ch03.01-03.12.qxd 8/3/04 7:45 AM Page 82
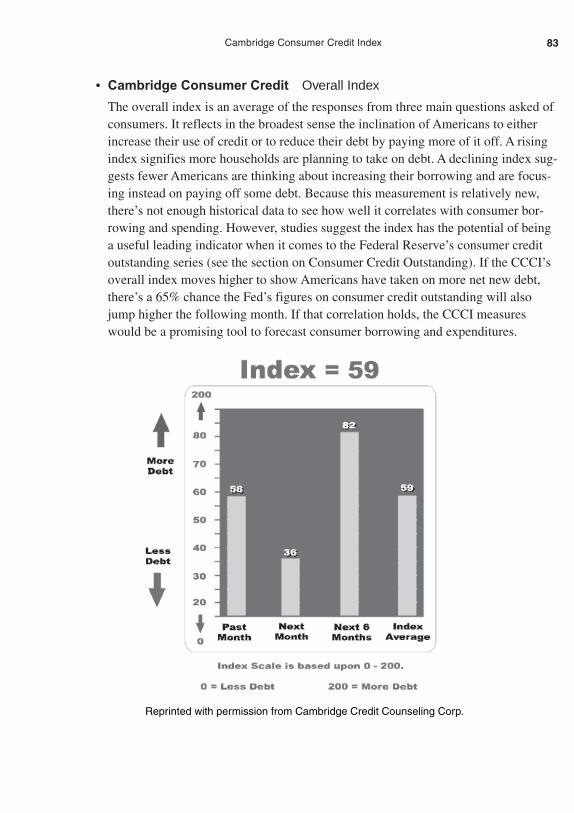
• Cambridge Consumer Credit Overall Index
The overall index is an average of the responses from three main questions asked ofconsumers. It reflects in the broadest sense the inclination of Americans to eitherincrease their use of credit or to reduce their debt by paying more of it off. A risingindex signifies more households are planning to take on debt. A declining index sug-gests fewer Americans are thinking about increasing their borrowing and are focus-ing instead on paying off some debt. Because this measurement is relatively new,there’s not enough historical data to see how well it correlates with consumer bor-rowing and spending. However, studies suggest the index has the potential of beinga useful leading indicator when it comes to the Federal Reserve’s consumer creditoutstanding series (see the section on Consumer Credit Outstanding). If the CCCI’soverall index moves higher to show Americans have taken on more net new debt,there’s a 65% chance the Fed’s figures on consumer credit outstanding will alsojump higher the following month. If that correlation holds, the CCCI measureswould be a promising tool to forecast consumer borrowing and expenditures.
83Cambridge Consumer Credit Index
Reprinted with permission from Cambridge Credit Counseling Corp.
04Baumohl_Ch03.01-03.12.qxd 8/3/04 7:45 AM Page 83
• Cambridge Consumer Credit Past Month
This graph reflects what those interviewed did about debt the previous month.Though an index value of 100 means that half of those polled said they would takeon more debt and the other half were paying off their IOUs, what’s important inthese charts is the emerging trend.
• Cambridge Consumer Credit Next Month and the Next Six Months
These two vertical bars look at the future plans Americans have with respect to debt.They reflect responses from the second and third questions previously described.Again, a reading below 100 means more Americans are planning to reduce house-hold debt levels than add to them. An index above 100 signifies that more people arelooking to add to their debt than pay it down.
• The Reality Gap (Not Shown)
Another interesting measure in this press release is labeled the reality gap. It’s basedon the difference between what consumers say they will do about debt in the nextmonth and how much they actually followed through on their intentions, which willbe known when the survey is taken a month later. An increase in the reality gap por-tends trouble for the economy because it suggests households are falling behind intheir ability to pay off debts as they expected to do. This can happen when house-holds suffer a sudden loss of income or if there’s an unforeseen rise in expenses. Incontrast, the reality gap shrinks when people carry out plans to reduce their personaldebt, a step considered bullish for the long-term economy. As consumers worktoward restoring their financial health, they’ll be in a better position to buy big-ticket items on credit in the future.
• Cambridge Consumer Credit Index General Population andDemographic Breakdown (Not Shown)
One highly informative part of a survey comes at the end of the release. CambridgeCredit Counseling makes available not just its summary indexes, but also breaksdown how people responded to questions of debt based on gender, age, income, edu-cation, and race, and whether they live in an urban or rural area. The real value herefor investors, marketing executives, and business leaders is that these numbers arevery current; they are based on responses taken just days earlier.
84 Chapter 3 • The Most Influential U.S. Economic Indicators
04Baumohl_Ch03.01-03.12.qxd 8/3/04 7:45 AM Page 84

MARKET IMPACT
Bonds
Despite its timeliness and potential as a leading economic indicator, the CambridgeConsumer Credit Index has yet to appear on the radar screen of most fixed income moneymanagers. This is a new measure and it might take time for the financial markets tobecome comfortable with it. Until then, it’s unlikely the bond market will react much tothe release.
Stocks
Nor is the index well known among equity investors, but that will change if this measuredemonstrates success at foreshadowing consumer spending and borrowing.
Dollar
It plays no role in the performance of the dollar.
85Cambridge Consumer Credit Index
04Baumohl_Ch03.01-03.12.qxd 8/3/04 7:45 AM Page 85
CONSUMER CONFIDENCE INDEX
Market Sensitivity: Medium, but can be high at turning points in the economy.
What Is It: Examines how consumers feel about jobs, the economy, andspending.
News Release on Internet: www.conference-board.org/economics/consumerConfidence.cfm
Home Web Address: www.conference-board.org/
Release Time: 10 A.M. (ET); announced the last Tuesday of the month beingsurveyed.
Frequency: Monthly.
Source: The Conference Board.
Revisions: Minor revisions can occur as more survey results are collected.
WHY IS IT IMPORTANT
Happy consumers are good for business. They are more likely to shop, travel, invest, andkeep the economy on a roll. An unhappy and insecure consumer is lousy for business, andif the number of malcontents is large enough, it can derail economic activity. Thus, anysign of failing confidence can immediately set off alarms in Washington and Wall Streetbecause consumer expenditures account for well over half of the economy’s totaldemand. For that reason, economists, government policymakers, and professional moneymanagers carefully track the temperament of households.
Presently, no less than three organizations regularly check the mood of consumers.Among the best known are the Conference Board and its monthly Consumer ConfidenceIndex, the University of Michigan’s Consumer Sentiment Survey, and ABC News/Moneymagazine’s weekly Consumer Comfort Index. Of course, all these groups consider theirown data an important leading indicator of the economy. The fact is that all have certaindisadvantages that limit their effectiveness in predicting consumer spending.
The Consumer Confidence Index, which claims to be based on the response of 5,000households, is a volatile series with a spotty link to household expenditures. TheUniversity of Michigan’s Consumer Sentiment Survey polls a much smaller population. Itqueries 500 adults; ABC News/Money talks to 250 new people every week but asks onlyabout current economic conditions and not future expectations.
Furthermore, you would think that the two best-known surveys—Consumer Confidenceand the Consumer Sentiment—would show similar performances month to month, but theyoften don’t. One might point to a pickup in confidence among consumers, while the othermay show a decline. Why have such conflicting signals? For one, they pursue different
86 Chapter 3 • The Most Influential U.S. Economic Indicators
04Baumohl_Ch03.01-03.12.qxd 8/3/04 7:45 AM Page 86
approaches in their surveys. Conference Board questionnaires place more emphasis onhousehold reaction to labor market conditions, while the University of Michigan gauges con-sumer attitudes on financial and income situations. This puts the Conference Board surveysomewhat at a disadvantage as a leading indicator. The labor market is very slow to react toeconomic changes. For instance, just before a recession bottoms out, stock prices and con-sumer spending often rebounds. But the unemployment rate tends to stay stubbornly higheven long after the recovery has started. In addition, there might be a bias in the ConsumerConference Index because the questionnaires are mailed out around the time the governmentreleases the unemployment report. So there may be some psychological spillover whenrespondents fill out the survey. That’s less an issue with the University of Michigan’sSentiment Survey because it dwells on personal income expectations, which ultimately arethe most important driving force behind consumer spending. Indeed, the University ofMichigan’s Consumer Expectations component is included in the Conference Board’s Indexof Leading Economic Indicators (see the section on Leading Economic Indicators).
Another crucial difference between the two surveys is that the Conference Boardqueries an entirely new group of people every month, while the Michigan survey goesback to interview many of the same individuals they initially polled. This makes theConsumer Confidence Index more erratic on a month-to-month basis compared to theSentiment Survey. The two also cover different time frames in their questions. TheConference Board seeks expectations over the next six months; the University of Michiganallows for a much longer period in its expectations component—one to five years.
The bottom-line question with these consumer surveys is are they able to devinefuture household spending? Not very well, unfortunately. It’s certainly reasonable to con-clude that when households are uncertain about their future, they would be more watchfulof every dollar spent. By the same token, if Americans are upbeat about the economicoutlook, it’s logical to think they feel more comfortable about spending. However, it hasn’t quite worked out that way, much to the chagrin of many analysts. History hasshown the relationship between consumer confidence and spending is not a close one,even though it is perfectly intuitive to think so. Perhaps this is a reminder that no method-ology, mathematical construct, or statistical model can successfully predict how humanbeings will behave in a given circumstance. The best advice here is to put less weight onwhat consumers tell pollsters about their expectations of the future and focus instead onwhat people are doing with their money right now. The strongest evidence of confidencecan be found at one place—the cash register.
That doesn’t mean the Consumer Confidence Index is not without some forward-looking merit. While the short-term, month-to-month correlation between confidence andspending is a slim one, it does strengthen over the long term. A six-month or nine-monthmoving average of consumer confidence levels has proven to be a somewhat better indi-cator of future household outlays.
87Consumer Confidence Index
04Baumohl_Ch03.01-03.12.qxd 8/3/04 7:45 AM Page 87

HOW IS IT COMPUTED
The Conference Board’s Consumer Confidence Index began as a bimonthly in 1967 andturned monthly in 1977. It’s based on an attempt to survey approximately 5,000 house-holds nationwide every month. Rarely, however, do that many respond. About 2,500make it in time to be included in the preliminary release of the index. A month later, arevision is published. It includes another 1,000 or so late responses. In the end, though,the difference in outcome between the first report and the follow-up revision is usuallyinsignificant.
Here are the key questions asked in the survey:
1. How would you rate the present general business conditions in your area? Good,normal, or bad?
2. Six months from now, do you think they will be better, the same, or worse?
3. What would you say about available jobs in your area right now? Plenty, not somany, or hard to get?
4. Six months from now, do you think there will be more jobs, the same, or fewerjobs?
5. What would you guess your total family income to be six months from now?Higher, the same, or lower?
The Conference Board often throws in additional questions based on current eco-nomic conditions. For example, in a climate of falling interest rates, they might askhouseholds if they plan to refinance their mortgage in the next six months.
With all the data in hand, the Conference Board produces three headline indices, allof which are seasonally adjusted. One is the Present Situations Index, and it reflects con-sumers’ attitudes about current conditions. The second is the Expectations Index, whichrepresents how consumers feel conditions might change in the next six months. Finally,you have the overall Consumer Confidence Index, which is based on a composite of themain five questions and weighted so that expectations make up 60% of the index whileopinions of the current situation account for the remaining 40%.
THE TABLES: CLUES ON WHAT’S AHEAD FOR THE ECONOMY
The Conference Board is a subscription-based service, so only a limited amount of freeinformation is found on its Web site. Those who want more details on the most currentconsumer confidence survey need to subscribe. The fee-based data contains demographicbreakdowns by age and income, responses from nine geographic regions covering thecountry, and a list of major goods and services consumers will purchase in the next sixmonths.
88 Chapter 3 • The Most Influential U.S. Economic Indicators
04Baumohl_Ch03.01-03.12.qxd 8/3/04 7:45 AM Page 88
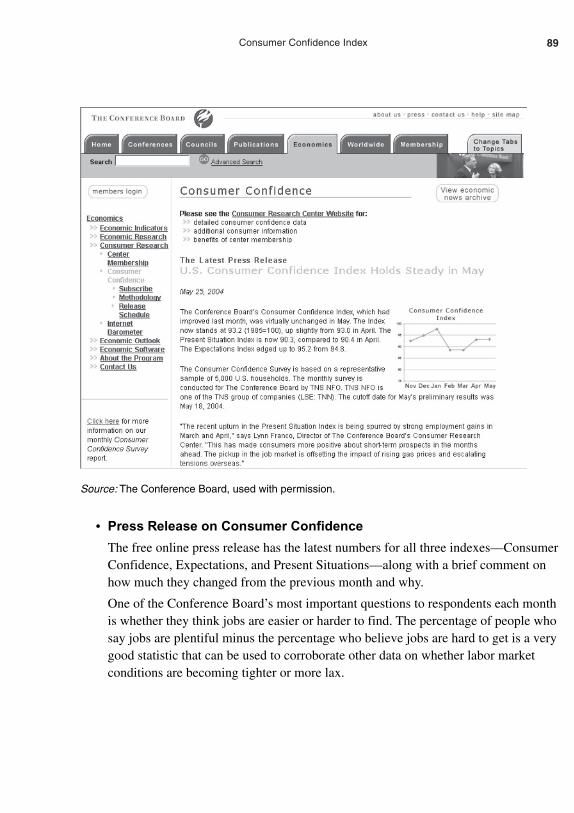
89Consumer Confidence Index
• Press Release on Consumer Confidence
The free online press release has the latest numbers for all three indexes—ConsumerConfidence, Expectations, and Present Situations—along with a brief comment onhow much they changed from the previous month and why.
One of the Conference Board’s most important questions to respondents each monthis whether they think jobs are easier or harder to find. The percentage of people whosay jobs are plentiful minus the percentage who believe jobs are hard to get is a verygood statistic that can be used to corroborate other data on whether labor marketconditions are becoming tighter or more lax.
Source: The Conference Board, used with permission.
04Baumohl_Ch03.01-03.12.qxd 8/3/04 7:45 AM Page 89
MARKET IMPACT
Bonds
Though questions abound regarding its efficacy as a predictor of household spending, asharp and sustained rise in consumer confidence is nevertheless worrisome to fixed-income investors. It could lead to an acceleration in borrowing and shopping, factors thatcan fuel faster economic growth and stoke inflation. Bond traders prefer to see consumerconfidence less ebullient about the future or an outright decline in the index. This wouldsuggest a retrenchment in spending and more modest economic activity ahead.
Stocks
Crumbling confidence by consumers is not favorable to equities because it can presagedeclining business sales and fading profits. Shareholders hope consumer confidence stayshigh to encourage more spending, which is bullish for stocks.
Dollar
A depressed consumer makes foreign investors with exposure in the U.S. markets a bitnervous. It raises the prospects of falling interest rates and a weakening business climate,both of which bode ill for the dollar’s value. Foreign investors might sell the U.S. cur-rency in search of higher yields and a stronger economy elsewhere. On the other hand, anupbeat consumer can lift U.S. interest rates and stock market returns to levels that prom-ise a higher return relative to other regions in the world, and this normally has the effectof increasing demand for dollars.
90 Chapter 3 • The Most Influential U.S. Economic Indicators
04Baumohl_Ch03.01-03.12.qxd 8/3/04 7:45 AM Page 90
SURVEY OF CONSUMER SENTIMENT
Market Sensitivity: Medium, but can be high at turning points in the economy.
What Is It: Near-real-time assessment of consumer attitudes on the businessclimate, personal finance, and shopping.
News Release on Internet: www.sca.isr.umich.edu/press-release.php
Home Web Address: www.sca.isr.umich.edu/main.php
Release Time: 9:45 A.M. (ET); preliminary numbers are released on the secondFriday of each month. Final figures come out the last Friday of the samemonth.
Frequency: Semi-monthly.
Source: Survey Research Center, University of Michigan.
Revisions: Low. Preliminary numbers, out mid-month, are revised two weekslater.
WHY IS IT IMPORTANT
This is the granddaddy of all consumer attitude surveys. Since 1946, the University ofMichigan has been interviewing consumers about their finances and their opinions onnational economic conditions. Some experts believe it to be a better predictor of house-hold spending than the Conference Board’s Consumer Confidence Survey. Indeed, onecomponent of the Michigan Sentiment survey—Consumer Expectations—is included inthe Conference Board’s Index of Leading Economic Indicators. The rationale behindthese attitude surveys is the widespread belief among economists that while it’s virtuallyimpossible to predict consumer behavior with any precision, Americans do seem moreadept at picking up early signs of an economy that is starting to sputter than they are atidentifying the beginning of a recovery. Experts think this is because households are moreacutely sensitive to losing money than gaining it. Whatever the reason, over the yearsconsumers have demonstrated a pretty good track record of predicting economic down-turns. As a result, many brokerage firms, lenders, and retailers are willing to spend bigbucks to subscribe to the Sentiment survey.
The University of Michigan publishes its information twice a month. A preliminaryreading of the survey (incorporating about 60% of the 500 respondents) is made availableto clients mid-month on a confidential basis through a conference call and via fax. Theseresults are not meant for widespread distribution, but the release is regularly leaked to thepress and thus known to the financial markets. A final report is issued on the last Friday
91Survey of Consumer Sentiment
05Baumohl_Ch03.13-03.20.qxd 8/3/04 7:37 AM Page 91

92 Chapter 3 • The Most Influential U.S. Economic Indicators
of the month. While that comes out after the Conference Board announces its ConsumerConfidence Index, the Sentiment survey arguably carries more influence amonginvestors. Some analysts view it as a better real-time measure of consumer moodsbecause the data includes interviews taken up to a day or two before the official release.
HOW IS IT COMPUTED
The surveys are taken on weekends with a total of 500 individuals. The University ofMichigan uses a rotating interview strategy. Each month, 60% of the consumers polledare new to the survey, with the remaining 40% being interviewed a second time. Thequestions are broader in scope than those raised by the Conference Board. People queriedare told to respond to 50 questions about their current and expected personal finance con-ditions and their buying plans for big-ticket items. They are also asked about the likelydirection of the U.S. economy, interest rates, inflation, and jobs over the next year and forthe next five years.
The main Index of Consumer Sentiment is based on the results of two subset indices:the Index of Current Economic Conditions, which explores consumer thinking about theircurrent finances and buying plans, and the Index of Consumer Expectations, which isdesigned to gauge the outlook of their finances and buying plans over the coming one-and five-year periods.
There are five core questions in the survey, which are used to calculate all theseindexes:
1. Are you and your family (living with you) better off or worse off financially thanyou were a year ago?
2. Do you think that a year from now you and your family living there will be betteroff financially, worse, or just about the same as now?
3. Do you think that during the next 12 months we’ll have good times financially, badtimes, or otherwise?
4. Looking ahead, what is more likely: that in the country as a whole, we’ll have con-tinued good times during the next five years or so, or that we will have periods ofunemployment and depression or otherwise?
5. About the big things people buy for their homes—such as furniture, a refrigerator,stove, television, things like that. Generally speaking, do you think now is a goodor bad time to buy major household items?
05Baumohl_Ch03.13-03.20.qxd 8/3/04 7:37 AM Page 92

93Survey of Consumer Sentiment
THE TABLES: CLUES ON WHAT’S AHEAD FOR THE ECONOMY
There does appear to be a correlation between a sustained change in the consumer“expectations” index and consumer spending in the next six months to a year—especiallyin the area of big-ticket items such as autos and home sales.
As for accessing the actual report on the Web, most details on the monthly ConsumerSentiment Survey are reserved for subscribers. The organization does provide for free onits Web site a one-page press release of the Sentiment numbers along with a brief analy-sis, but only at the end of the month when the final figures are published. As for viewinghistorical tables and charts, non-subscribers can see previous data, except that of the lastsix months.
MARKET IMPACT
Bonds
Fixed-income investors worry about consumer exuberance because that can translate intogreater spending and faster economic growth.
Stocks
Equity managers prefer to see consumers upbeat because they then have a higher propen-sity to spend on goods and services. This can increase revenues, corporate profitability,and stock values as well.
Dollar
Foreign demand for dollars will be strong as long as the U.S. economy is growing andinterest rates are attractive as compared to other countries. Because consumer expendi-tures account for more than $6 out of every $10 spent in the economy, foreigners favorseeing a happy American consumer.
05Baumohl_Ch03.13-03.20.qxd 8/3/04 7:37 AM Page 93

ABC NEWS/MONEY MAGAZINE
CONSUMER COMFORT INDEX
Market Sensitivity: Low.
What Is It: A survey of consumer attitudes.
News Release on Internet: http://abcnews.go.com/sections/business/
Home Web Address: www.abcnews.go.com
Release Time: 6:30 P.M. (ET) every Tuesday.
Frequency: Weekly.
Source: ABC News/Money magazine.
Revisions: No revisions.
WHY IS IT IMPORTANT
The ABC News/Money Magazine Consumer Comfort Index is not known to animate theinvestment community very much, especially given the existence of two major competi-tors—the University of Michigan’s Consumer Sentiment Survey and the ConferenceBoard’s Consumer Confidence Index. However, this relatively new kid on the block doeshave at least one advantage: it’s the only major consumer poll that comes out on a weeklybasis, making it more timely than the other two.
Back in 1985, ABC News and Money combined forces to provide information on con-sumer attitudes more frequently than once a month. Persons interviewed are asked ques-tions on matters of personal finance, the current state of the economy, and if they are in aspending mood. So how does this weekly measure stack up against its two better-knownrivals? Good enough to provide an early peek at how the monthly surveys will do whenthey are released. Since its origin, the Consumer Comfort Index has been very highly corre-lated with both the University of Michigan’s Sentiment survey and the Conference Board’sConsumer Confidence Index. In statistics, a correlation of 1 indicates the strongest possiblerelationship between two variables. The correlation between ABC News/Money andMichigan has been .88, and between ABC News/Money and the Conference Board, .91.
HOW IS IT COMPUTED
The methodology used to come up with the Consumer Comfort Index is somewhatunusual. From Wednesday through Sunday of each week, 250 new adults are interviewedby telephone. Respondents are asked to comment on three topics: Do they feel better orworse about the nation’s economy and their personal finances. The third topic probes
94 Chapter 3 • The Most Influential U.S. Economic Indicators
05Baumohl_Ch03.13-03.20.qxd 8/3/04 7:37 AM Page 94
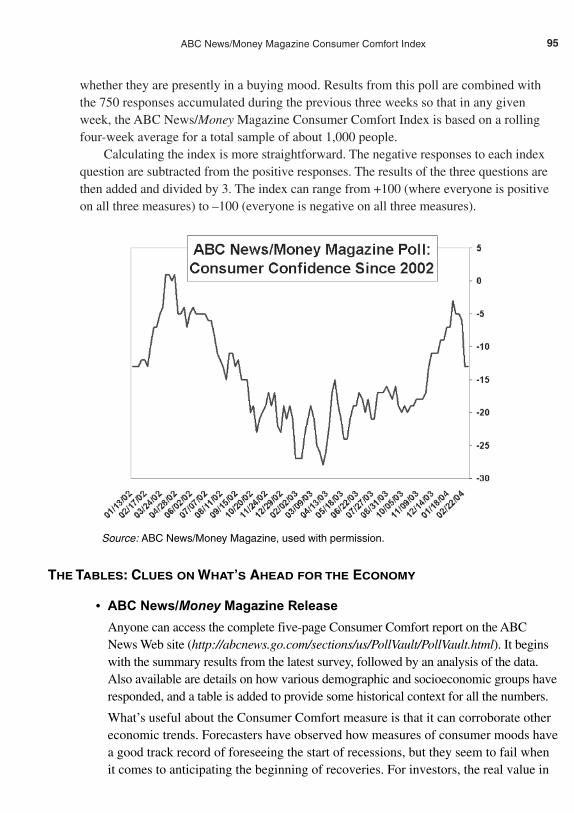
whether they are presently in a buying mood. Results from this poll are combined withthe 750 responses accumulated during the previous three weeks so that in any givenweek, the ABC News/Money Magazine Consumer Comfort Index is based on a rollingfour-week average for a total sample of about 1,000 people.
Calculating the index is more straightforward. The negative responses to each indexquestion are subtracted from the positive responses. The results of the three questions arethen added and divided by 3. The index can range from +100 (where everyone is positiveon all three measures) to –100 (everyone is negative on all three measures).
95ABC News/Money Magazine Consumer Comfort Index
THE TABLES: CLUES ON WHAT’S AHEAD FOR THE ECONOMY
• ABC News/Money Magazine Release
Anyone can access the complete five-page Consumer Comfort report on the ABCNews Web site (http://abcnews.go.com/sections/us/PollVault/PollVault.html). It beginswith the summary results from the latest survey, followed by an analysis of the data.Also available are details on how various demographic and socioeconomic groups haveresponded, and a table is added to provide some historical context for all the numbers.
What’s useful about the Consumer Comfort measure is that it can corroborate othereconomic trends. Forecasters have observed how measures of consumer moods havea good track record of foreseeing the start of recessions, but they seem to fail whenit comes to anticipating the beginning of recoveries. For investors, the real value in
Source: ABC News/Money Magazine, used with permission.
05Baumohl_Ch03.13-03.20.qxd 8/3/04 7:37 AM Page 95
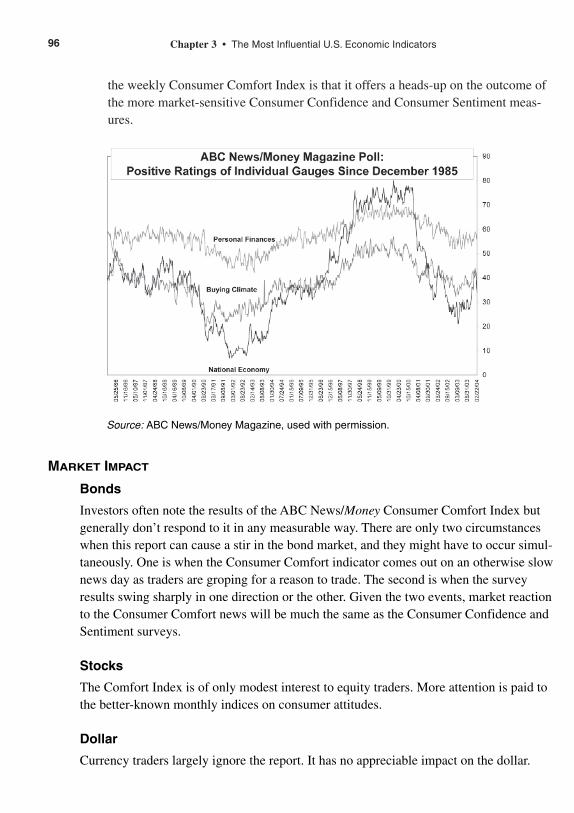
the weekly Consumer Comfort Index is that it offers a heads-up on the outcome ofthe more market-sensitive Consumer Confidence and Consumer Sentiment meas-ures.
96 Chapter 3 • The Most Influential U.S. Economic Indicators
MARKET IMPACT
Bonds
Investors often note the results of the ABC News/Money Consumer Comfort Index butgenerally don’t respond to it in any measurable way. There are only two circumstanceswhen this report can cause a stir in the bond market, and they might have to occur simul-taneously. One is when the Consumer Comfort indicator comes out on an otherwise slownews day as traders are groping for a reason to trade. The second is when the surveyresults swing sharply in one direction or the other. Given the two events, market reactionto the Consumer Comfort news will be much the same as the Consumer Confidence andSentiment surveys.
Stocks
The Comfort Index is of only modest interest to equity traders. More attention is paid tothe better-known monthly indices on consumer attitudes.
Dollar
Currency traders largely ignore the report. It has no appreciable impact on the dollar.
Source: ABC News/Money Magazine, used with permission.
05Baumohl_Ch03.13-03.20.qxd 8/3/04 7:38 AM Page 96
UBS INDEX OF INVESTOR OPTIMISM
Market Sensitivity: Low for now, but can increase in the future.
What Is It: Measures changes in investor confidence.
News Release on Internet: www.ubs.com/investoroptimism
Home Web Address: www.ubs.com
Release Time: 8:30 A.M. (ET), with data published the fourth Monday of themonth being covered.
Frequency: Monthly.
Source: UBS and the Gallup Organization.
Revisions: No revisions done.
WHY IS IT IMPORTANT
One of the most intriguing economic indicators also happens to be one of the leastknown. It’s called the UBS Index of Investor Optimism, and it measures the attitude ofprivate investors. What is special about this measure is that it has the rare potential ofbeing an effective leading indicator of consumer spending. The reason for this is theremarkably close correlation that has emerged between changes in key stock marketindices, such as the NASDAQ and the S&P 500, and its effect on consumer expendi-tures. This relationship has been firming since the 1990s when, for the first time, stocksbegan to account for most of the value in household financial assets. Back in 1983, lessthan 20% of households in America owned stocks. Today more than 50% do. Most ofthese households are in the 35–64 age category, a group with the highest income levels,the most invested, and the greatest propensity to spend. Thus, you can bet with reason-able certainty that sharp swings in the stock market will affect future consumer spend-ing behavior. This increasingly important link between stock market performance andhousehold expenditures makes the UBS Index of Investor Optimism a promising fore-casting tool.
HOW IS IT COMPUTED
The Index of Investor Optimism was launched in 1996 in a joint project by UBS, a globalfinancial services firm, and the Gallup Organization, a worldwide polling company. Thesurvey assesses the mood of a limited but growing segment of the population: householdswith investable assets of at least $10,000. That demographic segment accounts for nearly
97UBS Index of Investor Optimism
05Baumohl_Ch03.13-03.20.qxd 8/3/04 7:38 AM Page 97

40% of all U.S. households and more than 80% of the financial wealth in the U.S. Withinthis population group, about 800 households are randomly selected from across the coun-try and interviewed by phone in the first two weeks of each month. They are asked torespond along three major themes. The first consists of seven questions, which form thebasis of the overall Index of Investor Optimism:
1. Overall, are you optimistic, pessimistic or neither that you will be able to achieveyour investment targets over the next twelve months?
2. Overall, are you optimistic, pessimistic or neither that you will achieve your invest-ment goals over the next five years?
3. Overall, are you optimistic, pessimistic or neither of your ability to maintain orincrease your current income and earnings over the next twelve months?
4. As far as the general condition of the economy is concerned, how would you ratethe next four areas over the next 12 months?
4a. economic growth
4b. the unemployment rate
4c. performance of the stock market
4d. inflation
The other two themes provide a broader context for what investors are thinking. One iscalled the Topical Survey which explores household opinions on current issues, such aswhether they see real estate as a good investment or how terrorist attacks have affectedtheir investment strategy.
Finally there is the “financial markets survey,” which contains a variety of otherquestions about the U.S. and foreign financial markets, such as
• Do investors think stocks are overvalued or undervalued?
• Will interest rates increase or decrease?
• What return do they anticipate on their portfolio/stocks?
• Which currencies and countries are expected to be attractive or unattractive?
THE TABLES: CLUES ON WHAT’S AHEAD FOR THE ECONOMY
UBS provides a three-page release on its Web site which summarizes the findings of itssurvey and includes a historical table that lists the overall monthly index going to back toits inception in 1996. Missing from the release, however, are some key details on thedemographic breakdown of the answers, though UBS says it will e-mail that informationupon request at no charge.
98 Chapter 3 • The Most Influential U.S. Economic Indicators
05Baumohl_Ch03.13-03.20.qxd 8/3/04 7:38 AM Page 98

• UBS Report on Index of Investor Optimism (Not Shown)
While there appears to be a positive correlation between key stock indexes andfuture consumer expenditures, precisely how much changes in equity values influ-ence household spending depends on many factors, including the magnitude of themovement in stock values, the level of interest rates, and the growth in personalincome from wages and salaries.
Though there is a link between the performance of one’s stock portfolio and futurespending, the UBS investor index still has to be battle tested to see just how valid itis in the long run as a leading indicator. However, at least one recent observation canbe noted: the Index of Investor Optimism peaked more than a year before the onsetof the 2001 recession. By the time the economy began to turn down, the UBS indexhad already fallen by 55%.
MARKET IMPACT
The financial markets have not yet jumped on this economic indicator. That could rapidlychange if its correlation with consumer spending stands the test of time.
Bonds
A rising Index of Investor Optimism reflects improved confidence in the economy andexpectations that investor portfolios will rise in value. This can be construed as a negativebias against the bond market. Obviously, if the economy and stocks look more attractive,investors will move money out of fixed incomes and into equities. On the other hand,falling investor confidence suggests a widening belief of economic weakness ahead. Thus,a drop in the UBS index can stimulate more purchases of bonds and cause yields to slip.
Stocks
Higher investor optimism indicates households are sanguine about the economy and thestock market, both of which can encourage more investments in equities and greater con-sumer spending.
Dollar
Participants in the foreign exchange market are not avid followers of this index for now.But if more studies show the UBS index correlating with stock prices and consumerspending, international interest in this indicator will intensify. It is expected that a pre-cipitous drop in investor optimism will likely be viewed as a detriment to the dollarbecause the survey reflects disappointment or concern about the nation’s economicstrength. Conversely, a persistent climb in the index could catch the eye of foreigninvestors. They might consider buying U.S. assets in such instances, and this will bolsterthe dollar’s value.
99UBS Index of Investor Optimism
05Baumohl_Ch03.13-03.20.qxd 8/3/04 7:38 AM Page 99
GROSS DOMESTIC PRODUCT (GDP)
Market Sensitivity: Medium to high.
What Is It: The foremost report on the health of the economy, GDP measureshow fast or slow the economy is growing.
News Release on Internet: www.bea.doc.gov/bea/dn/home/gdp.htm
Home Web Address: www.bea.doc.gov
Release Time: 8:30 A.M. (ET); advance estimates are released the final week ofJanuary, April, July, and October. Two rounds of revisions follow, each amonth apart. (The Bureau of Economic Analysis expects to speed up therelease of the GDP by two weeks in 2006.)
Frequency: Quarterly.
Source: Bureau of Economic Analysis, Commerce Department.
Revisions: Monthly revisions tend to be moderate, though they can on occasionbe more substantial. There are also annual revisions that are normally done atthe end of July and reflect more complete information. Benchmark or historicrevisions take place every five years or so with changes that can go back to1929 when the GDP series began.
WHY IS IT IMPORTANT
GDP. They are the best-known initials in economics and stand for Gross DomesticProduct. This is the mother of all economic indicators and the most important statistic tocome out in any given quarter. The GDP is a must-read for many because it is the bestoverall barometer of the economy’s ups and downs. Forecasters analyze it carefully forhints on where the economy is heading. CEOs use it to help compose business plans,make hiring decisions, and forecast sales growth. Money managers study the GDP torefine their investment strategies. White House and Federal Reserve officials view theGDP as a report card on how well or poorly their own policies are working. For these andother reasons, the quarterly GDP report is one of the most greatly anticipated.
However, trying to decipher the swell of data from the GDP may be intimidating atfirst. Simply put, the GDP is the total price tag in dollars of all goods and servicesmade in the U.S. It’s the sum value of all hammers, cars, new homes, baby cribs, videogames, medical fees, books, toothpaste, hot dogs, haircuts, eyeglasses, yachts, kites,and computers—you get the idea—that were sold in the U.S. or exported during a spe-cific period. Even goods that were not sold but ended up on stockroom shelves areincluded in the GDP because these products were still assembled. The GDP thereforereflects the final value of all output in the U.S. economy, regardless of whether it wassold or placed in inventory.
100 Chapter 3 • The Most Influential U.S. Economic Indicators
05Baumohl_Ch03.13-03.20.qxd 8/3/04 7:38 AM Page 100
By looking at GDP performance over the last 50 years, it becomes clear that the U.S.economy has a natural predilection to grow. Business activity has been expanding farmore years than it has been contracting. Though recessions have not disappeared, they are definitely shorter and shallower since World War II, and that is important to the eco-nomic and social welfare of the country. The faster and longer the economy grows, thehigher the level of employment. With more people working, total household income goesup. This encourages Americans to spend more on goods and services. As consumerspending accelerates, companies will be inclined to speed up their own production andhire additional workers. That, in turn, further increases household income—and voila!—you have a self-sustaining economic expansion. Moreover, the benefits of growth are notjust felt inside the U.S. Stronger economic growth stimulates foreign businesses as well.Americans will import more cars, clothing, jewelry, wine, and home electronics fromother nations, and that helps revitalize the international economy. Foreign workers willalso use some of their additional income to buy more goods from the U.S.
Can this self-generating cycle of growth continue indefinitely? In theory, yes.However, as a practical matter, this system is susceptible to breaking down once in awhile as a result of outside shocks, like war, or in the event of a serious imbalance, suchas an accumulation of excess inventories or an outbreak of inflation. Fortunately, suchevents are rare. And even if they occur, the U.S. government has sufficient resources andpolicy options at its disposal to minimize damage to the economy.
Looking at the GDP report itself, it’s important to note at the outset that the govern-ment computes the size of the economy in two ways: one is in nominal dollar terms andthe other is in real dollar terms. Let’s review what is meant by these two concepts. Current(or nominal dollars) GDP tallies the value of all goods and services produced in the U.S.using present prices. On the other hand, real (or chained dollars) GDP counts only thevalue of what was physically produced. To clarify the point, suppose a hat-making factoryannounces that it made $1 million selling hats this year, 11% more than last year. The $1million represents nominal company sales (or current dollars). However, something’smissing. From this figure alone, it’s unclear how they achieved the extra income. Did thefactory actually sell 11% more hats? Or did they sell the same number of hats as the yearbefore but simply raised prices by 11%? If the factory made more money because itincreased the price tag by 11%, then in real (or constant dollar) terms, the true volume ofhats sold this year was no greater than last year, at $900,000. This is an important distinc-tion. It’s vital to know if the economy grew because the quantity of products sold wasgreater or whether it was largely the result of price hikes, or inflation. What you want tosee are real increases in economic output, which means that a greater supply of goods andservices is available for consumers. Higher real GDP improves the standard of living ofAmericans, while GDP growth due to inflation erodes living standards because peoplehave to pay more for the same amount of products consumed as before. These two meas-ures of GDP are thus of fundamental importance in economics.
To appreciate what the GDP is composed of and how it is calculated, it’s best to lookat the tables in the release. They are not as complicated as they first appear.
101Gross Domestic Product (GDP)
05Baumohl_Ch03.13-03.20.qxd 8/3/04 7:38 AM Page 101
• Table 3 Gross Domestic Product and Related Measures: Level andChange from Preceding Period
Note that all numbers are expressed in billions of dollars and at annual rates. (Thegovernment uses annual rates to show how the economy would perform if that quar-terly pace were maintained for a full year.) Looking at this table, we see two maincolumns on GDP growth: billions of current dollars and billions of chained dollars.Don’t worry about the jargon. “Current dollars” represents nominal GDP, or thevalue of economic output including price increases. (Remember the hat factory.)“Chained dollars” describes output in real (constant dollar) terms—that is, howmuch the economy really produced in volume or quantity. Though both columnscontain useful information, the real dollar amount of the GDP is more closely fol-lowed to get an accurate picture of the economy’s health. So unless otherwise noted,all references deal with chained (or real) dollars.
(1) Gross Domestic Product: The top line says it all. It’s the final value of all goodsand services produced in the U.S. The word “final” is intentional here; GDPdoes not directly include the costs of making a product during the intermediatestages. There’s a logical reason for this: the value of intermediate goods isalready included in the final product, so computing them separately would meancounting such costs more than once. For example, the final price of a new caralready factors in all the costs of steel and rubber that went into making it. If youwere to add the price of steel and rubber and wages at each stage of the assem-bly process, you would be counting the same production expenses several times.Thus, the government picks only the final value of goods and services to com-pute GDP.
Now let’s look at the four major components that make up GDP:
• Personal consumption expenditures (what consumers spend)
• Gross private domestic investment (what businesses invest in plants and equipment)
• Net exports (the difference between what the U.S. sells to foreigners and whatthe U.S. buys from them)
• Government consumption expenditures and gross investment (how much fed-eral, state, and local governments spend and invest)
Each of these four is further broken down into subcomponents to provide moredetail and clarity on what the economy is up to.
102 Chapter 3 • The Most Influential U.S. Economic Indicators
05Baumohl_Ch03.13-03.20.qxd 8/3/04 7:38 AM Page 102
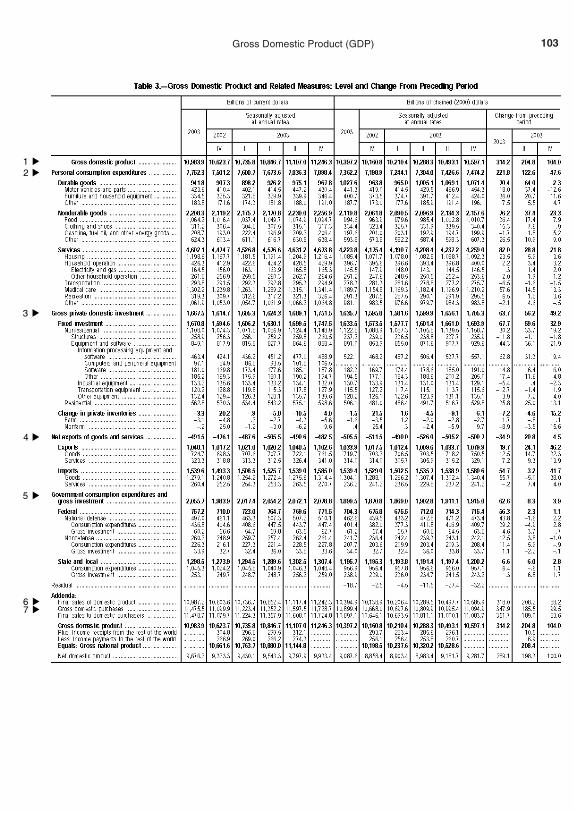
103Gross Domestic Product (GDP)
▲
1 ▲
2
▲
3
▲
4
▲
5
▲
6 ▲
7
05Baumohl_Ch03.13-03.20.qxd 8/3/04 7:38 AM Page 103
(2) Personal Consumption Expenditures (PCE): This is essentially all spending byconsumers on goods and services, and it accounts for 70% of total GDP. Byvirtue of its massive role in the economy, if households are not in a spendingmood, it spells serious trouble for the economy, with a recession nearly unavoid-able. For this reason, analysts closely monitor the dozen or so monthly economicindicators that report on consumers’ moods, income, and spending.
What are people spending money on? A broad answer can be found in one ofthe three subcategories that make up PCE: durable goods, nondurable goods,and services.
Durable Goods: These are big-ticket items (such as refrigerators, TVs, autos, andfurniture) that by definition last three years or more. While only 15% of all con-sumer spending is on durable goods, they represent one of the most importantmeasures of the economy’s vitality because these types of products are more dis-cretionary in nature. That means spending on durable goods is highly sensitive tochanges in consumer income and attitudes; when income declines or consumersbecome concerned about the economy, they are likely to postpone first the pur-chase of a new car or a television. Conversely, when income goes up or whenconsumers feel upbeat about future economic conditions, they are more comfort-able buying big-ticket items. Furthermore, many durable goods are expensive andoften purchased on credit, which makes their sales sensitive to interest rate move-ments. Once rates start to move up, consumers quickly react by cutting backspending on durable goods because of higher financing costs.
Nondurable Goods: Think vegetables, sweaters, and shoes here—items that lastless than three years. Nondurables make up about 30% of all personal spending.In contrast to the volatility often found in durable goods sales, orders for non-durables grow at a more stable rate during both good and bad economic times.The reason is these products are often part of daily living and spending for themcannot be postponed as easily as for durable goods. During uncertain economictimes, households might postpone the purchase of a new car, but spending onfood and fuel oil cannot be delayed. (That’s why investors rush to buy shares ofcompanies that produce non-durable goods when the economy is weakening andsell shares of those in the durable goods sector.)
Services: Not surprisingly, more than half of all consumer spending goes to payfor services such as medical and dental care, auto and home insurance, haircuts,mortgages, transportation, and legal costs. The service sector has grown dramati-cally, from 40% of all personal expenditures in 1960 to nearly 60% now. Thiscategory, too, is fairly stable because outlays for housing and medical servicescontinue largely unabated even when income declines.
(3) Gross Private Domestic Investment: Business spending constitutes about 15% ofGDP, but it can be extremely volatile. Much depends on the economic outlook.
104 Chapter 3 • The Most Influential U.S. Economic Indicators
05Baumohl_Ch03.13-03.20.qxd 8/3/04 7:38 AM Page 104

Business investment picks up if the economy is expected to show sustainedgrowth, but such expenditures can drop sharply if signs emerge that economicactivity is faltering.
Business expenditures fall into two broad headings: fixed investment and thechange in inventory investment.
Fixed investment: The lion’s share of all business spending is in fixed invest-ment, which covers non-residential expenditures (for example, office buildings,warehouses, computer equipment and software, machine tools, and transporta-tion equipment) and residential spending (constructing single-family homes andapartment buildings). Residential outlays alone can account for nearly a third ofall investment spending. It makes no difference if these homes or apartments areoccupied; all that matters is that they were built.
Both residential and nonresidential investment spending are highly sensitive tothe business cycle. If the economy is growing and corporate earnings are increas-ing, it will spur spending on equipment and construction. However, the first whiffof a slowdown in economic activity can put the brakes on such investments. Asdemand for goods and services dry up, so will businesses spending. The resultingcutback in corporate expenditures can help drag an economy into recession.
Change in private inventories: Inventory changes and their relationship to GDPhave been a source of much confusion, and it need not be. The relationshipbetween inventories and economic growth is really quite a logical one. To beginwith, we must understand that the GDP reflects the value of everything that wasproduced in the economy. To do this, the Bureau of Economic Analysis first totalsall that consumers, businesses, and government have purchased. Of course, whatwas bought—and what was produced—are not always the same. Firms often pro-duce a lot more goods than what is actually sold, and what’s left over is classifiedas part of inventory. To get an accurate GDP reading of everything produced inthe economy for a given period, you also have to include changes in inventories.Thus, in a simplified formula, GDP represents total demand plus the change ininventories. Here’s an illustration of how the computation works. If a hat factorymanufactures 1,000 hats, but sells just 900, its inventory goes up by 100 hats. Ifyou merely added up the hats that were bought, it would give you an incorrectamount on the value of all the hats made by the factory. To come up with the cor-rect figure, you need to add the 100 hats now in inventory to the 900 sold to comeup with the total of what was produced.
Now let’s look at the situation in reverse. If in the next quarter the same hat fac-tory manufactures only 700 hats but sells 800, it would be inaccurate to just con-sider total sales because output that quarter was less than 800. In this case, thehat factory had to dig into inventory to come up with the extra 100 hats to sell.Thus, to obtain the correct amount of what was produced by the factory thatquarter, we’ll look at our basic formula again: GDP represents total demand plus
105Gross Domestic Product (GDP)
05Baumohl_Ch03.13-03.20.qxd 8/3/04 7:38 AM Page 105
the change in inventories. Total demand for hats was 800, plus the change ininventories, which, in this case, dropped by 100. Thus, the result is real output of700 hats.
As you can see, it’s not the level of inventories that is used to compute the GDP,but the change in inventories from one period to the next.
Inventories can fluctuate wildly at turning points in the economy. In recent years,computers have made it easier to prevent inventories from getting too far out ofline with sales. However, businesses still find it difficult to determine what thecorrect level of inventories should be when the economy nears an inflectionpoint. If stockrooms become filled with unsold goods, companies will work offthat surplus and trim production, perhaps even shutting plants and laying offworkers—steps that could bring economic growth to a screeching halt. As timepasses, however, with the aid of advertised sales, special discounts, and othershopping incentives, the inventory on stockroom shelves (and in the parking lotsof car dealerships) will eventually thin out. When consumer demand returns,retailers and wholesalers will increase their orders for goods once again.Factories, in turn, will respond by cautiously gearing up production to replenishnow-depleted inventories. All these steps help place the economy back on therecovery track.
(4) Net exports of goods and services: Foreign trade plays an increasingly importantrole in the economy. Exports account for about 10% of GDP, double the level of1980. Imports have surged to 15% of GDP, up from 6.6%. As a result, as mushas a quarter of all U.S. output is linked to international trade.
The GDP table lists net exports as a category that contributes to economicgrowth. What do we mean by “net exports,” and why is it included in the GDP?To begin with, American goods and services that are exported overseas are addedto GDP for the simple reason that they are produced here in the U.S. Exportsstimulate U.S. economic growth because more has to be produced in this countryto satisfy both domestic and foreign demand. At the same time, we have toaccount for the fact that Americans do spend money on imports. Purchases of for-eign goods and services by U.S. consumers are subtracted from GDP growthbecause Americans are satisfying some of their demand by buying products thatwere not made in the U.S. but represent the output of another country. The term“net exports” is simply the difference between adding exports to the GDPaccounts and subtracting imports. Since the 1970s, the U.S. has imported muchmore than it has exported, which is why over the last 30 years net exports hasbeen a negative number and thus a drag on U.S. GDP growth.
(5) Government consumption expenditures and gross investment: Government expen-ditures (federal, state, and local) represent about 18% of GDP, down from 21% inthe mid-1980s. The federal component makes up a third of all government
106 Chapter 3 • The Most Influential U.S. Economic Indicators
05Baumohl_Ch03.13-03.20.qxd 8/3/04 7:38 AM Page 106
outlays, with state and local purchases accounting for the rest. The GDP tabledivides federal expenditures into defense spending (military hardware andsalaries of military and civilian employees in the armed forces) and non-defensespending (such as highway construction, NASA, the Park Service, and thesalaries of non-defense federal employees).
State and local governments are two-thirds of all official spending and invest-ment (for example, street construction, police, and fire-fighting equipment), butthis number can fluctuate a bit. If the regional economies are doing well withsales and tax revenues on the rise, outlays pick up as well. However, an eco-nomic slowdown can drain state and local treasuries as official outlays increaseto pay for unemployment insurance programs, while goverment tax revenuesshrink. At such times discretionary government spending is sharply cut back.
Adding together all four of the major components—consumer spending, businessinvestments, goverment outlays, and net exports—allows the Bureau of EconomicsAnalysis to compute total GDP. However, there are other variations of the GDP thatcan provide additional insight on the economy’s underlying health. Two such indi-cators extrapolated from the GDP are “final sales of domestic product” and “grossdomestic purchases,” both of which are listed in the GDP table under “Addenda.”
(6) Final sales of domestic product: To get a better feel for how vigorous the eco-nomic activity is, look at how many goods and services were sold that period.GDP does the same, but it also includes changes in inventories, which does notreflect pure demand in the economy. Final sales of domestic product are calcu-lated as GDP without adding in changes in inventories. This measure is thus con-sidered an excellent barometer of total demand for U.S. products. There’s oneslight hitch, however. Final sales of domestic product include sales to foreignersas well as to U.S. consumers. To get a sense of demand just in the U.S, we haveto check out the next category, gross domestic purchases.
(7) Gross domestic purchases: This measure adds up total purchases by U.S. con-sumers and businesses, regardless of whether the product was actually madehere or in another country. Recall that in calculating the GDP, imports are sub-tracted from spending and investment. Not so with gross domestic purchases. Toget a snapshot of actual demand inside the U.S., one has to exclude exports andinclude imports, which is what gross domestic purchases does.
Nominal and Real GDP: Adjusting for InflationWhen studying economic growth, most analysts want to know how much the econ-omy has physically expanded over time. This is not as simple to figure out as itsounds. GDP is initially calculated based on the current dollar (nominal) value of allgoods and services made in the U.S. It is valuable for measuring the size of the U.S.economy, how large it is compared to the economies of other countries, and forlearning the relative sizes of the industries that contribute to GDP. However, the
107Gross Domestic Product (GDP)
05Baumohl_Ch03.13-03.20.qxd 8/3/04 7:38 AM Page 107
problem with using current dollars is that it can be hard to discern whether anincrease in GDP came about from greater output of goods and services or simplybecause of higher prices. People benefit by having more goods and services to pur-chase, not by paying higher prices for them.
So how can you determine how much of the rise in GDP was due to real expansionand how much the result of inflation? The way to do this is to collect the currentdollar value of all goods and services and then strip out the effects of price changes.The Bureau of Economic Analysis in 1996 put into effect a chain-type inflationmeasure that helps convert current GDP to real GDP. The methodology to accom-plish this is complex and technical, however it is designed not only to remove priceinflation, but also to adjust for changes in consumer shopping habits brought on bydifferences in product prices and in the quality of goods. (For instance, if the priceof beef increases significantly, consumers might choose a less expensive cut of meator even poultry. The chain-type calculation tries to account for these shifts.) Whatemerges are several different, yet quite important, inflation measures of the econ-omy. The three major price indicators are the GDP price deflator, the gross domesticpurchases deflator, and the influential PCE price index.
• Table 4 Price Indexes for Gross Domestic Product and Related Measures:Percent Change from Preceding Period
(8) GDP Price Index and GDP Implicit Price Deflator: These are the main inflationgauges for the economy as a whole. Economists and other players in the finan-cial markets watch these indicators carefully to see if inflation is in check. TheGDP price index and the GDP implicit price deflator measure changes in pricesfor the goods and services produced by the U.S. economy. However, the twoinflation markers highlighted here have one significant disadvantage. They donot provide a full picture of the inflation pressures on U.S. consumers and busi-nesses. Reason? They include prices of exports but exclude prices of imports. Abetter measure of inflation in the economy, it is often argued, is the price indexfor gross domestic purchases, which is discussed in the next paragraph.
(9) Deflator for Gross Domestic Purchases: This inflation measure takes intoaccount price changes from all purchases, including imports. If oil prices jumphigher, that increase in cost is fully incorporated in the gross domestic purchaseprice index, unlike the GDP inflation indicators. Generally, the price indexes forgross domestic purchases and for the GDP move in tandem—except for periodswhen the cost of imports surges. That can happen when oil prices shoot up or ifthe dollar plummets in value, which automatically makes imports more expen-sive. In such instances, gross domestic purchases turns out to be a better gaugeof inflation in the economy.
108 Chapter 3 • The Most Influential U.S. Economic Indicators
05Baumohl_Ch03.13-03.20.qxd 8/3/04 7:38 AM Page 108
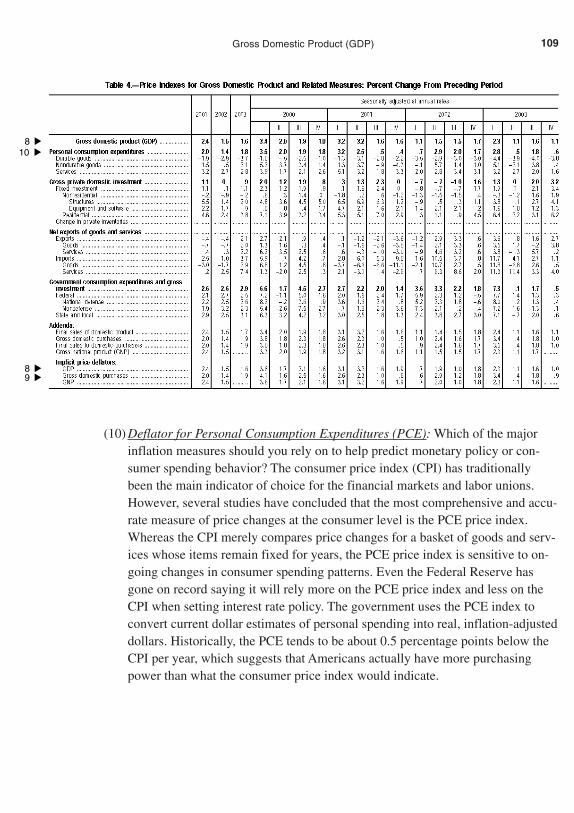
(10) Deflator for Personal Consumption Expenditures (PCE): Which of the majorinflation measures should you rely on to help predict monetary policy or con-sumer spending behavior? The consumer price index (CPI) has traditionallybeen the main indicator of choice for the financial markets and labor unions.However, several studies have concluded that the most comprehensive and accu-rate measure of price changes at the consumer level is the PCE price index.Whereas the CPI merely compares price changes for a basket of goods and serv-ices whose items remain fixed for years, the PCE price index is sensitive to on-going changes in consumer spending patterns. Even the Federal Reserve hasgone on record saying it will rely more on the PCE price index and less on theCPI when setting interest rate policy. The government uses the PCE index toconvert current dollar estimates of personal spending into real, inflation-adjusteddollars. Historically, the PCE tends to be about 0.5 percentage points below theCPI per year, which suggests that Americans actually have more purchasingpower than what the consumer price index would indicate.
109Gross Domestic Product (GDP)
▲
8
▲
10
▲
8
▲
9
05Baumohl_Ch03.13-03.20.qxd 8/3/04 7:38 AM Page 109
HOW IS IT COMPUTED
The GDP report has been a work in progress since the late 1930s, which makes it one ofthe longest-running economic indicators around. Calculating the GDP is a mammothundertaking because we’re talking about an $11 trillion economy. The main responsibilityfor this task falls on the nonpartisan Bureau of Economic Analysis, which is well suitedfor the job given its history and experience.
The GDP series is really part of a marvelous national accounting system known as theNational Income and Product Accounts (NIPA). That may be a mouthful to say but theidea behind it is actually quite simple. In essence, the NIPA is composed of two compli-mentary methods of estimating GDP. One side of the ledger is the product account whichtallies all goods and services sold. The other side is the income account and it looks atwhere all the monies generated in the production of GDP end up. After all, if consumers,businesses, and the government are spending $11 trillion a year, someone has got to begetting this income. That’s where the income side of the ledger comes in. It tries to recordthe disposition of the money that came from the production of those products and services.(How much went to wages and salaries? Proprietor income? Interest income? Profits?)Theoretically the product and income measures should be equal. However, discrepanciesbetween the two often crop up mainly because of the way the statistics are collected. Butthe differences tend to be minor. By and large, the establishment of America’s NIPA is anextraordinary accomplishment and the envy of the world because of its remarkable accu-racy, comprehensiveness, and detailed accounting of America’s massive economy.
So how does the bureau compute GDP? It collects and assimilates economic datafrom thousands of governmental and private sources. Among the information typessought are monthly retail sales, auto sales, and home purchases. To be sure, not all of theeconomic data is available at the time of collection. As a result, agency staffers work upreasonable estimates for the first GDP report. Why not wait until all the numbers come inbefore releasing it? Because investment managers and policymakers want to get informa-tion on the economy’s health as quickly as possible, even if some of its components haveto be estimated. Few want to wait a full three months to get the final quarterly GDPreport. Thus, the BEA runs the quarterly GDP numbers through its computers three timesfor the public. The first GDP report, known as the advance release, is published fourweeks after the quarter ends and offers a rough preview of how the economy behaved inthe quarter that just ended. A month later, the preliminary GDP report is announced. Itcontains some revisions based on information not available at the time of the advancerelease. It’s only at the very end of the subsequent quarter that we see a final GDP reportwith additional changes in the numbers to reflect more complete information.
However, it doesn’t end there. On top of these revisions, the BEA takes another passat the GDP statistics once a year, usually in July, when it further refines the numbers.
110 Chapter 3 • The Most Influential U.S. Economic Indicators
05Baumohl_Ch03.13-03.20.qxd 8/3/04 7:38 AM Page 110
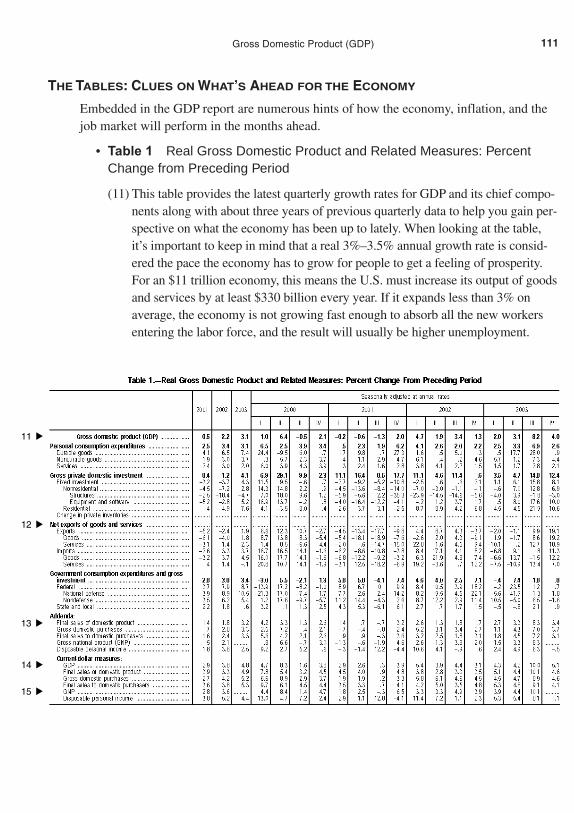
THE TABLES: CLUES ON WHAT’S AHEAD FOR THE ECONOMY
Embedded in the GDP report are numerous hints of how the economy, inflation, and thejob market will perform in the months ahead.
• Table 1 Real Gross Domestic Product and Related Measures: PercentChange from Preceding Period
(11) This table provides the latest quarterly growth rates for GDP and its chief compo-nents along with about three years of previous quarterly data to help you gain per-spective on what the economy has been up to lately. When looking at the table,it’s important to keep in mind that a real 3%–3.5% annual growth rate is consid-ered the pace the economy has to grow for people to get a feeling of prosperity.For an $11 trillion economy, this means the U.S. must increase its output of goodsand services by at least $330 billion every year. If it expands less than 3% onaverage, the economy is not growing fast enough to absorb all the new workersentering the labor force, and the result will usually be higher unemployment.
111Gross Domestic Product (GDP)
▲
11
▲12
▲
13
▲
14
▲
15
05Baumohl_Ch03.13-03.20.qxd 8/3/04 7:38 AM Page 111
However, this leads to an obvious question. If 3% growth is the minimumrequired to lower unemployment, wouldn’t 4%, 6%, or 10% growth be evenbetter? How fast can the economy grow before it gets so overheated it causes aneruption in inflation? There is no simple answer to this question. Much dependson the supply of labor and material resources at the time. Assuming the econ-omy is operating at a low level of unemployment, it is believed the economy’smaximum rate of growth without breaking into an inflationary sweat is equal to the rise of non-farm productivity (see the section on Productivity and Costs)plus the growth in the labor force (from the Employment Situation report). Ahigh level of productivity growth along with an ample supply of new workerscoming into the labor force keeps the economy well-oiled and out of danger ofoverheating. Because the labor force has been growing at an annual average rateof about 1% for years, it all comes down to improvements in labor productivity.During the 1970s and 1980s, U.S. productivity grew an average of 1.5% peryear. If you add that to the 1% growth in the labor force, it means the economy’stop long-term speed without generating inflation was about 2.5%. Since the mid-1990s, however, there has been a dramatic, and some say permanent, improve-ment in productivity growth as companies employ computerized technology andsoftware to operate more efficiently. As a result, productivity increases haveaveraged above 2.5% in recent years, lifting the red zone for economic growth toabout 3.5%. (Calculation: Productivity increase of 2.5% plus 1% for the rise inthe labor force equals 3.5%.) However, should the economy expand significantlyabove the 3.5% rate for several consecutive quarters, it could sop up excess laborand material resources, reignite inflation pressures, and force the FederalReserve to jump in and raise interest rates.
(12) Net exports of goods and services: U.S. trade with other countries now accountsfor one out of every four dollars in economic activity. Indeed, so important havethese international transactions become that a small change in the volume ofexports or imports can markedly affect GDP growth. If U.S. exports to foreign-ers drop by 10% from one year to the next, it can reduce GDP growth by 1.2percentage points over 12 months. Should imports rise by 10% over the sametime frame, it can slash GDP growth by as much as 1.4 percentage points.
(13) Addendum: Final Sales of Domestic Product: Economic forecasting is alwaysrisky because there are so many variables to ponder. Where experts seem tomiss the mark most often is whenever the economy is about to turn. One earlywarning sign the economy is close to switching tracks comes from real finalsales, not GDP. The final sales figure is a purer measure of demand in the econ-omy. It excludes inventories and looks at how much consumers, businesses, andthe government are actually spending. If the rise in final sales slips below GDP
112 Chapter 3 • The Most Influential U.S. Economic Indicators
05Baumohl_Ch03.13-03.20.qxd 8/3/04 7:38 AM Page 112
growth for an extended period of time, it means companies have been produc-ing much more than what people are interested in buying. As a result, invento-ries can swell to undesirable levels, and that will force companies to slow orhalt production. Such a scenario can depress economic growth in the future oreven cause a recession. Much depends on the degree real final sales have fallenand how much unwanted inventories have accumulated.
Conversely, if final sales are increasing at a faster clip than GDP growth, it por-tends strong economic growth ahead as companies accelerate production to meetthe higher demand.
(14) Up to now, all references to GDP numbers were in real (inflation-adjusted) dol-lars. However, don’t neglect growth in nominal (current dollar) terms. After all,that’s how corporate sales, revenues, and profits are recorded. Historically, S&P500 earnings growth tended to stay in line with nominal GDP. While profitsmay surge ahead from time to time, over the long run they cannot increasefaster than economic growth.
(15) Occasionally you will hear references to both GDP and GNP (Gross NationalProduct) and wonder what the difference is between the two. GDP covers allgoods and services made in the U.S., regardless of whether it is an Americancompany or a foreign company operating in the states. So long as it is producedwithin U.S. shores, the output is counted in the GDP. GNP, on the other hand,records goods and services produced only by U.S. residents regardless of wherethese plants or offices are located in the world. Here’s an example: GDP willnot include production of autos made by General Motors if the plant is locatedin Europe because it was physically made outside the U.S., but GNP willinclude it. All production at a Japanese-owned Honda car plant in the U.S. willbe included in the GDP because it was manufactured here, but it will beexcluded in the GNP because of the plant’s foreign ownership. GDP is a bettermeasure of output in the U.S. and is more closely associated with U.S. employ-ment activity.
• Table 2 Contributions to Percent Change in Real Gross Domestic Product(Not Shown)
Simply scanning the GDP headline figures won’t tell you much about what’s goingon in the economy. After all, even with zero economic growth, people are stillspending $11 trillion a year. In Table 2, one can see which specific sectors in theeconomy have contributed most to growth and which have been a drag, and by howmuch. A quick study of this table can answer key questions. Was the latest pick-upin economic activity due to a surge in government spending? How much has thebusiness sector contributed to overall growth in the latest period? What role haveconsumers played in the economy’s performance?
113Gross Domestic Product (GDP)
05Baumohl_Ch03.13-03.20.qxd 8/3/04 7:38 AM Page 113
• Appendix Table A Real Gross Domestic Product and Related Aggregatesand Price Indexes (Not Shown)
Some of the most intriguing numbers in the GDP report are buried in a table at theend of the release. One is final sales of computers, a key statistic because it reflectsbusiness spending on technology products. Such outlays rise when companies areoptimistic about the economic outlook and sufficiently confident they’ll see a returnon these investments. Sales of computers can also serve as a precursor to productiv-ity growth in the future. The second figure is motor vehicle output. If dealership lotsare filling up because of slow-selling cars and trucks, you’ll see the effects in theoutput numbers in the table. Automakers will respond by slowing or halting produc-tion. On the other hand, if demand for autos rebounds and dealers are clamoring formore shipments, output will resume at higher levels. Because the auto industry relieson thousands of suppliers (for rubber, glass, steel, electronics, and fabrics), a change inactivity in auto production can affect the fortunes of many other ancillary businesses.
MARKET IMPACT
Financial market reaction to the GDP release is not what you might think. Because it’s aquarterly figure, the report lags behind many more-current monthly indicators. Thus, theGDP story can become a non-event by the time it is released. However, one has to becareful! Despite its dated appearance, the GDP report should not be ignored. For one, itcould contain some surprises. The growth rate can turn out to be hugely different fromwhat the market expected. Second, it’s essential reading for anyone who wants to identifysources of strength and weakness in the economy. Third, a close read of the GDP reportcan provide some hints on where the economy and corporate profits might be headed inthe coming quarters. Finally, the revisions might be large enough to completely alterone’s outlook on the economy and call for a new investment strategy. For these reasonsyou should never take the GDP release for granted.
Bonds
When the actual GDP data is released, the first question on everyone’s mind is this: Howdoes it compare with expectations? If the economy is growing at or below the pace pro-jected by economists, the bond market is likely to react positively, especially if real finalsales are anemic and unwanted inventories are ballooning.
Conversely, if GDP growth numbers exceed expectations and the inflation indexesare showing signs of accelerating, it could be a nightmare for bond holders. A strongGDP report combined with rising inflation pressures will spread fears that the FederalReserve will sooner or later intervene and raise short-term rates to cool the economydown. Unless investors are confident the Fed can nip inflation in the bud, chances arebond prices will plummet and cause yields to spike.
114 Chapter 3 • The Most Influential U.S. Economic Indicators
05Baumohl_Ch03.13-03.20.qxd 8/3/04 7:38 AM Page 114

Stocks
The equity market’s reaction to the GDP report will likely be less reflexive than the bondmarket. Here the central question is how does the latest release affect the outlook for cor-porate profits? A healthy economy generates more business earnings, while a sluggishbusiness environment depresses sales and income. However, there’s an important qualifi-cation here. If economic activity has been racing ahead of the 3.5% rate for several quar-ters, even shareholders start to get nervous about rising prices. Higher inflation will causean erosion in household purchasing power and probably force interest rates higher. Thus,the equity market can be as uncomfortable with an economy growing too quickly as it iswhen it moves too slowly.
Dollar
To foreign investors, a strong American economy is viewed more favorably than a weakone. Robust economic activity in the U.S. spurs corporate profits and firms up interestrates; thus, foreign investors see opportunities to make money in the stock market andfrom higher-yielding Treasury bills and bonds. All this will increase the demand for dol-lars. If the Federal Reserve moves quickly to preempt inflation by driving up short-termrates, odds are it would also lead to an appreciation of the dollar because of the percep-tion that the U.S. central bank is ahead of the curve in containing price pressures.
However, if inflation accelerates and stays at a high level, it would lower U.S. com-petitiveness in the world and worsen the country’s foreign trade deficit, a scenario thatcan make U.S. currency far less appealing.
115Gross Domestic Product (GDP)
05Baumohl_Ch03.13-03.20.qxd 8/3/04 7:38 AM Page 115

DURABLE GOODS ORDERS
(ALSO KNOWN AS THE ADVANCE REPORT ON DURABLE GOODS
MANUFACTURERS’ SHIPMENTS, INVENTORIES, AND ORDERS)
Market Sensitivity: High.
What Is It: A key indicator of future manufacturing activity.
News Release on Internet: www.census.gov/indicator/www/m3/adv/
Home Web Address: www.census.gov
Release Time: 8:30 A.M. (ET); released 3–4 weeks after the end of the reportingmonth.
Frequency: Monthly.
Source: Census Bureau, Department of Commerce.
Revisions: Revisions can be major and cover the two preceding months.
WHY IS IT IMPORTANT
Most economic indicators tell a story about what has already happened in the economy.Only a few provide solid clues of what might occur in the future. The advance report ondurable goods orders is one such statistic, and that’s why it gets center-stage attention bythe financial markets and the business community the moment it is released. When we arelooking at “orders” for factory goods, it is about production that will take place in themonths ahead. A jump in orders is a positive sign because it suggests factories andemployees will remain busy as they work to satisfy this demand from customers. By thesame token, a persistent decline in orders must be viewed as a troubling omen that assem-bly lines might soon fall silent, leaving workers with little to do. In such a situation, man-ufacturers face tough choices. Either they will have to shut down some plants andpossibly lay off workers, or continue to maintain current production levels and risk fillingup stockroom shelves with inventories no one wants.
Durable goods are by definition products that have a life expectancy of at least threeyears (such as autos, computers, appliances, aircraft, and communications equipment)and they represent a crucial part of business investment spending. Many sectors of theeconomy are tied to durable goods production, including employment growth, industrialoutput, productivity, and profits. There is another reason why orders for durable goodsare so noteworthy: they serve as a sneak preview to the more comprehensive factoryorders report, which includes both durable and nondurable goods and is released just aweek later. (See Factory Orders in the next section.)
116 Chapter 3 • The Most Influential U.S. Economic Indicators
05Baumohl_Ch03.13-03.20.qxd 8/3/04 7:38 AM Page 116

HOW IS IT COMPUTED
The advance durable goods report is based on results obtained from 3,500 manufacturersrepresenting 89 industry categories. Firms with $500 million in annual shipments as wellas a handful of smaller companies are asked for figures on new orders, shipments,unfilled orders, and inventories. For military equipment, the government relies onDefense Department data.
A new order is considered if it comes with a legally binding agreement to purchase aproduct for immediate or future delivery. Options on new orders are not counted. Neworders are added up, net of cancellations, and the value of shipments is computed afternetting out discounts but before freight charges and excise taxes. Inventories are pricedaccording to their current cost basis.
All numbers are seasonally adjusted but not annualized, nor are the dollar amountsadjusted for inflation. To estimate “real” changes in durable goods orders, compare thegrowth rate over time with the performance of the producer price index.
THE TABLES: CLUES ON WHAT’S AHEAD FOR THE ECONOMY
What makes the durable goods report such a high-profile indicator for investors is that itcan foreshadow significant changes in economic activity far sooner than most other sta-tistics. However, it’s important to keep in mind that new durable goods orders are notori-ously volatile month to month due in part to sudden large orders for defense goods andaircraft. So readers have to strip out some of these components to get a true reading ofdemand in the business sector.
Let’s begin with a description of the release on durable goods. It is divided into fourmain components: new orders, shipments, unfilled orders, and total inventories. Studiedtogether, they can help business leaders and investors better anticipate the future pace ofmanufacturing output, hiring activity, and consumer demand; all are factors that deter-mine economic growth in the coming months.
• Table 1 Durable Goods Manufacturers’ Shipments and New Orders
(1) New Orders: Orders of U.S.-made durable goods reflects the very latest demandfrom both American and foreign buyers. A surge in orders will keep factoriesbusy in the future, making this statistic a good leading indicator. But beware: asingle large military or aircraft order can inflate total new orders for durablegoods and mislead analysts about the underlying strength of the economy. Toavoid any confusion, this table also contains separate data that excludes thevolatile elements of defense and transportation orders.
117Durable Goods Orders
05Baumohl_Ch03.13-03.20.qxd 8/3/04 7:38 AM Page 117
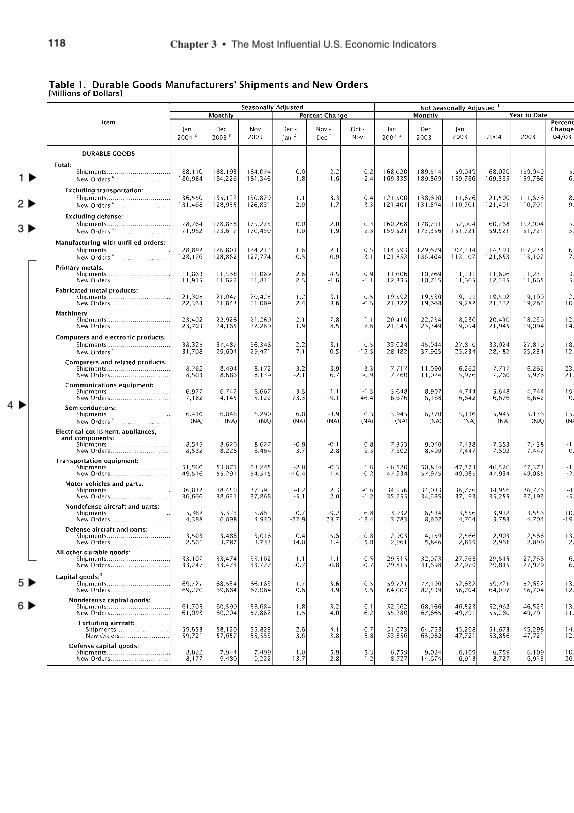
118 Chapter 3 • The Most Influential U.S. Economic Indicators
▲
1
▲
2
▲
3
▲
4
▲
5
▲
6
05Baumohl_Ch03.13-03.20.qxd 8/3/04 7:38 AM Page 118
(2) Orders excluding transportation: As you can see from the title, this categoryrecords the number of new orders—but without the transportation component.Why subtract transportation from the total? Orders for civilian aircraft occur inperiodic bursts and are hugely expensive. When a large order is received, itswells the total value of new orders for a brief period, greatly exaggerating theunderlying pace of demand for durable goods, only to plummet the next monthwhen it returns to a more normal level. To eliminate these erratic movements, it’sbetter to study the behavior of durable goods orders without transportation.
(3) Orders excluding defense: A similar situation exists with defense goods. Thenumber of orders for military goods depends entirely on preparations for nationaldefense and the execution of foreign policy. Given the active role of the U.S. inthe world, there will be occasional spurts of official spending on tanks, guns, air-craft, ammo, naval ships, missiles, submarines, and computers. Of course, theeconomy can benefit from higher defense spending, but what we’re really after isknowledge of the underlying strength or weakness of the private business sector.Orders excluding defense turn out to be an excellent predictor of industrial out-put, especially if they were not influenced by a large order for civilian aircraft. Apersistent climb in new orders for nondefense durable goods lasting, say, overthree to four months presages a broad improvement in manufacturing activity andan increase in factory jobs three to six months down the road.
New durable orders excluding both defense and aircraft: You’ll have to dothe math yourself here because there is no separate breakout for such a cate-gory, but it’s well worth the effort. What you come up with is a less well-known but very effective gauge of consumer confidence. Durable goods aremostly high-priced consumer products whose purchases are not pressing tomost households. Falling into this group would be boats, furniture, cars,wide-screen TVs, and appliances for kitchens and laundry rooms. A commoncharacteristic with all of them is that consumers have some discretion onwhen to buy these products. About 15% of discretionary spending goes to the purchase of durable goods. When consumers grow uneasy about the economy’s path, this is the first place they’ll cut spending. If new orders(aside from defense and aircraft) rebound, it shows households are suffi-ciently comfortable with their finances and the employment outlook toresume spending again, all a good sign for the industrial sector and the econ-omy as a whole.
119Durable Goods Orders
05Baumohl_Ch03.13-03.20.qxd 8/3/04 7:38 AM Page 119

(4) In addition to the broad headings above, the advance report on durable goodscontains more detail on orders for different industry groupings:
• Primary metals*
• Fabricated metals
• Machinery
• Computers, communications equipment, and electronic products
• Electrical equipment and appliances
• Transportation
• All other durables
*Primary metals: When large manufacturers gear up to increase production,their first step is to make sure they have adequate supplies of industrial rawmaterials. Thus, a resurgence in orders for primary materials is a portent thatindustrial output is about to shift into higher gear.
(5) Capital goods orders: Located at the bottom of this table are orders for capitalgoods. These are costly items not normally sold to households but to companiesthat use them to make other products. Purchases here include blast furnaces,machine tools, robotics, and similar equipment. Once again, there’s a separatelisting for total capital goods orders, which includes those for defense, and fornondefense capital goods.
(6) Nondefense capital goods: This category, also known among economists as“core capital goods orders,” might be the best leading indicator of all on busi-ness investment spending. Capital goods orders begin to slip 6 to 12 monthsprior to an economic downturn and generally rebound anywhere from 3 to 18months after the economy hits a recession bottom.
Shipments
Shipments are, well, just that—shipments! They are products that have been ordered andare now being delivered. If you think of new orders as a leading indicator of manufactur-ing activity, shipments should be seen as a coincident indicator, which is a measure ofwhat is going on in the economy right now.
As a rule, shipments are far less volatile than orders. An aircraft maker like Boeingcan receive a major order in one month for 40 passenger jets, which will cause the dol-lar value for new orders to spike that month. However, the actual assembly and deliv-ery of all those aircraft takes much longer. For instance, only two planes might beready for delivery each month, which means that shipments of the aircraft will bespread out over 20 months. Hence, the measurement of shipments tends to be far morestable than orders.
120 Chapter 3 • The Most Influential U.S. Economic Indicators
05Baumohl_Ch03.13-03.20.qxd 8/3/04 7:38 AM Page 120
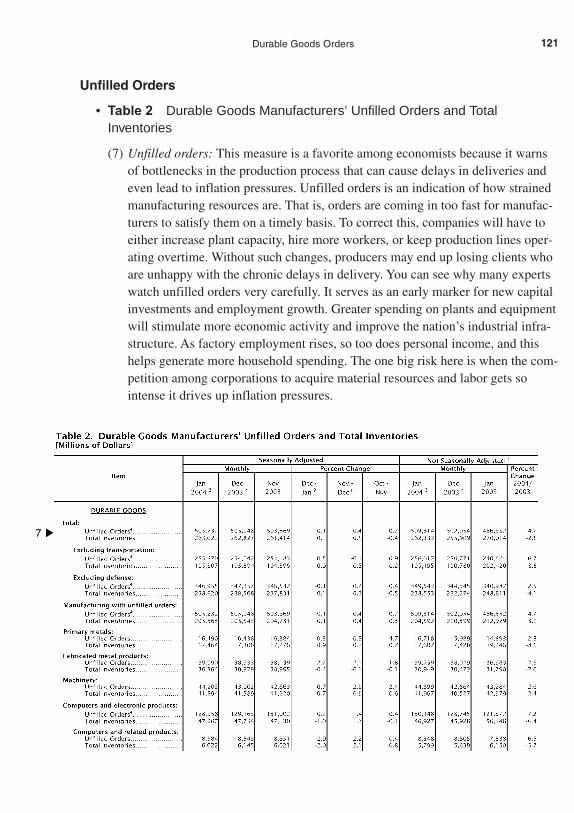
121Durable Goods Orders
Unfilled Orders
• Table 2 Durable Goods Manufacturers’ Unfilled Orders and TotalInventories
(7) Unfilled orders: This measure is a favorite among economists because it warnsof bottlenecks in the production process that can cause delays in deliveries andeven lead to inflation pressures. Unfilled orders is an indication of how strainedmanufacturing resources are. That is, orders are coming in too fast for manufac-turers to satisfy them on a timely basis. To correct this, companies will have toeither increase plant capacity, hire more workers, or keep production lines oper-ating overtime. Without such changes, producers may end up losing clients whoare unhappy with the chronic delays in delivery. You can see why many expertswatch unfilled orders very carefully. It serves as an early marker for new capitalinvestments and employment growth. Greater spending on plants and equipmentwill stimulate more economic activity and improve the nation’s industrial infra-structure. As factory employment rises, so too does personal income, and thishelps generate more household spending. The one big risk here is when the com-petition among corporations to acquire material resources and labor gets sointense it drives up inflation pressures.
▲7
05Baumohl_Ch03.13-03.20.qxd 8/3/04 7:38 AM Page 121
What happens if unfilled orders abruptly decline? This can occur for two rea-sons: either companies are operating at optimal levels and thus can quickly satisfy all orders coming in, or orders themselves have markedly tapered off.The latter can hurt the economy by putting in jeopardy future production andjobs. By and large, unfilled orders tend to rise when the economy is growingrobustly, and drop when business activity turns anemic.
Inventories
Whenever factory output exceeds orders, it can cause inventories to balloon and lead to cor-porate financial headaches. A buildup of unwanted goods can be quite costly to a firm. Afterall, they have to pay suppliers for the raw materials needed to manufacture goods. But ifthere are suddenly fewer buyers for these completed products, companies have little choicebut to store them as unwanted inventories. As these inventories mount, manufacturing execu-tives are often forced to slash output, which can lead to plant shutdowns and layoffs.
MARKET IMPACT
Bonds
Players in the bond market have a visceral dislike for surprises. Yet the advance report ondurable goods is notable for regularly catching investors off guard because it is so volatileand unpredictable. Should orders come in at a pace much greater than expected, it couldpummel bond prices and kick up yields. A surge in new orders, excluding defense and air-craft orders, is indicative of a strengthening manufacturing sector, faster GDP growth,and possibly higher inflation in the future. Conversely, a sudden drop in orders willweaken the manufacturing sector and possibly the rest of the economy, a scenario that’sgenerally bullish for bonds.
Stocks
It’s more problematic to predict how equity investors will react to the durable goodsreport. Generally, a jump in orders would be viewed favorably because it can lead tohigher corporate profits. However, if the economy is already operating close to fullcapacity, a sharp increase in orders might unnerve stock market players who fear thebond market will drive interest rates sharply higher. The rising cost of credit will cut intocorporate earnings, and this could end up depressing share prices.
Dollar
The dollar frequently rallies on evidence of a strengthening U.S economy, especially if itexceeds that of other industrialized countries. However, even currency traders mightbalk if the durable goods report adds to a growing body of evidence that the economy isoverheating.
122 Chapter 3 • The Most Influential U.S. Economic Indicators
05Baumohl_Ch03.13-03.20.qxd 8/3/04 7:38 AM Page 122

FACTORY ORDERS
(FORMALLY KNOWN AS MANUFACTURERS,SHIPMENTS, INVENTORIES, AND ORDERS)
Market Sensitivity: Low to medium.
What Is It: A comprehensive measure of manufacturing orders and sales.
News Release on Internet: www.census.gov/indicator/www/m3/prel/index.htm
Home Web Address: www.census.gov
Release Time: 10 A.M. (ET); published 4–5 weeks following the end of the month.
Frequency: Monthly.
Source: Census Bureau, Department of Commerce.
Revisions: Revisions occur over the next two months and can be substantial.
WHY IS IT IMPORTANT
This economic indicator is a source of some confusion. After all, just a week or sobefore its release, the government puts out a similar report known as the AdvanceReport on Durable Goods Orders (see the previous section), which at first glanceseems to cover the same ground as Factory Orders. But that’s not quite the case. TheAdvance Report is a quick and dirty computation of orders for durable goods (hardproducts such as cars, aircraft, and refrigerators). This release on Factory Orders,however, adds another important piece of information. Not only does it show thedurable goods data of a week ago, but for the first time there’s also data on nondurablegoods orders—defined as soft items such as food, clothing, and fuel—which the ear-lier Advance Report omits. Nondurable items make up 47% of all factory orders withdurable goods accounting for the rest. By including both durables and nondurables,the Factory Orders report completes the picture on U.S. manufacturing, and thisenables economists, investors, and political leaders to get the latest pulse on U.S. fac-tory activity.
Given the comprehensives of Factory Orders, you might think financial marketsworldwide would anxiously await its release every month. The fact is that to mostinvestors, the report on Factory Orders is as interesting as a soap opera rerun. Why?Because the most valued aspect of this report is the change in durable goods—not non-durables. Durable goods orders are considered to be an excellent leading indicator of eco-nomic activity. But the curtain already opened on that statistic days earlier with the release
123Factory Orders
05Baumohl_Ch03.13-03.20.qxd 8/3/04 7:38 AM Page 123
124 Chapter 3 • The Most Influential U.S. Economic Indicators
of the Advanced Report on Durable Goods. By the time Factory Order is published, all thenews on durable goods has already been digested. Relatively little attention is paid to non-durables because it possesses little predictive value. Non-durable orders tend to rise at afairly stable rate every month regardless of whether the economy is doing well or not.Consumers will always buy food, clothing, gas, and heating oil because these products areessential for living.
Should we simply pass over the Factory Orders report entirely? No! It contains amotherlode of detailed information on manufacturing. If examined closely, these statisticscan offer fresh insight on the soundness of the economy.
HOW IS IT COMPUTED
The Census Bureau conducts a monthly survey that contacts 3,500 manufacturingdepartments covering 89 industry groups. Most of the companies queried have morethan $500 million in sales a year, with only a few smaller firms included in the survey.Inquiries are made to obtain the latest figures on orders, shipments, and inventories. Notall these companies come back with answers on time. Roughly 60% do, and they arecounted in the preliminary release of Factory Orders. Subsequent revisions are based onmore complete information.
A new order is considered if it comes with a legally binding agreement to purchase aproduct for immediate or future delivery. Options on new orders are not counted. Neworders are also calculated net of cancellations. For military orders, the government relieson data from the Defense Department. Shipment values are computed net of discounts butbefore freight charges and excise taxes. Inventory values are calculated on a current costbasis.
All figures are presented in both seasonally and nonseasonally adjusted terms, butthey are not corrected for inflation; that is, the numbers are in nominal (current) dollars.To compute the amount after accounting for inflation, use the Producer Price Index forintermediate materials to make the adjustment.
THE TABLES: CLUES ON WHAT’S AHEAD FOR THE ECONOMY
Factory orders are not a high-profile economic indicator as far as money managers areconcerned. A quick scan of the headline numbers is enough to satisfy most. However, byinvesting a little more time looking beyond the headline figures, you may come awaywith a better feel for how the economy will perform in the coming quarters.
05Baumohl_Ch03.13-03.20.qxd 8/3/04 7:38 AM Page 124
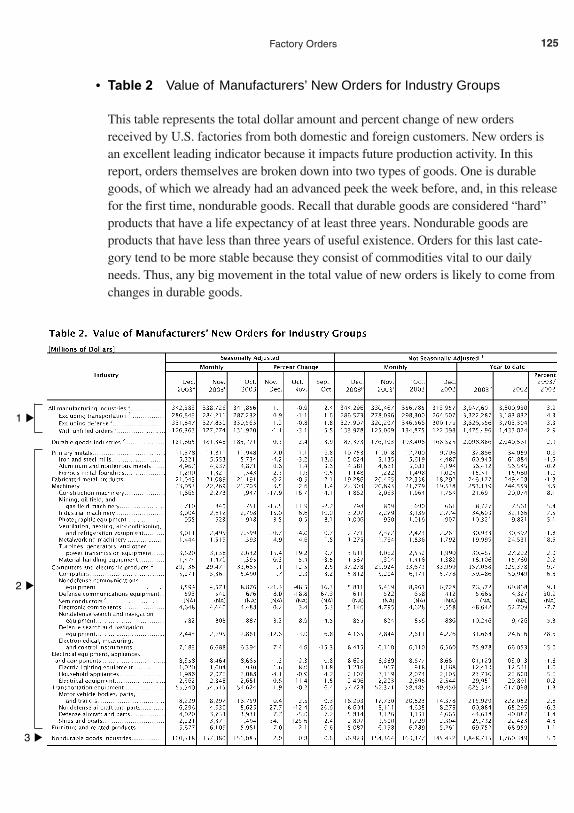
This table represents the total dollar amount and percent change of new ordersreceived by U.S. factories from both domestic and foreign customers. New orders isan excellent leading indicator because it impacts future production activity. In thisreport, orders themselves are broken down into two types of goods. One is durablegoods, of which we already had an advanced peek the week before, and, in this releasefor the first time, nondurable goods. Recall that durable goods are considered “hard”products that have a life expectancy of at least three years. Nondurable goods areproducts that have less than three years of useful existence. Orders for this last cate-gory tend to be more stable because they consist of commodities vital to our dailyneeds. Thus, any big movement in the total value of new orders is likely to come fromchanges in durable goods.
125Factory Orders
• Table 2 Value of Manufacturers’ New Orders for Industry Groups
▲
1
▲
3
▲
2
05Baumohl_Ch03.13-03.20.qxd 8/3/04 7:38 AM Page 125

(1) All manufacturing industries: The best way to determine how busy major U.S.factories will be is to look at the number of new orders coming in, both inabsolute dollar terms as well as the percentage change from previous months.Whether it’s steel mills, autos, computers, communications, aircraft, or dozensof other industries, this is where you’ll get a sense of future production trendsfor each of the industries featured and for manufacturing as a whole. The tablelists new orders for all key manufacturing industries in the latest month and thepercentage change in each of the last three months. Why is this so important totrack? New orders keep the production lines going. If orders drop off, factoriesrisk being idle and companies owning these plants can quickly lose money. Ifdemand for factory goods is strong, assembly lines will remain in full operationand the manufacturer can generate sales income.
Looking solely at total new orders, however, conveys only the most generalimpression. Certain manufacturing industries are more important than others tothe economy. Moreover, total orders can be distorted by the occasional surge inspending on civilian aircraft and defense. Both are typically expensive and willcause that value of new orders to balloon, greatly exaggerating for a singlemonth the underlying pace of demand for manufactured goods. To eliminatethese erratic movements, it’s more prudent to look at manufacturing orders afterexcluding transportation and defense orders. Fortunately, the Census Bureauadjusts for some of these categories in the same table. Finally, to smooth out thewild monthly swings in the data, one should examine orders on at least a three-month moving average basis.
(2) Durable goods industries: Investors here will find more detail on orders for an assortment of key manufacturing industries, including computers, semi-conductors, industrial machinery, electronic components, and motor vehicles.It’s worth repeating here that regardless of whether you’re using the AdvanceDurable Orders of a few days ago or this revised Factory Orders release, if neworders pick up (minus aircraft and defense), it’s a sign that factories will be hum-ming for at least the next three to six months, or longer.
The most substantial shortcoming in the data for new orders is that it does notdifferentiate between domestic and foreign orders. Thus, it’s difficult to discernhow much of the new demand originates from inside and outside the U.S.
(3) Nondurable goods industries: Unlike durable goods, orders for nondurablegoods show little fluctuation during the course of the business cycle becausemany products in this group are considered household necessities. Indeed, non-durable goods account for 63% of all retail sales, with food products, pharma-ceuticals, and textiles making up the largest chunk. The one nondurable that canbe subject to wide price swings is petroleum, a commodity whose cost is ofteninfluenced by geopolitical factors.
126 Chapter 3 • The Most Influential U.S. Economic Indicators
05Baumohl_Ch03.13-03.20.qxd 8/3/04 7:38 AM Page 126
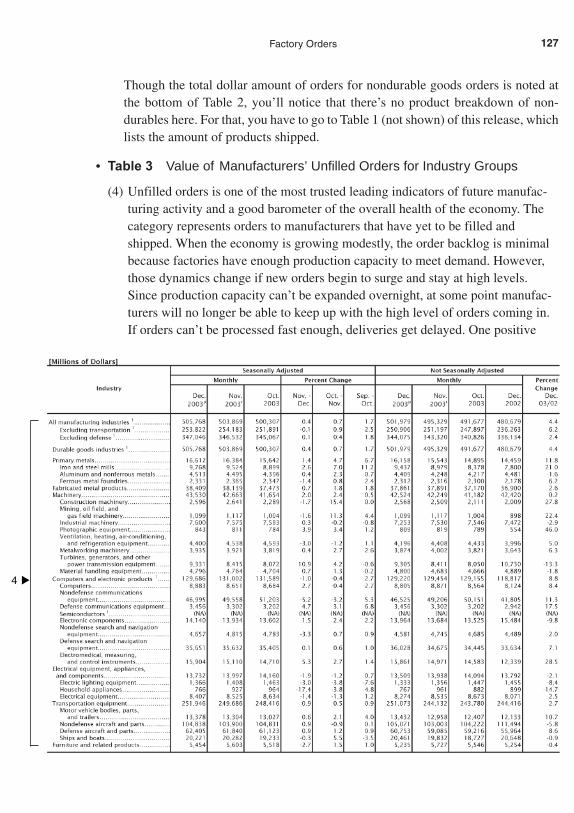
Though the total dollar amount of orders for nondurable goods orders is noted atthe bottom of Table 2, you’ll notice that there’s no product breakdown of non-durables here. For that, you have to go to Table 1 (not shown) of this release, whichlists the amount of products shipped.
• Table 3 Value of Manufacturers’ Unfilled Orders for Industry Groups
(4) Unfilled orders is one of the most trusted leading indicators of future manufac-turing activity and a good barometer of the overall health of the economy. Thecategory represents orders to manufacturers that have yet to be filled andshipped. When the economy is growing modestly, the order backlog is minimalbecause factories have enough production capacity to meet demand. However,those dynamics change if new orders begin to surge and stay at high levels.Since production capacity can’t be expanded overnight, at some point manufac-turers will no longer be able to keep up with the high level of orders coming in.If orders can’t be processed fast enough, deliveries get delayed. One positive
127Factory Orders
▲
4
05Baumohl_Ch03.13-03.20.qxd 8/3/04 7:38 AM Page 127
outcome from such bottlenecks for the economy is that companies might investto expand capacity and raise output. At the very least, a growing backlog oforders means high factory employment, more overtime, and busy assemblylines. The danger from unfilled orders is that they can cause a buildup of infla-tion pressures as both manufacturing capacity and commodities become scarce.Indeed, Federal Reserve officials closely monitor unfilled orders to detect anyemerging imbalance between the demand and supply for materials and products.
Aside from warning of inflation, changes in the order backlog can send othersignals. A persistent fall in unfilled orders, for instance, can warn of a slowdownin consumer and business spending that could result in a decline in factory out-put and even recession. Before jumping to any conclusions, however, rememberto track changes in unfilled orders excluding transportation and defense sincethese two components can greatly warp the data.
• Table 4 Value of Manufacturers Inventories for Industry Groups (Not Shown)
Inventory levels is another yardstick that can be used to foretell what the economywill do. Factory inventories represent more than a third of all business inventories,with wholesale and retail filling up the rest. As an economic concept, inventoriescan move up or down depending on the relative pace of demand and supply.Traditionally, inventories grow when the economy is expanding because at suchtimes, businesses are happy to keep stockrooms filled. The problem begins afterdemand unexpectedly drops and factories fail to adjust in time and slow their output.This can quickly lead to an imbalance where supplies are growing faster thandemand. The result: unwanted inventories begin to pile up as factories get stuckholding goods that no one wants to buy at the moment.
• Table 7 Ratios of Manufacturers’ Inventories to Shipments and UnfilledOrders to Shipments (Not Shown)
Two interesting columns are presented here. One deals with the inventory-sales (orshipments) ratio. It provides some perspective on where inventories stand relative tocurrent sales. The second ratio, unfilled orders to shipments, tells just how bad thelogjam is between orders coming in and shipments going out. The higher the ratio,the longer the delay in deliveries. Again, about a dozen industries are tracked in this table.
128 Chapter 3 • The Most Influential U.S. Economic Indicators
05Baumohl_Ch03.13-03.20.qxd 8/3/04 7:38 AM Page 128

MARKET IMPACT
The Factory Orders report is considered old news to financial markets, so any reactionwill be modest, unless it contains a major revision from the Advance Report on DurableGoods, which is rare.
Bonds
Bond prices might inch higher if Factory Orders conforms with other evidence that theeconomy is weakening. A decline in new orders and order backlog would lower the threatof inflation and enhance the chance of an easing in monetary policy by the FederalReserve—all bullish events for fixed income securities. On the other hand, a spike in neworders and a jump in the backlog raise the prospects of inflation, which can upset bondinvestors and lead to a sell-off that results in higher interest rates. As for inventories andthe I/S ratio, traders generally pay little attention to them unless the economy is close toan inflection point.
Stocks
Equity investors prefer to see Factory Orders validate other signs of economic strengthbecause this translates into higher corporate earnings. Thus, rising orders for both durableand nondurable goods and a pickup in unfilled orders are viewed as beneficial for stocks.However, its actual impact on share prices might be negligible because similar indicatorshave already come out by then.
Dollar
The dollar appears completely unaffected by the Factory Orders release.
129Factory Orders
05Baumohl_Ch03.13-03.20.qxd 8/3/04 7:38 AM Page 129
BUSINESS INVENTORIES
(FORMALLY KNOWN AS MANUFACTURING
AND TRADE INVENTORIES AND SALES)
Market Sensitivity: Low to medium.
What Is It: Tracks total U.S. business sales and inventories.
News Release on Internet: www.census.gov/mtis/www/mtis.html
Home Web Address: www.census.gov
Release Time: 8:30 A.M. (ET); released six weeks after the month ends.
Frequency: Monthly.
Source: Census Bureau, Department of Commerce.
Revisions: They tend to be small. Annual benchmark changes come out in thespring or summer and can cover several years.
WHY IS IT IMPORTANT
“Business inventories.” The term alone is enough for many to shut this book for good.Despite its irksome title, this release by the Census Bureau offers a lot of useful informa-tion on what the economy is up to as well as some valuable clues regarding its futurepath. At the heart of this report are three sets of data: total business sales; total invento-ries, and the inventory-sales (I/S) ratio. Let’s look at them individually.
Total business sales: We don’t need to spend much time on this part of the reportbecause a lot of the sales data on manufacturers, wholesalers, and retailers has already beenreleased weeks before in separate economic reports. (Figures on retail sales came out fourweeks earlier. Those by manufacturers were published two weeks ago, and the wholesalers’numbers the previous week.) The main virtue of the business inventories report is that allthese sales numbers are now combined into one table, along with total inventories and theinventory-sales ratio, allowing analysts an opportunity to connect the dots more easily andget a fuller picture of the economy.
Business inventories: Total business inventories represents the amount of goods thatmanufacturers, wholesalers, and retailers keep in their stockrooms. Though some of thedata on inventories has been out before, new in this release are the figures on retail inven-tories. This is a late but very telling piece of data because it is at the retail level where theeconomy often first runs into trouble.
Understanding inventories is crucial because they can directly affect the pace of futureeconomic growth. A company whose stockroom or back lot is filled with unsold goods canquickly find itself in a financial squeeze, especially if the economy starts to weaken. Keepin mind that inventories are often financed with short-term loans that have to be repaid even
130 Chapter 3 • The Most Influential U.S. Economic Indicators
05Baumohl_Ch03.13-03.20.qxd 8/3/04 7:38 AM Page 130
when income from sales is down. At the same time, holding a certain level of inventories isvital for businesses. A company has to have something to sell or it can’t make money. Thecentral question for corporate managers is just how much inventory they should carry inlight of present orders and expected future demand for goods and supplies.
Historically, inventory problems have been one of the main causes of economicdownturns, and it usually plays out in the following scenario: Retailers with bloatedinventories and sleepy sales will cutback or cancel their orders to wholesalers. As a result,wholesalers, fearful their own stockrooms will start to swell with unwanted products,start to postpone orders to factories. That leaves factories with no choice but to slow orshut down their own production, a step that may lead to plant closings and large-scalelayoffs. With more people out of work, household income drops and consumers spendless. This makes it even tougher for retailers to sell off their excess inventories, which, inturn, sets off yet another round in this entire cycle. On a wide-enough scale, such asequence of events can easily bring on a recession.
Interestingly, changes in inventory can also rescue an economy from recession. Forexample, companies generally succeed in drawing down their stock of excess goods bypromoting special sales, discounts, and other incentives to lure consumers back. Oncefirms get close to depleting their old inventories, a process that can take many months,they will at some point have to replenish their stock rooms. New orders from retailersthus become the powerful tonic that helps the economy get back on its feet. Retailers sub-mit fresh orders to wholesalers, and the latter purchase more from factories. Plants arereopened and workers are rehired.
To some extent, the wild inventory swings described above are becoming less commonas more companies rely on technology and software to help them maintain a better balancebetween stockroom supplies and sales. This “just-in-time” system of inventory managementis supposed to keep the economy out of trouble. But the practice isn’t perfect and mistakesare still made by corporate buyers.
Inventory-sales (I/S) ratio: Companies always want keep enough inventory on hand sothey can sell to customers. But how much is enough? The most popular gauge for assessingwhether inventory levels are too high or too low is the I/S ratio. The I/S ratio is a measureof how many months it takes to sell off inventories based on the latest monthly sales rate. Avery general rule of thumb is to stock up for no more than one and a half months worth ofsales (also expressed as an I/S ratio of 1.5 months). Some industries desire less, othersmore. Automakers, for instance, routinely prefer to have close to two months worth of vehi-cles on their lots (I/S ratio = 2.0). If the I/S ratio for motor vehicle inventory at dealershipsexceeds two months’ supply, it’s a yellow flag that they’re carrying more than is prudentlyneeded. Indeed, it might serve as fresh evidence that car purchases are waning. Too high aratio and companies will halt further stock building, a step that can derail production activ-ity. Too low an I/S ratio means sales to consumers have been growing faster than the rise ininventories. Without further action by the retailers, it would be only a matter of time beforethey would be left with nothing to sell. To avoid this predicament, companies rush throughorders for more goods, which paves the way for faster economic growth.
131Business Inventories
05Baumohl_Ch03.13-03.20.qxd 8/3/04 7:38 AM Page 131
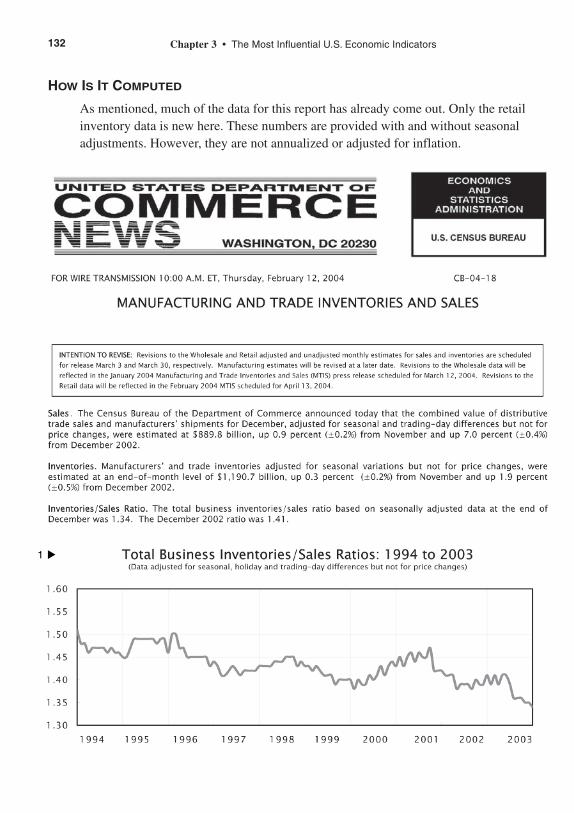
132 Chapter 3 • The Most Influential U.S. Economic Indicators
HOW IS IT COMPUTED
As mentioned, much of the data for this report has already come out. Only the retailinventory data is new here. These numbers are provided with and without seasonaladjustments. However, they are not annualized or adjusted for inflation.
▲
1
05Baumohl_Ch03.13-03.20.qxd 8/3/04 7:38 AM Page 132
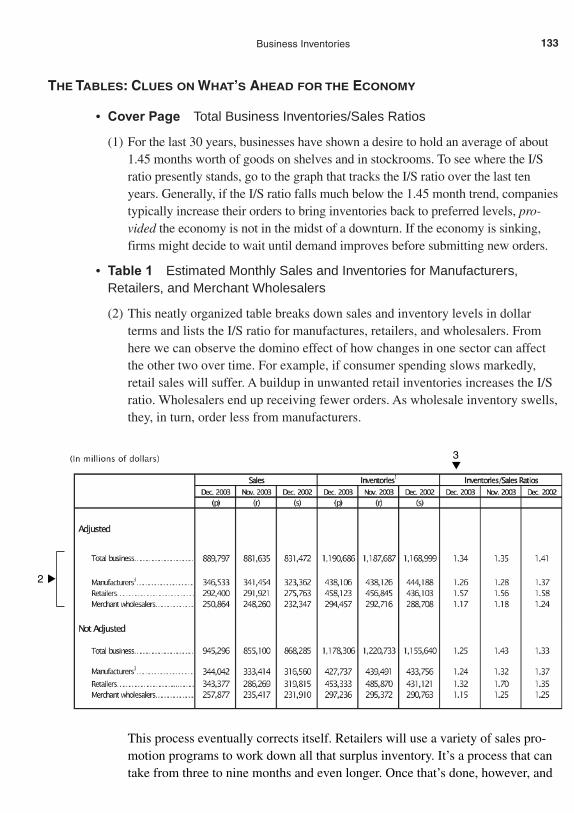
THE TABLES: CLUES ON WHAT’S AHEAD FOR THE ECONOMY
• Cover Page Total Business Inventories/Sales Ratios
(1) For the last 30 years, businesses have shown a desire to hold an average of about1.45 months worth of goods on shelves and in stockrooms. To see where the I/Sratio presently stands, go to the graph that tracks the I/S ratio over the last tenyears. Generally, if the I/S ratio falls much below the 1.45 month trend, companiestypically increase their orders to bring inventories back to preferred levels, pro-vided the economy is not in the midst of a downturn. If the economy is sinking,firms might decide to wait until demand improves before submitting new orders.
• Table 1 Estimated Monthly Sales and Inventories for Manufacturers,Retailers, and Merchant Wholesalers
(2) This neatly organized table breaks down sales and inventory levels in dollarterms and lists the I/S ratio for manufactures, retailers, and wholesalers. Fromhere we can observe the domino effect of how changes in one sector can affectthe other two over time. For example, if consumer spending slows markedly,retail sales will suffer. A buildup in unwanted retail inventories increases the I/Sratio. Wholesalers end up receiving fewer orders. As wholesale inventory swells,they, in turn, order less from manufacturers.
133Business Inventories
▲
2
3 ▼
This process eventually corrects itself. Retailers will use a variety of sales pro-motion programs to work down all that surplus inventory. It’s a process that cantake from three to nine months and even longer. Once that’s done, however, and
05Baumohl_Ch03.13-03.20.qxd 8/3/04 7:38 AM Page 133
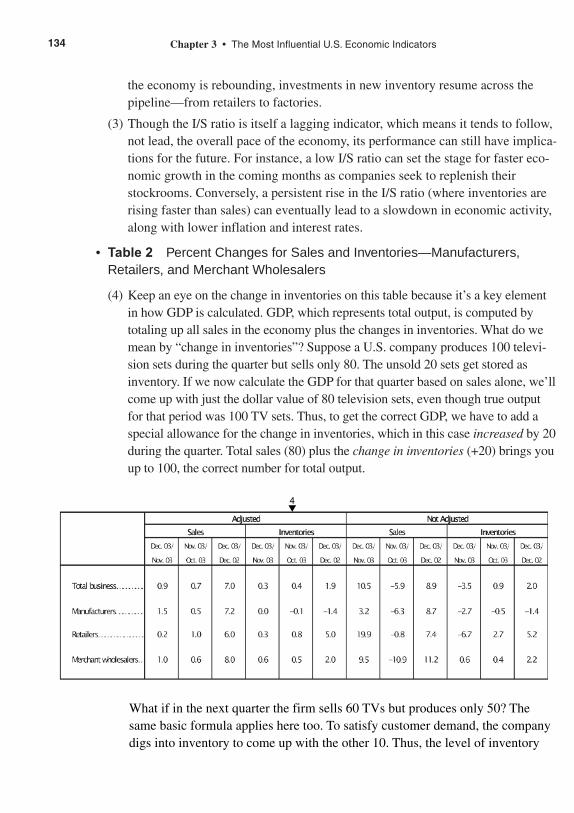
134 Chapter 3 • The Most Influential U.S. Economic Indicators
the economy is rebounding, investments in new inventory resume across thepipeline—from retailers to factories.
(3) Though the I/S ratio is itself a lagging indicator, which means it tends to follow,not lead, the overall pace of the economy, its performance can still have implica-tions for the future. For instance, a low I/S ratio can set the stage for faster eco-nomic growth in the coming months as companies seek to replenish theirstockrooms. Conversely, a persistent rise in the I/S ratio (where inventories arerising faster than sales) can eventually lead to a slowdown in economic activity,along with lower inflation and interest rates.
• Table 2 Percent Changes for Sales and Inventories—Manufacturers,Retailers, and Merchant Wholesalers
(4) Keep an eye on the change in inventories on this table because it’s a key elementin how GDP is calculated. GDP, which represents total output, is computed bytotaling up all sales in the economy plus the changes in inventories. What do wemean by “change in inventories”? Suppose a U.S. company produces 100 televi-sion sets during the quarter but sells only 80. The unsold 20 sets get stored asinventory. If we now calculate the GDP for that quarter based on sales alone, we’llcome up with just the dollar value of 80 television sets, even though true outputfor that period was 100 TV sets. Thus, to get the correct GDP, we have to add aspecial allowance for the change in inventories, which in this case increased by 20during the quarter. Total sales (80) plus the change in inventories (+20) brings youup to 100, the correct number for total output.
What if in the next quarter the firm sells 60 TVs but produces only 50? Thesame basic formula applies here too. To satisfy customer demand, the companydigs into inventory to come up with the other 10. Thus, the level of inventory
4▼
05Baumohl_Ch03.13-03.20.qxd 8/3/04 7:38 AM Page 134
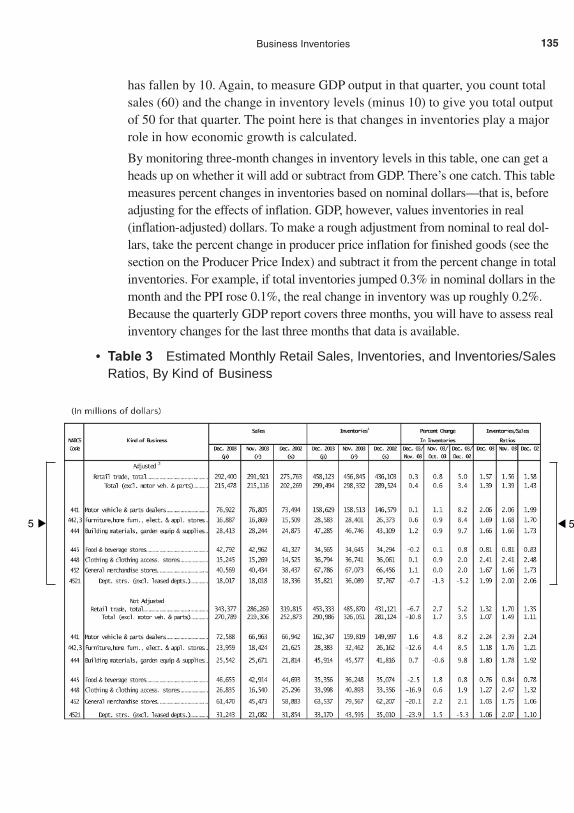
has fallen by 10. Again, to measure GDP output in that quarter, you count totalsales (60) and the change in inventory levels (minus 10) to give you total outputof 50 for that quarter. The point here is that changes in inventories play a majorrole in how economic growth is calculated.
By monitoring three-month changes in inventory levels in this table, one can get aheads up on whether it will add or subtract from GDP. There’s one catch. This tablemeasures percent changes in inventories based on nominal dollars—that is, beforeadjusting for the effects of inflation. GDP, however, values inventories in real(inflation-adjusted) dollars. To make a rough adjustment from nominal to real dol-lars, take the percent change in producer price inflation for finished goods (see thesection on the Producer Price Index) and subtract it from the percent change in totalinventories. For example, if total inventories jumped 0.3% in nominal dollars in themonth and the PPI rose 0.1%, the real change in inventory was up roughly 0.2%.Because the quarterly GDP report covers three months, you will have to assess realinventory changes for the last three months that data is available.
• Table 3 Estimated Monthly Retail Sales, Inventories, and Inventories/SalesRatios, By Kind of Business
135Business Inventories
▲5 ▲ 5
05Baumohl_Ch03.13-03.20.qxd 8/3/04 7:38 AM Page 135
(5) This table shows how various retailers stand in terms of sales, inventories, andthe I/S ratio. Of the three, the I/S is the most meaningful in serving as a leadingeconomic indicator of future orders and production activity. Specific emphasis isplaced on motor vehicles, home furnishings, building materials, clothing, foodand beverages, and general-merchandise stores.
A word of caution: Auto and truck inventories, which account for one-third of totalretail inventories, can be quite volatile in this series. To reduce any distortions,look at the total retail I/S ratio, excluding the motor vehicle and parts components.
MARKET IMPACT
Financial markets and the press react mildly to this report because so much of the datahas already been put out in separate releases. It’s also hard to get excited about economicevents that took place nearly two months ago. Still, on a slow business news day, theretail inventory series might draw some attention, particularly if the economy is reachingan inflection point.
Bonds
Faster-than-expected growth in retail inventory can upset traders in fixed income securi-ties because it adds to GDP growth and can put upward pressure on interest rates. A fallin inventory investment subtracts from economic output, which is positive for bonds.
Stocks
Rarely does the stock market get excited by this release. Though a slowdown in sales andproduction displeases equity investors because of its implications for earnings, the fact isthat most investors have already seen and reacted to similar evidence weeks earlier.
Dollar
The main question for foreign exchange traders is how the news on retail inventorieswill influence interest rates in the U.S. For them, a jump in the I/S ratio (with invento-ries rising at a faster pace than sales) is symptomatic of an economy in the process ofslowing down. That eventually portends lower interest rates, which translates into asmaller payback for international investors. Currency traders generally look at the dol-lar more favorably if both sales and inventories are rising at the retail, wholesale, andmanufacturing level.
136 Chapter 3 • The Most Influential U.S. Economic Indicators
05Baumohl_Ch03.13-03.20.qxd 8/3/04 7:38 AM Page 136
INDUSTRIAL PRODUCTION AND CAPACITY UTILIZATION
Market Sensitivity: Medium.
What Is It: Records U.S. industry’s output and its spare capacity.
News Release on the Internet: www.federalreserve.gov/releases/g17/current
Home Web Address: www.federalreserve.gov
Release Time: 9:15 A.M. (ET); released around the fifteenth of the month andreports on the previous month.
Frequency: Monthly.
Source: Federal Reserve Board.
Revisions: Modest changes are made over the subsequent three months, followedby an annual revision in the fall, usually November.
WHY IS IT IMPORTANT
Any economic indicator released by the Federal Reserve is automatically noticed byinvestors around the world. This is, after all, the agency that conducts U.S. monetary pol-icy and controls short-term interest rates. Two of the Fed’s most closely watched reportsare Industrial Production and Capacity Utilization, both published simultaneously aroundthe middle of every month. Industrial production covers nearly everything that is physi-cally produced in the U.S. and includes cars, umbrellas, paper clips, electricity, and med-ical equipment. It makes no difference whether these goods are for American buyers,foreign consumers, or inventory. All that matters is how much industry is actually churn-ing out in this country. One reason experts are so keen on following industrial productionis that it reacts fairly quickly to the ups and downs of the business cycle. It also has agood track record of forecasting changes in manufacturing employment, average hourlyearnings, and personal income.
The capacity utilization rate is a deceptively simple and incredibly important con-cept. Fed economists look at what industries in the U.S. are presently producing andthen compare that output with what they can potentially produce if all were running atmaximum capability. This series is significant in two respects. First, a nation’s economicpower is judged by its ability to produce goods when they’re needed. It reflects thestrength and flexibility of the industrial sector. Second, it is useful to know how under-utilized manufacturers, utilities, and the mining sectors are in case more output isneeded in the future. Third, the capacity utilization rate has some predictive value. It’s agood leading indicator of business investment spending and can warn of building infla-tion pressures.
137Industrial Production and Capacity Utilization
05Baumohl_Ch03.13-03.20.qxd 8/3/04 7:38 AM Page 137
Industrial Production
The industrial production (IP) series is like a window into the industrial part of the economyand differs from most other economic indicators in one important respect. It measureschanges in the volume of goods produced. That is, IP doesn’t take the price of these prod-ucts into account so there’s no need to worry about the distorting effects of inflation. Thatmakes it a purer measure of output so it corresponds more closely to the performance ofreal (inflation-adjusted) GDP. One can ask why IP figures are so influential to economicforecasters when the goods-producing sector makes up just 20% of the economy, while theservice industry gets far less attention yet contributes much more to the economic pie. Theanswer is that the service sector grows at a fairly stable pace regardless of whether the econ-omy is weak or strong. People will always spend on medical and dental services, transporta-tion, and haircuts. In contrast, manufacturing activity is highly sensitive to changes ininterest rates and demand, so it closely parallels shifts in the overall economy. As a result,there is a close relationship between changes in industrial output and GDP growth.
Capacity Utilization
If a bike-making firm has the capacity to manufacture 500 bicycles a month, but is cur-rently producing only 350, it’s operating at a capacity utilization rate of just 70%. Nowlet’s assume that the rest of the bike industry is operating at the same low level. Undersuch circumstances, getting spare parts would be no problem. There’s likely to be lots ofextra bike tires and brakes available from suppliers. Nor would there be a reason to hireadditional workers or invest in new bike-making machinery because there are not enoughbuyers out there to purchase what can already easily be produced.
But all this changes once demand surges and the industry starts churning out bikes atclose to 100% of its capacity. If that feverish pace continues for an extended period, bikemakers will begin to experience shortages in parts. Prices for bike components can alsorise. As the cost of assembling bicycles accelerates, shoppers will see the price-tags go upas well. The lesson here is that as American industry gets closer to operating at full capac-ity, shortages in resources emerge, and this can generate inflation. High capacity utiliza-tion rates can also lead to new investments in factory equipment and plant expansion socompanies can increase output in the future. As you might imagine, the capacity utiliza-tion rate for manufacturing typically climbs when the economy is vibrant and falls whendemand softens.
HOW IS IT COMPUTED
Industrial Production
Every month, the Federal Reserve calculates an index of industrial production after col-lecting data on 295 industry components representing manufacturing, mining, and theelectric utilities and gas industries. Each component is given a weight based on howimportant it is to the economy. (These weights are adjusted every year.) Most of thisinformation is derived from government data as well as private trade associations.
138 Chapter 3 • The Most Influential U.S. Economic Indicators
05Baumohl_Ch03.13-03.20.qxd 8/3/04 7:38 AM Page 138
The Fed first puts out a preliminary release on industrial production two weeks afterthe reporting month, and it is based on only 55% of the data needed. Why such a low fig-ure? Because the investment community and policymakers want to get a read on indus-trial activity as quickly as possible given this sector’s role in the economy. Since it takestime to collect output figures from so many industries, much of the information arrivestoo late for the first report. Fed economists thus fill in the gaps with estimates that arebased on other economic reports. These reports include hours worked in factories (fromthe employment data) and the amount of electric power consumed by business (frompower supply companies). Interestingly, both hours worked and electric power consump-tion seem to move in line with total industrial output, so these estimates tend to be quiteaccurate. Indeed, the preliminary IP index and the final revised index three months latervary by an average of just 0.3 percentage points.
Finally, data on IP is presented in two formats. One is by type of product, such asconsumer goods, business goods, intermediate goods, and materials. It reflects thedemand side of output. The second format is based on output by industry in broad, supply-side terms.
One cautionary note: although industrial production figures are seasonally adjusted,final numbers can occasionally be distorted because of bizarre weather, natural disasters,or a major strike by labor. Thus, to discern the true underlying growth rate of industrialproduction in the economy, it is best to look at a three-month moving average. (Industrialproduction does not include output from agriculture, construction, transportation, com-munications, trade, finance, and service industries.)
Capacity Utilization
If you think industrial production is tough to compute, calculating capacity utilizationrates is very near a crapshoot. To determine what proportion of capacity is being used,you have to know how much industry is capable of producing when it operates at fullspeed. However, that is impossible to determine with any precision. For one, how doyou define full capacity? Industries rarely work at 100% capacity, though theoreticallythey can function seven days a week, 24 hours a day. Indeed, some industries do havesuch nonstop operations. These companies include chemical and steel manufacturers aswell as petroleum refining companies. During times of war, many other U.S. industriesmobilize their workforce and plants to work past 90% capacity. However, these areextreme situations. The Fed gets around this by defining capacity based on what is con-sidered the “normal” operating time for each industry. A second difficulty in calculatingcapacity is that a growing number of production facilities are not even located in theU.S. Though capacity utilization in this report is based only on U.S. operations, the factis that manufacturing capacity is increasingly being moved offshore where costs arecheaper. Because American companies can also rely on these foreign production facili-ties to help meet U.S. demand, it becomes harder to define what true full capacity is.Third, manufacturers regularly make investments in new plants and equipment, but it’s
139Industrial Production and Capacity Utilization
05Baumohl_Ch03.13-03.20.qxd 8/3/04 7:38 AM Page 139
not immediately clear whether this is done to expand production capabilities or replaceaging and less-efficient equipment. Finally mergers and acquisitions also impact capac-ity because it often leads to a permanent shutdown or sale of redundant productionfacilities. So, trying to figure out the nation’s capacity utilization rate at any givenmoment is like taking a snapshot of a moving target. Yet despite these difficulties, theFederal Reserve makes a valiant effort to calculate capacity utilization rates for 85detailed industries (67 in manufacturing, 16 in mining, and 2 in utilities) and thencomes up with an industry total.
THE TABLES: CLUES ON WHAT’S AHEAD FOR THE ECONOMY
Manufacturing is the most cyclically sensitive part of the economy, a factor that makesindustrial production a classic indicator of current business conditions. When economicactivity is increasing, factory production rises with it. As the business cycle approachesits peak, factory output also tops out. And when the economy slips into recession, outputdrops as well. Does industrial production have any use as a predictive indicator? Theanswer is yes. The IP report can reveal quite a lot about the future direction of economicgrowth, corporate sales, inflation, and more.
• Cover Page Industrial Production and Capacity Utilization: Summary
(1) The “total index” on the front page table summarizes the change in industrialactivity during the latest four-month period. Historically, there has been a strongrelationship between industrial production and quarterly GDP. By monitoringpercentage changes in industrial output over the last three months, one can makea fairly good estimate of the current trend in GDP growth.
(2) Another key set of numbers refers to the total amount of consumer goods (suchas cars and trucks) produced versus those of business goods. Strong sales and athinning of inventories will encourage more production of consumer products,while the output of business equipment reflects mainly capital investment spend-ing by companies.
(3) Here you have the three main components of the industrial production index.The largest by far is manufacturing, which in 2003 accounted for about 82% ofindustrial output. Next on the list is mining at 8%, followed by utilities, whichmake up 10%.
Interested in developing forecasts of corporate revenues for U.S. manufactur-ers? One strategy used by some analysts involves taking three-month percent-age changes in manufacturing output and multiplying it by the three-monthpercentage change in consumer price inflation. The result becomes a goodproxy for nominal dollar GDP performance which, in turn, is a reliable harbin-ger of factory sales growth.
140 Chapter 3 • The Most Influential U.S. Economic Indicators
05Baumohl_Ch03.13-03.20.qxd 8/3/04 7:38 AM Page 140
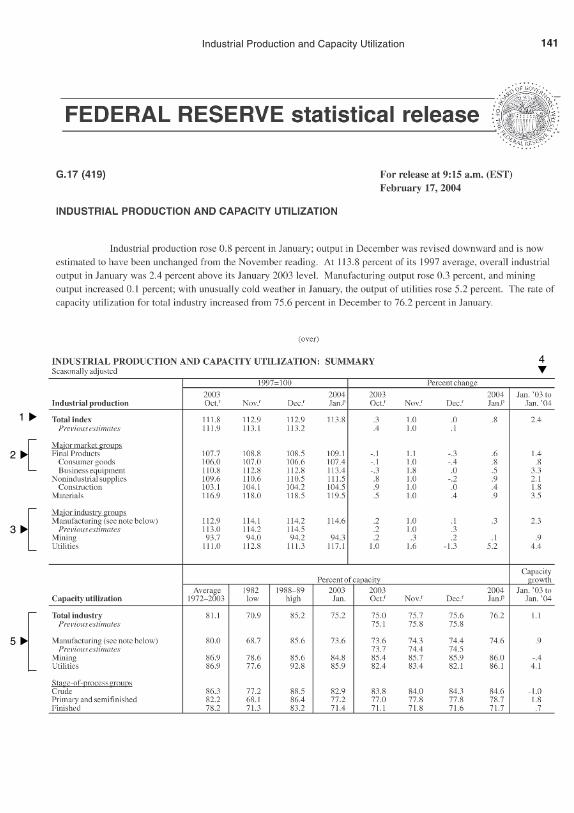
141Industrial Production and Capacity Utilization
▲
1
▲
2
4 ▼
▲
3
▲
5
05Baumohl_Ch03.13-03.20.qxd 8/3/04 7:38 AM Page 141
(4) The percent change in production for all these groups over the past year arelisted here.
(5) Moving on to capacity utilization, this table shows how much spare capacity isleft at factories, mines, and utilities. In general, the utilization rate rises or fallswith the business cycle, much like industrial production. If orders for productsfade, factory output declines and less capacity is utilized. If the utilization ratelingers below 80%, it tends to discourage new business investments and mayeven trigger a round of job dismissals.
On the other hand, strong demand for goods stimulates production. Manufac-turers will utilize more of their factories and plants, causing any slack in capacityto shrink or even disappear. As capacity utilization edges closer to operating atmaximum levels, pressure on prices starts to build. Is there a red zone in thecapacity utilization rate that usually detonates inflation? Generally speaking, theindustrial sector can function safely (that is, without an eruption of higher prices)with a capacity utilization rate as high as 81%. After the utilization rate enters the82%–85% range, however, production bottlenecks appear, and this can put freshpressure on prices, especially at the producer price level. Look at the summarytable to see the current capacity utilization rate for total industry and its threemain components: manufacturing, mining, and utilities.
• Table 1 Industrial Production: Market and Industry Group Summary
A wealth of information on industrial output is found in Tables 1 and 2. Table 1 listspercent change in production of key products for each of the past four months, thelast four quarters annualized, and over the last three years. Here are some of the most important categories:
(6) Business equipment: A category that tells of plans by companies to invest in newplants and equipment
(7) Defense and space equipment: A broad measure of production for military andaerospace hardware
(8) Motor vehicles and parts: An indication of whether automakers see enoughdemand to fill dealers’ lots
142 Chapter 3 • The Most Influential U.S. Economic Indicators
05Baumohl_Ch03.13-03.20.qxd 8/3/04 7:38 AM Page 142
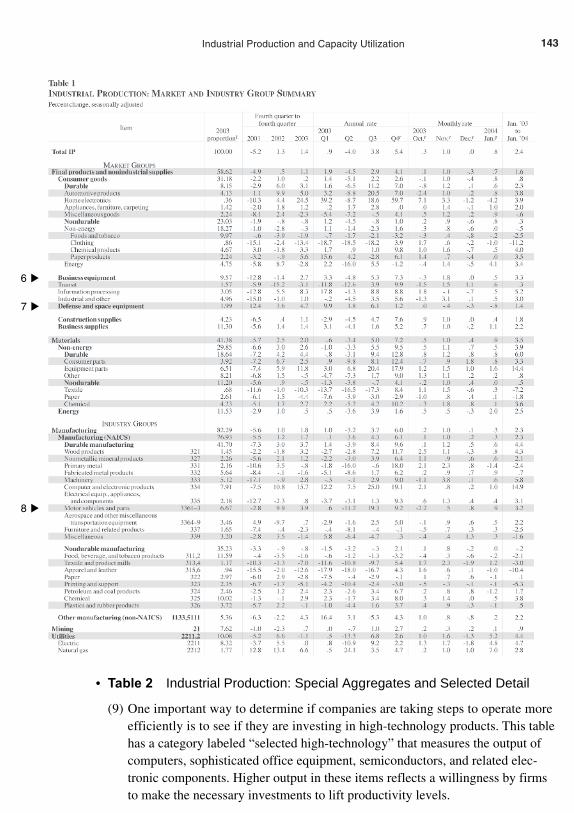
143Industrial Production and Capacity Utilization
• Table 2 Industrial Production: Special Aggregates and Selected Detail
(9) One important way to determine if companies are taking steps to operate moreefficiently is to see if they are investing in high-technology products. This tablehas a category labeled “selected high-technology” that measures the output ofcomputers, sophisticated office equipment, semiconductors, and related elec-tronic components. Higher output in these items reflects a willingness by firmsto make the necessary investments to lift productivity levels.
▲
6
▲
7
▲
8
05Baumohl_Ch03.13-03.20.qxd 8/3/04 7:38 AM Page 143

144 Chapter 3 • The Most Influential U.S. Economic Indicators
▲
9
▲
10
(10) Because of the enormous influence of motor vehicle output on the manufacturingindustry, large fluctuations in this one group can greatly distort swings in industrialproduction overall. To find out how much manufacturers outside the auto industryare producing, look at the output measure excluding motor vehicles and parts.
• Table 3 Motor Vehicle Assemblies
(11) No single industry is more closely identified with manufacturing than automak-ers. They are responsible for 7 million jobs and represent about 4% of GDP. TheU.S. automotive industry produces a higher level of output than any other singleindustry. It is among the largest purchasers of aluminum, iron, plastics, rubber,textiles, vinyl, steel, and computer chips. It’s also an industry that is highly sensi-tive to interest rates. High rates will dull sales and lead to lower auto production
05Baumohl_Ch03.13-03.20.qxd 8/3/04 7:38 AM Page 144
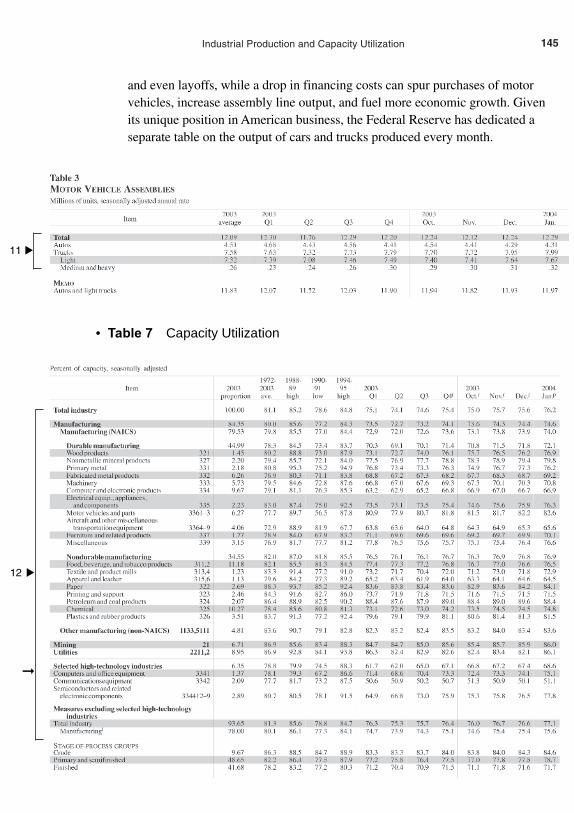
145Industrial Production and Capacity Utilization
▲
11
▲
12
➞
• Table 7 Capacity Utilization
and even layoffs, while a drop in financing costs can spur purchases of motorvehicles, increase assembly line output, and fuel more economic growth. Givenits unique position in American business, the Federal Reserve has dedicated aseparate table on the output of cars and trucks produced every month.
05Baumohl_Ch03.13-03.20.qxd 8/3/04 7:38 AM Page 145
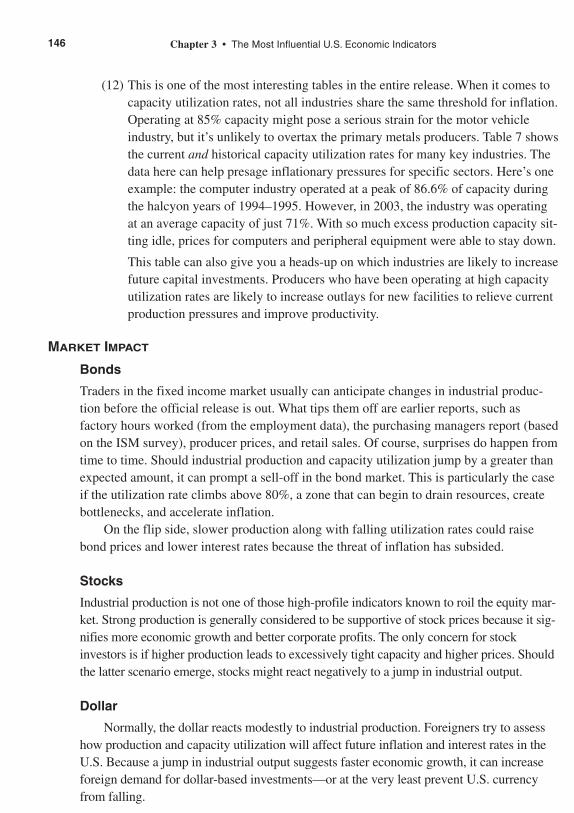
146 Chapter 3 • The Most Influential U.S. Economic Indicators
(12) This is one of the most interesting tables in the entire release. When it comes tocapacity utilization rates, not all industries share the same threshold for inflation.Operating at 85% capacity might pose a serious strain for the motor vehicleindustry, but it’s unlikely to overtax the primary metals producers. Table 7 showsthe current and historical capacity utilization rates for many key industries. Thedata here can help presage inflationary pressures for specific sectors. Here’s oneexample: the computer industry operated at a peak of 86.6% of capacity duringthe halcyon years of 1994–1995. However, in 2003, the industry was operatingat an average capacity of just 71%. With so much excess production capacity sit-ting idle, prices for computers and peripheral equipment were able to stay down.
This table can also give you a heads-up on which industries are likely to increasefuture capital investments. Producers who have been operating at high capacityutilization rates are likely to increase outlays for new facilities to relieve currentproduction pressures and improve productivity.
MARKET IMPACT
Bonds
Traders in the fixed income market usually can anticipate changes in industrial produc-tion before the official release is out. What tips them off are earlier reports, such asfactory hours worked (from the employment data), the purchasing managers report (basedon the ISM survey), producer prices, and retail sales. Of course, surprises do happen fromtime to time. Should industrial production and capacity utilization jump by a greater thanexpected amount, it can prompt a sell-off in the bond market. This is particularly the caseif the utilization rate climbs above 80%, a zone that can begin to drain resources, createbottlenecks, and accelerate inflation.
On the flip side, slower production along with falling utilization rates could raisebond prices and lower interest rates because the threat of inflation has subsided.
Stocks
Industrial production is not one of those high-profile indicators known to roil the equity mar-ket. Strong production is generally considered to be supportive of stock prices because it sig-nifies more economic growth and better corporate profits. The only concern for stockinvestors is if higher production leads to excessively tight capacity and higher prices. Shouldthe latter scenario emerge, stocks might react negatively to a jump in industrial output.
Dollar
Normally, the dollar reacts modestly to industrial production. Foreigners try to assesshow production and capacity utilization will affect future inflation and interest rates in theU.S. Because a jump in industrial output suggests faster economic growth, it can increaseforeign demand for dollar-based investments—or at the very least prevent U.S. currencyfrom falling.
05Baumohl_Ch03.13-03.20.qxd 8/3/04 7:38 AM Page 146
INSTITUTE FOR SUPPLY MANAGEMENT (ISM)MANUFACTURING SURVEY
Market Sensitivity: Very high.
What Is It: First monthly report on the economy with a focus on manufacturing.
News Release on Internet: www.ism.ws/ISMReport/index.cfm
Home Web Address: www.ism.ws
Release Time: 10 A.M. (ET); released the first business day after the reportingmonth.
Frequency: Monthly.
Source: Institute for Supply Management.
Revisions: No monthly revisions are done, but every January there arereassessments of seasonal adjustment factors that can lead to changes in allthe data.
WHY IS IT IMPORTANT
You might choose to ignore this economic indicator because of its less-than-rivetingname. So here’s a warning: Don’t! It is the first piece of news on the economy out of thegate every month and the most influential statistic released by the private sector. Theorganization behind this market-moving series is the Institute for Supply Management(ISM), a Tempe, Arizona-based group that represents corporate purchasing managersaround the country. Indeed, prior to January 2002, it was known by the more transparentname of National Association of Purchasing Managers. The ISM puts out two major sur-veys each month. The first is based on comments from purchasing managers in the manu-facturing sector. The second deals with their counterparts in the non-manufacturing, orservice, industry. It is the manufacturing survey that grabs most of the attention in thefinancial markets and the press.
This raises an immediate question. How is it that an obscure bunch of purchasing man-agers in manufacturing can hold such sway over the investment community? The answercan be found by understanding what corporate purchasing agents do. Manufacturing com-panies need lots of supplies to make products. Those in charge of procuring this material fortheir company are purchasing managers. A sample of items they might order includeswiring, packing boxes, ink, and computers. If there is a pickup in demand for manufacturedproducts, purchasing managers respond by increasing orders for production material andother supplies. Should manufacturing sales slow, these corporate buyers will cut back on
147ISM—Manufacturing Survey
06Baumohl_Ch03.21-03.30.qxd 8/3/04 9:18 AM Page 147
148 Chapter 3 • The Most Influential U.S. Economic Indicators
industrial orders. Thus, by virtue of their position, purchasing managers are in the forefrontof monitoring activity in manufacturing. That’s important because the goods-producingindustry is highly sensitive to the ebb and flow of business in the broader economy. Best ofall about the ISM’s Purchasing Managers Index is its timing. Survey results come out on thefirst business day of every month. As such, they provide the earliest clues of how the econ-omy has fared during the previous four weeks. Indeed, the numbers are so current thatFederal Reserve officials are briefed on the data before the public sees it. The ISM’s non-manufacturing report (see the next section) comes out two business days later, but it has notyet achieved the exalted status of the manufacturing release.
HOW IS IT COMPUTED
The ISM’s manufacturing survey has an interesting history. Its origin can be traced toHerbert Hoover. Faced with a collapsing U.S. economy during the Great Depression,President Hoover was frustrated by the lack of current data on the health of Americanmanufacturers. He approached the ISM, then known as the National Association ofPurchasing Agents, and urged them to develop a survey that would provide up-to-dateinformation on the health of this important part of the economy. The group complied, andthe survey began in 1931. It has been around ever since, except for a brief four-year inter-ruption during World War II.
Nowadays, the ISM mails out questionnaires every month to about 400 member com-panies around the country, representing 20 different industries. Corporate purchasing man-agers are asked to assess if activity is rising, falling, or unchanged in the following fields:
• New orders: New orders by purchasing agents
• Production: Manufacturing output
• Employment: Hiring in the company
• Supplier deliveries (or vendor performance): Speed of delivery from suppliers
• Inventories: The rate of liquidating manufacturers’ inventories
• Customers’ inventories: Agents guess the inventory levels of their customers
• Commodity prices: Prices paid by manufacturers for supplies
• Backlog of orders: Orders not yet filled
• New export orders: Rate of new orders from other countries
• Imports: Material that agents purchased from other countries
(Seasonal adjustment factors are applied only on new orders, production, employ-ment, supplier deliveries, inventories, export orders, and imports.)
The Purchasing Managers Index (PMI) itself is a compilation based on the answersto the first five queries in the preceding list. They are weighted as follows to compute theindex: new orders (30%), manufacturing production (25%), employment (20%), supplierdeliveries (15%), and inventories (10%). The bottom five provide additional coverage on
06Baumohl_Ch03.21-03.30.qxd 8/3/04 9:18 AM Page 148

how manufacturing is performing. The PMI is calculated as a so-called diffusion index,which shows changes in activity from month to month, but not actual levels of produc-tion. As the responses from members come in, the ISM takes the percentage of those whoreported activity being higher in each component and adds that to half the percentage ofthose who reported seeing no changes. If the result is an index number above 50, it meansthe manufacturing sector is growing. Below 50 means it’s contracting. An index of 50represents no change in activity.
Here are two examples: Let’s say 100% of those surveyed reported no change in manu-facturing production. To come up with the index, take half the percentage of those who saidorders were unchanged (which gives you 50%) and add it to the percentage of agents whosaw higher activity (no one did, so it’s 0%). The result is an index of 50, which means thatpurchasing managers have seen no discernible change in manufacturing output from onemonth to the next.
In the second example, we’ll assume 30% of the agents reported higher activity,while 50% noticed no change in business. The diffusion index in this case comes to 55%(30 plus half of 50), which is a sign manufacturing output is expanding.
THE TABLES: CLUES ON WHAT’S AHEAD FOR THE ECONOMY
One can glean lots of information about the present health of specific industries from theISM survey. For example, inside the ISM report, 20 different business sectors—from foodto furniture manufacturers—are probed so that one can see where the greatest sources ofstrength and weakness are in the economy. Which sectors are growing, hiring, or feelingthe inflation pinch? What makes this so valuable to equity investors is the timeliness of theresults and the fact that this information came directly from industry executives.
149ISM—Manufacturing Survey
Reprinted with permission from the publisher, the Institute for Supply Management™, from themonthly ISM Report on Business ®.
06Baumohl_Ch03.21-03.30.qxd 8/3/04 9:18 AM Page 149
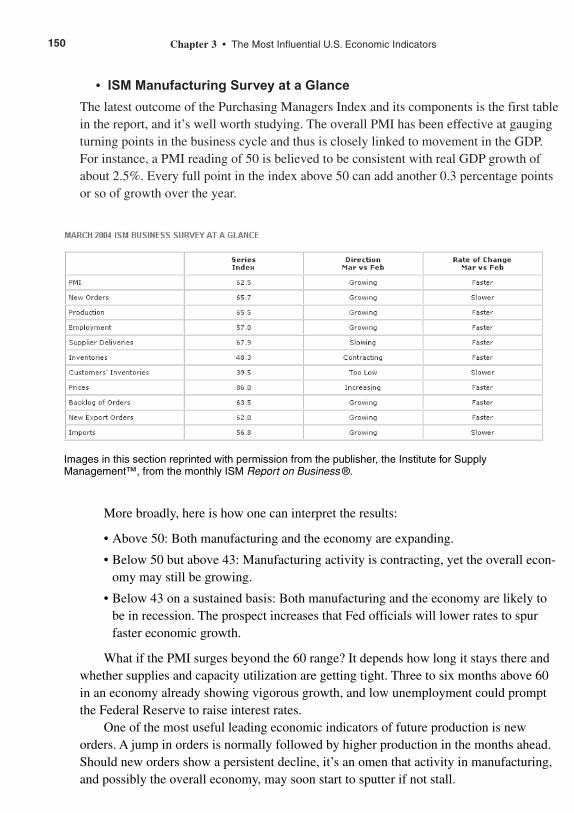
• ISM Manufacturing Survey at a Glance
The latest outcome of the Purchasing Managers Index and its components is the first tablein the report, and it’s well worth studying. The overall PMI has been effective at gaugingturning points in the business cycle and thus is closely linked to movement in the GDP.For instance, a PMI reading of 50 is believed to be consistent with real GDP growth ofabout 2.5%. Every full point in the index above 50 can add another 0.3 percentage pointsor so of growth over the year.
150 Chapter 3 • The Most Influential U.S. Economic Indicators
More broadly, here is how one can interpret the results:
• Above 50: Both manufacturing and the economy are expanding.
• Below 50 but above 43: Manufacturing activity is contracting, yet the overall econ-omy may still be growing.
• Below 43 on a sustained basis: Both manufacturing and the economy are likely tobe in recession. The prospect increases that Fed officials will lower rates to spurfaster economic growth.
What if the PMI surges beyond the 60 range? It depends how long it stays there andwhether supplies and capacity utilization are getting tight. Three to six months above 60in an economy already showing vigorous growth, and low unemployment could promptthe Federal Reserve to raise interest rates.
One of the most useful leading economic indicators of future production is neworders. A jump in orders is normally followed by higher production in the months ahead.Should new orders show a persistent decline, it’s an omen that activity in manufacturing,and possibly the overall economy, may soon start to sputter if not stall.
Images in this section reprinted with permission from the publisher, the Institute for SupplyManagement™, from the monthly ISM Report on Business ®.
06Baumohl_Ch03.21-03.30.qxd 8/3/04 9:18 AM Page 150
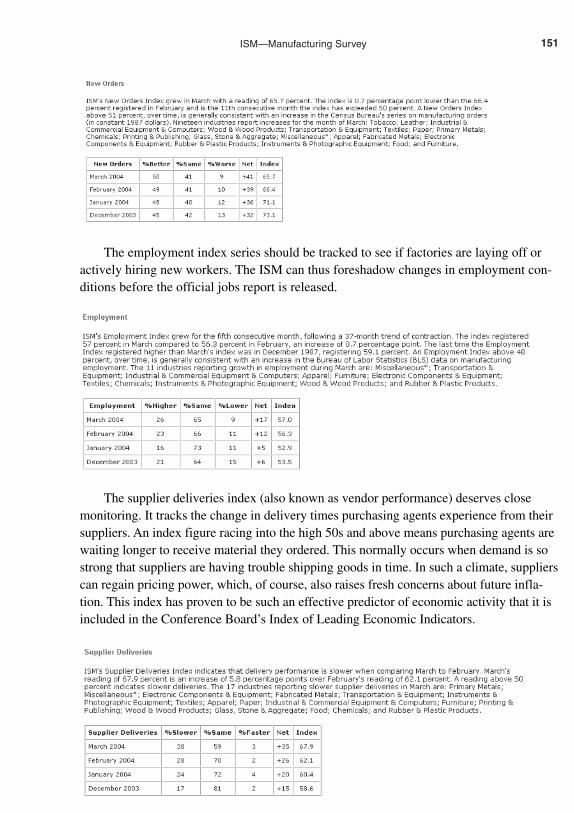
151ISM—Manufacturing Survey
The employment index series should be tracked to see if factories are laying off oractively hiring new workers. The ISM can thus foreshadow changes in employment con-ditions before the official jobs report is released.
The supplier deliveries index (also known as vendor performance) deserves closemonitoring. It tracks the change in delivery times purchasing agents experience from theirsuppliers. An index figure racing into the high 50s and above means purchasing agents arewaiting longer to receive material they ordered. This normally occurs when demand is sostrong that suppliers are having trouble shipping goods in time. In such a climate, supplierscan regain pricing power, which, of course, also raises fresh concerns about future infla-tion. This index has proven to be such an effective predictor of economic activity that it isincluded in the Conference Board’s Index of Leading Economic Indicators.
06Baumohl_Ch03.21-03.30.qxd 8/3/04 9:18 AM Page 151
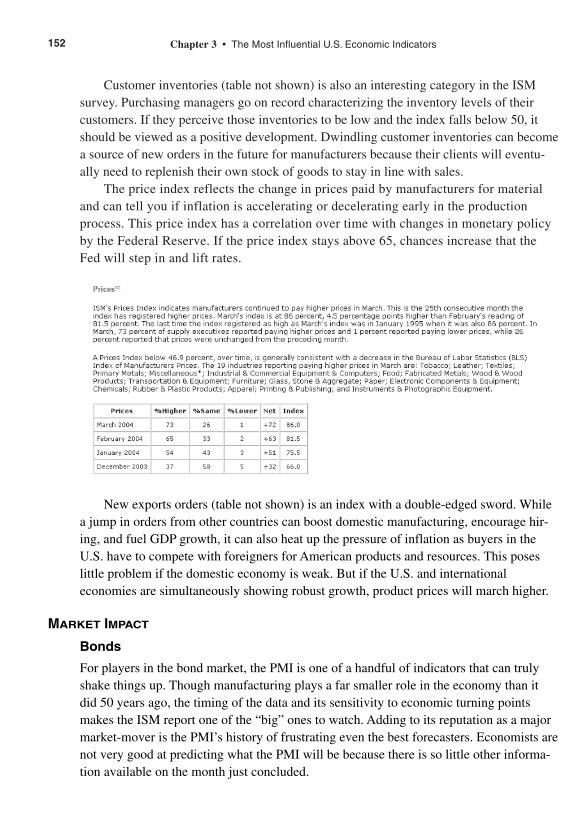
Customer inventories (table not shown) is also an interesting category in the ISMsurvey. Purchasing managers go on record characterizing the inventory levels of theircustomers. If they perceive those inventories to be low and the index falls below 50, itshould be viewed as a positive development. Dwindling customer inventories can becomea source of new orders in the future for manufacturers because their clients will eventu-ally need to replenish their own stock of goods to stay in line with sales.
The price index reflects the change in prices paid by manufacturers for materialand can tell you if inflation is accelerating or decelerating early in the productionprocess. This price index has a correlation over time with changes in monetary policyby the Federal Reserve. If the price index stays above 65, chances increase that theFed will step in and lift rates.
152 Chapter 3 • The Most Influential U.S. Economic Indicators
New exports orders (table not shown) is an index with a double-edged sword. Whilea jump in orders from other countries can boost domestic manufacturing, encourage hir-ing, and fuel GDP growth, it can also heat up the pressure of inflation as buyers in theU.S. have to compete with foreigners for American products and resources. This poseslittle problem if the domestic economy is weak. But if the U.S. and internationaleconomies are simultaneously showing robust growth, product prices will march higher.
MARKET IMPACT
Bonds
For players in the bond market, the PMI is one of a handful of indicators that can trulyshake things up. Though manufacturing plays a far smaller role in the economy than itdid 50 years ago, the timing of the data and its sensitivity to economic turning pointsmakes the ISM report one of the “big” ones to watch. Adding to its reputation as a majormarket-mover is the PMI’s history of frustrating even the best forecasters. Economists arenot very good at predicting what the PMI will be because there is so little other informa-tion available on the month just concluded.
06Baumohl_Ch03.21-03.30.qxd 8/3/04 9:18 AM Page 152
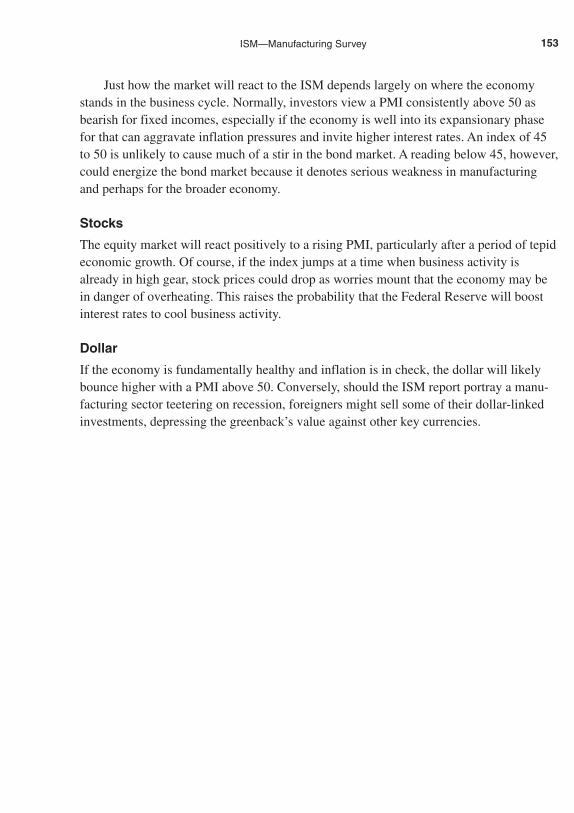
Just how the market will react to the ISM depends largely on where the economystands in the business cycle. Normally, investors view a PMI consistently above 50 asbearish for fixed incomes, especially if the economy is well into its expansionary phasefor that can aggravate inflation pressures and invite higher interest rates. An index of 45to 50 is unlikely to cause much of a stir in the bond market. A reading below 45, however,could energize the bond market because it denotes serious weakness in manufacturingand perhaps for the broader economy.
Stocks
The equity market will react positively to a rising PMI, particularly after a period of tepideconomic growth. Of course, if the index jumps at a time when business activity isalready in high gear, stock prices could drop as worries mount that the economy may bein danger of overheating. This raises the probability that the Federal Reserve will boostinterest rates to cool business activity.
Dollar
If the economy is fundamentally healthy and inflation is in check, the dollar will likelybounce higher with a PMI above 50. Conversely, should the ISM report portray a manu-facturing sector teetering on recession, foreigners might sell some of their dollar-linkedinvestments, depressing the greenback’s value against other key currencies.
153ISM—Manufacturing Survey
06Baumohl_Ch03.21-03.30.qxd 8/3/04 9:18 AM Page 153
INSTITUTE FOR SUPPLY MANAGEMENT (ISM)NON-MANUFACTURING BUSINESS SURVEY
Market Sensitivity: Low.
What Is It: The first read on the economy’s service sector.
News Release on Internet: www.ism.ws/ISMReport/index.cfm
Home Web Address: www.ism.ws
Release Time: 10 A.M. (ET); released on the third business day following themonth being reported.
Frequency: Monthly.
Source: Institute for Supply Management.
Revisions: No monthly revisions. There are yearly reassessments of seasonaladjustment factors. They are normally done in January and can lead torevisions for the last four years.
WHY IS IT IMPORTANT
This survey reminds one of Rodney Dangerfield’s old lament: “I get no respect, norespect at all.” Published for the first time in June 1998, the ISM’s Non-Manufacturingsurvey looks at conditions in the service sector. Though it lacks the kind of recognitionand gravitas its manufacturing counterpart has in the financial markets, this non-manu-facturing report is expected to become one of the most influential economic indicatorsput out every month.
After all, it not only spots changes in employment trends, new orders, and prices inthe non-manufacturing industries, which represent 80% of the U.S. economy, but the sur-vey results are published for all to see on a near-real-time basis. The data comes out onthe third business day of each month and covers the month just concluded.
So why hasn’t the non-manufacturing survey caught on faster? For one, it is a rela-tively new report and there has not been enough historical experience to draw a relation-ship with GDP performance. Several more years of tracking ISM’s non-manufacturingindex will be needed to establish any reliable correlation. At the very least, one has to seethis indicator perform through one or two complete business cycles. Another reason it hasbeen slow to excite investment managers and forecasters is that the service sector is not as cyclical as manufacturing. During tough economic times, Americans quickly slashspending on pricey manufactured goods (such as cars, furniture, and home entertainmentsystems), but they will not significantly pare back spending on services because there isalways a demand for medical care, transportation, and communications. That makes theISM’s non-manufacturing index less than an ideal forecasting tool to identify turning
154 Chapter 3 • The Most Influential U.S. Economic Indicators
06Baumohl_Ch03.21-03.30.qxd 8/3/04 9:18 AM Page 154
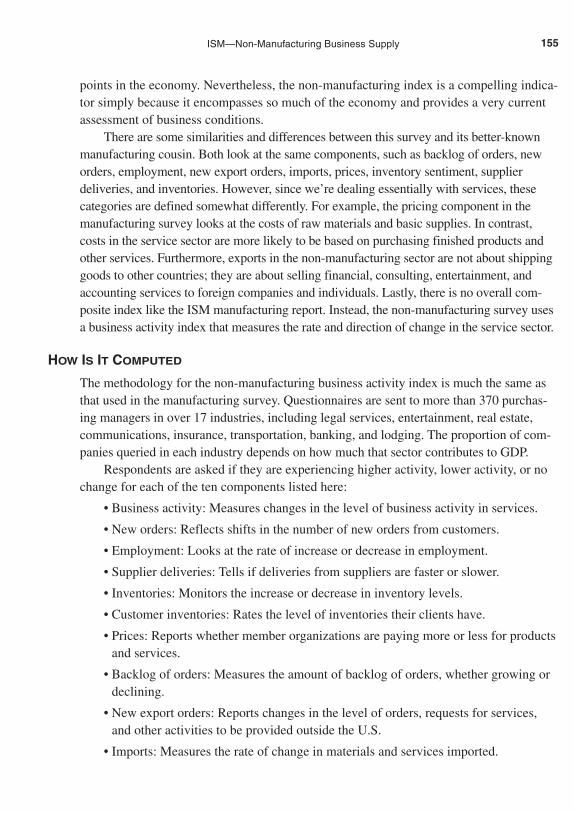
points in the economy. Nevertheless, the non-manufacturing index is a compelling indica-tor simply because it encompasses so much of the economy and provides a very currentassessment of business conditions.
There are some similarities and differences between this survey and its better-knownmanufacturing cousin. Both look at the same components, such as backlog of orders, neworders, employment, new export orders, imports, prices, inventory sentiment, supplier deliveries, and inventories. However, since we’re dealing essentially with services, thesecategories are defined somewhat differently. For example, the pricing component in themanufacturing survey looks at the costs of raw materials and basic supplies. In contrast,costs in the service sector are more likely to be based on purchasing finished products andother services. Furthermore, exports in the non-manufacturing sector are not about shippinggoods to other countries; they are about selling financial, consulting, entertainment, andaccounting services to foreign companies and individuals. Lastly, there is no overall com-posite index like the ISM manufacturing report. Instead, the non-manufacturing survey usesa business activity index that measures the rate and direction of change in the service sector.
HOW IS IT COMPUTED
The methodology for the non-manufacturing business activity index is much the same asthat used in the manufacturing survey. Questionnaires are sent to more than 370 purchas-ing managers in over 17 industries, including legal services, entertainment, real estate,communications, insurance, transportation, banking, and lodging. The proportion of com-panies queried in each industry depends on how much that sector contributes to GDP.
Respondents are asked if they are experiencing higher activity, lower activity, or nochange for each of the ten components listed here:
• Business activity: Measures changes in the level of business activity in services.
• New orders: Reflects shifts in the number of new orders from customers.
• Employment: Looks at the rate of increase or decrease in employment.
• Supplier deliveries: Tells if deliveries from suppliers are faster or slower.
• Inventories: Monitors the increase or decrease in inventory levels.
• Customer inventories: Rates the level of inventories their clients have.
• Prices: Reports whether member organizations are paying more or less for productsand services.
• Backlog of orders: Measures the amount of backlog of orders, whether growing ordeclining.
• New export orders: Reports changes in the level of orders, requests for services,and other activities to be provided outside the U.S.
• Imports: Measures the rate of change in materials and services imported.
155ISM—Non-Manufacturing Business Supply
06Baumohl_Ch03.21-03.30.qxd 8/3/04 9:18 AM Page 155
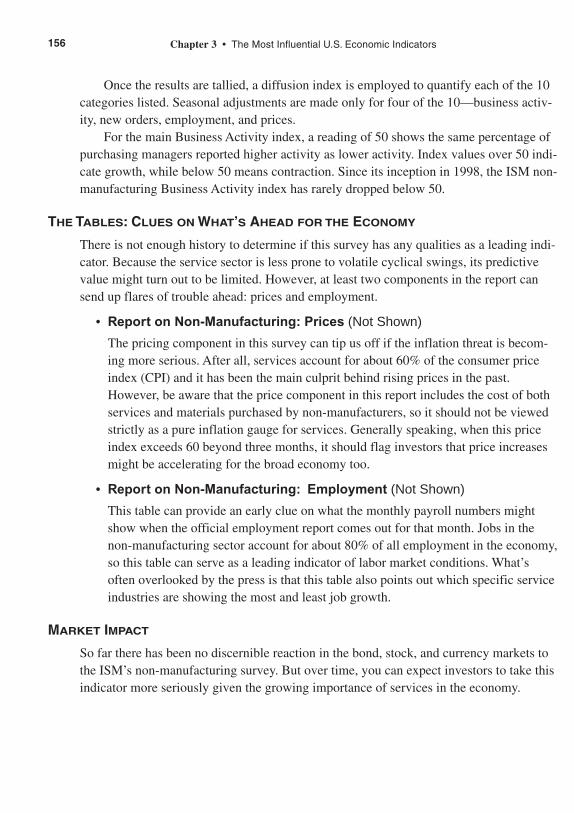
Once the results are tallied, a diffusion index is employed to quantify each of the 10categories listed. Seasonal adjustments are made only for four of the 10—business activ-ity, new orders, employment, and prices.
For the main Business Activity index, a reading of 50 shows the same percentage ofpurchasing managers reported higher activity as lower activity. Index values over 50 indi-cate growth, while below 50 means contraction. Since its inception in 1998, the ISM non-manufacturing Business Activity index has rarely dropped below 50.
THE TABLES: CLUES ON WHAT’S AHEAD FOR THE ECONOMY
There is not enough history to determine if this survey has any qualities as a leading indi-cator. Because the service sector is less prone to volatile cyclical swings, its predictivevalue might turn out to be limited. However, at least two components in the report cansend up flares of trouble ahead: prices and employment.
• Report on Non-Manufacturing: Prices (Not Shown)
The pricing component in this survey can tip us off if the inflation threat is becom-ing more serious. After all, services account for about 60% of the consumer priceindex (CPI) and it has been the main culprit behind rising prices in the past.However, be aware that the price component in this report includes the cost of bothservices and materials purchased by non-manufacturers, so it should not be viewedstrictly as a pure inflation gauge for services. Generally speaking, when this priceindex exceeds 60 beyond three months, it should flag investors that price increasesmight be accelerating for the broad economy too.
• Report on Non-Manufacturing: Employment (Not Shown)
This table can provide an early clue on what the monthly payroll numbers mightshow when the official employment report comes out for that month. Jobs in thenon-manufacturing sector account for about 80% of all employment in the economy,so this table can serve as a leading indicator of labor market conditions. What’soften overlooked by the press is that this table also points out which specific serviceindustries are showing the most and least job growth.
MARKET IMPACT
So far there has been no discernible reaction in the bond, stock, and currency markets tothe ISM’s non-manufacturing survey. But over time, you can expect investors to take thisindicator more seriously given the growing importance of services in the economy.
156 Chapter 3 • The Most Influential U.S. Economic Indicators
06Baumohl_Ch03.21-03.30.qxd 8/3/04 9:18 AM Page 156
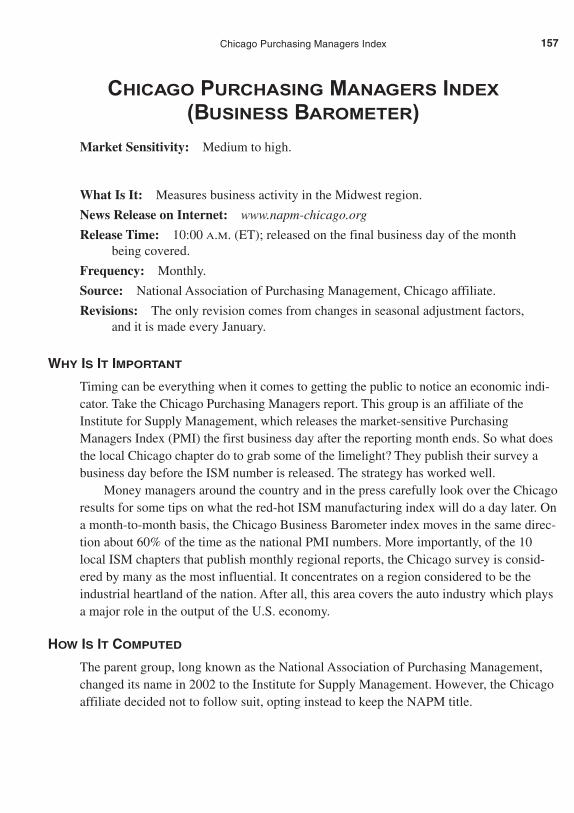
CHICAGO PURCHASING MANAGERS INDEX
(BUSINESS BAROMETER)
Market Sensitivity: Medium to high.
What Is It: Measures business activity in the Midwest region.
News Release on Internet: www.napm-chicago.org
Release Time: 10:00 A.M. (ET); released on the final business day of the monthbeing covered.
Frequency: Monthly.
Source: National Association of Purchasing Management, Chicago affiliate.
Revisions: The only revision comes from changes in seasonal adjustment factors,and it is made every January.
WHY IS IT IMPORTANT
Timing can be everything when it comes to getting the public to notice an economic indi-cator. Take the Chicago Purchasing Managers report. This group is an affiliate of theInstitute for Supply Management, which releases the market-sensitive PurchasingManagers Index (PMI) the first business day after the reporting month ends. So what doesthe local Chicago chapter do to grab some of the limelight? They publish their survey abusiness day before the ISM number is released. The strategy has worked well.
Money managers around the country and in the press carefully look over the Chicagoresults for some tips on what the red-hot ISM manufacturing index will do a day later. Ona month-to-month basis, the Chicago Business Barometer index moves in the same direc-tion about 60% of the time as the national PMI numbers. More importantly, of the 10local ISM chapters that publish monthly regional reports, the Chicago survey is consid-ered by many as the most influential. It concentrates on a region considered to be theindustrial heartland of the nation. After all, this area covers the auto industry which playsa major role in the output of the U.S. economy.
HOW IS IT COMPUTED
The parent group, long known as the National Association of Purchasing Management,changed its name in 2002 to the Institute for Supply Management. However, the Chicagoaffiliate decided not to follow suit, opting instead to keep the NAPM title.
157Chicago Purchasing Managers Index
06Baumohl_Ch03.21-03.30.qxd 8/3/04 9:18 AM Page 157

The Chicago NAPM queries about 200 purchasing managers spread out across aregion that includes Illinois, Indiana, and Michigan, and questions them on businessactivity in their area. Only about half of the respondents actually return their question-naires. Answers received are compiled and a diffusion index is produced based on aweighted average of the five subcomponent indexes: new orders (35% weight), produc-tion (25%), order backlogs (15%), employment (10%), and supplier deliveries (15%).Aside from the overall Business Barometer index, separate measures are provided onprices paid for goods and changes in inventories.
The diffusion index, which is seasonally adjusted, functions like the manufacturingISM survey; a reading above 50 in the Business Barometer index indicates expansion,while one below 50 suggests some contradiction in business activity in this region.
By the way, the responses received by the Chicago affiliate for this survey are not thesame data sent to the national ISM group. Different samples are used for each survey.
THE TABLES: CLUES ON WHAT’S AHEAD FOR THE ECONOMY
• Table Business Barometer
(1) Some traders in the financial markets look to the latest Chicago BusinessBarometer index for an early heads-up on what the more influential ISM indexmight do the next day. The two move in the same direction on a month-to-monthbasis a little better than 60% of the time. However, in terms of the size of theirchanges (as opposed to just relative directions), the two have demonstrated a cor-relation over the last two decades of about 90%. That’s quite high, of course, butfor investors who want to make a quick trade in the market, the more relevantconcern is the direction these indexes move and not so much the level of change.
• Tables New Orders and Backlogs
(2) Given the predominant influence of auto and auto parts manufacturers in thisregion, one can get a sense of motor vehicle demand and production by examin-ing the new orders and orders backlog indices in the Chicago report.
• Tables Supplier Deliveries and Prices Paid
To get a check on inflationary pressures in the industrial economy, follow thetrend in these two categories: prices paid and supplier deliveries. If the priceindex has been rising for more than three months and purchasing managers arenoticing supplier deliveries taking longer, it’s a warning that inflation mightsoon spread to other sectors of the economy.
158 Chapter 3 • The Most Influential U.S. Economic Indicators
06Baumohl_Ch03.21-03.30.qxd 8/3/04 9:18 AM Page 158
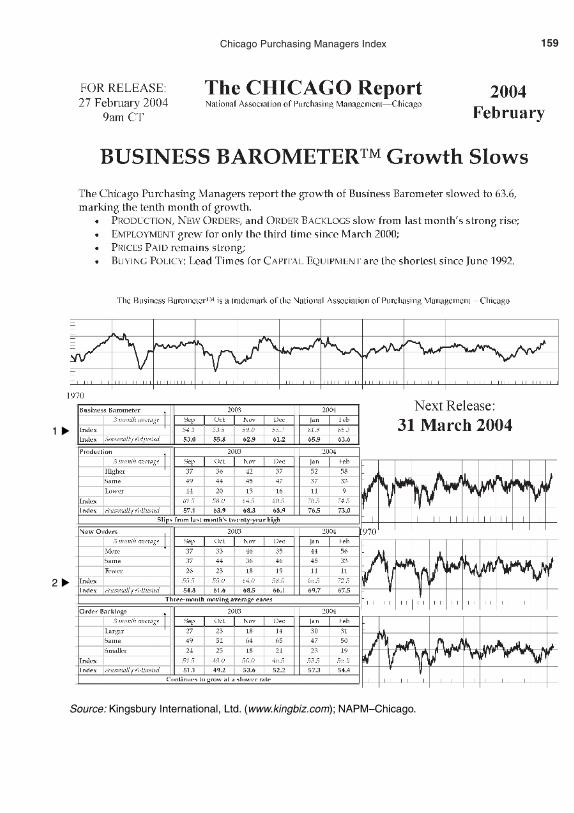
159Chicago Purchasing Managers Index
▲
1
▲
2
Source: Kingsbury International, Ltd. (www.kingbiz.com); NAPM–Chicago.
06Baumohl_Ch03.21-03.30.qxd 8/3/04 9:18 AM Page 159
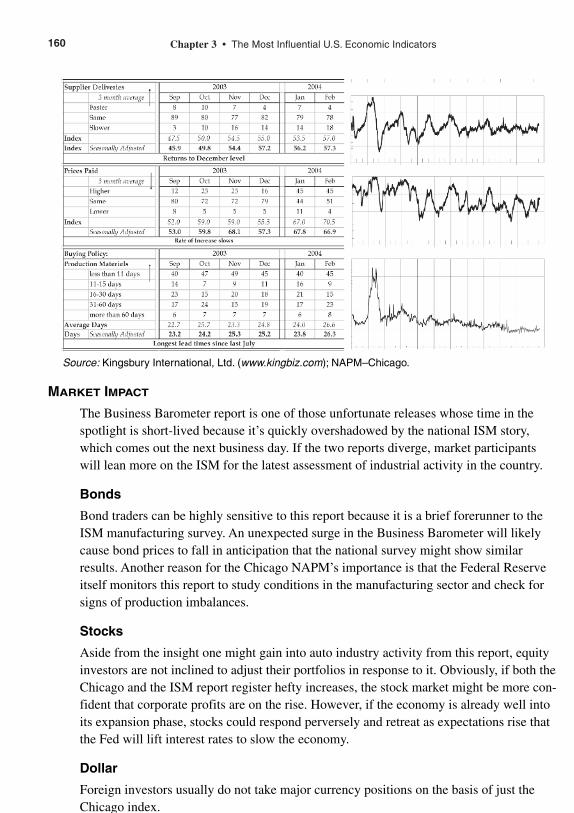
160 Chapter 3 • The Most Influential U.S. Economic Indicators
MARKET IMPACT
The Business Barometer report is one of those unfortunate releases whose time in thespotlight is short-lived because it’s quickly overshadowed by the national ISM story,which comes out the next business day. If the two reports diverge, market participantswill lean more on the ISM for the latest assessment of industrial activity in the country.
Bonds
Bond traders can be highly sensitive to this report because it is a brief forerunner to theISM manufacturing survey. An unexpected surge in the Business Barometer will likelycause bond prices to fall in anticipation that the national survey might show similarresults. Another reason for the Chicago NAPM’s importance is that the Federal Reserveitself monitors this report to study conditions in the manufacturing sector and check forsigns of production imbalances.
Stocks
Aside from the insight one might gain into auto industry activity from this report, equityinvestors are not inclined to adjust their portfolios in response to it. Obviously, if both theChicago and the ISM report register hefty increases, the stock market might be more con-fident that corporate profits are on the rise. However, if the economy is already well intoits expansion phase, stocks could respond perversely and retreat as expectations rise thatthe Fed will lift interest rates to slow the economy.
Dollar
Foreign investors usually do not take major currency positions on the basis of just theChicago index.
Source: Kingsbury International, Ltd. (www.kingbiz.com); NAPM–Chicago.
06Baumohl_Ch03.21-03.30.qxd 8/3/04 9:18 AM Page 160
INDEX OF LEADING ECONOMIC INDICATORS (LEI)
Market Sensitivity: Low to medium.
What Is It: An index designed to predict the direction of the economy.
News Release on Internet: www.globalindicators.org/us/LatestReleases
Home Web Address: www.globalindicators.org
Release Time: 10:00 A.M. (ET). The report is published three weeks after the endof the reporting month.
Frequency: Monthly.
Source: The Conference Board.
Revisions: Usually minor, but can be more significant at times.
WHY IS IT IMPORTANT
Suppose you want to know what’s ahead for the economy but don’t want to waste timegoing through reams of economic statistics. Is there a simpler way to find out how theeconomy might perform in the months ahead? One alternative is to rely on the index ofLeading Economic Indicators (LEI), which is published every month by the ConferenceBoard, a private business research group in New York City. This index is a composite of aselect group of economic statistics that are known to swing up or down well in advanceof the rest of the economy. Thus, by tracking the LEI index, you’ll hopefully know howthe economy will perform in the coming months. Though its record is not perfect, the LEIindex has been successful enough to make the measure worth watching.
Why do we need such a forecasting index in the first place? As any company execu-tive can tell you, business cycles are not neat, well-organized affairs. If they were, itwould be a lot easier to predict corporate sales, employment, and profits. Life, however,is never that simple. Dozens of economic indicators are released on a regular basis, andtogether they draw a remarkably unclear picture of what is happening in the economy. Tomake some sense of this gallimaufry of data, the Conference Board releases an indexcomposed of ten indicators that tend to precede changes in the economy. This index ofleading economic indicators has done a fairly respectable job of signaling peaks andtroughs of an economy some three to nine months down the road.
The LEI index is made up of ten components, seven nonfinancial and three financial.They are described below, along with their relative weight in the index.
161Index of Leading Economic Indicators
06Baumohl_Ch03.21-03.30.qxd 8/3/04 9:18 AM Page 161
Nonfinancial Indicators
• Average hourly workweek in manufacturing (19.7%): Taken from the employmentreport. A sustained rise or fall in the number of hours worked is often a telling signof whether companies will soon hire or fire workers.
• Average weekly initial claims for unemployment (2.5%): Obtained from the joblessclaims report. This series is one of the most sensitive to changing business condi-tions. Initial claims for unemployment benefits climb when the economic climatedeteriorates; the number of claims falls when the economy gets stronger.
• Manufacturers’ new orders for consumer goods and materials (5.9%): Taken fromthe factory orders report. This inflation-adjusted series is a measure of how com-fortable manufacturers are with current inventory levels and projections of futureconsumer demand.
• Vendor performance, or deliveries times index (2.9%): Comes from the Institute forSupply Management’s manufacturing survey. If it takes longer to deliver productsto customers, this suggests that orders are flooding in so quickly that they’re creat-ing bottlenecks and products can’t be shipped as fast. On the other hand, quickerdeliveries are more closely associated with an economic slowdown. As orders drop,a production crunch is less likely and the turnaround time between order and deliv-ery becomes shorter.
• Manufacturers’ new orders for nondefense capital goods (1.5%): Taken from thefactory orders report. Companies are less likely to spend on new capital equipmentand goods if they suspect a business slowdown is looming.
• Building permits for new private homes (2%): Data taken from the housing startsrelease. Because most builders have to file for a permit to begin construction onprivate homes, tracking changes in the number of permits is a good indicator offuture building activity.
• Index of consumer expectations by the University of Michigan (1.9%): Changes inexpectations about future economic conditions and household income can alter con-sumer spending behavior.
Financial Indicators
• Stock prices based on the S&P 500 stock index (2.9%): The stock market has his-torically been a good leading indicator of economic turning points. After all, stockstoday are priced to reflect expected earnings. A rise or fall in the S&P stock index isa barometer of what investors believe the economy will do in the future.
• M2 money supply in real (inflation-adjusted) terms (27.7%): Money supply figuresfrom the Federal Reserve. M2 is one of the broader measures of the money supply andincludes currency, demand deposits, savings accounts, and bank CDs. When M2growth fails to keep pace with inflation, it’s a sign that bank lending is slipping and theeconomy will soon weaken.
162 Chapter 3 • The Most Influential U.S. Economic Indicators
06Baumohl_Ch03.21-03.30.qxd 8/3/04 9:18 AM Page 162
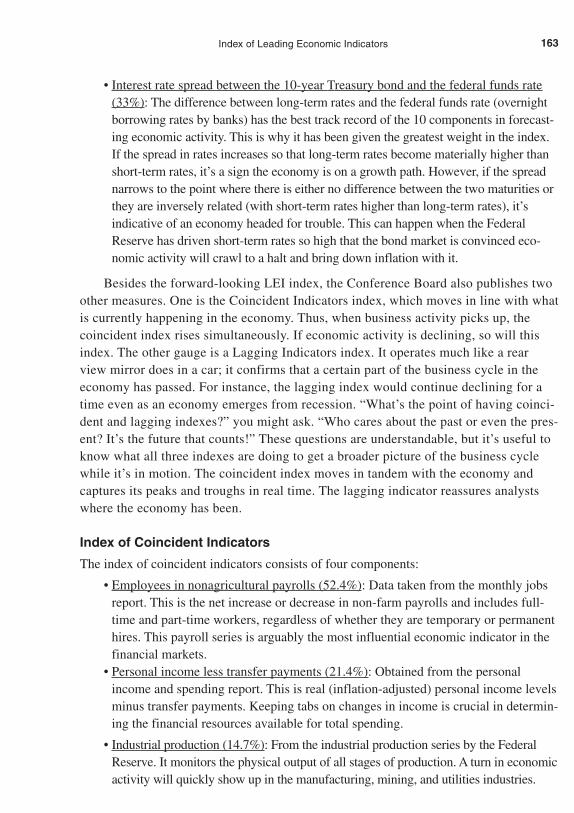
• Interest rate spread between the 10-year Treasury bond and the federal funds rate(33%): The difference between long-term rates and the federal funds rate (overnightborrowing rates by banks) has the best track record of the 10 components in forecast-ing economic activity. This is why it has been given the greatest weight in the index.If the spread in rates increases so that long-term rates become materially higher thanshort-term rates, it’s a sign the economy is on a growth path. However, if the spreadnarrows to the point where there is either no difference between the two maturities orthey are inversely related (with short-term rates higher than long-term rates), it’sindicative of an economy headed for trouble. This can happen when the FederalReserve has driven short-term rates so high that the bond market is convinced eco-nomic activity will crawl to a halt and bring down inflation with it.
Besides the forward-looking LEI index, the Conference Board also publishes twoother measures. One is the Coincident Indicators index, which moves in line with whatis currently happening in the economy. Thus, when business activity picks up, thecoincident index rises simultaneously. If economic activity is declining, so will thisindex. The other gauge is a Lagging Indicators index. It operates much like a rearview mirror does in a car; it confirms that a certain part of the business cycle in theeconomy has passed. For instance, the lagging index would continue declining for atime even as an economy emerges from recession. “What’s the point of having coinci-dent and lagging indexes?” you might ask. “Who cares about the past or even the pres-ent? It’s the future that counts!” These questions are understandable, but it’s useful toknow what all three indexes are doing to get a broader picture of the business cyclewhile it’s in motion. The coincident index moves in tandem with the economy andcaptures its peaks and troughs in real time. The lagging indicator reassures analystswhere the economy has been.
Index of Coincident Indicators
The index of coincident indicators consists of four components:
• Employees in nonagricultural payrolls (52.4%): Data taken from the monthly jobsreport. This is the net increase or decrease in non-farm payrolls and includes full-time and part-time workers, regardless of whether they are temporary or permanenthires. This payroll series is arguably the most influential economic indicator in thefinancial markets.
• Personal income less transfer payments (21.4%): Obtained from the personalincome and spending report. This is real (inflation-adjusted) personal income levelsminus transfer payments. Keeping tabs on changes in income is crucial in determin-ing the financial resources available for total spending.
• Industrial production (14.7%): From the industrial production series by the FederalReserve. It monitors the physical output of all stages of production. A turn in economicactivity will quickly show up in the manufacturing, mining, and utilities industries.
163Index of Leading Economic Indicators
06Baumohl_Ch03.21-03.30.qxd 8/3/04 9:18 AM Page 163
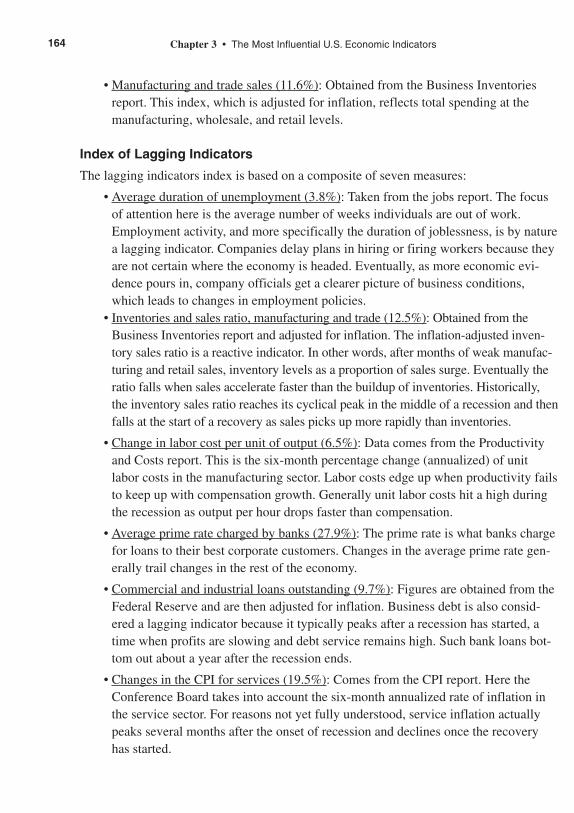
• Manufacturing and trade sales (11.6%): Obtained from the Business Inventoriesreport. This index, which is adjusted for inflation, reflects total spending at themanufacturing, wholesale, and retail levels.
Index of Lagging Indicators
The lagging indicators index is based on a composite of seven measures:
• Average duration of unemployment (3.8%): Taken from the jobs report. The focusof attention here is the average number of weeks individuals are out of work.Employment activity, and more specifically the duration of joblessness, is by naturea lagging indicator. Companies delay plans in hiring or firing workers because theyare not certain where the economy is headed. Eventually, as more economic evi-dence pours in, company officials get a clearer picture of business conditions,which leads to changes in employment policies.
• Inventories and sales ratio, manufacturing and trade (12.5%): Obtained from theBusiness Inventories report and adjusted for inflation. The inflation-adjusted inven-tory sales ratio is a reactive indicator. In other words, after months of weak manufac-turing and retail sales, inventory levels as a proportion of sales surge. Eventually theratio falls when sales accelerate faster than the buildup of inventories. Historically,the inventory sales ratio reaches its cyclical peak in the middle of a recession and thenfalls at the start of a recovery as sales picks up more rapidly than inventories.
• Change in labor cost per unit of output (6.5%): Data comes from the Productivityand Costs report. This is the six-month percentage change (annualized) of unitlabor costs in the manufacturing sector. Labor costs edge up when productivity failsto keep up with compensation growth. Generally unit labor costs hit a high duringthe recession as output per hour drops faster than compensation.
• Average prime rate charged by banks (27.9%): The prime rate is what banks chargefor loans to their best corporate customers. Changes in the average prime rate gen-erally trail changes in the rest of the economy.
• Commercial and industrial loans outstanding (9.7%): Figures are obtained from theFederal Reserve and are then adjusted for inflation. Business debt is also consid-ered a lagging indicator because it typically peaks after a recession has started, atime when profits are slowing and debt service remains high. Such bank loans bot-tom out about a year after the recession ends.
• Changes in the CPI for services (19.5%): Comes from the CPI report. Here theConference Board takes into account the six-month annualized rate of inflation inthe service sector. For reasons not yet fully understood, service inflation actuallypeaks several months after the onset of recession and declines once the recoveryhas started.
164 Chapter 3 • The Most Influential U.S. Economic Indicators
06Baumohl_Ch03.21-03.30.qxd 8/3/04 9:18 AM Page 164
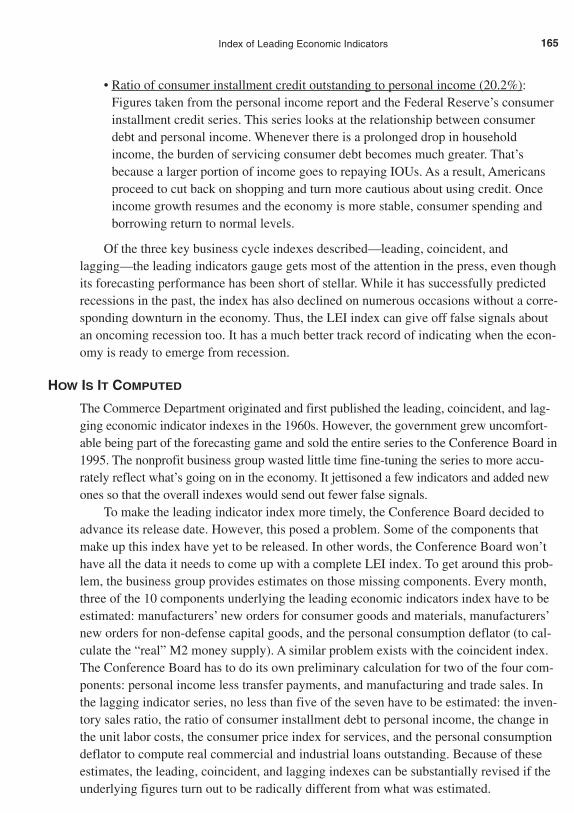
• Ratio of consumer installment credit outstanding to personal income (20.2%):Figures taken from the personal income report and the Federal Reserve’s consumerinstallment credit series. This series looks at the relationship between consumerdebt and personal income. Whenever there is a prolonged drop in householdincome, the burden of servicing consumer debt becomes much greater. That’sbecause a larger portion of income goes to repaying IOUs. As a result, Americansproceed to cut back on shopping and turn more cautious about using credit. Onceincome growth resumes and the economy is more stable, consumer spending andborrowing return to normal levels.
Of the three key business cycle indexes described—leading, coincident, and lagging—the leading indicators gauge gets most of the attention in the press, even thoughits forecasting performance has been short of stellar. While it has successfully predictedrecessions in the past, the index has also declined on numerous occasions without a corre-sponding downturn in the economy. Thus, the LEI index can give off false signals aboutan oncoming recession too. It has a much better track record of indicating when the econ-omy is ready to emerge from recession.
HOW IS IT COMPUTED
The Commerce Department originated and first published the leading, coincident, and lag-ging economic indicator indexes in the 1960s. However, the government grew uncomfort-able being part of the forecasting game and sold the entire series to the Conference Board in1995. The nonprofit business group wasted little time fine-tuning the series to more accu-rately reflect what’s going on in the economy. It jettisoned a few indicators and added newones so that the overall indexes would send out fewer false signals.
To make the leading indicator index more timely, the Conference Board decided toadvance its release date. However, this posed a problem. Some of the components thatmake up this index have yet to be released. In other words, the Conference Board won’thave all the data it needs to come up with a complete LEI index. To get around this prob-lem, the business group provides estimates on those missing components. Every month,three of the 10 components underlying the leading economic indicators index have to beestimated: manufacturers’ new orders for consumer goods and materials, manufacturers’new orders for non-defense capital goods, and the personal consumption deflator (to cal-culate the “real” M2 money supply). A similar problem exists with the coincident index.The Conference Board has to do its own preliminary calculation for two of the four com-ponents: personal income less transfer payments, and manufacturing and trade sales. Inthe lagging indicator series, no less than five of the seven have to be estimated: the inven-tory sales ratio, the ratio of consumer installment debt to personal income, the change inthe unit labor costs, the consumer price index for services, and the personal consumptiondeflator to compute real commercial and industrial loans outstanding. Because of theseestimates, the leading, coincident, and lagging indexes can be substantially revised if theunderlying figures turn out to be radically different from what was estimated.
165Index of Leading Economic Indicators
06Baumohl_Ch03.21-03.30.qxd 8/3/04 9:18 AM Page 165

THE TABLES: CLUES ON WHAT’S AHEAD FOR THE ECONOMY
Just how good is the LEI index at forecasting economic turning points? The answer dependson how high your expectations are for this or any other indicator that professes to predictfuture trends. Some experts poke fun at the LEI for predicting nine of the last six recessions.They criticize its failure to turn down prior to the 1990–1991 recession. In 1995, the indexsent out signals of an imminent contraction in economic activity that never came to pass.
In light of this spotty record, does the LEI index really serve a useful purpose? Theanswer is yes, for several reasons. First, it has been more successful at predicting eco-nomic recoveries than at foreseeing recessions. Second, the Conference Board periodi-cally refines this measure to improve its predictive performance. Third, what the LEIindex offers investors and analysts is a best guess (based on underlying data) of what theeconomy might be doing in the next six to nine months. Nothing more, nothing less.
• Table 1 Summary of Composite Indexes
(1) There are two parts to this table. The top half shows how all three major indexeshave changed in each of the last seven months. Let’s focus on the LEI index.The old rule of thumb was that three consecutive declines in the index was awarning that an economic downturn might begin within three to nine months,and that three unbroken months of increases in the leading index portends theend of recession and the beginning of a recovery within that same time frame.
The Conference Board, however, no longer subscribes to that three-month rule.The reason is that since 1953, the LEI index has actually fallen anywhere fromtwo months to 20 months before the onset of recession. Not a very consistentrecord. So after considerable research, the business group came forward withanother criterion considered to be more precise: a downward move in the LEIindex of more than 2% over six months coupled with declines in a majority ofthe 10 components. The new rule is considered to be a more effective way offorecasting a recession. However, it has one rather important shortcoming. If youhave to wait six months, it becomes less of a leading indicator, because by the endof that period, the economy may already be in recession. As a result, private econ-omists outside the Conference Board have devised their own formulas when usingthe LEI. In one case, the leading index must decline at least four of the sevenmonths and the coincident index has to drop three consecutive months beforethere’s a credible threat that recession is around the corner. There are probablyother ways to utilize these indexes for the purpose of predicting turning points inthe economy, which proves how subjective the science of forecasting can be.
(2) The bottom table lays out for the reader the results of the new forecasting guide-line employed by the Conference Board. It lists the latest six-month percentagechange for the LEI index, as well as for the other two measures. Once again, toget some historical perspective, the organization includes seven months worth ofprevious data.
166 Chapter 3 • The Most Influential U.S. Economic Indicators
06Baumohl_Ch03.21-03.30.qxd 8/3/04 9:18 AM Page 166
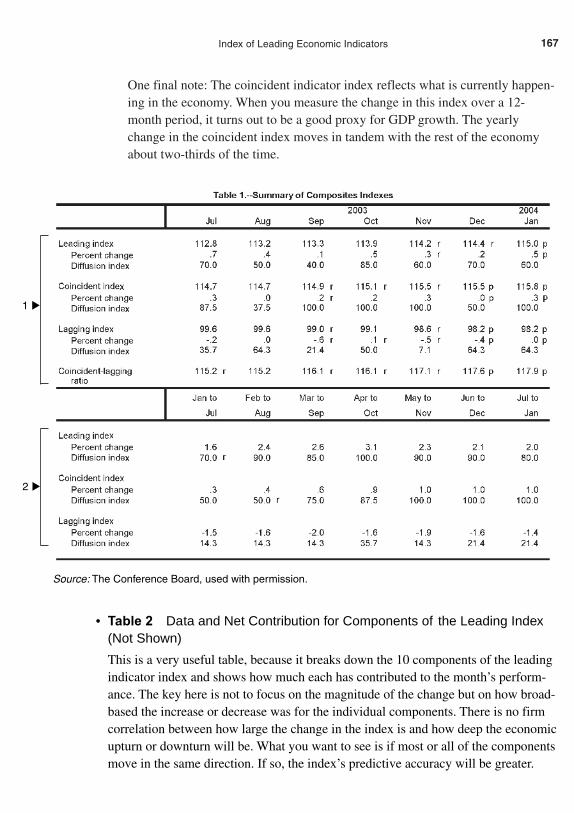
One final note: The coincident indicator index reflects what is currently happen-ing in the economy. When you measure the change in this index over a 12-month period, it turns out to be a good proxy for GDP growth. The yearlychange in the coincident index moves in tandem with the rest of the economyabout two-thirds of the time.
167Index of Leading Economic Indicators
▲
1
▲
2
Source: The Conference Board, used with permission.
• Table 2 Data and Net Contribution for Components of the Leading Index(Not Shown)
This is a very useful table, because it breaks down the 10 components of the leadingindicator index and shows how much each has contributed to the month’s perform-ance. The key here is not to focus on the magnitude of the change but on how broad-based the increase or decrease was for the individual components. There is no firmcorrelation between how large the change in the index is and how deep the economicupturn or downturn will be. What you want to see is if most or all of the componentsmove in the same direction. If so, the index’s predictive accuracy will be greater.
06Baumohl_Ch03.21-03.30.qxd 8/3/04 9:19 AM Page 167

MARKET IMPACT
You would think that the investment community would stop everything just to hear thelatest outcome of an index whose sole purpose is to illuminate what’s ahead for the econ-omy. While the press does devote attention to the LEI index, financial market reactiontends to be subdued. The reason for the muted response is that these leading, coincident,and lagging indicators rarely surprise investors; much of the data that underlies theindexes has already been published. It doesn’t require rocket science to simulate themethodology and come up with a good guess on how the three indexes will perform inadvance. Second, money managers still feel the forecasting track record of this series isshort of divine. As a result, the release sparks little excitement in the markets.
Bonds
Professionals in the fixed-income markets spend little time musing over the leading indi-cators series because it’s considered old news, and they pay virtually no attention to thecoincident and lagging gauges. Perhaps these measures might generate more talk whenthe economy is believed to be close to a turning point, with yields possibly inching up ordown a basis point or two. Otherwise, the market has largely discounted the LEI since thedata underlying it has already been published.
Stocks
The LEI has a slightly greater impact on equity prices. During a recession, stock marketinvestors search for any corroborative signs that point to a recovery and higher profits. Ifthe LEI index posts several consecutive gains, investors feel more confident that an eco-nomic rebound is in the offing and thus will raise their equity holdings. In contrast, anyreport that reinforces the notion that the economy is close to peaking could depress shareprices, since it casts a cloud over future earnings.
Dollar
Assuming that the dollar is not being influenced by other factors, it will likely follow thesame path as the stock market. Consecutive monthly rises in the LEI will encourage for-eign investors to buy dollar-based securities. Stronger U.S. economic growth brings withit higher interest rates and greater profits, all positive influences for the dollar. A series offalling LEI indexes would make the greenback less attractive to hold.
168 Chapter 3 • The Most Influential U.S. Economic Indicators
06Baumohl_Ch03.21-03.30.qxd 8/3/04 9:19 AM Page 168

HOUSING STARTS AND BUILDING PERMITS
Market Sensitivity: Medium.
What Is It: Records the number of new homes being built and permits for futureconstruction.
News Release on Internet: www.census.gov/const/www/newresconstindex.html
Home Web Address: www.census.gov
Release Time: 8:30 A.M. (ET); normally released two or three weeks followingthe month being covered.
Frequency: Monthly.
Source: Census Bureau, Department of Commerce.
Revisions: Modest revisions occur for the preceding two months on housingstarts and for just one month on permits. Seasonal adjustment changes aremade every April, and they cover two years worth of data.
WHY IS IT IMPORTANT
Looking for a single infallible indicator that can foresee the future direction of the econ-omy? Forget it; you won’t find any. However, there is one that comes surprisingly close,and that is housing! Excluding one instance, there has never been a recession in the U.S.at a time when the housing sector stood strong. Only once since World War II did theeconomy contract despite a robust housing market, and that was in 2001. Even then, therecession was brief and not very deep. This impressive track record is why many expertsview homebuilding as one of the most reliable leading indicators of economic activity.Residential real estate is among the first sectors to shut down when the economy nearsrecession, and it is the earliest to bloom when the economy starts to turn up.
What keeps housing so far ahead of the rest of the economy? Mainly its sensitivity tointerest rates. An overheated economy drives interest rates higher. As mortgage ratesclimb, this depresses demand for homes and discourages future construction. Builders arealso less likely to seek construction loans when rates are high. Conversely, when mort-gage rates tumble and home prices decline—events that typically happen during periodsof economic weakness—interest in home buying is rekindled now that it is more afford-able. Builders, in turn, rush back to banks before the cost of borrowing rises again.
Another critical aspect of the homebuilding industry is how powerful an influence ithas on the rest of the economy through what are known as “multiplier effects.” By mul-tiplier effects, we mean that changes in the pace of housing construction can have majorramifications for many other industries. Just look at who benefits when housing isstrong. A jump in residential construction drives up demand for steel, wood, electricity,glass, plastic, wiring, piping, and concrete. The need for skilled construction workers
169Housing Starts and Building Permits
06Baumohl_Ch03.21-03.30.qxd 8/3/04 9:19 AM Page 169

such as bricklayers, carpenters, and electricians soars as well. By one estimate, for every1,000 single-family homes under construction, some 2,500 full-time jobs and nearly$100 million in wages are generated. A vibrant home-selling market also acceleratespurchases of furniture, carpets, home electronics, and appliances. Housing is thus amajor swing industry in the economy because it can affect so many diverse businesses.
In this release, two key gauges on the homebuilding industry are presented: housingstarts and permits.
Housing Starts
Housing starts record how much new ground breaking occurred for residential real estatein the last month. The data on home construction is divided into three types of structures:
• The building of single-family houses: By far the largest component of the three,accounting for 75% of total home building.
• Residences with two to four apartments or units: These are usually townhouses orsmall condos and they make up no more than 5% of the market.
• Structures with five or more units: This category consists mostly of apartmentbuildings and represents about 20% of all residential housing starts. Each apartmentin a high-rise building is considered a single start. Thus, the government counts theconstruction of a 50-unit apartment building as 50 starts.
Housing Permits
Builders planning to construct new homes usually have to file for a permit in advance.Some 95% of all localities in the U.S. require construction firms to obtain such authoriza-tion before the first shovel touches ground. By tracking the issuance of permits, one canget a sense of how much and where future construction activity will take place. Becausehousing permits are such an excellent marker of future homebuilding, it is one of the 10components that make up the Conference Board’s Index of Leading Economic Indicators.
HOW IS IT COMPUTED
The Census Bureau conducts telephone interviews and sends out mailers to builders in19,000 localities across the country during the first two weeks of each month to inquireabout the number of construction starts and permits filed in their regions.
A housing start occurs when excavation begins to set a new foundation for a resi-dence. Adding a room, basement, or new roof to an existing home is not considered ahousing start, although if a home is being totally rebuilt on an existing foundation, it iscounted. The housing figures do not include construction of mobile homes, dormitories,rooming houses, and long-term hotels.
Permits are more straightforward. Each one represents the written authorization abuilder receives from local municipalities to begin construction.
Though figures in the tables are adjusted for seasonal factors, home construction canstill be extremely volatile during the winter season, so it’s important not to rely too much
170 Chapter 3 • The Most Influential U.S. Economic Indicators
06Baumohl_Ch03.21-03.30.qxd 8/3/04 9:19 AM Page 170
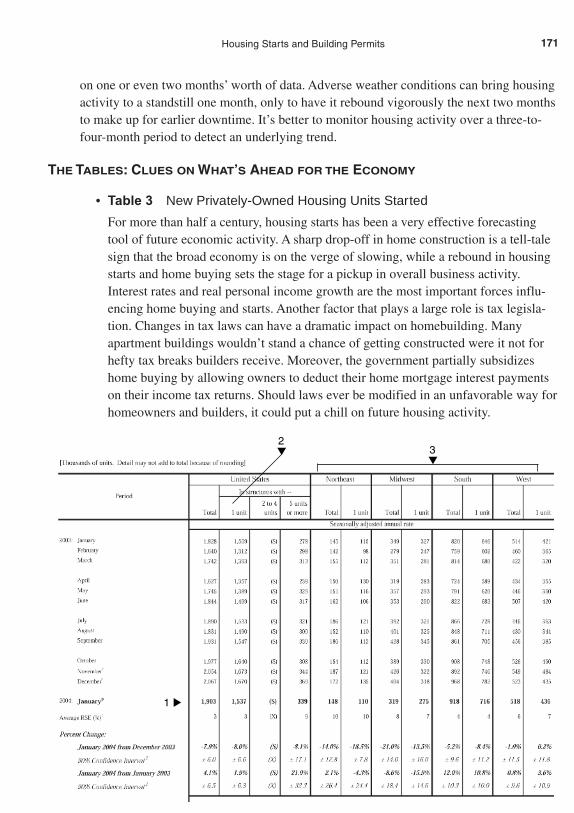
on one or even two months’ worth of data. Adverse weather conditions can bring housingactivity to a standstill one month, only to have it rebound vigorously the next two monthsto make up for earlier downtime. It’s better to monitor housing activity over a three-to-four-month period to detect an underlying trend.
THE TABLES: CLUES ON WHAT’S AHEAD FOR THE ECONOMY
• Table 3 New Privately-Owned Housing Units Started
For more than half a century, housing starts has been a very effective forecastingtool of future economic activity. A sharp drop-off in home construction is a tell-talesign that the broad economy is on the verge of slowing, while a rebound in housingstarts and home buying sets the stage for a pickup in overall business activity.Interest rates and real personal income growth are the most important forces influ-encing home buying and starts. Another factor that plays a large role is tax legisla-tion. Changes in tax laws can have a dramatic impact on homebuilding. Manyapartment buildings wouldn’t stand a chance of getting constructed were it not forhefty tax breaks builders receive. Moreover, the government partially subsidizeshome buying by allowing owners to deduct their home mortgage interest paymentson their income tax returns. Should laws ever be modified in an unfavorable way forhomeowners and builders, it could put a chill on future housing activity.
171Housing Starts and Building Permits
▲
1
2 ▼ 3
▼
06Baumohl_Ch03.21-03.30.qxd 8/3/04 9:19 AM Page 171
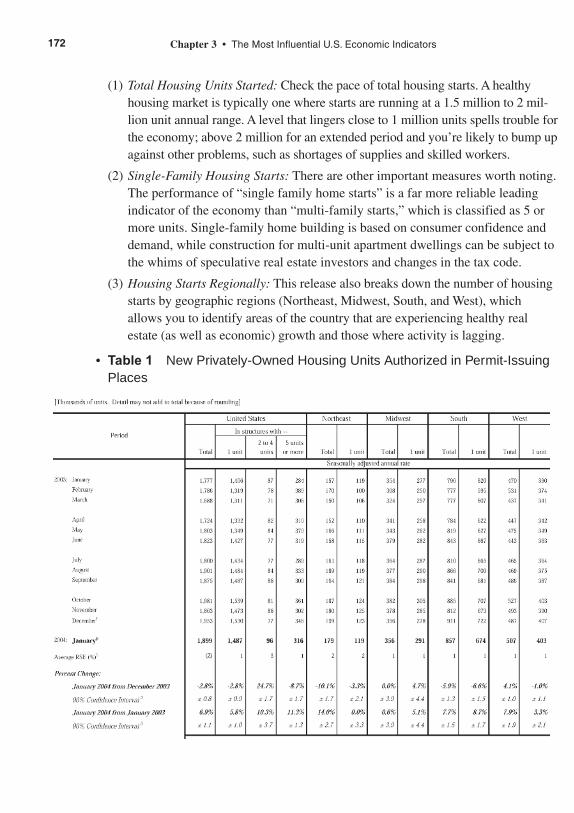
(1) Total Housing Units Started: Check the pace of total housing starts. A healthyhousing market is typically one where starts are running at a 1.5 million to 2 mil-lion unit annual range. A level that lingers close to 1 million units spells trouble forthe economy; above 2 million for an extended period and you’re likely to bump upagainst other problems, such as shortages of supplies and skilled workers.
(2) Single-Family Housing Starts: There are other important measures worth noting.The performance of “single family home starts” is a far more reliable leadingindicator of the economy than “multi-family starts,” which is classified as 5 ormore units. Single-family home building is based on consumer confidence anddemand, while construction for multi-unit apartment dwellings can be subject tothe whims of speculative real estate investors and changes in the tax code.
(3) Housing Starts Regionally: This release also breaks down the number of housingstarts by geographic regions (Northeast, Midwest, South, and West), whichallows you to identify areas of the country that are experiencing healthy realestate (as well as economic) growth and those where activity is lagging.
• Table 1 New Privately-Owned Housing Units Authorized in Permit-IssuingPlaces
172 Chapter 3 • The Most Influential U.S. Economic Indicators
06Baumohl_Ch03.21-03.30.qxd 8/3/04 9:19 AM Page 172

Keep a close eye on building permits because they lead housing starts by roughlyone to three months. While the issuance of a housing permit does not automaticallyresult in new construction, the two series do go hand in hand over time.
In fact, you can actually track the entire construction cycle for homes by looking atTables 1 through 5 in this release:
• Table 1 records the number of permits issued for home construction by type ofhome and region of the country.
• Table 2 counts the number of units where construction permits have been grantedbut where ground breaking has not yet started (not shown).
• Table 3 lists the number of units where construction has begun in the previousmonth.
• Table 4 tracks the number of new housing units undergoing construction as of theend of the previous month (not shown).
• Table 5 notes the number of homes where construction was completed in theprevious month (not shown).
Overall, it takes about six months on average for a single-family house to be builtfrom ground breaking to completion. The cycle for a multi-family dwelling is 10 months to a year.
MARKET IMPACT
Bonds
Good news in housing is often perceived as bad news for players in the fixed incomemarkets. A healthy pickup in housing starts depicts an economy that is robust and whereinflation pressures are likely to accelerate. That can knock bond prices down and causeyields to rise, leading to losses on bond portfolios. Traders prefer weak or falling housingstarts because they portend a slackening economy with less inflation—factors that liftbond prices.
Stocks
Prolonged weakness in housing starts can alarm stock investors since it’s often a precur-sor to a broader downturn in the economy. If, on the other hand, housing activity isvibrant and inflation remains contained, shareholders will view it as a positive sign. Arebound in housing can have a beneficial impact on other businesses as well. This is bull-ish for corporate profits and thus for stock prices. The danger comes when housing startssurge at a time when the rest of the economy is already operating at full speed. Investorsmight withdraw from stocks as worries mount that the Federal Reserve will raise short-term interest rates to curb economic activity.
173Housing Starts and Building Permits
06Baumohl_Ch03.21-03.30.qxd 8/3/04 9:19 AM Page 173

Dollar
Foreign investors are attracted to the U.S. if they can earn a higher rate of return here rel-ative to what they can receive in other countries. Thus, a strong housing report is consid-ered bullish for the dollar because it usually supports a scenario of higher corporateprofits and a firming of U.S. interest rates.
The dollar’s value can slip with weak housing data because it signals slower eco-nomic growth in the future and thus falling interest rates. Under such circumstances, for-eigners might choose to seek out more lucrative investment opportunities outside the U.S.
174 Chapter 3 • The Most Influential U.S. Economic Indicators
06Baumohl_Ch03.21-03.30.qxd 8/3/04 9:19 AM Page 174

EXISTING HOME SALES
Market Sensitivity: Medium.
What Is It: Measures monthly sales of previously owned single-family homes.
News Release on Internet:
Existing Home Sales: www.realtor.org/research.nsf/pages/ehsdata
Housing Affordability Index: www.realtor.org/research.nsf/pages/housinginx
Home Web Address: www.realtor.org
Release Time: 10:00 A.M. (ET); published four weeks after the month beingreported ends.
Frequency: Monthly.
Source: National Association of Realtors.
Revisions: Monthly revisions tend to be small. Annual revisions due toseasonal adjustment factors take place in February and can cover thepreceding three years.
WHY IS IT IMPORTANT
The big gorilla of the residential real estate market is existing home sales. Nearly eightout of every 10 homes purchased are used homes, with the rest being sales of newly con-structed housing. Yet, despite its large size, the actual impact of existing home sales onthe economy is relatively modest because no new ground is broken. No physical invest-ment in construction is made. Buyers and sellers simply transfer ownership of a deed.
If that’s the case, why isn’t this indicator simply ignored by the financial markets?The reason is that sales of existing homes can indirectly stimulate economic activity.Sellers generally use the capital gain from the sale of one house to buy a larger home inorder to meet the needs of an expanded family. Invariably, this means additional spendingon furnishings and appliances. In other cases, buyers will sell their home because it’s toolarge and subsequently purchase a smaller house, leaving more of the capital gain avail-able for spending on discretionary items. A rise in existing home sales also brings ingreater commissions to real estate agents and generates higher income for both movingcompanies and mortgage bankers. Equally important is that an increase in home sales isan unmistakable sign that buyers are confident about their jobs and future income growth.All of these factors make monitoring figures on existing home sales worthwhile.
The downside of this series is that it’s not very timely. Existing home sales are countedat the time of actual closing, which is when the deed finally gets transferred from one owner
175Existing Home Sales
06Baumohl_Ch03.21-03.30.qxd 8/3/04 9:19 AM Page 175

to another. The problem is that it can take one to three months between the moment the ini-tial contract is signed to the time buyers and sellers finally meet to close the deal. By the timeexisting homes sales are recorded and tallied for the monthly release, market conditions inhousing could have already changed. Analysts thus have to be careful when extrapolatingdata from this economic indicator.
HOW IS IT COMPUTED
The organization that releases data on existing home sales is the National Association ofRealtors (NAR), a private trade group of 960,000 agents and brokers from the residentialand commercial real estate market. For the monthly report, it culls information from 400out of the 900 multiple listing boards and local Realtor boards nationwide. The raw fig-ures are then divided into the four census regions: the Northeast, South, Midwest, andWest. The NAR also includes in its monthly release the median and average sale price forhomes at the national level as well as for each of the four geographic regions.
Keep in mind that seasonal factors can influence selling prices; the price tag forhomes is generally highest in the late spring and summer months, when favorableweather conditions and the end of the school year bring increased traffic to real estateoffices. In fact, demand for homes usually peaks in the summer quarter and then declinesgradually for the balance of the year.
Home sales figures are seasonally adjusted and presented in the form of annual rates.
THE TABLES: CLUES ON WHAT’S AHEAD FOR THE ECONOMY
Each month, existing home sales data is summarized onto a single page that con-tains two fact-filled tables: Existing Single-Family Homes Sales and Sales Price ofExisting Single-Family Homes.
• Existing Single-Family Home Sales
(1) Monitoring the volume of sales nationwide is a good way to assess housingdemand in the country. There’s a strong correlation between purchases of exist-ing homes and consumer spending, especially on durable goods such as furnitureand home electronics. Furthermore, a sustained drop—or rebound—in existinghome sales often portends a turning point in the economy. Finally, a big turnoverin home sales produces large capital gains, which can stimulate more home buy-ing and related shopping.
What’s the single biggest force in the economy that influences existinghomes sales? Interest rates. Every one percentage point increase in mortgagerates can reduce existing home sales by 250,000 units.
176 Chapter 3 • The Most Influential U.S. Economic Indicators
06Baumohl_Ch03.21-03.30.qxd 8/3/04 9:19 AM Page 176
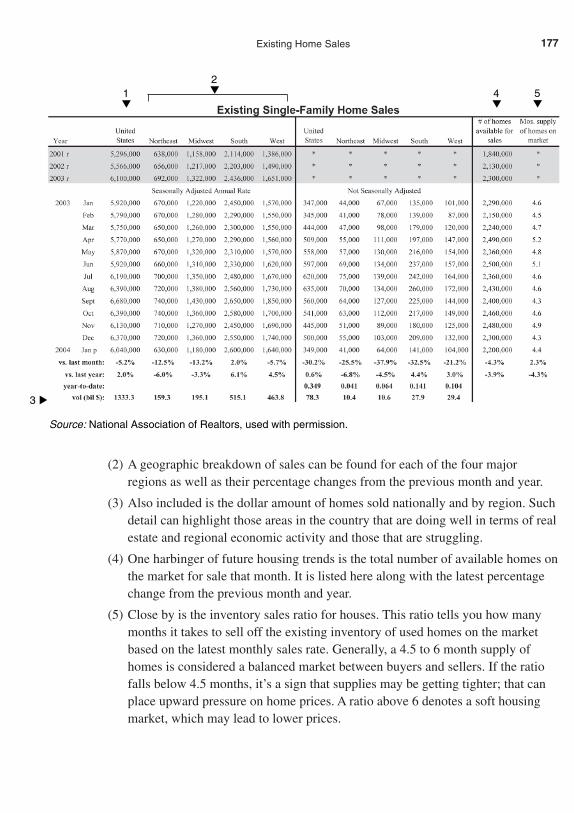
(2) A geographic breakdown of sales can be found for each of the four majorregions as well as their percentage changes from the previous month and year.
(3) Also included is the dollar amount of homes sold nationally and by region. Suchdetail can highlight those areas in the country that are doing well in terms of realestate and regional economic activity and those that are struggling.
(4) One harbinger of future housing trends is the total number of available homes onthe market for sale that month. It is listed here along with the latest percentagechange from the previous month and year.
(5) Close by is the inventory sales ratio for houses. This ratio tells you how manymonths it takes to sell off the existing inventory of used homes on the marketbased on the latest monthly sales rate. Generally, a 4.5 to 6 month supply ofhomes is considered a balanced market between buyers and sellers. If the ratiofalls below 4.5 months, it’s a sign that supplies may be getting tighter; that canplace upward pressure on home prices. A ratio above 6 denotes a soft housingmarket, which may lead to lower prices.
177Existing Home Sales
1 ▼
2 ▼ 4
▼5▼
▲
3
Source: National Association of Realtors, used with permission.
06Baumohl_Ch03.21-03.30.qxd 8/3/04 9:19 AM Page 177
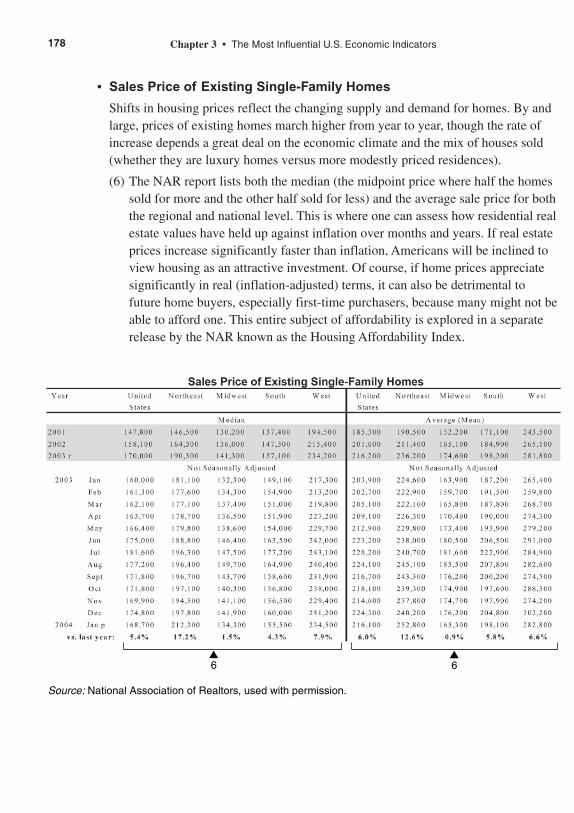
• Sales Price of Existing Single-Family Homes
Shifts in housing prices reflect the changing supply and demand for homes. By andlarge, prices of existing homes march higher from year to year, though the rate ofincrease depends a great deal on the economic climate and the mix of houses sold(whether they are luxury homes versus more modestly priced residences).
(6) The NAR report lists both the median (the midpoint price where half the homessold for more and the other half sold for less) and the average sale price for boththe regional and national level. This is where one can assess how residential realestate values have held up against inflation over months and years. If real estateprices increase significantly faster than inflation, Americans will be inclined toview housing as an attractive investment. Of course, if home prices appreciatesignificantly in real (inflation-adjusted) terms, it can also be detrimental tofuture home buyers, especially first-time purchasers, because many might not beable to afford one. This entire subject of affordability is explored in a separaterelease by the NAR known as the Housing Affordability Index.
178 Chapter 3 • The Most Influential U.S. Economic Indicators
▲6
▲6
Source: National Association of Realtors, used with permission.
06Baumohl_Ch03.21-03.30.qxd 8/3/04 9:19 AM Page 178

• Housing Affordability Index
Just how expensive is it for Americans to buy a home? The NAR assembles a tableevery month that measures the affordability of purchasing a home given the existingeconomic climate. This series, called the Housing Affordability Index, can also befound on the NAR Web site (www.realtor.org/research.nsf/pages/housinginx).Though this measure has virtually no impact on the stock and bond markets, it isincluded here because home purchases are the single biggest investment householdsmake in their lifetime. A favorable combination of economic conditions, such as ris-ing personal income and low mortgage rates, makes home buying more affordableand thus sets the stage for more real estate sales in the future.
179Existing Home Sales
7▼
Source: National Association of Realtors, used with permission.
06Baumohl_Ch03.21-03.30.qxd 8/3/04 9:19 AM Page 179

(7) The Housing Affordability Index tells whether or not a typical family can qual-ify for a mortgage loan on a typical home. A typical home is defined here as thenational median price of an existing single-family home as calculated by NAR.The outcome can be found with the columns on the right of the page. An indexvalue of 100 means that a median-income family has exactly enough to qualifyfor a mortgage on a median-priced home. An index above 100 signifies that afamily earning the median income has more than enough to qualify for a mort-gage loan on a median-priced home, assuming a 20% down payment. Forexample, a composite index of 130 means a family earning the median familyincome has 130% of the income necessary to qualify for a conventional loancovering 80% of a median-priced existing single-family home.
The NAR assumes a maximum qualifying ratio of 25%, where monthly principal andinterest payments cannot exceed 25% of the median family’s monthly income.
MARKET IMPACT
Bonds
Reaction to existing homes sales is muted unless the economy is edging closer to over-drive and facing an eruption of inflation pressures. Any unexpected jump in existinghome sales could easily scare away bond investors, a scenario that will lower bond pricesand raise yields.
A sudden plunge in sales might foreshadow a slowdown in economic activity in themonths ahead, which would support higher bond prices and lower rates. Thus, to a largeextent, the response to this release really depends on the economic backdrop.
Stocks
From the standpoint of corporate profits, investors prefer to see existing home sales stayat a high level. Housing is a major industry upon which many other businesses rely. Astrong report will buoy stock values, while a weak report may undermine them. However,if strength in housing fires up inflation, the Federal Reserve will eventually intervenewith higher rates, and such a prospect can upset the equity market.
Dollar
Foreign investors monitor existing home sales because it is one of the dominant indica-tors of consumer spending and can potentially influence interest rates. Generally, the dol-lar will remain firm or appreciate as long as existing home sales do not stumble into anextended downswing. For that would lower rates and raise uncertainties about futurestock prices, both of which can weaken demand for U.S. currency.
180 Chapter 3 • The Most Influential U.S. Economic Indicators
06Baumohl_Ch03.21-03.30.qxd 8/3/04 9:19 AM Page 180

NEW HOME SALES
Market Sensitivity: Medium.
What Is It: Tracks the sales of new single-family homes.
News Release on Internet: www.census.gov/newhomesales
Home Web Address: www.census.gov
Release Time: 10 A.M. (ET); released about four weeks after the reportingmonth ends.
Frequency: Monthly.
Source: Census Bureau, Department of Commerce.
Revisions: There are frequent revisions with the data, and they can cover thepreceding three months.
WHY IS IT IMPORTANT
An abundance of economic indicators deal with housing. With every month comes newsof housing starts and permits, sales of existing homes, construction spending, and nowthe topic of this section, new home sales. Each offers a different perspective on this all-important industry. Housing starts, or new home construction, is essentially a productionfigure. That is, it’s less a predictor of consumer spending and more a reflection of busi-ness confidence—specifically, builder expectations of future home buying trends.Existing homes sales, on the other hand, provide better insight into consumer financialhealth and their shopping mood. The downside of existing home sales is that its effects onthe economy are rather limited. Nothing new has to be constructed since the house isalready in place. Secondly, existing home sales has only limited value as a predictiveindicator because it is counted only when the transaction formally closes and the title isexchanged, a process that can take several months after the initial contract.
In this section we will look at new home sales, which is considered a more timely meas-ure of conditions in the housing market and a better indicator of future economic activity. Forinstance, the sale of a newly constructed house is recorded not at closing (as is the case withexisting homes), but when the initial contract is signed. True, you don’t know if all thosesigned contracts to purchase a home make it all the way to final closing, but those that don’tare rare and are statistically insignificant. The more interesting issue is how could the sale ofnew homes, which makes up a tiny 15% of the residential real estate market, have such aprofound effect on the economy? The answer is that they generate lots of investment, jobs,spending, and production. Builders seek construction loans; purchase property; order lumber,glass, wiring, concrete and plumbing; and hire a variety of skilled workers to help put up ahome. New homes also tend to be more expensive than existing homes because buildersoften include many modern amenities. In addition, when buyers move in, it triggers yetanother round of spending on new furniture and other accessories for the next 12–18 months.
181New Home Sales
06Baumohl_Ch03.21-03.30.qxd 8/3/04 9:19 AM Page 181

There is one other reason why top money managers examine this indicator on newhome sales closely. If consumer spending is about to change direction, you’ll see it turnhere first. Purchasing a home is the single biggest expense a household will undertake,and unless prospective buyers are content with their income, job security, and the eco-nomic outlook, many will be reluctant to buy. Should home buying begin to wane, it willset off alarm bells in many sectors of the economy. Banks will cut back on constructionloans for fear builders might have a hard time repaying them. Without the necessary capi-tal, new residential investment will fall and that will suppress demand for building sup-plies, appliances, and construction workers. Suddenly the danger of a serious economicslowdown begins to loom.
Ironically, it is in the midst of recession that the housing sector comes back to lifeand helps lift the rest of the economy out of its stupor. Mortgage rates fall during an eco-nomic downturn, and at some point drop to a level where they make housing more attrac-tive again. As interest in home buying revives, builders find a warmer reception frombank loan officers who, after a long dry spell of making few loans, are eager to lendagain. Moreover, in a recession, there is ample supply of labor and materials. As a conse-quence, construction quickly picks up speed to satisfy the growing demand for newhomes. Given the multiplier effects of a rebound in housing, it’s only a matter of weeksbefore other industries benefit as well.
HOW IS IT COMPUTED
To come up with figures on new home sales, the Census Bureau relies on data from its hous-ing permits series. Why look at permits? Because builders often file for construction permitsonly after they’ve collected a deposit or received a signed contract from a home buyer.
New home sales figures generally undergo revisions, sometimes substantial ones, ifparts of the country have been exposed to unusual weather patterns. As a result, it’s nec-essary to look at the data for at least three to four months before one can decipher a trendin new home sales.
THE TABLES: CLUES ON WHAT’S AHEAD FOR THE ECONOMY
• Table 1 New Houses Sold and For Sale
New home sales get center stage when the economy is believed to be near a turningpoint. In such instances, experts are looking for evidence that prospective homebuyers are ready to jump into the housing market and lock in the lowest possiblemortgage rate, a point that often occurs at the bottom of the business cycle. A pick-up in new home sales is often followed a month or two later by an increase in salesof existing homes. As the pace of home buying quickens, demand for supplies andservices will stimulate activity in other home-related businesses.
182 Chapter 3 • The Most Influential U.S. Economic Indicators
06Baumohl_Ch03.21-03.30.qxd 8/3/04 9:19 AM Page 182
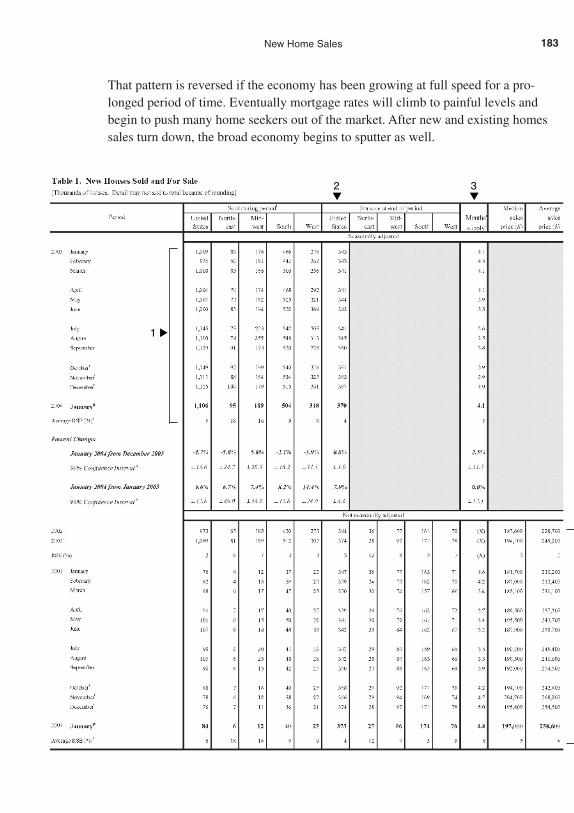
183New Home Sales
That pattern is reversed if the economy has been growing at full speed for a pro-longed period of time. Eventually mortgage rates will climb to painful levels andbegin to push many home seekers out of the market. After new and existing homessales turn down, the broad economy begins to sputter as well.
2 ▼
3 ▼
▲ 4
▲
1
06Baumohl_Ch03.21-03.30.qxd 8/3/04 9:19 AM Page 183

(1) New Houses Sold: This is the headline number where you’ll find the monthlytally of new homes sold at an annualized rate for the entire U.S. and the fourgeographic regions: Northeast, Midwest, South, and West. Any discerniblechange in trend sales here can act as an early warning indicator that the economyis losing steam or gearing up for recovery.
(2) New Houses for Sale at End of Period: This table provides the latest in the sup-ply of new homes being offered for sale. It stands to reason that the inventory ofnew homes ready for sale would shrink in a buoyant housing market andincrease when buying turns sluggish. Of course, a great deal depends on howquickly builders are grinding out new homes during these periods. Clearly, if theinventory of unsold homes expands too much, builders will scale down futureconstruction until the market improves again.
(3) Months’ Supply: The all-important inventory-sales ratio of new homes tellsyou the number of months it will take to sell the current supply of new homesbased on the most recent sales pace. The I/S ratio is a good predictor of futurehome construction. When homes sales are brisk, the month’s supply ratio willusually stabilize or fall. Generally, if it drops to four months’ worth of supplyor less, builders are sufficiently encouraged to keep investing in new con-struction. Conversely, if sales are declining or there are just not enough buy-ers to absorb all the new homes being built, the stock of new homes canclimb past six months’ worth of supply. This usually foreshadows a drop innew home construction.
(4) Median and Average Sales Prices: Check here to see the latest median andaverage price of new homes. Normally, the value of new homes appreciatesfaster than existing homes because they have more modern features. If prices move steadily higher over several months, it’s evidence of a vibranthousing sector. It’s also interesting to compare the rise in home prices withinflation. If new home prices increase significantly faster than inflation,Americans will be inclined to view housing as an attractive medium and long-term investment.
184 Chapter 3 • The Most Influential U.S. Economic Indicators
06Baumohl_Ch03.21-03.30.qxd 8/3/04 9:19 AM Page 184
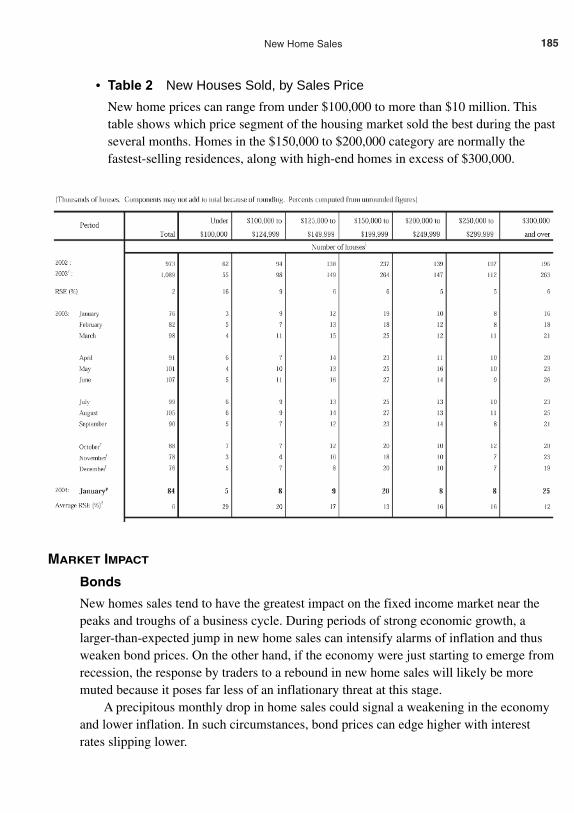
185New Home Sales
MARKET IMPACT
Bonds
New homes sales tend to have the greatest impact on the fixed income market near thepeaks and troughs of a business cycle. During periods of strong economic growth, alarger-than-expected jump in new home sales can intensify alarms of inflation and thusweaken bond prices. On the other hand, if the economy were just starting to emerge fromrecession, the response by traders to a rebound in new home sales will likely be moremuted because it poses far less of an inflationary threat at this stage.
A precipitous monthly drop in home sales could signal a weakening in the economyand lower inflation. In such circumstances, bond prices can edge higher with interestrates slipping lower.
• Table 2 New Houses Sold, by Sales Price
New home prices can range from under $100,000 to more than $10 million. Thistable shows which price segment of the housing market sold the best during the pastseveral months. Homes in the $150,000 to $200,000 category are normally thefastest-selling residences, along with high-end homes in excess of $300,000.
06Baumohl_Ch03.21-03.30.qxd 8/3/04 9:19 AM Page 185

Stocks
The volatile nature of this series and its small proportion of the residential real estatemarket keeps it from generating much excitement among equity investors. Yet, because itis widely known as a leading indicator, the new home sales series becomes more influen-tial whenever analysts suspect the economy nears a turning point.
Dollar
Traders in the currency markets have not shown much sensitivity to new home sales.There just isn’t much of a correlation between the performance of new home sales and achange in the dollar’s value.
186 Chapter 3 • The Most Influential U.S. Economic Indicators
06Baumohl_Ch03.21-03.30.qxd 8/3/04 9:19 AM Page 186

HOUSING MARKET INDEX: NATIONAL ASSOCIATION OF
HOME BUILDERS (NAHB)
Market Sensitivity: Low.
What Is It: Assesses the current market for new single-family home sales alongwith builder expectations of future trends.
Home Web Address: www.nahb.org (type “HMI” in the search box)
Release Time: 1:00 P.M. (ET); published mid-month and covers activity for thefirst half of the same month.
Frequency: Monthly.
Source: National Association of Home Builders.
Revisions: They tend to be minor.
WHY IS IT IMPORTANT
It is a truism in economics that as the housing industry goes, so goes the rest of the econ-omy. That’s why you’ll find so many economic indicators dedicated to tracking the resi-dential real estate market. Among the many reports, however, is one indicator that oftenslips below the radar screen, despite its talent for being among the best predictors offuture housing activity. The Housing Market Index (HMI), published every month by theNational Association of Home Builders, possesses all the characteristics of a big-timemarket mover. It is based on responses directly from homebuilders who have the bestpulse on current and future homebuilding trends. Furthermore, the HMI is released in thesame month it reports on, long before any of the other major monthly housing reports areout. Finally, this housing index has a proven track record of being a decent leading indi-cator of future home sales. Given these attributes, you would think money managerswould spring into action after the report is released. However, that is not the case. Forone, the size of the statistical sample used by the association is fairly small; the survey isbased on the responses from 400 builders out of a total membership of 72,000. Second,the data is not broken down regionally, making it hard to identify areas of the country thatare experiencing strong or weak demand for new single-family homes.
HOW IS IT COMPUTED
For 20 years, the National Association of Home Builders has conducted a monthly surveyasking roughly 900 members (about half of which answer on time) the following questions:
• What are the current conditions for new single-family home sales? (Good, fair, orpoor?)
• What are your expectations of new single-family home sales for the next sixmonths? (Good, fair, or poor?)
187Housing Market Index: NAHB
06Baumohl_Ch03.21-03.30.qxd 8/3/04 9:19 AM Page 187

• Rate the traffic of prospective home buyers you are seeing at new home sites. (High to very high, average, or low to very low?)
The survey results are based on answers received in the first 10 days of every month.Scores are calculated using a diffusion index for each question and are adjusted for sea-sonal factors. The index has a scale that ranges from 0 to 100, where 0 means virtuallyeveryone agreed conditions were poor and 100 indicates everyone believed that condi-tions were good. An index of 50 means the number of “good” responses received frombuilders is about the same as the number of “poor” responses. Thus, any index numberabove 50 suggests more builders viewed conditions as “good” rather than “poor.”
The centerpiece of the report is the overall Housing Market Index, which is computedas a weighted average of the results from the three main questions listed above. Answers tothe first query on current conditions represents 59% of the HMI index; expected sales forthe next six months accounts for 14%, and the traffic of home seekers is 27%.
THE TABLES: CLUES ON WHAT’S AHEAD FOR THE ECONOMY
The NAHB has two separate locations on its Web site for information on the HousingMarket Index. One is the press release with the latest monthly analysis, while the othercontains all the current and historical data points on the Housing Market Index. The easiestway to locate both is to simply type HMI in the search box on NAHB’s home page.
188 Chapter 3 • The Most Influential U.S. Economic Indicators
Source: National Association of Home Builders, used with permission.
06Baumohl_Ch03.21-03.30.qxd 8/3/04 9:19 AM Page 188
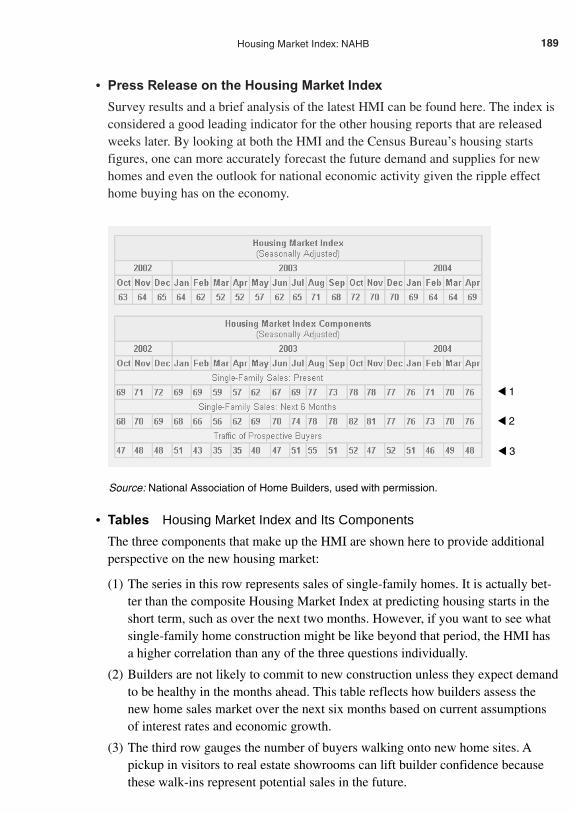
• Press Release on the Housing Market Index
Survey results and a brief analysis of the latest HMI can be found here. The index isconsidered a good leading indicator for the other housing reports that are releasedweeks later. By looking at both the HMI and the Census Bureau’s housing starts figures, one can more accurately forecast the future demand and supplies for newhomes and even the outlook for national economic activity given the ripple effecthome buying has on the economy.
189Housing Market Index: NAHB
• Tables Housing Market Index and Its Components
The three components that make up the HMI are shown here to provide additionalperspective on the new housing market:
(1) The series in this row represents sales of single-family homes. It is actually bet-ter than the composite Housing Market Index at predicting housing starts in theshort term, such as over the next two months. However, if you want to see whatsingle-family home construction might be like beyond that period, the HMI hasa higher correlation than any of the three questions individually.
(2) Builders are not likely to commit to new construction unless they expect demandto be healthy in the months ahead. This table reflects how builders assess thenew home sales market over the next six months based on current assumptionsof interest rates and economic growth.
(3) The third row gauges the number of buyers walking onto new home sites. Apickup in visitors to real estate showrooms can lift builder confidence becausethese walk-ins represent potential sales in the future.
▲ 1
▲ 2
▲ 3
Source: National Association of Home Builders, used with permission.
06Baumohl_Ch03.21-03.30.qxd 8/3/04 9:19 AM Page 189

MARKET IMPACT
Bonds
Economic indicators on home construction have an impact on bonds. However, theNAHB’s Housing Market Index, despite its early appearance, appears to be overshad-owed by other, better-known government releases on building activity. These includehousing starts and new home sales, both of which are based on larger surveys. As a result,the HMI does not provoke much of a reaction in the bond market.
Stocks
Money managers might review the report but they generally do not trade based on theinformation.
Dollar
Foreign exchange traders do not follow the NAHB release.
190 Chapter 3 • The Most Influential U.S. Economic Indicators
06Baumohl_Ch03.21-03.30.qxd 8/3/04 9:19 AM Page 190

WEEKLY MORTGAGE APPLICATIONS SURVEY AND THE
NATIONAL DELINQUENCY SURVEY
Market Sensitivity: Medium.
What Is It: Tracks the number of Americans applying for a mortgage to buy ahome or refinance an existing mortgage.
News Release on Internet: www.mortgagebankers.org/news/
Home Web Address: www.mortgagebankers.org
Release Time: 7 A.M. (ET); comes out every Wednesday and covers the weekending the previous Friday. A separate report, the National DelinquencySurvey, is published two and a half months after each quarter.
Frequency: Weekly.
Source: Mortgage Bankers Association (MBA).
Revisions: Few revisions are made.
WHY IS IT IMPORTANT
The key to any forecast on the economy is the consumer. If you can correctly assess howmuch people will spend in the months ahead, odds are you’ll do fairly well predicting eco-nomic growth. Get consumer behavior right, and everything else usually falls into place. Ifyou miss this critical source of demand in the economy, your projections will almost cer-tainly be off the mark. As a result, professional forecasters look for any piece of economicdata they can find that helps them foresee changes in consumer spending. One of the bestpieces of information turns out to be the Weekly Mortgage Applications Survey by theMortgage Bankers Association. A pickup in mortgage applications is very bullish for theeconomy in two respects. It serves as evidence that home buying interest has accelerated,which should be viewed as a positive for the residential real estate market and for theeconomy as a whole. Second, in a climate of falling mortgage rates, homeowners oftenjump at the chance to fill out a new application to refinance their existing mortgages. Byswitching from a high-cost mortgage to one that allows for lower monthly payments, con-sumers end up with a savings windfall, money that can be used to pay off other debt (suchas car loans and credit card bills) or fire up a new round of consumer spending.
Reading the Weekly Mortgage Applications Survey is easy. It contains variousindexes, each measuring a different part of the residential mortgage market. However, thetwo that grab the most attention are the purchase index and the refinance index. Becausemost home buyers have to apply for a mortgage before they can buy a home, changes inthe purchase index can tell analysts where the housing market is headed. Rarely has the
191Weekly Mortgage Applications Survey and the National Delinquency Survey
06Baumohl_Ch03.21-03.30.qxd 8/3/04 9:19 AM Page 191

economy found itself in trouble when home buying is strong. As for the refinance index,an increase in these applications often leads to greater household spending, which, inturn, fuels more economic growth.
Here’s a list of the main indexes in the Weekly Mortgage Applications Survey and adescription of what they cover:
1. The Market Composite Index: This is the best indicator of total mortgage appli-cation activity. It tracks all mortgage applications during the latest week, regard-less of whether it was to purchase or refinance a home. The index coversconventional and government-backed mortgage applications, as well as majortypes of mortgage maturities: 30-year fixed, 15-year fixed, and adjustable ratemortgages.
2. Purchase Index: Refers to all mortgage applications filed for the sole purpose ofbuying a private home, using either a conventional or government loan.
3. Refinance Index: Covers all mortgage applications used to refinance an existingmortgage. It also includes conventional and government refinances.
4. Conventional Index: Tracks all conventional purchase and refinance mortgageapplications, but excludes those with government guarantees.
5. Government Index: Measures activity with all Federal Housing Administration(FHA) and Veterans Administration (VA) loans. FHA and VA loans carry a federalgovernment guarantee.
In addition to these indexes, the survey computes the latest average contract interestrate for 30-year fixed mortgages, 15-year fixed mortgages, and 1-year adjustable ratemortgages (ARMs).
HOW IS IT COMPUTED
Each week, the MBA polls 20 to 25 mortgage bankers, commercial banks, and thrifts onthe latest mortgage activity. The survey manages to cover about 40% of the U.S. retailresidential mortgage market.
The answers are adjusted for seasonal and holiday effects, but it’s also available in aseasonally unadjusted form.
THE TABLES: CLUES ON WHAT’S AHEAD FOR THE ECONOMY
The MBA makes the press release available on the Web at no cost. It contains a usefulsummary of all the key indexes, plus a brief analysis. Access to tables, however, isthrough subscription only. We’ll stick to information that can be found in the publiclyavailable press release for both the Weekly Mortgage Applications Survey and theNational Delinquency Survey.
192 Chapter 3 • The Most Influential U.S. Economic Indicators
06Baumohl_Ch03.21-03.30.qxd 8/3/04 9:19 AM Page 192

193Weekly Mortgage Applications Survey and the National Delinquency Survey
• News Release Weekly Mortgage Applications Survey
The purchase index has proven to be a reliable indicator of future housing activity,especially with existing home sales, which dominate the residential real estate mar-ket. Sales of previously owned homes are counted only when the purchase closes,which is normally a month or two after the contract is signed. Therefore, a jump inthe purchase index usually means higher resales in the coming months. The pur-chase index also serves as a leading indicator of consumer spending, since buyerswant to outfit their new homes with furniture and appliances.
The refinance index is the best-known measure of mortgage refinancing activity.Anyone trying to forecast consumer spending has to consider the volume of mort-gage refinancing applications.
• News Release National Delinquency Survey (NDS) (Not Shown)
In addition to the Mortgage Applications Survey, the MBA publishes a quarterly reporton mortgage delinquencies and home foreclosures known as the National DelinquencySurvey. Economists read it to see if economic conditions have deteriorated to the pointwhere households have difficulty meeting their mortgage obligations.
Source: Mortgage Bankers Association, used with permission.
06Baumohl_Ch03.21-03.30.qxd 8/3/04 9:19 AM Page 193

Investors study the data to gauge the condition of the U.S. mortgage market and tocheck on the credit quality portfolio of banks and other mortgage lenders.
The results of the National Delinquency Survey can be found on the same MBAWeb site. By definition, the NDS looks at the percentage of all mortgages that aredelinquent and to what extent: 30 days overdue, 60 days overdue, and 90 days over-due. Normally, after 90 days, the lender can initiate foreclosure proceedings, and theMBA includes a percentage of those as well.
Over the years, a few trends have emerged from the National Delinquency Survey.First, during moments of great financial stress, Americans place a priority on keepingtheir mortgage payments on time. They will usually delay payments on credit cardsand other types of debts in order to have sufficient funds to keep their home. Shouldhousehold finances worsen further, 30-day delinquencies on home payments willpick up, and this will shortly be accompanied by a jump in 60-day and 90-day delin-quencies as well. The last to rise are foreclosure rates. Generally, banks and othermortgage lenders are reluctant to take the home repossession route because theprocess can be costly and time-consuming. However, once the number of foreclo-sures increases, it sets in motion a process that’s hard to turn around even if the econ-omy improves. Foreclosure rates lag behind improvements in delinquency ratesbecause it takes so long for repossessions to work their way through the legal system.
MARKET IMPACT
Bonds
Over the last few years, the Weekly Mortgage Applications Survey has taken on greatersignificance among bond traders and economists for its connection to future consumerspending. The report itself tends to have only a modest impact on the financial markets.However, there are occasions when investors holding bonds might fret that a sharpincrease in home buying portends greater consumer outlays and brisk economic growth—events that can lead to higher inflation. Such survey results therefore might trigger a mildsell-off, particularly if the refinancing index unexpectedly surges. As for the quarterlyNational Delinquency Survey, bond traders show little interest in this report.
Stocks
Equity investors regularly monitor the Weekly Mortgage Application Survey as well as theNational Delinquency Survey, but for different reasons. The former can shed light on howhousing and consumer spending will perform in the months ahead, while the latter is stud-ied to check on the quality of loan portfolios held by banks and mortgage lenders. Earningsat financial institutions can suffer if delinquencies and loan losses begin to mount.
Dollar
There’s no direct reaction in foreign exchange markets to either report.
194 Chapter 3 • The Most Influential U.S. Economic Indicators
06Baumohl_Ch03.21-03.30.qxd 8/3/04 9:19 AM Page 194

CONSTRUCTION SPENDING
Market Sensitivity: Low.
What Is It: Spending on public and private construction.
News Release on Internet: www.census.gov/constructionspending
Home Web address: www.census.gov
Release Time: 10 A.M. (ET); released five weeks following the reported month.
Frequency: Monthly.
Source: Census Bureau, Department of Commerce.
Revisions: Can be major. The two previous months are revised with each newrelease. In addition, there are annual benchmark changes every May that cango back two years or more.
WHY IS IT IMPORTANT
Up to now, economic indicators that gauge construction activity have focused on residentialreal estate trends. The construction spending report, however, looks at both residential andnonresidential building. It is the most comprehensive barometer of building activity in theU.S. and is well worth watching because of its large contribution to GDP. The total con-struction industry alone accounts for nearly 9% of all economic activity. That doesn’t eveninclude all the other businesses whose fortunes are tied to the building sector, such as thehome furnishings and appliance industries. Clearly construction activity is a major force inthe economy. The data from this release is used by the government to help compute busi-ness investment spending for the quarterly GDP report.
Construction spending is divided in three distinct categories:
• Private construction for residences (4.5% of GDP): Includes single-family homesand apartment buildings.
• Private nonresidential structures (2%): Pertain to factories, office buildings, hotels,motels, religious and educational buildings, hospitals, and other types of institutions.
• Public construction (2%): Covers public housing projects, public schools, sewersystems, and similar infrastructure development.
While many economists follow this indicator, money managers generally do not. Forone, it is terribly late in coming; the data is one of the last pieces of information to bereleased for a given month. More than a dozen other real estate-linked indicators forthe same month have been released long before, so many investors will find little addedvalue in these figures. Aside from its late arrival, the report is notorious for undergoingsizable revisions. As a result, analysts are forced to rely mostly on three- and six-monthmoving averages to detect a trend in the construction business.
195Construction Spending
06Baumohl_Ch03.21-03.30.qxd 8/3/04 9:19 AM Page 195

HOW IS IT COMPUTED
The government obtains the value of residential construction directly from its own sur-veys on housing starts and new home sales. For nonresidential structures, they rely onoutside sources, such as F.W. Dodge, a division of McGraw-Hill, to contact commercialreal estate builders for the estimated dollar value of the work done.
THE TABLES: CLUES ON WHAT’S AHEAD FOR THE ECONOMY
• Table 1 Value of Construction Put in Place in the U.S.
(1) Type of Construction and Amount: Private construction activity can be a tellingindicator of business confidence. The table records the monthly spending (at anannual rate) on private residential and nonresidential construction for each ofthe past six months, and also compares the latest level to that of the previousyear. What separates this report from all the other previous releases on realestate activity is that we get to know for the first time how much builders areactually spending and on what type of construction (homes, hotels, schools,nursing homes, and hospitals). Of great interest to analysts is the spending onhome building because of the industry’s reputation as being a leading indicatorof economic turning points, and the fact that it accounts for nearly 70% of allprivate construction.
MARKET IMPACT
Economists and industry specialists pay more attention to this report than day-to-daytraders, who do not find the construction spending data particularly riveting. Even oncereleased, this series has a history of massive revisions. In any event, it is quickly over-shadowed by the more influential ISM manufacturing survey, which is frequentlyreleased on the same day.
196 Chapter 3 • The Most Influential U.S. Economic Indicators
06Baumohl_Ch03.21-03.30.qxd 8/3/04 9:19 AM Page 196
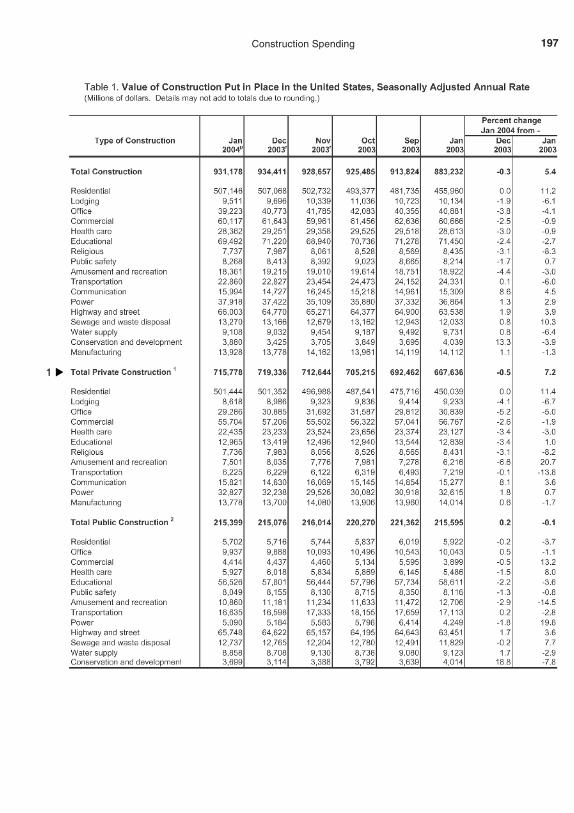
197Construction Spending
▲
1
06Baumohl_Ch03.21-03.30.qxd 8/3/04 9:19 AM Page 197
REGIONAL FEDERAL RESERVE BANK REPORTS
Every month, investors, economists, CEOs, and Washington policymakers are besiegedby a multitude of surveys that claim to measure manufacturing activity in every nook andcranny of the country. The best known ones come from the Institute for SupplyManagement (ISM) and the government’s own industrial production index. However,there are also a slew of reports published by regional Federal Reserve Banks around thecountry, and some of them are beginning to influence trading in the stock and bond mar-kets. We’ll focus on five of the most widely read.
The first to be released each month also happens to be the newest of the Fed sur-veys, and it’s already turning heads. The Federal Reserve Bank of New York first pub-lished the Empire State Manufacturing Survey in 2002, and for a few months, it wentvirtually unnoticed. The report began to catch the eye of investors once they realizedits quick turnaround—the Empire survey comes out in the middle of the month beingcovered—and how well it serves as a reliable leading indicator of manufacturingactivity of other Fed bank surveys.
The next to be published is the Philadelphia Fed survey, which is also released thesame month it reports on. It has a reputation of predicting what the market-sensitive ISMmanufacturing index will do when it comes out a few days later. Two other noteworthysurveys come in the middle of the following month: one is by the Federal Reserve Bankof Kansas City, and the other from the Fed Bank of Richmond.
Last on the list is the Federal Reserve Bank of Chicago, whose report is unique incomparison to the others. First, it’s not a regional report; it instead looks at business con-ditions nationwide. Second, no survey is mailed out. This Chicago index consists of acompilation of major economic indicators with a unique formula designed to predictinflation problems and forewarn the advent of recessions.
The five Fed bank reports will be discussed in the order they are released:
1. Federal Reserve Bank of New York
2. Federal Reserve Bank of Philadelphia
3. Federal Reserve Bank of Kansas City
4. Federal Reserve Bank of Richmond
5. Federal Reserve Bank of Chicago
198 Chapter 3 • The Most Influential U.S. Economic Indicators
06Baumohl_Ch03.21-03.30.qxd 8/3/04 9:19 AM Page 198
FEDERAL RESERVE BANK OF NEW YORK:EMPIRE STATE MANUFACTURING SURVEY
Market Sensitivity: Medium.
What Is It: Tracks manufacturing activity in New York state.
News Release on Internet: www.ny.frb.org/research/regional_economy/empiresurvey_overview.html
Home Web Address: www.ny.frb.org
Release Time: 8:30 A.M. (ET); released around the 15th of the month beingreported.
Frequency: Monthly.
Source: Federal Reserve Bank of New York.
Revisions: Revisions are slight on a month-to-month basis.
WHY IS IT IMPORTANT
If you’ve never heard of the Empire State Manufacturing Survey (ESMS), you’re notalone. Most people haven’t. Large institutional money managers have, however, and theyrecognize it as an up-and-coming economic indicator that could become one of the tenmost influential reports released by the government.
The ESMS was developed by the Federal Reserve Bank of New York for internal usein July 2001. Less than a year later, the bank went public with a monthly survey and clev-erly set the timing for its release to precede other Fed surveys as a way to elbow into thefinancial market spotlight.
The ESMS is designed to find out the present condition of New York’s manufactur-ing industries, as well as what company executives believe they will do in the next sixmonths. Despite its short history, the ESMS has already demonstrated an intriguing corre-lation with the Philadelphia Index, which in turn has a knack for being a leading indicatorof the market-shaking ISM manufacturing survey. Even the Federal Reserve Board,which sets the policy on interest rates, checks on the ESMS for any early indications ofweakness or strength in manufacturing as well as any incipient signs of inflation. It issomething of a surprise that the ESMS is being given such careful consideration when, infact, New York state doesn’t really have a significant amount of manufacturing.
199Federal Reserve Bank of New York
07Baumohl_Ch03.31-03.40.qxd 8/3/04 11:26 AM Page 199
200 Chapter 3 • The Most Influential U.S. Economic Indicators
HOW IS IT COMPUTED
On the first business day of every month, the New York Fed polls the same group of 175manufacturing CEOs or presidents. Respondents are asked to give their views on anassortment of issues and to return the completed forms by the 10th, though the forms stillmight be considered if they arrive as late as the 14th. Normally, about 100 are received ontime at the New York Fed.
They are asked to describe how manufacturing conditions have changed in the monthand what changes they expect to see in the next half year. Only three answers are possi-ble: an increase in activity, a decrease in activity, or no change at all.
The survey questions are as follows:
What is your evaluation of the level of general business activity?
What about new orders? Shipments? Unfilled orders? Delivery times?
Inventories? Prices paid? Prices received? Number of employees, including contractworkers?
Average employee workweek? Technology spending?
Capital expenditures?
The responses to each question are tallied to form a diffusion index where the per-centage of those who saw a decrease in activity is subtracted from the percentage whosaw an increase in activity. Thus, any number above zero means more manufacturersbelieve business conditions are improving rather than worsening.
THE TABLES: CLUES ON WHAT’S AHEAD FOR THE ECONOMY
• Cover Page Empire State Manufacturing Survey
(1) General Business Conditions: This is the key index of the report; it conveys theoverall impression of manufacturing executives on whether activity is increasingor not. Note that the General Business Conditions index is not a weighted aver-age of all the results from this survey, but based on a distinct question on generalbusiness activity.
What can we discern from the general business condition index? Aside from itsshort history as an economic measure, a positive index number is a sign that fac-tory activity is strengthening. Just how widespread that feeling is among manu-facturers can be seen in the detailed tables.
• Empire State Manufacturing Survey (Results for the Month and forExpectations Six Months Ahead)
Detailed Tables: The numbers in each table represent the actual percentage ofrespondents who feel activity is higher compared with the percentage who say it islower. The final index is merely the difference between the two. Obviously the
07Baumohl_Ch03.31-03.40.qxd 8/3/04 11:26 AM Page 200
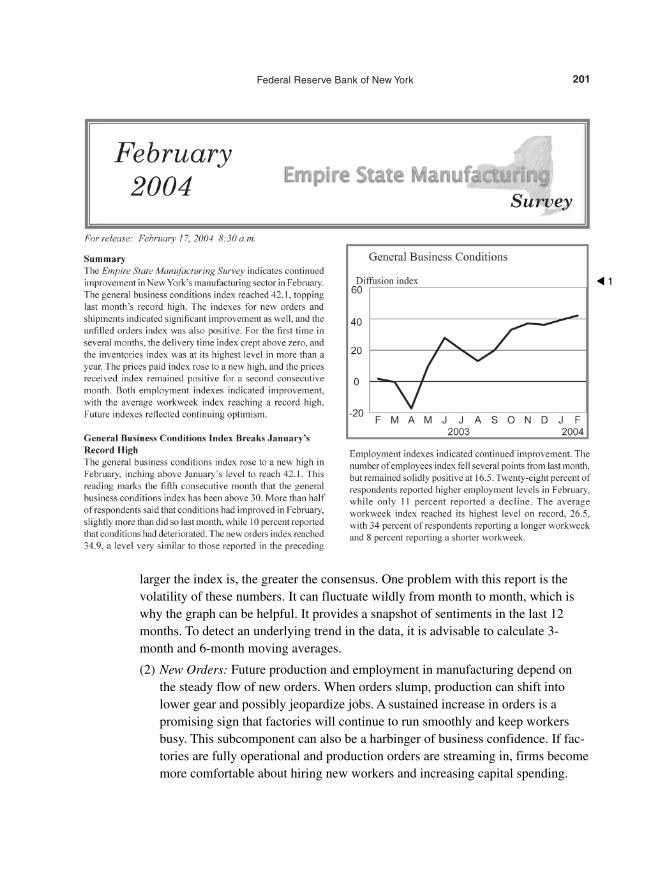
201Federal Reserve Bank of New York
▲ 1
larger the index is, the greater the consensus. One problem with this report is thevolatility of these numbers. It can fluctuate wildly from month to month, which iswhy the graph can be helpful. It provides a snapshot of sentiments in the last 12months. To detect an underlying trend in the data, it is advisable to calculate 3-month and 6-month moving averages.
(2) New Orders: Future production and employment in manufacturing depend onthe steady flow of new orders. When orders slump, production can shift intolower gear and possibly jeopardize jobs. A sustained increase in orders is apromising sign that factories will continue to run smoothly and keep workersbusy. This subcomponent can also be a harbinger of business confidence. If fac-tories are fully operational and production orders are streaming in, firms becomemore comfortable about hiring new workers and increasing capital spending.
07Baumohl_Ch03.31-03.40.qxd 8/3/04 11:26 AM Page 201
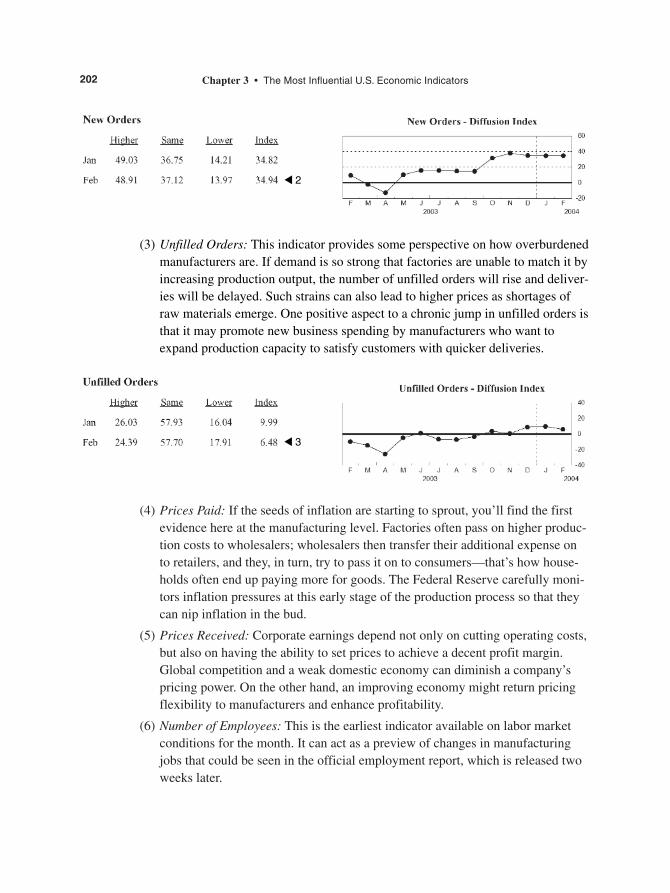
(4) Prices Paid: If the seeds of inflation are starting to sprout, you’ll find the firstevidence here at the manufacturing level. Factories often pass on higher produc-tion costs to wholesalers; wholesalers then transfer their additional expense onto retailers, and they, in turn, try to pass it on to consumers—that’s how house-holds often end up paying more for goods. The Federal Reserve carefully moni-tors inflation pressures at this early stage of the production process so that theycan nip inflation in the bud.
(5) Prices Received: Corporate earnings depend not only on cutting operating costs,but also on having the ability to set prices to achieve a decent profit margin.Global competition and a weak domestic economy can diminish a company’spricing power. On the other hand, an improving economy might return pricingflexibility to manufacturers and enhance profitability.
(6) Number of Employees: This is the earliest indicator available on labor marketconditions for the month. It can act as a preview of changes in manufacturingjobs that could be seen in the official employment report, which is released twoweeks later.
202 Chapter 3 • The Most Influential U.S. Economic Indicators
(3) Unfilled Orders: This indicator provides some perspective on how overburdenedmanufacturers are. If demand is so strong that factories are unable to match it byincreasing production output, the number of unfilled orders will rise and deliver-ies will be delayed. Such strains can also lead to higher prices as shortages ofraw materials emerge. One positive aspect to a chronic jump in unfilled orders isthat it may promote new business spending by manufacturers who want toexpand production capacity to satisfy customers with quicker deliveries.
▲ 2
▲ 3
07Baumohl_Ch03.31-03.40.qxd 8/3/04 11:26 AM Page 202
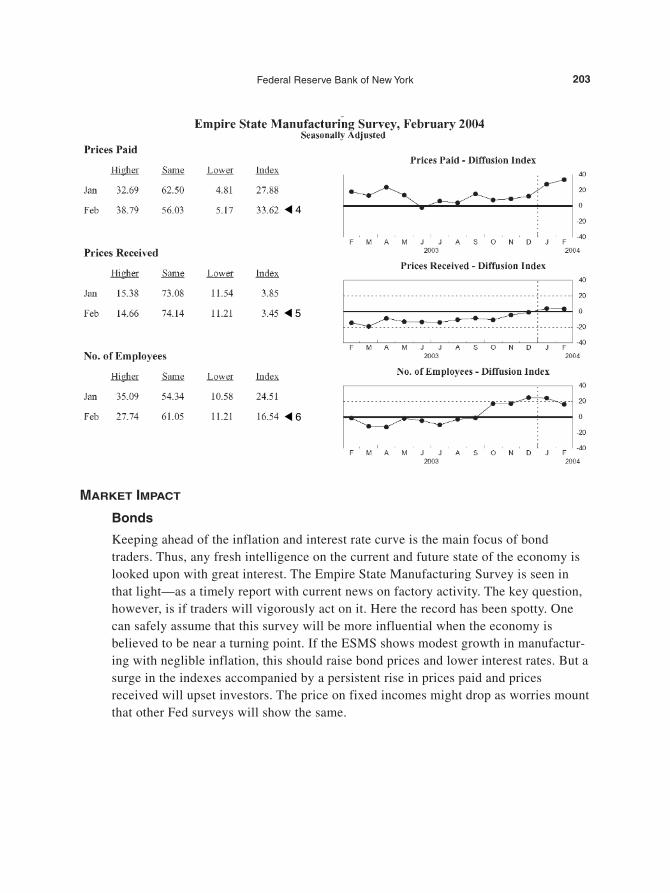
MARKET IMPACT
Bonds
Keeping ahead of the inflation and interest rate curve is the main focus of bondtraders. Thus, any fresh intelligence on the current and future state of the economy islooked upon with great interest. The Empire State Manufacturing Survey is seen inthat light—as a timely report with current news on factory activity. The key question,however, is if traders will vigorously act on it. Here the record has been spotty. Onecan safely assume that this survey will be more influential when the economy isbelieved to be near a turning point. If the ESMS shows modest growth in manufactur-ing with neglible inflation, this should raise bond prices and lower interest rates. But asurge in the indexes accompanied by a persistent rise in prices paid and pricesreceived will upset investors. The price on fixed incomes might drop as worries mountthat other Fed surveys will show the same.
203Federal Reserve Bank of New York
▲ 4
▲ 5
▲ 6
07Baumohl_Ch03.31-03.40.qxd 8/3/04 11:26 AM Page 203

Stocks
The equity market is also sensitive to this report because of its positive correlation withthe Philadelphia and Chicago Fed bank surveys and the ISM data. Weakness in theEmpire State indexes suggests the earnings of manufacturers are under pressure, whichcan dull stock prices. A healthy jump in the indexes at a time of economic softness willlift stock prices.
Dollar
There is no discernible reaction by foreign investors to this index.
204 Chapter 3 • The Most Influential U.S. Economic Indicators
07Baumohl_Ch03.31-03.40.qxd 8/3/04 11:26 AM Page 204
FEDERAL RESERVE BANK OF PHILADELPHIA:BUSINESS OUTLOOK SURVEY
Market Sensitivity: Low to medium.
What Is It: A survey of manufacturing activity in eastern Pennsylvania, southernNew Jersey, and the state of Delaware.
News Release on Internet: www.phil.frb.org/econ/bos/index.html
Home Web Address: www.phil.frb.org
Release Time: 12:00 P.M. (ET); data is released on the third Thursday of themonth being covered.
Frequency: Monthly.
Source: Federal Reserve Bank of Philadelphia.
Revisions: No monthly revisions take place, but the Philadelphia Fed does makeannual benchmark changes at the start of the year.
WHY IS IT IMPORTANT
The Philadelphia Fed regional report began in 1968 and is the longest-running survey ofmanufacturers by a Federal Reserve Bank. Known formally as the Business OutlookSurvey (BOS), its familiarity has made it one of the most closely followed surveys bymoney managers and the press. The report is recognized for its timeliness, because theresults are published in the same month it covers. This Fed district also encompasses oneof the more populated regions in the U.S. (eastern Pennsylvania, southern New Jersey,and the state of Delaware), which gives it added significance. Finally, the BOS can pro-vide a sneak preview of what the high-profile ISM manufacturing survey might showwhen it comes out less than two weeks later.
HOW IS IT COMPUTED
At the beginning of every month, the Philadelphia Fed mails questionnaires to the topexecutives at 250 large firms. They are asked to assess present conditions and record theirexpectations for the next six months. The questions below can be answered in one ofthree ways: activity is up, down, or unchanged.
What is your evaluation of the level of general business activity?
What about new orders? Shipments? Unfilled orders? Delivery times?
Inventories? Prices paid? Prices received? Number of employees?
Average employee workweek? Capital expenditures?
205Federal Reserve Bank of Philadelphia
07Baumohl_Ch03.31-03.40.qxd 8/3/04 11:26 AM Page 205
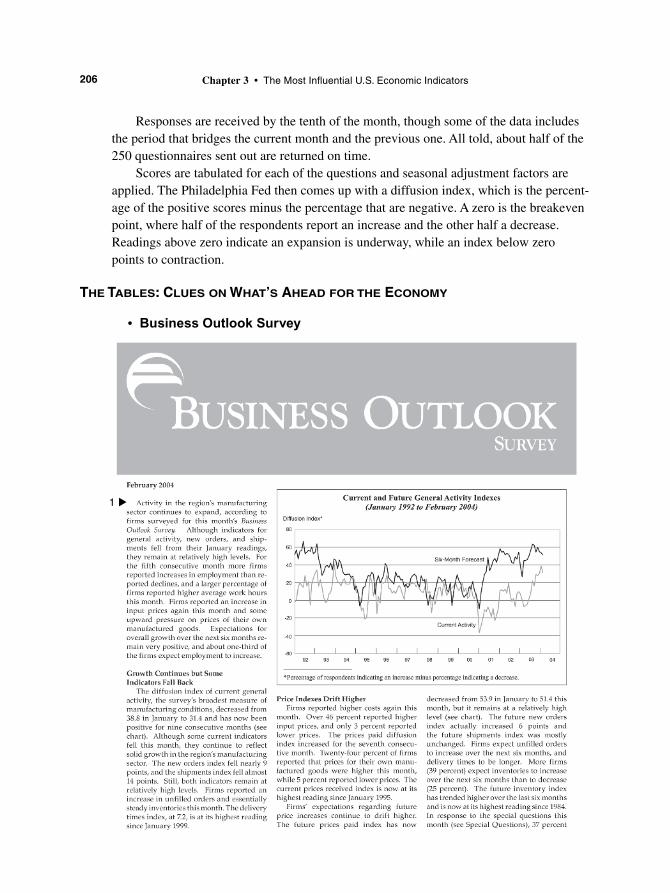
▲
1
Responses are received by the tenth of the month, though some of the data includesthe period that bridges the current month and the previous one. All told, about half of the250 questionnaires sent out are returned on time.
Scores are tabulated for each of the questions and seasonal adjustment factors areapplied. The Philadelphia Fed then comes up with a diffusion index, which is the percent-age of the positive scores minus the percentage that are negative. A zero is the breakevenpoint, where half of the respondents report an increase and the other half a decrease.Readings above zero indicate an expansion is underway, while an index below zeropoints to contraction.
THE TABLES: CLUES ON WHAT’S AHEAD FOR THE ECONOMY
• Business Outlook Survey
206 Chapter 3 • The Most Influential U.S. Economic Indicators
07Baumohl_Ch03.31-03.40.qxd 8/3/04 11:26 AM Page 206
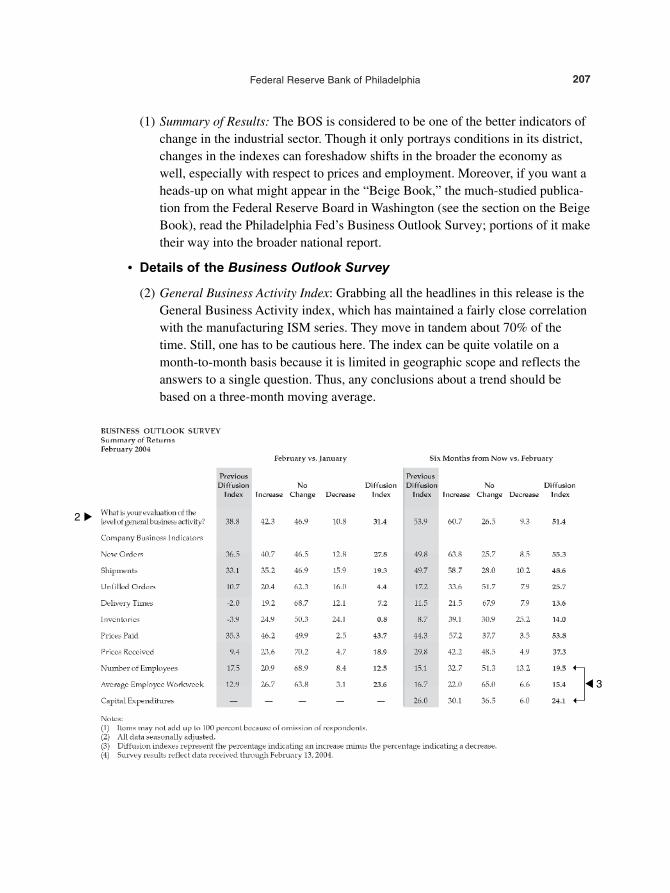
207Federal Reserve Bank of Philadelphia
(1) Summary of Results: The BOS is considered to be one of the better indicators ofchange in the industrial sector. Though it only portrays conditions in its district,changes in the indexes can foreshadow shifts in the broader the economy aswell, especially with respect to prices and employment. Moreover, if you want aheads-up on what might appear in the “Beige Book,” the much-studied publica-tion from the Federal Reserve Board in Washington (see the section on the BeigeBook), read the Philadelphia Fed’s Business Outlook Survey; portions of it maketheir way into the broader national report.
• Details of the Business Outlook Survey
(2) General Business Activity Index: Grabbing all the headlines in this release is theGeneral Business Activity index, which has maintained a fairly close correlationwith the manufacturing ISM series. They move in tandem about 70% of thetime. Still, one has to be cautious here. The index can be quite volatile on amonth-to-month basis because it is limited in geographic scope and reflects theanswers to a single question. Thus, any conclusions about a trend should bebased on a three-month moving average.
▲
2
➝
➝
▲ 3
07Baumohl_Ch03.31-03.40.qxd 8/3/04 11:26 AM Page 207
(3) Six-Month Outlook: Also of interest in this report are the respondents’ answersto the six-month outlook. Of the 11 business indicator questions asked, two war-rant particular attention. What’s the half-year projection for capital expendi-tures? And second, will the number of manufacturing employees grow or shrinkin that time frame? Clearly these two factors are related. Manufacturers willincrease business expenditures only if they are confident that private demandhas been resuscitated. Similarly, factories and plants are unlikely to hire perma-nent workers if there’s still uncertainty about the economy’s future direction.
MARKET IMPACT
Bonds
The Business Outlook Survey by the Philadelphia Fed isn’t a huge market mover. Yet,traders of fixed income securities do track it because the report can tip off analysts on theresults of the more influential national ISM survey when it is released days later.
Stocks
Investors keep an eye on the Business Outlook Survey, but they usually do not initiatemajor trades based on its information alone.
Dollar
Foreign exchange traders largely disregard this release.
208 Chapter 3 • The Most Influential U.S. Economic Indicators
07Baumohl_Ch03.31-03.40.qxd 8/3/04 11:26 AM Page 208

FEDERAL RESERVE BANK OF KANSAS CITY:MANUFACTURING SURVEY OF THE 10TH DISTRICT
Market Sensitivity: Low.
What Is It: Measures manufacturing activity in a region that includes Colorado,Kansas, Nebraska, Oklahoma, Wyoming, western Missouri, and northernNew Mexico.
News Release on Internet: www.kc.frb.org/mfgsurv/mfgmain.htm
Home Web Address: www.kc.frb.org
Release Time: 11 A.M. (ET); report is released about two weeks after the monthbeing examined.
Frequency: Monthly.
Source: Federal Reserve Bank of Kansas City.
Revisions: No revisions. There are no annual benchmark changes at this timebecause of its brief history.
WHY IS IT IMPORTANT
It’s safe to say that this survey is not routinely in the business spotlight. The Kansas City FedManufacturing Survey is relatively new, having been launched in 1995, and it lacks a solidtrack record on how well it correlates with other major economic indicators and with theeconomy as a whole. Still, this survey has some noteworthy virtues. There’s a relatively shortlag from the time the survey is conducted to its release date. This quick turnaround enablesthe Kansas City Fed manufacturing report to come out before other key indicators, such asindustrial production, business inventories, producer prices, and durable goods. Thus, bymerely being ahead of the pack, the Kansas City Fed survey is looked at with interest.
HOW IS IT COMPUTED
The Kansas City Fed queries 300 manufacturing officials who represent the district’s geo-graphic and industrial distribution. Respondents are asked about changes in business con-ditions for three time periods: over the past month, versus a year ago, and the expectedchange in six months. Questions are posed on the following issues:
• Change in volume of production
• Volume of shipments
• New orders
• Order backlog
209Federal Reserve Bank of Kansas City
07Baumohl_Ch03.31-03.40.qxd 8/3/04 11:26 AM Page 209
210 Chapter 3 • The Most Influential U.S. Economic Indicators
• Number of employees
• Average employee workweek
• Prices received for finished products
• Prices paid for raw materials
• Capital expenditures
• New orders for exports
• Supplier deliveries
• Inventory for raw materials and for finished goods
Responses are compiled, corrected for seasonal adjustment factors, and presented in theform of a diffusion index. That is, the percentage of those who reported a decrease for aspecific category is subtracted from the percentage of those who claimed an increase.Thus, the index can range from –100 (all queried see activity declining) to +100 (all seeactivity as increasing). If half see activity rising and the other half see it falling, the indexis zero. So any figure above zero indicates that manufacturing activity is expanding; anybelow zero suggests it’s contracting.
THE TABLES: CLUES ON WHAT’S AHEAD FOR THE ECONOMY
• Table 1 Summary of Tenth District Manufacturing Conditions
Though the results of this survey pertain to economic activity inside one FederalReserve district, they still can provide fresh clues on how the rest of the country isperforming. Here are some key indicators to track in the report:
(1) Production and shipments: Trends here reflect current manufacturing conditionsas well as expectations of the near-term future.
(2) New orders and the backlog of orders: The numbers tells you how busy factorieswill be in the future.
(3) Prices paid and received: Changes presage inflationary or deflationary pres-sures.
(4) Capital expenditures index: Looks at business spending plans in the region,but can also be seen as a harbinger of such investments in other parts of thecountry.
07Baumohl_Ch03.31-03.40.qxd 8/3/04 11:26 AM Page 210
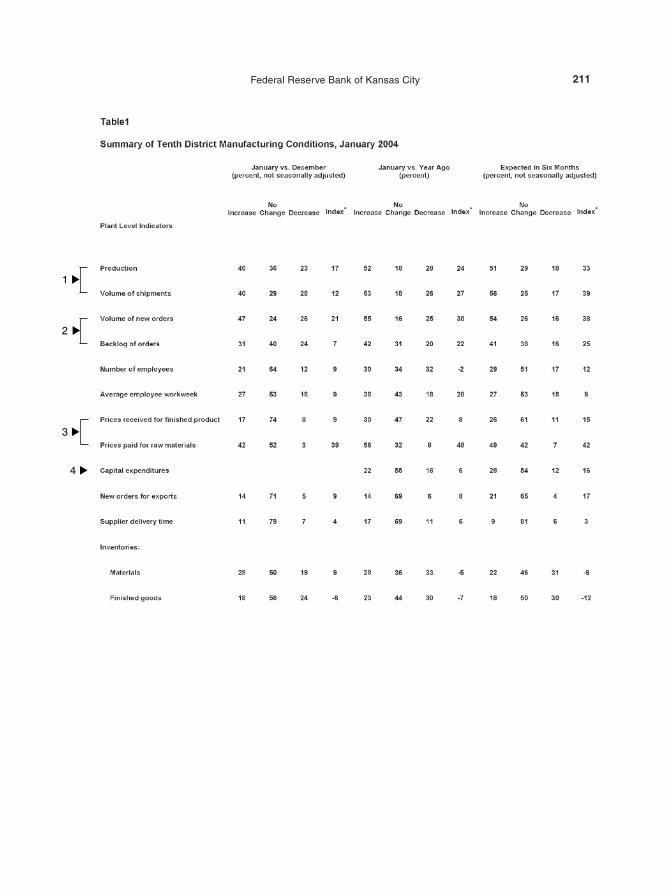
211Federal Reserve Bank of Kansas City
▲
4
▲
3
▲
2
▲
1
07Baumohl_Ch03.31-03.40.qxd 8/3/04 11:26 AM Page 211

MARKET IMPACT
Bonds
Players in the fixed income markets follow the regional Federal Reserve Bank surveysbecause they portray economic conditions in various parts of the country. Any surprise onthe upside can make investors edgy because they can portend changes in the more influ-ential manufacturing reports, including the ISM series and industrial production.
Stocks
Equity investors take notice but generally don’t trade on the survey results.
Dollar
There is no noticeable response in the currency market to the Kansas City Fed survey.
212 Chapter 3 • The Most Influential U.S. Economic Indicators
07Baumohl_Ch03.31-03.40.qxd 8/3/04 11:26 AM Page 212
FEDERAL RESERVE BANK OF RICHMOND:MANUFACTURING ACTIVITY FOR THE FIFTH DISTRICT
Market Sensitivity: Low.
What Is It: Measures manufacturing performance in a region encompassing theDistrict of Columbia, Maryland, North Carolina, South Carolina, Virginia,and most of West Virginia.
News Release on Internet: www.rich.frb.org/research/surveys
Home Web Address: www.rich.frb.org
Release Time: 10:00 A.M. (ET); report is released on the second Tuesday ofevery month and refers to events in the preceding month.
Frequency: Monthly.
Source: Federal Reserve Bank of Richmond.
Revisions: No monthly revisions. The survey is subject to annual revisions in thefall that stem from changes in seasonal adjustment factors.
WHY IS IT IMPORTANT
Though the Richmond survey comes out after the ISM report, it can be used to affirm ordisaffirm it. Perhaps the most useful feature of this regional Fed survey is its emphasison seeking out inflation pressures in the region.
HOW IS IT COMPUTED
This release is known for having a quick turnaround from when the survey is taken tothe time the results are published. Every month, the Richmond Fed surveys about 210plant managers, purchasing managers, and financial controllers whose firms make up across section of the industrial activity in the mid-Atlantic Fed district. Typically, around50% of those queried mail back their responses by the beginning of the following month.Less than a week later, the Richmond Fed releases the results.
It presents the information a little differently than the other regional Fed banks. Formost of the questions, the Richmond Fed uses a diffusion index, where the percentage ofrespondents reporting decreases in activity is subtracted from the percentage of thosereporting increases in activity. Thus, on every topic queried, a diffusion index is given for each of the last three months, along with a three-month moving average index. The
213Federal Reserve Bank of Richmond
07Baumohl_Ch03.31-03.40.qxd 8/3/04 11:26 AM Page 213
moving average smoothes out the month-to-month volatility and enables one to more eas-ily spot an underlying trend. The Richmond Fed differs when it comes to recordingswings in prices paid and prices received; no diffusion index is employed here. Instead itis the actual inflation rate for the region: specifically, the average annual rate that priceshave changed in the month.
The questions asked are similar to other Fed banks. They want to know about thechanges in activity in the latest month and what is expected to happen over the next sixmonths.
Specific topics covered in these questionnaires include the following:
Based on a diffusion index
• Shipments
• Volume of orders
• Backlog of orders
• Capacity utilization
• Vendor lead time
• Number of employees
• Average workweek
• Wages
• Inventories levels (latest month only) for finished goods and raw materials
• Capital expenditures (expectations over the next six months only)
Based on percent change in prices (annualized)
• Prices paid
• Prices received
THE TABLES: CLUES ON WHAT’S AHEAD FOR THE ECONOMY
• Business Activity Indexes
This survey provides a more detailed assessment of current and future price pres-sures than the other regional Fed bank reports. The Richmond Fed focuses on someof the most sensitive inflation detectors, such as changes in manufacturing wagesand capacity utilization. By looking at the survey results, investors might get aheads-up on what the nationwide CPI, PPI, and capacity utilization measures willreport when they’re published a few days later.
214 Chapter 3 • The Most Influential U.S. Economic Indicators
07Baumohl_Ch03.31-03.40.qxd 8/3/04 11:26 AM Page 214
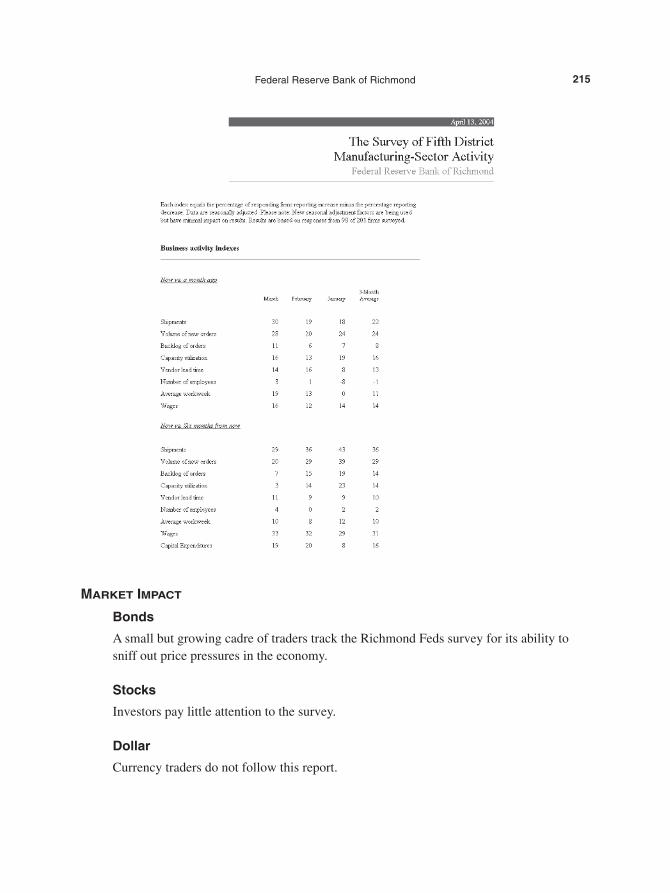
MARKET IMPACT
Bonds
A small but growing cadre of traders track the Richmond Feds survey for its ability tosniff out price pressures in the economy.
Stocks
Investors pay little attention to the survey.
Dollar
Currency traders do not follow this report.
215Federal Reserve Bank of Richmond
07Baumohl_Ch03.31-03.40.qxd 8/3/04 11:26 AM Page 215

FEDERAL RESERVE BANK OF CHICAGO:NATIONAL ACTIVITY INDEX (CFNAI)
Market Sensitivity: Low.
What Is It: A nationwide measure of economic activity and inflation pressures.
News Release on Internet: www.chicagofed.org/economic_research_and_data/data_index.cfm
Home Web Address: www.chicagofed.org
Release Time: 10 A.M. (ET); usually released four to five weeks after thereporting month.
Frequency: Monthly.
Source: Federal Reserve Bank of Chicago.
Revisions: Substantial revisions can occur in the monthly data.
WHY IS IT IMPORTANT
Economists are always coming up with new calculations that they hope will improvetheir ability to predict how the economy will perform. They might tweak an equation hereand there, change some assumptions, and occasionally add or toss certain indicators—allwith the intent to come up with a more refined method of forecasting U.S. business activ-ity. Most of the time, these formulations go unnoticed in the financial markets becausethey’re new and untested. Every once in a while, though, there comes along an indicatorthat stands out because of its potential to foresee economic problems. In March 2001, theFederal Reserve Bank of Chicago launched a monthly index designed to better assess thehealth of the national (not regional) economy, warn of upcoming inflationary pressures,and predict the beginning and end of recessions. Called the Chicago Fed NationalActivity Index (CFNAI), it has emerged as one of the most promising measures to comeout in recent years.
HOW IS IT COMPUTED
Here’s how it works. The index reflects the performance of 85 monthly national eco-nomic indicators drawn from four broad categories:
• Production and income
• The job market and hours worked
• Personal consumption and housing
• Sales, inventories, and orders
216 Chapter 3 • The Most Influential U.S. Economic Indicators
07Baumohl_Ch03.31-03.40.qxd 8/3/04 11:26 AM Page 216
By using a weighted average involving all 85 measures, a single index figure is computedso that a value of 0 indicates the economy is growing at its full potential. In other words,business is humming along at the fastest pace possible without aggravating inflation pres-sures. This is known as trend growth. A value above 0 indicates the economy is expand-ing at a rate above its safe speed, with total demand outstripping supplies to such anextent that it can lead to an outbreak of inflation. An index with a negative number pointsto an economy growing below potential, a development that may be benign for inflationbut can also cause unemployment to rise. A three-month moving average of the index isalso supplied to smooth out the volatility caused by short-term factors.
Due to the schedule of the release and the large number of components needed forthe index, about a quarter of the data sought will not be available in time to contribute tothe monthly report. Therefore, estimates are used for the missing indicators.
THE TABLES: CLUES ON WHAT’S AHEAD FOR THE ECONOMY
The main purpose of setting up the CFNAI is to advise investors and policymakers if theeconomy is (a) growing at a healthy pace with inflation nicely in check, or (b) racing aheadat a speed that threatens a buildup of inflationary pressures, or perhaps (c) functioning waybelow par and in danger of slipping into recession.
• Chicago Fed National Activity Index
The two main indexes in this report are identified as CFNAI (the report’s acronym)for the latest monthly index, and CFNAI-MA3, which represents the three-monthmoving average of the index. Trying to interpret the latest monthly reading is a use-less exercise because it tends to fluctuate a great deal. It is also subject to substantialrevisions the next month. The three-month moving average index is far more valu-able because it is less volatile and the revisions have already been incorporated.
(1) Track the CFNAI-MA3 index to see the outlook for inflation and economicgrowth. A moving average that falls below –0.7 indicates that the chance of arecession has risen substantially. How does the Chicago Fed know that? By look-ing back over the period of 1967–2001, the CFNAI has fallen below –0.7 on sevenoccasions, with six of these periods actually leading to a recession. That’s a suc-cess rate of 86%. When the index drops to –1.5, it means the economy is probablyin the midst of a recession.
A three-month moving average above 0.2 is a signal that the recession is likelyover. If the index rises above 0.7 more than two years into the economic expansion,it is a warning that inflation is in danger of accelerating. A number above 1.0 whenthe economy is already well into the expansion means there’s a clear threat thatbusiness activity may be overheating and that a sustained period of rising inflationcould follow.
217Federal Reserve Bank of Chicago
07Baumohl_Ch03.31-03.40.qxd 8/3/04 11:26 AM Page 217
218 Chapter 3 • The Most Influential U.S. Economic Indicators
▲
1
MARKET IMPACT
Few participants in the financial markets follow this indicator. That could change in thefuture as investors begin to take note of its usefulness as a forecasting tool.
07Baumohl_Ch03.31-03.40.qxd 8/3/04 11:26 AM Page 218
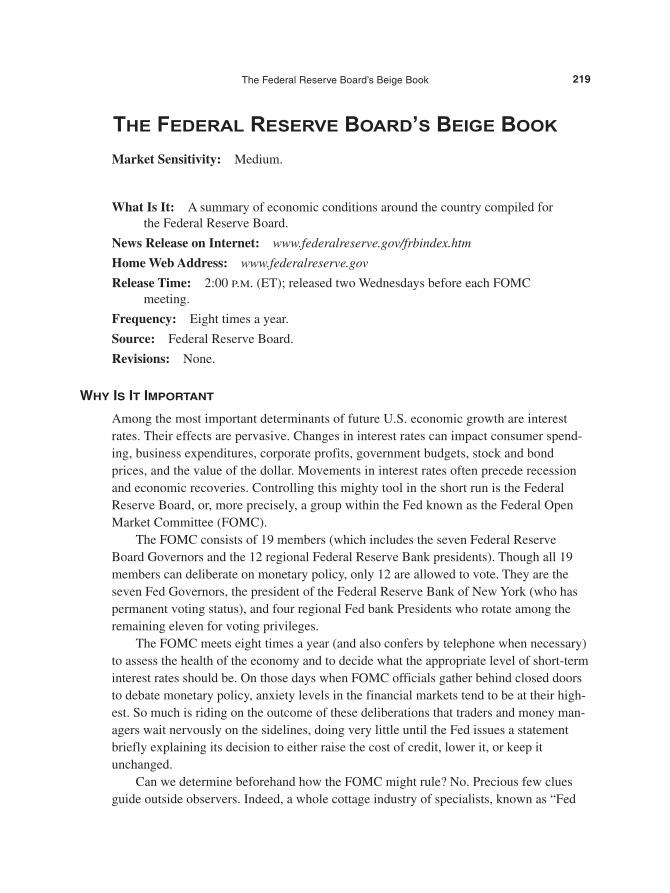
THE FEDERAL RESERVE BOARD’S BEIGE BOOK
Market Sensitivity: Medium.
What Is It: A summary of economic conditions around the country compiled forthe Federal Reserve Board.
News Release on Internet: www.federalreserve.gov/frbindex.htm
Home Web Address: www.federalreserve.gov
Release Time: 2:00 P.M. (ET); released two Wednesdays before each FOMCmeeting.
Frequency: Eight times a year.
Source: Federal Reserve Board.
Revisions: None.
WHY IS IT IMPORTANT
Among the most important determinants of future U.S. economic growth are interestrates. Their effects are pervasive. Changes in interest rates can impact consumer spend-ing, business expenditures, corporate profits, government budgets, stock and bondprices, and the value of the dollar. Movements in interest rates often precede recessionand economic recoveries. Controlling this mighty tool in the short run is the FederalReserve Board, or, more precisely, a group within the Fed known as the Federal OpenMarket Committee (FOMC).
The FOMC consists of 19 members (which includes the seven Federal ReserveBoard Governors and the 12 regional Federal Reserve Bank presidents). Though all 19members can deliberate on monetary policy, only 12 are allowed to vote. They are theseven Fed Governors, the president of the Federal Reserve Bank of New York (who haspermanent voting status), and four regional Fed bank Presidents who rotate among theremaining eleven for voting privileges.
The FOMC meets eight times a year (and also confers by telephone when necessary)to assess the health of the economy and to decide what the appropriate level of short-terminterest rates should be. On those days when FOMC officials gather behind closed doorsto debate monetary policy, anxiety levels in the financial markets tend to be at their high-est. So much is riding on the outcome of these deliberations that traders and money man-agers wait nervously on the sidelines, doing very little until the Fed issues a statementbriefly explaining its decision to either raise the cost of credit, lower it, or keep itunchanged.
Can we determine beforehand how the FOMC might rule? No. Precious few cluesguide outside observers. Indeed, a whole cottage industry of specialists, known as “Fed
219The Federal Reserve Board’s Beige Book
07Baumohl_Ch03.31-03.40.qxd 8/3/04 11:26 AM Page 219
watchers,” has emerged over the years. Their job is to pick up every possible nuance fromspeeches, side comments, and writings by FOMC members that might tip off how theywill vote at the next interest rate policy meeting. So far the track record of “Fed watch-ers” has been less than stellar, which is of little surprise. As famed economist JohnKenneth Galbraith once said, “There are two types of interest rate forecasters. Those whodon’t know, and those who don’t know they don’t know.”
Nonetheless, the Fed does release to the public at least one relevant document inadvance of each FOMC meeting, and it serves as an economic backdrop for these closed-door sessions. Two weeks prior to an FOMC gathering, the Fed puts out the Beige Book,so called because of its tan cover. Two factors make the Beige Book special. First, it pro-vides up-to-date information on economic conditions around the country. Second, andmore importantly, this book is given to each member of the FOMC to help set the stagefor the debate on interest rate policy.
The Beige Book, known formally as the Summary of Commentary on CurrentEconomic Conditions by Federal Reserve District, is not a collection of statistical data.Far from it. The report is mostly a compilation of anecdotal information from each of the12 Federal Reserve Districts and is based on interviews with local businesspeople andacademics who are asked to describe the economic climate in their region. It’s then puttogether with a summary by one of the Federal Reserve District banks in preparation forthe next FOMC meeting.
The Beige Book is not the only report read by FOMC officials. Two other key“books” are produced, but these are not available to the public. There’s the Green Book,which is prepared by top economists at the Federal Reserve Board and contains theirview of current and future domestic and international economic conditions. Finally, thereis the Blue Book, the most sensitive of the three documents, written by key Fed staffmembers. It offers a set of interest rate policy alternatives and their likely consequences.
All three documents are distributed to FOMC members before each meeting. TheBeige Book arrives two weeks before the monetary policy debate commences. The GreenBook is available on the Thursday before the FOMC confers. The super-secret Blue Bookis hand-delivered to FOMC members’ homes on Friday the weekend before a meeting.
HOW IS IT COMPUTED
About three weeks prior to each FOMC conference, staff from all 12 regional FederalReserve banks interview local business executives, private economists, bankers, academ-ics, and others to get their assessment of the economic and business climate in theirregion. A standard set of questions is asked. How is consumer spending holding up? Isthe labor market getting tighter? Are wage pressures rising? Has demand for financialservices diminished? Is housing or commercial construction slowing or accelerating?Have manufacturers detected a change in order volume? One of the Federal Reservebanks, chosen on a rotating basis, summarizes all the anecdotal information and organizesthe findings by district level to create the Beige Book.
220 Chapter 3 • The Most Influential U.S. Economic Indicators
07Baumohl_Ch03.31-03.40.qxd 8/3/04 11:26 AM Page 220

THE TABLES: CLUES ON WHAT’S AHEAD FOR THE ECONOMY
Since there are no tables in the Beige Book, the question becomes whether one can divinefrom the anecdotes and summary how the Fed might rule on interest rates. The shortanswer is no. The Beige Book is not a good leading indicator of interest rates or anythingelse for that matter. Still, it’s the only game in town that permits outsiders to know whatFed governors will be reading as they prepare to discuss whether to change the bench-mark Federal funds rate.
MARKET IMPACT
Though the Beige Book has no predictive value of its own, stock and bond traders arestill anxious to see what it says if only because Federal Reserve officials get this materialbefore their all-important gathering. Moreover, the information in the Beige Book is quitetimely because it comes out sooner than most of the statistical data for the period.
221The Federal Reserve Board’s Beige Book
07Baumohl_Ch03.31-03.40.qxd 8/3/04 11:26 AM Page 221
Bonds
Widespread anecdotal signs of a softening in the economy are considered bullish forfixed incomes because it might move the Fed closer to lowering interest rates. On theother hand, reports of strong business activity and tight labor markets will likely depressbond prices and raise interest rates because investors expect the central bank to interveneand cool the economy.
Stocks
If the Beige Book portrays a soft economy with little inflation pressures, equity investorsmight look to the Fed to keep interest rate levels low, normally a positive for stocksbecause it reduces corporate borrowing costs and improves future profits. In contrast, ifeconomic growth is too rapid at a time when labor and material resources are becomingscarce, it will heighten concerns that the Fed will soon hike rates, and this often causesstocks to retreat.
Dollar
The dollar might rise in value if the Beige Book agrees with other evidence that eco-nomic activity is robust. It portends firmer interest rates in the U.S., which makes the dol-lar more attractive to hold. In contrast, foreign investors are leery of reports depicting afragile economy since the Fed might be inclined to lower interest rates and that mightundermine the dollar’s value, especially if U.S. rates end up below those of other majorindustrialized countries.
222 Chapter 3 • The Most Influential U.S. Economic Indicators
07Baumohl_Ch03.31-03.40.qxd 8/3/04 11:26 AM Page 222
INTERNATIONAL TRADE IN GOODS
AND SERVICES
Market Sensitivity: Medium.
What Is It: Monthly report on U.S. exports and imports of goods and services.
News Release on Internet: www.bea.gov/bea/newsrel/tradnewsrelease.htm
Home Web Address: www.bea.gov
Release Time: 8:30 A.M. (ET); data is released the second week of the month andrefers to trade that occurred two months earlier.
Frequency: Monthly.
Source: Census Bureau and Bureau of Economic Analysis, Department ofCommerce.
Revisions: Each release comes with revisions that go back several months toreflect more complete information. Changes are usually small in magnitude,though they can be sizable at times. The annual benchmark revisionsnormally come out in June and these can span several years.
WHY IS IT IMPORTANT
Up until the early 1970s, the U.S. was viewed as having a closed economy. Internationaltrade was dismissed as a useful but not particularly vital part of overall domestic businessactivity. Back then, exports made up just 5.5% of total U.S. output and imports accounted for5.3%. These percentages were small enough that foreign economic events had only minimalimpact on the American economy. Yet, within a decade, all of that would change. TheBretton Woods Agreement, which was formed at the end of World War II to establish a stableforeign exchange system, collapsed in 1971. As a result, currency values in the world finan-cial markets began to float freely, sometimes moving wildly up or down. At the same time,world trade grew faster than ever. Cheaper foreign goods, often of better quality, increasinglyfound their way into the U.S. market and started to pose serious competition for U.S. produc-ers. American companies responded by operating more efficiently, lowering prices, and seek-ing out new markets overseas. Trade has since evolved to become one of the most importantforces shaping the U.S. economy. Today, the business of buying and selling products in for-eign markets represents as much as a quarter of all U.S. economic activity.
Indeed, international trade plays such an important role in the U.S. that the govern-ment issues two major releases on this topic. The first report is the International Trade inGoods and Services report, which is a collection of monthly data of U.S. exports andimports. It’s partly from these numbers that the “net export” figure is derived for use in theGDP account. The other report is known as the International Transactions account (see the
223International Trade in Goods and Services
07Baumohl_Ch03.31-03.40.qxd 8/3/04 11:26 AM Page 223
following section on the Current Account), which is released quarterly and covers not onlytrade in goods and services, but also foreign investment entering the U.S. and the amountof investment capital flowing out of the U.S to other countries. Though both of thesereports are valuable economic indicators, investors pay more attention to the monthly tradedata since it’s more current. The international transaction account comes out every threemonths; by then, much of the news is considered quite old for trading purposes.
What makes the monthly international trade report a must-read? First, exports reflectU.S. competitiveness in world markets, create American jobs, and improve corporateprofits. Exports also contribute directly to domestic economic growth. To satisfy bothAmerican and foreign demand, U.S. firms have to produce more. Greater productiontranslates into faster GDP growth. Third, by looking at imports, one can tell how strongdemand is in the U.S. Consumers and businesses tend to import much more when theeconomy is expanding. The downside of rising imports is that it subtracts from GDPgrowth since these products are made by foreign, not U.S.-based, companies.
One potential risk to America’s growing dependence on global trade is that the U.S.economy is no longer immune from financial and economic disruptions abroad. Relativelydistant and seemingly modest events, such as the Asian financial meltdown of 1997 andRussia’s default on its foreign loans in 1998, can have a detrimental impact on U.S. stocks,bonds, and even the economy. Some of these effects might be short-lived, but others canlast much longer.
What key forces shape the country’s trade balance? Broadly speaking, America’strade performance is determined by two primary factors: the relative differences ingrowth rates between the U.S. and other countries, and the changing value of the dollaragainst other major currencies. Let’s look at them separately. Obviously, where the econ-omy stands in the business cycle can influence how much we buy from other nations. Bythe same token, how much foreigners buy from the U.S. depends on how well thoseeconomies are doing. If the U.S. is growing at a faster rate than most other countries,imports to the U.S. will increase by a greater amount than exports, thus ensuring a deficitin the trade account. What further deepens the deficit, however, is that Americans havealso shown a greater propensity to import than shoppers in other countries. So, even ifboth the U.S. and other major industrial countries were growing at the same rate, thetrade deficit would still worsen because Americans are inherently inclined to spend proportionally more on imports. This hunger for foreign goods has locked the U.S. inannual trade deficits every year since 1976.
The second major factor shaping the trade balance is exchange rates. Changes in cur-rency values can alter the price of imports and exports and thus affect their demand. Astrong dollar worsens the trade balance because it lowers the price of imports, thus mak-ing them more desirable to Americans. At the same time, it raises the cost of U.S.-madegoods sold in international markets. This encourages foreign buyers to look elsewhere forless expensive products. It’s been estimated that a 1% rise in the dollar’s value against itsmain trading partners can worsen the trade deficit by $10–15 billion over two years. On
224 Chapter 3 • The Most Influential U.S. Economic Indicators
07Baumohl_Ch03.31-03.40.qxd 8/3/04 11:26 AM Page 224
the flip side, a falling U.S. currency makes imports more expensive and Americans mightthink twice about purchasing foreign goods. The upside of a weaker dollar is that it low-ers the price of American exports in foreign markets, which can increase overseasdemand for U.S. goods and services. Thus, changes in exchange rates over time have aprofound affect on international commerce.
Finally, it should be noted that differences in inflation rates among countries couldalso influence trade patterns. A high U.S. inflation rate can price American-made goodsout of foreign markets. In such a situation, demand for U.S. products will drop both hereand abroad. In contrast, if inflation in other countries climbs at a faster rate than in theU.S., imports might become more expensive relative to what consumers will pay forAmerican-made products. In that case, shoppers—both here and abroad—will be temptedto buy more from the U.S., where prices are rising more slowly, if at all. So, low inflationhas a beneficial impact on this country’s trade flows.
Could the U.S. return to a positive trade balance, or, at the very least, sharply slashits deficits in the future? Sure, but it won’t be easy. One solution is for America’s majortrading partners to grow much faster than the U.S. for several years so that they canaccelerate their purchases of American products. However, such a plan is difficult toachieve because of the structural difference between the economies of the U.S. and, say,Europe or Japan. For example, the U.S. economy has a larger capital market, lower taxrates, and fewer regulatory obstacles than most other industrial countries. All these fac-tors help promote faster growth here than overseas.
Another approach to cutting the trade deficit, at least theoretically, is to induce aprolonged recession in the U.S. because that will surely reduce imports. But thisapproach is a non-starter as a policy option since a recession will only generate otherproblems, including larger budget deficits, higher unemployment, a loss in income, andslower productivity growth.
A third way to correct the trade imbalance is to significantly devalue or cheapen thedollar and make imports too expensive for many Americans. Yet this solution also carriesgrave risks, such as rising inflation and interest rates. In the final analysis, the only rea-sonable way to end the chronic trade deficits is a two-fold approach: Americans mustlearn to save more and consume less, and two, policymakers in Europe and Japan need tolower trade barriers, accelerate regulatory reforms, and reduce tax rates so that their citi-zens can have more money to spend on U.S. goods and services. So far, these regionshave been agonizingly slow in making such changes.
HOW IS IT COMPUTED
Each month, the Commerce Department tallies figures on U.S. exports (such as corn,telecommunications equipment, musical instruments, and computers) and imports (cars,steel, rugs, caviar, wines, and copper). Normally, they reflect transactions that actuallytook place in the reported month, though a small number of trades are included from pre-vious months. Exports are reported based on what is called “free alongside ship” (FAS)
225International Trade in Goods and Services
07Baumohl_Ch03.31-03.40.qxd 8/3/04 11:26 AM Page 225
value, which means the price of the commodity includes freight transport, insurance, andother charges connected with shipping the goods to the U.S. port of exportation. Imports,however, are valued on a “customs basis” (CIF), which is essentially the price of theproduct without the cost of insurance, freight, or import duties.
Trade in services is handled differently. Here the Commerce Department dependsentirely on monthly surveys taken by businesses and associations in the service sector tosee how much revenue these firms raised by selling services abroad, and, on the otherside of the ledger, how much American firms paid for services provided by foreigners.
Trade figures in the report are presented in both nominal (current) dollars and real(adjusted for inflation) dollars. The conversion from nominal to real is based on themonthly import and export price indexes (see the section on Import and Export Prices).While the nominal figures get all the immediate press attention, it’s more important tofollow the inflation-adjusted numbers because they reflect the actual volume of goodstraded, which is what ultimately impacts real GDP.
Trade statistics are given in both seasonally and non-seasonally adjusted terms.Normally they are not annualized, but anyone can do so by simply multiplying themonthly trade figure by 12.
THE TABLES: CLUES ON WHAT’S AHEAD FOR THE ECONOMY
There are dozens of informative tables in this near 50-page release. Some of the most usefulare highlighted in the following pages. It should be pointed out that international trade hasfew qualities as a leading indicator. The reason is that trade patterns change slowly due to thelong lag between the time contracts are signed and when goods actually get shipped. Doesthat diminish the value of this release to investors and forecasters? Absolutely not. TheCommerce Department provides amazingly detailed information in this report on America’sforeign trade position, including its transactions with virtually every country in the world.
• Exhibit 1 U.S. International Trade in Goods and Services
(1) The first table summarizes the U.S. trade balance for the latest period, alongwith about three years of monthly data so that readers can spot any departurefrom recent trends in exports and imports as well as the total trade balance. Aone-month aberration is not significant, but a continuous divergence spanning atleast three months can indicate a more significant change is underway in theU.S. or international economy.
(2) Look to see whether the departure in trade patterns stems from changes on theexport or import side. An abrupt drop in the export growth rate can occurbecause of deteriorating economic conditions in other countries, an overly mus-cular dollar, or sharply rising U.S. inflation. A marked decline in the imports cantake place if domestic demand has plunged due to a weakened U.S. economy, orperhaps as a consequence of a serious erosion in the dollar’s value in currencymarkets, which would make foreign goods much more expensive.
226 Chapter 3 • The Most Influential U.S. Economic Indicators
07Baumohl_Ch03.31-03.40.qxd 8/3/04 11:26 AM Page 226
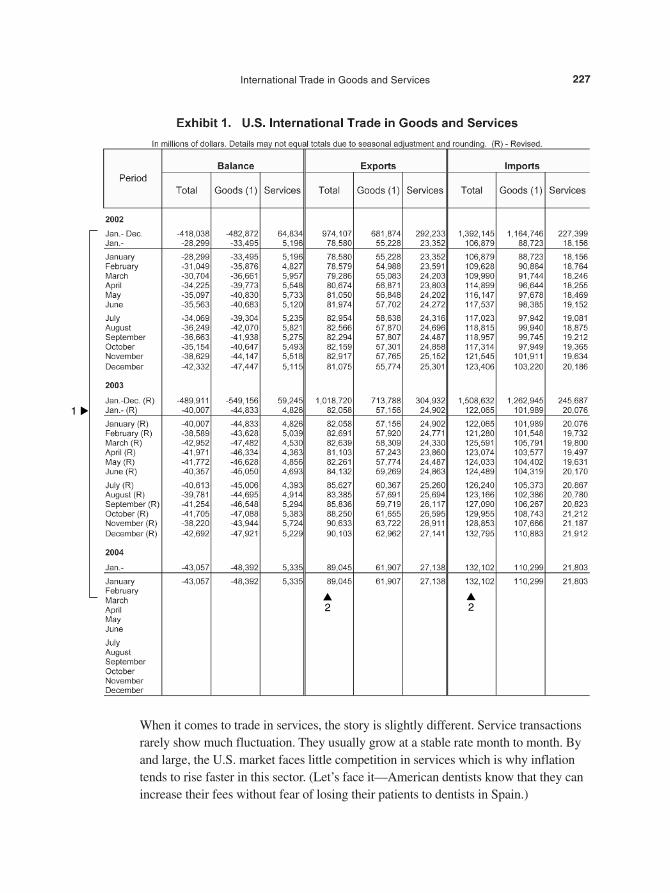
When it comes to trade in services, the story is slightly different. Service transactionsrarely show much fluctuation. They usually grow at a stable rate month to month. Byand large, the U.S. market faces little competition in services which is why inflationtends to rise faster in this sector. (Let’s face it—American dentists know that they canincrease their fees without fear of losing their patients to dentists in Spain.)
227International Trade in Goods and Services
▲2
▲2
▲
1
07Baumohl_Ch03.31-03.40.qxd 8/3/04 11:26 AM Page 227
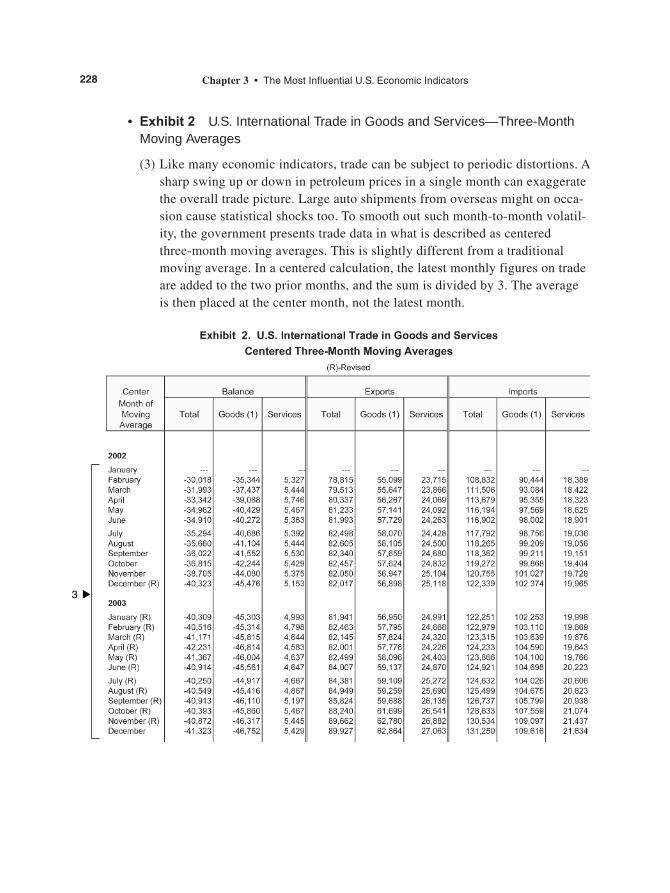
• Exhibit 2 U.S. International Trade in Goods and Services—Three-MonthMoving Averages
(3) Like many economic indicators, trade can be subject to periodic distortions. Asharp swing up or down in petroleum prices in a single month can exaggeratethe overall trade picture. Large auto shipments from overseas might on occa-sion cause statistical shocks too. To smooth out such month-to-month volatil-ity, the government presents trade data in what is described as centeredthree-month moving averages. This is slightly different from a traditionalmoving average. In a centered calculation, the latest monthly figures on tradeare added to the two prior months, and the sum is divided by 3. The averageis then placed at the center month, not the latest month.
228 Chapter 3 • The Most Influential U.S. Economic Indicators
▲3
07Baumohl_Ch03.31-03.40.qxd 8/3/04 11:26 AM Page 228
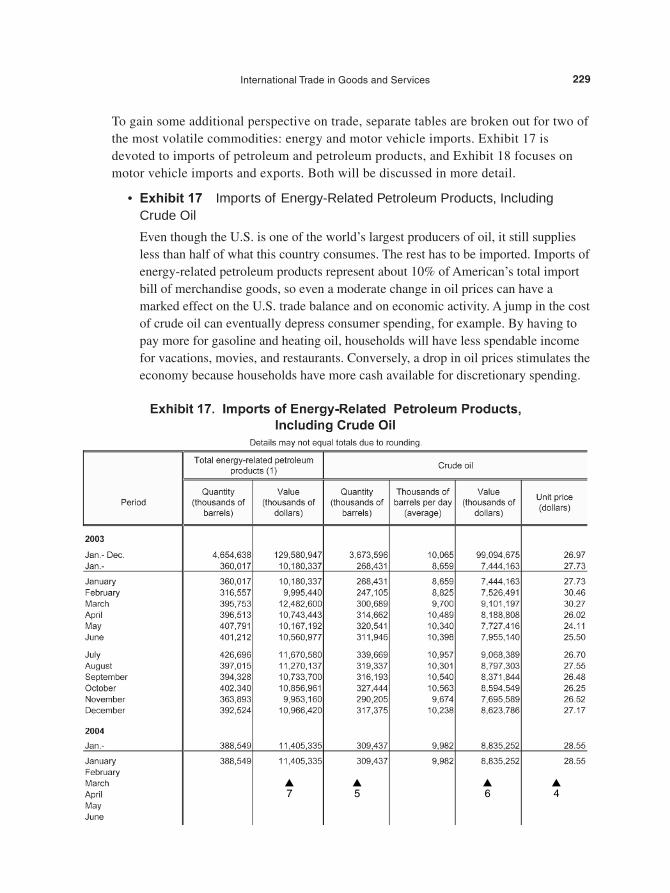
To gain some additional perspective on trade, separate tables are broken out for two ofthe most volatile commodities: energy and motor vehicle imports. Exhibit 17 isdevoted to imports of petroleum and petroleum products, and Exhibit 18 focuses onmotor vehicle imports and exports. Both will be discussed in more detail.
• Exhibit 17 Imports of Energy-Related Petroleum Products, IncludingCrude Oil
Even though the U.S. is one of the world’s largest producers of oil, it still suppliesless than half of what this country consumes. The rest has to be imported. Imports ofenergy-related petroleum products represent about 10% of American’s total importbill of merchandise goods, so even a moderate change in oil prices can have amarked effect on the U.S. trade balance and on economic activity. A jump in the costof crude oil can eventually depress consumer spending, for example. By having topay more for gasoline and heating oil, households will have less spendable incomefor vacations, movies, and restaurants. Conversely, a drop in oil prices stimulates theeconomy because households have more cash available for discretionary spending.
229International Trade in Goods and Services
▲7
▲5
▲6
▲4
07Baumohl_Ch03.31-03.40.qxd 8/3/04 11:26 AM Page 229

(4) This column lays out the average cost of oil per barrel imported into the U.S. forthe latest month.
(5) Here one finds the quantity of oil imported to the U.S by month.
(6) This is the monthly bill for importing crude.
(7) Located in this column is the total monthly cost of crude oil, plus other energy-related imports, including liquefied propane and butane gas.
For purposes of comparison, all this data is also presented on a historical basis thatgoes back more than 18 months.
• Exhibit 9 Exports, Imports, and Balance of Goods, Petroleum, and Non-Petroleum End-Use Category Totals (Not Shown)
Given how much oil can exaggerate the cost of imports, it is also useful to see tradefigures with petroleum excluded from the calculation. Exhibit 9 does just that; itsums up U.S. international trade minus petroleum imports.
• Exhibit 18 Exports and Imports of Motor Vehicles and Parts by SelectedCountries
By dedicating a table to motor vehicle trade, the Commerce Department demon-strates how singularly important this industry is to the economy. Nearly 7 millionAmerican workers are tied to the automotive manufacturing business, encompassing1 out of 20 jobs. Imports of cars and trucks make up more than 15% of all merchan-dise goods brought into this country, while exports of U.S.-built motor vehicles represent about 12% of all goods sold internationally. Exhibit 18 breaks down motorvehicle shipments by countries the U.S. exports to and imports from. This tableserves three purposes. First, purchases of such big-ticket items can offer insightsinto the health of consumer demand in the U.S. Second, the level of exports pro-vides information on how well the domestic manufacturing sector is performing.Finally, by analyzing the export data, one can get a few clues on the strength ofdemand in foreign countries.
230 Chapter 3 • The Most Influential U.S. Economic Indicators
07Baumohl_Ch03.31-03.40.qxd 8/3/04 11:26 AM Page 230
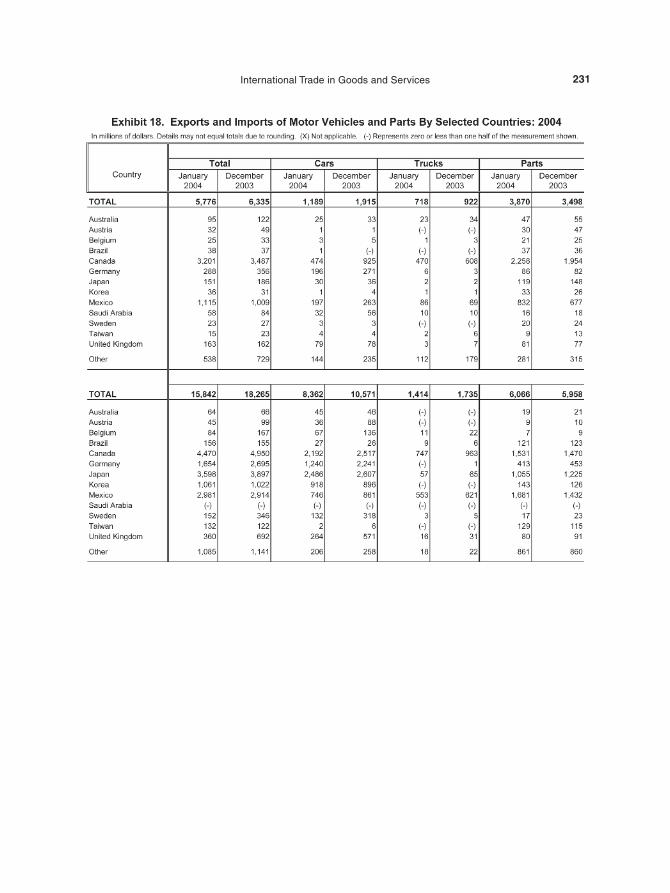
231International Trade in Goods and Services
07Baumohl_Ch03.31-03.40.qxd 8/3/04 11:26 AM Page 231
232 Chapter 3 • The Most Influential U.S. Economic Indicators
• Exhibit 10 Real Exports and Imports of Goods by Principal End-UseCategory (Adjusted for Inflation) (Not Shown)
It is best to look at trade in real terms. This is the only way one can determinechanges in the actual volume of goods traded. It strips away the distortive effects ofprice inflation and gives you a picture of the quantity of goods and services traded.Exhibit 10 adjusts both exports and imports for inflation, but only for merchandisegoods. Inflation-adjusted trade in services is available only on a quarterly basis withthe GDP report.
What’s valuable about this table is that net exports (exports minus imports) are a keycomponent in the GDP account. Thus, monitoring real net exports can offer an earlyglimpse of upcoming changes in the quarterly GDP growth rate.
• Exhibits 6, 7, and 8 Exports and Imports of Goods by Principal End-UseCategory and Commodity (Exhibits 7 and 8 Not Shown)
The minutiae of trade statistics in this report can easily scare away many readers,and that’s perfectly understandable. However, a few moments of study will showthat there is a veritable gold mine of information in these tables that could be helpfulto investors and business leaders.
Exhibit 6 divides the import and export of goods into six broad categories: foodsand beverages, industrial supplies, capital goods, automotive vehicles (plus partsand engines), consumer goods, and other goods. The table provides the readerwith a quick wrap-up of the sectors most responsible for the latest changes in thetrade balance. For example, if imports surged, was it the result of consumers buy-ing more cars, televisions, and wine, or because companies spent more on capitalgoods? It is preferable to have imports rise as a result of purchases of capitalgoods rather than consumer goods. Capital goods imports can help U.S. firms andfactories operate more efficiently, create more jobs, and reduce the risk of futureinflation. Imports of mostly consumer goods simply go to satisfy consumption,and by doing so, they exacerbate the trade deficit and add very little to the long-term health of the economy.
Exhibits 7 and 8 go one step further. Here you can identify 150 specific commoditycategories that have been imported and exported, including telecom equipment,computers, leather and furs, tractors, TVs, pleasure boats, drilling equipment, andtextile sewing machines. The data can help identify U.S. industries that are showingstronger sales overseas as well as reveal those domestic sectors possibly headed fortrouble because of inroads foreign competitors are making in the U.S. market.
07Baumohl_Ch03.31-03.40.qxd 8/3/04 11:26 AM Page 232
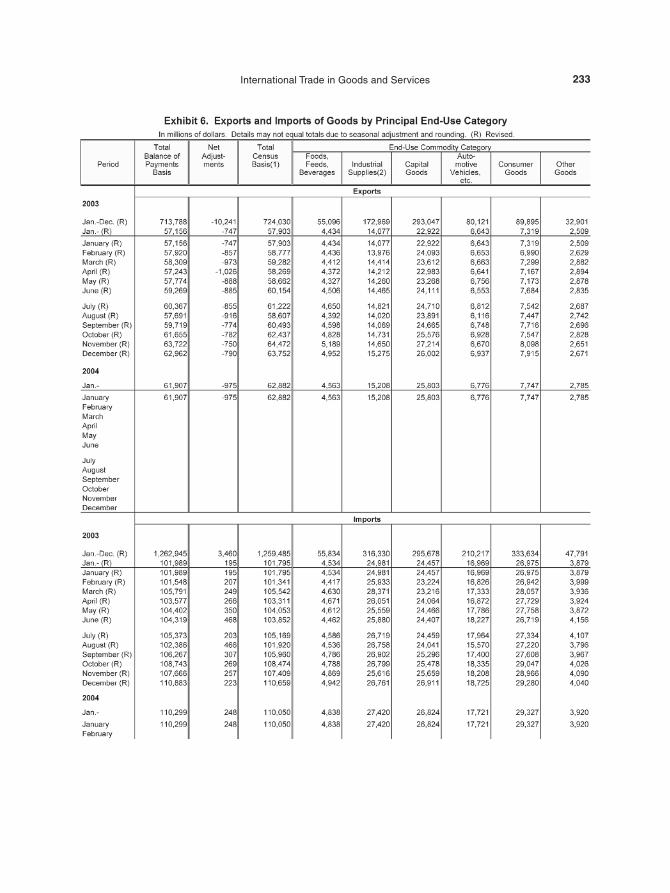
233International Trade in Goods and Services
07Baumohl_Ch03.31-03.40.qxd 8/3/04 11:26 AM Page 233
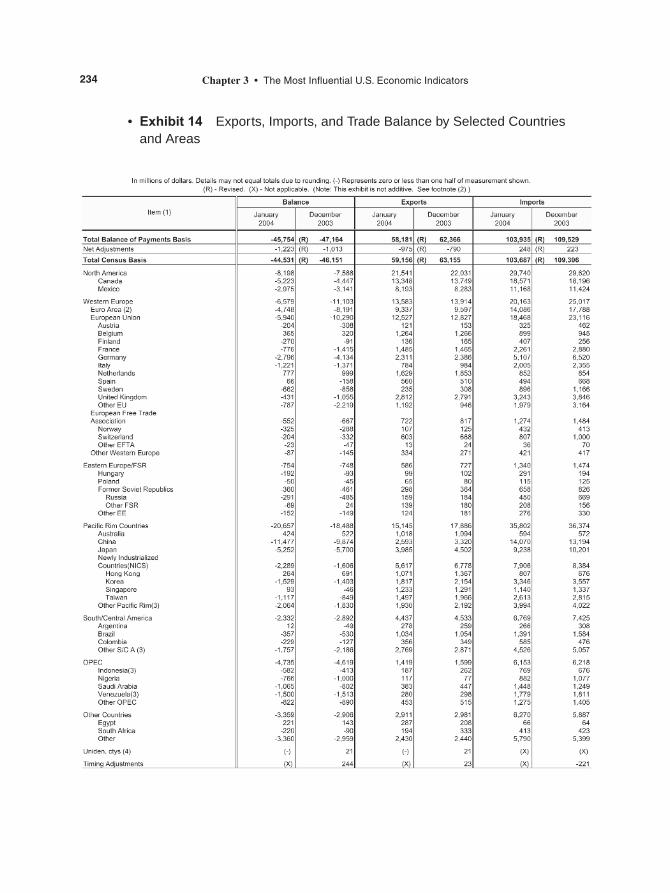
• Exhibit 14 Exports, Imports, and Trade Balance by Selected Countriesand Areas
234 Chapter 3 • The Most Influential U.S. Economic Indicators
07Baumohl_Ch03.31-03.40.qxd 8/3/04 11:26 AM Page 234
• Supplemental Section: Exhibit 6-a Exports, Imports, and Trade Balanceby Country and Area (Not Shown)
Both these tables show U.S. trade patters with individual countries. Exhibit 14records U.S. trade with three dozen of its major trading partners.
If you want a more detailed country-by-country breakdown, Exhibit 6-a (located in thesupplemental section of the release) shows trade between the U.S. and virtually everynation in the world. A chronic trade imbalance with certain countries can not only putpressure on currency rates but even affect foreign economic policy, especially whenunfair or illegal trading practices by other nations end up hurting U.S. producers.
MARKET IMPACT
Financial market reaction to the monthly trade data is tough to predict. Everyone recog-nizes the growing importance of international commerce to the U.S. economy and howflows of imports and exports can tip off investors about domestic demand, industry earn-ings, pricing power, and potential changes in currency values. What lessens the value ofthe international trade report is its late arrival. The trade balance is the last economicrelease by the Census Bureau each month and it reports on activity that took place twomonths back. So, it’s hard to get worked up when this report comes out. One factor thatmight provoke a sharp reaction is if the trade numbers significantly depart from what themarket or policymakers expected that month. Sudden changes in export or import flowscould have implications for GDP growth estimates and the dollar, and that could startlemarket participants.
Bonds
Anticipating how bond investors might respond to trade data can be very tricky. There’sno consistent pattern of response because much depends on the factors behind the latesttrade news. Here’s just a sample of the scenarios investors might face.
If the monthly trade deficit turns out to be smaller than expected, it could be viewedas good news for fixed incomes. The reason? The dollar often rallies in such casesbecause foreign investors prefer to see the U.S. trade gap shrink. A stronger dollar willhelp reduce inflation pressures in the U.S., and this can lift bond prices.
Note, however, that the same report can also be viewed negatively by bondholdersbecause a shrinking deficit can boost GDP growth. Greater exports or fewer imports—both of which can reduce the red ink in trade—means less is subtracted from the GDPaccount. If the cause is a surge in exports, it will further pump up the U.S. economy andthat can unnerve fixed-income investors and lead to a sell-off in bonds. On the otherhand, if the reason for the smaller deficit turns out to be a drop in imports, it suggests theU.S. economy might be weakening and this is considered good news for bond investors.
235International Trade in Goods and Services
07Baumohl_Ch03.31-03.40.qxd 8/3/04 11:26 AM Page 235
Now suppose that the trade deficit suddenly balloons. You might conclude that is badnews for bond investors. After all, this would normally put downward pressure on thedollar, which might raise both inflation and interest rates in the U.S. An increase in thetrade shortfall means that the U.S., which is already the world’s largest debtor nation, willhave to borrow even more money from foreign investors to finance these additionaldeficits. Ah, but there might also be good news here for bonds. A higher trade deficitcould also mean less economic growth because a jump in imports will subtract from theGDP account.
With such a dizzying assortment of possible outcomes in the bond market, what isone to do? First, don’t just look at the headline trade figures, but focus instead on thedynamics going on behind the scenes. If the trade balance improves, bond investors pre-fer the reason to be a fall in imports rather than a surge in exports. If the deficit climbs,traders hope the cause is a plunge in exports, which would at least ease economic output.
Stocks
This is not an easy call for equity players either. Basically, they prefer to see the deficitshrink as a result of vibrant demand for exports. That will keep U.S. factories humming,improve the outlook for corporate profits, and bolster the dollar’s value. The only wrinklehere would come from the bond market. Should export growth be so strong that it height-ens fears of inflation, interest rates would edge higher and spoil the party for stockinvestors. In the final analysis, though, stocks tend to do better if the trade balanceimproves due to an increase in sales overseas.
Dollar
While investors in the bond and stock markets agonize over how to respond to the latestinternational trade figures, currency traders take a more direct approach. Unless causedby a deep recession in the U.S., any improvement in the trade balance is viewed favor-ably for the dollar. The more goods and services foreigners buy from the U.S., the moredollars they’ll need to pay for these American products.
In contrast, a worsening trade deficit can undermine the dollar. To purchase foreigngoods and services, Americans have to sell dollars so they can pay for these products inlocal currencies. The problem is that foreign exchange traders are already swimming in asea of surplus dollars. Flooding the market with even more dollars can only furtherdepress the greenback’s value.
236 Chapter 3 • The Most Influential U.S. Economic Indicators
07Baumohl_Ch03.31-03.40.qxd 8/3/04 11:26 AM Page 236
CURRENT ACCOUNT BALANCE
(SUMMARY OF INTERNATIONAL TRANSACTIONS)
Market Sensitivity: Low to medium.
What Is It: The broadest accounting of America’s trade and investmentrelationship with the rest of the world.
News Release on Internet: www.bea.doc.gov/bea/rels.htm
Home Web Address: www.bea.doc.gov
Release Time: 8:30 A.M. (ET); data is released two and a half months after thereference quarter ends.
Frequency: Quarterly.
Source: Bureau of Economic Analysis, Commerce Department.
Revisions: Usually moderate. Annual benchmark changes are made in June.
WHY IS IT IMPORTANT
The explosion in world trade over the last several decades has fundamentally altered theU.S. economic landscape. More than 12 million American jobs are now tied to theexports sector; some 10 million are supported by importers. About a quarter of all U.S.business activity is now linked in some fashion to international commerce.
Given its importance to the U.S. economy, we need to delve a little deeper into pre-cisely what we mean here by trade. One aspect of it deals with the basic exchange ofgoods and services between the U.S. and other countries, an area that was explored in theprevious section on international trade. However, the International Transactions releaseprovides a more comprehensive accounting of where the U.S. stands in its economic tieswith the rest of the world. For instance, besides selling and buying goods and services inforeign markets, we need to keep in mind that the U.S. also imports and exports invest-ment capital. Every day, foreigners buy and sell U.S. stocks, bonds, and other types ofassets, and Americans are major buyers of similar assets overseas. Moreover, U.S.investors get paid a return (usually in the form of dividends and interest payments) ontheir investments abroad—income that flows back to this country. By the same token,foreigners get a return from their investment stake in U.S. assets. The quarterly U.S.international transactions report attempts to track all of these cross-border movements ofphysical goods and services, income flows from investments, and the purchases and salesof assets. It might sound complicated, but it really isn’t.
237Current Account Balance
07Baumohl_Ch03.31-03.40.qxd 8/3/04 11:26 AM Page 237
Let’s take a look at the international transactions release and see how all of this infor-mation is laid out. The report is divided into two sections. The first deals with the CurrentAccount, which includes the merchandise trade, services, investment income flows, andunilateral transfers. The second part is titled the Capital and Financial Accounts, whichtracks the movement of actual investments and loans into and out of the U.S.
Current Account
The current account balance summarizes the net change in four components:Merchandise Trade, Services, Income Flows, and Unilateral Transfers.
1. Merchandise Trade Account: This refers to goods or “visible” trade, such as theexport and import of cars, home electronics, bananas, bicycles, and calculators.The trade balance is the net difference between the value of goods Americans sellto other countries (exports) and the goods Americans buy from other countries(imports). Since the mid-1970s, the U.S. has recorded annual deficits by importingfar more products than it exported. Indeed, the gap is so large it is the prime reasonthe U.S. has suffered deficits in the overall current account.
2. Services Trade Account: The services account, or “invisible” trade, is the net resultof what Americans pay for services sold by foreigners (considered an import) andwhat foreigners spend on U.S. services (listed as an export). This kind of cross-bor-der business includes insurance, engineering, investment banking, public relations,accounting, and advertising services. Fees from patents, copyrights, and movies alsobelong to this category. The balance in the services account is the only component ofthe current account that has consistently shown a surplus, though it is not big enoughto offset the gaping shortfall from the merchandise trade account.
3. Income Account: A subcategory of the service account is the net income receivedfrom investing in foreign assets. When Americans invest in assets outside the U.S.,such as in European or Japanese stocks and bonds, the earnings received from thoseassets are classified as export income because they are earned from investmentsAmericans made abroad. Conversely, payments Americans make to foreigners whoinvest in U.S. assets are considered an import because they’re based on capitalshipped here. An income deficit occurs when the investment income paid to for-eigners exceeds the income foreigners pay U.S investors. For most of the post-World War II period, the U.S. maintained a surplus in the income account, but since2002, it too has slipped into the deficit column.
4. Unilateral Transfers: These represent one-way transfers of foreign aid, govern-ment grants, pension payments, and worker remittances (which occur when for-eigners working in the U.S. send money back to their families in another country).By definition, unilateral transfers show up as a negative in the current accountbecause they always involve money leaving U.S. shores.
238 Chapter 3 • The Most Influential U.S. Economic Indicators
07Baumohl_Ch03.31-03.40.qxd 8/3/04 11:26 AM Page 238
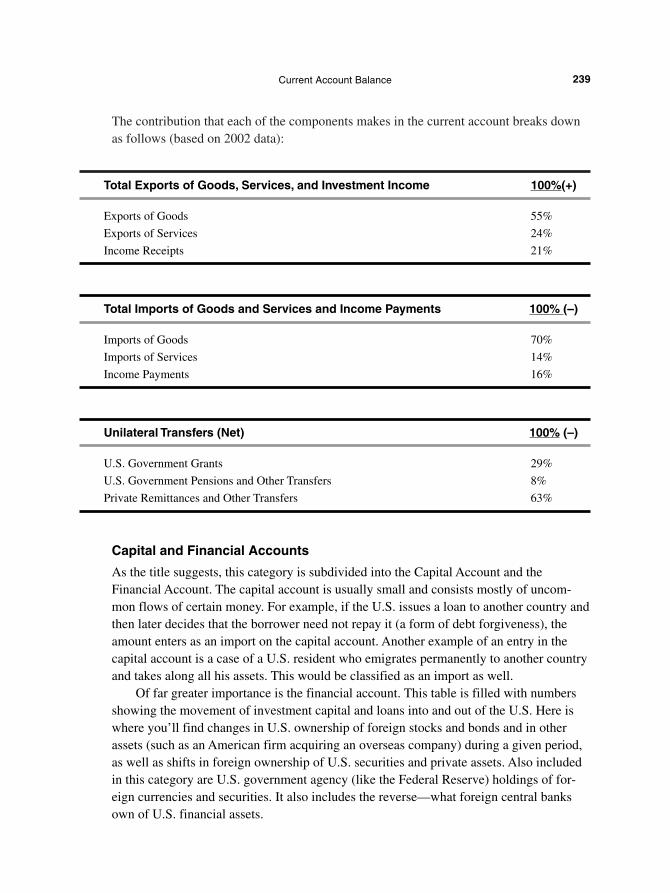
The contribution that each of the components makes in the current account breaks downas follows (based on 2002 data):
Total Exports of Goods, Services, and Investment Income 100%(+)
Exports of Goods 55%
Exports of Services 24%
Income Receipts 21%
Total Imports of Goods and Services and Income Payments 100% (–)
Imports of Goods 70%
Imports of Services 14%
Income Payments 16%
Unilateral Transfers (Net) 100% (–)
U.S. Government Grants 29%
U.S. Government Pensions and Other Transfers 8%
Private Remittances and Other Transfers 63%
Capital and Financial Accounts
As the title suggests, this category is subdivided into the Capital Account and theFinancial Account. The capital account is usually small and consists mostly of uncom-mon flows of certain money. For example, if the U.S. issues a loan to another country andthen later decides that the borrower need not repay it (a form of debt forgiveness), theamount enters as an import on the capital account. Another example of an entry in thecapital account is a case of a U.S. resident who emigrates permanently to another countryand takes along all his assets. This would be classified as an import as well.
Of far greater importance is the financial account. This table is filled with numbersshowing the movement of investment capital and loans into and out of the U.S. Here iswhere you’ll find changes in U.S. ownership of foreign stocks and bonds and in otherassets (such as an American firm acquiring an overseas company) during a given period,as well as shifts in foreign ownership of U.S. securities and private assets. Also includedin this category are U.S. government agency (like the Federal Reserve) holdings of for-eign currencies and securities. It also includes the reverse—what foreign central banksown of U.S. financial assets.
239Current Account Balance
07Baumohl_Ch03.31-03.40.qxd 8/3/04 11:26 AM Page 239

Taken together, the current account and the financial and capital accounts make upAmerica’s balance of payments, which represents all economic transactions between theU.S. and the rest of the world.
So how does the U.S. stack up in its trade and financial affairs? Not too well!Americans love to spend and borrow, even if it is beyond their means to do so. Since the1980s, the U.S has consistently consumed far more than it produces, which meansAmericans increasingly rely on imports to satisfy their enormous appetites. However, tofinance all this consumption, the U.S. has to borrow, on average, more than $1 billionevery day from other nations. The result is that America has become the largest debtornation in the world, owing foreigners more than $3 trillion as of 2003. This figure is pro-jected to rise to $5 trillion by 2005. Can such a build-up in debt continue indefinitely?No. The problem is that no one is sure at what point this massive and still-growing debtwill begin to seriously destabilize the U.S. and global economy.
HOW IS IT COMPUTED
Since there are numerous elements to the International Transactions account, the Bureauof Economic Analysis (BEA) has to rely on many sources for data. Trade in goods andservices comes essentially from the monthly international trade report. Investment earn-ings are calculated using estimates of holdings, dividend-payout ratios, and interest rates,based on information from corporate reports and the U.S. Treasury. Travel receipts andpayments are derived from two places. The BEA gets U.S. and foreign travel data directlyfrom the Mexican and Canadian governments. For travel to Europe, Asia, and elsewhere,the agency relies on surveys taken by passengers while in flight either arriving into orleaving the U.S.
The data in the current account and the capital and financial accounts is seasonallyadjusted, but it is not annualized. The data represents quarterly changes in trade andinvestment flows, or the year-end totals. The current account is not adjusted for inflation.
THE TABLES: CLUES ON WHAT’S AHEAD FOR THE ECONOMY
• Table 1 U.S. International Transactions—Current Account
To get a snapshot of where the U.S. stands in its trade and financial relationship withthe rest of the world, go directly to the memoranda section at the very end of Table 1and review lines 71 to 76. The result is the current account balance for the latestquarter. A negative figure reflects how much the U.S. has to borrow from overseasto help finance the appetite of American consumers, business, and government.
Can the U.S. afford to sink deeper into debt with the rest of the world? This is no aca-demic question. There has been a vigorous debate in the economics profession about how
240 Chapter 3 • The Most Influential U.S. Economic Indicators
07Baumohl_Ch03.31-03.40.qxd 8/3/04 11:26 AM Page 240
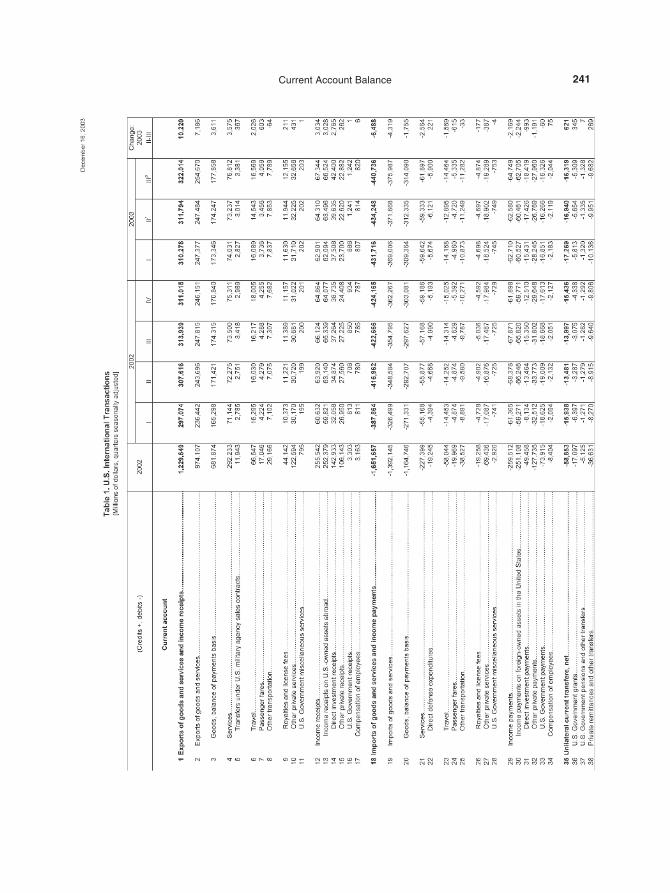
241Current Account Balance
07Baumohl_Ch03.31-03.40.qxd 8/3/04 11:26 AM Page 241
dangerous the unending stream of current account deficits is to the future health of theU.S. economy. Many are raising alarms that if the red ink continues, sooner or later for-eign creditors will decide to lessen their exposure to the U.S. economy and its stock andbond markets. The consequences of such a step could be disastrous. The dollar could dra-matically weaken, and both inflation and interest rates will be driven higher.
Others argue that while these deficits cannot go on indefinitely, the U.S. economy isnot in any imminent danger. If the U.S. imports a lot more, it just reflects how muchstronger and healthier the American economy is compared with other countries. In addi-tion, the U.S. is perceived as a stable and attractive place to invest because of its liquidity,creditworthiness, and robust productivity growth. Finally, some will argue there is nodirect link between a country’s current account balance and its economic health. Just lookat Japan; it had current account surpluses in the 1990s, yet its economy was stuck in a vir-tual depression throughout that decade.
Who’s right here? That’s a tough question to answer because economic theory pro-vides little guidance on the consequences of long-term current account deficits.Practically speaking, current account deficits cannot be sustained because foreigninvestors will at some point conclude that their loan portfolios are saturated with dollars.In the interest of prudence, these investors could decide to shun U.S. financial assets anddiversify into other currencies. Precisely when this shift will take place is unknown.However, the prospect of such a reversal in sentiment against the dollar is unsettlingenough. To keep foreign investors interested in the U.S. and increase their holdings ofdollar-denominated securities and loans, interest rates in this country will have to risehigh enough to reward foreign creditors for the extra risk they face for carrying all thosedollars. Of course, the downside of that scenario is that high interest rates can also deraileconomic growth in the U.S.
Here are a couple of key components in the current account worth noting because oftheir impact on certain U.S. business sectors:
Travel: Money spent by foreign tourists in the U.S. is considered an export item, andexpenditures by Americans in other countries are classified as an import. (Think of it interms of who gets the revenues from tourism.) Since the U.S. is a popular tourist destina-tion for people from all over the world, this country has traditionally had a surplus in thetravel account. Compare lines 6 (travel by foreigners to the U.S.) and 23 (travel byAmericans to other countries), and you can see whether foreign tourists have spent morein the U.S. than American travelers did in other countries, and by how much. The resultshave business implications for the lodging and transportation sectors.
Income Receipts and Payments: Two main categories are listed here. Line 13 (Incomereceipts on U.S.-owned assets abroad) shows how much income Americans receivedfrom their international investments, such as interest income and dividends as well asreturns from other types of assets owned in other countries. Line 30 (Income paymentson foreign-owned assets in the U.S.) represents what the U.S. paid to foreigners fortheir investments in this country.
242 Chapter 3 • The Most Influential U.S. Economic Indicators
07Baumohl_Ch03.31-03.40.qxd 8/3/04 11:26 AM Page 242
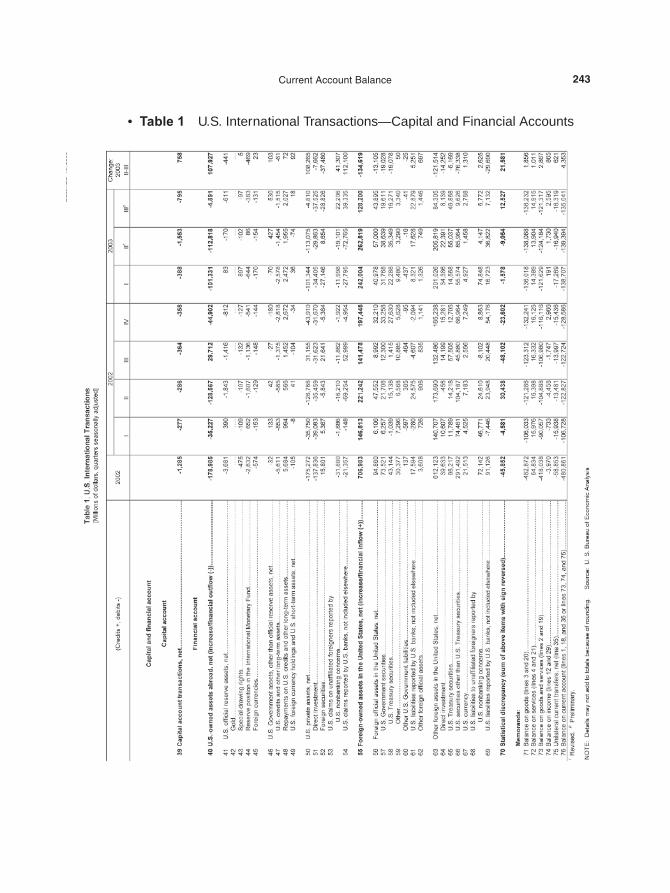
• Table 1 U.S. International Transactions—Capital and Financial Accounts
243Current Account Balance
07Baumohl_Ch03.31-03.40.qxd 8/3/04 11:26 AM Page 243
Line 40. Net U.S.-owned assets abroad: Americans frequently buy and sell assets inother countries. This line tells the change in the amount of foreign assets held by theU.S. government and private Americans.
Line 50. Net U.S. private assets: Here you’ll find the net change in the private owner-ship of assets outside the U.S. This is further segmented into two groups: direct invest-ments (as in buying a foreign company or factory) and foreign securities on lines 51and 52, respectively.
Line 55. Net foreign-owned assets in the United States: This is the foreign side of thetransaction—specifically, the total change in foreign ownership of U.S. assets. It com-bines both private and government holdings.
Line 63. Other net foreign assets in the United States: A subset of line 55, this looks atthe change in private foreign sector holdings of U.S. assets. This is further divided intodirect investments (line 64), U.S. Treasuries (line 65), and other securities (line 66).
MARKET IMPACT
Bonds
There is little tradable value in the international transaction report. It is a quarterly indica-tor with a headline that carries few surprises for the fixed income market because other,more timely monthly measures, such as international trade, have already told much of thestory. Nor does the current account balance stand out as some sort of leading indicator.This report, however, does get a lot of attention from economists and policymakers inWashington because of concerns that mounting current accounts deficits could at somepoint jeopardize U.S. economic growth.
Stocks
This release has virtually no impact on equity prices.
Dollar
Traders in the foreign exchange markets do look over the report. A deterioration in theU.S. current account balance will over time erode the value of the dollar. However, noone knows with any certainty when these burgeoning deficits will tip the greenback overthe cliff. Conversely, if America’s trade balance reverses course and begins to movecloser to surplus, it would be considered highly bullish for the U.S. currency, thoughmuch depends on what’s behind this improvement. If it’s the result of a deep recession inthe U.S., with import demand plummeting, foreigners will likely shy away from the dol-lar. If current account deficits were to narrow as a result of greater international demandfor U.S. goods and services, the dollar should appreciate in value in the currency markets.
244 Chapter 3 • The Most Influential U.S. Economic Indicators
07Baumohl_Ch03.31-03.40.qxd 8/3/04 11:26 AM Page 244
CONSUMER PRICE INDEX (CPI)
Market Sensitivity: Very high.
What Is It: Most popular measure of price inflation in retail goods and services.
News Release on Internet: www.bls.gov/cpi/
Home Web Address: www.bls.gov/
Release Time: 8:30 A.M. (ET); released the second or third week following themonth being covered.
Frequency: Monthly.
Source: Bureau of Labor Statistics, Department of Labor.
Revisions: No monthly revisions. Only annual changes are introduced inFebruary with the release of the January CPI data. Revisions then can goback five years.
WHY IS IT IMPORTANT
Along with the employment report, the Consumer Price Index (CPI) is another one ofthose red-hot economic indicators that is carefully dissected by the financial markets. It’sfairly obvious why it gets so much attention. Inflation touches everyone. It determineshow much consumers pay for goods and services, affects the cost of doing business,causes havoc with personal and corporate investments, and influences the quality of lifefor retirees. Moreover, the outlook for inflation helps set labor contracts and governmentfiscal policy.
Changes in the CPI also alter the benefits of 50 million Social Security recipients and20 million people on food stamps. Landlords take inflation forecasts into account to lockin future hikes in rental contracts. Judges even refer to the CPI to compute alimony andchild support payments. In short, the effects of inflation are ubiquitous. No one canescape its reach.
Where it gets a little tricky is how to measure inflation. No less than half a dozeneconomic indicators purport to gauge changes in prices. They include the personal con-sumption expenditures price index, producer prices, import prices, employment costindex, unit labor costs, and the GDP deflator. Each has its strengths and weaknesses. Forexample, the GDP inflation indices cover a much broader range of items than the CPI, butthe former is released only quarterly, whereas the CPI is published monthly. And whilethe producer price index is a monthly inflation measure, it reflects price changes mostlyat the wholesale business level and does not include the cost of services. In contrast, morethan half of the CPI consists of services which is the fastest-growing part of the economy.This makes the CPI more relevant to consumers and workers.
245Consumer Price Index
07Baumohl_Ch03.31-03.40.qxd 8/3/04 11:26 AM Page 245
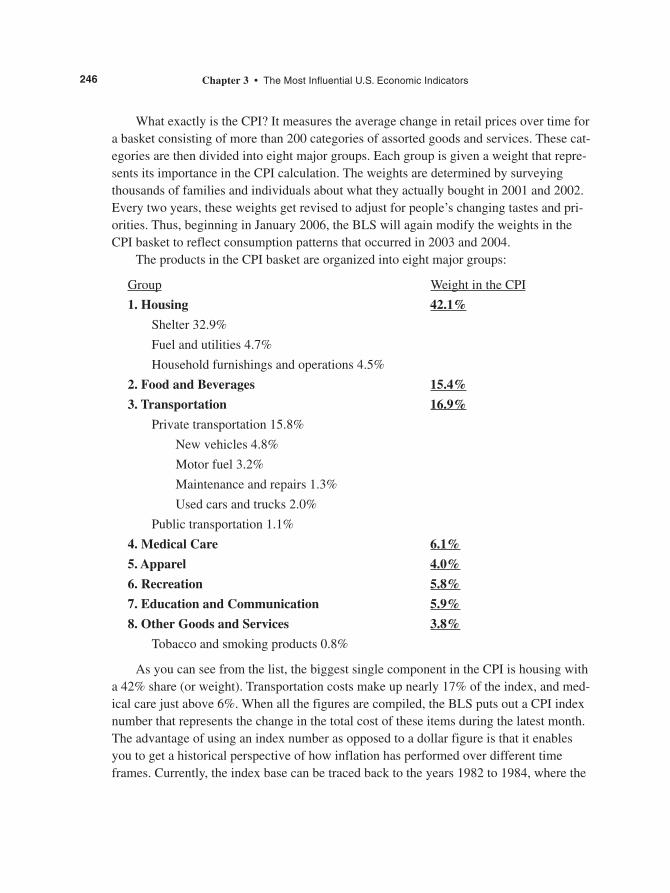
What exactly is the CPI? It measures the average change in retail prices over time fora basket consisting of more than 200 categories of assorted goods and services. These cat-egories are then divided into eight major groups. Each group is given a weight that repre-sents its importance in the CPI calculation. The weights are determined by surveyingthousands of families and individuals about what they actually bought in 2001 and 2002.Every two years, these weights get revised to adjust for people’s changing tastes and pri-orities. Thus, beginning in January 2006, the BLS will again modify the weights in theCPI basket to reflect consumption patterns that occurred in 2003 and 2004.
The products in the CPI basket are organized into eight major groups:
Group Weight in the CPI
1. Housing 42.1%
Shelter 32.9%
Fuel and utilities 4.7%
Household furnishings and operations 4.5%
2. Food and Beverages 15.4%
3. Transportation 16.9%
Private transportation 15.8%
New vehicles 4.8%
Motor fuel 3.2%
Maintenance and repairs 1.3%
Used cars and trucks 2.0%
Public transportation 1.1%
4. Medical Care 6.1%
5. Apparel 4.0%
6. Recreation 5.8%
7. Education and Communication 5.9%
8. Other Goods and Services 3.8%
Tobacco and smoking products 0.8%
As you can see from the list, the biggest single component in the CPI is housing witha 42% share (or weight). Transportation costs make up nearly 17% of the index, and med-ical care just above 6%. When all the figures are compiled, the BLS puts out a CPI indexnumber that represents the change in the total cost of these items during the latest month.The advantage of using an index number as opposed to a dollar figure is that it enablesyou to get a historical perspective of how inflation has performed over different timeframes. Currently, the index base can be traced back to the years 1982 to 1984, where the
246 Chapter 3 • The Most Influential U.S. Economic Indicators
07Baumohl_Ch03.31-03.40.qxd 8/3/04 11:26 AM Page 246
average price in the basket has been assigned a value of 100. Thus, if the CPI index stoodat 200 at the end of the year and increased in the first six months of the following year to202, inflation rose 1% in the first half of the year, or, if you annualize it, prices jumped ata 2% rate.
How does inflation get started in the first place, and is it really all that bad for theeconomy? There are two popular explanations for what causes inflation. One is based onthe Monetarist view that excessive growth in the money supply is the culprit behindsharply rising prices. If the supply of money increases at a faster rate than the output ofgoods and services, you’ve got a problem, because ultimately it will mean that too muchmoney will be chasing too few products. The result is that prices for these scarce but pop-ular items are bid up and—voila!—you have inflation.
The second explanation puts less emphasis on the money supply and more on theoverall demand for goods and services. This is the Keynesian view, known for its chiefproponent, John Maynard Keynes. It argues that when overall demand (from consumers,businesses, the government, and foreign buyers who want American products) greatlyexceeds the economy’s ability to satisfy it, the resulting shortage in supply can drive upthe price of goods and services and cause inflation to accelerate. How fast inflation willincrease depends on where the economy stands in the business cycle, or, more specifi-cally, on how much production slack is left in the economy. A powerful pickup in demandfor goods and services immediately following a recession is not inflationary becausethere will likely be ample supplies and idle capacity to tap. It is only later in the cycle,when material and labor resources become increasingly scarce, that continued strongdemand can fire up inflation pressures.
Equally interesting is the question of whether inflation is a bad thing. After all,higher prices allow companies to generate more revenues, which can boost stock pricesand enrich investors, large and small. Federal and state governments count on inflation togenerate more tax revenues, which go to help balance the federal budget or finance newgovernment spending programs. Large borrowers don’t mind inflation because they canrepay their loans with cheaper dollars.
So what’s so awful about inflation? Plenty. Inflation creates a climate of instabilityand uncertainty and invites distortions in the economy. Sure, firms would love to see theirrevenues increase, but they prefer to accomplish this by selling more products, rather thanby simply raising prices. Furthermore, companies can suffer like anyone else from infla-tion, especially if their own suppliers decide to bump up prices. Company employees alsodemand higher pay to offset the increased cost of living due to inflation. In addition,while Congress might quietly admit that inflation brings in more tax revenues, electedofficials also know that rising inflation can anger voters who see their purchasing powereroding. That can cause them to take out their frustrations on Election Day. So is inflationharmful? Absolutely.
247Consumer Price Index
07Baumohl_Ch03.31-03.40.qxd 8/3/04 11:26 AM Page 247
The only time inflation is deliberately sought is when an economy comes face toface with the threat of deflation, a phenomenon where prices across the board spiraldownward. To be sure, falling prices initially sound great to shoppers. But make nomistake—deflation can be as destructive to an economy as inflation. Tumbling pricesslash corporate profits, which, in turn, can lead to job layoffs. Higher unemploymentreduces household income, and that causes a retrenchment in consumer spending. Asmore consumers back away from shopping, prices drop further and companies areforced to let go of additional workers. It’s a vicious cycle of an economy in utter col-lapse. The U.S. suffered deflation during the Great Depression. Between 1929 and1933, the CPI dropped 24%. As recently as 2001 and 2002, Japan was stuck in a deflationary spiral from which it could not recover, even though interest rates dropped to essentially zero. Its economy was unable to grow and joblessness rose toan all-time high.
Ideally, the goal of government—specifically the Federal Reserve—is to avoid bothharmful inflation and deflation by pursuing policies that promote price stability. In practi-cal terms, that means tolerating only a modest level of inflation, with prices inching up nomore than 1% to 2% a year.
HOW IS IT COMPUTED
In the first three weeks of every month, agents from the Bureau of Labor Statistics (BLS)check out stores and conduct telephone interviews with about 23,000 retail outlets andother businesses located in 87 urban areas. Prices are collected on 80,000 items and serv-ices, including eyeglasses, hamburgers, dental exams, cars, gasoline, legal fees, beer,computers, breakfast cereal, and funeral services. Every month, the same basket of goodsand services is analyzed to get a sense of how prices are behaving. Because home rentalcosts do not change very much, the BLS obtains new pricing information from about50,000 housing units only every six months.
Seasonal adjustment factors are applied to all data to correct for typical variationsthat can occur during the year. For example, prices for oranges and other fruits typicallyedge higher in the winter because that’s when supplies for such foods dwindle, eventhough demand remains strong. Seasonal adjustments try to iron out such abrupt shifts inprices, but the process is imperfect. For instance, oil prices can fluctuate wildly as a resultof geopolitical shocks.
To reduce some of the statistical noise in the inflation data and to provide a betterunderstanding of the genuine trend in inflation, the government publishes an index knownas the core-CPI, which is the CPI, but without the unstable components of food and energy.Most economists see core-CPI as the best measure of the underlying inflation rate.
248 Chapter 3 • The Most Influential U.S. Economic Indicators
07Baumohl_Ch03.31-03.40.qxd 8/3/04 11:26 AM Page 248
CPI-W Versus CPI-U
After receiving the raw data and subjecting it to seasonal adjustment factors, the BLSthen comes up with inflation figures for two different population groups. One index iscalled the CPI-W (with the “W” standing for wage earners and clerical workers). It cov-ers 32% of the working population. While only one in three employees is covered, theCPI-W is still important to monitor because it’s the benchmark used to figure out payincreases in collective bargaining agreements and for yearly cost-of-living adjustments onSocial Security checks.
The other and much broader measure is the CPI-U (for all urban workers), which notonly includes wage and clerical workers but also professionals, the self-employed, man-agers, technical workers, and short-term workers. It’s a broad-enough population to cover87% of consumers. Because it comprises so many more people, the CPI-U gets most ofthe attention in the media and financial markets.
Geographic Coverage
Besides measuring how inflation behaved at the national level, the monthly CPI releasealso describes how prices changed in different regions in the country. This enables ana-lysts to compare cost-of-living changes in a variety of communities. For example, theBLS publishes inflation data for 14 specific local areas. They were chosen because oftheir size and importance to the economy. Of the 14 regions, the BLS releases inflationdata on three of them every month:
• Chicago-Gary-Kenosha, IL-IN-WI
• Los Angeles-Riverside-Orange County, CA
• New York-Northern NJ-Long Island, NY-NJ-CT-PA
Data for the other eleven metropolitan areas is published every other month to makethe price collection process more manageable.
THE TABLES: CLUES ON WHAT’S AHEAD FOR THE ECONOMY
The CPI has only limited value as a forecasting tool. It can point to a couple of inflationhot spots that could become problematic for an economy down the road. This enablesbusinesses to anticipate costs ahead of time. Evidence that inflation pressures are mount-ing can also help money managers reassess investment strategies. Union leaders rely oninflation forecasts to negotiate better pay terms for their rank and file. What the CPI can-not do, however, is function as a leading indicator of economic activity. If anything, theCPI is a lagging indicator. Price increases start to ease after a recession is well under wayand don’t accelerate again until a year or more after the recovery has begun. Therefore, ithas no real value as a predictor of turning points in the economy.
249Consumer Price Index
07Baumohl_Ch03.31-03.40.qxd 8/3/04 11:26 AM Page 249
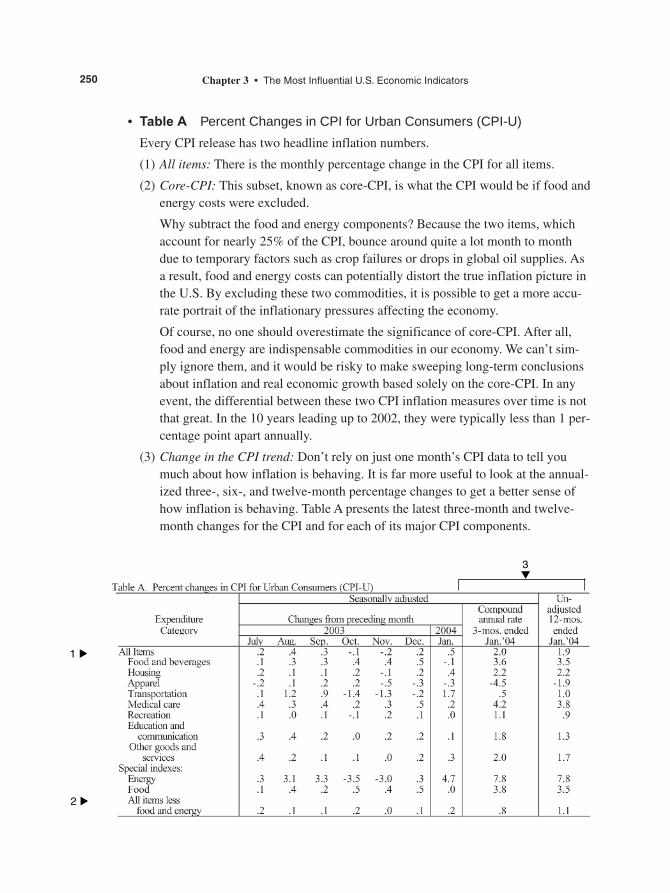
• Table A Percent Changes in CPI for Urban Consumers (CPI-U)
Every CPI release has two headline inflation numbers.
(1) All items: There is the monthly percentage change in the CPI for all items.
(2) Core-CPI: This subset, known as core-CPI, is what the CPI would be if food andenergy costs were excluded.
Why subtract the food and energy components? Because the two items, whichaccount for nearly 25% of the CPI, bounce around quite a lot month to monthdue to temporary factors such as crop failures or drops in global oil supplies. Asa result, food and energy costs can potentially distort the true inflation picture inthe U.S. By excluding these two commodities, it is possible to get a more accu-rate portrait of the inflationary pressures affecting the economy.
Of course, no one should overestimate the significance of core-CPI. After all,food and energy are indispensable commodities in our economy. We can’t sim-ply ignore them, and it would be risky to make sweeping long-term conclusionsabout inflation and real economic growth based solely on the core-CPI. In anyevent, the differential between these two CPI inflation measures over time is notthat great. In the 10 years leading up to 2002, they were typically less than 1 per-centage point apart annually.
(3) Change in the CPI trend: Don’t rely on just one month’s CPI data to tell youmuch about how inflation is behaving. It is far more useful to look at the annual-ized three-, six-, and twelve-month percentage changes to get a better sense ofhow inflation is behaving. Table A presents the latest three-month and twelve-month changes for the CPI and for each of its major CPI components.
250 Chapter 3 • The Most Influential U.S. Economic Indicators
▲
1
▲
2
3▼
07Baumohl_Ch03.31-03.40.qxd 8/3/04 11:26 AM Page 250
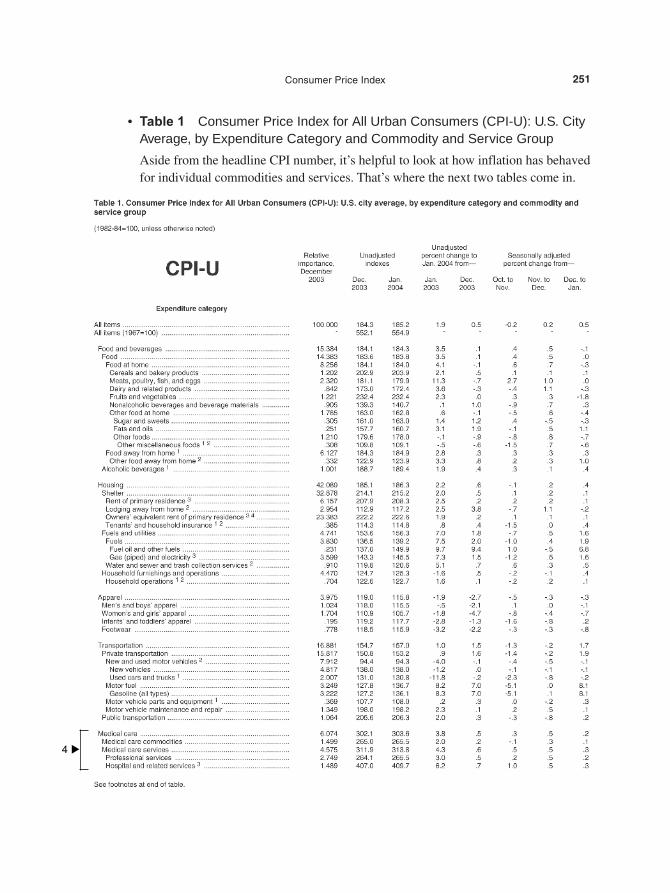
• Table 1 Consumer Price Index for All Urban Consumers (CPI-U): U.S. CityAverage, by Expenditure Category and Commodity and Service Group
Aside from the headline CPI number, it’s helpful to look at how inflation has behavedfor individual commodities and services. That’s where the next two tables come in.
251Consumer Price Index
▲
4
07Baumohl_Ch03.31-03.40.qxd 8/3/04 11:26 AM Page 251
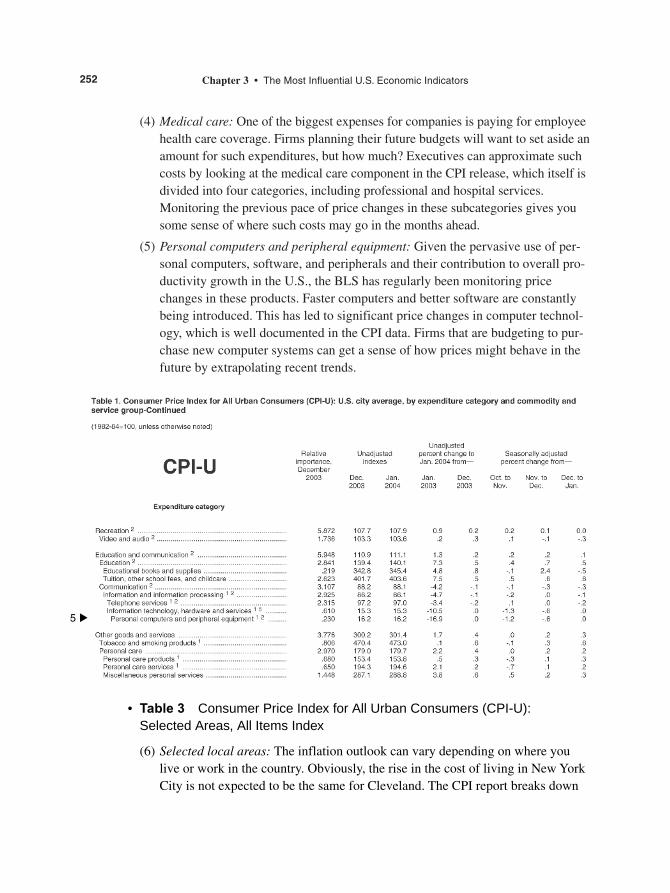
(4) Medical care: One of the biggest expenses for companies is paying for employeehealth care coverage. Firms planning their future budgets will want to set aside anamount for such expenditures, but how much? Executives can approximate suchcosts by looking at the medical care component in the CPI release, which itself isdivided into four categories, including professional and hospital services.Monitoring the previous pace of price changes in these subcategories gives yousome sense of where such costs may go in the months ahead.
(5) Personal computers and peripheral equipment: Given the pervasive use of per-sonal computers, software, and peripherals and their contribution to overall pro-ductivity growth in the U.S., the BLS has regularly been monitoring pricechanges in these products. Faster computers and better software are constantlybeing introduced. This has led to significant price changes in computer technol-ogy, which is well documented in the CPI data. Firms that are budgeting to pur-chase new computer systems can get a sense of how prices might behave in thefuture by extrapolating recent trends.
252 Chapter 3 • The Most Influential U.S. Economic Indicators
• Table 3 Consumer Price Index for All Urban Consumers (CPI-U):Selected Areas, All Items Index
(6) Selected local areas: The inflation outlook can vary depending on where youlive or work in the country. Obviously, the rise in the cost of living in New YorkCity is not expected to be the same for Cleveland. The CPI report breaks down
▲
5
07Baumohl_Ch03.31-03.40.qxd 8/3/04 11:26 AM Page 252
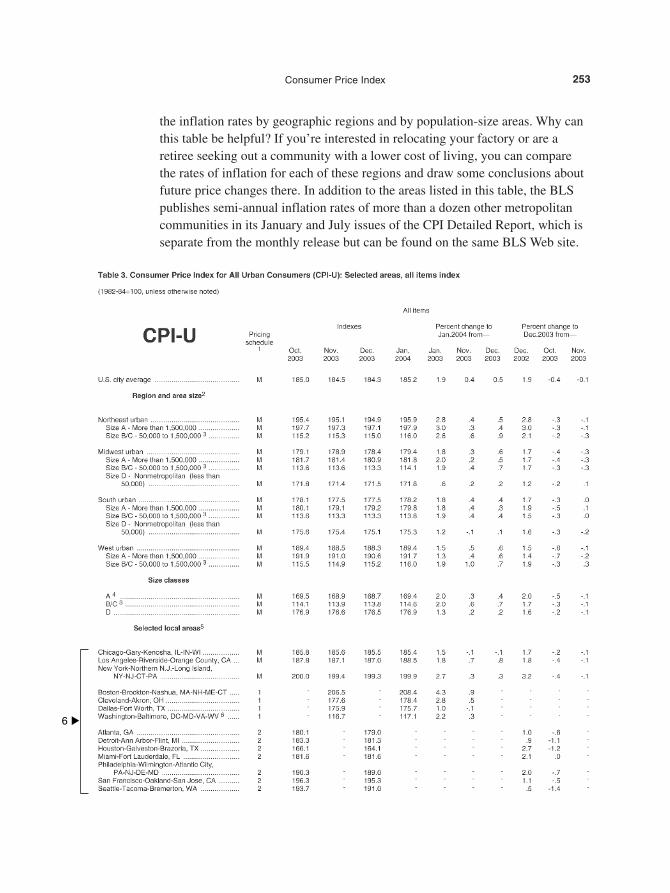
the inflation rates by geographic regions and by population-size areas. Why canthis table be helpful? If you’re interested in relocating your factory or are aretiree seeking out a community with a lower cost of living, you can comparethe rates of inflation for each of these regions and draw some conclusions aboutfuture price changes there. In addition to the areas listed in this table, the BLSpublishes semi-annual inflation rates of more than a dozen other metropolitancommunities in its January and July issues of the CPI Detailed Report, which isseparate from the monthly release but can be found on the same BLS Web site.
253Consumer Price Index
▲
6
07Baumohl_Ch03.31-03.40.qxd 8/3/04 11:26 AM Page 253
MARKET IMPACT
Bonds
An unexpected jump in the CPI can slash of bond values and propel yields higher. Bondlosses are likely to be even worse if the core-CPI surges as well, because it represents adeterioration in the underlying rate of inflation. Conversely, a benign CPI report showinglittle or no inflation is bullish for fixed income securities, with bond prices generally ris-ing and interest rates easing.
Stocks
Equity investors also detest sharp increases in the CPI, especially core-CPI, because itleads to higher bond rates, which raises the cost of corporate borrowing. While revenuesand perhaps even profits might jump in an inflationary environment, that kind of income isworth much less to shareholders, who prefer to see earnings improve from greater salesvolume, not price hikes. Furthermore, the threat of inflation will almost certainly force theFederal Reserve to jump in and raise interest rates, which is also anathema to shareholders.
In contrast, if inflation is quiescent, it will keep interest rates from rising and buoystock prices. Investors usually place a higher value on the stream of future earnings atsuch times because it will stem from greater sales and/or higher productivity.
Dollar
The effect inflation has on the dollar is less clear. As is often the case in a healthy eco-nomic expansion, rising U.S. interest rates can make the dollar attractive. But if ratessurge primarily on account of growing inflation concerns, it can hurt the U.S. currency.Higher U.S. inflation erodes the value of dollar-based investments held by foreigners, soa sustained increase in the CPI can have a negative influence on the greenback.
Having said that, bear in mind that currency traders are also sensitive to othernuances. For instance, if players in the foreign exchange markets believe the FederalReserve has moved quickly and deftly to smother inflation pressures, it’s likely the dollarwill hold its ground or even appreciate in value.
254 Chapter 3 • The Most Influential U.S. Economic Indicators
07Baumohl_Ch03.31-03.40.qxd 8/3/04 11:26 AM Page 254
PRODUCER PRICE INDEX (PPI)
Market Sensitivity: Very high.
What Is It: Measures the change in prices paid by businesses.
News Release on Internet: www.bls.gov/ppi
Home Web Address: www.bls.gov
Release Time: 8:30 A.M. (ET); announced two weeks after the reporting month ends.
Frequency: Monthly.
Source: Bureau of Labor Statistics, Department of Labor.
Revisions: The monthly data is subject to one revision which is published fourmonths later. Annual revisions are published in February with the Januarydata, and it can go back five years.
WHY IS IT IMPORTANT
Inflation is public enemy number one to the financial markets. It can wipe out the valueof bond portfolios, depress stock prices, and push interest rates higher. So when the firstmajor inflation number of the month comes out, a distinction that belongs to the ProducerPrice Index (PPI), it should come as no surprise that everyone pounces on it. The PPImeasures changes in prices that manufacturers and wholesalers pay for goods duringvarious stages of production. Any whiff of inflation here could eventually be transmittedto the retail level. After all, if business has to pay more for goods, they are more likely topass some of those higher costs on to consumers. (As we’ll see later, the relationshipbetween producer prices and consumer prices is actually not that simple.)
The producer price index is really not just one index, but a family of indexes. Thereare price indexes for each of the three progressive stages of production: crude goods, inter-mediate goods, and finished goods. The one that grabs all the headlines and most excitesfinancial markets is the last one, the PPI for finished goods. It represents the final stage ofprocessing just before these goods are shipped to wholesalers and retailers. Prices at thislast stage of production are often determined by cost pressures encountered in the crudeand intermediate steps, which is why it is important to monitor all three stages.
PPI Crude Goods
The crude goods index represents the cost of raw materials entering the market for thefirst time. Examples of crude food supplies would be wheat, cattle, and soybeans. Non-food crude items include coal, crude petroleum, sand, and timber. Changes in the pricesof these commodities are generally based on supplies, which can be subject to largeswings as a result of droughts, animal disease, and geopolitical factors. A spurt in pricesat this early stage will be felt at the intermediate stage.
255Producer Price Index
08Baumohl_Ch03.41-03.47.qxd 8/3/04 10:43 AM Page 255
256 Chapter 3 • The Most Influential U.S. Economic Indicators
PPI Intermediate Goods
The intermediate goods index reflects the cost of commodities that have undergone tran-sitional processing before becoming the final product. Items like flour, certain animalfeeds, paper, auto parts, leather, and fabric fall into this category. Again, changes in priceshere can be transferred to the final stage, which is finished goods.
PPI Finished Goods
The finished goods index is the most closely watched measure in the entire PPI report. Itconsists of apparel, furniture, automobiles, meats, gasoline, and fuel oil. Any inflation atthis stage is considered serious because these are the products retailers pay for and thuscan influence the price tag consumers will see.
Do changes in the producer prices dictate what consumer prices will do? Manyeconomists claim there is little correlation between the two. But that conclusion is not afair one. Much depends on which of the three main PPI indexes are chosen as a predic-tive tool for future consumer price inflation. During the 1970s and 1980s, shifts in theprice of crude and intermediate goods often preceded changes in the CPI. However, thatrelationship has been less reliable since the 1990s. What has stood the test of time is thelink between PPI for finished goods and the CPI. Sure, they might diverge on a month-to-month basis, but they tend to move in tandem over the longer term, usually in therange of 6 to 9 months. This complicated relationship exists because the two inflationmeasures have some important differences and similarities. One difference is the PPIdoes not take into account the price of services. In the CPI, services, like housing andmedical care, make up more than half of the index. One area where both of these infla-tion gauges share common ground is in “consumer products.” That sector accounts fornearly 75% of the PPI for finished goods. So if prices leap higher here, chances are theCPI will also be under pressure to rise.
In addition to keeping a close eye on the PPI for finished goods, the investment com-munity studies a subset known as core-PPI, a measure that excludes the bumpy categoriesof food and energy. Those two commodity groups make up a large 40% of the finishedPPI, so any abnormal weather pattern or a temporary disruption in oil supplies can greatlydistort the inflation numbers and mislead analysts. To get a more accurate reading of theunderlying inflation trend, the core-PPI for finished goods is given equal and sometimeseven greater consideration than the total index.
HOW IS IT COMPUTED
The producer price series began in 1902, making it the nation’s oldest inflation measure.The government computes the PPI as follows: Every month, around the week thatincludes the thirteenth, the Labor Department receives answers to questionnaires request-ing prices on about 100,000 different items from nearly 30,000 firms around the country.
08Baumohl_Ch03.41-03.47.qxd 8/3/04 10:43 AM Page 256
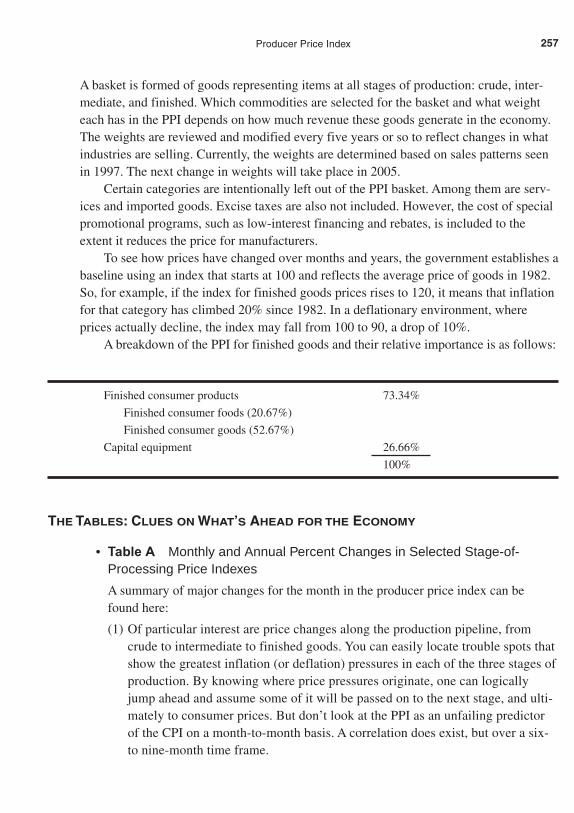
A basket is formed of goods representing items at all stages of production: crude, inter-mediate, and finished. Which commodities are selected for the basket and what weighteach has in the PPI depends on how much revenue these goods generate in the economy.The weights are reviewed and modified every five years or so to reflect changes in whatindustries are selling. Currently, the weights are determined based on sales patterns seenin 1997. The next change in weights will take place in 2005.
Certain categories are intentionally left out of the PPI basket. Among them are serv-ices and imported goods. Excise taxes are also not included. However, the cost of specialpromotional programs, such as low-interest financing and rebates, is included to theextent it reduces the price for manufacturers.
To see how prices have changed over months and years, the government establishes abaseline using an index that starts at 100 and reflects the average price of goods in 1982.So, for example, if the index for finished goods prices rises to 120, it means that inflationfor that category has climbed 20% since 1982. In a deflationary environment, whereprices actually decline, the index may fall from 100 to 90, a drop of 10%.
A breakdown of the PPI for finished goods and their relative importance is as follows:
Finished consumer products 73.34%
Finished consumer foods (20.67%)
Finished consumer goods (52.67%)
Capital equipment 26.66%
100%
THE TABLES: CLUES ON WHAT’S AHEAD FOR THE ECONOMY
• Table A Monthly and Annual Percent Changes in Selected Stage-of-Processing Price Indexes
A summary of major changes for the month in the producer price index can befound here:
(1) Of particular interest are price changes along the production pipeline, fromcrude to intermediate to finished goods. You can easily locate trouble spots thatshow the greatest inflation (or deflation) pressures in each of the three stages ofproduction. By knowing where price pressures originate, one can logicallyjump ahead and assume some of it will be passed on to the next stage, and ulti-mately to consumer prices. But don’t look at the PPI as an unfailing predictorof the CPI on a month-to-month basis. A correlation does exist, but over a six-to nine-month time frame.
257Producer Price Index
08Baumohl_Ch03.41-03.47.qxd 8/3/04 10:43 AM Page 257
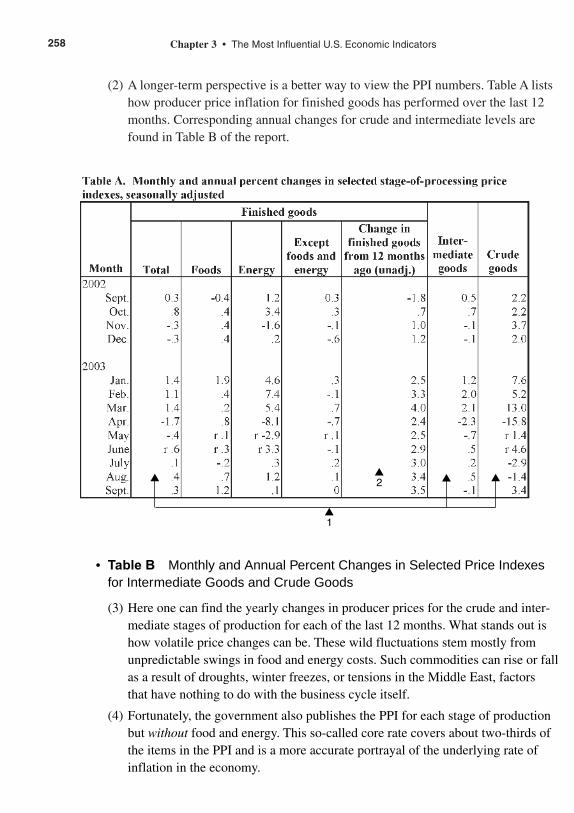
(2) A longer-term perspective is a better way to view the PPI numbers. Table A listshow producer price inflation for finished goods has performed over the last 12months. Corresponding annual changes for crude and intermediate levels arefound in Table B of the report.
258 Chapter 3 • The Most Influential U.S. Economic Indicators
• Table B Monthly and Annual Percent Changes in Selected Price Indexesfor Intermediate Goods and Crude Goods
(3) Here one can find the yearly changes in producer prices for the crude and inter-mediate stages of production for each of the last 12 months. What stands out ishow volatile price changes can be. These wild fluctuations stem mostly fromunpredictable swings in food and energy costs. Such commodities can rise or fallas a result of droughts, winter freezes, or tensions in the Middle East, factorsthat have nothing to do with the business cycle itself.
(4) Fortunately, the government also publishes the PPI for each stage of productionbut without food and energy. This so-called core rate covers about two-thirds ofthe items in the PPI and is a more accurate portrayal of the underlying rate ofinflation in the economy.
▲ ▲▲
▲1
▲2
08Baumohl_Ch03.41-03.47.qxd 8/3/04 10:44 AM Page 258
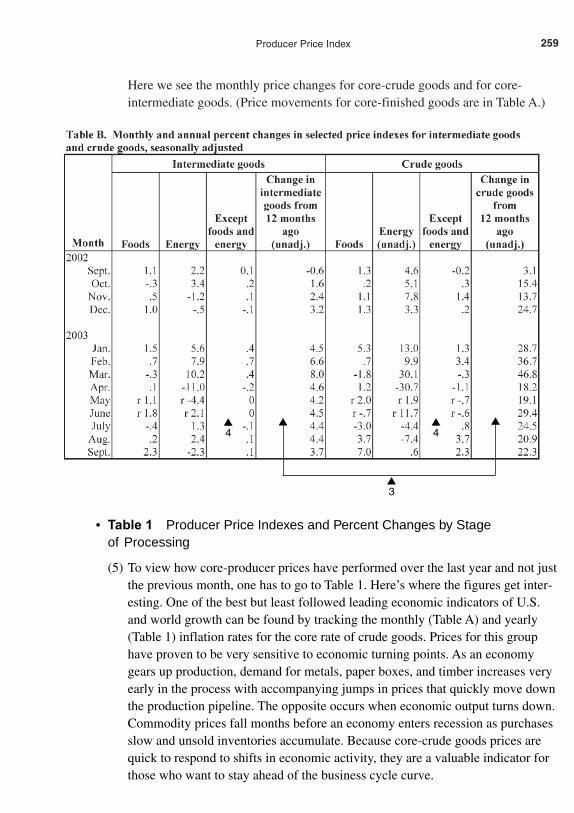
Here we see the monthly price changes for core-crude goods and for core-intermediate goods. (Price movements for core-finished goods are in Table A.)
259Producer Price Index
• Table 1 Producer Price Indexes and Percent Changes by Stage of Processing
(5) To view how core-producer prices have performed over the last year and not justthe previous month, one has to go to Table 1. Here’s where the figures get inter-esting. One of the best but least followed leading economic indicators of U.S.and world growth can be found by tracking the monthly (Table A) and yearly(Table 1) inflation rates for the core rate of crude goods. Prices for this grouphave proven to be very sensitive to economic turning points. As an economygears up production, demand for metals, paper boxes, and timber increases veryearly in the process with accompanying jumps in prices that quickly move downthe production pipeline. The opposite occurs when economic output turns down.Commodity prices fall months before an economy enters recession as purchasesslow and unsold inventories accumulate. Because core-crude goods prices arequick to respond to shifts in economic activity, they are a valuable indicator forthose who want to stay ahead of the business cycle curve.
▲▲▲4
▲4
▲3
08Baumohl_Ch03.41-03.47.qxd 8/3/04 10:44 AM Page 259
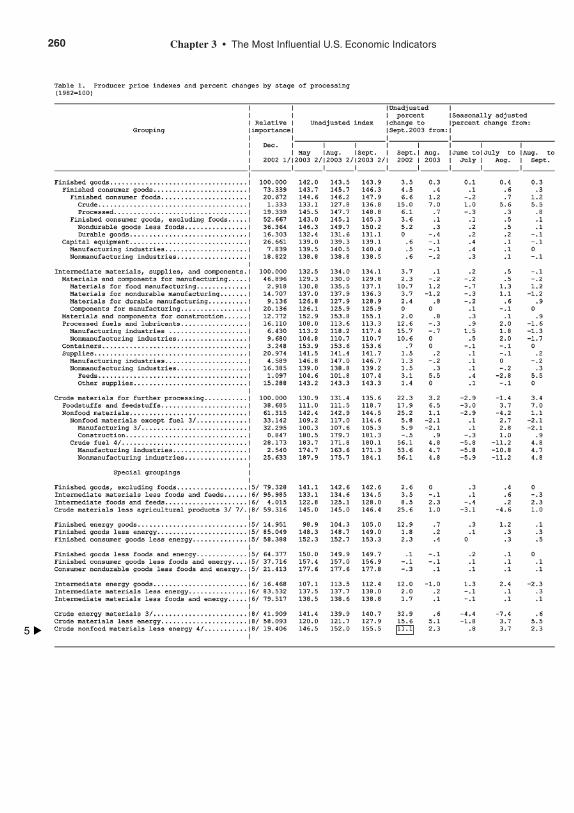
260 Chapter 3 • The Most Influential U.S. Economic Indicators
▲
5
08Baumohl_Ch03.41-03.47.qxd 8/3/04 10:44 AM Page 260
While the core rate of producer prices can tell you something about future infla-tion pressures, one should not totally ignore the food and energy components.After all, those two commodities are, in the final analysis, essential to the U.S.economy. So a general rule is to look at the core rate to detect month-to-monthchanges in inflation. But when making longer projections of economic growthand inflation, the core rate becomes less meaningful since we ultimately pay forfood and energy. Thus, the core rate can serve as a proxy for near-term inflationwhile the total finished goods index can be helpful in determining the behaviorof consumer prices in the longer term.
MARKET IMPACT
Bonds
The PPI may not be an ideal leading indicator of consumer prices, but you’d never knowthat from the way the bond market reacts. Producer price inflation is one of the hottesteconomic indicators released by the government. Fixed income investors intuitivelybelieve that a jump in the PPI can be a wake-up call that consumer price inflation isheaded higher in the future. Second, since it is the first key inflation gauge the govern-ments puts out every month, the market tends to view it with greater sensitivity. If the PPIdetects rising price pressures in the economy, it could depress bond prices and force inter-est rates higher. No change, or an actual decline in producer prices, is viewed favorablyby bond holders because it suggests the absence of any troublesome inflation.
Stocks
For the most part, equities respond much the same way bonds do to signs of inflation. Ajump in the PPI means higher production costs for companies and this can erode profitsand endanger dividends. While some stock investors argue that a little inflation is a goodthing because it allows producers to charge more for goods and which bolster revenues,there is a point beyond which inflation pressures can do more harm than good to equities.The problem is that there is no consensus on where that threshold is.
Dollar
A rise in the PPI is a tough call for participants in the foreign exchange market. Normally,the dollar benefits from a little pickup in inflation since this propels U.S. short-term interest rates higher. A fast-rising inflation report, however, can hurt the dollar because the Federal Reserve can respond so aggressively as to jeopardize U.S. economic growthaltogether. By and large, a gradual rise in inflation that is accompanied by a well-timedtightening of monetary policy is likely to lead to an appreciation of U.S. currency.
261Producer Price Index
08Baumohl_Ch03.41-03.47.qxd 8/3/04 10:44 AM Page 261
EMPLOYMENT COST INDEX
Market Sensitivity: Medium to high.
What Is It: The most comprehensive measure of labor costs.
News Release on Internet: www.stats.bls.gov/news.release/eci.toc.htm
Home Web Address: www.stats.bls.gov
Release Time: 8:30 A.M. (ET); released the last Thursday of April, July, October,and January.
Frequency: Quarterly.
Source: Bureau of Labor Statistics, Department of Labor.
Revisions: Not on a quarterly basis. Revisions are announced annually with therelease of first quarter data, and the changes can go back several years.
WHY IS IT IMPORTANT
Inflation is the scourge of any economy. It drives interest rates higher and can punishstock prices. Thus, any indicator that serves as an early warning system of rising infla-tion pressures would be of great value to investors and business leaders. Topping the listas perhaps the best harbinger of pricing pressures is the Employment Cost Index (ECI).The ECI tracks changes in the cost of labor, the single biggest expense companies face.Labor-related outlays on wages, salaries, and the gamut of fringe benefits (such as vaca-tions, health insurance, and social security) account for more than 70% of the cost ofmaking a product. Employees make up such a huge proportion of operating expensesthat any significant acceleration in compensation can quickly cut into corporate profitsand pressure companies to pass these additional costs on to consumers in the form ofhigher prices.
Historically, once rising labor costs fuel inflation, it can unleash a vicious cyclethat is hard to stop. As retailers hike their prices to offset rising employee expenses,workers will eventually demand bigger increases in wages and salaries just to keep upwith inflation. Should employers again comply and pay workers more money, it willsoon bring about another jump in retail prices. This self-perpetuating escalation ininflation, known among economists as a wage-price spiral, is so destructive to an econ-omy that it stands high on the Federal Reserve’s enemy watch list.
262 Chapter 3 • The Most Influential U.S. Economic Indicators
08Baumohl_Ch03.41-03.47.qxd 8/3/04 10:44 AM Page 262
To be fair, companies can respond to higher labor costs in ways other than raisingprices. Firms might choose to absorb the extra expense and grudgingly accept lessprofits for the time being. Or they can decide that given how expensive labor hasbecome, it makes more sense to simply let go a large number of employees andinstead invest in new technology that would permit the same or even greater outputbut with fewer workers. Lastly, companies can simply decide to relocate their produc-tion facilities to other countries where labor is much cheaper. All of these responses torising U.S. labor costs have significant consequences for the economy and the finan-cial markets. By choosing to raise prices, firms can ignite inflation. At some point theFederal Reserve is likely to jump in and raise interest rates before a wage-price spiralgets out of hand. Should companies decide to absorb the extra costs, it will cut intoearnings and adversely affect stock prices. Moving operations offshore can lead tohigher joblessness in the U.S. and more government spending on unemploymentinsurance. For all these reasons, the ECI is monitored closely by Federal Reserve offi-cials, money managers, business executives, and union leaders.
HOW IS IT COMPUTED
The ECI is based on surveys of both private and public sectors (local and state only; thefederal payroll is excluded). Every quarter, about 8,500 establishments in private indus-try, involving 37,000 occupational observations, and 800 establishments in state and localgovernments, public schools, and public hospitals, covering 3,700 occupational group-ings, are queried on labor cost issues. The surveys are conducted for the pay period thatincludes the twelfth day of the month in March, June, September, and December. All theinformation is then boiled down to 500 occupational classifications, which make up afixed basket of job types.
Questions are asked about changes in wages, salaries, and benefits. Wage and salarydata is collected on a straight-time hourly pay basis. For those employees not paid on anhourly basis, a computation is made based on salary divided by the corresponding hoursworked. Also included are production bonuses, incentive earnings, commission pay-ments, and cost of living adjustments. Excluded from this calculation is premium pay forovertime and for work performed on weekends and holidays. Shift differentials are alsoexcluded.
Benefits covered by the ECI are paid vacations, sick leave, holidays, premium payfor overtime, shift differentials, insurance benefits, retirement and savings benefits, socialsecurity, Medicare, and federal- and state-mandated social insurance programs.
263Employment Cost Index
08Baumohl_Ch03.41-03.47.qxd 8/3/04 10:44 AM Page 263
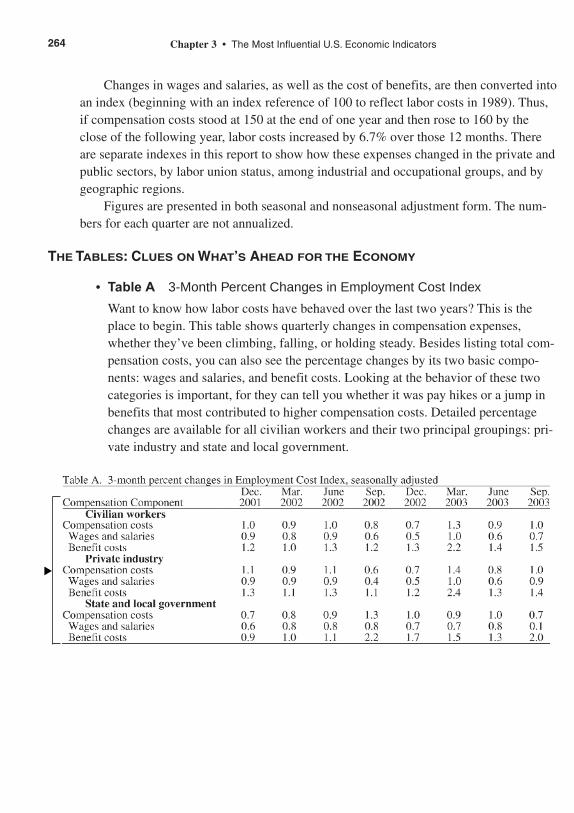
Changes in wages and salaries, as well as the cost of benefits, are then converted intoan index (beginning with an index reference of 100 to reflect labor costs in 1989). Thus,if compensation costs stood at 150 at the end of one year and then rose to 160 by theclose of the following year, labor costs increased by 6.7% over those 12 months. Thereare separate indexes in this report to show how these expenses changed in the private andpublic sectors, by labor union status, among industrial and occupational groups, and bygeographic regions.
Figures are presented in both seasonal and nonseasonal adjustment form. The num-bers for each quarter are not annualized.
THE TABLES: CLUES ON WHAT’S AHEAD FOR THE ECONOMY
• Table A 3-Month Percent Changes in Employment Cost Index
Want to know how labor costs have behaved over the last two years? This is theplace to begin. This table shows quarterly changes in compensation expenses,whether they’ve been climbing, falling, or holding steady. Besides listing total com-pensation costs, you can also see the percentage changes by its two basic compo-nents: wages and salaries, and benefit costs. Looking at the behavior of these twocategories is important, for they can tell you whether it was pay hikes or a jump inbenefits that most contributed to higher compensation costs. Detailed percentagechanges are available for all civilian workers and their two principal groupings: pri-vate industry and state and local government.
264 Chapter 3 • The Most Influential U.S. Economic Indicators
▲
08Baumohl_Ch03.41-03.47.qxd 8/3/04 10:44 AM Page 264
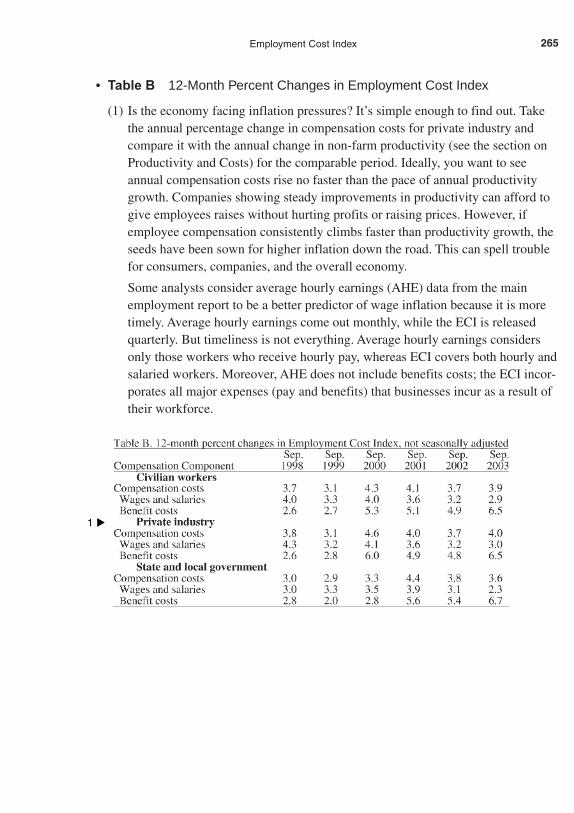
• Table B 12-Month Percent Changes in Employment Cost Index
(1) Is the economy facing inflation pressures? It’s simple enough to find out. Takethe annual percentage change in compensation costs for private industry andcompare it with the annual change in non-farm productivity (see the section onProductivity and Costs) for the comparable period. Ideally, you want to seeannual compensation costs rise no faster than the pace of annual productivitygrowth. Companies showing steady improvements in productivity can afford togive employees raises without hurting profits or raising prices. However, ifemployee compensation consistently climbs faster than productivity growth, theseeds have been sown for higher inflation down the road. This can spell troublefor consumers, companies, and the overall economy.
Some analysts consider average hourly earnings (AHE) data from the mainemployment report to be a better predictor of wage inflation because it is moretimely. Average hourly earnings come out monthly, while the ECI is releasedquarterly. But timeliness is not everything. Average hourly earnings considersonly those workers who receive hourly pay, whereas ECI covers both hourly andsalaried workers. Moreover, AHE does not include benefits costs; the ECI incor-porates all major expenses (pay and benefits) that businesses incur as a result oftheir workforce.
265Employment Cost Index
▲
1
08Baumohl_Ch03.41-03.47.qxd 8/3/04 10:44 AM Page 265
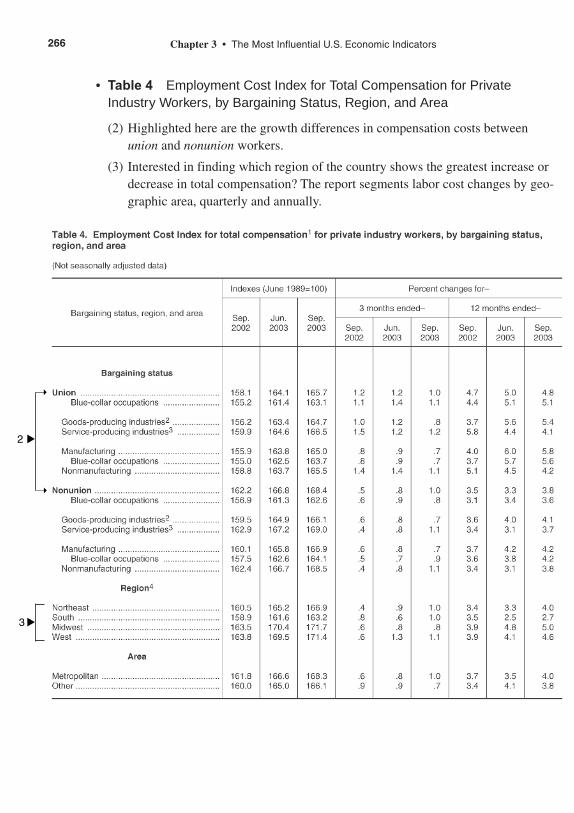
• Table 4 Employment Cost Index for Total Compensation for PrivateIndustry Workers, by Bargaining Status, Region, and Area
(2) Highlighted here are the growth differences in compensation costs betweenunion and nonunion workers.
(3) Interested in finding which region of the country shows the greatest increase ordecrease in total compensation? The report segments labor cost changes by geo-graphic area, quarterly and annually.
266 Chapter 3 • The Most Influential U.S. Economic Indicators
▲
3
▲
2
➝
➝
08Baumohl_Ch03.41-03.47.qxd 8/3/04 10:44 AM Page 266
MARKET IMPACT
Bonds
Bond traders react to the ECI much like they do for any forerunner of inflation. A larger-than-expected jump in the index is disconcerting to these investors and can provokeenough sales of fixed income securities to significantly drive up yields. Investors fear thatrising labor costs without a concurrent increase in productivity can fire up price pressuresand eventually force the Fed to raise interest rates before wage inflation firmly sets in. Astable or weaker-than-expected ECI is viewed as positive for the bond market.
Stocks
A sustained increase in labor costs is also bearish for the stock market. If wages andbenefits climb faster than productivity, business costs swell, which then jeopardizes corporate profits. Moreover, it can compel the Fed to act. How quickly this all unfoldsdepends on where the economy stands in the business cycle and how vulnerable it is toan outbreak of inflation.
Dollar
No dependable pattern emerges between the ECI and the dollar’s value in foreignexchange markets. Obviously, if labor costs pick up, it can propel interest rates higher,which normally would attract foreign investors to the dollar. However, higher labor costscan also erode the competitiveness of U.S. companies selling goods and services overseasand worsen the trade deficit, a distinct negative for the dollar. By and large, if players inthe currency markets believe the Federal Reserve is successful at piloting the economyinto a gentle slowdown and forestalls an outbreak of wage inflation, it would strengthenthe dollar.
267Employment Cost Index
08Baumohl_Ch03.41-03.47.qxd 8/3/04 10:44 AM Page 267
IMPORT AND EXPORT PRICES
Market Sensitivity: Low.
What Is It: Records price changes of goods bought and sold by the U.S. inforeign markets.
News Release on Internet: www.bls.gov/mxp
Home Web Address: www.bls.gov
Release Time: 8:30 A.M. (ET); data is released around two weeks after thereported month.
Frequency: Monthly.
Source: Bureau of Labor Statistics, Department of Labor.
Revisions: Each release contains monthly revisions and corrections that go backthree months. Changes affecting the weights of products in the basket ofgoods bought and sold in foreign markets are made every January, beginningin 2004, and reflect shifts in trade patterns two years earlier.
WHY IS IT IMPORTANT
When it comes to measuring inflation, the economic indicators that first come to mind areconsumer prices, producer prices, and the GDP price deflators. Less well known isanother series by the government, one that looks at the behavior of import and exportprices. Why look at the cost of trade? Americans spend $1.5 trillion a year buying foreignproducts. These purchases make up nearly 15% of GDP, so a major swing in importprices can have a palpable impact on inflation in this country. If the price of imported oilclimbs sharply, drivers can end up paying more for gasoline and heating oil. A poor cropof coffee beans in Venezuela will effectively raise the price of a morning cup of caffeine.In addition, if the value of the dollar drops sharply against the major world currencies, itmakes imports more expensive over a broad spectrum of goods and services.
Another reason to monitor import and export price indexes is that they have a directbearing on the competitive position of the U.S. in foreign markets. Should American-made products get too pricey overseas because of inflation at home or a strengtheningdollar, foreign buyers will stop ordering from the U.S. and seek other, cheaper suppliers.Since exports account for 10% of GDP, a significant drop in sales to other nations willreduce the earnings of major American companies and retard overall economic growth inthis country.
The official reason for establishing these price indexes in the first place was to con-vert the monthly U.S. trade figures from current dollars into real dollars. Tracking tradeflows in real terms is vital. If you simply tally all the sales in trade in current dollars,you’re still left wondering whether America’s higher import bill was the result of more
268 Chapter 3 • The Most Influential U.S. Economic Indicators
08Baumohl_Ch03.41-03.47.qxd 8/3/04 10:44 AM Page 268
products being purchased or because foreigners raised prices. The same applies toexports. If the value of U.S. shipments to other nations increased from one period to thenext, was it because American firms actually sold more goods, or did they just hikeprices? By using the information from this report, analysts can determine the real volumeof imports and exports traded.
HOW IS IT COMPUTED
Every month, information on export and import prices is collected on more than 20,000products from over 6,000 companies and other sources. The Bureau of Labor Statisticsasks these companies to report on the transaction price of trades that occur close to thebeginning of every month. Most imports are priced on a “free on board” (FOB) basis andreflect the value of products at the foreign port of exportation. The seller is responsiblefor placing the goods on a boat or plane, but after that, the responsibility passes to theimporter. The FOB price does not include the cost of insurance and duty taxes. On theexport side, the majority is recorded with “free alongside ship” (FAS) prices, and repre-sents their value before loading. The exporter is responsible only for placing the goodsalongside the ship or plane. The price includes insurance and the cost of transportingeverything up to the port of departure. However, the cost of actually loading the goods ispaid for by the buyer.
All prices collected are then weighed against a fixed market basket of goods thatwere imported and exported. Weights for the products in the basket are updated everyyear (beginning in 2004) and reflect changes in consumption patterns that occurred twoyears earlier.
Revisions are routine with each monthly release, and they can go back three months.The figures in the report are not seasonally adjusted.
THE TABLES: CLUES ON WHAT’S AHEAD FOR THE ECONOMY
• Cover Page Percent Changes in Import and Export Price Indexes
This release deserves a close look because it tracks one of the most important eco-nomic forces to influence domestic inflation, growth, and corporate profits.
(1) To begin with, the summary table permits a quick glance at the latest trend inimport and export price movements by showing month-to-month percentagechanges for the past year. If imports prices are on the rise, it will put upwardpressure on consumer price inflation, while a sustained fall in import prices canlead to disinflation (where the rate of inflation is decelerating), or in rareinstances, deflation (where the CPI is actually falling). Given the volatile natureof petroleum prices and how it can skew the total cost of imports, one shouldkeep an eye on price patterns for both total imports and non-petroleum imports.
269Employment Cost Index
08Baumohl_Ch03.41-03.47.qxd 8/3/04 10:44 AM Page 269
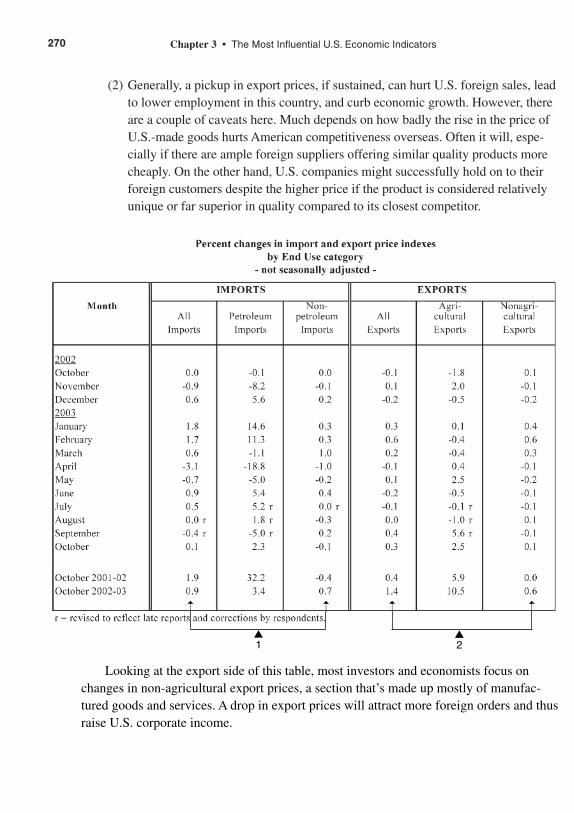
(2) Generally, a pickup in export prices, if sustained, can hurt U.S. foreign sales, leadto lower employment in this country, and curb economic growth. However, thereare a couple of caveats here. Much depends on how badly the rise in the price ofU.S.-made goods hurts American competitiveness overseas. Often it will, espe-cially if there are ample foreign suppliers offering similar quality products morecheaply. On the other hand, U.S. companies might successfully hold on to theirforeign customers despite the higher price if the product is considered relativelyunique or far superior in quality compared to its closest competitor.
270 Chapter 3 • The Most Influential U.S. Economic Indicators
Looking at the export side of this table, most investors and economists focus onchanges in non-agricultural export prices, a section that’s made up mostly of manufac-tured goods and services. A drop in export prices will attract more foreign orders and thusraise U.S. corporate income.
➝➝ ➝➝
▲1
▲2
08Baumohl_Ch03.41-03.47.qxd 8/3/04 10:44 AM Page 270
The dominant factor behind changes in import and export prices is the rise and fall ofthe dollar’s value in the currency market. A strengthening dollar reduces the price ofimports, but makes U.S. exports more expensive in foreign markets. A depreciating dollarraises the cost of import costs. The flip side is that American exporters have an easiertime getting foreign orders because their products drop in price outside the U.S. Here’s anillustration of how changes in export and import prices can influence costs, profits, andgrowth in this country.
A Weak Dollar
Suppose France sells wine to the U.S. at a price of 25 euros per bottle. With an exchangerate of one dollar for each euro, the price of each bottle for American consumers is $25.Now let’s say the dollar falls in value and it now costs $1.25 to acquire each euro (that is,each U.S. dollar gets you only 0.80 euros). The price of the imported wine has nowjumped from $25 to $31.25 (25 euros × $1.25 = $31.25), a 25% hike. Now imagine thebroader inflationary implications from such a drop in the dollar’s value, for in addition towine, Americans also import from Europe cars, cheese, apparel, perfumes, art, and furni-ture. Moreover, with imports now pricier, it will embolden domestic companies to lifttheir own prices as well because they have less to worry about from foreign competition.
For exporters, a weaker dollar enables them to sell products abroad at a lower, morecompetitive price. Here’s how: Say an American firm is selling jeans to Europeans for$25 a pair. Prior to the dollar’s fall, foreigners would be able to pick up a pair ofAmerican jeans for 25 euros. But once the U.S. currency fell to $1.25 = 1 euro, the priceof those jeans to Europeans dropped from 25 euros to 20 euros ($25 ÷ $1.25 = 20), mak-ing them 20% cheaper. The lower price can spur more sales, lift earnings of U.S.exporters, and boost overall GDP growth.
A Strong Dollar
When the dollar’s value climbs in currency markets, a different set of dynamics takes placefor exporters and importers. Instead of having an equal exchange rate of $1 = 1 euro, let’ssay the U.S. currency jumps in value by 25%. Thus, Americans can now receive 1.25 eurosfor each U.S. dollar (or 1 euro = U.S $ .80). This poses a serious problem for Americanexporters, for a jump in the dollar’s value drives up the cost of those jeans for Europeansfrom 25 euros to 31.25 euros. U.S. firms, fearful that fewer people will buy jeans at thathigher price, might decide to keep the European price unchanged at 25 euros just to staycompetitive. However, that strategy will cost the company some revenue with each pair ofjeans sold. For by holding the price tag at 25 euros, the U.S. jeans producer is now gettingjust $20 for every pair of jeans sold, not the previous $25 (25 × U.S. $ .80 = $20).
271Employment Cost Index
08Baumohl_Ch03.41-03.47.qxd 8/3/04 10:44 AM Page 271
Importers and American consumers, on the other hand, are happy to see a musculardollar because foreign products are now cheaper. When the value of the U.S. currencystrengthened from U.S. $1 = 1 euro to U.S. $1 = 1.25 euros, the bottle of French winefor Americans fell from $25 to $20. However, what’s great for U.S. shoppers can beawful for domestic producers, who now have to compete with lower-priced foreigngoods entering this country. These American companies are thus now under immensepressure to keep their own prices down or face losing sales to imports. Multiply this bythousands of other commodities coming into the U.S. and you can begin to see how astrong U.S. currency can help reduce domestic inflation, but it can also hurt the earningsof many companies too.
• Table 3 U.S. Import Price Indexes and Percent Changes for SelectedCategories of Goods (Not Shown)
This table contains a more detailed list of how import prices have fared for com-modities, capital goods, foods, and other key categories of products. Equity analystscan seek out industries that thrive when import prices fall, and they can veer awayfrom those businesses that are threatened by low-price foreign goods being shippedto the U.S.
• Table 4 U.S. Export Price Indexes and Percent Changes for SelectedCategories of Goods (Not Shown)
Similar in detail to Table 3, this page focuses on exports. Changes in exchange ratescan provide economists and investors with better insights into how competitivelypriced U.S. products are in foreign markets. Keep in mind that nearly half the earn-ings of S&P 500 firms come from business generated outside the U.S.
• Table 7 U.S. Import Price Indexes and Percent Changes by Locality of Origin
The price of U.S. imports can drop precipitously if they originate from nations withailing currencies. That’s where Table 7 comes in. It looks at five major traderegions—Canada, the European Union, Latin America, Japan, and Asia’s NewlyIndustrialized Countries—and the change in import prices over time for each ofthese localities. U.S. importers prefer to deal with nations whose currencies areweak because they can purchase goods more cheaply from them than from strongercurrency nations. U.S. exporters, on the other hand, face serious hardships sellinginto a market whose local currency is slipping. For one, countries with weak curren-cies are usually in economic distress and they’re not likely to buy much from theU.S. anyway. Secondly, the dollar’s relative strength will probably price manyAmerican products out of that market anyway.
272 Chapter 3 • The Most Influential U.S. Economic Indicators
08Baumohl_Ch03.41-03.47.qxd 8/3/04 10:44 AM Page 272
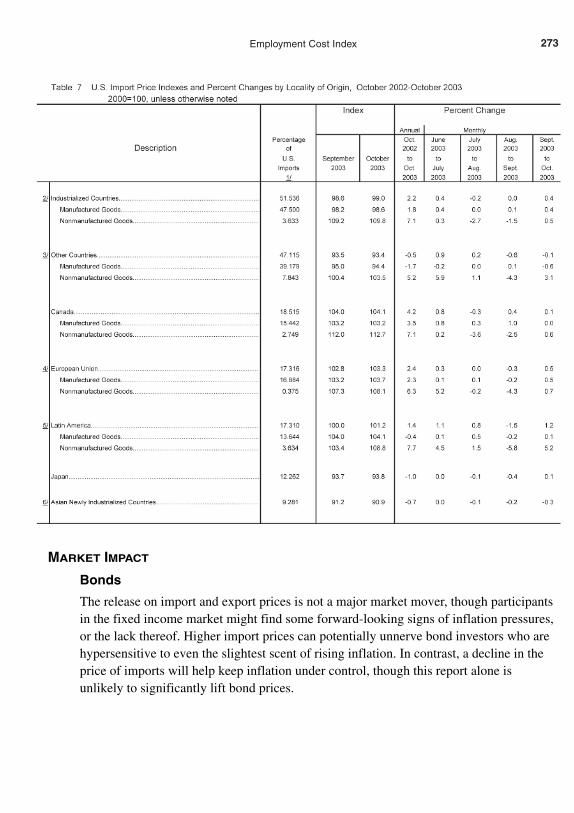
273Employment Cost Index
MARKET IMPACT
Bonds
The release on import and export prices is not a major market mover, though participantsin the fixed income market might find some forward-looking signs of inflation pressures,or the lack thereof. Higher import prices can potentially unnerve bond investors who arehypersensitive to even the slightest scent of rising inflation. In contrast, a decline in theprice of imports will help keep inflation under control, though this report alone isunlikely to significantly lift bond prices.
08Baumohl_Ch03.41-03.47.qxd 8/3/04 10:44 AM Page 273
Stocks
Here, too, any response to this report is likely to be modest. That’s not to say it’s of minorimportance to equity investors. Corporate profitability is very much affected by bothimport and export price movements. If the cost of imports drops, some U.S. firms, specif-ically those that buy product components from other nations, stand to gain because itlowers production costs. Others will suffer from cheaper imports as foreign competitorsthreaten to grab a bigger share of the American market. Should imports become moreexpensive, the situation gives U.S. companies room to lift their own prices and increaseprofits. Yet other firms will feel the pinch of higher import costs.
In terms of exports, a drop in price can generate higher sales for U.S. firms sellingabroad, while higher export prices can reduce foreign demand for U.S. goods and hurtcorporate revenues. How this plays out in the stock market depends on the extent towhich individual firms are exposed to the global marketplace. Generally speaking, themajor equity indexes will not move much in response to this economic indicator, unlessimport prices surge to a level that fires up inflation pressures.
Dollar
The foreign exchange market normally does not spring into action as a result of thisreport. For these traders, much of the news on how exchange rate movements influenceimport and export prices has already been discounted. What alarms foreign investors is asituation in which the dollar’s weakness or strength becomes so detrimental to the U.S.economy that it impels Washington to intervene in the currency market. Such actions arerare but they cannot be totally dismissed among investors. What might trigger such astep? Several events can. Sharply higher import inflation, a significant deterioration incompetitiveness, or an unacceptable widening in America’s foreign trade deficit could atsome point trigger remedial action by U.S. policymakers. That action can range from del-icately crafted expressions of concern by administration officials on the dollar’s value todirect intervention by the government in the currency markets.
274 Chapter 3 • The Most Influential U.S. Economic Indicators
08Baumohl_Ch03.41-03.47.qxd 8/3/04 10:44 AM Page 274
PRODUCTIVITY AND COSTS
Market Sensitivity: Medium.
What Is It: Measures changes in the efficiency of workers who produce goodsand services.
News Release on Internet: www.bls.gov/lpc/
Home Web Address: www.bls.gov
Release Time: 8:30 A.M. (ET); the initial report is released about five weeksfollowing the end of the quarter.
Frequency: Quarterly.
Source: Bureau of Labor Statistics, Department of Labor.
Revisions: Can be substantial. This first revision appears a month after thepreliminary figures, and a second revision comes 60 days after the initialrevision. Subsequent changes to productivity data depend on revisions toGDP and employment data.
WHY IS IT IMPORTANT
Here’s a question: What single feat allows an economy to grow faster without any infla-tion, helps U.S. exporters win markets overseas, and enriches both households and corpo-rations simultaneously? The answer is productivity growth. Productivity is the output ingoods and services employees produce each hour of labor worked, and it serves as a wayof measuring how well companies are using their employees and their physical capital(by which we mean land, material resources, and equipment).
Productivity is by far the most important determinant in the long-term health andprosperity of an economy. Here’s why: Labor costs account for some 70% of all businessexpenses, so if companies are not using workers efficiently, it’s an enormous waste ofresources. With a productive workforce, however, an economy can produce enough sup-plies to meet the demands of consumers and businesses without causing shortages andhigher prices. In addition, if workers produce more each hour, companies can increasesales and generate greater revenues. That will boost profits, which, in turn, can be used todistribute bigger dividends to shareholders, stimulate more business investment spending,or lead to greater pay for workers. Indeed, you might even be able do all three at the sametime. On the other hand, poor productivity growth is a recipe for economic stagnation. Itinvites inflation, higher unemployment, weaker growth, and little or no gains in realincome. The plain fact is that strong labor productivity growth is not just preferable, it’sessential in an environment where U.S. companies face serious global competition.
275Productivity and Costs
08Baumohl_Ch03.41-03.47.qxd 8/3/04 10:44 AM Page 275
That last point was painfully learned back in the 1970s and early 1980s, when pro-ductivity growth was close to flat-lining. The U.S. economy at the time was reeling fromsoaring energy costs and several deep recessions. Moreover, American firms were losingcustomers overseas as well and in the United States as foreign competitors charged on tothe scene with less-expensive, often better-quality cars, appliances, home electronics, andother products. Once overly confident that no nation could challenge America’s post-World War II economic supremacy, companies here suddenly found themselves whollyunprepared to go up against their more agile foreign rivals.
After years of complacency, American industry finally awoke to the urgency of retool-ing their factories and operating more nimbly. Hundreds of plants were closed in the late1980s and early 1990s. A wave of mergers, acquisitions, and consolidations followed,effectively burying companies that were no longer able to operate profitably. Just as corpo-rate America began to work more efficiently, rapid technological innovation in the mid-and late 1990s contributed another large boost to productivity growth. These events havenot only helped the U.S. regain its competitiveness in global trade, but also fundamentallyaltered the way Americans work and live. Cell phones, laptops, e-mails, high-speedtelecommunication networks, and computer-based machine tools have spawned a true productivity revolution. But such major technology-driven breakthroughs in productivityare quite rare in history, occurring perhaps only once or twice every hundred years.
Far more common is the type of productivity swing that normally accompanies abusiness cycle. The ups and downs of cyclical productivity growth are better understoodand tend to follow a predictable pattern. First, productivity typically falls when an econ-omy approaches recession. The reason is companies initially cut back production asdemand shrinks, but they continue to hold on to employees—at least until it becomesclear that business will not turn up anytime soon. Thus, for a brief period of time, produc-tivity plummets because output drops—but the number of people on payrolls remainsunchanged. The next stage in the productivity cycle occurs when employers realize theyhave little choice but to begin layoffs. After all, with corporate revenues shrinking, itbecomes too costly to keep idle or underutilized workers. As a result, during a recessioncompanies try to get by with as few workers as possible. Third, as demand graduallypicks up again and the economy starts to recover, productivity often surges because companies first rev up their production lines but hold off on hiring back workers. It’s only when the economy begins to demonstrate sustainable growth that employers resumehiring. As more people are put back to work, the number of hours on the job increasesand productivity growth tapers off. This type of cyclical productivity has been faithfullyobserved for decades.
However, something quite bizarre occurred in the recession of 2001 and during the sub-sequent recovery. For the first time in modern history, productivity growth continued evenduring the economic downturn, and accelerated further well into the recovery phase. Alsounusual was that fewer workers were called back well after the economy rebounded. Thereason for this is still debated among economists. The predominant explanation is that duringthe boom years of the 1990s, businesses plowed so much money into productivity-enhancing
276 Chapter 3 • The Most Influential U.S. Economic Indicators
08Baumohl_Ch03.41-03.47.qxd 8/3/04 10:44 AM Page 276
equipment that the need for labor significantly diminished. This prompted many to wonderwhether the U.S. economy was now operating under a new paradigm where future increasesin output can be achieved more easily and cheaply by relying on domestic and foreign capital(such as high-tech equipment, modern assembly lines, and outsourcing production) ratherthan by hiring more U.S. workers.
If true, this sounds wonderful to companies because they can satisfy consumerdemand with a smaller, less costly, more efficient workforce. On the downside, though, isthe prospect that sustained productivity growth can severely disrupt traditional patterns ofjob creation in the U.S. economy. Workers with outmoded skills will have far greater dif-ficulty finding work in a period of high productivity growth and might have to relocate toanother state, learn a new trade, or both.
Does productivity growth itself lead to a higher unemployment over the longer term?Conventional wisdom says no. Greater operating efficiencies produce more corporateprofits, and this fosters higher investment spending by business. These outlays fuel theformation of new businesses, which leads to more employment opportunities. But someeconomists now wonder whether the traditional relationship between economic growth,corporate profits, and employment has changed. If productivity can surge during bothrecessions and expansions, it represents a historic shift in how the economy functions,specifically in terms of job creation. Meanwhile, as the debate continues, policymakersand economists are paying much more attention to the quarterly productivity data.
The report on productivity and costs contains three major components: output per hour(labor productivity), compensation per hour, and unit labor costs.
Output per hour of all persons: Productivity reflects how efficient labor is in produc-ing goods and services, normally referred to as output per hour. Calculating productivityis relatively straightforward. How much did the private, non-farm economy produce?Divide that number by the number of hours worked to make those goods and services.(For example, let’s look at a kitchen appliance manufacturer. Productivity in this casewould be based on how many toasters factory workers assembled in a single hour.)
Compensation per hour: This is the average hourly rate of compensation given toemployees in non-farm business. (Continuing with the example of toasters, how much didthat company compensate their workers per hour?) Compensation includes wages andsalaries, bonuses, commissions, exercised stock options, and the value of employee-paidbenefits. These include health costs, social security funds, and private pensions. Aftertotal compensation is calculated, it is divided by the number of hours worked.
Unit labor costs: It represents the cost of labor to produce a single unit of product.(Using the illustration of the company making toasters, unit labor costs would show howmuch the manufacturer pays its workers for each toaster they make.) Recall that labor isthe greatest cost to production, representing more than two-thirds of all business expenses.As unit labor costs go up, employers will either pass these additional expenses on to con-sumers in the form of higher prices, or they will absorb them and take a cut in profits.
277Productivity and Costs
08Baumohl_Ch03.41-03.47.qxd 8/3/04 10:44 AM Page 277
Suppose compensation per hour jumps by 3%, but labor productivity (output per hour)increases only 2%. In that case, the cost of labor (or unit labor costs) rises by 1%.There isa close statistical correlation between changes in unit labor costs and the behavior of con-sumer prices in the future. If unit labor costs ratchet up, prices at the retail level will even-tually climb too.
Let’s assume that instead of labor productivity increasing 2%, it actually jumps by 4%.Now, with labor output per hour greater than the increase in compensation per hour (3%),the result is a drop in unit labor costs of 1%. Whenever labor costs fall due to higher pro-ductivity, the economy benefits greatly. Corporate profits increase, which in turn buoysstock prices. Second, there’s no need for companies to raise prices, and they might verywell reward their workforce for their efficiency with higher compensation. The combinationof higher pay and dormant inflation will lead to a higher standard of living for workers.
HOW IS IT COMPUTED
Non-farm productivity and labor costs are compiled from numerous sources. Data onhours worked comes from the monthly payroll employment (see the section onEmployment Situation). For output, the government uses total GDP minus the outputgenerated by the government, nonprofit institutions, the employees of private households,the rental value of owner-occupied dwellings, and the farm sector. Strip all these factorsout and you’re still left with a hefty 80% of the GDP.
Labor compensation figures come from the Bureau of Labor Statistics and theBureau of Economic Analysis. It includes direct labor income from wages and salaries,tips, bonuses, commissions, and exercised stock options. Also added to labor compensa-tion are indirect payments, such as employee-paid benefits for health care, social securityfunds, and private pensions. In this release, total compensation costs are presented in bothcurrent dollars and inflation-adjusted dollars.
Revisions tend to occur frequently with productivity data and for obvious reasons.Many of the statistical sources that underlie this indicator, like GDP and hours worked,are themselves subject to periodic revisions. Thus, any change in those measures auto-matically leads to revisions in the productivity and cost data too.
THE TABLES: CLUES ON WHAT’S AHEAD FOR THE ECONOMY
• Table 2 Non-Farm Business Sector: Productivity, Hourly Compensation,Unit Labor Costs, and Prices
When it comes to monitoring productivity numbers, players in the financial marketsprefer to track the non-farm business sector, which makes up 75% of the GDP and isthe focus of this table.
278 Chapter 3 • The Most Influential U.S. Economic Indicators
08Baumohl_Ch03.41-03.47.qxd 8/3/04 10:44 AM Page 278
(1) The second column, formally labeled output per hour of all persons, is the bestoverall indicator of the economy’s efficiency. It records the percentage change inlabor productivity from one quarter to the next as well as over the past year.Labor productivity is considered a leading indicator of inflation in the economy.Higher output per hour is essential if the economy is to grow rapidly withoutinciting inflation.
To figure out just how fast the economy can expand before inflationary pres-sures heat up, take the annual growth of labor productivity in this table andadd that to the yearly increase in the labor force (or working age population).If output per hour has averaged a 3% annual rate in the last several quartersand the labor force increases at 1% a year, the economy is generally able togrow as fast as 4% annually in the long run without arousing price pressures.
(2) About midway across the page is a column called compensation per hour, andit provides some clues on emerging wage pressures. Because labor representsa significant portion of business costs, experts follow the compensation num-bers closely, especially as they relate to productivity growth. The linkbetween compensation per hour and output per hour shows up vividly in thenearby column titled unit labor costs, which is an excellent indicator of howpainful labor costs are to business. As long as output per hour rises fasterthan compensation per hour, it will drive down the all-important unit laborcosts. Should unit labor costs start to rise, which can happen when compensa-tion expenses climb faster than productivity, it can unleash the destructiveforces of inflation.
One interesting point here is that once productivity growth takes hold, it islikely to foster even more capital investment spending. The reason is that in ahighly competitive global marketplace, the pressure is on for manufacturers,wholesalers, and retailers to keep their sales price as low as necessary to holdon to customers. In this environment, companies will not be able to improveprofits simply by charging more for their products. Otherwise consumers hereand abroad will react by quickly shopping elsewhere. Since it becomes increas-ingly difficult to rely on pricing as a way to fatten profits, the other option is tofurther reduce operating costs, and that can be accomplished by achieving evenhigher levels of productivity.
279Productivity and Costs
08Baumohl_Ch03.41-03.47.qxd 8/3/04 10:44 AM Page 279
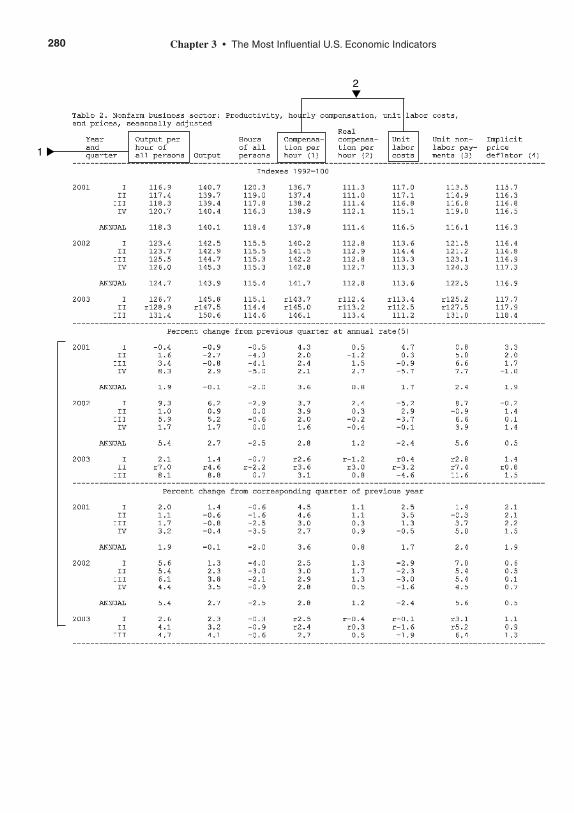
280 Chapter 3 • The Most Influential U.S. Economic Indicators
▲
1
2 ▼
08Baumohl_Ch03.41-03.47.qxd 8/3/04 10:44 AM Page 280
MARKET IMPACT
Bonds
Fixed income traders rarely get excited at quarterly releases, even for one as importantas productivity. That’s because some of the components, such as output and hoursworked, have already been published in separate reports. Still, reaction in the bondmarket to the productivity report might vary, depending on how inflation and laborcosts have been behaving in the background. The primary point here is that higher pro-ductivity levels keep inflation in check. However, a fall in productivity during times ofrising wages will upset the bond market and lead to a sell-off, with prices falling andyields rising.
Stocks
The equity market in this instance will react much like bonds. Higher productivitygrowth translates into lower unit labor costs and bigger corporate profits, events that canpropel stocks to higher prices. Flat or declining productivity is viewed as bearish forequity prices.
Dollar
The dollar will also be on better footing if there are firm gains in U.S. productivity. Byoperating efficiently, companies in this country will be in a better position to competewith foreigners, an important prerequisite to lowering the monthly trade and currentaccount deficits.
281Productivity and Costs
08Baumohl_Ch03.41-03.47.qxd 8/3/04 10:44 AM Page 281
EMPLOYER COSTS FOR EMPLOYEE COMPENSATION
Market Sensitivity: Low.
What Is It: Measures dollar cost per hour of having an employee on payroll.
News Release on Internet: www.bls.gov/news.release/ecec.toc.htm
Home Web Address: www.bls.gov
Release Time: 10 A.M. (ET); released nearly three months after the end of thereported quarter.
Frequency: Quarterly.
Source: Bureau of Labor Statistics, Department of Labor.
Revisions: No revisions.
WHY IS IT IMPORTANT
For years, economists have been clamoring for more information on labor costs.Employee compensation plays a pivotal role in determining future inflation and economicgrowth. A rise in wages can boost household confidence, fuel consumer spending, andkeep the economy running smoothly. For business, however, a rise in the cost of labor canhave adverse consequences on competitiveness and profits. If employee expenses, whichaccount for about three-fourths of all business costs, climb too quickly, they can eventu-ally ignite inflation. Given the enormous importance of compensation costs in the econ-omy, it is easy to see why so much attention is focused on this subject. The EmploymentCost Index does track changes for such expenses, but the results are put out in the form ofan index. More helpful to some analysts would be labor cost data presented in actual dol-lar terms.
Now comes along a relatively new quarterly series that does precisely that. Thisrelease, which comes with the unfortunate appellation of Employer Costs for EmployeeCompensation (ECEC), looks at the average cost per hour in dollars of having anemployee on payroll. It was originally put out just once a year, but the annual data quicklybecame outdated for those who tried to project future economic trends. As a result, startingin the fall of 2002, the Bureau of Labor Statistics began to publish it every quarter.Economists applauded the change, but the financial markets and the press have so fargiven this series surprisingly little notice even though it is easier to relate to. It’s expectedthat the ECEC will shortly be recognized as an effective and reliable gauge of actual laborcosts and possibly even become a leading indicator of consumer spending and inflation.
282 Chapter 3 • The Most Influential U.S. Economic Indicators
08Baumohl_Ch03.41-03.47.qxd 8/3/04 10:44 AM Page 282
HOW IS IT COMPUTED
The ECEC is based on a population survey involving both the private and public sector(local and state only; the federal payroll is excluded). Every quarter, the Bureau of LaborStatistics makes inquiries into labor costs at about 8,500 establishments in private indus-try involving 37,300 occupational observations. It also includes 800 establishments instate and local governments, public schools, and public hospitals covering 3,700 occupa-tional groupings. The surveys are conducted for the pay period that includes the twelfthday of the month in March, June, September, and December.
The same sampling is used to compute both the Employment Cost Index and theEmployer Costs for Employee Compensation. After the raw data arrives, there is a slightdifference in how these two labor cost measures are calculated, and this can cause themto diverge on an annual basis. The Employment Cost Index uses a fixed weight for differ-ent occupational groups that’s updated about every 10 years, the last being in 1995. Onthe other hand, the ECEC reformulates its weights every quarter based on changes in thenumber of people at work for those jobs listed in the sampling data.
Wages and Salary
The data is collected on a straight-time hourly pay basis. For those employees not paid onan hourly basis, a computation is made based on salary which is then divided by the cor-responding hours worked. Also included are production bonuses, incentive earnings,commission payments, and cost of living adjustments. Excluded from this calculation ispremium pay for overtime and for work performed on weekends and holidays.
Benefits
Benefits covered by the ECEC are paid vacations, sick leave, holidays, premium pay forovertime, shift differentials, insurance benefits, retirement and savings benefits, socialsecurity, Medicare, and federal- and state-mandated social insurance programs.
THE TABLES: CLUES ON WHAT’S AHEAD FOR THE ECONOMY
Labor cost measures such as Average Hourly Earnings and the Employment Cost Index(ECI) have demonstrated some qualities as leading indicators of consumer spending andeconomic growth. The new quarterly ECEC series is expected have to similar predictivevalues. Precisely how well it correlates with these key variables in the economy has yet tobe determined.
283Employer Costs for Employee Compensation
08Baumohl_Ch03.41-03.47.qxd 8/3/04 10:44 AM Page 283
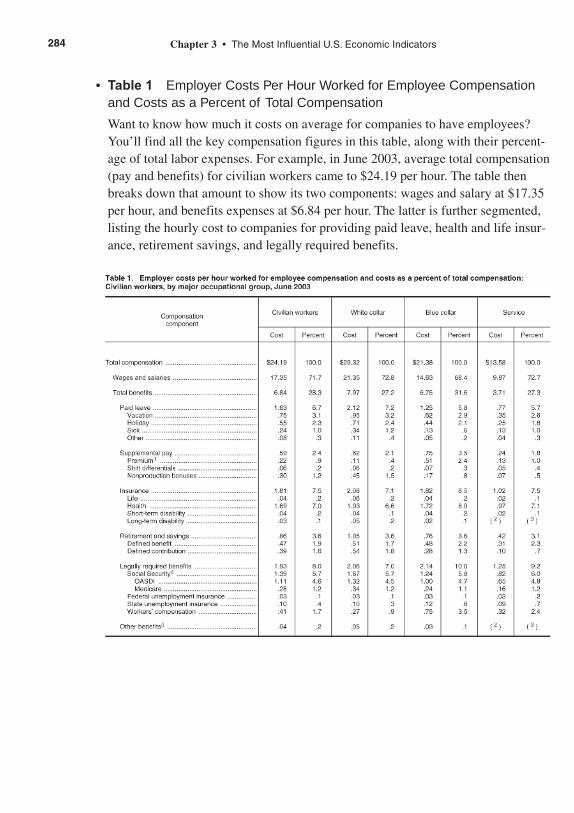
• Table 1 Employer Costs Per Hour Worked for Employee Compensationand Costs as a Percent of Total Compensation
Want to know how much it costs on average for companies to have employees?You’ll find all the key compensation figures in this table, along with their percent-age of total labor expenses. For example, in June 2003, average total compensation(pay and benefits) for civilian workers came to $24.19 per hour. The table thenbreaks down that amount to show its two components: wages and salary at $17.35per hour, and benefits expenses at $6.84 per hour. The latter is further segmented,listing the hourly cost to companies for providing paid leave, health and life insur-ance, retirement savings, and legally required benefits.
284 Chapter 3 • The Most Influential U.S. Economic Indicators
08Baumohl_Ch03.41-03.47.qxd 8/3/04 10:44 AM Page 284
This first table, however, is quite broad in that it encompasses all civilian workers inboth private industry and state and local governments. Subsequent tables in this 24-pagereport, while not included in this book, list the costs for different segments of the activeworkforce. For example, Table 2 in the release shows labor costs in dollars for differentoccupational and industry groups.
Table 5 compares the compensation costs for union versus non-union employees. Table 6 records labor expenses in the goods versus service producing sectors. Table 7 quantifies how compensation expenses differ across regions of the country.Table 8 notes labor costs at firms of various sizes. That is, it computes the average
hourly expense for labor at companies with up to 99 employees, up to 500 employees,and more than 500 employees.
One question that arises here is which measure—the ECI or the ECEC—you shoulduse to get a better sense of labor cost changes across American industry. The answerdepends on what you’re looking for. The ECEC gives you the average compensation indollar terms during a certain period, while the ECI measures change in the cost of com-pensation from one period to the next. One problem with the ECEC release is that it doesnot contain any historical tables. To see changes in the dollar-based ECEC over severalquarters and years, follow these steps:
1. Go to the Bureau of Labor Statistics Web site at www.bls.gov/ncs/ect/home.htm.
2. Click Get Detailed Statistics, located at the top line across the page.
3. You’ll see a column titled “Create Customized Tables.” Scroll down the page andclick the category for Employer Costs for Employee Compensation (ECEC). Atable appears, which allows you to pick and choose specific labor cost categories.Once you click “Get Data,” it will retrieve historical compensation costs that cango back quarterly or yearly—to the 1980s in some cases.
MARKET IMPACT
Again, this quarterly indicator is relatively new so it hasn’t received much notice fromthe investment community. That recognition will come once it develops a track record asa useful indicator that can anticipate future labor costs, corporate profit margins, andconsumer spending.
285Employer Costs for Employee Compensation
08Baumohl_Ch03.41-03.47.qxd 8/3/04 10:44 AM Page 285
REAL EARNINGS
Market Sensitivity: Low.
What Is It: Measures the change in worker earnings after adjusting for inflation.
News Release on Internet: www.bls.gov/news.release/realer.toc.htm
Home Web Address: www.bls.gov/
Release Time: 8:30 A.M. (ET); published in the middle of the month the sameday the CPI is released and refers to earnings in the previous month.
Frequency: Monthly.
Source: Bureau of Labor Statistics, Department of Labor.
Revisions: Changes are made monthly and are the result of revisions in theprevious month’s employment report or the CPI.
WHY IS IT IMPORTANT
Just how much do American workers earn these days after adjusting for inflation? This is acritical issue since people work hard for their money and rising prices can rob them oftheir purchasing power. If incomes fail to grow at or above the rate of inflation, Americanswill have less to spend on food, clothing, vacations, and gasoline. The result is lower liv-ing standards and discontented consumers. Labor unrest might follow as workers demandmore pay to offset the corrosive effects of higher prices. If, on the other hand, workersachieve true gains in real incomes, where earnings exceed the pace of inflation, more canbe purchased with each paycheck and that can promote further economic growth. Thus,tracking real earnings can be helpful in forecasting future trends in consumer spending.
Yet, the stock and bond markets do not react at all to this report. The reason is thatthe real earnings report simply combines two different sets of dated statistics. It’s basedon earnings from the previous employment release and then gets adjusted for inflationusing the Consumer Price Index (CPI), which happens to be published at the same time asReal Earnings.
Another reason why this indicator fails to command much attention is that earningsfrom work represent just one source of household income. It does not include profit shar-ing or increases in household wealth due to capital gains from financial assets (like stocksand bonds) and real estate, all of which play a role in the psychology of spending.
286 Chapter 3 • The Most Influential U.S. Economic Indicators
08Baumohl_Ch03.41-03.47.qxd 8/3/04 10:44 AM Page 286
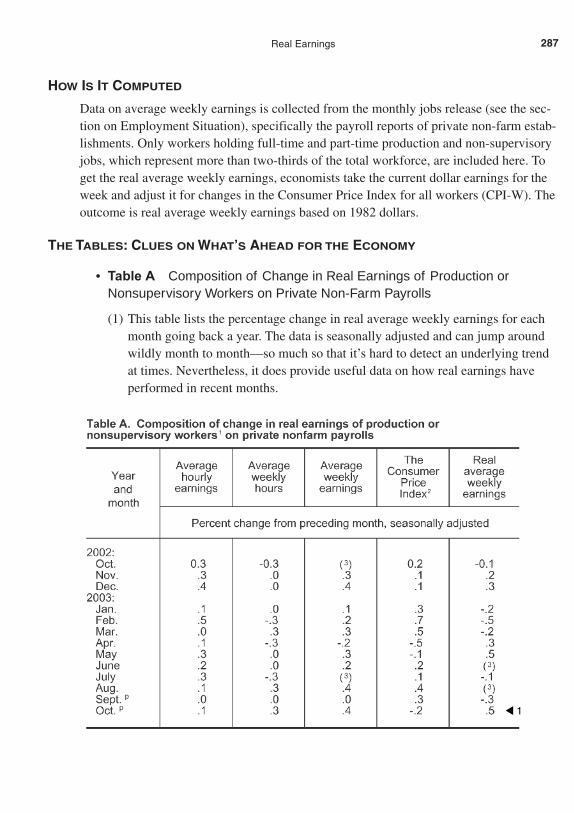
HOW IS IT COMPUTED
Data on average weekly earnings is collected from the monthly jobs release (see the sec-tion on Employment Situation), specifically the payroll reports of private non-farm estab-lishments. Only workers holding full-time and part-time production and non-supervisoryjobs, which represent more than two-thirds of the total workforce, are included here. Toget the real average weekly earnings, economists take the current dollar earnings for theweek and adjust it for changes in the Consumer Price Index for all workers (CPI-W). Theoutcome is real average weekly earnings based on 1982 dollars.
THE TABLES: CLUES ON WHAT’S AHEAD FOR THE ECONOMY
• Table A Composition of Change in Real Earnings of Production orNonsupervisory Workers on Private Non-Farm Payrolls
(1) This table lists the percentage change in real average weekly earnings for eachmonth going back a year. The data is seasonally adjusted and can jump aroundwildly month to month—so much so that it’s hard to detect an underlying trendat times. Nevertheless, it does provide useful data on how real earnings haveperformed in recent months.
287Real Earnings
▲ 1
08Baumohl_Ch03.41-03.47.qxd 8/3/04 10:44 AM Page 287
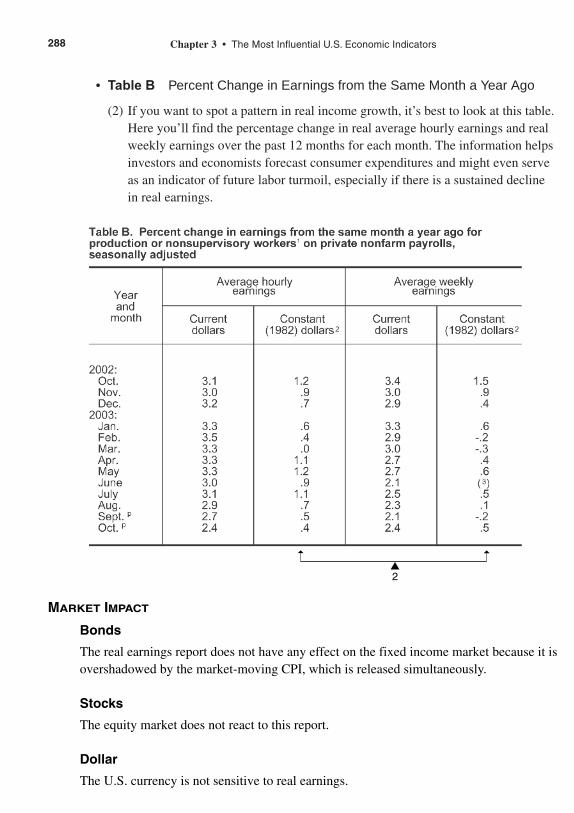
• Table B Percent Change in Earnings from the Same Month a Year Ago
(2) If you want to spot a pattern in real income growth, it’s best to look at this table.Here you’ll find the percentage change in real average hourly earnings and realweekly earnings over the past 12 months for each month. The information helpsinvestors and economists forecast consumer expenditures and might even serveas an indicator of future labor turmoil, especially if there is a sustained declinein real earnings.
288 Chapter 3 • The Most Influential U.S. Economic Indicators
MARKET IMPACT
Bonds
The real earnings report does not have any effect on the fixed income market because it isovershadowed by the market-moving CPI, which is released simultaneously.
Stocks
The equity market does not react to this report.
Dollar
The U.S. currency is not sensitive to real earnings.
➝➝
▲2
08Baumohl_Ch03.41-03.47.qxd 8/3/04 10:44 AM Page 288

YIELD CURVE
Market Sensitivity: Low to medium.
What Is It: Yields on Treasury securities from short to long term maturities.
Web Addresses: www.stockcharts.com/charts/YieldCurve.html www.bloomberg.com/markets/rates/index.html
Frequency: Always available.
Source: Treasury markets.
WHY IS IT IMPORTANT
When it comes to predicting the future course of the economy, only one indicator standsabove all others in terms of accuracy: the yield curve. No other measurement has demon-strated as much success in warning of upcoming turning points in business activity. Theyield curve is a collection of yields plotted on a graph that covers the entire spectrum ofmaturities on U.S. Treasury securities. What distinguishes the yield curve from all othereconomic indicators is that it’s not something produced by a government agency or pri-vate group. Instead, it comes directly from the financial markets and is supposed toreflect the collective wisdom of investors at any moment in time on the likely direction ofthe economy and inflation. Best yet, you don’t have to wait a week or a month for theresults of this indicator; you can check out Treasury yields anytime during the course ofthe trading period.
All yield curve graphs have the same characteristics. They begin on the left with theshortest maturities, which in most cases are three-month Treasuries, and then progress to6 months, 1 year, 2, 5, 10, all the way up to 30-year bonds at the far right side of thecurve. What makes the yield curve such a powerful forecasting tool is its shape after youplot the yields on a graph. The curve can slope up gradually or steeply, appear totally flat,or be completely inverted. In a normal yield curve, the yield starts off low on short matu-rities and then gradually rises as the duration of the security lengthens (see Chart A). Whyis this considered normal? Because in a typical economic expansion, investors demand ahigher rate of return on longer maturing Treasury debt. After all, if they’re going to pur-chase a 10- or 30-year bond, investors want extra compensation in the form of a higheryield for all the unknown risks they face over the coming years. These risks can includeinflation swings, political turmoil, and war. In contrast, those investors buying short-termTreasuries have far less risk to worry about and thus are willing to accept a lower yield.It’s much easier to foresee what’s going to happen in the next few months than predictconditions two or three decades ahead.
289Yield Curve
08Baumohl_Ch03.41-03.47.qxd 8/3/04 10:44 AM Page 289
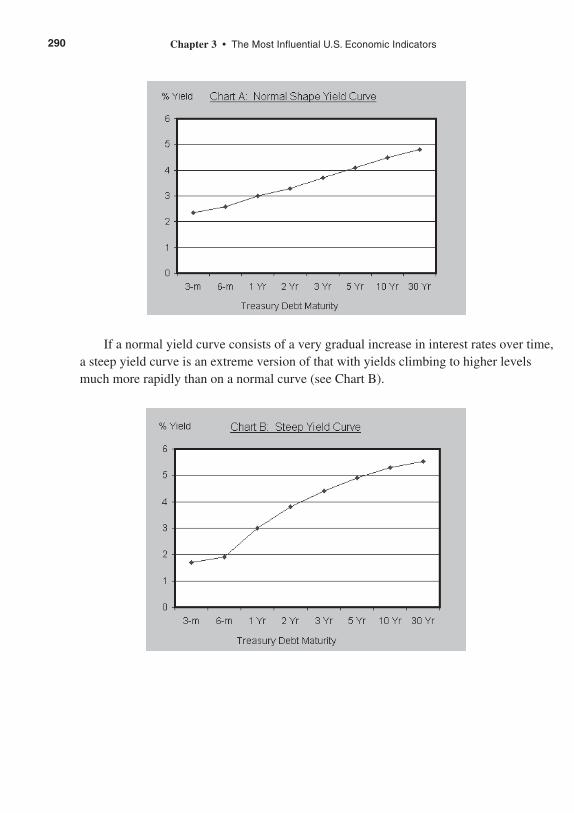
If a normal yield curve consists of a very gradual increase in interest rates over time,a steep yield curve is an extreme version of that with yields climbing to higher levelsmuch more rapidly than on a normal curve (see Chart B).
290 Chapter 3 • The Most Influential U.S. Economic Indicators
08Baumohl_Ch03.41-03.47.qxd 8/3/04 10:44 AM Page 290
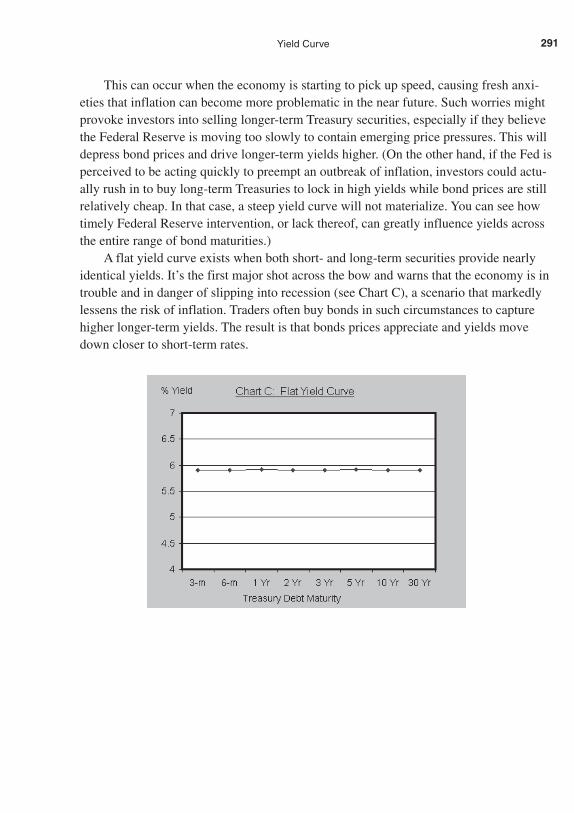
This can occur when the economy is starting to pick up speed, causing fresh anxi-eties that inflation can become more problematic in the near future. Such worries mightprovoke investors into selling longer-term Treasury securities, especially if they believethe Federal Reserve is moving too slowly to contain emerging price pressures. This willdepress bond prices and drive longer-term yields higher. (On the other hand, if the Fed isperceived to be acting quickly to preempt an outbreak of inflation, investors could actu-ally rush in to buy long-term Treasuries to lock in high yields while bond prices are stillrelatively cheap. In that case, a steep yield curve will not materialize. You can see howtimely Federal Reserve intervention, or lack thereof, can greatly influence yields acrossthe entire range of bond maturities.)
A flat yield curve exists when both short- and long-term securities provide nearlyidentical yields. It’s the first major shot across the bow and warns that the economy is introuble and in danger of slipping into recession (see Chart C), a scenario that markedlylessens the risk of inflation. Traders often buy bonds in such circumstances to capturehigher longer-term yields. The result is that bonds prices appreciate and yields movedown closer to short-term rates.
291Yield Curve
08Baumohl_Ch03.41-03.47.qxd 8/3/04 10:44 AM Page 291
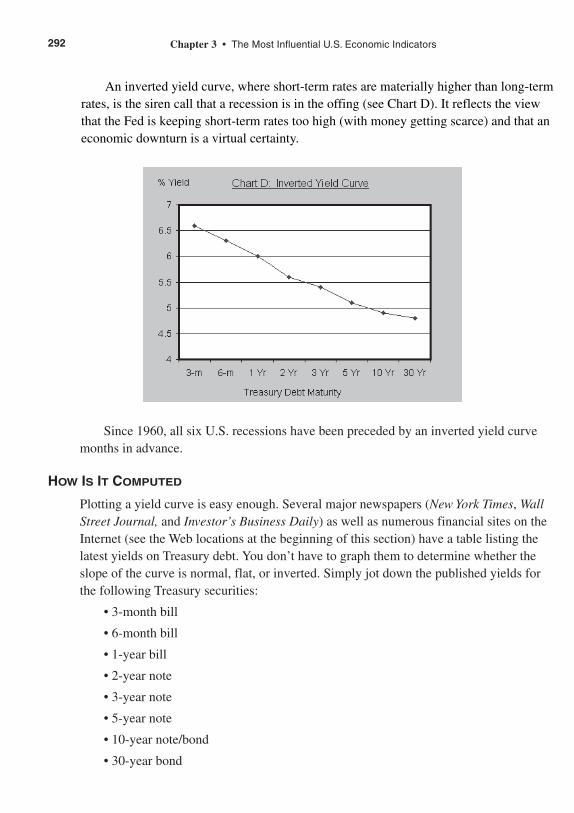
Since 1960, all six U.S. recessions have been preceded by an inverted yield curvemonths in advance.
HOW IS IT COMPUTED
Plotting a yield curve is easy enough. Several major newspapers (New York Times, WallStreet Journal, and Investor’s Business Daily) as well as numerous financial sites on theInternet (see the Web locations at the beginning of this section) have a table listing thelatest yields on Treasury debt. You don’t have to graph them to determine whether theslope of the curve is normal, flat, or inverted. Simply jot down the published yields forthe following Treasury securities:
• 3-month bill
• 6-month bill
• 1-year bill
• 2-year note
• 3-year note
• 5-year note
• 10-year note/bond
• 30-year bond
292 Chapter 3 • The Most Influential U.S. Economic Indicators
An inverted yield curve, where short-term rates are materially higher than long-termrates, is the siren call that a recession is in the offing (see Chart D). It reflects the viewthat the Fed is keeping short-term rates too high (with money getting scarce) and that aneconomic downturn is a virtual certainty.
08Baumohl_Ch03.41-03.47.qxd 8/3/04 10:44 AM Page 292

A normal yield curve will have a spread, which is the difference in yield between the 30-year bond and the short 3-month bill, of about two and half percentage points. Anythinggreater than that would be considered a steep yield curve. A flat curve is where they allhuddle close to the same rate, and an inverted curve is whenever the 3-month bill rate ishigher than that of the 10- or 30-year bond. A key point to appreciate is that while theFederal Reserve sets yields at the shortest end of the curve by governing the overnightfederal funds rate, it’s the market that determines all other yields.
THE TABLES: CLUES ON WHAT’S AHEAD FOR THE ECONOMY
So what can you learn from the yield curve? After plotting the yields, determine theshape of the curve. If the yield curve is flat or inverted, chances are that the economyis, or will soon become, sluggish. Indeed, once the curve is inverted the odds greatlyincrease that a recession is unavoidable. Just how certain can we be a recession willoccur? One study by the Federal Reserve Bank in New York calculated probabilities ofa recession based on the yield curve. If the yield curve is normal so that the 10-yearTreasury bond yield is more than 1.2 percentage points above the 3-month bill, thechance of recession is less than 5%. Once the yield curve flattens and the two haveessentially the same yield, the probability of recession jumps to 50%. If the curve endsup inverted where the yield on 3-month bills is more than 2.4 percentage points abovethe 10-year bond, the odds leap to 90% that an economic downturn will materializewithin the next 18 months.
Once a recession is underway, short-term rates often plunge as the demand formoney and credit diminishes and the Federal Reserve pumps more funds into the econ-omy to make borrowing even cheaper. Should the economy respond and start to turnup, the combination of very low yields on short-term Treasuries and a rebound in yieldson 10- and 30-year bonds can produce a steep yield curve. It’s symptomatic of an econ-omy moving from recession to growth again. After healthy growth resumes, the Fedlifts short-term rates a little and the yield curve returns to its more normal spread ofabout 2.5 percentage points.
MARKET IMPACT
Bonds
Expectations of future growth and inflation by fixed income investors determine whichTreasury debt maturities are the most attractive to buy. Such preferences help shape theyield curve. However, since the outlook for economic activity and price behaviorfrequently changes, the yield curve is constantly in a state of motion.
293Yield Curve
08Baumohl_Ch03.41-03.47.qxd 8/3/04 10:44 AM Page 293

Stocks
The equity market has not taken the yield curve seriously, despite its proven forecastingrecord. This is surprising because stock prices are based on expectations of future corpo-rate earnings and overall business activity, both of which can be foreseen by the behaviorof the yield curve. Indeed, studies have shown that the yield curve can serve as an effec-tive market-timing strategy, yet it remains underappreciated among portfolio managers.
Dollar
Foreign investor reaction to a flat or inverted yield curve is difficult to predict. Muchdepends on the magnitude of the inverted yield curve, which is how much higher short-term rates are above long-term rates, and how U.S. short-term rates stack up against thoseof other countries. It is possible that international investors might choose to avoid invest-ing in the U.S. because a flat or inverted yield curve is a harbinger of anemic growth, ifnot recession. That will cause the dollar to depreciate in foreign exchange markets.However, if the yield curve is so inverted that U.S. short-term rates are markedly higherthan those of other nations, it may attract an influx of “hot money” from overseas as for-eign investors seek to take advantage of the greater returns they can receive here. Whatdo we mean by “hot money?” It’s fast-moving money from investors around the worldwho are constantly on the hunt for the highest possible short-term gains. The instant aninvestment loses its appeal (for example, when U.S. yields fall relative to their foreigncounterparts), that “hot” money quickly leaves the border of one country for anotherlucrative region of the world. Thus, the dollar might bounce up in value when there is aninverted yield curve, but its strength would be very tenuous.
A steep yield curves suggests stronger economic growth and rising short-term ratesin the months ahead. This will likely attract foreign investors to purchase and hold dollar-based financial assets.
294 Chapter 3 • The Most Influential U.S. Economic Indicators
08Baumohl_Ch03.41-03.47.qxd 8/3/04 10:44 AM Page 294

C H A P T E R 4
International Economic Indicators:Why Are They So Important?
U.S. economic indicators help us understand what is happening in the domestic economy.However, being a successful investor or an effective corporate leader in today’s highlyintegrated global economy requires a knowledge of what is going on beyond U.S. borderstoo. A CEO who wants to sell products overseas or an investor who seeks to achievehigher returns on stocks and bonds should be familiar with indicators that gauge thehealth of foreign economies.
Why place so much emphasis on the international business climate? For one, theperformance of U.S. corporate profits, stocks and bonds, and the dollar is affected byforeign developments more than ever before. A recession in Europe harms not only com-panies on that continent, but many U.S.-based firms as well. Close to half of the earn-ings of S&P 500 firms originate from sales outside the U.S. Moreover, it just makesgood business sense to be aware of new opportunities that become available in marketsoutside the U.S. By diversifying into Europe, Asia, and Latin America, one is no longerbound to the economic swings of just one country. Indeed, there is much fertile territoryto choose from in other markets. Equity investors, for example, can pick from more than40,000 public companies that are listed on world stock exchanges, two-thirds of whichare outside the U.S.
To be sure, there are additional risks to consider when investing overseas. One of thebiggest is adverse movements in currencies. If you own securities or other assets inanother country and their currency climbs in value against the dollar, great!! The overallreturn on that investment gets an added lift because it is more valuable in dollar terms.However, should that currency happen to weaken relative to the dollar, the investmentwill be less valuable or perhaps even turn into a loss once it is sold and the proceeds con-verted back to dollars. Thus, shifts in foreign exchange values can potentially make orbreak a foreign investment.
09Baumohl_Ch04.qxd 8/3/04 2:59 PM Page 295
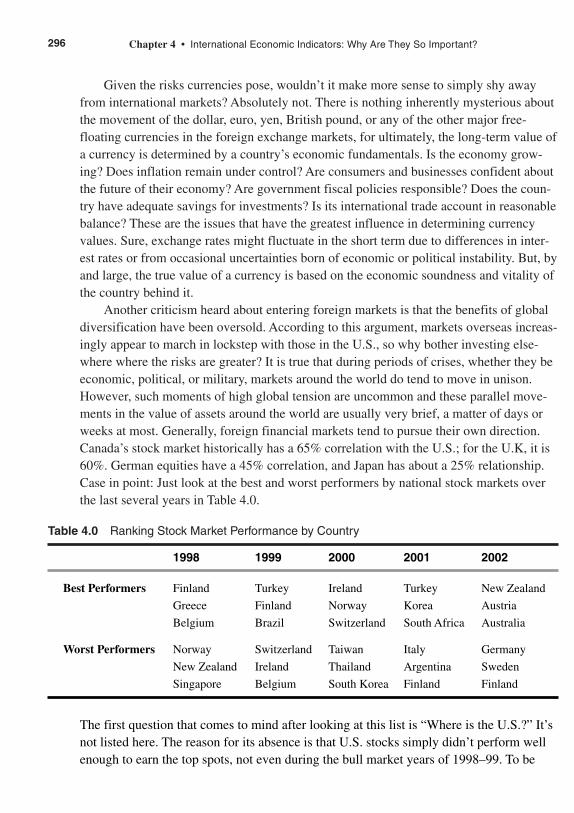
296 Chapter 4 • International Economic Indicators: Why Are They So Important?
Given the risks currencies pose, wouldn’t it make more sense to simply shy awayfrom international markets? Absolutely not. There is nothing inherently mysterious aboutthe movement of the dollar, euro, yen, British pound, or any of the other major free-floating currencies in the foreign exchange markets, for ultimately, the long-term value ofa currency is determined by a country’s economic fundamentals. Is the economy grow-ing? Does inflation remain under control? Are consumers and businesses confident aboutthe future of their economy? Are government fiscal policies responsible? Does the coun-try have adequate savings for investments? Is its international trade account in reasonablebalance? These are the issues that have the greatest influence in determining currencyvalues. Sure, exchange rates might fluctuate in the short term due to differences in inter-est rates or from occasional uncertainties born of economic or political instability. But, byand large, the true value of a currency is based on the economic soundness and vitality ofthe country behind it.
Another criticism heard about entering foreign markets is that the benefits of globaldiversification have been oversold. According to this argument, markets overseas increas-ingly appear to march in lockstep with those in the U.S., so why bother investing else-where where the risks are greater? It is true that during periods of crises, whether they beeconomic, political, or military, markets around the world do tend to move in unison.However, such moments of high global tension are uncommon and these parallel move-ments in the value of assets around the world are usually very brief, a matter of days orweeks at most. Generally, foreign financial markets tend to pursue their own direction.Canada’s stock market historically has a 65% correlation with the U.S.; for the U.K, it is60%. German equities have a 45% correlation, and Japan has about a 25% relationship.Case in point: Just look at the best and worst performers by national stock markets overthe last several years in Table 4.0.
Table 4.0 Ranking Stock Market Performance by Country
1998 1999 2000 2001 2002
Best Performers Finland Turkey Ireland Turkey New Zealand
Greece Finland Norway Korea Austria
Belgium Brazil Switzerland South Africa Australia
Worst Performers Norway Switzerland Taiwan Italy Germany
New Zealand Ireland Thailand Argentina Sweden
Singapore Belgium South Korea Finland Finland
The first question that comes to mind after looking at this list is “Where is the U.S.?” It’snot listed here. The reason for its absence is that U.S. stocks simply didn’t perform wellenough to earn the top spots, not even during the bull market years of 1998–99. To be
09Baumohl_Ch04.qxd 8/3/04 2:59 PM Page 296

fair, nor did the U.S. do as poorly as other foreign markets in 2000 following the dot.commarket collapse. What all this boils down to is the importance of keeping an open mindabout the profits and perils that come with international investments. No one can predictwith certainty which economies and financial markets will outperform others. But thereshould be no dispute that the virtues of diversifying investments abroad remain as validas ever.
The purpose of this chapter is to bring the reader to the next level and help identifythose foreign indicators that provide the best read on current and future global economicconditions. These barometers of economic activity abroad should be followed with thesame regularity and scrutiny as U.S. indicators so that investors and business managershave a chance of achieving success in international markets. The problem, much like withthe U.S., is that there is a vast amount of foreign economic data in the public domain.Hundreds of countries churn out thousands of statistics on a regular basis. Even if younarrowed down the number of countries worth monitoring to two dozen, the task of fol-lowing all the indicators that flow from these nations can still be overwhelming. Besidesthe sheer variety of international statistics, many of them are difficult to locate whenneeded. Often they are defined and computed differently than indicators in the U.S andcan vary greatly in quality. A large number are not even presented in English.
This chapter tries to overcome these problems. In the pages that follow, ten of themost important foreign economic indicators are chosen for closer study. They representthe three major non-U.S. markets in the world: Europe, Asia, and the emerging countries.As is the case with U.S. economic statistics, these foreign indicators are released to thepublic on a predetermined schedule. Calendars of international economic releases can befound at Web sites listed at the start of Chapter 6, “Best Web Sites for InternationalEconomic Indicators.” All 10 international indicators presented here are available on theInternet. They originate either from official government or private association Web sites,are free to the public, and displayed in English.
Finally, readers should note that international data is presented in different formats.Many countries use commas instead of decimal points and a period or a space instead of acomma to indicate the thousands place. For example, the U.S. and Germany both repre-sent numbers using decimals and commas, but sometimes the symbols are interchanged(2,325.77 versus 2.325,77). At other times, Germany (and France) might use a blankspace as the digit-grouping symbol (2 325,77).
International dates are also displayed differently around the world. In the U.S., themonth precedes the day; Europeans mostly use day-month-year, while Asian cultures useyear-month-day. Why isn’t there a single standard for all countries now that world eco-nomic and financial systems are so closely integrated? Tradition and politics. These twohurdles are difficult to overcome. Those favoring a uniform worldwide format will have along wait. In the meantime, one has little choice but to get used to these local customsand move on.
297International Economic Indicators
09Baumohl_Ch04.qxd 8/3/04 2:59 PM Page 297

GERMAN INDUSTRIAL PRODUCTION
Rank: 1st
What Is It: Industrial output in Europe’s largest economy.
News Release on Internet: www.destatis.de/indicators/e/tkpi111x.htm
Home Web Address: www.destatis.de
Release Time: 11 A.M. (Continental time); released the second week of themonth and refers to activity two months earlier (so March data describesproduction in January).
Frequency: Monthly.
Source: Federal Statistics Office, Germany (Statistisches Bundesamt,Deutschland).
Revisions: Revisions can occur with each release and cover the two previous months.
Germany is Europe’s richest and most populous country. Its output alone accounts forabout a third of everything produced in Euroland, the name given to the region of 12countries that use the euro currency. Germany thus holds enormous sway over theContinent’s economic well-being. However, the country’s influence also extends farbeyond Europe. It’s the world’s second largest exporter and is considered the third mosttechnologically advanced nation on the globe, after the U.S. and Japan. Germany is also akey trading partner of the U.S. and an important investor. Trade between the two coun-tries now exceeds $120 billion. The U.S. is the second largest market for German prod-ucts, while American exporters see Germany as their third largest buyer. In terms ofinvesting, German companies account for about 850,000 jobs in the U.S., while Americanfirms have established roughly 800,000 positions in Germany.
Given the dominance of its economy over Europe and the fact that it is a key playerin the world as well, Germany’s industrial production figure ranks at the top of the must-watch list. This indicator has been correlated with GDP changes in Euroland overall.Thus, investors and business executives who want to spot early signs of strength or weak-ness in Europe will find Germany’s industrial production index a good leading indicator.
298 Chapter 4 • International Economic Indicators: Why Are They So Important?
09Baumohl_Ch04.qxd 8/3/04 2:59 PM Page 298
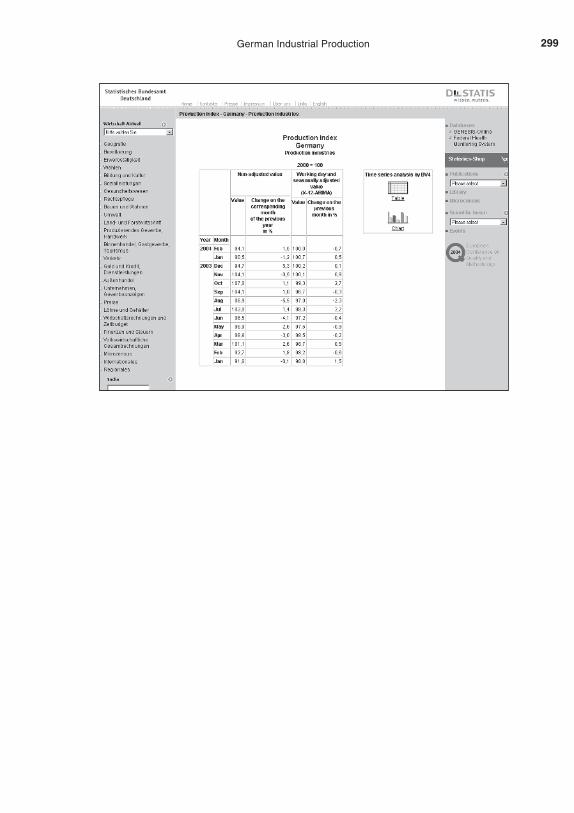
299German Industrial Production
09Baumohl_Ch04.qxd 8/3/04 2:59 PM Page 299

GERMAN IFO BUSINESS SURVEY
Rank: 2nd.
What Is It: German business leaders assess the current and future economicclimate.
News Release on Internet: www.ifo-business-climate-index.info
Home Web Address: www.ifo.de
Release Time: 10 A.M. (Continental time); published the fourth week of thesurvey month.
Frequency: Monthly.
Source: IFO Institut für Wirtschaftsforschung (IFO Institute for EconomicResearch).
Revisions: Tend to be rare. Periodic revisions occur as a result of changes inseasonal adjustment factors.
Among the most anticipated economic statistics to come out in Europe every month isGermany’s IFO Business Survey. It has been a very good leading indicator of how theGerman economy and, more broadly, the European economy will perform in the weeksahead. Of course, a similar claim was made of the industrial production index. But whatmakes the IFO report such a sensitive one for investors is the timeliness of the data—theresults are released the same month the survey is taken.
At the start of every month, the Institute questions more than 7,000 German businessleaders and senior managers covering the manufacturing, construction, wholesale, andretailing industries. All are asked to appraise Germany’s current business situation(good/satisfactory/poor) as well as their expectations over the next six months(better/same/worse). Their answers form the basis for the total IFO Business ClimateIndex and its two principal subcomponents: the present situations index, which assessescurrent economic conditions, and the expectations index, where those queried are askedto forecast what the business environment might be a half year later.
Of the three index results, European financial markets tune in more closely to theexpectations series. History has shown that movements in the expectations index tend tolead changes in Euroland’s industrial production by about two or three months. Thus, ifthe IFO expectations gauge turns up, odds are it will shortly be followed by an accelera-tion in factory output in Germany and perhaps much of Europe as well.
After the reunification of Germany, the IFO Institute published two separate businessclimate readings, one for eastern Germany and the other for western Germany. However,in 2004, the decision was made to combine the two sets of data to represent business
300 Chapter 4 • International Economic Indicators: Why Are They So Important?
09Baumohl_Ch04.qxd 8/3/04 2:59 PM Page 300
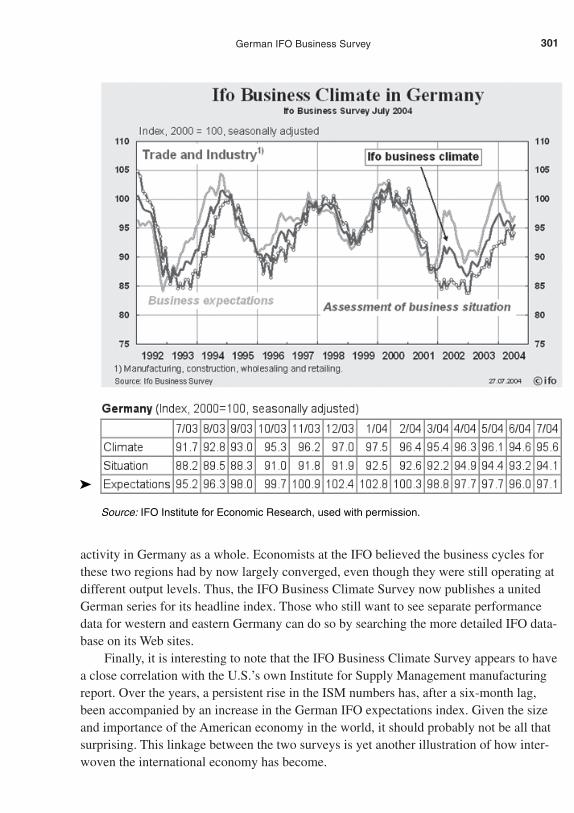
activity in Germany as a whole. Economists at the IFO believed the business cycles forthese two regions had by now largely converged, even though they were still operating atdifferent output levels. Thus, the IFO Business Climate Survey now publishes a unitedGerman series for its headline index. Those who still want to see separate performancedata for western and eastern Germany can do so by searching the more detailed IFO data-base on its Web sites.
Finally, it is interesting to note that the IFO Business Climate Survey appears to havea close correlation with the U.S.’s own Institute for Supply Management manufacturingreport. Over the years, a persistent rise in the ISM numbers has, after a six-month lag,been accompanied by an increase in the German IFO expectations index. Given the sizeand importance of the American economy in the world, it should probably not be all thatsurprising. This linkage between the two surveys is yet another illustration of how inter-woven the international economy has become.
301German IFO Business Survey
➤
Source: IFO Institute for Economic Research, used with permission.
09Baumohl_Ch04.qxd 8/3/04 2:59 PM Page 301

GERMAN CONSUMER PRICE INDEX (CPI)
Rank: 3rd.
What Is It: The main price inflation gauge for Europe’s largest economy.
News Release on Internet: www.destatis.de/indicators/e/pre110je.htm
Home Web Address: www.destatis.de/e_home.htm
Release Time: 7 A.M. (Continental time); the preliminary CPI is publishedaround the 25th of every month. Final figures are released two weeks later.
Frequency: Monthly.
Source: Federal Statistics Office Germany (Statistisches BundesamtDeutschland).
Revisions: Monthly report on the CPI might contain revisions for earlier months.
As the economic pillar of Europe, Germany can serve as the engine of growth for the Continent, or it can be responsible for dragging the region down. Which roleGermany ultimately plays depends on many factors, but none more important than theperformance of its own inflation. Germany’s CPI can have a powerful impact on theeconomies of other European nations and on the policies of the European CentralBank (ECB), which sets short-term interest rates for all 12 countries using the eurocurrency.1
If German inflation is increasing at a troubling rate, the ECB will likely raiseinterest rates even if the other neighboring economies show their inflation to be rela-tively tame. On the other extreme, should Germany get caught up in a deflationaryspiral where prices are consistently falling, the ECB is expected to jump in and lowerrates to preempt a similar collapse in prices from spreading to the rest of the continent.
Germany’s CPI has been on the radar screen of investors worldwide for decades.Its high profile can be traced to the country’s oath to avoid at all costs a repetition ofthe catastrophic hyperinflation it experienced in the 1920s, when prices for essentialslike bread and milk jumped several hundred percent every day, making its nationalcurrency essentially worthless. That painful memory led the Bundesbank (Germany’scentral bank) after World War II to set in stone a tough, inflexible, anti-inflationarypolicy, and it has never veered from that stance. For decades the Bundesbank showed
302 Chapter 4 • International Economic Indicators: Why Are They So Important?
1 Countries using the euro as currency are Austria, Belgium, Finland, France, Germany, Greece, Ireland, Italy,Luxembourg, the Netherlands, Portugal, and Spain.
09Baumohl_Ch04.qxd 8/3/04 2:59 PM Page 302
zero tolerance for the slightest whiff of inflation beyond 2% a year. It made no differ-ence whether their economy was weak or unemployment was sky high. The primarymandate of the central bank was to keep inflation close to zero and protect Germany’scurrency, the Deutsche Mark, at all costs, even if it meant lifting and holding rates atpainfully high levels. While Germany’s dogged defense against inflation contributedto years of chronically high joblessness, it also made its currency one of the mostrevered in the world.
During talks to establish the euro in the 1990s, Germany made clear to Europeannegotiators that it would join the currency union only if the new European Central Bankagreed to pursue the same tough anti-inflationary position shown by the Bundesbank.German officials wanted the euro to have the kind of respectability in global currencymarkets the mark had and that would mean keeping interest rate decisions for Eurozonenations out of the hands of politicians. Even today, Germany’s influence on the ECB ispalpable; Europe’s central bank firmly toes the line that it will not permit inflation toexceed the 2% range for the Eurozone. Moreover, ECB policymakers place great weighton the outlook for German inflation to help formulate future monetary policy for theEuro region.
Let’s take a closer look at Germany’s inflation measure itself. The CPI measuresthe average change in prices for all goods and services bought by households for thepurpose of consumption. In the middle of the month, about 560 price collectors, work-ing out of state government offices across Germany, collect prices on a basket of 750specific goods and services. Overall, approximately 400,000 prices are obtained eachmonth and include taxes (value-added and excise taxes) and price discounts (such assales or rebates). The Federal Statistics Office (FSO) then compiles these pricechanges for six key German states (Baden-Württemberg, Bavaria, Brandenburg,Hesse, North Rhine-Westphalia, and Saxony) and announces the much-awaited pre-liminary inflation rate for the month, along with the latest 12-month change. The com-plete data on German CPI appears at different links within the Federal StatisticsOffice’s Web site:
• The press release of Germany’s CPI can be found here shortly after it’s announced:www.destatis.de/e_home.htm
• Monthly trends in the CPI are located at this address:www.destatis.de/indicators/e/pre110me.htm
• Yearly changes for each month are published here:www.destatis.de/indicators/e/pre110je.htm
303German Consumer Price Index
09Baumohl_Ch04.qxd 8/3/04 2:59 PM Page 303
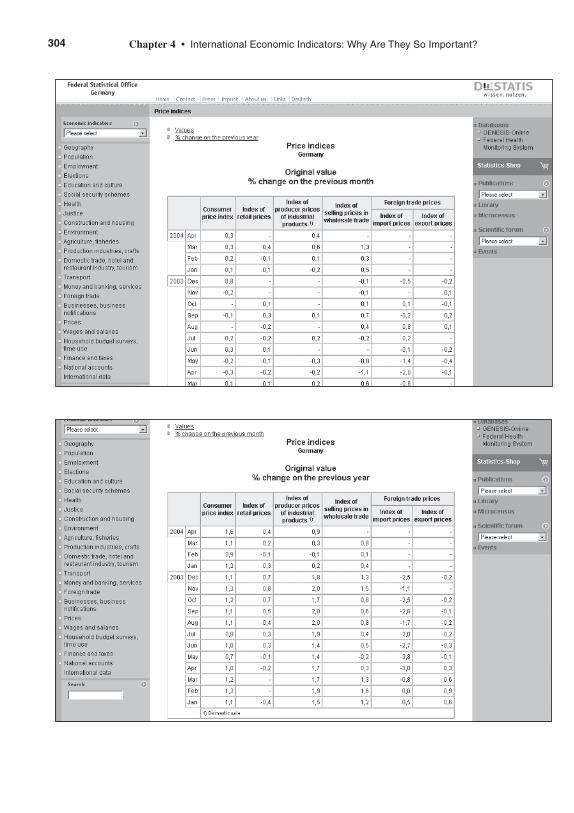
304 Chapter 4 • International Economic Indicators: Why Are They So Important?
09Baumohl_Ch04.qxd 8/3/04 2:59 PM Page 304

Another virtue of the German CPI is how current it is. The government puts out a pro-visional estimate of inflation the same month as the survey. A final CPI is publishedtwo weeks later between the 10th and the15th of the following month. It is the provi-sional figures, though, that traders in the financial markets react to the most becausethe difference between the preliminary German CPI and the revised numbers tends tobe negligible.
Without meaning to complicate this subject, it is necessary to know that theFederal Statistics Office also calculates another version of Germany’s inflation everymonth, which is also in the same press release. Why produce two CPI versions? Thereason for the second is to follow a standardized European formula for measuring the CPI. This allows business leaders, investors, and economists to more accuratelycompare Germany’s inflation rates with those of its neighboring countries. Called theHarmonized Index of Consumer Prices (HICP), and commonly dubbed “hiccup,” it isthe official inflation computation for the 15 member states of the European Union(EU), plus Norway and Iceland. When all is said and done, though, the differencebetween the national definition of German CPI and the Harmonized CPI for Germanyis not a significant one.
305German Consumer Price Index
09Baumohl_Ch04.qxd 8/3/04 2:59 PM Page 305
306 Chapter 4 • International Economic Indicators: Why Are They So Important?
JAPAN’S TANKAN SURVEY
Rank: 4th.
What Is It: A widely respected report on business confidence in Japan.
News Release on Internet: www.boj.or.jp/en/stat/tk/tk.htm
Home Web Address: www.boj.or.jp/en/index.htm
Release Time: 8:50 A.M. (local time); results are published at the start of April,July, and October, and in mid-December.
Frequency: Quarterly.
Source: Bank of Japan.
Revisions: Statistical corrections are rare. Revisions merely reflect changes inconfidence and plans from one quarter to the next.
Aside from the U.S., Japan has arguably the most extensive collection of economic indi-cators in the world, much of it in English and freely available on the Web. Perhaps that’sto be expected from the second-largest economy (after the United States). Among thereports Japan churns out is the Tankan survey, which has gained worldwide recognitionfor its sweeping coverage, forward-looking features, and quick release to the public.International investors and managers of multinational companies look to the Tankanreport for the latest reading on the state of the Japanese economy and its forecasts ofbusiness activity in the months ahead. What gives this survey extra credibility is theagency behind it. The Tankan survey is produced by the Bank of Japan, the country’scentral bank, and its results can offer clues on the future course of monetary policy andinterest rates.
Often described as a business confidence survey, the Tankan survey is really muchmore than that. Indeed, this report offers readers more insight into what the business com-munity is thinking than does any comparable U.S. economic indicator. If you want toknow of Japanese plans for future capital investments, employment, or expectations ofpricing power, and predictions of where the yen will likely be valued in the future, thisrelease covers all this and a lot more.
The survey itself is conducted quarterly by the Research and Statistics Department atthe Bank of Japan. Questionnaires are sent out the last month of every quarter—March,June, September, and December—to about 8,000 firms. These companies are differenti-ated by their size—large (on average 16% of the sample), medium (32%), and small(52%)—and by industry type, with more going to non-manufacturers (57%) than manu-facturing (43%). Amazingly, the response rate of these surveys tends to be around 98%.
09Baumohl_Ch04.qxd 8/3/04 2:59 PM Page 306
Respondents are asked to respond to seven broad questions:
• Business conditions (favorable or unfavorable?)
• Supply and demand conditions (excessive demand or excessive supply?) and prices(rising or falling?)
• Sales and current profits (% change)
• Fixed investment (% change)
• Employment (excessive employment or insufficient?)
• Corporate finance (easy or tight monetary conditions?)
• Overseas activities (% change)
Of the seven topics, four seek qualitative assessments that require a judgment call (topics 1,2, 5, and 6). These responses are collected and a diffusion index is computed by simply cal-culating the percentage of businesses reporting a negative tone and subtracting it from thepercentage indicating a positive tone. The remaining three questions (3, 4, and 7) ask forquantitative changes in percentage terms regarding recent performance as well as expecta-tions of how this will change in the future.
Highlighted in the following text are a few of the most useful tables in the Tankansurvey:
• Business Conditions for Large Manufacturers
(1) Manufacturing is one of the main engines of growth in Japan because it includesthe country’s vital export industry. In this table, we see confidence improved inDecember (actual result) to a net 11, representing a 10 percentage point gain inconfidence from September’s survey. However, these same manufacturers havepredicted a slight deterioration in conditions in the next few months because thediffusion index on the forecast dropped back to 8.
Aside from the summary number at the top of the table, confidence levels arealso broken down into broad industry categories such as motor vehicles andindustrial machinery.
• Business Conditions for Nonmanufacturers
(2) This section is a good measure of the strength of consumer demand inside Japan.Large non-manufacturers conduct most of their business in the country and donot benefit much from strong export growth. One can look at the headline figureto get an idea of domestic demand, as well as how specific sectors are doing. Forexample, retailers noted that conditions have barely improved over the last quar-ter, moving from –14 to –13. Note, however, that more of them appear opti-mistic about conditions in the subsequent three months because the forecastindex rose to –5.
307Japan’s Tankan Survey
09Baumohl_Ch04.qxd 8/3/04 2:59 PM Page 307
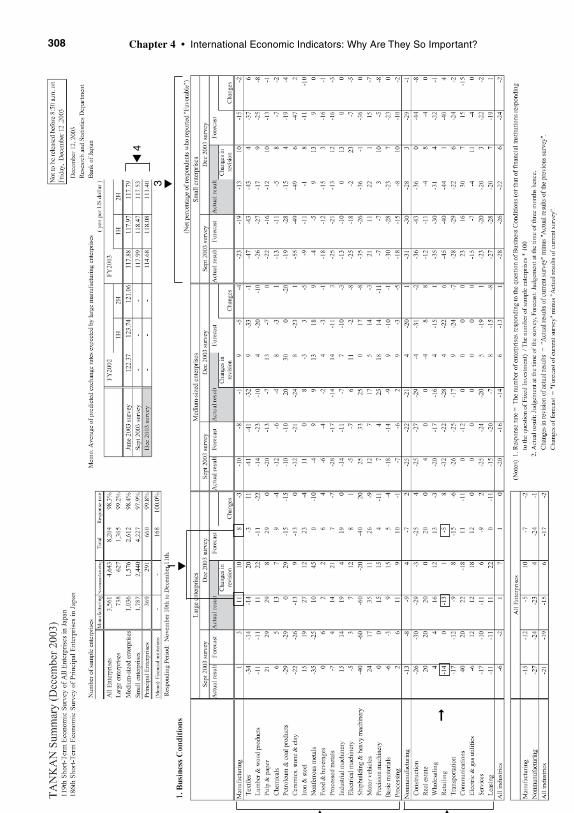
308 Chapter 4 • International Economic Indicators: Why Are They So Important?
▲4
3 ▼
▲
1
▲
2➞
1 ▼
09Baumohl_Ch04.qxd 8/3/04 2:59 PM Page 308
• Business Conditions at Small Enterprises
(3) Are all businesses benefiting from economic growth or just a few? How wide-spread is the recovery inside Japan? By comparing the sentiment levels of largeand small companies, one can tell whether businesses across the board are see-ing an improvement in sales and profits—or if these gains are limited to mainlylarge enterprises.
• Average Exchange Rates Predicted by Large Manufacturers
(4) Where the yen is valued in relation to other currencies can make all the differ-ence in how successful Japanese exporters are in selling products in foreignmarkets. This table represents the best guess by major Japanese manufacturerswhat value the yen will average in the first half and second half of the year, aswell as for the year as a whole. Indeed, there is a correlation between howcheap the yen is expected to be and the level of business confidence by largemanufacturers. The lower the yen’s value in foreign exchange markets, themore upbeat manufacturers become because it effectively drops the price ofJapanese-made goods abroad.
• Prices by Large Enterprises
(5) Companies that can raise prices generally achieve higher earnings and hiremore workers. However, there are times when attempts to increase prices aredifficult either because competition prevents them from doing so or becausethe economy is undergoing a deflationary spiral, a situation where prices areunder continuous pressure to fall. The latter has been a serious problem withJapan throughout the 1990s and beyond. This index represents the percentageof companies saying their prices had risen versus those who lowered prices.The numbers show that slightly more firms in the latest survey have raisedprices. The index for large manufacturers inched up from –23 in September to –21 in the December survey. But that might prove to be just a brief reprievebecause the expectations index fell back to –24.
• Fixed Investment
(6) Capital spending is another major contributor to economic growth and serves asa marker of confidence that companies have about future business activity. Herewe see large manufacturers planning to boost investment spending by 11.1% inJapan’s 2003 fiscal year, compared to what was spent the previous year.
309Japan’s Tankan Survey
09Baumohl_Ch04.qxd 8/3/04 2:59 PM Page 309
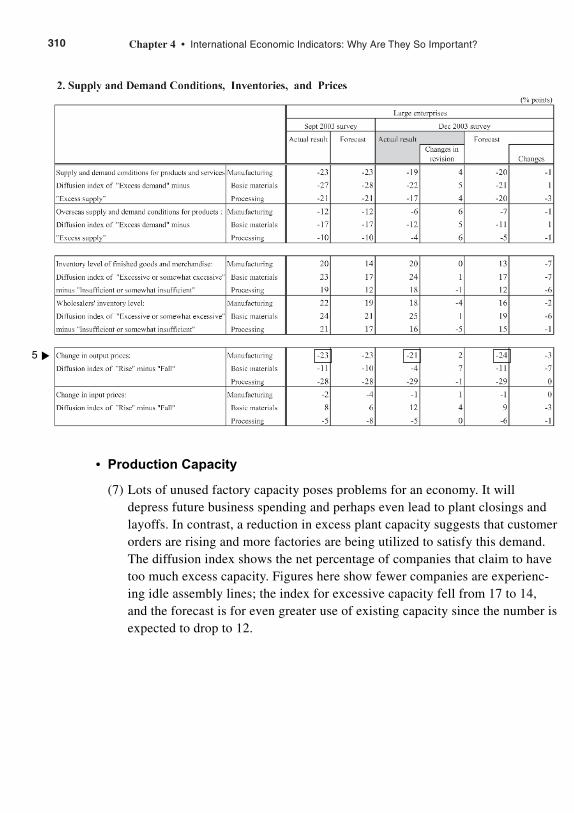
310 Chapter 4 • International Economic Indicators: Why Are They So Important?
• Production Capacity
(7) Lots of unused factory capacity poses problems for an economy. It willdepress future business spending and perhaps even lead to plant closings andlayoffs. In contrast, a reduction in excess plant capacity suggests that customerorders are rising and more factories are being utilized to satisfy this demand.The diffusion index shows the net percentage of companies that claim to havetoo much excess capacity. Figures here show fewer companies are experienc-ing idle assembly lines; the index for excessive capacity fell from 17 to 14,and the forecast is for even greater use of existing capacity since the number isexpected to drop to 12.
▲
5
09Baumohl_Ch04.qxd 8/3/04 2:59 PM Page 310
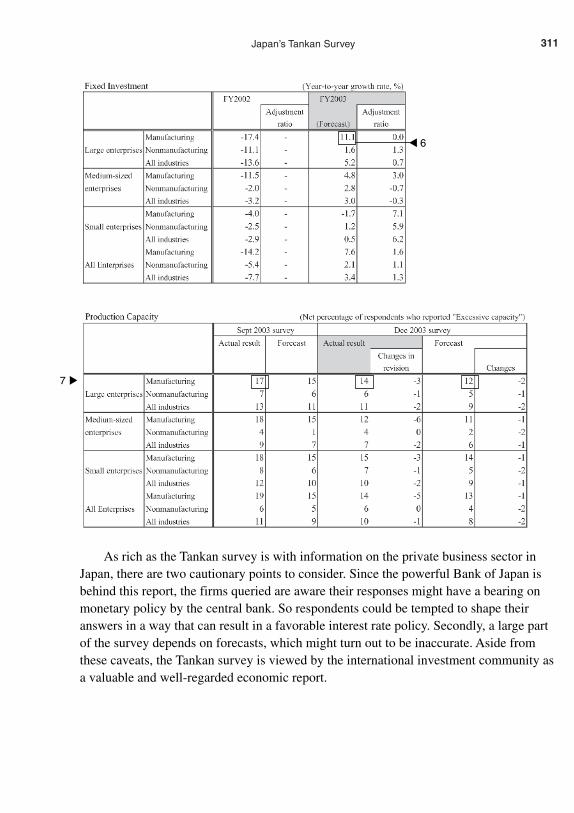
311Japan’s Tankan Survey
As rich as the Tankan survey is with information on the private business sector inJapan, there are two cautionary points to consider. Since the powerful Bank of Japan isbehind this report, the firms queried are aware their responses might have a bearing onmonetary policy by the central bank. So respondents could be tempted to shape theiranswers in a way that can result in a favorable interest rate policy. Secondly, a large partof the survey depends on forecasts, which might turn out to be inaccurate. Aside fromthese caveats, the Tankan survey is viewed by the international investment community asa valuable and well-regarded economic report.
▲
7
▲ 6
09Baumohl_Ch04.qxd 8/3/04 2:59 PM Page 311
JAPAN INDUSTRIAL PRODUCTION
Rank: 5th.
What Is It: Measures the change in monthly industrial output.
News Release on Internet: www.meti.go.jp/english/statistics
Home Web Address: www.meti.go.jp/english
Release Time: 8:50 A.M. (local time); a preliminary report is released in the finalweek of the next month. A revised report is published another two to threeweeks later. (For example, data on October is announced during the last weekin November, to be followed by another report on revisions in mid-December.)
Frequency: Monthly.
Source: Ministry of Economy, Trade and Industry (METI).
Revisions: Monthly and annual revisions are frequent and can be substantial.
After achieving one of the highest growth rates in the world from the 1960s through the1980s, Japan has struggled to regain its footing ever since. Indeed, economists describethe 1990s as that country’s lost decade. Yet, despite its internal difficulties, Japan’simportance in the global economy and influence on international capital marketsremains largely undiminished. Japan still holds title as the world’s second largest econ-omy and biggest exporter of investment capital. It owns more foreign exchangereserves than any other nation and sells $400 billion worth of goods and services everyyear to the rest of the world. Moreover, the yen continues to stand alongside the U.S.dollar and the euro as one of the three most important currencies. For all these reasons,global investors and business leaders, especially those in the U.S., closely monitor Japan’s economic health.
Also looming large for Americans is the fact that Japanese banks, insurance com-panies, and government agencies are among the largest holders of U.S. Treasury securi-ties. In doing so, Japan has helped fund the U.S. government budget for years, lendinghundreds of billions of dollars. However, this is also a cause for concern. If seriousfinancial and economic problems erupt in Japan, they can easily spill over into the U.S.Investors in Japan, for example, may decide to purchase less U.S. Treasury debt or
312 Chapter 4 • International Economic Indicators: Why Are They So Important?
09Baumohl_Ch04.qxd 8/3/04 2:59 PM Page 312
even sell some financial assets. They can also choose to manipulate the value of theyen to help export sales. Indeed, no other country intervenes in the currency markets asmuch as Japan.
Given the ability of Japan’s economy to affect asset values in world capital marketsand sway currency markets, foreign investors know they have to stay informed on thesoundness of the economy. That means paying particularly close attention to its industrialproduction, which many experts consider to be one of the best barometers of businessactivity in Japan. Analysts prefer to monitor industrial output over GDP because the for-mer comes out sooner, responds faster to changes in the business climate, and is rich withinformation on the country’s manufacturing and mining industries. In fact, Japan’s indus-trial production release is more comprehensive in its coverage of the economy than itsU.S counterpart. Case in point: Japan’s monthly production report even includes forecastsof how key manufacturers are expected to perform in the next two months.
In view of all the attention paid to Japanese manufacturers, it might be surprisingto learn that it makes up less than a quarter of the GDP. But this figure is very mislead-ing because the actual impact that manufacturers have on the economy is much greater.For example, exports represent a primary engine of growth for Japan. Strong foreigndemand for cars, digital cameras, HDTVs, and computer accessories feeds rightthrough to the domestic economy by stimulating capital investment spending, employ-ment, and overall output.
Japan started measuring industrial production in 1953, and it now includes virtu-ally all privately owned companies in mining and manufacturing, regardless of size. Itsmain task is to compute monthly changes in output for 536 items. Figures are alsogiven for the actual quantity of goods being produced, shipped, and kept in inventoryfor many commodities.
The initial release, called the “Preliminary Report on Indices of IndustrialProduction,” is published a month after the period being covered ends. A revised releaseis issued about three weeks later. One can access the industrial production report in twoways. There is a summary report on the Web (www.meti.go.jp/english/statistics/). Insidethat report is another link where you can download the full 78-page release as a PDF file.The tables shown in this section come from that detailed report. Data is presented in bothEnglish and Japanese and is well organized. Figures are seasonally adjusted with an indexbase of 100 that is tied to the year 2000. Keep in mind that revisions are frequent and canbe very large.
313Japan’s Industrial Production
09Baumohl_Ch04.qxd 8/3/04 2:59 PM Page 313
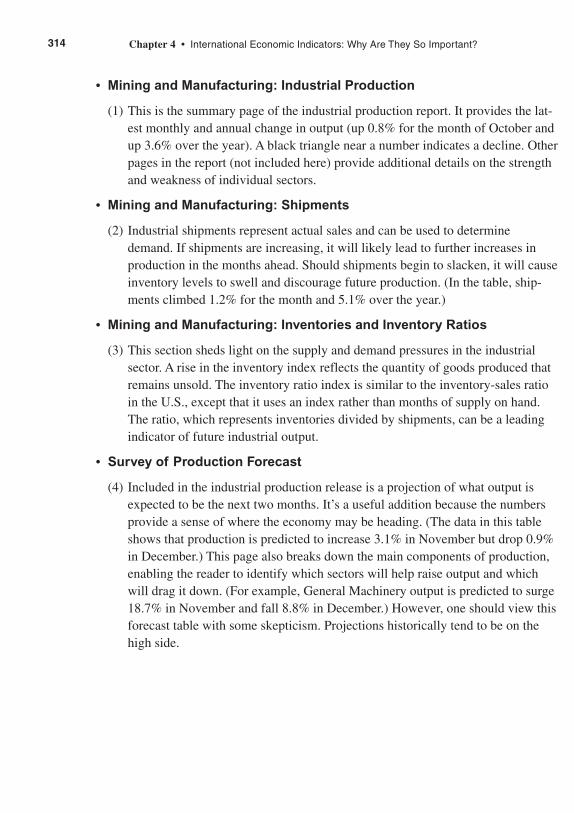
• Mining and Manufacturing: Industrial Production
(1) This is the summary page of the industrial production report. It provides the lat-est monthly and annual change in output (up 0.8% for the month of October andup 3.6% over the year). A black triangle near a number indicates a decline. Otherpages in the report (not included here) provide additional details on the strengthand weakness of individual sectors.
• Mining and Manufacturing: Shipments
(2) Industrial shipments represent actual sales and can be used to determinedemand. If shipments are increasing, it will likely lead to further increases inproduction in the months ahead. Should shipments begin to slacken, it will causeinventory levels to swell and discourage future production. (In the table, ship-ments climbed 1.2% for the month and 5.1% over the year.)
• Mining and Manufacturing: Inventories and Inventory Ratios
(3) This section sheds light on the supply and demand pressures in the industrialsector. A rise in the inventory index reflects the quantity of goods produced thatremains unsold. The inventory ratio index is similar to the inventory-sales ratioin the U.S., except that it uses an index rather than months of supply on hand.The ratio, which represents inventories divided by shipments, can be a leadingindicator of future industrial output.
• Survey of Production Forecast
(4) Included in the industrial production release is a projection of what output isexpected to be the next two months. It’s a useful addition because the numbersprovide a sense of where the economy may be heading. (The data in this tableshows that production is predicted to increase 3.1% in November but drop 0.9%in December.) This page also breaks down the main components of production,enabling the reader to identify which sectors will help raise output and whichwill drag it down. (For example, General Machinery output is predicted to surge18.7% in November and fall 8.8% in December.) However, one should view thisforecast table with some skepticism. Projections historically tend to be on thehigh side.
314 Chapter 4 • International Economic Indicators: Why Are They So Important?
09Baumohl_Ch04.qxd 8/3/04 2:59 PM Page 314
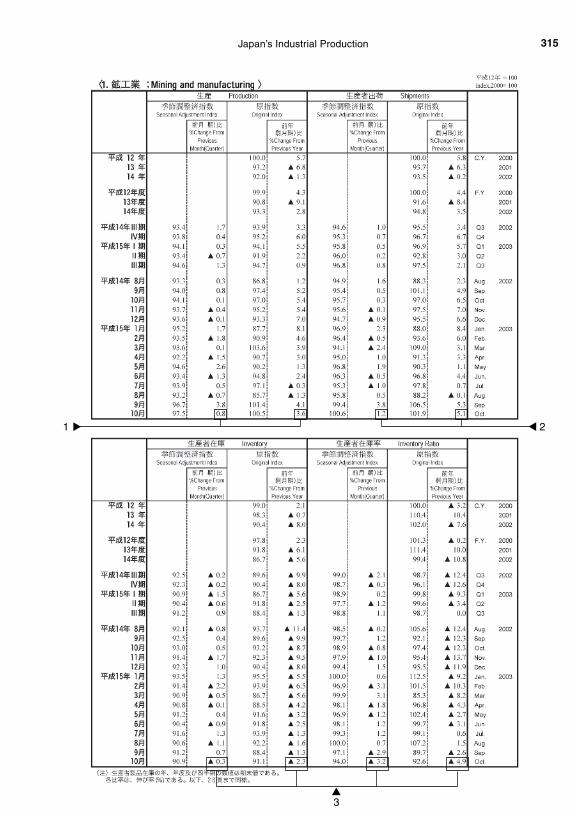
315Japan’s Industrial Production
▲
▲
▲3
21
09Baumohl_Ch04.qxd 8/3/04 2:59 PM Page 315
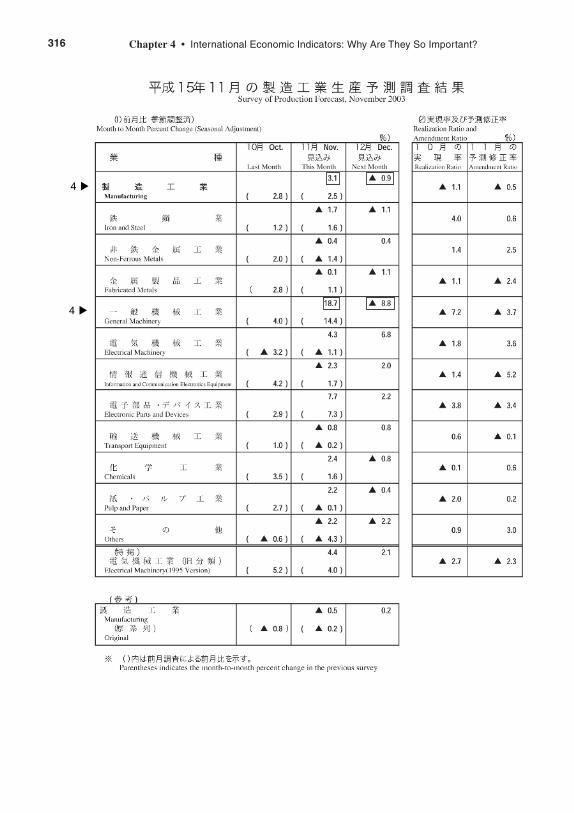
316 Chapter 4 • International Economic Indicators: Why Are They So Important?
▲
4
▲
4
09Baumohl_Ch04.qxd 8/3/04 2:59 PM Page 316

FRANCE MONTHLY BUSINESS SURVEY (INSEE)
Rank: 6th.
What Is It: A survey assessing the confidence of French industry leaders.
News Release on Internet: www.insee.fr/en/indicateur/indic_conj/liste_indice.asp
Home Web Address: www.insee.fr/en/home/home_page.asp
Release Time: 8:45 A.M. (Continental time); it is published at the end of themonth being surveyed.
Frequency: Monthly.
Source: INSEE (National Institute for Statistics and Economic Studies).
Revisions: Changes are made in the previous month’s data to reflect moreupdated information.
One of the first economic indicators to come out in Europe every month is the businessconfidence survey by France’s national statistics office. Early in the month, the agencypolls leaders of 4,000 French companies, covering manufacturing, mining, agriculturaland food processing, and oil refineries. They are asked to assess how well business hasbeen in the recent past, what conditions are like now, and how they would evaluate theoutlook for the next few months. The results are published the same month the survey istaken, giving analysts a very timely glimpse of industrial activity inside the secondlargest economy in the Eurozone and the fourth biggest in the world.
U.S. investors and top business executives also have an interest in this survey. Franceis usually one of the top three investors in the U.S. stock market and a major foreign directinvestor as well. At least 2,500 French subsidiaries operate inside the U.S. (mainly manu-facturing, but also in services). American investment in France has also grown sharply inthe last 10 years. The U.S. now ranks third among investors in that country, coming inbehind the Netherlands and the United Kingdom. Clearly the commercial and financial tiesbetween France and the United States remain firm despite their frequent, and at timesvociferous, disagreements over economic and foreign policy issues.
The Monthly Business Survey offers a chance to get a quick read on the economicoutlook in France and, by implication, Europe as well. The survey does this by posingeight key questions to the country’s industry leaders:
• A: Output
(A-1) How would you characterize the change in your firm’s production in the pastthree months? (Up? Stable? Down?)
(A-2 ) How would you characterize your firm’s production prospects over the nextthree months? (Up? Stable? Down?)
317France Monthly Business Survey
09Baumohl_Ch04.qxd 8/3/04 2:59 PM Page 317

• B: Demand
(B-1) Considering the season, how would you describe your current demand, or orderbookings? (Strong? Normal? Weak?)
(B-2) Considering the season, how would you describe your export orders (i.e.,demand for French goods from other countries)? (Strong? Normal? Weak?)
• C: Inventory of Finished Goods
(C-1) Considering the season, how would you describe your present state of finished-goods inventory levels? (Above normal? Normal? Below normal?)
• D: Change in Producer Prices
(D-1) What’s the likely direction of your (selling) prices in the next three months?(Up? Stable? Down?)
• E: Outlook for French Industry as a Whole
(E-1) What is production output in the country likely to be in the next three months?(Up? Stable? Down?)
(E-2) What is the direction of producer prices likely to be in the country over the nextthree months? (Up? Stable? Down?)
A calculation is made to get the difference between the percentage of those who werepositive in their assessment (“Up” or “Above normal” or “Strong”) and the percentage ofthose who were negative (“Down” or “Below normal” or “Weak”). The net result foreach question is published in the survey. In addition, the government also computes acomposite index, which is a summary of the survey results. Though the press often zeroesin on this composite index, the financial markets prefer to focus more on answers toqueries dealing with future expectations.
The Monthly Business Survey is available to all on the Web and comes in two ver-sions. You can download the complete and detailed French-only release or view the sum-mary table in English, which still contains all the essential numbers.
Let’s look at the actual survey results as they appear in English on the Web:
(1) Recent changes in output: This is in response to question A-1 and refers to the com-pany’s own production levels. In this case, the December table shows that therewere an equal number of negative and positive responses. This is a wash at zero,but a distinct improvement over the prior months.
318 Chapter 4 • International Economic Indicators: Why Are They So Important?
09Baumohl_Ch04.qxd 8/3/04 2:59 PM Page 318
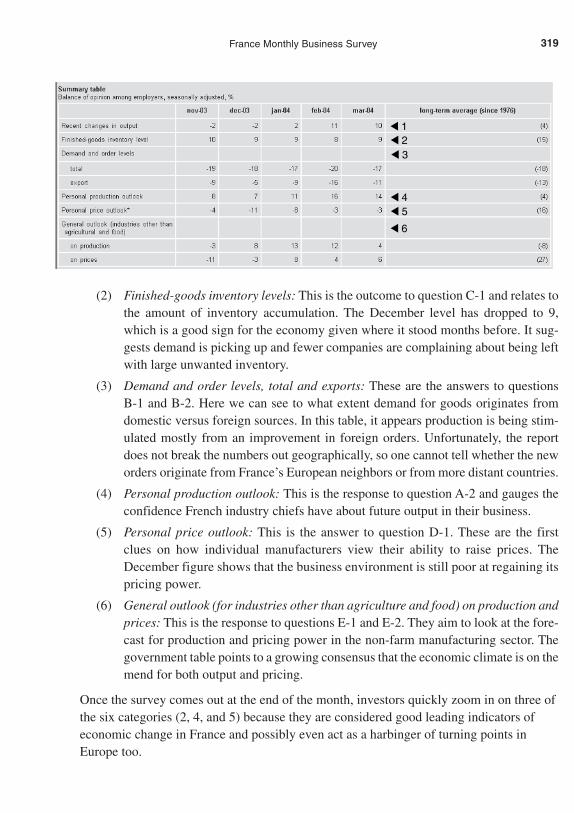
(2) Finished-goods inventory levels: This is the outcome to question C-1 and relates tothe amount of inventory accumulation. The December level has dropped to 9,which is a good sign for the economy given where it stood months before. It sug-gests demand is picking up and fewer companies are complaining about being leftwith large unwanted inventory.
(3) Demand and order levels, total and exports: These are the answers to questions B-1 and B-2. Here we can see to what extent demand for goods originates fromdomestic versus foreign sources. In this table, it appears production is being stim-ulated mostly from an improvement in foreign orders. Unfortunately, the reportdoes not break the numbers out geographically, so one cannot tell whether the neworders originate from France’s European neighbors or from more distant countries.
(4) Personal production outlook: This is the response to question A-2 and gauges theconfidence French industry chiefs have about future output in their business.
(5) Personal price outlook: This is the answer to question D-1. These are the firstclues on how individual manufacturers view their ability to raise prices. TheDecember figure shows that the business environment is still poor at regaining itspricing power.
(6) General outlook (for industries other than agriculture and food) on production andprices: This is the response to questions E-1 and E-2. They aim to look at the fore-cast for production and pricing power in the non-farm manufacturing sector. Thegovernment table points to a growing consensus that the economic climate is on themend for both output and pricing.
Once the survey comes out at the end of the month, investors quickly zoom in on three ofthe six categories (2, 4, and 5) because they are considered good leading indicators ofeconomic change in France and possibly even act as a harbinger of turning points inEurope too.
319France Monthly Business Survey
▲ 1
▲ 5
▲ 4
▲ 6
▲ 2
▲ 3
09Baumohl_Ch04.qxd 8/3/04 2:59 PM Page 319
EUROZONE—MANUFACTURING PURCHASING
MANAGERS INDEX (PMI)
GLOBAL—MANUFACTURING PURCHASING
MANAGERS INDEX
Rank: 7th.
What Is It: One measures changes in manufacturing activity in the Eurozoneregion; the other looks at shifts in manufacturing globally.
Home Web Address: www.ntc-research.com www.ism.ws/ISMReport/index.cfm
Release Time:
Eurozone Manufacturing PMI: 9 A.M. (London time); released the first business day of the month.
Global Manufacturing PMI: 11 A.M. (New York time); released the first business day of the month.
Frequency: Monthly.
Source:
Eurozone PMI: Reuters/NTC Research
Global PMI: JP Morgan /NTC Research.
Revisions: They tend to be rare and minor in both surveys.
The great popularity of the U.S. purchasing manager surveys has recently spawned abunch of similar measures in other countries. The U.S. Purchasing Managers Index (PMI)for manufacturing, produced by the Institute for Supply Management, is one of thehottest economic indicators out every month. It has demonstrated a solid track record ofanticipating turning points in the business cycle and for being way ahead of the curve indetecting a buildup of inflation pressures. Indeed, it is so highly regarded by investors,economists, and policymakers that more than two dozen nations have developed theirown PMI series in recent years, all basically modeled after the U.S. Germany establishedits purchasing managers survey in 1996. Italy followed in 1997. France and Japan com-posed theirs in 1998 and 2002, respectively.
Now, three organizations have taken those international PMI polls a step further.Reuters, JP Morgan, and NTC Research, a London-based purveyor of global economicdata, have come up with another series that combines several national surveys to producebroader regional PMI reports. The result is two new releases: The Eurozone ManufacturingPMI, which is a composite of eight of the 12 European countries that make up the euro cur-rency group, and the Global Manufacturing PMI. The latter consolidates the outcomes ofpurchasing manager surveys from 22 countries around the world. Both the Eurozone and
320 Chapter 4 • International Economic Indicators: Why Are They So Important?
09Baumohl_Ch04.qxd 8/3/04 2:59 PM Page 320
the Global PMI are now closely monitored by money managers because these reports canhave a direct bearing on fiscal and monetary policy. They are considered very good predic-tors of foreign economic trends.
The surprisingly quick public acceptance of these new regional PMI measures comesat a time when there is growing frustration with government economic indicators. Suchstatistics are often released after a long lag time. Some, like the GDP, are published 60 to70 days after the quarter ends. Another complaint about official data is that countries usedifferent methods to come up with same indicators. This complicates efforts to makecomparisons between economies. In addition, figures can be of such poor quality thatthey are frequently followed by substantial revisions.
In contrast, the Eurozone and Global PMI series employ the same methodology withall the countries, so comparisons are much easier to make. What’s more, revisions to thedata are also extremely rare. This is not to say that these international surveys are withoutshortcomings. One problem with both is that they make no effort to quantify the degreeof change. For instance, if a large number of purchasing managers say they witnessed justa modest improvement in activity in the latest month, that alone is enough to propel theindex sharply higher. A second criticism centers on the validity of the Global PMIbecause this series leaves out some of the world’s most important economies, such asSouth Korea and China. Thus, describing the 22-country PMI as a global indicator ofmanufacturing might be a bit of a stretch.
Eurozone PMI
Established in 1997, the Eurozone Manufacturing PMI is the first composite indicator outevery month on conditions inside eight countries: Germany, France, Spain, Italy, Ireland,Greece, Austria, and the Netherlands. They represent 92% of all manufacturing activity inthe euro currency area. (Countries in the Eurozone not represented in this PMI series areFinland, Luxembourg, Portugal, and Belgium.) The report is based on responses from3,000 purchasing executives. Reuters and NTC Research collect the data from the indi-vidual national surveys and then recompute a regional index for each of the major ques-tions asked. Finally, an overall headline index is calculated to reflect total manufacturingactivity in the region.
At the heart of the surveys are questions to purchasing managers that cover six key topics:
1. Is the level of new orders received by your company higher, the same, or lower thanone month ago? This addresses the issue of demand in the economy. If demand for goods increases,it will drive up manufacturing output.
2. Is the level of output in your company higher, the same, or lower than onemonth ago?The focus here is on whether there’s been a shift in production to higher levelsbecause of new orders.
321Manufacturing Purchasing Managers Index
09Baumohl_Ch04.qxd 8/3/04 2:59 PM Page 321
3. Is the stock of items purchased by your company higher, the same, or lower thanone month ago? For manufacturers to keep their production lines running smoothly, they need tohave an ample supply of raw material on hand. But as output accelerates, suppliestypically diminish and purchasing managers need to reorder more stock. Thus, thepurchase of new items is linked to the pace of production.
4. Are supplier delivery times experienced by your company longer, the same, orshorter than one month ago?Just because a purchasing manager places an order to replenish its stock of rawmaterials doesn’t necessarily mean it will arrive overnight. Suppliers generally canship raw materials to manufacturers faster in a slow economy. In a booming econ-omy, however, when lots of orders for raw materials are coming in at the same time,suppliers can’t instantly satisfy all the demand. Bottlenecks emerge and even sup-pliers have their own production constraints. As a result, shipments to manufactur-ers slow and this leads to delays in deliveries. Thus, longer lead times betweenorders and deliveries of raw materials are a sign of faster economic growth, whilerapid deliveries suggest slower business activity.
5. Is the average input prices experienced by your company higher, the same, or lowerthan one month ago?It should come as no surprise that when many manufacturers increase orders simul-taneously, demand for raw materials can outstrip supplies and this places upwardpressure on factory input prices.
6. Is the level of employment at your company higher, the same, or lower than onemonth ago?There is a link between employment in manufacturing and production. Greaterdemand for new orders often leads to more employment. However, over time, therelationship between jobs and output turns more tenuous. Given the high cost oflabor, manufacturers may try investing more in improving productivity than inexpanding their workforce to raise output. Thus, production could increase at afaster pace than job growth in the long run.
Based on these questions, an answer of “higher” (or longer for delivery times) isgiven one point; the “same” is allocated half a point, and “lower” (or shorter) gets nopoints. Reuters and NTC Research compile the numbers from individual Europeancountries and come up with regional composite indexes that are part of the EurozoneManufacturing PMI. The methodology is standardized for all the countries, and theresults are presented in the form of a diffusion index, where a reading of less than 50indicates a contraction of activity, above 50 points to an expansion, and an index ofexactly 50 says that no change has occurred.
On top of that, a summary index is calculated. That index is made up of a weightedaverage of five (of the six) key topics and is based on the following formula: the new orders
322 Chapter 4 • International Economic Indicators: Why Are They So Important?
09Baumohl_Ch04.qxd 8/3/04 2:59 PM Page 322
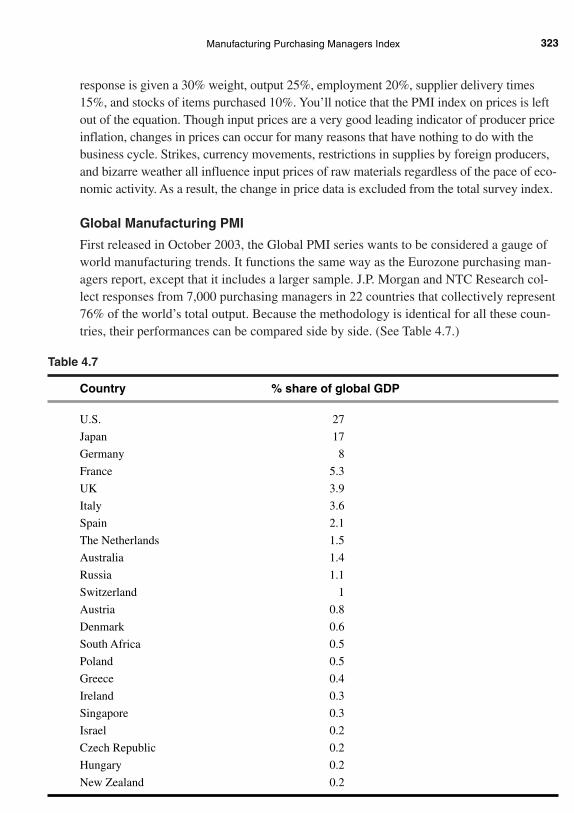
response is given a 30% weight, output 25%, employment 20%, supplier delivery times15%, and stocks of items purchased 10%. You’ll notice that the PMI index on prices is leftout of the equation. Though input prices are a very good leading indicator of producer priceinflation, changes in prices can occur for many reasons that have nothing to do with thebusiness cycle. Strikes, currency movements, restrictions in supplies by foreign producers,and bizarre weather all influence input prices of raw materials regardless of the pace of eco-nomic activity. As a result, the change in price data is excluded from the total survey index.
Global Manufacturing PMI
First released in October 2003, the Global PMI series wants to be considered a gauge ofworld manufacturing trends. It functions the same way as the Eurozone purchasing man-agers report, except that it includes a larger sample. J.P. Morgan and NTC Research col-lect responses from 7,000 purchasing managers in 22 countries that collectively represent76% of the world’s total output. Because the methodology is identical for all these coun-tries, their performances can be compared side by side. (See Table 4.7.)
Table 4.7
Country % share of global GDP
U.S. 27
Japan 17
Germany 8
France 5.3
UK 3.9
Italy 3.6
Spain 2.1
The Netherlands 1.5
Australia 1.4
Russia 1.1
Switzerland 1
Austria 0.8
Denmark 0.6
South Africa 0.5
Poland 0.5
Greece 0.4
Ireland 0.3
Singapore 0.3
Israel 0.2
Czech Republic 0.2
Hungary 0.2
New Zealand 0.2
323Manufacturing Purchasing Managers Index
09Baumohl_Ch04.qxd 8/3/04 2:59 PM Page 323
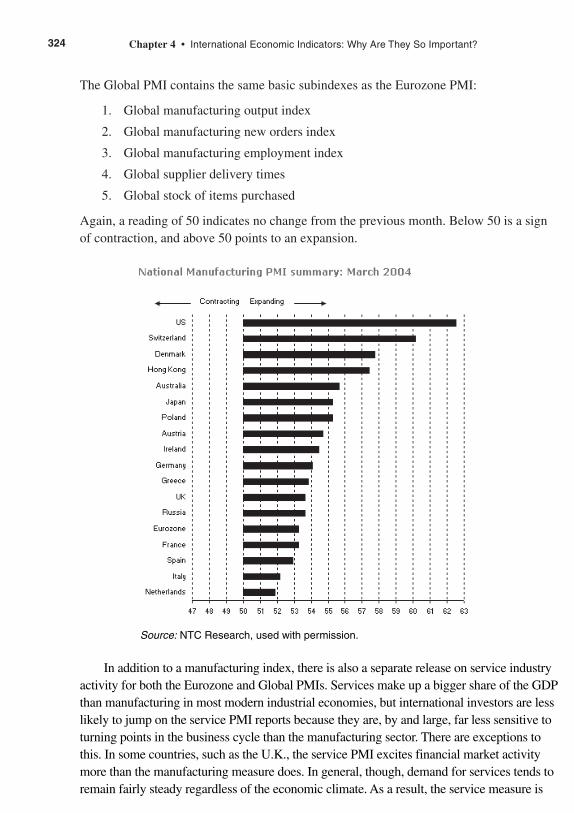
The Global PMI contains the same basic subindexes as the Eurozone PMI:
1. Global manufacturing output index
2. Global manufacturing new orders index
3. Global manufacturing employment index
4. Global supplier delivery times
5. Global stock of items purchased
Again, a reading of 50 indicates no change from the previous month. Below 50 is a signof contraction, and above 50 points to an expansion.
324 Chapter 4 • International Economic Indicators: Why Are They So Important?
In addition to a manufacturing index, there is also a separate release on service industryactivity for both the Eurozone and Global PMIs. Services make up a bigger share of the GDPthan manufacturing in most modern industrial economies, but international investors are lesslikely to jump on the service PMI reports because they are, by and large, far less sensitive toturning points in the business cycle than the manufacturing sector. There are exceptions tothis. In some countries, such as the U.K., the service PMI excites financial market activitymore than the manufacturing measure does. In general, though, demand for services tends toremain fairly steady regardless of the economic climate. As a result, the service measure is
Source: NTC Research, used with permission.
09Baumohl_Ch04.qxd 8/3/04 2:59 PM Page 324
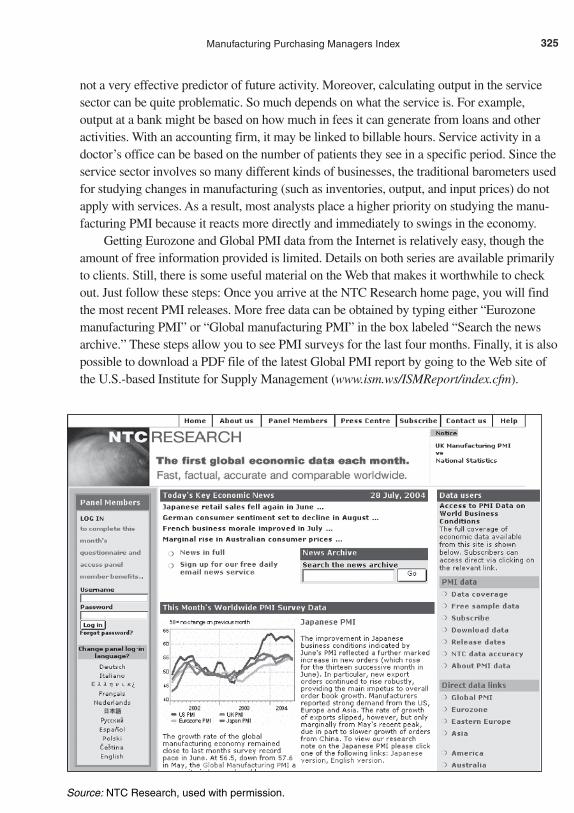
not a very effective predictor of future activity. Moreover, calculating output in the servicesector can be quite problematic. So much depends on what the service is. For example, output at a bank might be based on how much in fees it can generate from loans and otheractivities. With an accounting firm, it may be linked to billable hours. Service activity in adoctor’s office can be based on the number of patients they see in a specific period. Since theservice sector involves so many different kinds of businesses, the traditional barometers usedfor studying changes in manufacturing (such as inventories, output, and input prices) do notapply with services. As a result, most analysts place a higher priority on studying the manu-facturing PMI because it reacts more directly and immediately to swings in the economy.
Getting Eurozone and Global PMI data from the Internet is relatively easy, though theamount of free information provided is limited. Details on both series are available primarilyto clients. Still, there is some useful material on the Web that makes it worthwhile to checkout. Just follow these steps: Once you arrive at the NTC Research home page, you will findthe most recent PMI releases. More free data can be obtained by typing either “Eurozonemanufacturing PMI” or “Global manufacturing PMI” in the box labeled “Search the newsarchive.” These steps allow you to see PMI surveys for the last four months. Finally, it is alsopossible to download a PDF file of the latest Global PMI report by going to the Web site ofthe U.S.-based Institute for Supply Management (www.ism.ws/ISMReport/index.cfm).
325Manufacturing Purchasing Managers Index
Source: NTC Research, used with permission.
09Baumohl_Ch04.qxd 8/3/04 2:59 PM Page 325
OECD COMPOSITE LEADING INDICATORS (CLI)
Rank: 8th.
What Is It: A tool to forecast business activity in the world’s largest economies.
News Release on Internet: www.oecd.org/std/cli
Home Web Address: www.oecd.org
Release Time: Noon (Continental time); data is released on the Friday of the firstfull week of the month and refers to activity two months earlier. (Forexample, January’s release reports leading indicators for November.)
Frequency: Monthly.
Source: Organization for Economic Cooperation and Development (OECD).
Revisions: The previous month’s data is frequently revised with each newrelease.
Investors and policymakers love to follow leading economic indicators because of theirlook-ahead qualities. They are supposed to predict short-term movements in an economyby using measures that are highly sensitive to upcoming changes in business conditions.The U.S. has its own set of domestic leading economic indicators by the ConferenceBoard, a business research group in New York (see the Index of Leading EconomicIndicators). On a global scale, however, the best-known and most closely studied equiva-lent is the OECD’s own Composite Leading Indicators (CLI). This Paris-based interna-tional organization computes a leading economic indicator index for 23 member countries(there are 30 member countries in the OECD), as well as for seven different geographiczones. The zones are Total OECD area, G-7, NAFTA, OECD-Europe, European Union,Eurozone currency area, and the Big Four European economies. (See Table 4.8.) Whilesome countries produce their own in-house leading indicators, it’s the OECD’s ownindexes that make the big headlines and draw the greatest interest among money man-agers and policymakers.
Using economic data from its member countries, the OECD calculates CLI indexesdesigned to forecast what’s ahead for industrial production in the OECD nations andregions. Why industrial production and not the more broad-based GDP? First, industrialoutput is seen as an effective proxy for GDP because, historically, turning points in indus-trial production have coincided with the overall economy. Second, using industrial pro-duction as a reference point is more practical because that data comes out every month,while the GDP is available only quarterly.
326 Chapter 4 • International Economic Indicators: Why Are They So Important?
09Baumohl_Ch04.qxd 8/3/04 2:59 PM Page 326
Table 4.8 OECD Composite Leading Indicators
The OECD has composite leading indicators for 23 member countries and the follow-ing 7 regions:
1. Big Four European Countries:France, Germany, Italy, and the United Kingdom
2. Eurozone:Austria, Belgium, Finland, France, Germany, Greece, Ireland, Italy, Luxembourg, theNetherlands, Portugal, and Spain.
3. G7 (Major 7 Economies):Canada, France, Germany, Italy, Japan, the United Kingdom, and the United States.
4. EU-15*:All Eurozone countries plus Denmark, Sweden, and the United Kingdom.
5. OECD-Europe:All European Member countries of OECD, i.e. countries in EU-15* plus Norway,Switzerland, and Turkey.
6.Total OECD Countries:Includes countries in OECD-Europe plus Canada, Mexico, the United States,Australia, and Japan.
7. NAFTA:Canada, Mexico, and the United States
* In May 2004, the EU-15 expanded to EU-25 as 10 new members joined theEuropean Union. They are the Czech Republic, Estonia, Cyprus, Latvia, Lithuania,Hungary, Malta, Poland, Slovenia, and Slovakia. However, the OECD’s CLI surveywill undergo no change in methodology. It will continue to reflect the views of theoriginal 23 member countries.
Now for the obvious question: Does the OECD’s CLI really work? Is it reliable inpicking up signals of a pending slowdown or rebound in economic growth? Here weget one of those “yes, but” answers. To begin with, anticipating turning points is noteasy. Signs are often elusive or ambiguous. Second, much depends on the quality ofthe underlying data from national governments, not to mention the judgment callsinvolved in setting up the leading indicator models and the assumptions behind them.By and large, the OECD’s leading indicator series does get a thumbs up from econo-mists and large investors. Even central bankers review the CLI data when setting
327OECD Composite Leading Indicators
09Baumohl_Ch04.qxd 8/3/04 2:59 PM Page 327
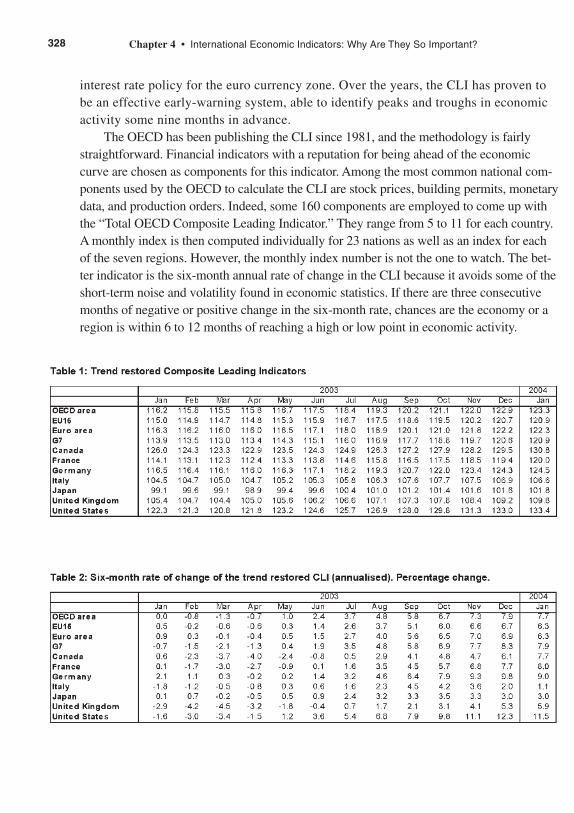
interest rate policy for the euro currency zone. Over the years, the CLI has proven tobe an effective early-warning system, able to identify peaks and troughs in economicactivity some nine months in advance.
The OECD has been publishing the CLI since 1981, and the methodology is fairlystraightforward. Financial indicators with a reputation for being ahead of the economiccurve are chosen as components for this indicator. Among the most common national com-ponents used by the OECD to calculate the CLI are stock prices, building permits, monetarydata, and production orders. Indeed, some 160 components are employed to come up withthe “Total OECD Composite Leading Indicator.” They range from 5 to 11 for each country.A monthly index is then computed individually for 23 nations as well as an index for eachof the seven regions. However, the monthly index number is not the one to watch. The bet-ter indicator is the six-month annual rate of change in the CLI because it avoids some of theshort-term noise and volatility found in economic statistics. If there are three consecutivemonths of negative or positive change in the six-month rate, chances are the economy or aregion is within 6 to 12 months of reaching a high or low point in economic activity.
328 Chapter 4 • International Economic Indicators: Why Are They So Important?
09Baumohl_Ch04.qxd 8/3/04 3:00 PM Page 328
CHINA INDUSTRIAL PRODUCTION
Rank: 9th.
What Is It: Measures the monthly change in China’s industrial output.
News Release on Internet: www.stats.gov.cn/english/statisticaldata/monthlydata
Home Web Address: www.stats.gov.cn/english
Release Time: Between 3:30 and 4:30 P.M. (local time); usually released fourweeks after the end of the month being covered.
Frequency: Monthly.
Source: National Bureau of Statistics of China (NBS).
Revisions: Corrections to data may occur more frequently in the future as Chinaendeavors to improve the accuracy of its statistics.
China comes as close to the Promised Land as you can get for investors and businessexecutives. It is a nation with awesome growth rates and mind-boggling potential as aneconomy. Depending on the measure you use, China is either the sixth-largest economyin the world, as it is most commonly described, or the second-largest based on purchasingpower parity, which some economists prefer to use. (With purchasing power parity, GDPvalues of two or more countries are readjusted so that prices for identical products areeffectively the same for consumers in these countries.) Whichever measure you choose,the overall point is that China is buzzing with activity. No country in the world producesmore steel, cement, mobile phones, or color TVs. Auto production will soon exceed thatof Germany’s, making China the third-largest automaker, behind only the U.S. and Japan.Indeed, one can argue that China’s manufacturing capabilities can now be promoted tothe status of an industrial country.
As a consumer market, the opportunities are limited only by imagination. Here is anation of 1.3 billion people and growing, including a labor force of 750 million, all eagerto work and spend money. Consumer demand has been climbing steadily the last twodecades as households are driven to improve their standard of living. That can be seen notonly by their larger and better-furnished residences, but also in the use of high-tech con-sumer products. Despite government controls on Internet access, 80 million Chinese citi-zens surf the Web (as of early 2004), an exponential rise from just 620,000 users six yearsearlier. In fact, China’s Internet population has catapulted into second place in the world,exceeding even Japan and closing in fast on the U.S. Moreover, the potential market forthe Internet alone is staggering because current users still represent less than 7% ofChina’s total population.
329China Industrial Production
09Baumohl_Ch04.qxd 8/3/04 3:00 PM Page 329
The broader question is what intentions do China’s top political leaders have for thecountry? Government officials talk about moving toward a “socialist market economy,” astrange brew where socialist ideals can be met in conjunction with a more liberal, open,and capitalistic economy. Precisely what this means or how both can be achieved is any-one’s guess. In any event, China’s economic strategy can be more easily understood fromthe actions taken so far by its policymakers, and here there is reason for some encourage-ment. China is unmistakably evolving into a more market-oriented economy. Concretesteps are being taken to shift economic decision-making away from a centralized, command-style system. What’s more, China’s ascension to the World Trade Organizationin 2003 will bring its economic policies more in line with world standards. The countrywill even be hosting the 2008 Summer Olympics, which promises to keep its economicengine going at full throttle for some time.
The results so far have been nothing short of striking. For more than two decades,China’s economic growth has consistently been among the fastest in the world, fueledmainly by explosive surges in industrial production, consumer demand, exports, and capi-tal investments. Nothing seems to get in its way. This rapid expansion has continued irre-spective of what else is going on in the rest of the world economy. Is it any wonder thatinternational investors and multinational business leaders are so eager to get a piece ofthis action? Foreign firms are pouring money into China, salivating at the chance to setup factories in a country where labor costs are only 2% that of the developed world.International money managers see more opportunities to add Chinese securities to theirportfolio. Large foreign investment bankers see in China a rich source of new clients asan increasing number of companies there are being permitted to access global capitalmarkets to raise funds. Credit ratings firms, such as Standard & Poor’s, Fitch, andMoody’s, are also charging into China to assess the creditworthiness of its companies andgovernment agencies. China itself has become a major player in the international commu-nity. With a war chest of more than $400 billion in foreign exchange reserves, secondlargest in the world thanks to its cumulative trade surpluses, China is in a position to buyhuge chunks of foreign government bonds, stocks, and real estate.
And yet, even with all the attributes that make it a rising economic superpower, thecountry has at least one noticeable flaw: China has a reputation for putting out dubiousstatistics about its economy. This poses a genuine problem for foreign firms and investorswho need to appraise the country’s current and future well-being. Long-time observershave complained that China’s economic numbers are less accurate than those of otherindustrialized countries, even going so far as to say that key officials “cook the books” toimpress foreign investors and lenders. In recent years analysts have charged that China
330 Chapter 4 • International Economic Indicators: Why Are They So Important?
09Baumohl_Ch04.qxd 8/3/04 3:00 PM Page 330
331China Industrial Production
was overestimating its GDP growth to lure foreign capital. At other times, there wereaccusations that Chinese statisticians were intentionally underestimating growth to createthe impression that the economy was not overheating. Amazingly, even top Chinese lead-ers acknowledged there was a problem with the integrity of the data. As recently as 2000,former premier Zhu Ronji said that Chinese economic reports suffered from “falsificationand that exaggeration was rampant.” One Chinese government study in 2002 concludedthat 60,000 errors were committed in the collection of data over a five-month period.
Behind these statistical problems lies an antiquated data collection system, one thatcan be traced back to the old command economy days. During the 1950s and 1960s,Communist party headquarters relied extensively on production reports from local man-agers, who would often lie about output figures to curry favor with party leaders. Small-town Communist officials were often promoted based on the economic performance intheir region, so it was in their best interest to embellish the figures. Thus, to some extent,the problem was not so much at the headquarters level in Beijing, but with the fieldreports from local and municipal managers. Today, China’s National Bureau of Statistics(NBS) still gathers output figures much the same way as before, though the degree of fab-rication is believed to be less widespread. Nevertheless, China still has no independentmethod in place to check the veracity of local production reports. This doesn’t meanBeijing officials are sitting idle. They are well aware that without a trustworthy source ofeconomic information, it will be hard for foreigners to make investment decisions or forChinese leaders to carry out the right fiscal and monetary policies. NBS has been work-ing in earnest to upgrade the quality of its economic reports and seek better ways to com-pile and estimate economic data. In late 2003, it announced plans to improve the accuracyof its industrial production figures and to release and revise quarterly and annual GDPstatistics so that they conform more with international standards.
One of the ways China has moved to bring its economic reports up to global stan-dards was to make the data more accessible to anyone in the world. China’s NBS has aWeb site with detailed information on economic output, inflation, and other measures ofperformance, and much of it is in English. Topping the list of perhaps the best overallmeasure of economic performance in China is its industrial production numbers.Industrial production and construction make up more than half of China’s GDP. Everymonth, the NBS reports the latest industrial output statistics, and much of it is on the Web(www.stats.gov.cn/english/statisticaldata/monthlydata), though it might take a fewmoments to learn how to navigate this site to arrive at the correct page.
The latest report on industrial production can be seen in both summary form (see thefollowing chart) and in greater detail by specific commodity.
09Baumohl_Ch04.qxd 8/3/04 3:00 PM Page 331
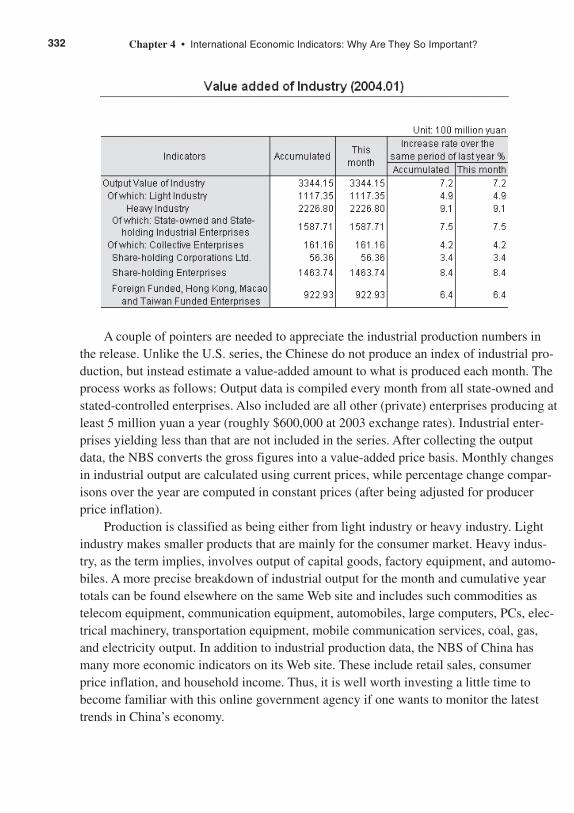
A couple of pointers are needed to appreciate the industrial production numbers inthe release. Unlike the U.S. series, the Chinese do not produce an index of industrial pro-duction, but instead estimate a value-added amount to what is produced each month. Theprocess works as follows: Output data is compiled every month from all state-owned andstated-controlled enterprises. Also included are all other (private) enterprises producing atleast 5 million yuan a year (roughly $600,000 at 2003 exchange rates). Industrial enter-prises yielding less than that are not included in the series. After collecting the outputdata, the NBS converts the gross figures into a value-added price basis. Monthly changesin industrial output are calculated using current prices, while percentage change compar-isons over the year are computed in constant prices (after being adjusted for producerprice inflation).
Production is classified as being either from light industry or heavy industry. Lightindustry makes smaller products that are mainly for the consumer market. Heavy indus-try, as the term implies, involves output of capital goods, factory equipment, and automo-biles. A more precise breakdown of industrial output for the month and cumulative yeartotals can be found elsewhere on the same Web site and includes such commodities astelecom equipment, communication equipment, automobiles, large computers, PCs, elec-trical machinery, transportation equipment, mobile communication services, coal, gas,and electricity output. In addition to industrial production data, the NBS of China hasmany more economic indicators on its Web site. These include retail sales, consumerprice inflation, and household income. Thus, it is well worth investing a little time tobecome familiar with this online government agency if one wants to monitor the latesttrends in China’s economy.
332 Chapter 4 • International Economic Indicators: Why Are They So Important?
09Baumohl_Ch04.qxd 8/3/04 3:00 PM Page 332

333China Industrial Production
09Baumohl_Ch04.qxd 8/3/04 3:00 PM Page 333
BRAZIL INDUSTRIAL PRODUCTION
Rank: 10th.
What Is It: Tracks changes in Brazil’s industrial output.
News Release on Internet: www.ibge.gov.br/english/www.bcb.gov.br/pec/Indeco/Ingl/indecoi.htm
Release Time: 9:30 A.M. (local time); the report is released about 40 days afterthe survey month ends. (Thus, January’s release refers to industrialperformance in November.)
Frequency: Monthly.
Source: Brazilian Institute for Geography and Statistics.
Revisions: Monthly figures are subject to revisions.
The temptation for foreigners to invest in an emerging economy can be high given thelucrative returns that are possible from a country with lots of growth potential. Oneprincipal beneficiary of such foreign investments has been China, the biggest emergingcountry of all. However, many investment managers look upon Brazil as possessingattributes that might match, if not exceed, those of China. China may have matchlesshuman assets with 1.3 billion people, but it also is rapidly running out of accessiblenatural resources. In contrast, Brazil is endowed with lots of physical resources; standsclose to enjoying energy self-sufficiency; occupies huge territory; is rich in minerals;has ample arable land, a benign climate, and thousands of miles of magnificentbeaches; and is surrounded by other democratically elected developing nations. Withsuch characteristics, Brazil has all the prerequisites to become a prosperous leaderamong the emerging market economies.
The country is already a major player in the global arena. Brazil easily outweighsits neighbors in economic size and alone accounts for 42% of Latin America’s totalGDP. Over the years, the size of Brazil’s economy in the world has shifted betweeneighth and thirteenth place. These fluctuations exist not because of recessions in Brazil,but because of movement in the exchange rates between its currency (the real) and theU.S. dollar.
What recently put Brazil back on the radar screen for many foreign investors were notonly its splendid resources, but the political and economic reforms the country has under-taken in the last two decades. The country made a fateful transition to mass electoral
334 Chapter 4 • International Economic Indicators: Why Are They So Important?
09Baumohl_Ch04.qxd 8/3/04 3:00 PM Page 334
democracy in the mid 1980s, smack in the middle of the Latin American debt crisis. Inaddition to political reforms, Brazil’s leaders have since liberalized the domestic capitalmarkets. They allowed their currency to float in foreign exchange markets, crafted a newfiscal spending plan, opened the economy to more competition, embarked on a privatiza-tion program, and passed legislation to further deregulate the economy.
The results for Brazil’s economy have been palpable. After growing an average of6% a year in the 1960s and nearly 9% in the 1970s, the economy was stuck at idle in the1980s, squeaking out barely 1.5% growth annually, its worst 10-year economic perform-ance since the 1930s. But it has bounced back nicely since. Brazil has weathered globaleconomic downturns better than its neighbors. As the U.S. and Europe struggled withrecession after the tech bubble burst and stock markets collapsed, economic activity inBrazil continued to expand without interruption, an accomplishment that did not escapethe attention of foreign investors. At the core of Brazil’s resilience and strength is ahighly diversified export sector, one that ranges from shipments of orange juice and min-erals to value-added manufactured products such as automobiles, planes, boats, and capi-tal goods. Perhaps the most important benefit to Brazil from all the reforms is that for thefirst time in decades, the country is now capable of experiencing vibrant economicgrowth without necessarily suffering the previous side effects of huge trade deficits andsoaring inflation.
Still, Brazil needs to do more. Its central bank, which carries out monetary policy,does not yet have full independence and thus can be subject to political influence. Thecountry continues to have severe social problems due to sharp inequalities in its incomedistribution. It also has a creaky infrastructure that requires attention, and it needs to fur-ther reform the judicial system.
But make no mistake: Brazil’s economy is on the move, and internationalinvestors have returned to help expand the country’s industrial sector. In fact, the bestbarometer for measuring the health of Brazil’s economy is industrial production,which represents 40% of its GDP (with services and agriculture contributing 52% and8%, respectively). To measure industrial output, the government surveys 8,500 estab-lishments on the output of 944 different products. Brazil’s Institute for Geography andStatistics compiles the data, announces the news, publishes an online press release inEnglish, and provides relevant tables, though they are printed on different Web pageswithin the IBGE Web site. For instance, the headline news can be found on the homepage (www.ibge.gov.br/english). A press release can be downloaded from the mainindustrial production news page. However, to get all the relevant tables, one has toreturn to the home page and click “indicators.”
335Brazil Industrial Production
09Baumohl_Ch04.qxd 8/3/04 3:00 PM Page 335
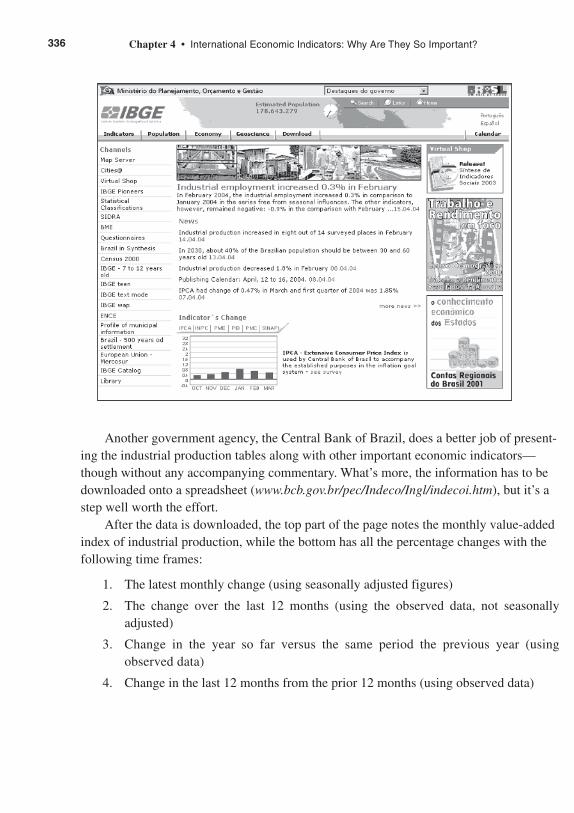
Another government agency, the Central Bank of Brazil, does a better job of present-ing the industrial production tables along with other important economic indicators—though without any accompanying commentary. What’s more, the information has to bedownloaded onto a spreadsheet (www.bcb.gov.br/pec/Indeco/Ingl/indecoi.htm), but it’s astep well worth the effort.
After the data is downloaded, the top part of the page notes the monthly value-addedindex of industrial production, while the bottom has all the percentage changes with thefollowing time frames:
1. The latest monthly change (using seasonally adjusted figures)
2. The change over the last 12 months (using the observed data, not seasonallyadjusted)
3. Change in the year so far versus the same period the previous year (usingobserved data)
4. Change in the last 12 months from the prior 12 months (using observed data)
336 Chapter 4 • International Economic Indicators: Why Are They So Important?
09Baumohl_Ch04.qxd 8/3/04 3:00 PM Page 336
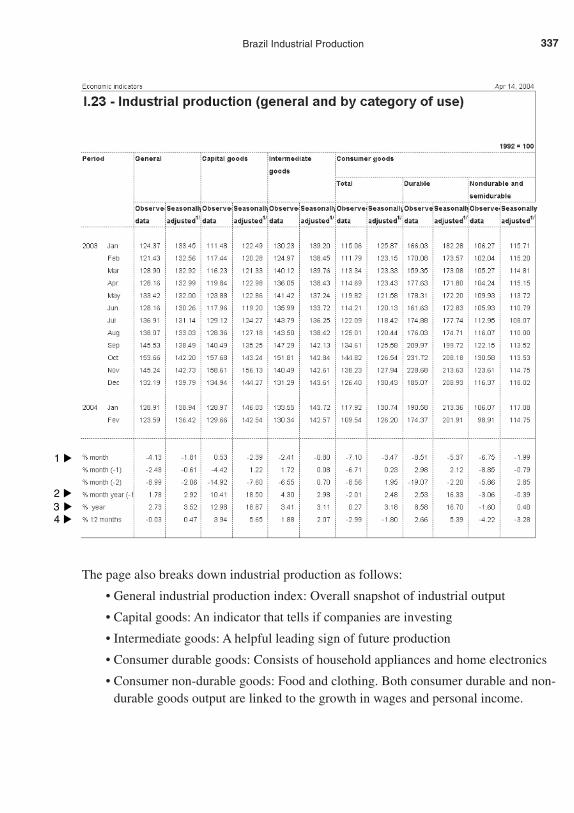
The page also breaks down industrial production as follows:
• General industrial production index: Overall snapshot of industrial output
• Capital goods: An indicator that tells if companies are investing
• Intermediate goods: A helpful leading sign of future production
• Consumer durable goods: Consists of household appliances and home electronics
• Consumer non-durable goods: Food and clothing. Both consumer durable and non-durable goods output are linked to the growth in wages and personal income.
337Brazil Industrial Production
▲
4▲
1
▲
2 ▲3
09Baumohl_Ch04.qxd 8/3/04 3:00 PM Page 337

09Baumohl_Ch04.qxd 8/3/04 3:00 PM Page 338

C H A P T E R 5
Best Web Sites for U.S. Economic Indicators
Up until the 1990s, large economic research firms would charge clients thousands of dol-lars for churning out statistics on the U.S. and international economies. Today, thanks tothe Internet and the intense competition among financial services companies to attractcustomers, anyone can easily obtain economic or financial data directly from the Web atno cost. The following is a list of online resources that provide such information for free.
SCHEDULE OF RELEASES
• Get a calendar of U.S. economic releases:
http://money.cnn.com/markets/IRC/economic.htmlwww.nber.org/releases/http://fidweek.econoday.com/
ECONOMIC NEWS
• Latest stories on the economy:
www.bloomberg.com/news/http://money.cnn.com/news/economy/http://cbs.marketwatch.com/news/http://news.yahoo.com/fc?tmpl=fc&cid=34&in=business&cat=us_economy
THE U.S. ECONOMY
• Most recent GDP report:
www.bea.doc.gov/bea/rels.htm
10Baumohl_Ch05.qxd 8/3/04 10:31 AM Page 339
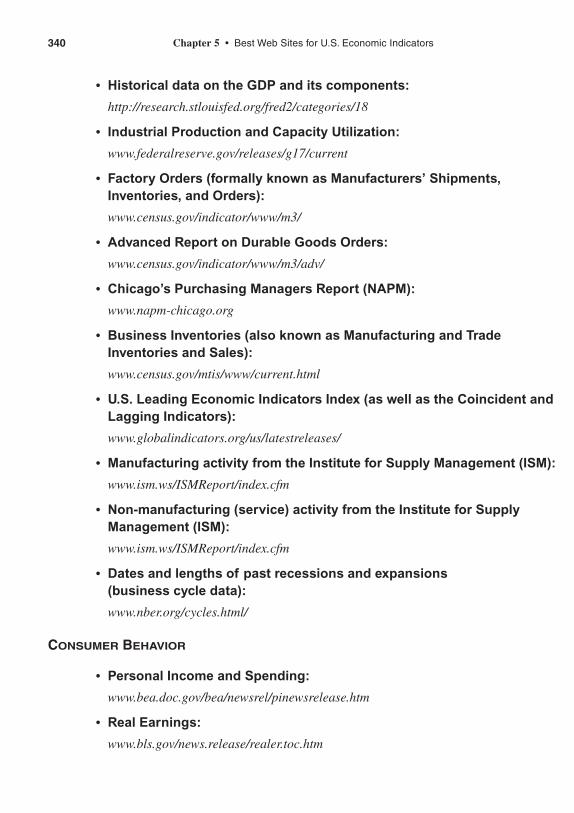
340 Chapter 5 • Best Web Sites for U.S. Economic Indicators
• Historical data on the GDP and its components:
http://research.stlouisfed.org/fred2/categories/18
• Industrial Production and Capacity Utilization:
www.federalreserve.gov/releases/g17/current
• Factory Orders (formally known as Manufacturers’ Shipments,Inventories, and Orders):
www.census.gov/indicator/www/m3/
• Advanced Report on Durable Goods Orders:
www.census.gov/indicator/www/m3/adv/
• Chicago’s Purchasing Managers Report (NAPM):
www.napm-chicago.org
• Business Inventories (also known as Manufacturing and TradeInventories and Sales):
www.census.gov/mtis/www/current.html
• U.S. Leading Economic Indicators Index (as well as the Coincident andLagging Indicators):
www.globalindicators.org/us/latestreleases/
• Manufacturing activity from the Institute for Supply Management (ISM):
www.ism.ws/ISMReport/index.cfm
• Non-manufacturing (service) activity from the Institute for SupplyManagement (ISM):
www.ism.ws/ISMReport/index.cfm
• Dates and lengths of past recessions and expansions (business cycle data):
www.nber.org/cycles.html/
CONSUMER BEHAVIOR
• Personal Income and Spending:
www.bea.doc.gov/bea/newsrel/pinewsrelease.htm
• Real Earnings:
www.bls.gov/news.release/realer.toc.htm
10Baumohl_Ch05.qxd 8/3/04 10:31 AM Page 340
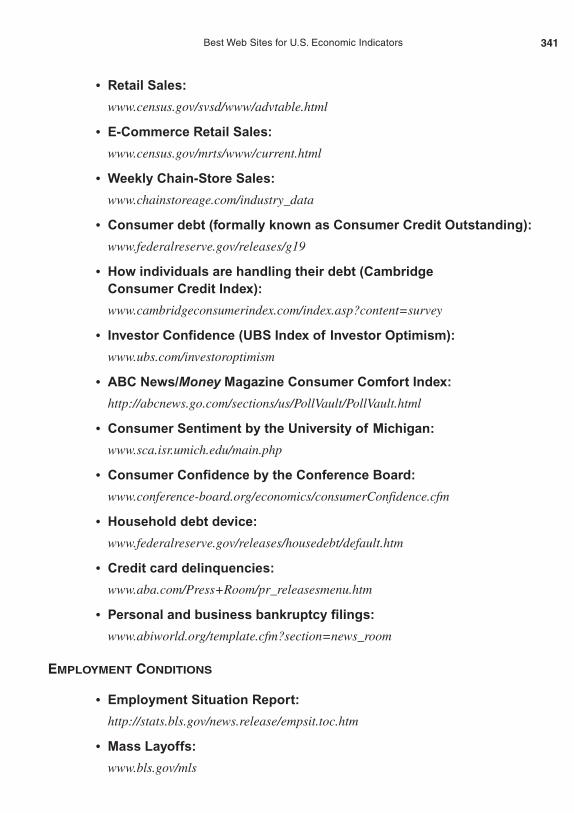
• Retail Sales:
www.census.gov/svsd/www/advtable.html
• E-Commerce Retail Sales:
www.census.gov/mrts/www/current.html
• Weekly Chain-Store Sales:
www.chainstoreage.com/industry_data
• Consumer debt (formally known as Consumer Credit Outstanding):
www.federalreserve.gov/releases/g19
• How individuals are handling their debt (Cambridge Consumer Credit Index):
www.cambridgeconsumerindex.com/index.asp?content=survey
• Investor Confidence (UBS Index of Investor Optimism):
www.ubs.com/investoroptimism
• ABC News/Money Magazine Consumer Comfort Index:
http://abcnews.go.com/sections/us/PollVault/PollVault.html
• Consumer Sentiment by the University of Michigan:
www.sca.isr.umich.edu/main.php
• Consumer Confidence by the Conference Board:
www.conference-board.org/economics/consumerConfidence.cfm
• Household debt device:
www.federalreserve.gov/releases/housedebt/default.htm
• Credit card delinquencies:
www.aba.com/Press+Room/pr_releasesmenu.htm
• Personal and business bankruptcy filings:
www.abiworld.org/template.cfm?section=news_room
EMPLOYMENT CONDITIONS
• Employment Situation Report:
http://stats.bls.gov/news.release/empsit.toc.htm
• Mass Layoffs:
www.bls.gov/mls
341Best Web Sites for U.S. Economic Indicators
10Baumohl_Ch05.qxd 8/3/04 10:31 AM Page 341

• Weekly-Claims for Unemployment Insurance:
www.ows.doleta.gov/unemploy/claims_arch
• Help Wanted Advertising Index:
www.conferenceboard.org/economics/
HOME SALES AND CONSTRUCTION ACTIVITY
• Housing Starts:
www.census.gov/const/www/newresconstindex.html
• Housing Market Index—Builders’ perception of the current and future market for new single-family homes (National Association ofHome Builders):
www.nahb.org (type “HMI” in the search box)
• Single-Family Existing Home Sales (National Association of Realtors):
www.realtor.org/research.nsf/pages/ehsdata
• New Home Sales:
www.census.gov/const/newressales.pdf
• Construction Spending:
www.census.gov/c30
• Weekly Mortgage Applications (Mortgage Bankers Association):
www.mortgagebankers.org/news/
• Home Affordability Index (National Association of Realtors):
www.realtor.org/research.nsf/pages/housinginx
INTERNATIONAL TRADE
• International Trade:
www.bea.doc.gov/bea/newsrel/tradnewsrelease.htm
• Export and Import Prices:
www.bls.gov/mxp
• Current Account Balance (International Transactions):
www.bea.doc.gov/bea/rels.htm
342 Chapter 5 • Best Web Sites for U.S. Economic Indicators
10Baumohl_Ch05.qxd 8/3/04 10:31 AM Page 342
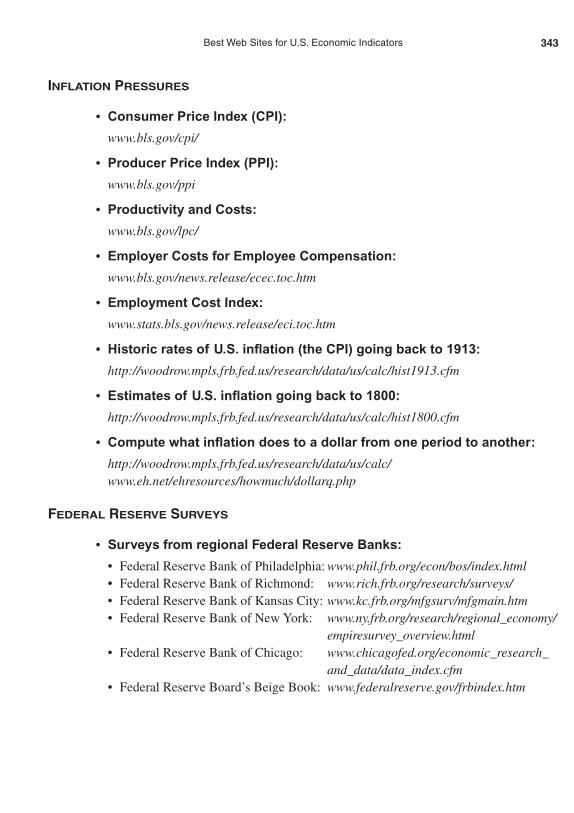
INFLATION PRESSURES
• Consumer Price Index (CPI):
www.bls.gov/cpi/
• Producer Price Index (PPI):
www.bls.gov/ppi
• Productivity and Costs:
www.bls.gov/lpc/
• Employer Costs for Employee Compensation:
www.bls.gov/news.release/ecec.toc.htm
• Employment Cost Index:
www.stats.bls.gov/news.release/eci.toc.htm
• Historic rates of U.S. inflation (the CPI) going back to 1913:
http://woodrow.mpls.frb.fed.us/research/data/us/calc/hist1913.cfm
• Estimates of U.S. inflation going back to 1800:
http://woodrow.mpls.frb.fed.us/research/data/us/calc/hist1800.cfm
• Compute what inflation does to a dollar from one period to another:
http://woodrow.mpls.frb.fed.us/research/data/us/calc/www.eh.net/ehresources/howmuch/dollarq.php
FEDERAL RESERVE SURVEYS
• Surveys from regional Federal Reserve Banks:
• Federal Reserve Bank of Philadelphia: www.phil.frb.org/econ/bos/index.html• Federal Reserve Bank of Richmond: www.rich.frb.org/research/surveys/• Federal Reserve Bank of Kansas City: www.kc.frb.org/mfgsurv/mfgmain.htm• Federal Reserve Bank of New York: www.ny.frb.org/research/regional_economy/
empiresurvey_overview.html• Federal Reserve Bank of Chicago: www.chicagofed.org/economic_research_
and_data/data_index.cfm• Federal Reserve Board’s Beige Book: www.federalreserve.gov/frbindex.htm
343Best Web Sites for U.S. Economic Indicators
10Baumohl_Ch05.qxd 8/3/04 10:31 AM Page 343
THE FEDERAL BUDGET
• Current projections as well as historical data on the U.S. federalbudget:
www.cbo.gov/
• Latest proposed budget of the United States:
www.whitehouse.gov/omb/budget
INTEREST RATES
• Latest interest rates on mortgages, mortgage refinancings, homeequity loans, auto loans, and credit cards:
www.bankrate.com/brm/rate/avg_natl.asp
• Historical interest rates on Federal funds and Treasury securities:
www.federalreserve.gov/releases/h15/data.htm
• Current interest rates on Federal funds and Treasury securities:
www.federalreserve.gov/releases/h15/update/www.bloomberg.com/markets/rates/
MONEY AND CREDIT
• Figures on the U.S. money supply:
www.federalreserve.gov/releases/h6/current
• Data on U.S. bank reserves:
www.federalreserve.gov/releases/h3/
• Historical figures on consumer loans by all commercial banks:
http://research.stlouisfed.org/fred2/series/CONSUMER/49
• Current and historical numbers on commercial and industrial loansoutstanding by commercial banks:
http://research.stlouisfed.org/fred2/series/BUSLOANS/49
U.S. DOLLAR
• Dollar’s exchange rate with virtually any currency in the world:
www.x-rates.com/www.xe.com/ucc/www.oanda.com/converter/classic
344 Chapter 5 • Best Web Sites for U.S. Economic Indicators
10Baumohl_Ch05.qxd 8/3/04 10:31 AM Page 344

• Historical foreign exchange rates:
www.federalreserve.gov/releases/h10/hist/www.oanda.com/converter/classic
• Dollar’s performance versus its major trading partners:
www.federalreserve.gov/releases/h10/summary
ONE-STOP SHOPPING FOR ECONOMIC STATISTICS
• Locate common economic indicators:
www.economicindicators.gov
• Raw data of U.S. economic statistics for graphing purposes:
www.economagic.com/
• Economic Report of the President (which contains a comprehensivecollection of economic indicators going back more than 50 years):
http://w3.access.gpo.gov/eop/
• Economic Indicators by the Joint Economic Committee (U.S.Congress):
www.gpoaccess.gov/indicators/
OTHER USEFUL SOURCES ON THE WEB
• Federal Reserve Board’s Flow of Funds:
www.federalreserve.gov/releases/z1/
• Glossary of economic and financial terms:
www.exchange-handbook.co.uk/glossary.cfm?www.digitaleconomist.com/glossary_macro.htmlhttp://moneycentral.msn.com/investor/glossary/glossary.asp?
345Best Web Sites for U.S. Economic Indicators
10Baumohl_Ch05.qxd 8/3/04 10:31 AM Page 345

10Baumohl_Ch05.qxd 8/3/04 10:31 AM Page 346

C H A P T E R 6
Best Web Sites for InternationalEconomic Indicators
(Only those available in English are listed here)
CALENDAR OF RELEASES FOR FOREIGN ECONOMIC DATA
www.fxstreet.com/nou/continguts/economiccal.asp
www.macro-dev.com/mthcalendar.php
www.mfr.com/Extra/Calendar/MFRIntCalendar.htm
SOURCES OF GLOBAL ECONOMIC NEWS
http://news.bbc.co.uk/2/hi/business/default.stm
http://news.ft.com/business
www.fxstreet.com
www.economics.co.uk
www.reuters.com
www.iht.com/frontpage.html
www.bloomberg.com
ECONOMIC STATISTICS FROM OTHER COUNTRIES
• Europe
• Albania: www.instat.gov.al• Austria: www.statistik.at/index_englisch.shtml• Belarus: http://president.gov.by/Minstat/en/main.html• Belgium: http://statbel.fgov.be/
11Baumohl_Ch06.qxd 8/3/04 10:31 AM Page 347

• Bosnia and Herzegovina: www.bhas.ba/eng/index2/index.htm• Bulgaria: www.nsi.bg/Index_e.htm• Croatia: www.dzs.hr/Eng/ouraddress.htm• Czech Republic: www.czso.cz/eng/redakce.nsf/i/home• Denmark: www.dst.dk/HomeUK.aspx• Estonia: www.stat.ee/• Finland: www.stat.fi/index_en.html• France: www.insee.fr/en/home/home_page.asp
www.insee.fr/en/indicateur/indic_conj/liste_indice.asp
• Germany: www.destatis.de/indicators/e/iwf01.htmwww.destatis.de/e_home.htmwww.ifo.dewww.ifo-business-climate-index.infowww.bundesbank.de/index.en.php
• Greece: www.statistics.gr/Main_eng.asp• Hungary: www.ksh.hu/pls/ksh/docs/index_eng.html• Iceland: www.hagstofa.is/template40.asp?PageID=261• Ireland: www.cso.ie/• Italy: www.istat.it/English/index.htm• Latvia: www.csb.lv/avidus.cfm• Liechtenstein: www.liechtenstein.li/• Lithuania: www.std.lt/web/main.php• Luxembourg: http://statec.gouvernement.lu/html_en/• Macedonia: www.economy.gov.mk/• Malta: www.nso.gov.mt/• Moldova: www.statistica.md/• The Netherlands: www.cbs.nl/en/
www.cpb.nl/eng/www.dnb.nl/dnb/homepage.jsp?lang=en
• Norway: www.ssb.no/www-open/english/• Poland: www.stat.gov.pl/english/• Portugal: www.ine.pt/ajuda/mapa_eng.html• Romania: www.insse.ro/indexe.htm• Russia: www.cbr.ru/eng• Slovakia: www.statistics.sk/webdata/english/index2_a.htm• Slovenia: www.stat.si/eng/• Spain: www.ine.es/welcoing.htm• Sweden: www.scb.se/
348 Chapter 6 • Best Web Sites for International Economic Indicators
11Baumohl_Ch06.qxd 8/3/04 10:31 AM Page 348
349Best Web Sites for International Economic Indicators
• Switzerland: www.statistik.admin.ch/eindex.htm• Ukraine: www.ukrstat.gov.ua/• United Kingdom: www.statistics.gov.uk/
www.bankofengland.co.uk
• Asia
• Armenia: www.armstat.am• Azerbaijan: www.azstat.org/indexen.php• Bahrain: www.mofne.gov.bh/English/eindex.asp• Bangladesh: www.bangladesh-bank.org/• Cambodia: www.nis.gov.kh/• China: http://ce.cei.gov.cn
www.china.org.cn/englishhttp://english.peopledaily.com.cn/www.stats.gov.cn/english/index.htmwww.stats.gov.cn/english/statisticaldata/index.htmwww.pbc.gov.cn/english/www.geoinvestor.com/countries/china/main.htmwww.xinhuanet.com/english/business.htm
• Cyprus: www.centralbank.gov.cy/nqcontent.cfm?a_id=1&lang=en
• Georgia: www.nbg.gov.ge/eng/index.html• Hong Kong: www.info.gov.hk/censtatd/home.html• India: www.rbi.org.in/
http://mospi.nic.in/http://finmin.nic.in/index.htmlwww.censusindia.net/
• Indonesia: www.bps.go.id/index.shtml• Iran: www.cbi.ir/e/• Israel: www.cbs.gov.il/engindex.htm
www.bankisrael.gov.il/firsteng.htm• Japan: www.tse.or.jp/english/index.shtml
www.esri.cao.go.jp/index-e.htmlwww.meti.go.jp/englishwww.meti.go.jp/english/statisticswww.stat.go.jp/english/www5.cao.go.jp/keizai3/getsurei-e/index-e.htmlwww.boj.or.jp/en/index.htmwww.boj.or.jp/en/stat/tk/tk.htmwww.esri.cao.go.jp/en/sna/menu.htmlwww.cao.go.jp/index-e.html
11Baumohl_Ch06.qxd 8/3/04 10:31 AM Page 349

• Jordan: www.dos.gov.jo/dos_home_e/main/• Kazakhstan: www.geocities.com/economy_kz/• Korea (South): http://english.mofe.go.kr/main.php
www.nso.go.kr/eng/• Kuwait: www.cbk.gov.kw/WWW/index.html
www.mop.gov.kw/MopWebSite/english/default.asp • Kyrgyzstan: http://nsc.bishkek.su/English/index.html• Laos: www.mot.gov.vn/laowebsite/• Lebanon: www.cas.gov.lb/index_en.asp• Macao: www.dsec.gov.mo/e_index.html• Malaysia: www.statistics.gov.my/• Maldives: www.planning.gov.mv/index2.htm• Mauritius: http://bom.intnet.mu/• Mongolia: www.mongolbank.mn/• Nepal: www.cbs.gov.np/ • Oman: www.moneoman.gov.om/economic.htm• Pakistan: www.statpak.gov.pk/• Palestinian Authority: www.pcbs.org/• Papua New Guinea: www.nso.gov.pg• Philippines: www.nscb.gov.ph/• Qatar: www.qcb.gov.qa/pages/English_Site/intro.html• Saudi Arabia: www.planning.gov.sa/indexe.htm
www.sama.gov.sa/indexe.htm• Singapore: www.singstat.gov.sg/• Sri Lanka: www.statistics.gov.lk/index.asp• Syria: www.syrecon.org/main_frame.html• Taiwan: www.dgbasey.gov.tw/english/dgbas-e0.htm• Thailand: www.nso.go.th/• Turkey: www.tcmb.gov.tr/yeni/eng/index.html• United Arab Emirates: www.uae.gov.ae/mop/E_home.htm
www.uae.gov.ae/mofi/ • Vietnam: www.mof.gov.vn/DefaultE.aspx?tabid=197• Yemen: www.most.org.ye/bttom.htm
• North America
• Anguilla: www.gov.ai/statistics• Aruba: www.aruba.com/extlinks/govs/cbstats.html• Bahamas: www.bahamascentralbank.com/
www.bahamas.gov.bs/finance
350 Chapter 6 • Best Web Sites for International Economic Indicators
11Baumohl_Ch06.qxd 8/3/04 10:31 AM Page 350

• Barbados: www.centralbank.org.bb/• Belize: www.cso.gov.bz/• Bermuda: www.bma.bm/• Canada: www.statcan.ca
www.bankofcanada.ca/en/www.canadianeconomy.gc.ca/english/economy
• Cayman Islands: www.cimoney.com.ky• El Salvador: www.bcr.gob.sv/• Greenland: www.statgreen.gl/english/• Guatemala: www.banguat.gob.gt/en/• Jamaica: www.statinja.com/• Mexico: www.banxico.org.mx/siteBanxicoINGLES/
www.shcp.gob.mx/english/index.html• Netherlands Antilles: www.centralbank.an/• St. Kitts and Nevis: www.eccb-centralbank.org/• St. Lucia: www.stats.gov.lc• Trinidad & Tobago: www.cso.gov.tt/
• South America
• Argentina: www.indec.mecon.ar/• Brazil: www.investebrasil.org
www.ipeadata.gov.br/www.ibge.gov.br/english/www.bcb.gov.br/pec/Indeco/Ingl/indecoi.htm
• Chile: www.minhda.cl/ingles/inicio.htmlwww.bcentral.cl/eng/
• Columbia: www.banrep.gov.co/engroot/home4.htm• Peru: www.bcrp.gob.pe/English/Index_eng.htm• Suriname: www.cbvs.sr/english/over-de-cbvs.htm• Uruguay: www.bcu.gub.uy/indexe.html• Venezuela: www.bcv.org.ve/EnglishVersion/Index.asp
• Oceania
• Cook Islands: www.mfem.gov.ck/• Guam: www.admin.gov.gu/commerce/• Marshall Islands: www.rmiembassyus.org/statistics/statistics.html• New Zealand: www.treasury.govt.nz/
www.rbnz.govt.nz/www.stats.govt.nz/
• Niue: www.gov.nu/stats/
351Best Web Sites for International Economic Indicators
11Baumohl_Ch06.qxd 8/3/04 10:31 AM Page 351

• Samoa: www.cbs.gov.ws/• Vanuatu: www.vanuatustatistics.gov.vu
• Africa
• Algeria: www.ons.dz/English/indexag.htm• Benin: www.gouv.bj/en/ministeres/mfe/index.php• Botswana: www.cso.gov.bw/• Egypt: www.capmas.gov.eg• Ghana: www.finance.gov.gh/• Lesotho: www.bos.gov.ls/• Libya: www.cbl-ly.com/eng/about.html• Malawi: www.nso.malawi.net/• Morocco: www.bkam.ma/Anglais/Menu/Anex.asp• Mozambique: www.bancomoc.mz/index.php?menu=1&lang=uk• Namibia: www.npc.gov.na/cbs/• Nigeria: www.cenbank.org/• Rwanda: www.minecofin.gov.rw/• Seychelles: www.seychelles.net/misd/• Sierra Leone: www.statistics-sierra-leone.org/• South Africa: www.statssa.gov.za/• Sudan: www.sudanmfa.com/Preface.htm• Swaziland: www.gov.sz/home.asp?pid=75• Tanzania: www.tanzania.go.tz/statistics.html• Uganda: www.ubos.org/• Zambia: www.boz.zm/economics/economics_main.htm
• Australia
www.abs.gov.auwww.rba.gov.au
352 Chapter 6 • Best Web Sites for International Economic Indicators
11Baumohl_Ch06.qxd 8/3/04 10:31 AM Page 352

BEST MEGASITES FOR INTERNATIONAL ECONOMIC STATISTICS
www.worldbank.org/data/countrydata/countrydata.html
www.globalindicators.org
www.oecd.org
www.oecd.org/std/cli
www.ecb.int
www.ntc-research.com
http://europa.eu.int/comm/eurostat/
http://unstats.un.org/unsd/
http://datacentre.chass.utoronto.ca/pwt/
http://devdata.worldbank.org/data-query/
www.latin-focus.com/news
353Best Web Sites for International Economic Indicators
11Baumohl_Ch06.qxd 8/3/04 10:31 AM Page 353

11Baumohl_Ch06.qxd 8/3/04 10:31 AM Page 354
355
Index
AABC News/Money Magazine Consumer Comfort
Index, 94computing, 95
accuracy of statistics, 10
advance report on durable goods orders, 116
annual rates, 17
Bbanks
Central Bank of Brazil, 336Federal Reserve Banks, 198
BEA (Bureau of Economic Analysis), 240
Beige Book, 220
benchmarks, 21
benefits, 283
bondsaffected by jobs report, 37economic indicators, 12impact of
Beige Book, 222
BOS, 208
business inventories, 136
CCCI, 85
Chicago Purchasing Managers Index, 160
Consumer Confidence Index, 90
consumer installment debt, 79
consumer sentiment surveys, 93
corporate layoff announcements, 46
CPI, 254
ECI, 267
ESMS, 203
existing home sales, 180
Factory Orders, 129
GDP, 114
HMI, 190
import/export prices, 273
industrial production and capacity
utilization, 146
International Trade in Goods and Services
report, 235
International Transactions report, 244
ISM manufacturing survey, 152
Kansas City Fed Manufacturing
Survey, 212
LEI, 168
new home sales, 185
personal income and spending, 61
PPI, 261
productivity and costs, 281
retail sales, 66
Richmond Fed Survey, 215
UBS Index of Investor Optimism, 99
weekly chain store sales, 74
Weekly Mortgage Application Survey, 194
yield curves, 293unemployment insurance claims, 41
BOS (Business Outlook Survey), 205computing, 205forecasting the economy, 207market impact, 208
Brazil, industrial production, 334-337
Bundesbank, 302
Bureau of economic Analysis (BEA), 240
business cycles, 18productivity swings, 276statistics, 11
business inventories, 130computing, 132information gained from, 133
12Baumohl_Index.qxd 8/3/04 10:32 AM Page 355
356 Index
market impact, 136overview, 130percent changes, 134
Business Outlook Survey. See BOS
CCambridge Consumer Credit Index. See CCCI
capacity utilization, computing, 138
capital goods orders (durable goods), 120
CBOT (Chicago Board of Trade), 4
CCCI (Cambridge Consumer Credit Index), 80computing, 81forecasting the economy, 81market impact, 85reality gap, 84
Central Bank of Brazil, 336
CFNAI (Chicago Fed National Activity Index),
216-217
chained dollars, 56
Chicago Board of Trade (CBOT), 4
Chicago Mercantile Exchange (CME), 4
Chicago Purchasing Managers Index, 157computing, 157market impact, 160
Chicago Purchasing Managers Report, 340
Chinaindustrial production, 329, 331National Bureau of Statistics (NBS), 331Web site resources, 349
CLI (OECD’s Composite Leading Indicators),
326, 328
CME (Chicago Mercantile Exchange), 4
COLA (cost of living adjustment), 55
Composite Leading Indicators (OECD’s CLI),
326-328
computingBOS, 205business inventories, 132capacity utilization, 139CCCI, 81CFNAI, 217
Chicago Purchasing Managers Index, 157construction spending, 196Consumer Confidence Index, 88consumer installment debt, 76durable goods orders (advance report), 117e-commerce retail sales, 68ECEC, 283ECI, 263ESMS, 200existing home sales, 176Factory Orders, 124GDP, 110industrial production, 138International Trade in Goods and Services
report, 225International Transactions report, 240ISM manufacturing survey, 148ISM Non-Manufacturing survey, 155Kansas City Fed Manufacturing Survey, 209PPI, 256productivity and costs, 278real earnings, 287Richmond Fed Survey, 213Weekly Mortgage Applications Survey, 192yield curves, 292
comScore Networks, 68
consensus surveys, 19
constant dollars vs. current dollars, 20
construction spending, 195-196
Consumer Confidence Index, 86-87computing, 88market impact, 90
consumer installment debt, 75-76forecasting the economy, 78market impact, 79
Consumer Price Index. See CPI
Consumer Sentiment Surveys, 86computing, 92market impact, 93
Conventional Index (Weekly Mortgage
Applications Survey), 192
core-CPI, 250
corporate layoff announcements, 45
cost of living adjustment (COLA), 55
12Baumohl_Index.qxd 8/3/04 10:32 AM Page 356
357Index
costsChinese industrial production, 330ECEC, 282-284labor, 262productivity and costs, 275-276
computing, 278
forecasting the economy, 279
market impact, 281
report components, 277
CPI (Consumer Price Index), 245CPI-W, 287market impact, 254Web site, 343
credit cards, consumer installment debt, 75-76
currencyDeutsche Mark, 303U.S. dollar, 344. See also dollar valueyen, 309
current account balance (international trade), 238
current dollars vs. constant dollars, 20
Ddata, 21
debt (consumer installment debt), 75-76forecasting the economy, 78market impact, 79
deflator for GDP, 108
deflator for PCE, 109
Deutsche Mark, 303
diffusion indexes of employment change, 36
disposable personal income (DPI), 52
dollar valueexample effects, 271exchange rates, 224impact of
Beige Book, 222
business inventories, 136
Consumer Confidence Index, 90
consumer sentiment surveys, 93
CPI, 254
ECI, 267
GDP, 115
housing starts and building permits, 174
International Trade in Goods and Services
report, 236
International Transactions report, 244
ISM manufacturing survey, 153
jobs report, 37
LEI, 168
personal income and spending, 61
PPI, 261
productivity and cost, 281
retail sales, 66
UBS Index of Investor Optimism, 99
yield curves, 294import/export prices, 274international economic indicators, 296unemployment insurance claims, 41Web site resources, 344
dollars, nominal vs. real, 20
DPI (disposable personal income), 52
durable goods, 104, 116, 123, 126industry groupings, 120
durable goods orders (advanced report), 116computing, 117inventories, 122market impact, 122shipments, 120unfilled orders, 121
Ee-commerce retail sales, 67
computing, 68market impact, 69
ECEC (Employer Costs for Employee
Compensation), 282computing, 283forecasting the economy, 284
ECI (Employment Cost Index), 262, 283computing, 263forecasting the economy, 264market impact, 267
economic forecasts (productivity), 275
economic growth (GDP), 101
12Baumohl_Index.qxd 8/3/04 10:32 AM Page 357
358 Index
economic indicators, 6, 10ABC News/Money Magazine Consumer
Comfort Index, 94-95Beige Book, 221bonds, 12BOS, 205
computing, 205
forecasting the economy, 207
market impact, 208Brazil, industrial production, 334-337business inventories, 130
computing, 132
information gained from, 133
market impact, 136
overview, 130
percent changes, 134CCCI, 80-81
computing, 81
market impact, 85CFNAI, 216
computing, 217
market impact, 217Chicago Purchasing Managers Index, 157
computing, 157
market impact, 160China, industrial production, 329-331construction spending, 195-196Consumer Confidence Index, 86-87
computing, 88
market impact, 90consumer installment debt, 75-79consumer sentiment surveys, 91-93corporate layoff announcements, 45CPI, 245, 254durable goods orders (advanced report), 116
computing, 117
inventories, 122
market impact, 122
shipments, 120
unfilled orders, 121e-commerce retail sales, 67
computing, 68
market impact, 69ECEC, 282
computing, 283
forecasting the economy, 284ECI, 262
computing, 263
forecasting the economy, 264
market impact, 267ESMS, 199
computing, 200
forecasting the economy, 201
market impact, 203existing home sales
computing, 176
market impact, 180Factory Orders, 123
computing, 124
market impact, 129
new orders, 125
unfilled orders, 127France, Monthly Business Survey, 317-319GDP, 100-105
computing, 110
market impact, 114-115
net exports, 106
nominal vs. real, 107
percent changes, 111
performance trend, 101
price indexes, 108
vs. GNP, 113Germany
CPI, 302-303
IFO Business Survey, 300-301global
Eurozone Manufacturing PMI, 320-322
Global PMI, 320-321, 324-325
Web site resources, 347-353help wanted advertising index, 42-44HMI, 187housing starts and building permits, 170import/export prices, 268
12Baumohl_Index.qxd 8/3/04 10:32 AM Page 358

359Index
computing, 269
forecasting the economy, 269-272
market impact, 273Industrial Production and Capacity
Utilization, 137
computing, 138
information gained from, 140-144
market impact, 146international, 13-15
data format, 297
impact of, 295-296International Trade in Goods and Services
report, 223-225
computing, 226
forecasting the economy, 226, 230, 235
market impact, 235International Transactions report, 237
capital and financial accounts, 239
computing, 240
current account balance, 238
forecasting the economy, 242
market impact, 244Japan
industrial production, 312
Tankan Survey, 306-309Kansas City Fed Manufacturing Survey, 209
computing, 209
market impact, 212labor market activity, 36leading indicators, 12LEI
financial indicators, 162
index of coincident indicators, 163manufacturing survey (ISM), 147
computing, 148
information gained from, 149
market impact, 152mass layoff statistics, 48-51new home sales, 181
forecasting the economy, 182
market impact, 185
Non-Manufacturing survey (ISM), 154
compared to Manufacturing survey, 155
computing, 155
information gained from, 156OECD’s CLI, 326, 328origin of, xixpersonal income and spending, 52-54, 57, 61PPI, 255
computing, 256
forecasting the economy, 258-259
market impact, 261
stages, 255-256productivity and costs, 275-276
computing, 278
forecasting the economy, 279
market impact, 281
report components, 277real earnings, 286-287regional Federal Reserve Bank reports, 198relevance of, xviiiretail sales, 62-66Richmond Fed Survey, 213
forecasting the economy, 214
market impact, 215sales (weekly chain stores), 70-74seasonal adjustments, 22-23timeliness, 11U.S. dollar, 13UBS Index of Investor Optimism, 97-99unemployment insurance data, 39-40unemployment rate, 30-31Web site resources, 339-345Weekly Mortgage Applications Survey, 191
components, 192
forecasting the economy, 193
market impact, 194yield curve, 289
computing, 292
flat, 291
forecasting the economy, 293
inverted, 292
market impact, 293-294
12Baumohl_Index.qxd 8/3/04 10:32 AM Page 359
360 Index
economic reports, evaluating, xix
economybusiness cycles, 18moving average, 20
Empire State Manufacturing Survey. See ESMS
Employment Cost Index (ECI), 262, 283, 343
employment reportseffects on interest rates, 6evaluating, 5
employment, Web site resources, 341
ESMS (Empire State Manufacturing Survey), 199computing, 200forecasting the economy, 201market impact, 203
establishment survey, 26-27
Europe, Web site resources, 348
Eurozone Manufacturing PMI, 320-322
evaluatingeconomic reports, xixemployment reports, 5
exchange rates, 224
existing home sales, computing, 176
FFactory Orders, 123
computing, 124market impact, 129new orders, 125unfilled orders, 127Web site, 340
Federal Open Market committee. See FOMC
Federal Reserve, evaluating employment reports, 5
Federal Reserve Banks, 198BOS, 205CFNAI, 216ESMS, 199Kansas City Fed Manufacturing Survey, 209Web site resources, 343
Federal Reserve BoardFOMC, 219
Beige Book, 220
Beige Book, 221
fixed investments, 105
flat yield curves, 291
FOMC (Federal Open Market Committee),
219-221
foreign markets. See international trade
Forrester Research, 68
FranceMonthly Business Survey (INSEE), 317-319Web site resources, 348
GGDP (Gross Domestic Product), 100-104
change in private inventory, 105computing, 110Gross Private Domestic Investment, 105import/export prices, 268International Trade in Goods and Services
report, 223market impact, 114-115net exports, 106nominal vs. real, 107percent changes, 111performance trend, 101price indexes, 108vs. GNP, 113
GermanyCPI, 302-303IFO Business Survey, 300-301industrial production, 298inflation measures, 303Web site resources, 348
Global PMI, 320-321, 324-325
GNP (Gross National Product), 113
governmental statistic release, 2
Government Index (Weekly Mortgage
Applications Survey), 192
Gross Domestic Product. See GDP
Gross Private Domestic Investment, 105
12Baumohl_Index.qxd 8/3/04 10:32 AM Page 360
361Index
Hhelp wanted advertising index, 42
affects on stocks, bonds, dollar value, 44what it foretells, 43
HICP (Harmonized Index of Consumer
Prices), 305
HMI (Housing Market Index), 187
household survey, 26
housing permits, 170
housing salesHMI, 187Web site resources, 342
II/S (inventory/sales) ratio, 131
ICSC (International Council of Shopping Centers),
70
import/export prices, 268computing, 269forecasting the economy, 269-272market impact, 273
importing motor vehicles, 230
incomedistortion, 55DPI, 52personal income and spending, 52-54, 57, 61
Income Account, 238
index of coincident indicators (LEI), 163
index of lagging indicators (LEI), 164
industrial productionBrazil, 334-337China, 329-331Germany, 298
Industrial Production and Capacity
Utilization, 137computing, 138information gained from, 140-144market impact, 146Web site, 340
industry groupings (durable goods), 120
inflationCPI, 245Germany, 303import/export prices, 268international trade, 225Web site resources, 343
interest rateseffects of employment reports, 6Web site resources, 344
International Council of Shopping Centers
(ICSC), 70
international economic indicators, 13-15data format, 297impact of, 295-296Web site resources, 347-353
international tradeBrazil, industrial production, 334-337China, industrial production, 329-331exchange rates, 224France, Monthly Business Survey (INSEE),
317-319Germany
CPI, 302-303
IFO Business Survey, 300-301
industrial production, 298import/export prices, 268inflation rates, 225International Trade in Goods and Services
report, 223-225
computing, 226
forecasting the economy, 226, 230, 235
market impact, 235International Transactions report, 237
capital and financial accounts, 239
computing, 240
current account balance, 238
forecasting the economy, 242
market impact, 244Japan
industrial production, 312
Tankan Survey, 306-309
12Baumohl_Index.qxd 8/3/04 10:32 AM Page 361
362 Index
risks of dependence on global trading, 224Web site resources, 342
Internet, retail sales, 68
inventories, 106durable goods, 122maintaining, 116
inverted yield curves, 292
ISM (Institute for Supply Management), 147, 340
ISM Non-Manufacturing survey, 154compared to Manufacturing survey, 155computing, 155information gained from, 156
JJapan
industrial production, 312Tankan Survey, 306-309Web site resources, 349
jobs report, 3, 25evaluating, 5impact on
bonds, 37
interest rates, 6
stocks, 37
Johnson Redbook Average, 70-72
Jupiter Media Matrix, 68
KKansas City Fed Manufacturing Survey, 209
computing, 209market impact, 212
Llabor market activity
diffusion indexes of employment change, 36ECI, 262indicators, 29overtime hours, 32part-time work, 33productivity, 277underemployment, 35
leading indicators, 12
LEI (Leading Economic Indicators), market
impact, 168
Mmaintaining inventory, 116
Manufacturing and Trade Inventories and Sales.
See business inventories
Manufacturers, Shipments, Inventories, and
Orders. See Factory Orders
manufacturing survey (ISM), 147computing, 148information gained from, 149market impact, 152
Market Composite Index (Weekly Mortgage
Applications Survey), 192
market impactBeige Book, 221BOS, 208CFNAI, 217consumer installment debt, 79CPI, 254durable goods, 122e-commerce retail sales, 69ECI, 267ESMS, 203existing home sales, 180Factory Orders, 129import/export prices, 273industrial production and capacity
utilization, 146International Trade in Goods and Services
report, 235International Transactions report, 244ISM manufacturing survey, 152Kansas City Fed Manufacturing Survey, 212new home sales, 185PPI, 261productivity and costs, 281Richmond Fed Survey, 215weekly chain store sales, 74Weekly Mortgage Applications Survey, 194yield curves, 293-294
12Baumohl_Index.qxd 8/3/04 10:32 AM Page 362
363Index
mass layoff statistics, 48-51
Merchandise Trade Account, 238
METI (Ministry of Economy, Trade and
Industry), 312
Michigan Sentiment survey, 91computing, 92market impact, 93
MLS report, 48
Monthly Business Survey (France), 317
mortgages, Weekly Mortgage Applications
Survey, 191
moving averages, 20
NNAHB (National Association of Home
Builders), 187
NDS (National Delinquency Survey), 193
Neilsen/Netratings, 68
net exports, 106
new durable orders excluding both defense and
aircraft, 119
new home sales, computing, 182
nominal dollars vs. real dollars, 20
nominal GDP, 107
non-farm employment, 31
Non-Manufacturing survey (ISM), 154compared to Manufacturing survey, 155computing, 155information gained from, 156
nondefense capital goods (durable goods), 120
nondurable goods, 104, 123, 126
OOECD (Organization for Economic Co-operation
and Development), 326
orders excluding defense (durable goods), 119
orders excluding transportation (durable
goods), 119
Organization for Economic Co-operation and
Development (OECD), 326
overtime hours, 32
Ppart-time work, 33
payroll survey, 26
PCE (personal consumption expenditures), 53,
59, 104
permits (housing), 170
personal income and spending, 52, 57computing, 54effects on bonds, stocks, and the dollar, 61PCE, 53, 59savings, 54
phases of business cycles, 18
PMI (Purchasing Managers Index), 148. See also
Eurozone Manufacturing PMI; Global PMI
PPI (Producer Price Index), 255computing, 256forecasting the economy, 258-259market impact, 261stages, 255-256Web site, 343
predictive ability of statistics, 11
price indexes (GDP), 108
prices (import/export), 268
primary metals (durable goods), 120
private inventories, 106
Producer Price Index. See PPI
productivity and costs, 275-276computing, 278forecasting the economy, 279market impact, 281report components, 277
Proxmire, Senator William, 7
Purchase Index (Weekly Mortgage Applications
Survey), 192
Purchasing Managers Index (PMI), 148
12Baumohl_Index.qxd 8/3/04 10:32 AM Page 363
364 Index
Rrates (annual), 17
real dollars vs. nominal dollars, 20
real earnings, 286-287
real estateexisting home sales
computing, 176
market impact, 180new home sales, 181
forecasting the economy, 182
market impact, 185
real GDP, 107percent changes, 111
reality gap, 84
Refinance Index (Weekly Mortgage Applications
Survey), 192
regional Federal Reserve BanksBOS, 205CFNAI, 216ESMS, 199Kansas City Fed Manufacturing Survey, 209reports, 198
retail sales, 62breakdown of, 64computing, 63e-commerce, 67
computing, 68
market impact, 69market impact, 66statistical resource Web site, 341weekly chain stores, 70
ICSC - UBS, 72
Johnson Redbook Average, 71
market impact, 74
revisions, 21
Richmond Fed Survey, 213forecasting the economy, 214market impact, 215
Ssalaries, 283
distortion, 55real earnings, 286
salesexisting home sales
computing, 176
market impact, 180home sales, Web site resources, 342new home sales, 181
forecasting the economy, 182
market impact, 185retail, 62-66
e-commerce, 67-69
weekly chain stores, 70-74Web site resources, 341
savings, 54
seasonal adjustments, 22-23
Services Trade Account, 238
shipments (durable goods), 120
statisticsaccuracy, 10business cycle stage, 11degree of interest, 11economic indicators, 6government release, 2help wanted advertising index, 43jobless insurance claims, 39mass layoff statistics, 48-51predictive ability, 11retail sales, 62timeliness, 11unemployment, 31vs. economic indicators, xvii
stockseconomic indicators, 12impact of
Beige Book, 222
12Baumohl_Index.qxd 8/3/04 10:32 AM Page 364
365Index
business inventories, 136
Consumer Confidence Index, 90
consumer installment debt, 79
consumer sentiment surveys, 93
CPI, 254
ECI, 267
e-commerce retail sales, 69
ESMS, 204
existing home sales, 180
Factory Orders, 129
GDP, 115
housing starts and building permits, 173
import/export prices, 274
industrial production and capacity
utilization, 146
International Trade in Goods and Services
report, 236
ISM manufacturing survey, 153
jobs report, 37
LEI, 168
new home sales, 186
personal income and spending, 61
PPI, 261
productivity and costs, 281
retail sales, 66
UBS Index of Investor Optimism, 99
weekly chain store sales, 74
Weekly Mortgage Applications Survey, 194
yield curves, 294UBS Index of Investor Optimism, 97unemployment insurance claims, 41
Summary of Commentary on Current Economic
Conditions, 220
surveysconsensus, 19consumer attitude (Michigan Sentiment
survey), 91-93diverging, 28
Ttemporary workers, 36
timeliness of statistics, 11
trade deficit, 225International Transactions report, 237
Treasury yields, 289flat yield curves, 291inverted yield curves, 292
UU.S. dollar, 13. See also dollar value
U.S. economy related Web sites, 339
UBS Index of Investor Optimism, 97computing, 97link between portfolio performance and future
spending, 99market impact, 99
UBS Weekly Chain-Store Sales Snapshot, 71
underemployment, 35
unemployment insurance, weekly claims, 38-40
unemployment rate, 26establishment survey, 27household survey, 26indicators of labor market activity, 29mass layoff statistics, 48-51non-farm employment, 31overtime hours, 32unemployment by duration, 33weekly claims for unemployment insurance,
38-40
unemployment statistics, 4
unfilled orders (durable goods), 121
Unilateral transfers, 238
unit labor costs, 277
12Baumohl_Index.qxd 8/3/04 10:32 AM Page 365
366 Index
Wwages, 283
real earnings, 286
Web sitesABC News/Money Magazine Consumer
Comfort Index, 95international economic indicators, 347-353U.S. economic indicator resources, 339-345
weekly chain store sales, 70ICSC - UBS, 72Johnson Redbook Average, 71market impact, 74
weekly claims for unemployment insurance, 38-40
Weekly Mortgage Applications Survey, 191components, 192forecasting the economy, 193market impact, 194
Yyen, 309
yield curve, 289computing, 292flat, 291forecasting the economy, 293inverted, 292market impact, 293-294
12Baumohl_Index.qxd 8/3/04 10:32 AM Page 366

12Baumohl_Index.qxd 8/3/04 10:32 AM Page 367

12Baumohl_Index.qxd 8/3/04 10:32 AM Page 368

12Baumohl_Index.qxd 8/3/04 10:32 AM Page 369

12Baumohl_Index.qxd 8/3/04 10:32 AM Page 370

12Baumohl_Index.qxd 8/3/04 10:32 AM Page 371

www.informit.com
YOUR GUIDE TO IT REFERENCE
Articles
Keep your edge with thousands of free articles, in-
depth features, interviews, and IT reference recommen-
dations – all written by experts you know and trust.
Online Books
Answers in an instant from InformIT Online Book’s 600+
fully searchable on line books. For a limited time, you can
get your first 14 days free.
Catalog
Review online sample chapters, author biographies
and customer rankings and choose exactly the right book
from a selection of over 5,000 titles.
13Baumohl_Ads.qxd 8/3/04 11:27 AM Page 372

373Last HC Head
At Wharton,
http://execed.wharton.upenn.edu/exec
We Write Them.
We Don’t Teachthe Rules of Business…
Executive Education That Works™
With more than 200 world-class faculty, Wharton has the most powerful research engine
in the world. Every year, Wharton Executive Education draws on this strength to deliver
programs in Senior Management, Finance, Leadership, Management and Marketing—
creating knowledge to propel organizations and power careers.
For more information and a complete
program listing:
215.898.1776 or 800.255.3932 ext. [email protected] (sub. 4033)
13Baumohl_Ads.qxd 8/3/04 11:27 AM Page 373

374 Chapter 1 • Chapter TitleABOUT CONCENTRATED KNOWLEDGE CORPORATIONthe producers of the CD enclosed in the back of this book
CKC invites you to learn more about receiving summaries ofthe best business books of the year delivered right to your dooror computer.
There are so many great business books, but so little time.You know you need tokeep current with theexpanding base of knowledge. But how canyou possibly keep up withall that reading?
The solution is SoundviewExecutive Book Summaries®.
Our experienced editorsreceive all the newly published business booksand select the year’s 30 best.These titles are condensedinto 8-page print and 20-minute audio summaries– with the essential information you need tokeep up.You’ll quickly gain a working knowledge to prepare forpresentations, make decisions, assume leadership responsibilities,and respond to high-pressure situations.
Gain the confidence that only such a broad scope of knowledge can provide by subscribing today. Call the numberbelow or visit our Web site.You’ll be happy you did.
Call 1-800-521-1227 (610-558-9495) or go to www.summary.com/wp
A Concentrated Knowledge Corporation
13Baumohl_Ads.qxd 8/3/04 11:27 AM Page 374

375Last HC Head
For licensing and content information, please contact:Jamie HammondAssociate Director of Marketing215.898.2388 • [email protected]
Knowledge@Wharton is a unique, free resource that offers the best of business—
the latest trends; the latest research on a vast range of business issues; original insights
of Wharton faculty; studies, papers and analyses of hundreds of topics and industries.
Knowledge@Wharton has over 300,000 users from more than 189 countries.
http://knowledge.wharton.upenn.edu
WSP_K@W_ad-final.qxd 2/18/04 3:49 PM Page 1
13Baumohl_Ads.qxd 8/3/04 11:27 AM Page 375

376 Chapter 1 • Chapter Title
Finding Fertile GroundIf you’re starting a business, the statistics prove that your best odds
of success are in high technology industries: not just computing and
telecom, but also biotech, electronics, manufacturing and materials,
medical devices, robotics, and other knowledge-intensive fi elds. This is
the fi rst book to provide a methodology for fi nding those extraordinary
opportunities. Shane shows how to identify market opportunities and
competitor weaknesses, evaluate customer needs, manage risk and
uncertainty, predict product adoption and diffusion, structure your
organization, and protect intellectual property. You’ll learn how to take into
account crucial issues such as network externalities, and the emergence
of dominant designs and technical standards. Unlike other books on
entrepreneurship, this one offers solutions specifi cally targeted at high
tech startups.
ISBN 0131423983, © 2005, 256 pp., $27.95
The Power of Impossible ThinkingYou don’t live in the real world. You live in the world inside your head.
We all do. Our invisible mental models shape everything we do. Often,
they keep us from seeing what’s right in front of us, and prevent us from
changing our companies and society…even our lives. The Power of
Impossible Thinking is about fi xing your mental models, so you can see
reality and act on it. Based fi rmly in neuroscience, it shows how to develop
new ways of seeing…understand complex environments…even how to
do “mind R&D” to keep your models fresh and relevant. Whether you need
to beat the competition or lose weight, your mental models may be the
problem…and The Power of Impossible Thinking is the solution.
ISBN 0131425021, © 2005, 336 pp., $24.95
Baumohl_bbad.indd 1Baumohl_bbad.indd 1 8/2/04 1:24:33 PM8/2/04 1:24:33 PM
13Baumohl_Ads.qxd 8/3/04 11:27 AM Page 376