the value of design rationale information
TRANSCRIPT

21
The Value of Design Rationale Information
DAVIDE FALESSI, University of Rome Tor Vergata and Simula Research LaboratoryLIONEL C. BRIAND, University of LuxembourgGIOVANNI CANTONE, University of Rome Tor VergataRAFAEL CAPILLA, Rey Juan Carlos UniversityPHILIPPE KRUCHTEN, University of British Columbia
A complete and detailed (full) Design Rationale Documentation (DRD) could support many software devel-opment activities, such as an impact analysis or a major redesign. However, this is typically too onerous forsystematic industrial use as it is not cost effective to write, maintain, or read. The key idea investigated inthis article is that DRD should be developed only to the extent required to support activities particularlydifficult to execute or in need of significant improvement in a particular context. The aim of this article is toempirically investigate the customization of the DRD by documenting only the information items that willprobably be required for executing an activity. This customization strategy relies on the hypothesis that thevalue of a specific DRD information item depends on its category (e.g., assumptions, related requirements,etc.) and on the activity it is meant to support. We investigate this hypothesis through two controlled ex-periments involving a total of 75 master students as experimental subjects. Results show that the value ofa DRD information item significantly depends on its category and, within a given category, on the activityit supports. Furthermore, on average among activities, documenting only the information items that havebeen required at least half of the time (i.e., the information that will probably be required in the future) leadsto a customized DRD containing about half the information items of a full documentation. We expect thatsuch a significant reduction in DRD information should mitigate the effects of some inhibitors that currentlyprevent practitioners from documenting design decision rationale.
Categories and Subject Descriptors: D.2.10 [Software-Design]: Representation
General Terms: Design, Documentation, Experimentation
Additional Key Words and Phrases: Empirical software engineering, software architecture, design decisions,value-based software engineering, software maintenance.
ACM Reference Format:Falessi, D., Briand, L. C., Cantone, G., Capilla, R., and Kruchten, P. 2013. The value of design rationaleinformation. ACM Trans. Softw. Eng. Methodol. 22, 3, Article 21 (July 2013), 32 pages.DOI: http://dx.doi.org/10.1145/2491509.2491515
1. INTRODUCTION
During any software development process, most architectural design decisions arenot explicitly documented with their rationale, as they are often embedded in themodels the architects build [Tyree and Akerman 2005]. Consequently, useful knowledge
This article is a revised and extended version of a paper presented at WICSA 2008 and SHARK 2008.The work of L. Briand and D. Falessi was supported by a grant from the Norwegian research council.Authors’ Addresses: D. Falessi (corresponding author), University of Rome Tor Vergata, Italy and SimulaResearch Laboratory, Norway; email: [email protected]; L. C. Briand, University of Luxembourg,Luxembourg; G. Cantone, University of Rome Tor Vergata, Italy; R. Capilla, Rey Juan Carlos University,Sapin; P. Kruchten, University of British Columbia, Canada.Permission to make digital or hard copies of part or all of this work for personal or classroom use is grantedwithout fee provided that copies are not made or distributed for profit or commercial advantage and thatcopies show this notice on the first page or initial screen of a display along with the full citation. Copyrights forcomponents of this work owned by others than ACM must be honored. Abstracting with credit is permitted.To copy otherwise, to republish, to post on servers, to redistribute to lists, or to use any component of thiswork in other works requires prior specific permission and/or a fee. Permissions may be requested fromPublications Dept., ACM, Inc., 2 Penn Plaza, Suite 701, New York, NY 10121-0701 USA, fax +1 (212)869-0481, or [email protected]© 2013 ACM 1049-331X/2013/07-ART21 $15.00
DOI: http://dx.doi.org/10.1145/2491509.2491515
ACM Transactions on Software Engineering and Methodology, Vol. 22, No. 3, Article 21, Pub. date: July 2013.

21:2 D. Falessi et al.
associated to the decision-making activities is lost forever [Falessi et al. 2011a, 2011b;Kruchten et al. 2009]. In cases where the design erodes, the problem of knowledgevaporization [Bosch 2004], often due to a lack of Design Rationale Documentation(DRD), leads to high maintenance cost, as new design decisions cannot rely on previousones.
Although the use of design rationale is recognized as one of the most promisingsteps for advancing the state-of-the-art of software architecture design and mainte-nance [Bosch 2004], its widespread industrial use has been hindered by socio-technicalinhibitors, in particular the effort to produce and maintain additional documentation[Lee 1997]. According to Gorton [2006], “Generating architecture documentation isnearly always a good idea. The trick is to spend just enough effort to produce only doc-umentation that will be useful for the project’s various stakeholders. This takes someupfront planning and thinking.” In other words, DRD should be tailored to supportactivities that are the most in need of improvement in a given context.
The term information item refers to a single piece of rationale information regardinga design decision. The taxonomy of DRD information proposed by Tyree and Akerman[2005] provides a categorization of information items for a design decision. Accordingto this categorization, an information item always belongs to a single category.
The key idea we have investigated is that design rationale documentation shouldonly be introduced to the extent required to support subsequent activities that are par-ticularly challenging to perform, or in significant need of improvement in a particularcontext. Hence, the purpose of this article is to report on an empirical study of thecustomization of the design rationale documentation by restricting the documentationto only those information elements that are very likely to be required to perform asubsequent activity.
In order to demonstrate the feasibility and value of DRD customization we investi-gate here the following research questions.
R.Q. 1. Is the value of an information item significantly affected by its category andthe activity it supports?
R.Q. 2. How much effort could be saved by adopting a value-based DRD?The empirical procedure consists of two controlled experiments performed in two
different geographical locations and both involving trained graduate students. The cur-rent article combines the data of the first experiment with that of its replica in order togain in statistical power and apply more sophisticated analysis techniques. More specif-ically, we have used multiple correspondence analysis [Greenacre 2007]—a techniquededicated to large contingency tables (categorical data) and their interpretation—toanalyze the relations among the category of DRD information items, its value, and thespecific activities it supports.
We decided to focus on DRD and do not consider other types of existing documentationbecause there is a general agreement that sharing architectural knowledge is a veryrelevant problem and it is not addressed by any documentation other than DRD [Lagoet al. 2008].
The remainder of this article is structured as follows: Section 2 presents the relatedwork and introduces the concepts used in this study. Section 3 discusses the costs andbenefits of using design rationale and presents our key idea. Section 4 describes twoexperiments, namely a controlled experiment and an exact replica, with the goal toassess empirically the feasibility and efficiency of documenting only those informationitems that are valuable for the intended use or purpose. Section 5 reports the empiricalresults and their discussion. Section 6 discusses in great detail how the work presentedin this article can be built upon to eventually support the application of DRD. The articleconcludes in Section 7.
ACM Transactions on Software Engineering and Methodology, Vol. 22, No. 3, Article 21, Pub. date: July 2013.
The Value of Design Rationale Information 21:3
2. RELATED WORK
2.1. DRD Approaches and Tools
There are many definitions of design rationale [de Boer and Farenhorst 2008]; one of themost comprehensive definitions has been proposed by Jintae Lee: “Design rationalesinclude not only the reasons behind a design decision but also the justification for it,the other alternatives considered, the trade-offs evaluated, and the argumentation thatled to the decision” [Lee 1997]. The rationale can be classified into several types; mostof the times these types are not mutually exclusive. Burge and Brown [1998] proposethe following types of rationale: argumentation, history, device, process, and activedocument. In particular, in the argumentation-based DRD, design rationale is used torepresent the arguments that characterize a design, such as issues raised, alternativeresponses to these issues, and arguments for and against each alternative. Prominentargument-based design rationale techniques are gIBIS [Conklin and Begeman 1988],DRL [Lee 1997], and QOC [MacLean et al. 1996].
Lee states that much of the design rationale is embedded in design specificationsor parts of meeting discussions [Lee 1997]. Addressing all the issues that match thedifferent dimensions of design rationale is also difficult because different stakeholdersare interested in different concerns. This interest in different concerns is similar inprinciple to our value-based DRD approach which is based on the premise that “whatyou represent depends on what you want to do with it” [Lee 1997].
Tang et al. evaluated the importance of DRD as perceived by industrial softwarearchitects [Tang et al. 2007]. Our article shares with Tang et al. the view that “practi-tioners recognize the importance of documenting design rationale [. . . ] however theyhave indicated barriers to the use and documentation of design rationale” [Tang et al.2007]. In particular, they investigated which type of information is generally morelikely to be used by practitioners. We have tried to go a step further by investigatingthe level of support, provided by each category of information, for specific activities.
Referring to the knowledge capturing problem, Tyree and Akerman proposed aframework to document design decision rationale for system architectures [Tyree andAkerman 2005]. In the present study, we use such a documentation template as anexample of DRD and we investigate the level of usefulness of each information itemcategory in this template in support of different software development activities.
Capilla et al. described an approach for modeling and documenting the evolution ofarchitectural design decisions that is characterized by sets of mandatory and optionalattributes that can be tailored according to different users’ needs as well as to differentorganizations [Capilla et al. 2007]. Customized information is used to adapt part ofthe information captured for the design decisions to the specific needs of differentstakeholders and organizations.
Kruchten et al. had suggested a set of different activities supported by DRD[Kruchten et al. 2006]; we investigate some of these (e.g., impact analysis) in thepresent article.
Van der Ven et al. describe that different types of stakeholders adopt DRD to en-act specific activities; in particular they presented a use-case model that arose fromindustrial needs [Van der Ven et al. 2006].
Farenhorst et al. recently investigated by means of a large-scale survey the behaviorof architects in terms of their daily activities, and how important they consider thevarious types of support for sharing architectural knowledge [Farenhorst et al. 2009].Their results indicate that architects mainly consume architectural knowledge, butneglect to document and share such knowledge themselves. Such a result calls for sup-porting architectural knowledge sharing by effectively balancing the costs and benefitsof design rationale information.
ACM Transactions on Software Engineering and Methodology, Vol. 22, No. 3, Article 21, Pub. date: July 2013.

21:4 D. Falessi et al.
Jansen et al. presented the Architectural Design Decision Recovery Approach(ADDRA) for recovering architectural design decisions after the fact [Jansen andBosch 2005]. In particular, ADDRA uses architectural deltas to provide the architectwith clues about these design decisions. This DRD approach has the advantage ofrequiring little effort from the DRD producer.
Lee and Kruchten divided the documentation activity into three steps: flagging in-formation (identification of possible significant information related to a decision that isbeing made), filtering (excluding some of the information selected in the previous step),and forming (merging the information produced in the previous step to create a usefuland comprehensive DRD) [Lee and Kruchten 2007]. Their key idea is that only the flag-ging step needs to be enacted near the decision-making process; so most of the effortrequired by the DRD can be postponed according to the decision-maker availability.
2.2. Value-Based Approaches
We consider all the aforementioned DRD approaches as value neutral because they donot relate to a particular business context; rather they aim to maximize the benefits forthe knowledge consumer, by imposing the burden on the knowledge producer to docu-ment all potential useful information. To date, “much of current software engineeringpractice and research is done in a value-neutral setting, in which every requirement,use case, object, test case, and defect is equally important” [Biffl et al. 2006]. Con-sequently, “a resulting value-based software engineering agenda has emerged, withthe objective of integrating value considerations into the full range of existing andemerging software engineering principles and practices, and of developing an overallframework in which they compatibly reinforce each other” [Biffl et al. 2006]. In thepresent work, we apply value-based software engineering principles to documentation,and we propose a value-based approach to DRD consisting in prioritizing the informa-tion to document according to the activity to support, that is, the activities particularlyhard to enact without DRD.
The idea of applying a value-based approach to requirements traces was proposed inseveral studies including Arkley et al. [2006], Egyed et al. [2005, 2007a], Falessi et al.[2011a], and Heindl and Biffl [2005]. We share with these studies the aim and visionthough the object being tailored is different (requirements trace versus DRD). More-over, the questions “how much traceability is enough?” [Cleland-Huang 2006b] and“when and how does requirements traceability deliver more than it costs?” [Cleland-Huang 2006b], were addressed in panel discussions held at two important internationalconferences: COMPSAC06 and RE06.
More than twenty years ago, Basili and Rombach provided practical guidelines for asuccessful reuse strategy [Basili and Rombach 1991]. Similarly, in our work we proposea guideline to reuse architectural knowledge: the model capturing experience (i.e.,DRD) should be tailored to specific project objectives in terms of activities to support.
The present work perfectly matches the agile modeling approach [Falessi et al.2010b], and in particular “the TAGRI principle of software development: they ain’tgonna read it”, as a way to cut the documentation effort [Ambler and Jeffries 2002].While Ambler poses some relevant questions regarding the different ways stakeholdersuse the documentation [Ambler 2007], in this article we provide quantitative resultsregarding the extent to which specific rationale information items support specificactivities.
2.3. DRD Benefits
The role of design rationale in software engineering has been extensively discussed byBurge et al. [2008]. DRD can support several software-architecture-related activities:architectural review, review for a specific concern, change impact analysis, studying the
ACM Transactions on Software Engineering and Methodology, Vol. 22, No. 3, Article 21, Pub. date: July 2013.

The Value of Design Rationale Information 21:5
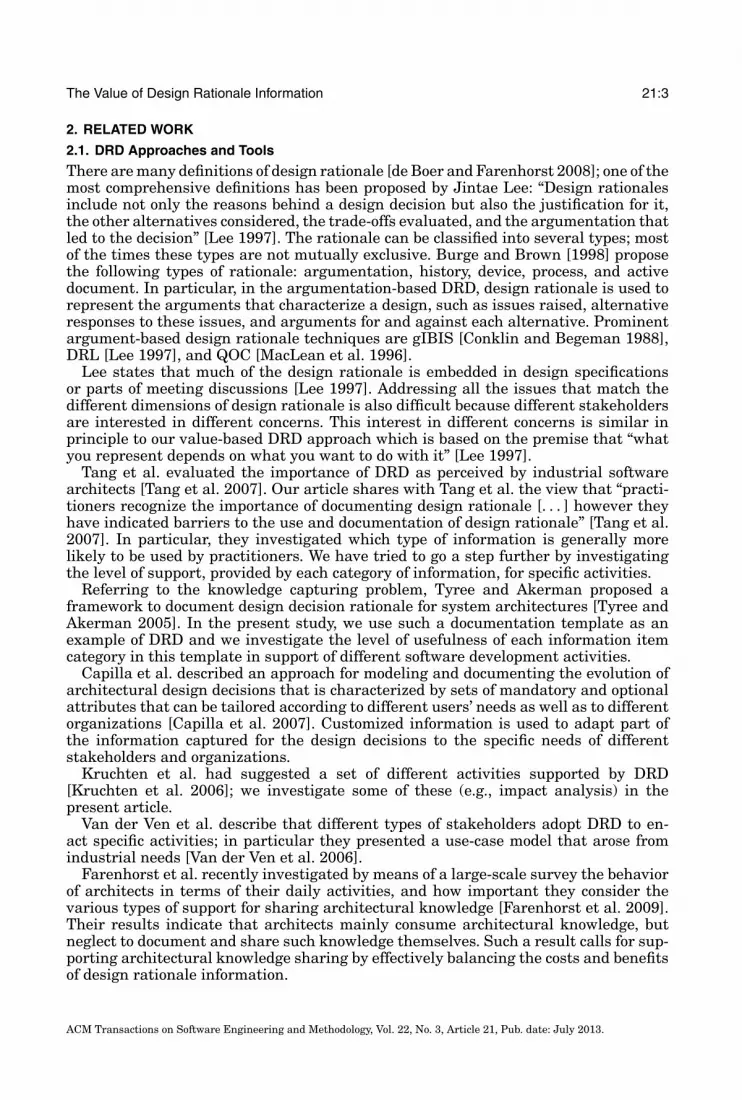
Fig. 1. Correctness of individual decisions and team decisions with and without design rationale documen-tation.
chronology, adding decisions, cleaning up the system, spotting the subversive stake-holder, cloning architectural knowledge, and detection and interpretation of patterns[Kruchten et al. 2006]. To explain the meaning of such DRD uses, let us consider,for instance, the activity “impact analysis”, which is concerned with the managementof requirement changes. In practice, changes in requirements or business goals arevery frequent. Martin Fowler [2005] emphasized the unpredictability of requirements:“What might be a good set of requirements now, is not a good set in six months time.Even if customers can fix their requirements, the business world isn’t going to stop forthem.” In the case of a requirements change, it is crucial to understand which deci-sions (and eventually which system artifacts) are still valid and which ones have to bereworked (i.e., redesigned and/or reimplemented).
Several researchers assessed the support provided by DRD. For instance, Karsentyassessed the QOC approach in the maintenance of a nine-month old software project[Karsenty 1996].
Brathall et al. presented a controlled experiment to evaluate the importance of DRDwhen predicting change impact on software architecture evolution [Bratthall et al.2000]. Results show that DRD clearly improves effectiveness and efficiency.
Zimmermann et al. presented a proactive approach to modeling and reusing archi-tectural knowledge for enterprise application development [Zimmermann et al. 2007].Their approach has already shown to be practical for BPM requirement models and theSOA architectural style: they observed initial effort savings and quality improvementson an early adoption project.
Falessi et al. [2006] analyzed the value of DRD with respect to effectiveness andefficiency of individual/team decision making in the presence of requirement changes.The main goal was to estimate whether the availability of the DRD would improvethe correctness of design decisions. The study was a controlled experiment in which50 masters students were the experiment subjects. Figure 1 summarizes the resultsof the study; we can see how in case of requirement changes the correctness of thedecisions improves when the DRD is available for decision makers, both for individ-ual participants and teams. Given the empirical evidence that DRD is beneficial, thenatural next step is to provide realistic means to reduce the inhibitors for DRD usage.
3. BALANCING THE COSTS AND BENEFITS OF DESIGN RATIONALE INFORMATION
3.1. DRD Inhibitors
Although several studies empirically demonstrated that the use of design rationaledocumentation brings numerous benefits [Bratthall et al. 2000; Falessi et al. 2006;
ACM Transactions on Software Engineering and Methodology, Vol. 22, No. 3, Article 21, Pub. date: July 2013.

21:6 D. Falessi et al.
Karsenty 1996], such type of documentation is not widely adopted in practice. Throughdiscussions with our industrial partners we’ve identified the following inhibitors to theadoption of DRD.
—Bad timing and delayed benefit. The period in which design decisions are made isoften critical for the overall project success. People involved in design decisions areusually busy trying to perform other more recognized and essential tasks and to meettheir related deadlines. In such circumstances, documenting rationale is perceivedto be less important and is eventually dismissed. Our experience shows that whenwe suggest documenting the design decision rationale in an appropriate time frame,the most common answer is: “We are already under pressure to meet the deadline;investing additional time in documentation would make the situation worse.”
—Information predictability.DRD consumers and producers are often different persons.People who are responsible for evolving a software project are usually not the originaldesigners, who may not even be part of the project organization anymore. Hence, thedocumentation producer needs to forecast which information the consumers will needin the future. As a result, the producer would need to document all the informationthat could be useful.
—Overhead. Several DRD techniques already exist [Burge and Brown 1998; Conklinand Begeman 1988; Jansen et al. 2008; Lee and Kruchten 2007]; however, they usu-ally focus on maximizing the consumer benefits rather than minimizing the producereffort. This results in substantial effort being spent on documentation and main-tenance activities. Supposedly, the overhead required to capture design rationaleinformation is regained by assisting future maintenance and evolution activities.This overhead can be minimized by carefully selecting the DRD information itemsto be captured. Shum and Hammond [1994] pointed out that without a good ReturnOn Investment (ROI), the documentation management system would not be used orwould ultimately be counterproductive.
—Unclear benefits. Decision makers often do not know how the DRD will supportspecific activities.
—Lack of motivation. This may arise from the absence of direct benefits or a lack ofpersonal interest. People in charge of documenting and maintaining DRD artifacts(the decision makers) are not very motivated because they do not directly benefitfrom DRD. Lee [1997] had already raised the issue of having distinct DRD producersand consumers. Moreover, experts may not be interested in making their valuableknowledge explicit as they may perceive it to be an asset. In other words, someexperts may see no clear advantage in documenting design rationale.
—Lack of maturity. Only few tools are currently available to support DRD and themajority of them are still immature [Burge and Brown 1998; Conklin and Begeman1988; Jansen et al. 2008; Lee and Kruchten 2007].
—Potential inconsistencies. DRD and designs should be kept up to date and alignedto avoid potential inconsistencies when the design is modified or when decisionschange.
3.2. Key Idea: A Value-Based Customization
Though all the inhibitors exist, the “overhead” seems the most important to addressbecause it would in turn impact additional inhibitors including bad timing and delayedbenefits, lack of motivation, and potential inconsistencies. For this reason, we decidedto focus here on the overhead inhibitor. The key idea is to customize the DRD bydocumenting only those information items that will probably be required for executinga particular software-architecture-related activity [Kruchten et al. 2006], for example,detecting requirements misunderstandings.
ACM Transactions on Software Engineering and Methodology, Vol. 22, No. 3, Article 21, Pub. date: July 2013.
The Value of Design Rationale Information 21:7
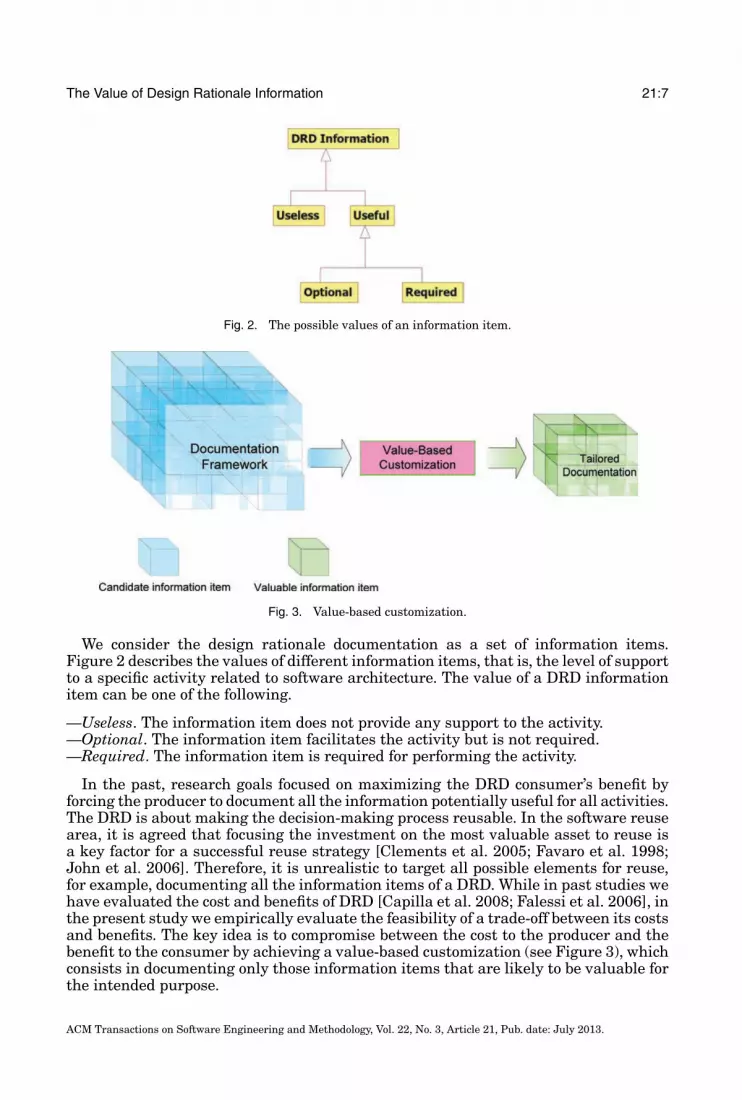
Fig. 2. The possible values of an information item.
Fig. 3. Value-based customization.
We consider the design rationale documentation as a set of information items.Figure 2 describes the values of different information items, that is, the level of supportto a specific activity related to software architecture. The value of a DRD informationitem can be one of the following.
—Useless. The information item does not provide any support to the activity.—Optional. The information item facilitates the activity but is not required.—Required. The information item is required for performing the activity.
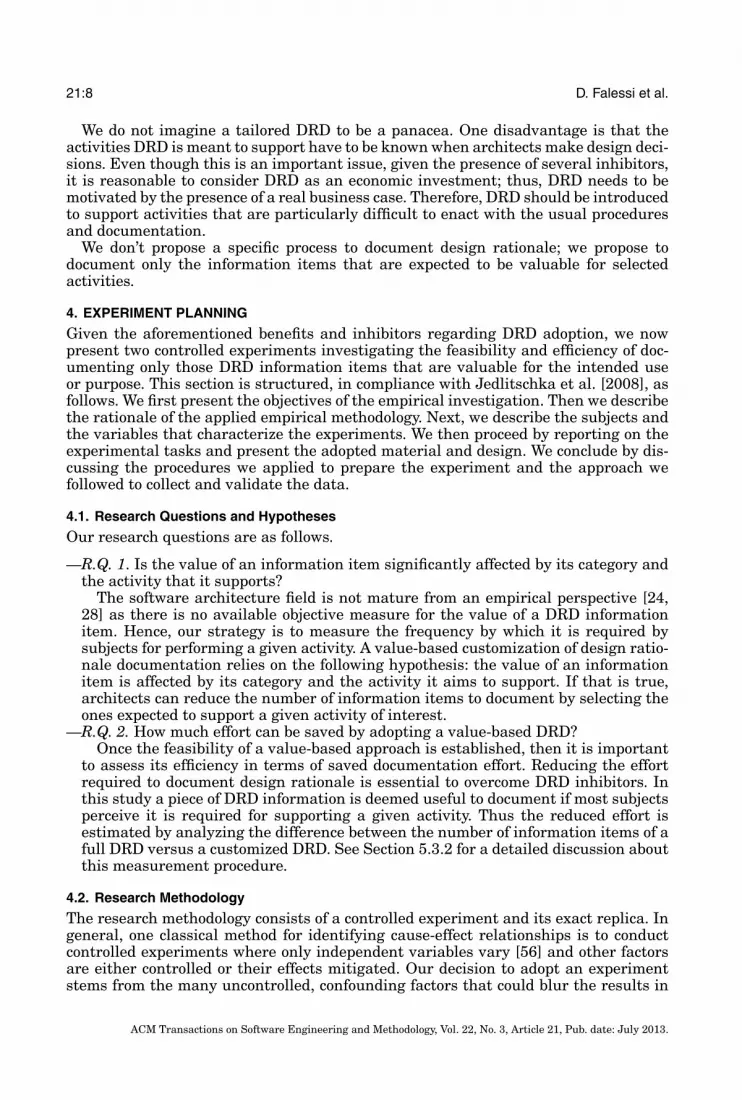
In the past, research goals focused on maximizing the DRD consumer’s benefit byforcing the producer to document all the information potentially useful for all activities.The DRD is about making the decision-making process reusable. In the software reusearea, it is agreed that focusing the investment on the most valuable asset to reuse isa key factor for a successful reuse strategy [Clements et al. 2005; Favaro et al. 1998;John et al. 2006]. Therefore, it is unrealistic to target all possible elements for reuse,for example, documenting all the information items of a DRD. While in past studies wehave evaluated the cost and benefits of DRD [Capilla et al. 2008; Falessi et al. 2006], inthe present study we empirically evaluate the feasibility of a trade-off between its costsand benefits. The key idea is to compromise between the cost to the producer and thebenefit to the consumer by achieving a value-based customization (see Figure 3), whichconsists in documenting only those information items that are likely to be valuable forthe intended purpose.
ACM Transactions on Software Engineering and Methodology, Vol. 22, No. 3, Article 21, Pub. date: July 2013.
21:8 D. Falessi et al.
We do not imagine a tailored DRD to be a panacea. One disadvantage is that theactivities DRD is meant to support have to be known when architects make design deci-sions. Even though this is an important issue, given the presence of several inhibitors,it is reasonable to consider DRD as an economic investment; thus, DRD needs to bemotivated by the presence of a real business case. Therefore, DRD should be introducedto support activities that are particularly difficult to enact with the usual proceduresand documentation.
We don’t propose a specific process to document design rationale; we propose todocument only the information items that are expected to be valuable for selectedactivities.
4. EXPERIMENT PLANNING
Given the aforementioned benefits and inhibitors regarding DRD adoption, we nowpresent two controlled experiments investigating the feasibility and efficiency of doc-umenting only those DRD information items that are valuable for the intended useor purpose. This section is structured, in compliance with Jedlitschka et al. [2008], asfollows. We first present the objectives of the empirical investigation. Then we describethe rationale of the applied empirical methodology. Next, we describe the subjects andthe variables that characterize the experiments. We then proceed by reporting on theexperimental tasks and present the adopted material and design. We conclude by dis-cussing the procedures we applied to prepare the experiment and the approach wefollowed to collect and validate the data.
4.1. Research Questions and Hypotheses
Our research questions are as follows.
—R.Q. 1. Is the value of an information item significantly affected by its category andthe activity that it supports?
The software architecture field is not mature from an empirical perspective [24,28] as there is no available objective measure for the value of a DRD informationitem. Hence, our strategy is to measure the frequency by which it is required bysubjects for performing a given activity. A value-based customization of design ratio-nale documentation relies on the following hypothesis: the value of an informationitem is affected by its category and the activity it aims to support. If that is true,architects can reduce the number of information items to document by selecting theones expected to support a given activity of interest.
—R.Q. 2. How much effort can be saved by adopting a value-based DRD?Once the feasibility of a value-based approach is established, then it is important
to assess its efficiency in terms of saved documentation effort. Reducing the effortrequired to document design rationale is essential to overcome DRD inhibitors. Inthis study a piece of DRD information is deemed useful to document if most subjectsperceive it is required for supporting a given activity. Thus the reduced effort isestimated by analyzing the difference between the number of information items of afull DRD versus a customized DRD. See Section 5.3.2 for a detailed discussion aboutthis measurement procedure.
4.2. Research Methodology
The research methodology consists of a controlled experiment and its exact replica. Ingeneral, one classical method for identifying cause-effect relationships is to conductcontrolled experiments where only independent variables vary [56] and other factorsare either controlled or their effects mitigated. Our decision to adopt an experimentstems from the many uncontrolled, confounding factors that could blur the results in
ACM Transactions on Software Engineering and Methodology, Vol. 22, No. 3, Article 21, Pub. date: July 2013.

The Value of Design Rationale Information 21:9
an industrial context. Thus, in order to assess the feasibility and potential benefits ofa value-based DRD we enacted a controlled experiment involving masters students incomputer and electrical engineering at the University of Rome Tor Vergata (Italy).
In general, the purpose of replication is to help the research community build knowl-edge about which results hold under which conditions [Basili et al. 1999]. In an exactreplica, changes to the original experiment concern only the context in which the studyis conducted (e.g., population, languages, etc.) and not the procedure that the subjectsfollow [Shull et al. 2008]. Its main benefit is to help mature the software engineer-ing body of knowledge by addressing both conclusion and internal validity problemsin existing experiments. Regarding internal validity, an exact replica aims to confirmthat the variables taken into account (i.e., the replicated ones) are the ones influencingresults [Shull et al. 2008]. In other words, an exact replica providing a result differentfrom the original experiment would suggest the existence of unknown, confoundingvariables. Regarding conclusion validity, an exact replica increases statistical power byproviding further data to analyze, together with the original experiment.
Therefore, in order to increase our confidence in the results, we ran an exact replica[Shull et al. 2008] of our controlled experiment at the Rey Juan Carlos University ofMadrid (URJC) in Spain.
Though we did not change the experimental settings, there are some minor differ-ences among the experiment and its replica: the subjects’ background was computerengineering and computer science in the experiment and replica, respectively. More-over the experimental material was translated from Italian to Spanish.
4.3. Experimental Units
Fifty graduate students belonging to a master’s course in computer engineering at theUniversity of Rome TorVergata (Rome) participated in the experiment. Twenty-fivegraduate students belonging to a master’s course in computer science at the Rey JuanCarlos University (URJC) participated in the replica.
All the students attended extensive teaching on the various phases of the softwarelifecycle through their bachelor and master courses, including requirements engineer-ing and software architecture analysis and design. Some of the students had industrialexperience or worked as private consultants.
Because the use of students as subjects can be considered as one of the main threatsto validity of the present study, we provide a detailed discussion of this issue inSection 5.3.4.
4.4. Variables
The output and dependent variable is the value of an information item in a DRD. Valuerepresents the level of support it is perceived to provide by the subjects for performingan activity. We measure the value on a 3-point ordinal scale (useless, optional, orrequired), for each specific information item, after having executed an activity. Thismeasurement mechanism is based on the subjective theory of value [Cox 1997]: thevalue is based on the needs of subjects using an object (i.e., DRD) rather than onthe inherent importance of the object itself. An alternative measurement mechanismwas taken in Falessi et al. [2006] where the impact of DRD was measured by itsinfluence on decision correctness. Since multiple DRD categories have a confoundingeffect on decision correctness, the theory of subjective value is the only viable option todiscriminate among the value of DRD information categories.
Among the independent variables, we considered the following two factors.
(1) The activity performed by subjects (Activity). Since we had: (1) 5 and 25 subjects inthe original experiment and replica, respectively, (2) up to five areas of expertise (as
ACM Transactions on Software Engineering and Methodology, Vol. 22, No. 3, Article 21, Pub. date: July 2013.

21:10 D. Falessi et al.
detailed in Section 4.7), and (3) the need to make the design as balanced as possible,we decided to use five activities. Among all possible relevant activities [Kruchtenet al. 2006], we selected the five activities based on the level of expected validitythreats given the available experiment time and the subjects’ experience. Suchan expectation was based on our experience in conducting similar experiments incontrolled environments and with master students [Capilla et al. 2008; Falessi andCantone 2006; Falessi et al. 2006, 2007]. Specifically we analyzed the following fiveactivities:—Detecting wrong aspects in decisions. Which characteristics of the chosen decision
are wrong?—Detecting requirements misunderstandings. Which characteristics of the problem
to address have been misunderstood?—Checking design: verification and evaluation. Do you approve the decision made?—Detecting conflicts between new requirements and an old decision. Is the old
decision still valid for the new set of requirements?—Evaluating impact. What is the impact of new requirements on the system?
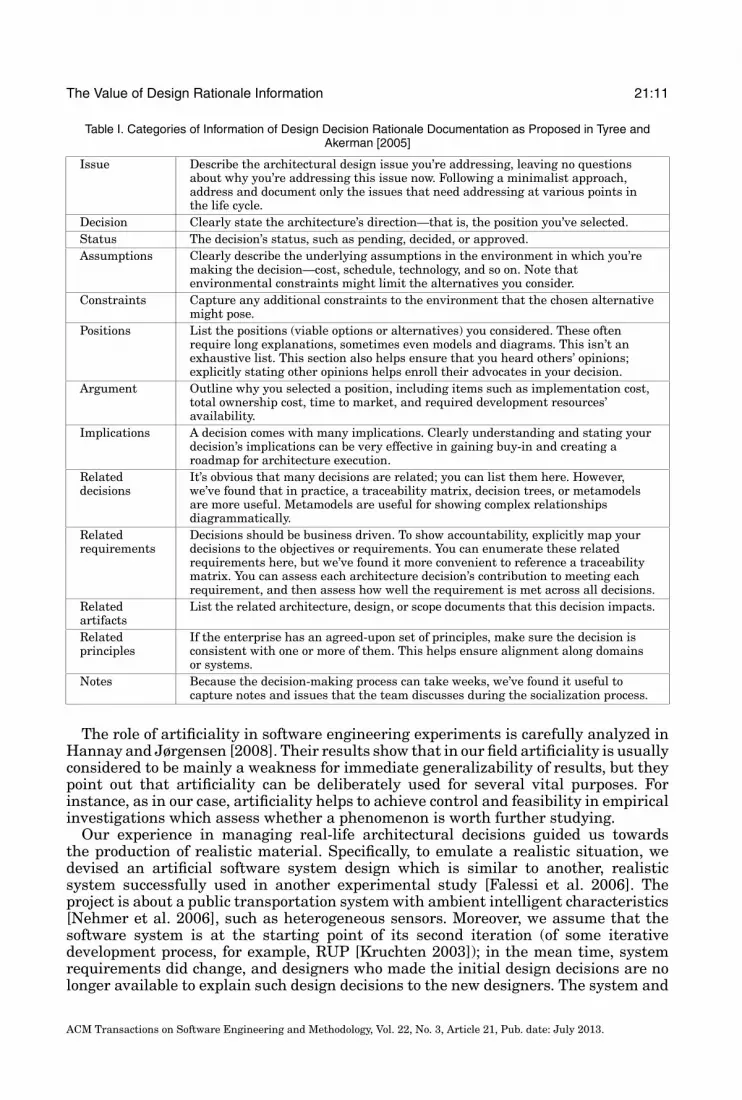
(2) The category of the information item (Category). In the present study we assigned13 levels to this factor (Table I) as proposed by Tyree and Akerman [2005] fordocumenting design decisions.
4.5. Tasks
This work concerns the study of the impact of DRD on architecture-relevant decisions.Therefore, decisions are the units of analysis and the experimental tasks are activitiesinvolving such decisions based on DRD. Specifically, during the experiment, subjectsreceived the description of a system (e.g., similar to a vision document in RUP [Kruchten2003]) and a set of five decisions and their DRD. Each subject performed one activityon each decision in the experiment and five activities on each decision in the replica.See the list of activities in Section 4.4 for further details. For each of the five decisions,the subjects had to execute the following steps.
—Understand the activity.—Note the starting time.—Read and understand the DRD related to a specific decision.—Execute the activity and write the requested answer. Note that, though the answer’s
correctness is not relevant for our research questions, we need to ensure that subjectscompleted the activities assigned to them.
—Note the ending time. Note that this data is not needed for addressing our researchquestions but only for data quality assurance.
—For each DRD category, score how much support DRD provided to the activity: use-less, optional, or required.
Steps 2 and 5 are needed to check the correctness of the order of execution of theactivities, as we detail in Section 4.10.
4.6. Experimental Material
The experimental material was created by the authors of this article with the aim toachieve realism. However, we chose to use artificial design elements instead of realones given the time constraints of a controlled environment and the need to focus onmechanisms (i.e., DRD) and phenomena (i.e., decision making) of interest. Specifically,we focused on the decision-making activity and DRD artifacts, while neglecting other,possibly relevant activities and types of artifacts. In our context, this meant creatingdecisions, and related DRD, that would enable realistic decision-making activities with-out needing further types of documentation and without involving further activities.
ACM Transactions on Software Engineering and Methodology, Vol. 22, No. 3, Article 21, Pub. date: July 2013.
The Value of Design Rationale Information 21:11
Table I. Categories of Information of Design Decision Rationale Documentation as Proposed in Tyree andAkerman [2005]
Issue Describe the architectural design issue you’re addressing, leaving no questionsabout why you’re addressing this issue now. Following a minimalist approach,address and document only the issues that need addressing at various points inthe life cycle.
Decision Clearly state the architecture’s direction—that is, the position you’ve selected.Status The decision’s status, such as pending, decided, or approved.Assumptions Clearly describe the underlying assumptions in the environment in which you’re
making the decision—cost, schedule, technology, and so on. Note thatenvironmental constraints might limit the alternatives you consider.
Constraints Capture any additional constraints to the environment that the chosen alternativemight pose.
Positions List the positions (viable options or alternatives) you considered. These oftenrequire long explanations, sometimes even models and diagrams. This isn’t anexhaustive list. This section also helps ensure that you heard others’ opinions;explicitly stating other opinions helps enroll their advocates in your decision.
Argument Outline why you selected a position, including items such as implementation cost,total ownership cost, time to market, and required development resources’availability.
Implications A decision comes with many implications. Clearly understanding and stating yourdecision’s implications can be very effective in gaining buy-in and creating aroadmap for architecture execution.
Relateddecisions
It’s obvious that many decisions are related; you can list them here. However,we’ve found that in practice, a traceability matrix, decision trees, or metamodelsare more useful. Metamodels are useful for showing complex relationshipsdiagrammatically.
Relatedrequirements
Decisions should be business driven. To show accountability, explicitly map yourdecisions to the objectives or requirements. You can enumerate these relatedrequirements here, but we’ve found it more convenient to reference a traceabilitymatrix. You can assess each architecture decision’s contribution to meeting eachrequirement, and then assess how well the requirement is met across all decisions.
Relatedartifacts
List the related architecture, design, or scope documents that this decision impacts.
Relatedprinciples
If the enterprise has an agreed-upon set of principles, make sure the decision isconsistent with one or more of them. This helps ensure alignment along domainsor systems.
Notes Because the decision-making process can take weeks, we’ve found it useful tocapture notes and issues that the team discusses during the socialization process.
The role of artificiality in software engineering experiments is carefully analyzed inHannay and Jørgensen [2008]. Their results show that in our field artificiality is usuallyconsidered to be mainly a weakness for immediate generalizability of results, but theypoint out that artificiality can be deliberately used for several vital purposes. Forinstance, as in our case, artificiality helps to achieve control and feasibility in empiricalinvestigations which assess whether a phenomenon is worth further studying.
Our experience in managing real-life architectural decisions guided us towardsthe production of realistic material. Specifically, to emulate a realistic situation, wedevised an artificial software system design which is similar to another, realisticsystem successfully used in another experimental study [Falessi et al. 2006]. Theproject is about a public transportation system with ambient intelligent characteristics[Nehmer et al. 2006], such as heterogeneous sensors. Moreover, we assume that thesoftware system is at the starting point of its second iteration (of some iterativedevelopment process, for example, RUP [Kruchten 2003]); in the mean time, systemrequirements did change, and designers who made the initial design decisions are nolonger available to explain such design decisions to the new designers. The system and
ACM Transactions on Software Engineering and Methodology, Vol. 22, No. 3, Article 21, Pub. date: July 2013.

21:12 D. Falessi et al.
Table II. Form that Subjects Filled in During the Experiment
Order Answer Value of DRD informationActivity Initial
TimeAnswer Final
TimeIssue
Decson
Status
AssumPtons
Constrants
Postons
Argument
ImPl catons
Relateddecsons
Relatedrequrements
Relatedart facts
RelatedPrncPles
Notes
12345
Each cell in the columns 5 to 17 describes the value, as perceived by subjects (useless, optional, orrequired), of a given DRD category (column), for supporting a given activity (row).
the high-level requirements are described via a document in Word R©similar to a visiontype of document in RUP. All the material we used was in native languages, Italianand Spanish in the original experiment and replica, respectively.
Concerning the requirements changes driving the activities, we selected commonchange causes such as: (1) variations in industrial strategic partnerships, (2) changes incustomer requests resulting from experience using the previous version of the product,and (3) technology advances. One key point is that performing the selected activities(Section 4.4) requires to rereason about the decisions made during the first iteration ofthe project.
We adopted a total of 25 decisions in order to mitigate the influence of any individualdecision on the empirical results. These 25 decisions are all, in some sense, architecturaldecisions; for example:
—the selection of a communication protocol depends on the topology of the nodes,the specific communication mechanism (e.g., publish-subscribe or event-driven), andarchitectural style (e.g., blackboard or client-server);
—the selection of a data storage mechanism depends on the type of DBMS, the com-munication protocol, and the architectural pattern (e.g., MVC).
Further drivers for architectural decisions included: available budget, desired compat-ibility, maintainability, scalability, and security. Constraints, requirements (new andold), rationale, and related decisions (and their status) are described in the providedDRD.
Table II shows the form that subjects filled out during the experiment for a givendecision. The first column describes the activity to execute. The following three columnsdescribe the initial time, the output of the activity (answer, column 3), and the finaltime when the activity was completed, respectively. Columns 5 to 17 describe 13 levels
ACM Transactions on Software Engineering and Methodology, Vol. 22, No. 3, Article 21, Pub. date: July 2013.

The Value of Design Rationale Information 21:13
of value: columns identify the category; rows identify the activity. Thus, each cell inthe columns 5 to 17 describes the value, as perceived by subjects (useless, optional, orrequired), of a given category (column), for supporting a given activity (row).
4.7. Design
We designed the experiment to make the best possible use of available subjects. Inparticular, using an artificial project related to ambient intelligence allowed us to modelfive different areas of expertise: authentication, human interface, operating system,communication protocol, and data storage. Then, subjects expressed their preferencesfor each area according to their previous experience and level of confidence. Afterwards,we assigned one area of expertise to each subject and the same number of subjectsper area, by satisfying subjects’ preferences to the maximum extent possible. Thisprocedure aimed at ensuring that subjects had sufficient ability and level of confidencein the task to perform. We then prepared five design decisions for each area of expertise.Therefore, each subject dealt with the five decisions pertaining to the assigned area ofexpertise.
Finally, we designed the experiment to balance the following.
—Number of activities. All treatments (i.e., the activities described in Section 4.4) havebeen applied the same number of times on all decisions. This mitigates the influenceof specific activities and decisions on the empirical results.
—Order of activities. All activities have been applied the same number of times in allpossible orders (i.e., first to fifth). This mitigates the influence of the order in whichthe treatments are applied on the results.
—Original vs. replica. There is only one small difference between the original experi-ment and its replica. In the original experiment the subjects performed one activityper decision on five decisions. In the replica, to obtain more observations, subjectsperformed all five activities on each of the five decisions.
4.8. Execution Preparation
The training phase was performed in three sessions of a total of five hours. Duringthe training we taught the concepts of design decisions and design rationale, and theimportance of capturing such knowledge. Then, we described the basis and the steps ofthe controlled experiment and how it would be carried out. We clearly explained almostall the experiment characteristics though we hid the experimenters’ expectations.
We carefully checked for the attendance of the subjects to all the training sessions. Asa result, some students were excluded because they did not attend one or more trainingsessions. In the end, we had 51 and 27 students that could be considered properlytrained for the experiment and the replica, respectively. Because the experiment wasdesigned to be balanced with 25 and 50 subjects, then, to compensate for possiblesubject absence in the experiment, we randomly selected one and two students asspares for the experiment and replica, respectively.
4.9. Execution Deviations
While conducting the experiment and the replica, no particular deviation from theirplan was observed. The experiment was designed to have a suitable number of activityexecutions given the realistic time a masters student is willing to spend in a controlledenvironment. Subjects had no time constraints. The original experiment and its replicalasted about 90 and 150 minutes, respectively; this difference is explained by the highernumber of activities performed by subjects in the replica.
Regarding the experiment, on one occasion where a subject was absent, we replacedhim with one of the spare subjects, thus preserving the experiment balance.
ACM Transactions on Software Engineering and Methodology, Vol. 22, No. 3, Article 21, Pub. date: July 2013.
21:14 D. Falessi et al.
4.10. Dataset Collection and Validation
In the original experiment, 50 subjects performed five activities (1 activity per decision)thus yielding 250 observations. Because for each performed activity we had a setof 16 answers to collect (initial time, answer, the value of each of 13 informationcategories, and final time), the experiment produced around 4,000 data items, 3,250 ofwhich represent values of DRD information items (13 information items on 250 activityexecutions). Similarly because in the replica we had 25 subjects enacting 25 activities(five activities per decision), the replica produced 10,000 data items, 8,125 of whichrepresenting values of DRD information items. The total number of data items istherefore 14,000; 11,375 of which represent values related to DRD information items.
To detect and correct mistakes during the data transcription, we checked the datathree times. Moreover, we applied some sanity checks based on simple automatic tech-niques. For example, for each form, the “initial time” for enacting an activity is checkedto: (i) precede the “final time” of the same activity, and (ii) follow the “final time” ofthe previous activity. As a result we excluded few invalid data points from any furtheranalysis.
5. RESULTS AND INTERPRETATION
5.1. R.Q. 1
Is the value of an information item significantly affected by its category and the activitythat it supports?
5.1.1. Analysis Procedure. Remember that the original experiment and its replica differonly in the number of activities executions, that is, five versus twenty-five. Because thetraining, the design, the activity, the decisions, and the type of subjects were the samein the original experiment and its replica, we decided to merge their data to maximizestatistical power. However, we also investigated the consistency of their results asdiscussed in last paragraph of this subsection.
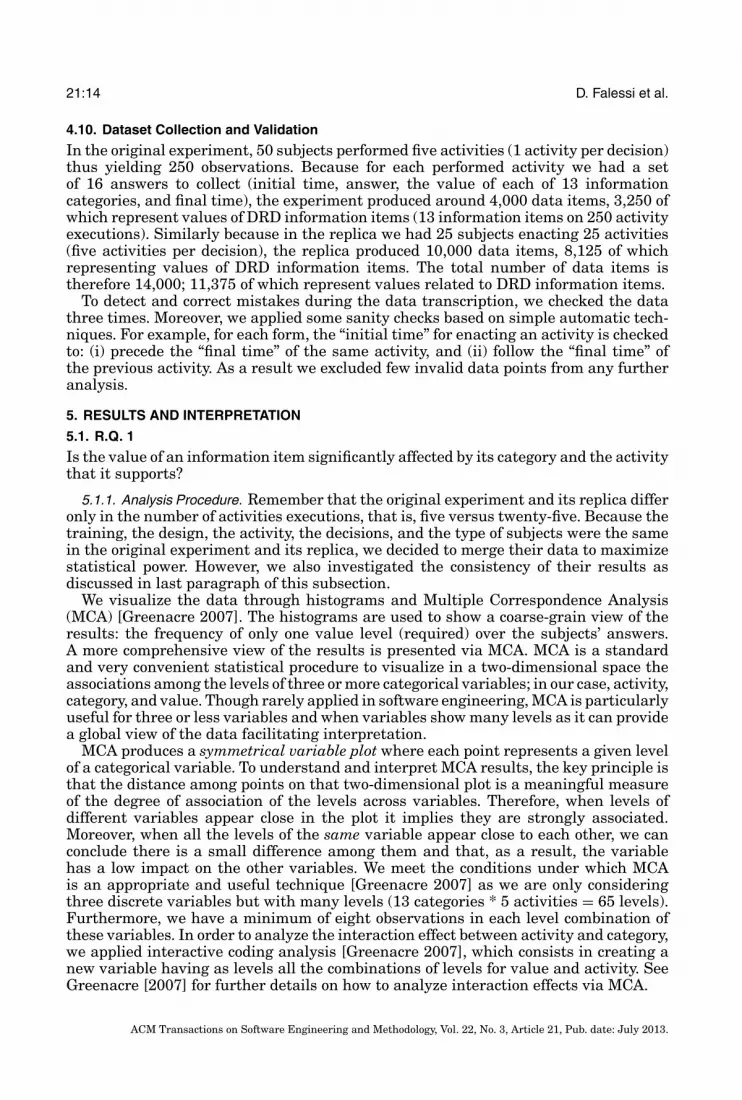
We visualize the data through histograms and Multiple Correspondence Analysis(MCA) [Greenacre 2007]. The histograms are used to show a coarse-grain view of theresults: the frequency of only one value level (required) over the subjects’ answers.A more comprehensive view of the results is presented via MCA. MCA is a standardand very convenient statistical procedure to visualize in a two-dimensional space theassociations among the levels of three or more categorical variables; in our case, activity,category, and value. Though rarely applied in software engineering, MCA is particularlyuseful for three or less variables and when variables show many levels as it can providea global view of the data facilitating interpretation.
MCA produces a symmetrical variable plot where each point represents a given levelof a categorical variable. To understand and interpret MCA results, the key principle isthat the distance among points on that two-dimensional plot is a meaningful measureof the degree of association of the levels across variables. Therefore, when levels ofdifferent variables appear close in the plot it implies they are strongly associated.Moreover, when all the levels of the same variable appear close to each other, we canconclude there is a small difference among them and that, as a result, the variablehas a low impact on the other variables. We meet the conditions under which MCAis an appropriate and useful technique [Greenacre 2007] as we are only consideringthree discrete variables but with many levels (13 categories * 5 activities = 65 levels).Furthermore, we have a minimum of eight observations in each level combination ofthese variables. In order to analyze the interaction effect between activity and category,we applied interactive coding analysis [Greenacre 2007], which consists in creating anew variable having as levels all the combinations of levels for value and activity. SeeGreenacre [2007] for further details on how to analyze interaction effects via MCA.
ACM Transactions on Software Engineering and Methodology, Vol. 22, No. 3, Article 21, Pub. date: July 2013.

The Value of Design Rationale Information 21:15
Table III. Abbreviations and Results of Multiple Correspondence Analysis (MCA)
Variable Treatment Abbreviation F1 F2
Category
Issue CatIs −28.225 3.257Decision CatD −34.549 46.667Status CatS −4.362 −18.965Assumptions CatAs −8.528 −33.270Constraints CatC 18.700 0.828Positions CatP −15.078 −12.607Argument CatAr −19.953 −3.181Implications CatIm 8.872 −3.979Related decisions CatRD −9.133 −5.353Related requirements CatRR −20.438 15.138Related artifacts CatRA 37.141 9.952Related principles CatRP 22.678 −30.388Notes CatN 52.876 31.902
Activity
1: Wrong solution space A1 −3.973 4.4612: Wrong problem space A2 −6.480 6.6943: Decision verification A3 9.388 8.0564: Conflicts detection A4 −0.010 −2.4925: Impact evaluation A5 1.064 −16.715
ValueRequired VR −74.422 41.726Optional VO −3.504 −77.388Useless VU 83.001 26.514
For statistically testing the impact of activity and category on value we applied logis-tic regression for ordinal response variables (value in our case) with activity, category,and their interaction term as explanatory variables [Hosmer and Lemeshow 2000].The significance of the effect of each explanatory variable is tested using the stan-dard likelihood ratio chi-square test [Hosmer and Lemeshow 2000]. We meet the datarequirements as the sample size is large enough, with 11,000 observations.
In order to analyze the difference between the results of the controlled experimentand its replica we apply two independent MCA analyses based on their two respectivedata sets. We then plot the results of both analyses in one MCA symmetric variableplot to assess the variation in positions for all category and activity levels. The higherthe distance for each pair of points corresponding to the same level but a differentexperiment, the more inconsistent the results. We want to assess whether the mainconclusions are the same for both experiments.
5.1.2. Results. Table III describes the results of MCA in a standard form: the coor-dinates of each level of each variable in the symmetric variable plot, as depicted inFigure 3. In Figure 3, F1 and F2 are the coordinates in the plot produced by MCA[Greenacre 2007]. The “Required” Value level (VR) is in the top-left quadrant andthe closer the category and activity levels to this point, the stronger their statisticalassociation with it. For example, category Related Requirement (CatRR) is stronglyassociated with value Required (VR), therefore suggesting that “related requirements”is a very important piece of design rationale information. Similarly, category RelatedArtifact (CatRA) is closely associated with value Useless (VU), thus suggesting that“related artifacts” is not a very relevant piece of information. Figure 4 also shows ac-tivity levels to be much closer to the center, thus showing that activity does not explainnearly as much of the variation in value as category does.
Regarding the interaction effect between activity and category, because the newvariable created for the interactive coding analysis has a very high number of
ACM Transactions on Software Engineering and Methodology, Vol. 22, No. 3, Article 21, Pub. date: July 2013.
21:16 D. Falessi et al.
CatIs
CatD
CatS
CatAs
CatC
CatP
CatAr CatImCatRD
CatRR
CatRA
CatRP
CatN
A1A2 A3
A4
A5
VR
VO
VU
-1.5
-1
-0.5
0
0.5
1
1.5
2
-2 -1.5 -1 -0.5 0 0.5 1 1.5 2 2.5
F2
F1
Symmetric variable plot
Fig. 4. Graphical results of multiple correspondence analysis.
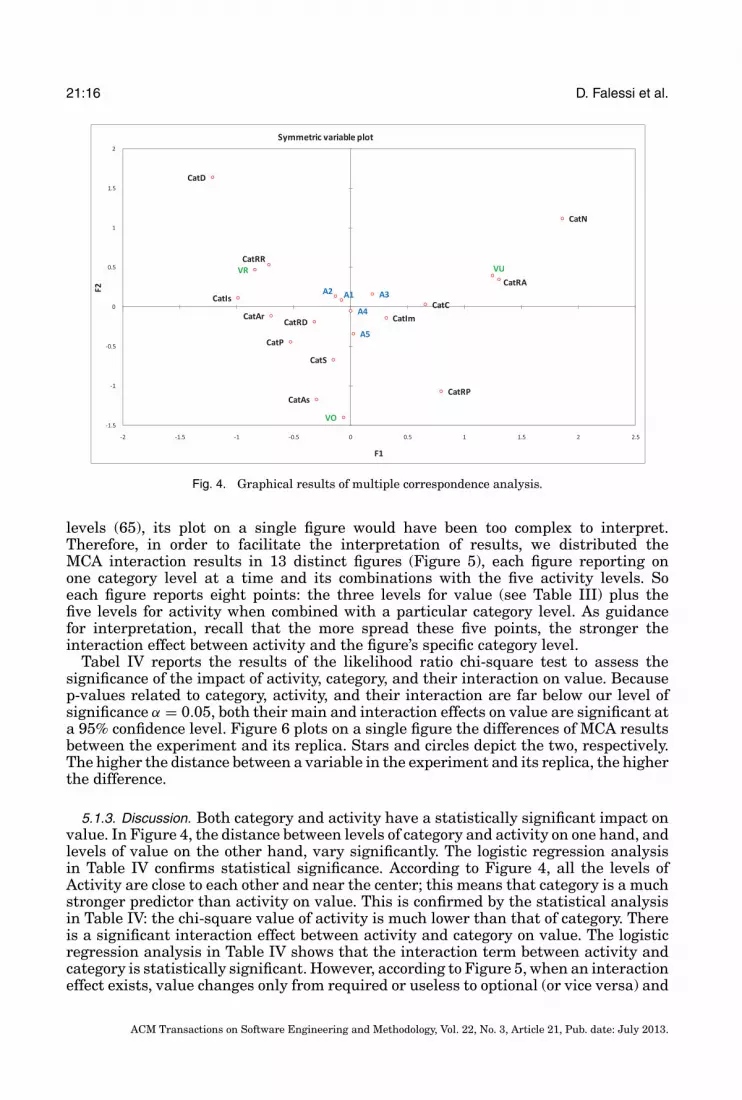
levels (65), its plot on a single figure would have been too complex to interpret.Therefore, in order to facilitate the interpretation of results, we distributed theMCA interaction results in 13 distinct figures (Figure 5), each figure reporting onone category level at a time and its combinations with the five activity levels. Soeach figure reports eight points: the three levels for value (see Table III) plus thefive levels for activity when combined with a particular category level. As guidancefor interpretation, recall that the more spread these five points, the stronger theinteraction effect between activity and the figure’s specific category level.
Tabel IV reports the results of the likelihood ratio chi-square test to assess thesignificance of the impact of activity, category, and their interaction on value. Becausep-values related to category, activity, and their interaction are far below our level ofsignificance α = 0.05, both their main and interaction effects on value are significant ata 95% confidence level. Figure 6 plots on a single figure the differences of MCA resultsbetween the experiment and its replica. Stars and circles depict the two, respectively.The higher the distance between a variable in the experiment and its replica, the higherthe difference.
5.1.3. Discussion. Both category and activity have a statistically significant impact onvalue. In Figure 4, the distance between levels of category and activity on one hand, andlevels of value on the other hand, vary significantly. The logistic regression analysisin Table IV confirms statistical significance. According to Figure 4, all the levels ofActivity are close to each other and near the center; this means that category is a muchstronger predictor than activity on value. This is confirmed by the statistical analysisin Table IV: the chi-square value of activity is much lower than that of category. Thereis a significant interaction effect between activity and category on value. The logisticregression analysis in Table IV shows that the interaction term between activity andcategory is statistically significant. However, according to Figure 5, when an interactioneffect exists, value changes only from required or useless to optional (or vice versa) and
ACM Transactions on Software Engineering and Methodology, Vol. 22, No. 3, Article 21, Pub. date: July 2013.
The Value of Design Rationale Information 21:17
(a) DRD category Argument (b) DRD category Assumptions
(c) DRD category Constraints (d) DRD category Decision
(e) DRD category Implications (f) DRD category Issue
Fig. 5. Interaction effect analysis through multiple correspondence analysis.
never from useless to required (or vice versa). This means that, even when present, theinteraction effect has a limited effect on value.
Based on the analysis results, the categories of design rationale documentation canbe divided into three groups.
ACM Transactions on Software Engineering and Methodology, Vol. 22, No. 3, Article 21, Pub. date: July 2013.
21:18 D. Falessi et al.
(g) DRD category Notes (h) DRD category Positions
(i) DRD category Related artifacts (l) DRD category Related decisions
(m) DRD category Related principles (n) DRD category Related requirements
Fig. 5. (Continued)
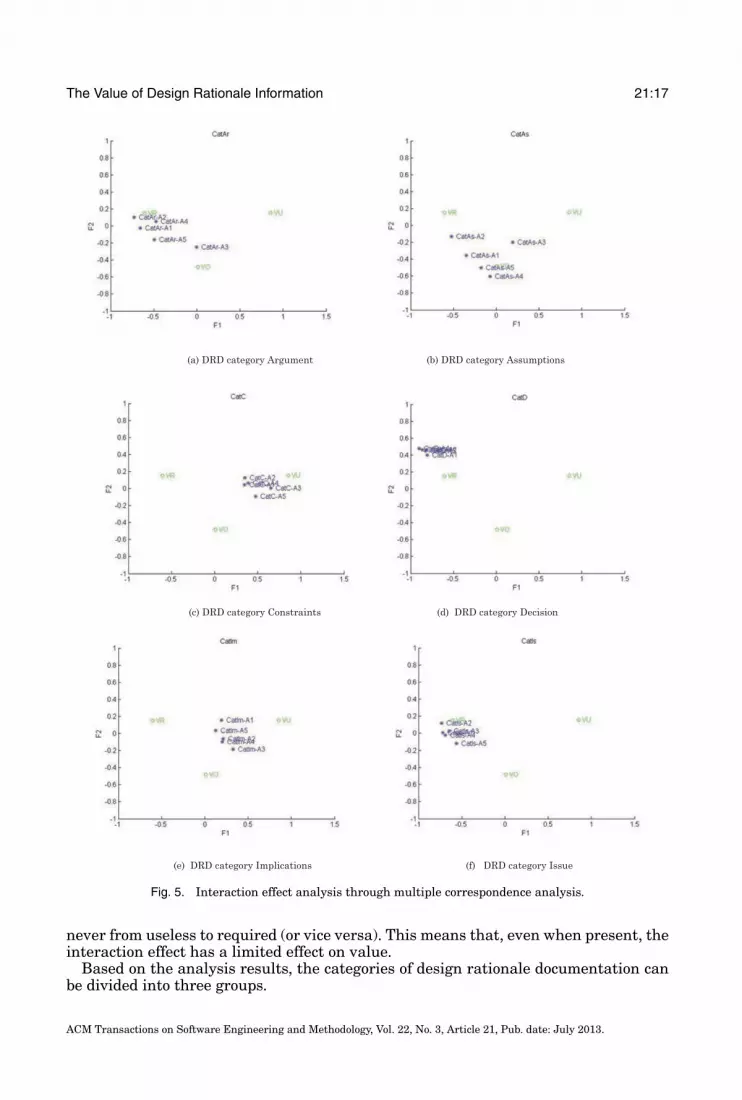
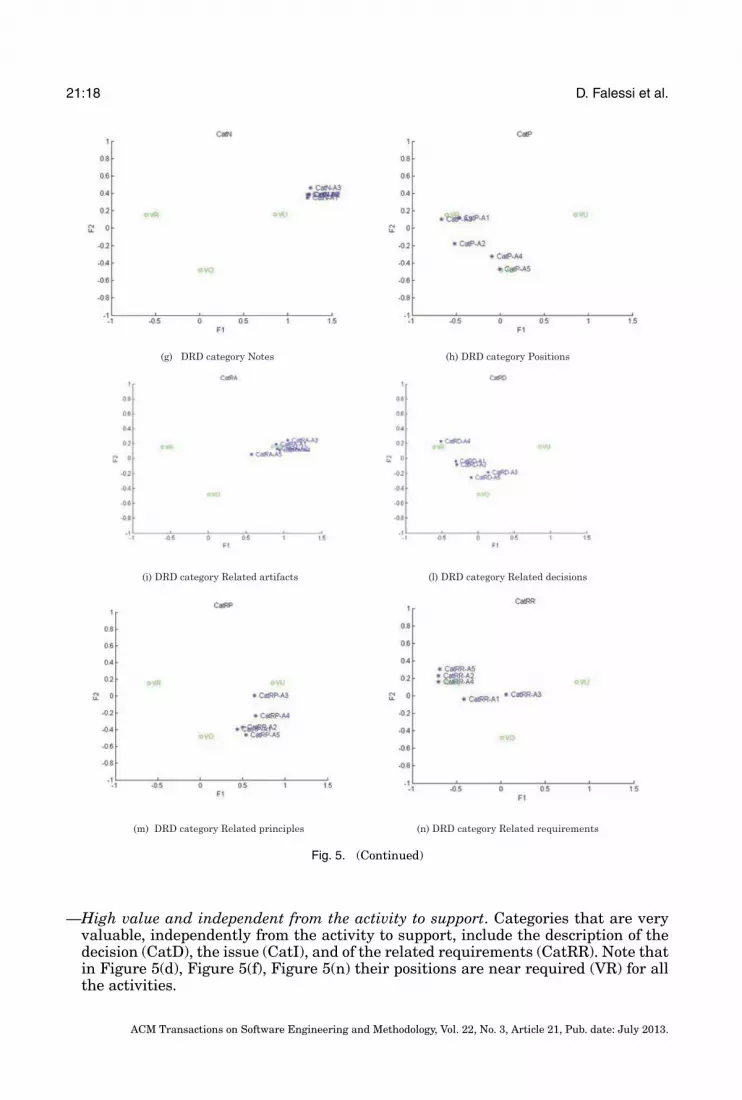
—High value and independent from the activity to support. Categories that are veryvaluable, independently from the activity to support, include the description of thedecision (CatD), the issue (CatI), and of the related requirements (CatRR). Note thatin Figure 5(d), Figure 5(f), Figure 5(n) their positions are near required (VR) for allthe activities.
ACM Transactions on Software Engineering and Methodology, Vol. 22, No. 3, Article 21, Pub. date: July 2013.

The Value of Design Rationale Information 21:19
(o) DRD category Status
Fig. 5. (Continued)
Fig. 6. Difference between experiment and replica through multiple correspondence analysis.
—Low value and independent from the activity to support. Only one category showslittle usefulness regardless of the activity to support: Notes. In Figure 5(g) all activ-ities are placed near VU (useless). We recall that the “Notes” category contains anyinformation that is not recorded in the other DRD categories. Because this categoryproves useless for all five activities, we can then conclude that the framework pro-posed by Tyree and Akerman [2005] is comprehensive and no additional informationneeds to be added for documenting a design decision.
ACM Transactions on Software Engineering and Methodology, Vol. 22, No. 3, Article 21, Pub. date: July 2013.

21:20 D. Falessi et al.
Table IV. Likelihood Ratio Chi-Square TestResults of the Effect of Category, Activity, and
Their Interaction on the Value of a DRDInformation Item
VariableLikelihood Ratio TestChiSquare P-value
Activity 45 �0.001Category 4251 �0.001Category*Activity 403 �0.001
—Ranging from high to low value according to the activity to support. The remainingcategories are only relevant for some of the activities to support. For instance, thecategory Positions (i.e., the description of the considered alternatives) provides valueonly when the activity to support is Decision verification or Wrong solution space. Onthe contrary, Positions is optional to support Impact evaluation; see in Figure 5(h)that Activity 5 is near Optional (VO). This makes intuitive sense as, given newrequirements, it is optional to know the set of considered alternatives; what is trulyrelevant is the chosen alternative.
There are only minor differences between the results of the controlled experiment andthe exact replica. Based on Figure 6, the position of the 13 categories did not signif-icantly vary. This is especially the case for those categories that were most stronglyassociated with value levels and further away from the center. For example, CatD andCatRR remain close to VR. Visible variations are for those categories near the centerthat have no strong association with any value level. This result suggests, for the mainassociations, that the results are consistent across the two experiments and thereforethat the data can be merged to enhance statistical power.
5.2. R.Q. 2. How much effort can be saved by adopting a value-based DRD?
5.2.1. Analysis and Results. In the absence of evidence showing actual differences inrequired effort among information items, we assume that the number of items of adesign rationale documentation is a good indicator of the relative effort. To computethe expected effort savings in adopting a value-based DRD, we compute the percentageof information items considered relevant and valuable for a given activity (value-basedDRD).
As explained before, a value-based DRD is composed of valuable information itemsonly. An information item is defined as valuable according to a threshold on value;in particular, a threshold on a given frequency of required among subjects’ scores.Adopting a medium threshold (frequency of required = 50%) results in documentingonly the information categories that are more likely than not to support the readers(i.e., the information categories that have been perceived at least half of the times tobe required by subjects). Though a medium threshold makes sense, we also analyzethe expected effort savings in relation to other thresholds. Obviously, the lower thethreshold, the higher the number of information items included in the value-basedDRD, the higher the required effort, the lower the probability that a subject wouldrequire an information item that is not included in the DRD. We consider five thresholdson value: lowest = value >0%, low = value >25%, medium = value >50%, high = value>75%, highest = value = 100%.
Figure 7 describes the number of information categories in the value-based DRDaccording to both the threshold on value and the activity to be supported (e.g., Impactevaluation). Figure 7 is composed of a histogram and a table. In the histogram, columnsshow, for each supported activity, the number of DRD information categories associated
ACM Transactions on Software Engineering and Methodology, Vol. 22, No. 3, Article 21, Pub. date: July 2013.

The Value of Design Rationale Information 21:21
Fig. 7. Amount of information items in a tailored DRD according to different thresholds on required.
with each frequency threshold for required. The table provides the exact number ofinformation categories for each percentage threshold. For instance, a value-based DRDfor the Decision verification activity (third column) with a medium threshold (frequencyof required = 50%, third row) requires only four information categories out of 13.
5.2.2. Discussion. Based on the third row in Figure 7, the number of information itemsincluded in a value-based DRD, tailored for a medium threshold, varies from 4 (thirdand fifth columns) to 8 (first column) depending on the activity to support. Therefore,the effort savings in documenting only valuable information items (i.e., categories thatare more likely to support the reader in a given activity) varies from a maximum of70% (Decision verification and Impact evaluation) to a minimum of 40% (Checkingwrong solution space). On average across activities, a value-based DRD includes only6 information items out of 13, that is 46% of a full documentation.
The significant reduction of information items to document is therefore expectedto mitigate the effects of inhibitors that are currently preventing practitioners fromdocumenting the rationale of their decisions. Though these results are generalizable
ACM Transactions on Software Engineering and Methodology, Vol. 22, No. 3, Article 21, Pub. date: July 2013.
21:22 D. Falessi et al.
only to the five activities we have adopted, they have practical relevance since theseactivities are of widespread importance.
5.3. Threats to Validity
In the following subsections we provide insights regarding the validity of the aforemen-tioned results based on the possible threats to validity as suggested in Falessi et al.[2010b] and Wohlin et al. [2000].
5.3.1. Conclusion Validity. Conclusion validity concerns the reliability of the observedrelations among the experimental variables [Juristo and Moreno 2006; Wohlin et al.2000].
Reliability of measures. Regarding research question 1, we considered the use of asubjective measure of value of a DRD information item, that is, the subjective opinionof the experiment subjects. However, in the current industrial and research practice,the architecting activity is inherently a human endeavor and hence is subjective innature. For instance, it is very hard to objectively judge if a design decision is corrector not [Falessi et al. 2010b]. In our specific context, in the absence of any availableobjective measure of the value of DRD information category, it is estimated by averagingsubjective values. Regarding research question 2, the magnitude of effort reduction iscomputed as the difference between the number of information items of a full DRDversus a customized DRD. But the actual effort saved by not documenting a DRDinformation category is significantly related to the technology in use where one categorycan be particularly easy or hard to document. Therefore, measuring the reduced effortas the number of reduced information items to document has the advantage to provideresults applicable to a wide range of contexts.
Replica independence. There is a low risk that researchers biased the replica resultssince the replica was enacted before executing a complete data analysis of the originalexperiment. Therefore, the original experiment results were unknown and could notbe communicated to the subjects of the replica. Second, the experiment results wouldhave been in any case difficult to communicate given the very high number of levels forvariables (13 DRD categories * 5 activities * 3 value levels = 195). In other words, itwould have been difficult to influence (consciously or unconsciously) the subjects of thereplica to provide a specific value, that was observed in the experiment, for a specificDRD category, in a given activity.
5.3.2. Internal Validity. Internal validity is the degree to which conclusions can be drawnregarding the causal effect of the independent variables on the dependent variables[Juristo and Moreno 2006; Wohlin et al. 2000]. The level of internal validity relatedto our experiment should be considered high since we balanced the order of activityexecutions and we randomized the application of treatments.
5.3.3. Construct Validity. Construct validity is the degree to which the independent vari-ables and dependent variables accurately measure the concepts they purport to mea-sure [Juristo and Moreno 2006; Wohlin et al. 2000]. This was addressed in multipleways.
Mono-operation bias. This was the threat with highest priority. To prevent experi-mental results from being too specific to the units of analysis (decisions), we adopted aset of 25 different decisions. Hence, since all the subjects performed all (five) activities,for each dependent variable we have a distribution composed of 250 data points.
Restricted generalizability across constructs. Regarding the proposed value-basedDRD, the present study analyzes its efficiency (i.e., documentation effort reduction)
ACM Transactions on Software Engineering and Methodology, Vol. 22, No. 3, Article 21, Pub. date: July 2013.
The Value of Design Rationale Information 21:23
without considering effectiveness. In other words, it may be unclear whether a reduceddocumentation negatively affects the output quality of the activity it supports. Ingeneral, the quality of a design decision (i.e., the activity output) is difficult to measure[Falessi et al. 2010b]. In this study, we indirectly and implicitly estimate effectivenessas the probability that a subject requires an information item that is included in thecustomized documentation.
Hypotheses guessing and experimenter expectancies. During the training sessions,we did not convey our expectations and hypotheses to participants.
Evaluation apprehension. We informed the subjects that they would not be person-ally evaluated based on their answers.
Low motivation. Subjects were not pressured to participate in the experiment. Weclearly explained that their course grade would not be related to their presence orperformance during the experiment. The subjects would not provide random answersbecause they knew that the examiners would ask for explanations during the examof the Empirical Software Engineering course. This is an approach we have success-fully adopted over several years in other experiments [Cantone et al. 2003; Falessiet al. 2010b, 2006; Falessi and Cantone 2006]. We observed a high level of commit-ment and concentration, as visible on the video we posted at: http://eseg.uniroma2.it/DDRD-Experiment-December2006.zip.
5.3.4. External Validity. External validity is the degree to which research results can begeneralized to other settings than the experiment one. Since the use of students assubjects may be interpreted as an important threat to external validity, we carefullydescribed the experimental process by following standard guidelines [Jedlitschka et al.2008] in order to enable replications in different and possibly more realistic contexts.The following list discusses how we addressed various external validity threats, withan emphasis on the experimental subjects and objects.
Experimental subjects. The main reason why we chose masters students as the sub-jects of our experiment is because we could properly train them to use the designrationale documentation, a documentation goal much harder to achieve with busypractitioners over a short period of time. Though the use of students may appear asserious threat to validity, a number of studies actually show that differences betweenstudents and practitioners may not be relevant. This is the case, for example, of stud-ies in the context of requirements selection [Svahnberg et al. 2008], assessment oflead-time impact [Host et al. 2000], and mental representation of programs [Holt et al.1987]. Whether this is the case for DRD activities is an open question. Furthermore, wemust note that about half of the subjects in our experiment had significant professionalexperience. In addition, most computer science and engineering courses include prac-tical exercises or projects and therefore masters students may not be so different fromjunior practitioners, as observed in Sjoberg et al. [2001a, 2001b]. Last, “the variationsamong students and variations among professionals may be so large that whether theperson is a student or a professional, may just be one of many characteristics of asoftware engineer” [Sjøberg et al. 2002].
Moreover, our experiment was designed to: (i) ensure that subjects had a reasonableability and level of confidence in the task to perform (see Section 4.7), and (ii) perfectlybalance the assignment of treatments to subjects; in this way, every treatment hasbeen applied by every subject and thus at all levels of experience.
We neither measure nor control the variable “experience” of subjects. The main mo-tivation for this decision is that experience has a broad and uncertain meaning in ourcontext. Therefore, any experience measure would probably be inadequate and would
ACM Transactions on Software Engineering and Methodology, Vol. 22, No. 3, Article 21, Pub. date: July 2013.

21:24 D. Falessi et al.
therefore provide misleading results. Moreover, the experiment is already complex asit is given the high number of input variables and levels: 13 DRD categories × 5 activ-ities × 3 utility levels = 195 levels. Therefore adding a variable would make the MCAresults less understandable. Finally, since an information item represents a piece ofknowledge, it is obvious that people with less experience or knowledge tend to requiremore information items than more experienced people. Therefore, more experiencedreaders require less documentation, which results in greater effort savings for docu-menting only the required information items. Consequently, assuming students haveless experience than practitioners, the effort savings in adopting a value-based DRDshould logically be expected to be higher in industrial contexts than in our experimen-tal setting. In other words, effort reduction brought by value-based DRD is expected tobe conservative when using students as experimental subjects.
Experimental material. In general, it is not possible to eliminate all the threats tovalidity; experimenters should prioritize them according to their context and researchquestion to address [Wohlin et al. 2000]. In particular, there is always a trade-offbetween realism and control [Dzidek et al. 2008]. We deliberately chose to use artificialartifacts given the time constraints of a controlled environment and the need to focusonly on the effects of DRD on decision making. Regarding the representativeness ofthe units of analysis, the decisions involved in the tasks were complex since they werecharacterized by several, opposite and interrelated objectives, as in realistic contexts.We decided to involve a large number of decisions (i.e., 25, five per role) in order tostudy the impact of activities in a somewhat independent manner from the specifics ofthe decisions to be made. In other words, we defined a large number of varied decisionsto achieve better external validity.
Experimental task. This work involves individual rather than team decision makingand does not account for decision making based on past releases or iterations of thesystem. But we would expect an even greater need for explicit decision rationale undersuch conditions. In other words, we expect the effects observed in our experiment to beminimal or conservative and this is why we recommend, in the next section, possiblesubsequent steps to perform industrial case studies where team decision making basedon information from past releases would take place.
6. THE WAY AHEAD
The maturity of empiricism in software engineering can be considered low whencompared to other scientific disciplines and the software architecture subfield is notan exception. During the last two decades, empirical software engineering researchhas gained in maturity and experience. For instance, the application of empiricismprovided significant advances in the area of software economics [Boehm 1981; Boehmand Sullivan 2000], software quality [Boehm et al. 2010; Shull et al. 2006], andvalue-based software engineering [Biffl et al. 2005]. During the same period, softwarearchitecture has emerged as an important field of software engineering for managingthe development and maintenance of large, software-intensive systems. Historically,most advances in software architecture have been driven by talented people andindustrial experience, but there is now a growing need to systematically gatherempirical evidence rather than just rely on promotional anecdotes or rhetoric [Oates2003]. Performing valid empirical software architecture research is still very harddue to the existence of several challenges caused by the inherent complexity of thesoftware architecture discipline [Falessi et al. 2010b].
Using a complex empirical setting, we report in this article two controlled experi-ments investigating if the value of information items in DRD documentation is influ-enced by its category and the activity it supports. Despite encouraging results, how
ACM Transactions on Software Engineering and Methodology, Vol. 22, No. 3, Article 21, Pub. date: July 2013.

The Value of Design Rationale Information 21:25
to make DRD cost effective in practice is certainly a complex question that cannot beanswered by any single (empirical) study, such as the one reported here.
In a controlled artificial setting, we cannot perform any cost-benefit analysis becausewe would need to account for several practical issues typically arising in real projects(as detailed shortly). But we can assess whether selective DRD can be potentially ben-eficial and is worth studying further in more realistic contexts. To be realistic, for anystudy, time and budget constraints make it impossible to run a fully realistic investiga-tion accounting for all variables that can potentially influence DRD cost effectiveness.The research community should follow an iterative process of creating and analyzingevidence, with the twofold aim of confirming well-defined theories and suggesting newones [Basili et al. 1999; Ragin 1989; Wohlin et al. 2000]. Our controlled experiments,like most in software engineering, took place in an artificial environment to prioritizecontrol over realism. There is significant work that remains to be done before the DRDcan achieve widespread adoption. This work nevertheless paves the way for futurecoordinated and integrated research efforts. Our controlled experiments can be seenas a first, fundamental step; but a collective and coordinated effort must be appliedby the research community [Basili et al. 1999]. Large effort should be spent in inte-grating results and planning subsequent observations. In general, future controlledexperiments should continue our work aiming at reducing the scope of the variablesinfluencing DRD cost effectiveness. Large-scale observational study should follow and,benefiting from reported experiments, should focus on the variables shown to be signif-icant, thus keeping their time and budget under control. For example, future studiesmay be restricted to only those DRD categories that have shown to be valuable inour experiments for certain activities. More specifically, future studies can proceed,based on the presented results, by following three orthogonal directions: independentvariables, and dependent variables and realistic context.
Independent variables: enlarging the scope. Because our study was the first one ex-ploring the variables that can possibly impact the value of DRD, we focused on themost intuitive aspects: supported activity and DRD category. Future studies can com-plement the present study by analyzing whether the following independent variablesimpact DRD cost effectiveness.
Phase of the software development lifecycle. The time in which a decision takes placecan significantly impact its value. Decisions taken in the early phases of the designhave intuitively a high impact on the overall project because subsequent decisions mustbe based on them. For instance, once a middleware has been selected, the choice of theprogramming language is partially restricted.
Decision-making technique. Decision making in software design is a reasoning pro-cess that consists in analyzing requirements and business/contextual constraints,choosing an alternative among feasible options, and assessing the solution as a whole.This process can be performed by individual subjects or teams [Falessi et al. 2006],by following or not a structured technique [Falessi et al. 2007]. This article focusedon individual decision making and without the use of any structured technique. Fu-ture studies may investigate which DRD categories are required by which team-baseddecision-making techniques. Moreover, the reasoning process characterizing decisionmaking in software design should be thoroughly investigated [Tang 2011].
Supported activities. This study focused on five specific activities in which a designermay benefit from DRD (Section 4.4). There may be further activities that have notbeen investigated in this article and are relevant in specific contexts. Examples of suchactivities are reported in Kruchten et al. [2006].
ACM Transactions on Software Engineering and Methodology, Vol. 22, No. 3, Article 21, Pub. date: July 2013.

21:26 D. Falessi et al.
Complementary documentation. The importance of a piece of information in the DRDmay vary according to the information already present in complementary documenta-tions such as traceability documents and architectural views. Documentation should beviewed as an investment and its cost effectiveness should be investigated by analyzingalso the interactions among the different types of documentation. Overlaps should beminimized and optimizing the set of used documentation should be investigated.
Application context. Software is used in a wide spectrum of contexts, from enter-tainment (e.g., games), to safety-critical systems (e.g., air traffic control systems), toapplets for smartphones. Some of the activities supported by DRD may be more or lessvital according to the application context. Since the value of DRD information itemshas shown to be dependent on the activity it supports, the same DRD information itemcould be more or less valuable based on the application context.
Realistic dependent variables. The business value of DRD. Though our experimentsshowed that a value-based DRD resulted into significant cost reduction, we were notin a position to study the business value of enforcing the production and use of suchdocumentation. This would require to measure both the real cost and the benefits ofDRD in realistic contexts. This is elaborated next.
Measuring cost. Our study showed that the size of DRD can be significantly reducedwithout unduly compromising its benefits. However, the high-value DRD categoriescould also be the most expensive ones, thus making effort savings less significant.However, given what we know now, that is very little, the first question to ask iswhether customized DRD is even worth studying. Moreover, we note that the cost ofa DRD category strictly depends on the technology supporting it (e.g., software tools).For example, a DRD category can be inexpensive when using an advanced technologythat is able to automatically record decision rationale, whereas the same DRD categorycan be very expensive in other contexts when manual tasks are involved. Therefore, inthis article we focus on the DRD value and leave it to the reader to assess, in context,her own cost-benefits trade-offs.
Measuring economic benefits. Our main purpose was to reveal the magnitude ofpotential differences in the values of an information item according to its categoryand the activity that it supports. Therefore, in this article we measured the value ofDRD categories via the theory of subjective value; see Section 4.4. We see this as afirst important step to pursue research on value-based DRD. Further analyses mustbe performed in real settings to understand when a good design decision is actuallyimportant enough to deserve the investment of documenting its rationale.
Measuring locality of DRD costs-benefits. The present study makes simplifying as-sumptions regarding where the DRD cost and benefits take place, mainly because thereis no reported empirical data on that topic. Specifically, here we assume the DRD pro-ducer as incurring cost for documenting rationale information and the DRD consumeras incurring value. If this assumption holds, DRD would have a dismal future re-gardless of the savings provided by a value-based customization strategy. Future fieldstudies should investigate the actual “locality” of both cost and benefits for DRD. Thisissue can’t be addressed in controlled settings but only via an industrial case study.
Context: from small and artificial to large and real. The high cost of conductingempirical studies tends to create a tension between control and realism; researchersalways struggle to find the right balance. Because analyzing all the possible interestingvariables in real development context is too expensive to be feasible, it is usual to firstproceed with controlled studies in artificial settings. Future studies can explore theuse of design rationale information in industrial settings, based on what was learned
ACM Transactions on Software Engineering and Methodology, Vol. 22, No. 3, Article 21, Pub. date: July 2013.

The Value of Design Rationale Information 21:27
in our controlled experiments. Specifically future studies may improve on the realismof the following aspects while focusing on the DRD categories that showed, for specificactivities, to be valuable.
Real objects. Our study intentionally made use of an artificial object of study, butwith as high a level of complexity as possible given the practical constraints of ourcontrolled experiments. Decision making and the value provided by DRD should beobserved and analyzed when applied in the context of realistic artifacts.
Real subjects. In this study, the use of students, though fully trained and competent,was opportunistic rather than intended. Further studies should involve professionaldesigners, though existing studies suggest that adequately trained students performas well as junior or intermediate consultants (see Section 5.3.4). Professional subjectsare an expensive resource, whose cost is a significant barrier to carrying out controlledempirical studies.
7. CONCLUSION
Documenting software design rationale is a strongly recommended practice: recordinga designer’s line of reasoning makes it possible to revisit it later in order to assessit, to approve it, or more simply to learn from it, with regards to either the systembeing designed or the decision process itself. But the methods and tools proposed sofar to document design rationale have not been very successful; they all tend to tryto maximize the benefits for the consumer of the rationale, at the expense of theproducer—that is the designer—and they are therefore too onerous for systematicindustrial use. In order to facilitate the industrial adoption of rationale documentationwe investigated how to reduce the amount of effort required from the producer side.
The underlying intuition of our work is that design rationale documentation can po-tentially be used in many activities (e.g., what-if analysis, avoiding design erosion) butnot all of them are enacted in every context. Therefore, documenting all the informationitems that support all the activities becomes somehow ineffective from a cost-benefitpoint of view; this eventually inhibits practitioners to document the rationale of theirdesign decisions. The key idea is that design rationale documentation should be in-troduced (for adoption) only to support those activities which are particularly hard toperform with the usual procedures and documentation.
Such value-based design rationale documentation is supposed to contain only the in-formation items that will be required, with a significant probability, to support a givenactivity. Therefore, the aim of the article was twofold: (1) validating the feasibility ofthe proposed customization strategy, (2) assessing its effectiveness by estimating theexpected effort savings. Specifically, in this article, we report on two controlled exper-iments that investigate whether the decision to document or exclude an informationitem in DRD should depend on its category and the activity it aims to support. Anefficient customization is essential because it provides a realistic means for mitigatingthe extra effort inhibitor of documenting design rationale.Our experimental resultsshow the following.
—The value of an information item is significantly affected by its category; moreover,different categories have different values for different activities. Therefore, it ispossible to prioritize the information items to document according to the categoryand the activities that design rationale documentation targets.
—On average, across activities, a value-based design rationale documentation contains46% of the information items in the full documentation. The maximum effort reduc-tion provided by a value-based design rationale documentation is 70% and concerns
ACM Transactions on Software Engineering and Methodology, Vol. 22, No. 3, Article 21, Pub. date: July 2013.

21:28 D. Falessi et al.
the “decision verification” activity: only 4 out of 13 information categories have beenshown to be required more than 50% of the time.
—Our experiment replication, performed in a different setting and geographical lo-cation, provided similar results to the original controlled experiment; this suggeststhat all the important variables have been taken into account in our experimentdesign.
Our results suggest that a value-based design rationale documentation facilitates itspractical adoption by focusing and investing documentation effort where it is mostneeded. This approach can be easily applied regardless of the documentation type andmedium; it consists in documenting only those information items that are expected tobe valuable for a target activity.
Despite the observed significant effort savings provided by a value-based customiza-tion of DRD in our experiments, we cannot assess its cost-benefit as this would requireaccounting for several practical issues that can only be studied in real project set-tings. At this stage, based on the presented results in this article, we can, however,observe that selective, value-based DRD is promising and worth studying further inmore realistic contexts.
APPENDIXES
APPENDIX A: FRAGMENT OF EXPERIMENT MATERIAL
The present section provides a fragment of the material adopted during the experiment.All the material we used was in native language, that is Italian and Spanish in theoriginal experiment and replica, respectively. This section reports the experimentalmaterial in English to promote the understandability. The description of the projectand its high-level requirements, namely. the vision document in RUP, is pretty largein size. Therefore, Section A1 reports only a summary of this document. Section A2reports an example of DRD, Section A3 reports an example of change, and Section A4reports an example of activity to perform.
A.1. Summary description of the project
The system under consideration consists of a software system for managing a servicesystem for the transport of passengers by bus. The system offers features: the managerof the transport service, the driver, and passenger of a vehicle. The system is designedto operate in three main parts.
(1) A central system manages the maintenance of vehicles and shall, at the time ofexecution, be input to the rest of the sites of the system, will converge and cananalyze all the system information from other sites and is characterized by anability to calculate that may supposed unlimited.
(2) Totem, in various instances, is placed along the route of the buses, at bus stops forpassengers, and helps them make reservations for the routes they want, pay fortickets, and check times of departure and arrival.
(3) An intelligent bus consists of an on-board computer, a temperature sensor and hu-midity, a video camera, and a system of marking. The on-board computer managestemperature and humidity inside the bus and, according to passenger bookings,gives directions to the driver. It is noted that the bus is intelligent, and the totemonly communicates directly with the central system and not between them.
The system must handle emergency situations such as collisions, fires, accidents,and sudden illnesses of passengers or the driver. In routine conditions of operationand service, the intelligent bus communicates with the central system, at each stop,using the protected access point (Bluetooth or wifi), offered by each totem in emergency
ACM Transactions on Software Engineering and Methodology, Vol. 22, No. 3, Article 21, Pub. date: July 2013.

The Value of Design Rationale Information 21:29
situations. The intelligent bus will communicate via cellular network. A bus providessome services to its passengers, who can access it via their mobile phone or handheldPDA (Bluetooth or wifi). The computing capacity on-board computer is similar to thatof a laptop.
The initial design is made not only by the system, only the central totem of about150 and about 40 buses. The whole performance is, for quality of services and so on,paid to the needs of an average citizen and it expects to recoup the costs in five years.
A2. A Design Decision and Its Rationale Documentation
—Issue: Determine the operating system to install on each on-board computer.—Decision: Windows.—Status: Pendent.—Assumptions: Such a system should be installed on all buses. Not all features of
a standard operating system are necessary, on the contrary, some of the featuresoffered could be wasting memory and/or computing power.
—Constraints: None.—Positions: Linux, Windows XP, Sun Solaris, Symbian, Mac OS X.—Argument: Medium level of reliability.—Implication: All software must be Windows compliant.—Related decisions: C# has been decided and approved as the standard programming
language for the on-board computers.—Related requirements: Reliability and support should have a medium level.—Related artifacts: None.—Related principles: The development organization prefers the use of standard and
well-known technologies over state-of-the-art promising technologies.—Notes: None.
A.3 New Requirement or Change
The availability of the memory has increased by 80%. The required level of reliabilityhas become a low. The requested level of support is now high.
A.4 Activity to Perform
Detecting conflicts between new requirements and an old decision is the activity toperform. Is the old decision still valid for the new set of requirements?
REFERENCES
AMBLER, S. W. 2007. The tagri (they aren’t gonna read it) principle of software development. http://www.agilemodeling.com/essays/tagri.htm.
AMBLER, S. W. AND JEFFRIES, R. 2002. Agile Modeling: Effective Practices for Extreme Programming and theUnified Process. Wiley.
ARKLEY, P., RIDDLE, S., AND BROOKES, T. 2006. Tailoring traceability information to business needs. In Pro-ceedings of the 14th IEEE International Requirements Engineering Conference (RE’06). IEEE ComputerSociety.
BASILI, V. R. AND ROMBACH, H. D. 1991. Support for comprehensive reuse. Softw. Engin. J. 6, 5. 303–316.BASILI, V. R., SHULL, F., AND LANUBILE, F. 1999. Building knowledge through families of experiments. IEEE
Trans. Softw. Engin. 25, 4. 456–473.BIFFL, S., AURUM, A., BOHEM, B., ERDOGMUS, H., AND GRUNBACHER, P. 2005. Value-Based Software Engineering.
Springer.BIFFL, S., AURUM, A., BOHEM, B., ERDOGMUS, H., AND GRUNBACHER, P. 2006. Value-Based Software Engineering.
Springer.BOEHM, B., ROMBACH, D., AND ZELKOWITZ, M. 2010. Foundations of Empirical Software Engineering: The Legacy
of Victor R. Basili. Springer.BOEHM, B. W. 1981. Software Engineering Economics. Prentice Hall PTR.
ACM Transactions on Software Engineering and Methodology, Vol. 22, No. 3, Article 21, Pub. date: July 2013.
21:30 D. Falessi et al.
BOEHM, B. W. AND SULLIVAN, K. J. 2000. Software economics: A roadmap. In Proceedings of the Conference onThe Future of Software Engineering. ACM Press, New York.
BOSCH, J. 2004. Software architecture: The next step. In Proceedings of the 1st European Workshop on SoftwareArchitecture (EWSA’04). Springer.
BRATTHALL, L., JOHANSSON, E., AND REGNELL, B. 2000. Is a design rationale vital when predicting changeimpact? A controlled experiment on software architecture evolution. In Proceedings of the InternationalConference on Product Focused Software Process Improvement.
BURGE, J. AND BROWN, D. 1998. Design rationale types and tools, ai in design group. http://web.cs.wpi.edu/Research/aidg/DR-Rpt98.html.
BURGE, J. E., CARROLL, J. M., MCCALL, R., AND MISTRK, I. 2008. Rationale-Based Software Engineering. Springer.CANTONE, G., COLASANTI, L., ABDULNABI, Z., LOMARTIRE, A., AND CALAVARO, G. 2003. Evaluating checklist-based
and use-case-driven reading techniques as applied to software analysis and design uml artifacts. InExperiences from ESERNET: Empirical Methods and Studies on Software Engineering.
CAPILLA, R., NAVA, F., AND DUENAS, J. C. 2007. Modeling and documenting the evolution of architecturaldesign decisions. In Proceedings of the 2nd Workshop on Sharing and Reusing Architectural Knowledge,(ICSE Workshops). IEEE.
CAPILLA, R., NAVA, F., AND CARRILLO, C. 2008. Effort estimation in capturing architectural knowledge. In Pro-ceedings of the 23rd IEEE/ACM International Conference on Automated Software Engineering (ASE’08).
CLELAND-HUANG, J. 2006a. Just enough requirements traceability. In Proceedings of the 30th Annual Interna-tional Computer Software and Applications Conference (COMPSAC’06). Vol. 1, IEEE Computer Society.
CLELAND-HUANG, J. 2006b. Requirements traceability - When and how does it deliver more than it costs?In Proceedings of the 14th IEEE International Requirements Engineering Conference (RE’06). IEEEComputer Society.
CLEMENTS, P., MCGREGOR, J. D., AND COHEN, S. G. 2005. The structured intuitive model for product line economics(simple). Tech. rep. CMU/SEI-2005-TR-003, Carnegie Mellon University.
CONKLIN, J. AND BEGEMAN, L. M. 1988. gIBIS: A hypertext tool for exploratory policy discussion. In Proceedingsof the ACM Conference on Computer-Supported Cooperative Work.
COX, J. 1997. The Concise Guide to Economics. Laissez Faire Books.DE BOER, R. C. AND FARENHORST, R. 2008. In search for architectural knowledge. In Proceedings of the 3rd
Workshop on Sharing and Reusing Architectural Knowledge (SHARK’08), co-located with the 30th Inter-national Conference on Software Engineering (ICSE’08).
DZIDEK, W., ARISHOLM, E., AND BRIAND, L. 2008. A realistic empirical evaluation of the costs and benefits ofuml in software maintenance. IEEE Trans. Softw. Engin. 34, 3. 407–432.
EGYED, A., BIFFL, S., HEINDL, M., AND GRUNBACHER, P. 2005. Determining the cost-quality trade-off for auto-mated software traceability. In Proceedings of the 20th IEEE/ACM International Conference on Auto-mated Software Engineering. ACM Press, New York.
EGYED, A., GRUNBACHER, P., HEINDL, M., AND BIFFL, S. 2007. Value-based requirements traceability: Lessonslearned. In Proceedings of the 15th IEEE International Requirements Engineering Conference (RE’07).
FALESSI, D., ALI BABAR, M., CANTONE, G., AND KRUCHTEN, P. 2010a. Applying empirical software engineering tosoftware architecture: Challenges and lessons learned. Empirical Softw. Engin. 15, 3. 250–276.
FALESSI, D. AND CANTONE, G. 2006. Exploring feasibility of software defects orthogonal classification. In Soft-ware and Data Technologies, Springer.
FALESSI, D., CANTONE, G., AND BECKER, M. 2006. Documenting design decision rationale to improve individualand team design decision making: An experimental evaluation. In Proceedings of the 5th ACM/IEEEInternational Symposium on Empirical Software Engineering.
FALESSI, D., CANTONE, G., AND CANFORA, G. 2011a. Empirical principles and an industrial case study in retriev-ing equivalent requirements via natural language processing techniques. IEEE Trans. Softw. Engin. 39,1, 18–44.
FALESSI, D., CANTONE, G., AND GRANDE, C. 2007. A comparison of structured analysis and object orientedanalysis: An experimental study. In Proceedings of the International Conference on Software and DataTechnologies.
FALESSI, D., CANTONE, G., KAZMAN, R., AND KRUCHTEN, P. 2011b. Decision-making techniques for softwarearchitecture design: A comparative survey. ACM Comput. Surv. 43, 4.
FALESSI, D., CANTONE, G., SARCIA, S. A., CALAVARO, G., SUBIACO, P., AND D’AMORE, C. 2010b. Peaceful coexistence:Agile developer perspectives on software architecture. IEEE Softw. 27, 2.
FARENHORST, R., HOORN, J. F., LAGO, P., AND VAN VLIET, H. 2009. What architects do and what they need toshare knowledge. Tech. rep. IR-IMSE-003, VU University Amsterdam.
ACM Transactions on Software Engineering and Methodology, Vol. 22, No. 3, Article 21, Pub. date: July 2013.

The Value of Design Rationale Information 21:31
FAVARO, J., FAVARO, K., AND FAVARO, P. 1998. Value based software reuse investment. Ann. Softw. Enin. 5, 5–52.FOWLER, M. 2005. The new methodology. http://martinfowler.com/articles/newMethodology.html.GORTON, I. 2006. Essential Software Architecture. Springer.GREENACRE, M. 2007. Correspondence Analysis in Practice. Chapman and Hall/CRC.HANNAY, J. AND JØRGENSEN, M. 2008. The role of deliberate artificial design elements in software engineering
experiments. IEEE Trans. Softw. Engin. 34, 2, 242–259.HEINDL, M. AND BIFFL, S. 2005. A case study on value-based requirements tracing. In Proceedings of the 10th
European Software Engineering Conference. ACM Press, New York.HOLT, R., BOEHM-DAVIS, D., AND SHULTZ, A. 1987. Mental representations of programs for student and pro-
fessional programmers. In Proceedings of the Empirical Studies of Programmers, 2nd Workshop. AblexPublishing.
HOSMER, D. AND LEMESHOW, S. 2000. Applied Logistic Regression. Wiley-Interscience.HOST, M., REGNELL, B., AND WOHLIN, C. 2000. Using students as subjects: A comparative study of students and
professionals in lead-time impact assessment. Empirical Softw. Engin. J. 5, 3, 201–214.JANSEN, A. AND BOSCH, J. 2005. Software architecture as a set of architectural design decisions. In Proceedings
of the 5th Working IEEE/IFIP Conference on Software Architecture (WICSA’05). IEEE Computer Society.JANSEN, A., BOSCH, J., AND AVGERIOU, P. 2008. Documenting after the fact: Recovering architectural design
decisions. J. Syst. Softw. 81, 4. 536–557.JEDLITSCHKA, A., CIOLKOWSKI, M., AND PFAHL, D. 2008. Reporting experiments in software engineering. In Guide
to Advanced Empirical Software Engineering, Springer.JOHN, I., KNODEL, J., LEHNER, T., AND MUTHIG, D. 2006. A practical guide to product line scoping. In Proceedings
of the 10th International Software Product Line Conference.JURISTO, N. AND MORENO, A. M. 2006. Basics of Software Engineering Experimentation. Springer.KARSENTY, L. 1996. An empirical evaluation of design rationale documents. In Proceedings of the SIGCHI
Conference on Human Factors in Computing Systems: Common Ground. ACM Press, New York.KRUCHTEN, P. 2003. The Rational Unified Process: An Introduction 3rd Ed. Addison-Wesley Professional.KRUCHTEN, P., CAPILLA, R., AND DUENAS, J. 2009. The decision view’s role in software architecture practice.
IEEE Softw. 26, 2. 36–42.KRUCHTEN, P., LAGO, P., AND VAN VLIET, H. 2006. Building up and reasoning about architectural knowledge. In
Proceedings of the 2nd International Conference on the Quality of Software Architectures. Lecture Notesin Computer Science, vol. 4214, Springer, 43–58.
LAGO, P., AVGERIOU, P., CAPILLA, R., AND KRUCHTEN, P. 2008. Wishes and boundaries for a software architectureknowledge community. In Proceedings of the 7th Working IEEE/IFIP Conference on Software Architecture(WICSA’08).
LEE, J. 1997. Design rationale systems: Understanding the issues. IEEE Expert: Intell. Syst. Their Appl. 12,3. 78–85.
LEE, L. AND KRUCHTEN, P. 2007. Capturing software architectural design decisions. In Proceedings of theCanadian Conference on Electrical and Computer Engineering (CCECE’07).
MACLEAN, A., YOUNG, R. M., BELLOTTI, V. M. E., AND MORAN, T. P. 1996. Questions, options, and criteria: Ele-ments of design space analysis. In Design Rationale: Concepts, Techniques, and Use. Lawrence ErlbaumAssociates, 53–105.
NEHMER, J., BECKER, M., KARSHMER, A., AND LAMM, R. 2006. Living assistance systems: An ambient intelligenceapproach. In Proceedings of the 28th International Conference on Software Engineering. ACM Press,New York.
OATES, B. J. 2003. Widening the scope of evidence gathering in software engineering. In Proceedings of the11th Annual International Workshop on Software Technology and Engineering Practice. IEEE ComputerSociety.
RAGIN, C. C. 1989. The Comparative Method: Moving Beyond Qualitative and Quantitative Strategies. Uni-versity of California Press.
SHULL, F., CARVER, J., VEGAS, S., AND JURISTO, N. 2008. The role of replications in empirical software engineering.J. Empirical Softw. Engin. 13, 2. 211–218.
SHULL, F., SEAMAN, C., AND ZELKOWITZ, M. 2006. Victor R. Basili’s contributions to software quality. IEEE Softw.23, 1.
SHUM, B. AND HAMMOND, N. 1994. Argumentation-based design rationale: What use at what cost? Int. J.Hum.-Comput. Stud. 40, 4, 603–652.
SJØBERG, D., ANDA, B., ARISHOLM, E., TORE, D., JØRGENSEN, M., KARAHASANOVIC, A., KOREN, E., AND MAREK, V.2002. Conducting realistic experiments in software engineering. In Proceedings of the InternationalSymposium on Empirical Software Engineering. IEEE Computer Society.
ACM Transactions on Software Engineering and Methodology, Vol. 22, No. 3, Article 21, Pub. date: July 2013.

21:32 D. Falessi et al.
SJOBERG, D., ARISHOLM, E., AND JORGENSEN, M. 2001. Conducting experiments on software evolution. In Pro-ceedings of the 4th International Workshop on Principles of Software Evolution. ACM Press, New York.
SVAHNBERG, M., AURUM, A., AND WOHLIN, C. 2008. Using students as subjects - An empirical evaluation. InProceedings of the 2nd ACM-IEEE International Symposium on Empirical Software Engineering andMeasurement. ACM Press, New York.
TANG, A. 2011. Software designers are you biased? In Proceedings of the 6th Workshop on Sharing and ReusingArchitectural Knowledge (SHARK’11).
TANG, A., ALI BABAR, M., GORTON, I., AND HAN, J. 2007. A survey of architecture design rationale. J. Syst. Softw.79, 12. 1792–1804.
TYREE, J. AND AKERMAN, A. 2005. Architecture decisions: Demystifying architecture. IEEE Softw. 22, 2, 19–27.VAN DER VEN, J. S., JANSEN, A., AVGERIOU, P., AND HAMMER, D. K. 2006. Using architectural decisions. In
Proceedings of the 2nd International Conference on the Quality of Software Architectures.WOHLIN, C., RUNESON, P., HOST, M., OHLSSON, M. C., REGNELL, B., AND WESSLEN, A. 2000. Experimentation in
Software Engineering: An Introduction, Springer.ZIMMERMANN, O., GSCHWIND, T., KUSTER, J., LEYMANN, F., AND SCHUSTER, N. 2007. Reusable architectural decision
models for enterprise application development. In Proceedings of the 3rd Quality of Software ArchitecturesInternational Conference on Software Architectures, Components, and Applications (QoSA’07). LectureNotes in Computer Science, vol. 4880. Springer, 15–32.
Received May 2011; revised December 2011; accepted March 2012
ACM Transactions on Software Engineering and Methodology, Vol. 22, No. 3, Article 21, Pub. date: July 2013.