on the value of river network information in regional
TRANSCRIPT
On the Value of River Network Information in Regional Frequency Analysis
KICHUL JUNGa TAHA B M J OUARDAb AND PRASHANTH R MARPUc
aDepartment of Civil and Environmental Engineering Konkuk University Gwanjin-gu Seoul South KoreabCanada Research Chair in Statistical Hydro-Climatology INRS-ETE Quebec Quebec Canada
cDepartment of Electrical Engineering and Computer Science Khalifa University Masdar City Abu Dhabi United Arab Emirates
(Manuscript received 22 February 2020 in final form 18 September 2020)
ABSTRACT Regional frequency analysis (RFA) is widely used in the design of hydraulic structures at locations where
streamflow records are not available RFA estimates depend on the precise delineation of homogenous regions for accurate
information transfer This study proposes new physiographical variables based on river network features and tests their
potential to improve the accuracy of hydrological feature estimates Information about river network types is used both in
the definition of homogenous regions and in the estimation process Data from 105 river basins in arid and semiarid regions
of theUnited States were used in our analysis Artificial neural network ensemblemodels and canonical correlation analysis
were used to produce flood quantile estimates which were validated through tenfold cross and jackknife validations We
conducted analysis for model performance based on statistical indices such as the NashndashSutcliffe efficiency root-mean-
square error relative root-mean-square error mean absolute error and relativemean bias Among various combinations of
variables a model with 10 variables produced the best performance Further 49 36 and 20 river networks in the 105 basins
were classified as dendritic pinnate and trellis networks respectively The model with river network classification for the
homogenous regions appeared to provide a superior performance compared with a model without such classification The
results indicated that including our proposed combination of variables could improve the accuracy of RFA flood estimates
with the classification of the network types This finding has considerable implications for hydraulic structure design
KEYWORDS Hydrology Statistical techniques Hydrologic models Neural networks Regional models Flood events
1 Introduction
Regional hydrological frequency analysis (RFA) is adopted
widely for estimating extreme hydrological events and is essential
for the design and operation of hydraulic structures RFA is
usually carried out to transfer information from locations where
data are available to ungauged locations (Durrans and Tomic
1996 Chebana and Ouarda 2007) or to partially gauged sites
(Seidou et al 2006) RFA generally consists of two steps namely
the delineation of groups of hydrologically homogeneous basins
called lsquolsquohomogenous regionsrsquorsquo or lsquolsquohomogenous neighborhoodsrsquorsquo
and the transfer of hydrological information within the defined
groups The quality of the final estimate depends mainly on the
quality of the defined homogeneous regions When the region is
extremely small it could have a high level of homogeneity but
insufficient information content to transfer the knowledge to the
ungauged site For instance even a simple transfer through re-
gression requires an adequate number of siteswithin the region as
adequate regression cannot be built with a small number of points
On the other hand if the region is extremely large the amount of
information remains important but the level of homogeneity is
reduced substantially Therefore a delicate trade-off is usually
sought between the amount of information and the homogeneity
level The precise identification of homogenous regions signifi-
cantly affects the performance of hydrological estimation models
(Chebana and Ouarda 2008 Wazneh et al 2016)
Several methods have been proposed to delineate homo-
geneous regions For instanceMatalas et al (1975) and Beable
and McKerchar (1982) used geographic and administrative
boundaries Hosking and Wallis (1997) proposed hierarchical
clustering usingWardrsquos method (Ward 1963) andOuarda et al
(2001) recommended using canonical correlation analysis
(CCA) to determine hydrological neighborhoods to improve
the estimation of flood quantiles Durocher et al (2016) ana-
lyzed the delineation of homogenous regions based on refer-
ence variables representing nonlinear relationships among
hydrological data Abdi et al (2017a) used the growing neural
gas network to determine hydrological data clustering in RFA
Various physiographical and meteorological variables have
been employed to define homogeneous regions in RFA such as
basin area mean basin slope main channel length percentage of
area covered by forest percentage of area covered by lakes main
channel slope annual mean precipitation annual mean days with
temperature exceeding 08C and curve number (CN) (Flavell
1983 Shu andOuarda 2007Aziz et al 2014 Requena et al 2018)
In the literature on hydrological frequency analysis the focus is
mainly on the development and assessment of new methods of
delineation and estimation to enhance hydrological quantile es-
timation (Castellarin et al 2001Ouarda et al 2008)However the
physiographical and meteorological variables used in RFA have
not evolved much in recent decades Noteworthy gains could re-
sult from the integration of drainage network features as new
variables in group delineation and regional transfermodels as the
characterization of river networks depends on climatic physio-
graphic and topographic constraints (Horton 1945 Daniel 1981
Burbank 1992) and flood dynamics are correlated with the
drainage density of a basin (Pallard et al 2009) Information on
river network types and their properties is highly relevant to
understanding regional hydrological dynamics such as floodCorresponding author Kichul Jung jkichul11navercom
JANUARY 2021 JUNG ET AL 201
DOI 101175JHM-D-20-00531
2021 American Meteorological Society For information regarding reuse of this content and general copyright information consult the AMS CopyrightPolicy (wwwametsocorgPUBSReuseLicenses)
Unauthenticated | Downloaded 030922 0422 AM UTC
response time and the shape of hydrographs for the generation
of flood quantile estimates Therefore integrating such infor-
mation should improve the definition of homogenous regions
and significantly affect RFA results
Several methods have been proposed for estimation using
RFAFor instance several countries have adopted the index flood
method (Dalrymple 1960 Hosking andWallis 1993 Chebana and
Ouarda 2009 Kjeldsen and Jones 2010) The key assumption of
this approach is that except for an index factor flood data from
different locations have similar distributions (Dalrymple 1960)
Alternatively the rational method has been used for flood esti-
mates in small river basins (Hua et al 2003) The rational method
is used generally for flood estimation in small urban or rural areas
and it often fails to reproduce specific flood events when actual
rainfall data are applied Diverse regression-based approaches
have also been applied in regional estimation (Haddad and
Rahman 2012 Ouarda et al 2018) Hydrological processes gen-
erally represent nonlinear behaviors by showing substantial spa-
tial and temporal variability and nonlinear regression approaches
provide estimates that are more accurate than linear regression
approaches in regional flood frequency analysis (Pandey and
Nguyen 1999 Grover et al 2002) As regards nonlinear modeling
artificial neural networks (ANNs) have been adopted generally
in a wide range of hydrological issues such as rainfall runoff
modeling hydrological forecasting and flood quantile estimation
in regional frequency analysis (Daniell 1991 Muttiah et al 1997
Govindaraju 2000 Luk et al 2001 Dawson and Wilby 2001 Shu
and Burn 2004 Dawson et al 2006 Shu and Ouarda 2007
Chokmani et al 2008 Turan and Yurdusev 2009 Besaw et al
2010 Aziz et al 2014) ANN models in RFA can provide the
functional relationships between quantiles and physiographical
variables resulting in improved quantile estimation Furthermore
the integration of canonical correlation analysis and ensemble
ANN has been proposed to improve flood quantile estimation
(Ouarda et al 2001 Shu andOuarda 2007Alobaidi et al 2015) In
their analysis Ouarda et al (2001) proposed a theoretical
framework in applying the CCA for RFA
RFA has been applied extensively in nonarid regions (Abdi
et al 2017b Requena et al 2017 Rahman et al 2018)
However relatively few studies have proposed RFA proce-
dures for arid and semiarid regions although the design of ir-
rigation and groundwater recharge dams is crucial in such
regions A small country such as the UnitedArab Emirates for
instance has more than 130 recharge dams on intermittent
rivers (Gonzalez et al 2016) Zaman et al (2012) applied RFA
in arid regions in Australia and Farquharson et al (1992)
conducted RFA using flood data from 162 stations in arid re-
gions including northwestern Africa Iran and Saudi Arabia
However RFA methods for arid and semiarid regions of the
United States have not been developed and no studies have
attempted to use specific river network information to produce
flood quantile estimates in the context of RFA
Drainage networks have a distinct appearance in different
regions and environments For instance a dendritic network is
typically tree like and it develops freely with tributaries
merging at moderately acute angles (Howard 1967) A parallel
network has a parallel form and it generally develops on large
surface slopes characterized by straight main channels and
tributaries that join at acute junction angles (Mosley 1972
Phillips and Schumm 1987 Jung et al 2011) A pinnate net-
work features a feather-like form with straight major channels
andmany small tributaries merging at extremely acute junction
angles (Howard 1967) A rectangular network involves stream
course irregularities characterized by a large number of 908bends and tributaries that join at right angles (Howard 1967)
A trellis network appears lattice like and has small short
channels that merge at nearly 908 angles (Howard 1967
Abrahams and Flint 1983) Figure 1 shows examples of the
five types of river networks from US basins
Several attempts have beenmade to identify different drainage
network types based on river network characteristics and propose
classification methods Argialas et al (1988) used third-order
networks digitized from aerial photos to propose a river classifi-
cation system Ichoku and Chorowicz (1994) proposed a quanti-
tative approach to determine different river networks based on 14
features of drainage networks derived from digital elevation
models (DEMs)Mejia andNiemann (2008) used threemeasures
including drainage-area increments along a channel channel
course irregularities and tributary junction angles to classify dif-
ferent network types More recently Jung et al (2015) proposed
identification of drainage network types based on the cumulative
distributions of secondary tributary lengths within various ranges
of tributary junction angles As different river network types in-
volve specific drainage network features river network classifi-
cation should provide valuable information for use in RFA
The objective of the present work is to develop the RFA
model employing the river network information used for de-
lineating the homogenous regions Further the optimal com-
bination of physiographical and meteorological variables for
flood quantile estimation was analyzed based on statistical in-
dices As regards the statistical indices the k-fold cross-
validation and jackknife approaches were used to evaluate
the accuracy and performance and to present the appropriate
model The k-fold cross-validation and jackknife techniques
are used extensively to evaluate the prediction model in fre-
quency analysis (Shu and Ouarda 2007 Ouarda and Shu 2009
Alobaidi et al 2015 Faridzad et al 2018 Requena et al 2018
Jung et al 2019) We applied a machine learning technique
ANN to produce flood quantile estimates in the RFA proce-
dure at arid and semiarid areas of the United States As the
present study focuses on arid and semiarid regions we con-
centrated on intermittent streams which are normally dry but
do flow occasionally and seasonally The homogenous regions
were defined by river network classification and several sta-
tistical indices were used to evaluate the model performance
Based on this analysis we were able to determine an appro-
priate combination of variables to improve the performance It
appears that employing river network classification has po-
tential for enhancing the RFA process
2 Materials and methods
a Dataset
A dataset representing 105 river basins dominated by in-
termittent streams in arid and semiarid regions of the United
States was developed for RFA The spatial distribution of the
202 JOURNAL OF HYDROMETEOROLOGY VOLUME 22
Unauthenticated | Downloaded 030922 0422 AM UTC
relevant stations is presented in Fig 2 These 105 stations were
selected among the hydrological stations on intermittent
streams in theUnited States to ensure the quality of the dataset
based on the following criteria
1) availability of an historical flow record of at least 15 years
to ensure reliable quantile estimates
2) basin characterized by a natural flow regime
3) the historical flow data at all retained gauging stations had to
pass the tests of homogeneity (Wilcoxon 1945) stationarity
(Kendall 1948) and independence (Wald and Wolfowitz
1943) which permit verifying existence from an autocorre-
lation of significant first-order in the observations
Several physiographical and meteorological variables were
estimated and employed in our analysis The first seven vari-
ables (7Var) included in the database have been used generally
in previous studies (Ouarda et al 2001 Shu and Ouarda 2007
Mosaffaie 2015) These include drainage area (AREA) length
of the main channel (LMC) slope of the main channel (SMC)
mean basin slope (MBS) curve number (CN) annual mean
precipitation (AMP) and annual mean temperature (AMT)
FIG 1 Illustrations for five drainage networks (a) Buckeye Run WV for a dendritic network (b) Yellow Creek CO for a parallel
network (c) PaisanoWash AZ for a pinnate network (d) Boreas River NY for a rectangular network and (e) Sleepy CreekWV for a
trellis network The block point of each network type indicates the outlet of the river basin and the lines indicate the channels in the basin
JANUARY 2021 JUNG ET AL 203
Unauthenticated | Downloaded 030922 0422 AM UTC
New physio-meteorological variables were added including
the aridity index (ADI) tributary junction angle (TJA) time of
concentration (Tc) and three power-law exponents (3EXP) in
an attempt to improve regional hydrological estimates Details
on the new variables are provided in section 2c Descriptive
statistics for all physio-meteorological variables used in the
present study are presented in Table 1
Ten-year (q10) 50-year (q50) and 100-year (q100) specific
quantiles were considered as hydrological variables They were
estimated using the flow records from all the gauged sites in the
study area The following statistical distributions were consid-
ered in the fitting processes gamma generalized extreme value
generalized Pareto Gumbel two-parameter lognormal three-
parameter lognormal log-Pearson type III Pearson type III and
Weibull At each station the Bayesian information criterion was
used to identify the optimal statistical distribution to fit the data
The physiographical meteorological and hydrological variables
were transformed to achieve normality and standardized to
obtain consistent format Subsequently the transformed vari-
ables were applied to the model for flood quantile estimation
b CCA and ANN ensemble model
In this study the CCA and ANN ensemble techniques
(EANN-CCA) were integrated to estimate the flood quantiles
at ungauged locations Shu and Ouarda (2007) suggested the
EANN-CCA model and demonstrated that its estimation perfor-
mance was superior compared with that of other generally used
RFA models We used the EANN-CCA model to obtain flood
quantile estimates in arid and semiarid regions In thismodel CCA
was used to construct a transformed physio-meteorological space
based on site characteristics The canonical variables derived from
CCA were fed to an ANN ensemble model to obtain flood
quantile estimates A brief description of the CCA and ANN en-
sembles is provided in sections 2b(1) and 2b(2) respectively
1) CANONICAL CORRELATION ANALYSIS
The CCA approach represents a statistical multivariate
analysis and it characterizes the relationship between two sets of
random variables removing nonessential data and preserving
the original property of the variables In CCA procedures X
indicates a set of physiographical and meteorological variables
and Y represents a set of hydrological variables These physio-
graphical and meteorological variables can be obtained easily
for ungauged locations Given two sets (X and Y) of random
variables the CCA approach was applied to link the sets using
vectors of canonical variables that were linear combinations of
the original ones When linear combinations of X and Y are
denoted as W and V the equations are
W5a0X (1)
V5b0Y (2)
where W implies the canonical variables for the physiograph-
ical and meteorological variables and V indicates the canoni-
cal variables for the hydrological variables The correlation of
the two canonical variables is
r5
a0XY
bffiffiffiffiffiffiffiffiffiffiffiffiffia0
X
ar ffiffiffiffiffiffiffiffiffiffiffiffiffi
b0Y
br (3)
FIG 2 Locations of 105 stations in the United States Dots in the figure indicate stations in
different states red dots in Arizona purple ones in California green ones in Colorado pink
ones in Nevada yellow ones in New Mexico blue ones in Texas and gray ones in Utah
TABLE 1 Descriptive statistics of 13 variables for physiographical
and meteorological features used for regional frequency analysis
Variables Min Max Mean Std dev
AREA (km2) 17787 21 00057 1483295 3179978
LMC (km) 8277 435794 73641 74662
SMC () 0095 13617 2057 2551
MBS () 0775 57616 14797 1367
CN 60509 85500 75459 486
AMP (mm) 28617 232156 99113 44211
AMT (8C) 151 21242 14106 4824
ADI 0146 298 0792 0377
TJA (8) 4162 71485 5566 5729
Tc (h) 1212 194372 19658 27274
q10 (m3 s21 km21) 62284 15644 310238 3537667
q50 (m3 s21 km21) 96476 54352 6432242 824412
q100 (m3 s21 km21) 109246 86402 8557539 11 96796
204 JOURNAL OF HYDROMETEOROLOGY VOLUME 22
Unauthenticated | Downloaded 030922 0422 AM UTC
The vectors of a and b can be determined by maximizing
the correlation TheCCA in the EANN-CCAmodel allows the
construction of a transformed physiographical space called the
canonical space defined by physiographical and meteorologi-
cal variables The constructed model can establish a functional
relationship between the canonical physiographical and mete-
orological variables on one side and the canonical hydrological
variables on the other Based on the functional relationship
estimates of the hydrological variables at ungauged locations can
be obtained in the canonical space More theoretical informa-
tion about the use of CCA in RFA is presented in Ouarda
et al (2001)
2) ANN ENSEMBLE
In the Shu and Ouarda (2007) model the physiographical
and meteorological variables are first projected into the ca-
nonical space and then fed to an ANN model to estimate hy-
drological variables at ungauged locations (Dawson et al
2006) In RFA ANNs can be used as nonlinear hydrological
models to approximate the functional relationship between the
canonical physio-meteorological variables and the hydrologi-
cal variables
Using the variables multilayer perceptrons (MLPs) con-
sisting of an input layer hidden layers and an output layer
were utilized to train the hydrological variables A network
with MLPs was trained based on samples obtained from
gauged stations for estimating the hydrological variables such
as flood quantiles In the training process network parameters
were optimized until the estimation error was minimized and
the network obtained the specified level of accuracy The
LevenbergndashMarquardt (LM) algorithm (Hagan and Menhaj
1994) was used to identify optimal solutions and minimize the
network error in the study Further early stopping criteria
were used to avoid overfitting issues inANN training Once the
ANN model completed the training procedure the output
layer provided an ANN prediction ie the flood quantile es-
timates in the present work
To enhance the generalization ability and stability of a
single ANN several researchers have used an ANN ensemble
model based on multiple ANNs trained and produced by in-
dividual networks (Cannon and Whitfield 2002 Dietterich
1997) Among ANN ensemble methods the bagging proce-
dure has been used to produce a unique ensemble output ie
the flood quantile estimate by averaging the networks In the
process each ANN member of the ensemble was trained in-
dependently on a subset of the training set sampled with a
replacement of the dataset This is a simple and effective
approach to generate ensemble output Detailed information
on the use of the bagging method in RFA is available in Shu
and Ouarda (2007)
c Estimation of new physiographical variables
We proposed and tested new variables that had not been
used previously in RFA to assess whether using them would
improve the performance of RFA models These variables are
related to the hydrological and geomorphological dynamics
of a river basin including tributary junction angles time of
concentration aridity index and three exponents used for river
network classification The procedures to obtain the proposed
variables are described in sections 2c(1)ndash2c(4)
1) TRIBUTARY JUNCTION ANGLE
Drainage networks generally display quite distinct features
in different regions depending on the regional and local lith-
ologic and tectonic conditions during the development of the
network (Parvis 1950 Cox 1989 Burbank 1992) River net-
work characteristics have a significant effect on hydrological
responses Among other river network properties tributary
junction angles have been investigated frequently to under-
stand variations in the angles among different river network
types (Abrahams and Flint 1983 Phillips and Schumm 1987
Ichoku and Chorowicz 1994 Hackney and Carling 2011)
Tributary junction angles are used also in RFA to estimate
flood quantiles along with other physiographic and climatic
variables Tributary junction angles are important features in a
basin and are calculated at every junction between primary and
secondary tributaries (Mejia and Niemann 2008 Jung et al
2015) A primary tributary is calculated using the chord be-
tween the junction and a location determined based on the
Euclidean distance upstream from the junction on the larger
tributary in a river network A secondary tributary is estimated
using the chord between the junction and a location deter-
mined based on the Euclidean distance upstream from the
junction on the smaller tributary in the river network
Subsequently the two chords can be applied to obtain the
junction angles Comprehensive theoretical information on
calculating the angles is presented in the studies of Mejia and
Niemann (2008) and Jung et al (2015)
2) TIME OF CONCENTRATION
The time of concentration Tc is defined as the time required
for runoff to travel from the most hydraulically distant location
in a basin to its outlet (Jung et al 2017) As a crucial variable
linked directly to a river basin hydrological regime Tc was
included as an RFA variable in the present study Several re-
searchers have alluded to its importance by investigating Tc for
diverse hydrological applications Wong (2005) and Sharifi and
Hosseini (2011) used Tc to estimate the peak discharge for the
construction of hydraulic structures In a more recent study
Jung et al (2017) examined Tc within different river network
types to identify whether network types affect the hydrological
response of a basin
Several Tc estimation methods have been proposed We
used the lag method of the Natural Resources Conservation
Service (NRCS) (US Department of Agriculture) Folmar
and Miller (2000) demonstrated the effectiveness of this
method for computing Tc and Jung et al (2017) examined
Tc values calculated using the NRCS lag method along-
side drainage network characteristics for use in hydro-
logical models In the NRCS lag method Tc can be
estimated by
Tc5
L
06 (4)
where L is the watershed lag (h) defined as a function of the
hydraulic length This lag can be calculated as
JANUARY 2021 JUNG ET AL 205
Unauthenticated | Downloaded 030922 0422 AM UTC
L5l08(S1 1)07
1900Y05 (5)
where Y represents the mean basin slope () and l indicates
the main channel length (ft) The unit of the main channel
length is converted from km to ft for application of the equa-
tion The variable S represents the maximum potential reten-
tion related to the rate of infiltration at the soil surface in the
basin The maximum potential retention can be written as
S5
1000
CN
2 10 (6)
where CN is the curve number Soils show high infiltration
rates when the CN value is low and low infiltration rates when
the CN is high Note that Tc can be obtained at ungauged lo-
cations and can serve as a physiographical variable in RFA
flood quantile estimates
3) ARIDITY INDEX
We used an ADI which is a numerical indicator of the de-
gree of dryness of a climate as a meteorological variable in the
study of RFA Walton (1969) investigated the nature and
causes of aridity which are affected generally by geomorpho-
logical processes vegetation and climatic phenomena in-
cluding seasonality For example the rain shadow effect which
is related to topographical features is an important factor that
leads to aridity The rain shadow effect occurs when rising air at
the windward sides of mountain ranges cools by generating
precipitation and losing moisture while descending air on the
leeward side of ranges warms up thereby creating arid envi-
ronments Stadler (1987) and Maliva and Missimer (2012)
employed ADI to identify aridity patterns and conditions
correlated with climate variables such as temperature pre-
cipitation and evaporation for water resource estimation and
management
A low ADI value implies an arid environment whereas a
large value indicates a humid environment We investigated
whether ADI could be used as a climate index to improve flood
quantile estimates in arid and semiarid regions ADI can be
estimated as follows
ADI5P
PET (7)
where P is the annual mean precipitation (over ranges of 10ndash
70 years) and PET is potential evapotranspiration We used the
Hamon potential evapotranspiration equation which has been
employed in global hydrological studies to estimate potential
evapotranspiration in our study (Hamon 1960) Themonthly PET
(mmmonth21) equation based on Hamonrsquos method is as follows
PET5 13973d3D2 3Wt (8)
where d is the number of days in the month andD is the mean
monthly number of hours of daylight in 12-h units The variable
Wt (gm23) is a saturated water vapor density term estimated by
Wt54953 e00623T
100 (9)
where T is the mean monthly temperature (8C)
Further the Hamon equation for the annual PET (mmyr21)
is as follows
PET5 [059491 (011893TC)]3 365 (10)
where TC is the annual mean temperature (8C) For ADI
calculations in the current study PET was obtained based on
Eq (10) using the annual mean temperature
4) CLASSIFICATION OF RIVER NETWORK TYPES
In several studies river networks were classified based on
the network characteristics (Ichoku and Chorowicz 1994
Mejia and Niemann 2008 Jung et al 2015) The development
and characterization of drainage networks normally depend on
local and regional constraints (Parvis 1950 Howard 1967) We
used methodology proposed by Jung et al (2015) to classify
river networks into five types (dendritic parallel pinnate
rectangular and trellis) in arid and semiarid regions This
method was selected for its simplicity as only two character-
istics namely tributary junction angles and secondary tribu-
tary lengths in a basin are required to distinguish between
different river network types This approach was used to pro-
vide data for defining homogenous neighborhoods based on
the river network classification in RFA
To examine the classification of the river networks the
tributary junction angles of a basin are grouped into three
overlapping ranges (08ndash608 308ndash908 and 608ndash1208) by consid-
ering continuity Subsequently the lengths of the secondary
tributaries in the basin were estimated for the different ranges
and the distributions of the secondary tributary lengths were
obtained to produce cumulative histograms of the length dis-
tributions These cumulative histograms provide three power-
law exponents for the secondary tributary lengths which are
similar to the fractal dimensions to classify different river
network types (Velde et al 1990 Gloaguen et al 2007 Jung
et al 2015) The exponents of the power law can be calculated
based on the following equation
Ni5
C
lDi (11)
where D implies the power-law exponent c means the pro-
portional constant and Ni indicates the number of secondary
tributaries based on a length less than li The method for
classifying the different networks is described briefly here and
further details on the procedure are presented in Jung et al
(2015) The present study is the first to employ these power-law
exponents in the context of RFA The exponents were assessed
to determine whether they could be used as physiographical
variables to improve flood quantile estimates
d Model validation methods and criteria
Tenfold cross-validation and jackknife procedures are used
regularly as resampling methods to assess the performance of
regional frequency models (Miller 1964 Shao and Tu 2012)
We used these approaches for model validation and to evaluate
the relative performance of the RFA models Figure 3 shows
the construction process of the EANN-CAA model for
206 JOURNAL OF HYDROMETEOROLOGY VOLUME 22
Unauthenticated | Downloaded 030922 0422 AM UTC
regional frequency estimation of hydrological variables along
with the resampling procedures
In tenfold cross-validation the original sample was divided
randomly into ten subsamples of the same size and in each
trial one of the subsamples was used to test the proposed
EANN-CCA model while the remaining nine subsamples
were used as training data The process of cross validation was
repeated 10 times by producing the model outputs based on a
dataset of known data These outputs were then averaged over
the rounds to provide an estimate of the model performance
We also conducted jackknife estimation for three pre-
dicted flood quantiles (q10 q50 and q100) using the model
involving river network types In the jackknife procedure
each gauged site in the study area was removed temporarily
from the database in every trial and considered as an
ungauged location Subsequently regional estimates for the
site were obtained using an EANN-CCA model that was
trained based on the data from the remaining locations For
the model used in this study various numbers of neurons
were tested to identify the optimal number of hidden neu-
rons Generally when very few neurons are used an
underfitting problem could arise because of insufficient
complexity to produce a functional relationship between
input and output systems On the other hand when many
neurons are used an overfitting problem could arise because
the number of training cases is inadequate Considering
these factors in their analyses Shu and Ouarda (2007)
identified the number of neurons in RFA ranging from three
to eight We also used various numbers of hidden neurons
ranging from 2 to 17 in estimating flood quantiles It was
found that fewer than five hidden neurons provided superior
estimates We used five hidden neurons as proposed by Shu
and Ouarda (2007) and an ensemble size of 14 indicating
14 ANN members and averages of the networks to produce
a unique output (flood quantile)
The EANN-CCA model used in our study was assessed
further using five measures namely the NashndashSutcliffe effi-
ciency (NSE) root-mean-square error (RMSE) relative root-
mean-square error (rRMSE) mean absolute error (MAE)
and relative mean bias (rBIAS) The five measures are defined
by the following equations respectively
NSE5 12n
i51
(qi2 q
i)2
n
i51
(qi2 q
i)2
(12)
RMSE5
ffiffiffiffiffiffiffiffiffiffiffiffiffiffiffiffiffiffiffiffiffiffiffiffiffiffiffiffiffi1
nn
i51
(qi2 q
i)2
s (13)
rRMSE5 1003
ffiffiffiffiffiffiffiffiffiffiffiffiffiffiffiffiffiffiffiffiffiffiffiffiffiffiffiffiffiffiffiffi1
nn
i51
qi2 q
i
qi
2s
(14)
MAE51
nn
i51
jqi2 q
ij (15)
rBIAS5100
nn
i51
qi2 q
i
qi
(16)
where n indicates the total number of basins used in the anal-
ysis qi represents the at-site estimate for location i qi implies
the mean of at-site estimate and qi represents the RFA flood
estimate for location i
3 Results
a Models without river network classification assessed
via tenfold cross validation
The proposed EANN-CCA model was applied to the 105
river basins to estimate three flood quantiles corresponding
to generally used return periods (q10 q50 and q100) In the
analysis we used the new physiographical andmeteorological
variables (ADI TJA Tc and 3EXP) related to river network
characteristics with the seven variables (7Var) used in pre-
vious studies Based on the collected variables we examined
the flood quantile estimation by considering homogenous
regions defined by river network classification In section 3a
the classification was not applied in estimating the flood
quantiles implying that the definition of the homogenous
regions in RFA was not considered In addition we investi-
gated whether adding the new variables representing drain-
age network dynamics could improve quantile estimation
We applied the tenfold cross-validation procedure to this
model to validate the model performance We conducted
several case studies using various combinations of variables
to identify the parameters that would produce the optimal
performance To ensure generalizability we examined the
sizes of the ensemble in the EANN-CCA model We found
that with an extremely large ensemble the training time in-
creased and when it was extremely small generalizability
would be insufficient We selected an ensemble size of 14
in the EANN-CCA model process as has been suggested by
Shu and Ouarda (2007)
FIG 3 EANN-CCA model process for regional frequency estimation of hydrological variables
JANUARY 2021 JUNG ET AL 207
Unauthenticated | Downloaded 030922 0422 AM UTC
An EANN-CCA model with 10 variables (7Var ADI
TJA and Tc) was employed to determine an optimal com-
bination of variables for flood quantile estimates Figure 4
shows the plot of the RMSE values based on four variable
combinations (7Var 7Var 1 ADI 7Var 1 ADI 1 TJA and
7Var1ADI1TJA1Tc) for the three quantiles as a function
of the number of hidden neurons (ranging from 2 to 17) The
three cases including 7Var 7Var 1ADI and 7Var 1ADI 1TJA appeared to produce a superior performance based on a
number of neurons ranging from four to six On the other
hand the RMSE for most input variable combinations
(7Var 1 ADI 1 TJA 1 Tc) tended to increase using more
than two neurons
Figure 4 indicates that the RMSE values decrease grad-
ually when the new variables are included For example the
EANN-CCA model using 7Var 1ADI produced a superior
performance compared with the model with 7Var for all
quantiles Further the model using 7Var 1 ADI 1 TJA
shows decreased RMSE values especially for the q50 and
q100 quantiles The model using 7Var 1 ADI 1 TJA 1 Tc
however showed the optimal performance The lowest
RMSE values of 0043 0110 and 0163 were achieved for
the q10 q50 and q100 quantiles respectively using this
combination of variables We found that including the ADI
variable improved the model performance However high
RMSE values and strong fluctuations were observed with
large numbers of hidden neurons This could be ascribed to
EANN-CCA models with many hidden neurons having
sufficient training cases to properly train all the neurons
during the procedure
We also examined the effect of the 3EXP variables on the
model performance for the three quantiles The perfor-
mance of the EANN-CCA model using 7Var 1 ADI 13EXP was superior compared with the model with 7Var 1ADI However when we added the Tc variable there was no
improvement in the RMSE values The behavior of the
model using 7Var 1 ADI 1 3EXP 1 TJA was similar to
that of the model using 7Var 1 ADI 1 3EXP 1 Tc The
combination 3EXP 1 Tc or 3EXP 1 TJA did not appear to
improve the model performance Furthermore the perfor-
mance of the model using a combination of 7Var 1 ADI 1TJA1 Tc 1 3EXP was the worst The results suggested that
the adoption of redundant variables in RFA could lead to
unnecessarily complex models that reduce overall model
performance
Further we investigated combinations of other variables
without ADI to determine how such other variables affected
model performance Adding the variables TJA and Tc to the
model with 7Var led to a gradual improvement in the perfor-
mance However the best RMSE value derived from the
model using 7Var1 TJA1 Tcwas inferior to the worst RMSE
values derived from the model with 7Var1ADI1 TJA1 Tc
The performance was achieved with the combination 7Var 1ADI1 TJA1 Tc The performance of the model with 7Var13EXP 1 TJA1 Tc was similar or inferior to that of the model
using 7Var 1 TJA 1 Tc The performance of the model using
FIG 4 RMSE of the EANN-CCA model for 105 stations based on the cross-validation method for four case
studies (7Var 7Var1ADI 7Var1ADI1 TJA 7Var1ADI1 TJA1 Tc) for the three quantiles with a number
of hidden neurons increasing from 2 to 17
208 JOURNAL OF HYDROMETEOROLOGY VOLUME 22
Unauthenticated | Downloaded 030922 0422 AM UTC
7Var1 3EXP1Tc appeared to be inferior to that of themodel
with 7Var 1 3EXP
b Models without river network classification assessed viajackknife validation
We evaluated the EANN-CCA model with different
combinations of variables for the three quantiles (q10 q50
and q100) using the jackknife validation procedure The
RMSE and rRMSE indices were used to assess the predictive
accuracy of the models in absolute and relative terms and the
MAE and rBIAS indices were used to identify eventual
overestimation and underestimation of flood quantile esti-
mates Table 2 shows the evaluation results of themodels with
7Var and 7Var 1 ADI 1 TJA 1 Tc the model that achieved
superior performance in the tenfold cross-validation proce-
dure The performance of themodelwith 7Var1ADI1TJA1Tc was superior to that of the model with 7Var for the five
indices
TABLE 2 Jackknife validation results based on the EANN-CAAmodel for q10 q50 and q100 quantiles using 105 river basins in arid and
semiarid regions The bold font indicates the best-performing approach for each quantile
q10 q50 q100
7Var 7Var 1 ADI 1 TJA 1 Tc 7Var 7Var 1 ADI 1 TJA 1 Tc 7Var 7Var 1 ADI 1 TJA 1 Tc
NSE 0513 0628 0491 0546 0434 0452
RMSE 0071 0062 0169 0158 0261 0253rRMSE () 18677 9992 18324 12254 20234 13653
MAE 0017 0010 0038 0026 0054 0043
rBIAS () 26210 22495 25247 23468 26258 24197
FIG 5 Jackknife estimation for three quantiles (q10 q50 and q100) using themodel with 7Var (7 variables) and the
model with 7Var 1 ADI 1 TJA 1 Tc (10 variables)
JANUARY 2021 JUNG ET AL 209
Unauthenticated | Downloaded 030922 0422 AM UTC
Figure 5 shows a plot of the regional estimates as a function
of the local estimates for all three quantiles based on the
models using 7Var and 7Var 1 ADI 1 TJA 1 Tc Regional
estimates include those obtained from the proposed model
using the jackknife validation technique whereas local esti-
mates include at-site observations of the quantiles We deter-
mined that the model using 7Var1ADI1 TJA1 Tc provided
optimal estimates according to the tenfold cross-validation and
jackknife methods and we only plotted the results for these two
combinations Figure 5 shows that the estimation error is re-
duced for sites with low quantile values However the models
appear to underestimate these values at sites with high quantile
values This could be ascribed to inadequate training data
available in the variable space for the RFA procedures
Although Fig 5 appears to show no obvious difference be-
tween the results for 7Var and 7Var 1 ADI 1 TJA 1 Tc the
values of the statistical indices including NSE RMSE rRMSE
MAE and rBIAS improved when we used the model with
7Var 1ADI 1 TJA1 Tc The NSE shows a range from 0513
to 0434 with 7Var and a range from 0628 to 0452 with 7Var1ADI 1 TJA 1 Tc for the q10 q50 and q100 quantiles The
RMSE values and the rRMSE values of 7Var range from 0071
to 0261 and range from 18677 to 20234 whereas the RMSE
values and rRMSE of 7Var 1 ADI 1 TJA 1 Tc range from
0062 to 0253 and range from 9992 to 13562 for the three
quantiles Further The MAE values and the rBIAS values of
7Var range from 0017 to 0054 and range from 26210
to26258 whereas theMAEvalues and rBIASof 7Var1ADI1TJA 1 Tc range from 0010 to 0043 and range from 22495
to 24197 for the q10 q50 and q100 quantiles The relative
statistical indices of 7Var 1 ADI 1 TJA 1 Tc clearly show
superior performance compared with the indices of Var7
In practical hydrology a change of even 1 in the estimation
of a design quantile for a dam could translate into a cost dif-
ference of tens of millions of dollars
c River network classification
River network classification data are used in RFA to define
homogenous regions in arid and semiarid regions Different
drainage network types are associated with different hydro-
logical responses Therefore we expect that the use of infor-
mation on drainage network types could improve homogenous
group delineation In the present work we identified different
river network types using the power-law exponents proposed
by Jung et al (2015) for the channel network classification of
105 river networks Among these 49 were dendritic 36 were
pinnate and 20 were trellis networks These classified river
networks were used to define homogenous regions in our study
d Models with river network classification using tenfoldcross validation
Forty-nine dendritic networks were identified in the 105
drainage networks Figure 6 shows the plot of the RMSE values
of the EANN-CCA model using 7Var1 ADI1 TJA1 Tc as a
FIG 6 RMSE of the EANN-CCAmodel for dendritic networks using the cross-validation method for four case
studies (7Var 7Var1ADI 7Var1ADI1 TJA 7Var1ADI1 TJA1 Tc) for the three quantiles with a number
of hidden neurons increasing from 2 to 17
210 JOURNAL OF HYDROMETEOROLOGY VOLUME 22
Unauthenticated | Downloaded 030922 0422 AM UTC
function of the number of hidden neurons ranging from 2
to 17 for the three quantiles of the dendritic networks
Figure 6 indicates that the model performance improved
when ADI TJA and Tc are added to the 7Var variables for
quantile q10 However the models using 7Var 1 ADI 1 TJA
and 7Var 1 ADI 1 TJA 1 Tc show similar RMSE values for
quantiles q50 and q100 The EANN-CCA model with 7Var
shows large RMSE fluctuations as using 7Var alone with a
small number of stations is not sufficient to produce stable
results for the RFA procedure
Among the 105 river networks 36 drainage networks were
identified as pinnate networks Figure 7 shows the RMSE
values of models using four variable combinations to assess
model performance in these networks The performance of the
7Var 1 ADI model was superior to that of the model using
7Var However adding the TJA and Tc variables to the models
led to only minor improvements for the estimates in each
quantile Figure 7 also shows that the proposed models ap-
peared to suffer from overfitting owing to insufficient training
cases for large numbers of hidden neurons
Twenty trellis river networks were identified among the 105
drainage networks Figure 8 shows the RMSE values for
models with different numbers of hidden neurons in trellis
networks There was no significant improvement when we used
the models with 7Var 1 ADI and 7Var 1 ADI 1 TJA com-
pared with the model with 7Var The performance of the
model using 7Var1ADI1 TJA1 Tc is superior to that of the
model based on 7Var Substantial fluctuation is also observed
for the models using 7Var 7Var 1 ADI and 7Var 1 ADI 1TJA with several hidden neurons This could be ascribed
to the small number of stations which affects the accuracy
of the RFA procedures
e Models with classification versus models
without classification
In this section we discuss the effectiveness of using drainage
network types (dendritic pinnate and trellis) in defining ho-
mogenous regions to derive flood quantile estimates For this
purpose we conducted RFA using the EANN-CCA model
with 7Var1ADI1TJA1Tc To determine whether the river
network type classifications improved model performance
through the improved delineation of homogenous regions we
examined models based on classified versus unclassified river
networks For the model with unclassified channel networks
that were not defined as homogenous regions 49 36 and 20
drainage networks indicating the number of dendritic pinnate
and trellis networks respectively were selected randomly
from the 105 channel networks Figure 9 shows the RMSE
values for groups 49 36 and 20 river networks for quantiles
q10 q50 and q100 respectively The figure shows the results
obtained from the analysis with river network classification in
which homogenous regions were delineated and the results of
the analysis without river network classification with homog-
enous regions not delineated
FIG 7 RMSE of the EANN-CCA model for pinnate networks using the cross-validation method for four case
studies (7Var 7Var1ADI 7Var1ADI1 TJA 7Var1ADI1 TJA1 Tc) for the three quantiles with a number
of hidden neurons increasing from 2 to 17
JANUARY 2021 JUNG ET AL 211
Unauthenticated | Downloaded 030922 0422 AM UTC
Figure 9 shows that the results for dendritic and trellis net-
works based on river network classification are superior to
those obtained without river network classification for the
three quantiles The results corresponding to trellis networks
show a particularly significant improvement in association with
the use of drainage network classification However opposite
results are shown for pinnate networks ie the performance of
models without river network classification was superior to
those with river network classification This could be ascribed
to the characteristics of pinnate networks being more complex
compared with those of other network types This aspect would
need to be investigated in futurework Further the development
and feature of pinnate networks are not clear Several authors
have attempted to identify the differences between other
FIG 8 RMSE of the EANN-CCA model for trellis networks using the cross-validation method for four case
studies (7Var 7Var1ADI 7Var1ADI1 TJA 7Var1ADI1 TJA1 Tc) for the three quantiles with a number
of hidden neurons increasing from 2 to 17
FIG 9 RMSE of the EANN-CCAmodel using the cross-validationmethod for the classified networks and for the randomnetworks based
on 7Var 1 ADI 1 TJA 1 Tc with the three quantiles changing a number of hidden neurons from 2 to 17
212 JOURNAL OF HYDROMETEOROLOGY VOLUME 22
Unauthenticated | Downloaded 030922 0422 AM UTC
networks and pinnate networks however this is beyond the
scope of the present study (Phillips andSchumm1987Mejia and
Niemann 2008 Jung et al 2011 Jung andOuarda 2015) In these
studies the regional slopes of rivers or surface characteristics
such as sandy loams clay loams and erodible surfaces were
shown to affect river network classifications In addition com-
bining variables such as the arid index and tributary junction
angle proposed in the study for RFA at arid and semiarid re-
gions could affect the performances of the models with and
without classification Other geomorphological features that
differ between the different river networks and the effect of
these features on hydrological models should be considered in
detail in the future
Table 3 shows the statistical indices NSE RMSE rRMSE
MAE and rBIAS for themodel with 7Var1ADI1TJA1Tc
As shown in the table we compared the results for the river
networks without and with classification based on the q10 q50
and q100 quantiles The classified networks for dendritic and
trellis networks tend to produce superior performance with the
indices compared with the unclassified networks for the three
quantiles as shown in Fig 9 The networks classified as pinnate
tend to show inferior performance compared with the unclas-
sified networks except for the q100 quantile with rRMSE and
rBIAS In the analysis of Jennings et al 1994 various regional
regression equations were used to estimate the frequency and
magnitude of floods at ungauged locations in each state of the
United States These authors examined multivariate regional
statistical relationships between stream climate and geomor-
phology to calculate flood-flow statistics They also investi-
gated typical approaches to streamflow prediction based on the
delineation of geographical areas with similar patterns for
flows at ungauged sites Their results showed that the estimates
of floods were reasonable and provided estimates similar to
station data (Jennings et al 1994) These typical regression
equations and approaches should be considered for compari-
son with the proposed method in estimating hydrological var-
iables in future work
4 Conclusions
In the present study we proposed using river network in-
formation related to the dynamics of river basins to improve
the performance of RFA models The analysis involved 105
river basins in arid and semiarid regions of the United States
For the structure of themodel the CCA approach and anANN
ensemble method were applied for estimation of the flood
quantiles (q10 q50 and q100) Based on the EANN-CCA
model we determined whether the physiographical and me-
teorological variables including ADI TJA Tc and 3EXP
affected the model performance Further we used river net-
work classification to enhance flood quantile estimates by de-
fining homogenous regions
Tenfold cross- and jackknife validation techniques were
used as resampling approaches to evaluate the performance of
EANN-CCA models employing different combinations of
variables (7Var ADI TJA Tc and 3EXP) Among several
combinations we used the model with variables 7Var1ADI1TJA 1 Tc produced a superior performance in estimating the
three quantiles The performance of the model with the pro-
posed variables was superior compared with a model with
7Var The performance of themodel using 7Var1ADI1TJA1Tc was enhanced gradually by adding the variables ADI TJA
and Tc to 7Var However when we included 3EXP in 7Var
1 ADI 1 TJA 1 Tc the model performed poorly Some var-
iables were not adequately representative of the hydrological
processes
TABLE 3 Results based on the 7Var 1 ADI 1 TJA 1 Tc model with q10 q50 and q100 quantiles for consideration of river network
classification including the dendritic network pinnate network and trellis network The bold font indicates the best-performing approach
for each quantile
q10 q50 q100
Unclassified Dendritic Unclassified Dendritic Unclassified Dendritic
NSE 0511 0648 0481 0557 0474 0493RMSE 0074 0050 0236 0219 0562 0516
rRMSE () 123837 86305 189260 139712 310780 185099
MAE 0005 0004 0053 0042 0162 0105
rBIAS () 251103 231244 282767 264573 2153376 286526
Unclassified Pinnate Unclassified Pinnate Unclassified Pinnate
NSE 0601 0589 0577 0594 0515 0548
RMSE 0158 0185 0253 0389 0328 0506
rRMSE () 67403 120927 83705 105390 104397 82675
MAE 0055 0068 0082 0167 0108 0209
rBIAS () 219436 245881 222342 234187 233806 221390
Unclassified Trellis Unclassified Trellis Unclassified Trellis
NSE 0501 0585 0472 0602 0374 0527
RMSE 0038 0029 0043 0031 0051 0036rRMSE () 66370 39635 144444 31962 151153 30282
MAE 0007 0011 0013 0009 0010 0003
rBIAS () 219871 212348 238756 25456 279984 26280
JANUARY 2021 JUNG ET AL 213
Unauthenticated | Downloaded 030922 0422 AM UTC
For the identification of the effect of river network classifi-
cation in RFA 49 of the 105 drainage networks were identified
as dendritic 36 as pinnate and 20 as trellis The various net-
work types were used to define the homogenous regions The
performance of the model with 7Var 1 ADI 1 TJA 1 Tc was
assessed for each network type based on the RMSE values for
the three flood quantiles Adding the variables TJA and Tc to
the model using 7Var 1 ADI produced stable results The
model using homogenous regions defined through river net-
work classification was compared with the model without ho-
mogenous regions The results showed that the performance of
the model with classification was superior compared with that
of the model without classification for the dendritic and trellis
networks However for pinnate networks the model without
classification appeared to produce superior performance
Future studies should employ data from a larger number
of river basins in arid and semiarid regions and other cli-
mates to study the value of river network information in
various RFA procedures Studies should also explore the
use of physical data such as geology and land use to classify
river basins Future efforts could also focus on the use of
river network classification in multivariate RFA procedures
and in combination of local and regional analysis ie where
it is important to adequately delineate homogenous regions
for the target site
Acknowledgments This research was supported by the Basic
Science Research Program of the National Research Foundation
of Korea (NRF) funded by the Ministry of Education (Grant
2019R1I1A1A01061109) There are no conflicts of interest to
declare
Data availability statement The hydrological variables were
obtained from the US Geological Survey (httpswwwusgs
gov) For the physiographical variables DEMs were obtained
from the National Elevation Dataset (httpsviewernationalmap
govbasic) The meteorological variables were acquired from the
Parameter-Elevation Regressions on Independent Slopes Model
(httpwwwprismoregonstateedu) The data supporting the
findings of this study are available from the corresponding author
on reasonable request
REFERENCES
Abdi A Y Hassanzadeh and T B M J Ouarda 2017a
Regional frequency analysis using Growing Neural Gas
network J Hydrol 550 92ndash102 httpsdoiorg101016
jjhydrol201704047
mdashmdash mdashmdash S Talatahari A Fakheri-Fard R Mirabbasi and
T B M J Ouarda 2017b Multivariate regional frequency
analysis Two new methods to increase the accuracy of mea-
sures Adv Water Resour 107 290ndash300 httpsdoiorg
101016jadvwatres201707006
Abrahams A D and J J Flint 1983 Geological controls on
the topological properties of some trellis channel networks
Geol Soc Amer Bull 94 80ndash91 httpsdoiorg101130
0016-7606(1983)9480GCOTTP20CO2
Alobaidi M H P R Marpu T B M J Ouarda and
F Chebana 2015 Regional frequency analysis at ungauged
sites using a two-stage resampling generalized ensemble
framework Adv Water Resour 84 103ndash111 httpsdoiorg
101016jadvwatres201507019
Argialas D J Lyon and O Mintzer 1988 Quantitative descrip-
tion and classification of drainage patternsPhotogramm Eng
Remote Sens 54 505ndash509
Aziz K A Rahman G Fang and S Shrestha 2014 Application of
artificial neural networks in regional flood frequency analysis A
case study for Australia Stochastic Environ Res Risk Assess
28 541ndash554 httpsdoiorg101007s00477-013-0771-5
Beable M E and A I McKerchar 1982 Regional flood esti-
mation inNewZealandWater and Soil Tech Publ 20 139 pp
Besaw L D M Rizzo P R Bierman and W R Hackett 2010
Advances in ungauged streamflow prediction using artificial
neural networks J Hydrol 386 27ndash37 httpsdoiorg
101016jjhydrol201002037
Burbank D W 1992 Causes of recent Himalayan uplift de-
duced from deposited patterns in the Ganges basin Nature
357 680ndash683 httpsdoiorg101038357680a0
Cannon A J and P H Whitfield 2002 Downscaling recent
streamflow conditions in British Columbia Canada using en-
semble neural network models J Hydrol 259 136ndash151
httpsdoiorg101016S0022-1694(01)00581-9
Castellarin A D H Burn and A Brath 2001 Assessing the ef-
fectiveness of hydrological similarity measures for flood fre-
quency analysis J Hydrol 241 270ndash285 httpsdoiorg
101016S0022-1694(00)00383-8
Chebana F and T B M J Ouarda 2007 Multivariate L-moment
homogeneity test Water Resour Res 43 W08406 https
doiorg1010292006WR005639
mdashmdash and mdashmdash 2008 Depth and homogeneity in regional flood
frequency analysis Water Resour Res 44 W11422 https
doiorg1010292007WR006771
mdashmdash and mdashmdash 2009 Index flood-based multivariate regional fre-
quency analysis Water Resour Res 45 W10435 https
doiorg1010292008WR007490
ChokmaniK T BM J Ouarda S HamiltonMHGhedira and
H Gingras 2008 Comparison of ice-affected streamflow es-
timates computed using artificial neural networks andmultiple
regression techniques J Hydrol 349 383ndash396 httpsdoiorg
101016jjhydrol200711024
Cox K G 1989 The role of mantle plumes in the development of
continental drainage patterns Nature 342 873ndash877 https
doiorg101038342873a0
Dalrymple T 1960 Flood-frequency analyses Manual of Hydrology
Part 3 Flood-flow techniques USGS Water-Supply Paper
1543-A 80 pp httpspubsusgsgovwsp1543areportpdf
Daniel J 1981 Drainage density as an index of climatic geo-
morphology J Hydrol 50 147ndash154 httpsdoiorg101016
0022-1694(81)90065-2
Daniell TM 1991 Neural networkApplication in hydrology and
water resources engineering Int Hydrology Water Resources
Symp Perth Australia Institute of Engineers 797ndash802
Dawson CW andR LWilby 2001 Hydrological modelling using
artificial neural networks Prog Phys Geogr 25 80ndash108
httpsdoiorg101177030913330102500104
mdashmdash R J Abrahart A Y Shamseldin and R L Wilby 2006
Flood estimation at ungauged sites using artificial neural
networks J Hydrol 319 391ndash409 httpsdoiorg101016
jjhydrol200507032
Dietterich TG 1997Machine-learning researchAIMag 18 (4)
97 httpsdoiorg101609aimagv18i41324
Durocher M F Chebana and T B M J Ouarda 2016
Delineation of homogenous regions using hydrological
214 JOURNAL OF HYDROMETEOROLOGY VOLUME 22
Unauthenticated | Downloaded 030922 0422 AM UTC
variables predicted by projection pursuit regressionHydrol
Earth Syst Sci 20 4717ndash4729 httpsdoiorg105194hess-20-
4717-2016
Durrans S R and S Tomic 1996 Regionalization of low-flow
frequency estimates An Alabama case study J Amer
Water Resour Assoc 32 23ndash37 httpsdoiorg101111
j1752-16881996tb03431x
Faridzad M T Yang K Hsu S Sorooshian and C Xiao 2018
Rainfall frequency analysis for ungauged regions using re-
motely sensed precipitation information J Hydrol 563
123ndash142 httpsdoiorg101016jjhydrol201805071
Farquharson F A K J R Meigh and J V Sutcliffe 1992
Regional flood frequency analysis in arid and semi-arid areas
J Hydrol 138 487ndash501 httpsdoiorg1010160022-1694(92)
90132-F
Flavell D 1983 Design flood estimation in Western Australia
WaterwayAnalysis andDesign NAASRABEC 1983 Seminar
Adelaide South Australia Australia National Association of
Australian State Road Authorities 23 pp
Folmar N D and A C Miller 2000 Historical perspective of the
NRCS lag time equation Transportation Research Board 70th
Annual Meeting Washington DC Transportation Research
Board
Gloaguen R P R Marpu and I Niemeyer 2007 Automatic
extraction of faults and fractal analysis from remote sensing
data Nonlinear Processes Geophys 14 131ndash138 https
doiorg105194npg-14-131-2007
Gonzalez R T B M J Ouarda P R Marpu M M Allam
E A B Eltahir and S Pearson 2016 Water budget analysis
in arid regions application to the United Arab Emirates
Water 8 415 httpsdoiorg103390w8090415
Govindaraju R S 2000Artificial neural networks in hydrology II
Hydrological applications J Hydrol Eng 5 124ndash137 https
doiorg101061(ASCE)1084-0699(2000)52(124)
Grover P L D H Burn and J M Cunderlik 2002 A comparison
of index flood estimation procedures for ungauged catchments
Can J Civ Eng 29 734ndash741 httpsdoiorg101139l02-065
Hackney C and P Carling 2011 The occurrence of obtuse junction
angles and changes in channel width below tributaries along the
MekongRiver south-eastAsiaEarthSurf ProcessesLandforms
36 1563ndash1576 httpsdoiorg101002esp2165
Haddad K and A Rahman 2012 Regional flood frequency anal-
ysis in eastern Australia Bayesian GLS regression-based
methods within fixed region and ROI frameworkndashQuantile
Regression vs Parameter Regression Technique J Hydrol
430ndash431 142ndash161 httpsdoiorg101016jjhydrol201202012
Hagan M T and M B Menhaj 1994 Training feedforward
networks with the Marquardt algorithm IEEE Trans Neural
Netw 5 989ndash993 httpsdoiorg10110972329697
HamonW R 1960 Estimating potential evapotranspiration BS
thesis Massachusetts Institute of Technology 75 pp
Horton R E 1945 Erosional development of streams and their
drainage basins hydrophysical approach to quantitative mor-
phology Geol Soc Amer Bull 56 275ndash370 httpsdoiorg
1011300016-7606(1945)56[275EDOSAT]20CO2
Hosking J and J RWallis 1993 Some statistics useful in regional
frequency analysis Water Resour Res 29 271ndash281 https
doiorg10102992WR01980
mdashmdash and mdashmdash 1997 Regional Frequency Analysis An Approach
Based on L-Moments Cambridge University Press 242 pp
Howard A D 1967 Drainage analysis in geologic interpretation A
summation Amer Assoc Pet Geol Bull 51 2246ndash2259 https
doiorg1013065D25C26D-16C1-11D7-8645000102C1865D
Hua J Z Liang and Z Yu 2003 A modified rational formula
for flood design in small basins J Amer Water Resour
Assoc 39 1017ndash1025 httpsdoiorg101111j1752-1688
2003tb03689x
Ichoku C and J Chorowicz 1994 A numerical approach to the
analysis and classification of channel network patterns Water
Resour Res 30 161ndash174 httpsdoiorg10102993WR02279
Jennings M EW O Thomas Jr and H C Riggs 1994 Nationwide
summary ofUSGeological Survey regional regression equations
for estimating magnitude and frequency of floods for ungaged
sites 1993 USGSWater-Resources Investigations Rep 94-4002
196 pp httpsdoiorg103133wri944002
Jung K and T B M J Ouarda 2015 Analysis and classification
of channel network types for intermittent streams in the
United Arab Emirates and Oman J Civil Environ Eng 5
1000183 httpsdoiorg1041722165-784X1000183
mdashmdash J D Niemann and X Huang 2011 Under what conditions
do parallel river networks occur Geomorphology 132 260ndash
271 httpsdoiorg101016jgeomorph201105014
mdashmdash P R Marpu and T B M J Ouarda 2015 Improved clas-
sification of drainage networks using junction angles and
secondary tributary lengths Geomorphology 239 41ndash47
httpsdoiorg101016jgeomorph201503004
mdashmdash mdashmdash and mdashmdash 2017 Impact of river network type on the
time of concentrationArab J Geosci 10 546 httpsdoiorg
101007s12517-017-3323-3
mdashmdash E Kim and B Kang 2019 Estimation of low-flow in South
Korean river basins using a Canonical CorrelationAnalysis and
Neural Network (CCA-NN) based regional frequency analysis
Atmosphere 10 695 httpsdoiorg103390atmos10110695
Kendall M G 1948 Rank Correlation Methods Charles Griffin
160 pp
Kjeldsen T R andD A Jones 2010 Predicting the index flood in
ungauged UK catchments On the link between data-transfer
and spatial model error structure J Hydrol 387 1ndash9 https
doiorg101016jjhydrol201003024
Luk K C J E Ball and A Sharma 2001 An application of ar-
tificial neural networks for rainfall forecastingMath Comput
Modell 33 683ndash693 httpsdoiorg101016S0895-7177(00)
00272-7
Maliva R and TMissimer 2012Aridity and droughtAridLands
Water Evaluation and Management Springer 21ndash39
Matalas N C J R Slack and J R Wallis 1975 Regional skew in
search of a parent Water Resour Res 11 815ndash826 https
doiorg101029WR011i006p00815
Mejia A I and J D Niemann 2008 Identification and char-
acterization of dendritic parallel pinnate rectangular and
trellis networks based on deviations from planform self-
similarity J Geophys Res 113 F02015 httpsdoiorg
1010292007JF000781
Miller R G 1964 A trustworthy jackknife Ann Math Stat 35
1594ndash1605 httpsdoiorg101214aoms1177700384
Mosaffaie J 2015 Comparison of two methods of regional flood
frequency analysis by using L-momentsWater Res 42 313ndash321
httpsdoiorg101134S0097807815030112
Mosley M P 1972 An experimental study of rill erosion MS
thesis Colorado State University 118 pp
Muttiah R S R Srinivasan and P M Allen 1997 Prediction of
two year peak stream discharges using neural networks
J Amer Water Resour Assoc 33 625ndash630 httpsdoiorg
101111j1752-16881997tb03537x
Ouarda T B M J and C Shu 2009 Regional low-flow fre-
quency analysis using single and ensemble artificial neural
JANUARY 2021 JUNG ET AL 215
Unauthenticated | Downloaded 030922 0422 AM UTC
networks Water Resour Res 45 W11428 httpsdoiorg
1010292008WR007196
mdashmdash C Girard G S Cavadias and B Bobeacutee 2001 Regional
flood frequency estimation with canonical correlation anal-
ysis J Hydrol 254 157ndash173 httpsdoiorg101016S0022-
1694(01)00488-7
mdashmdash C Charron and A St-Hilaire 2008 Statistical models and
the estimation of low flowsCanWater Resour J 33 195ndash206httpsdoiorg104296cwrj3302195
mdashmdash mdashmdash Y Hundecha A St-Hilaire and F Chebana 2018
Introduction of the GAM model for regional low-flow fre-
quency analysis at ungauged basins and comparison with
commonly used approaches Environ Modell Software 109
256ndash271 httpsdoiorg101016jenvsoft201808031
Pallard B A Castellarin and A Montanari 2009 A look at
the links between drainage density and flood statistics
Hydrol Earth Syst Sci 13 1019ndash1029 httpsdoiorg
105194hess-13-1019-2009
Pandey G R and V T V Nguyen 1999 A comparative study of
regression basedmethods in regional flood frequency analysis
J Hydrol 225 92ndash101 httpsdoiorg101016S0022-1694(99)
00135-3
Parvis M 1950 Drainage pattern significance in airphoto identi-
fication of soils and bedrocksPhotogramm Eng 16 375ndash409
Phillips L F and S Schumm 1987 Effect of regional slope on
drainage networks Geology 15 813ndash816 httpsdoiorg
1011300091-7613(1987)15813EORSOD20CO2
Rahman A C Charron T B M J Ouarda and F Chebana
2018 Development of regional flood frequency analysis
techniques using generalized additive models for Australia
Stochastic Environ Res Risk Assess 32 123ndash139 https
doiorg101007s00477-017-1384-1
Requena A I T B M J Ouarda and F Chebana 2017 Flood
frequency analysis at ungauged sites based on regionally es-
timated streamflows J Hydrometeor 18 2521ndash2539 https
doiorg101175JHM-D-16-01431
mdashmdashmdashmdash andmdashmdash 2018 Low-flow frequency analysis at ungauged
sites based on regionally estimated streamflows J Hydrol 563
523ndash532 httpsdoiorg101016jjhydrol201806016
SeidouO TBM JOuardaMBarbet PBruneau andBBobeacutee2006 A parametric Bayesian combination of local and regional
information in flood frequency analysisWater Resour Res 42
W11408 httpsdoiorg1010292005WR004397
Shao J and D Tu 2012 The Jackknife and Bootstrap Springer
Science amp Business Media 517 pp
Sharifi S and S M Hosseini 2011 Methodology for identi-
fying the best equations for estimating the time of con-
centration of watersheds in a particular region J Irrig
Drain Eng 137 712ndash719 httpsdoiorg101061(ASCE)
IR1943-47740000373
ShuC andDHBurn 2004Artificial neural network ensembles and
their application in pooled flood frequency analysis Water
Resour Res 40W09301 httpsdoiorg1010292003WR002816
mdashmdash and T B M J Ouarda 2007 Flood frequency analysis at
ungauged sites using artificial neural networks in canonical
correlation analysis physiographic space Water Resour Res
43 W07438 httpsdoiorg1010292006WR005142
Stadler S J 1987 Aridity indexes Climatology Springer 102ndash107
Turan M E and M A Yurdusev 2009 River flow estima-
tion from upstream flow records by artificial intelligence
methods J Hydrol 369 71ndash77 httpsdoiorg101016
jjhydrol200902004
Velde B J Dubois G Touchard andABadri 1990 Fractal analysis
of fractures in rocks The Cantorrsquos dust method Tectonophysics
179 345ndash352 httpsdoiorg1010160040-1951(90)90300-W
Wald A and J Wolfowitz 1943 An exact test for randomness in
the non-parametric case based on serial correlationAnnMath
Stat 14 378ndash388 httpsdoiorg101214aoms1177731358
Walton K 1969 The Arid Zones Aldine Publishing Co 175 pp
Ward J H 1963 Hierarchical grouping to optimize an objective
function J Amer Stat Assoc 58 236ndash244 httpsdoiorg
10108001621459196310500845
Wazneh H F Chebana and T B M J Ouarda 2016
Identification of hydrological neighborhoods for regional
flood frequency analysis using statistical depth function
Adv Water Resour 94 251ndash263 httpsdoiorg101016
jadvwatres201605013
Wilcoxon F 1945 Individual comparisons by ranking methods
Biom Bull 1 80ndash83 httpsdoiorg1023073001968
Wong T S 2005 Assessment of time of concentration formulas
for overland flow J Irrig Drain Eng 131 383ndash387 https
doiorg101061(ASCE)0733-9437(2005)1314(383)
Zaman M A A Rahman and K Haddad 2012 Regional
flood frequency analysis in arid regions A case study for
Australia J Hydrol 475 74ndash83 httpsdoiorg101016
jjhydrol201208054
216 JOURNAL OF HYDROMETEOROLOGY VOLUME 22
Unauthenticated | Downloaded 030922 0422 AM UTC
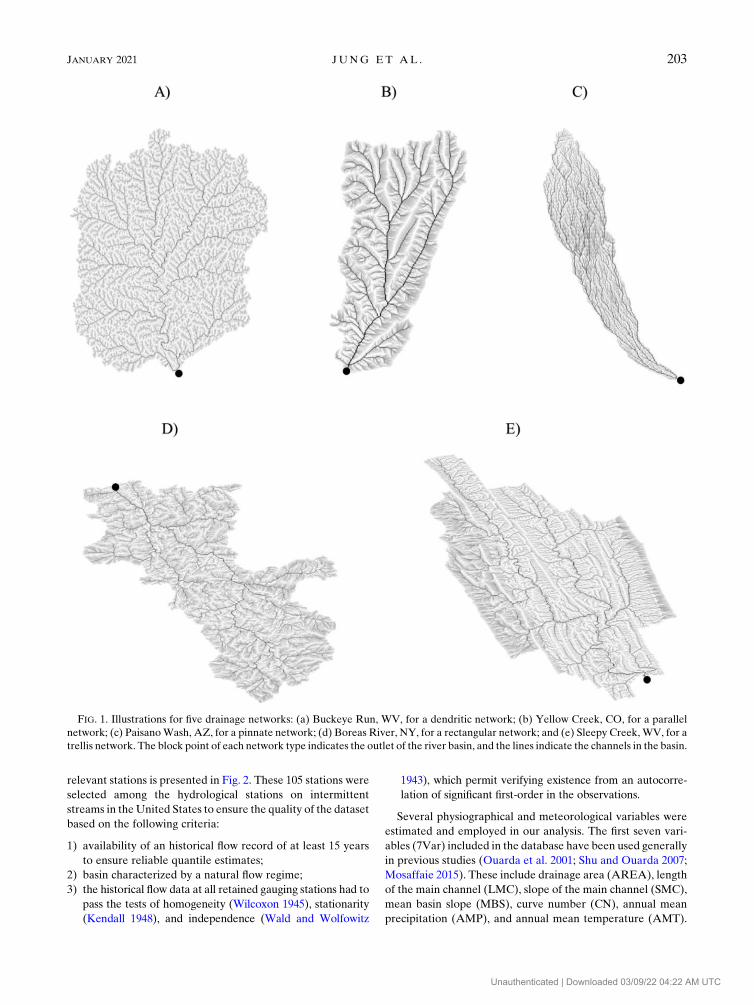
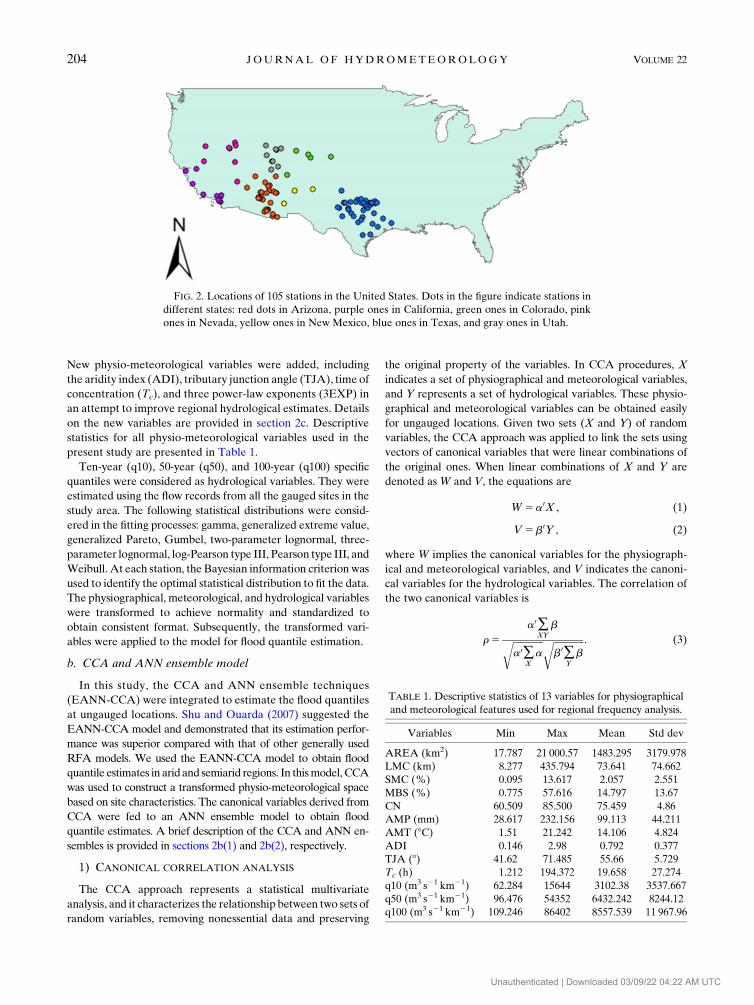
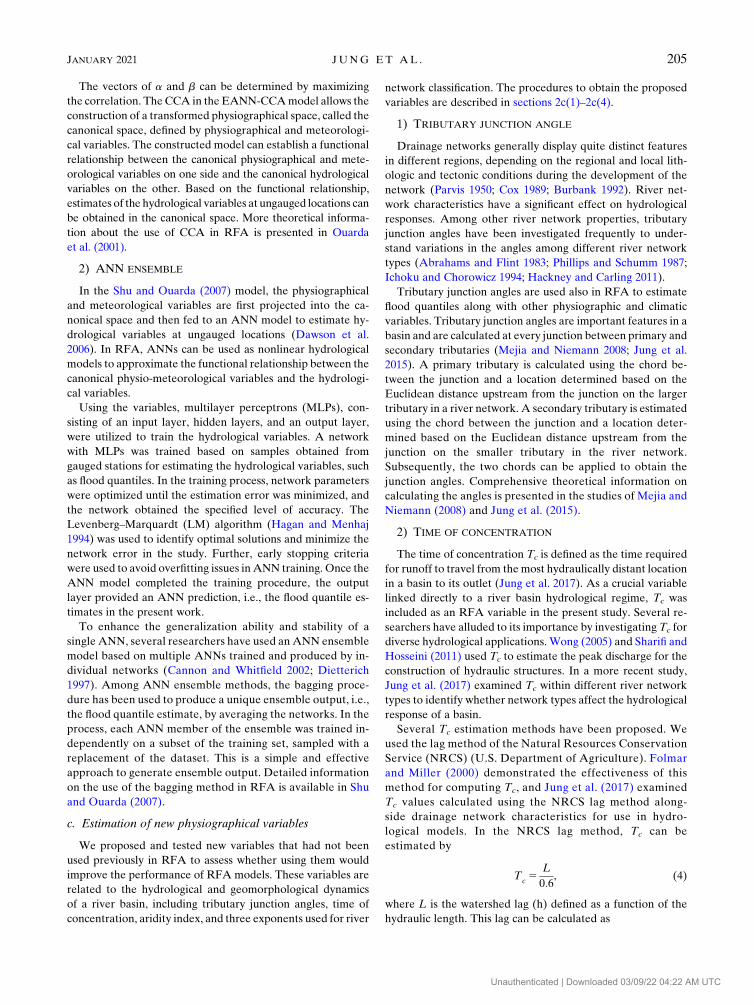
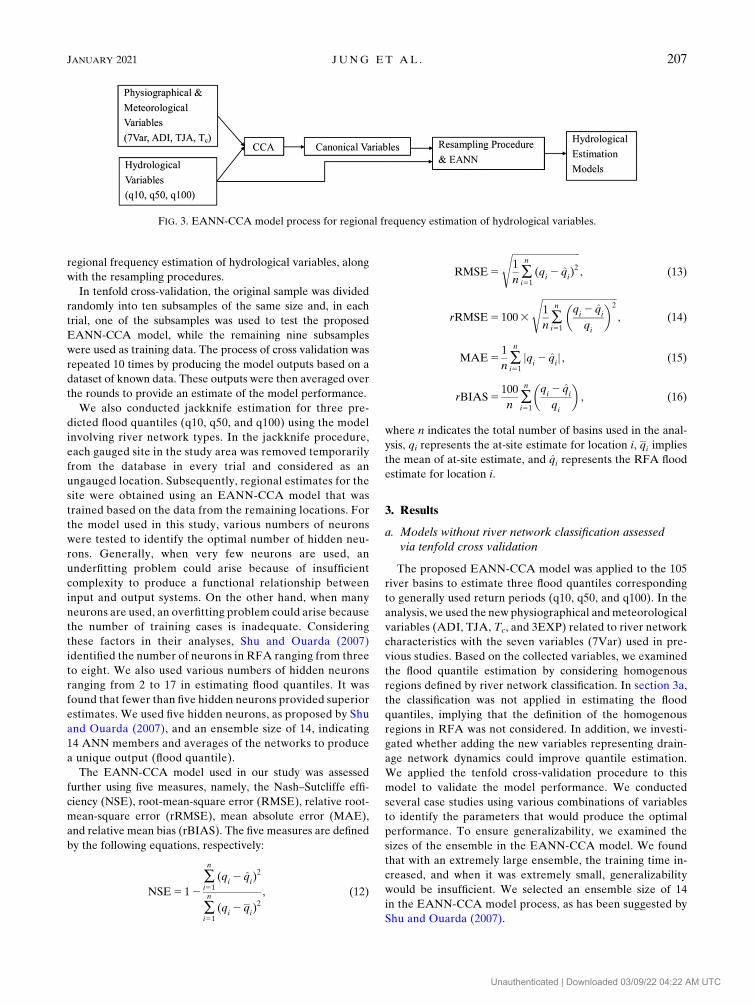
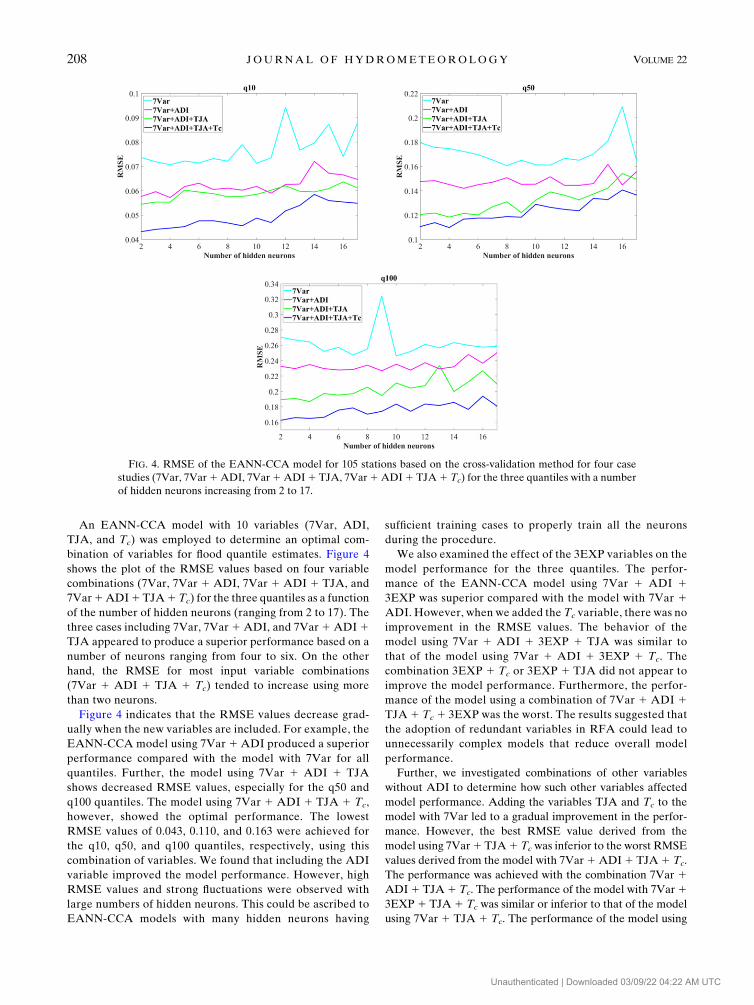
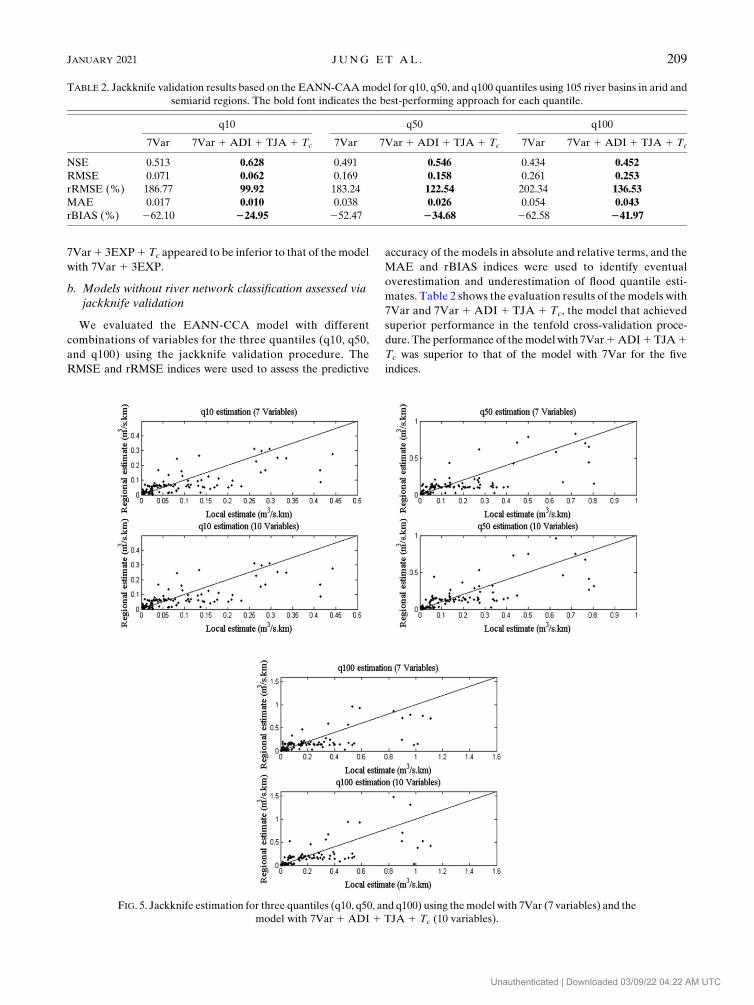
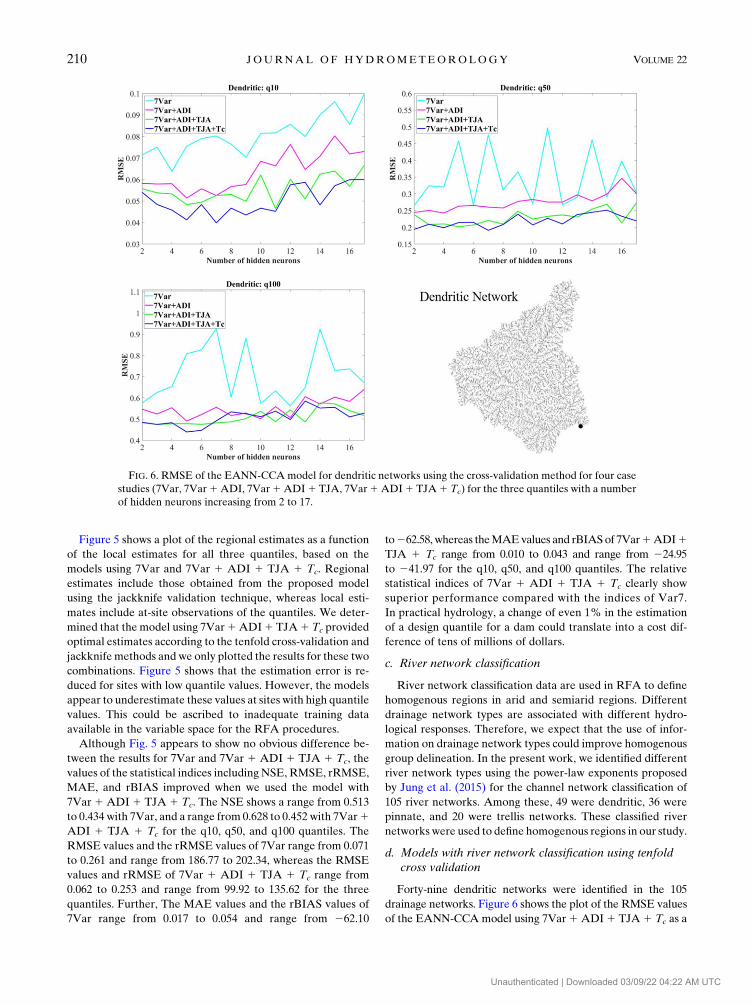
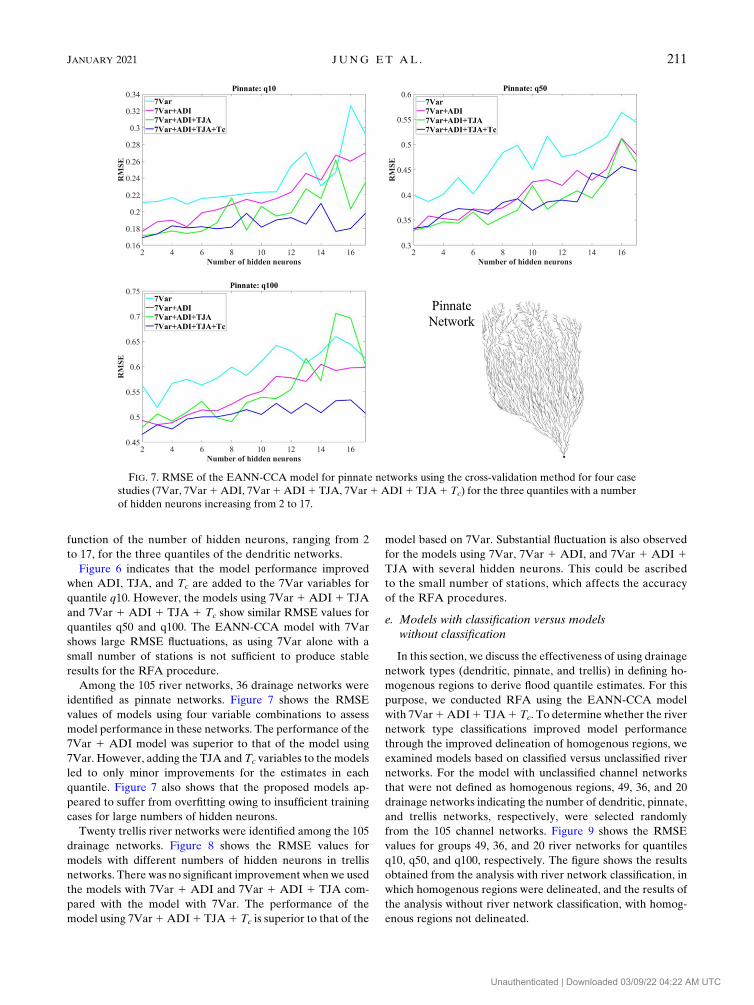
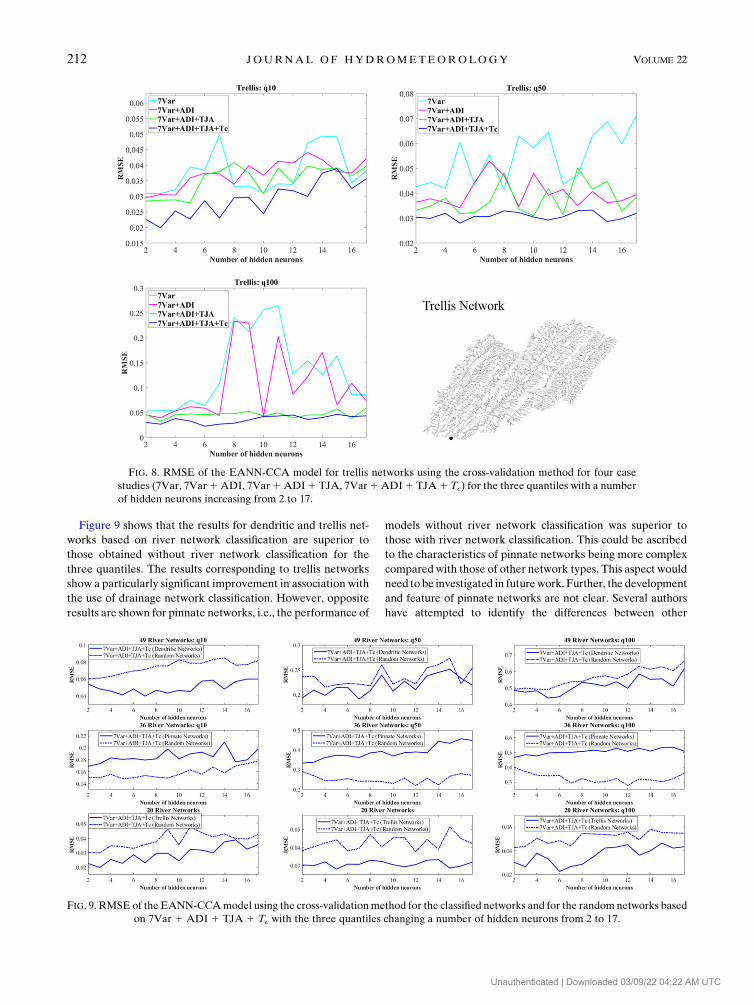
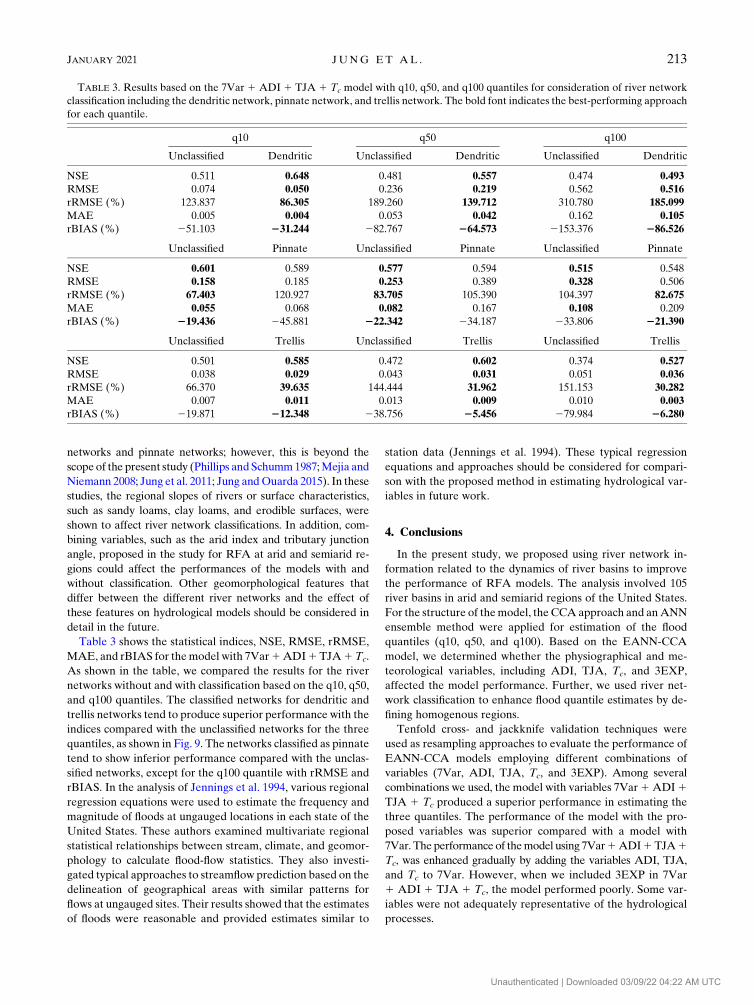