rationale - cenviro
TRANSCRIPT
RATIONALE
UNFOLDING HORIZONS
The cover of our Sustainability Report 2011 showcases the evolutionof our operations as we move towards greener pastures. We are inthe midst of transforming our business from a successful wastemanagement provider to a high growth environmental enterprisedelivering diversified environmental solutions. This is aptly capturedin the theme of our 2011 report, “Unfolding Horizons”.
We embraced all advancements in other environmental solutions and related areas. We have also expanded our portfolio to include more challenging, yet rewarding opportunities. As we grow, we will continue to emphasise environmental protection to achieve a greener horizon.
2 UEM EnvironmentSustainability Report 2011|
CONTENTS04
05
06
08
10
15
16
17
17
19
20
22
28
39
48
65
76
79
80
82
86
87
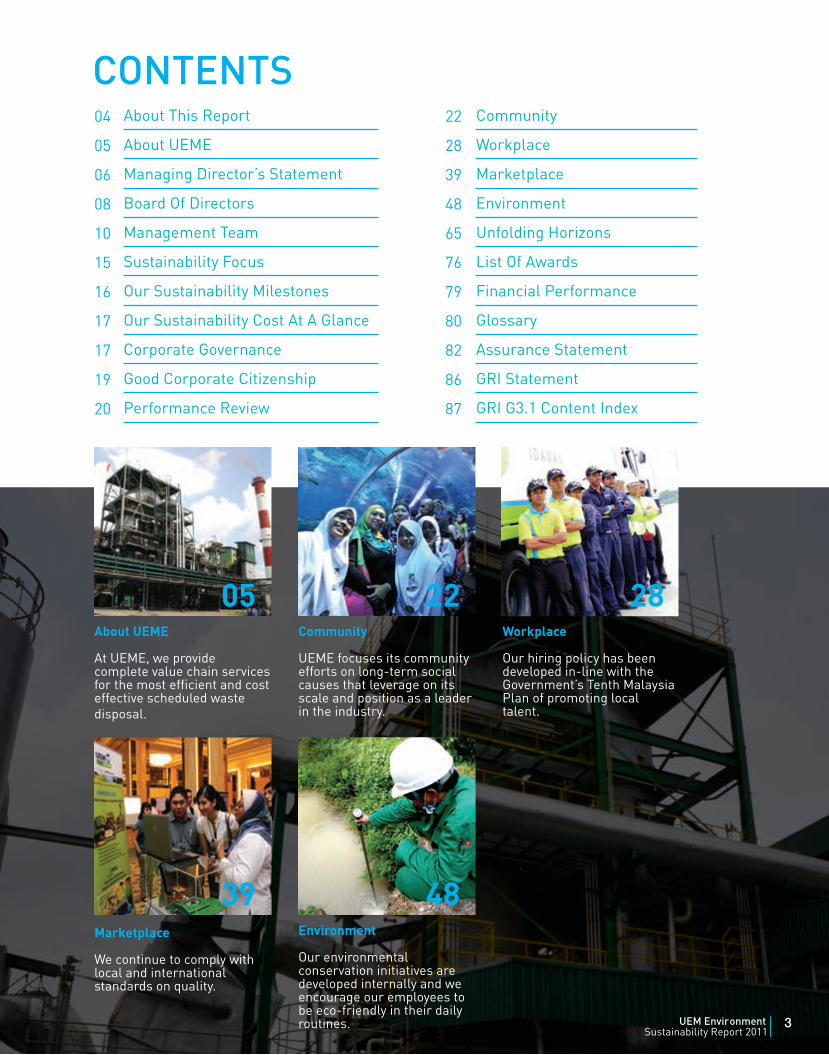
Community
Workplace
Marketplace
Environment
Unfolding Horizons
List Of Awards
Financial Performance
Glossary
Assurance Statement
GRI Statement
GRI G3.1 Content Index
About This Report
About UEME
Managing Director’s Statement
Board Of Directors
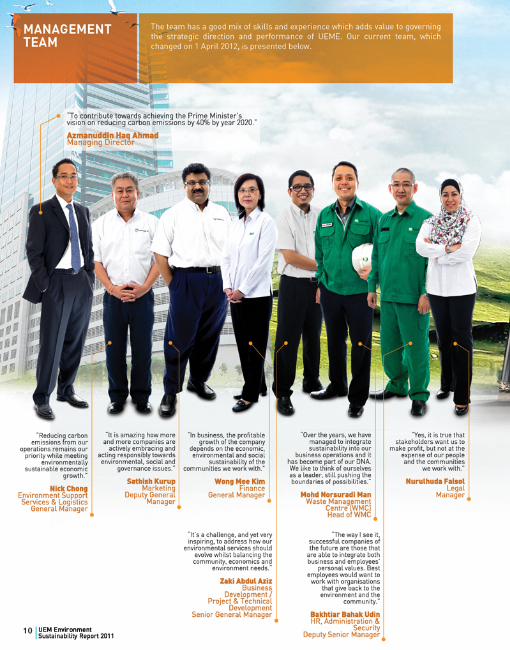
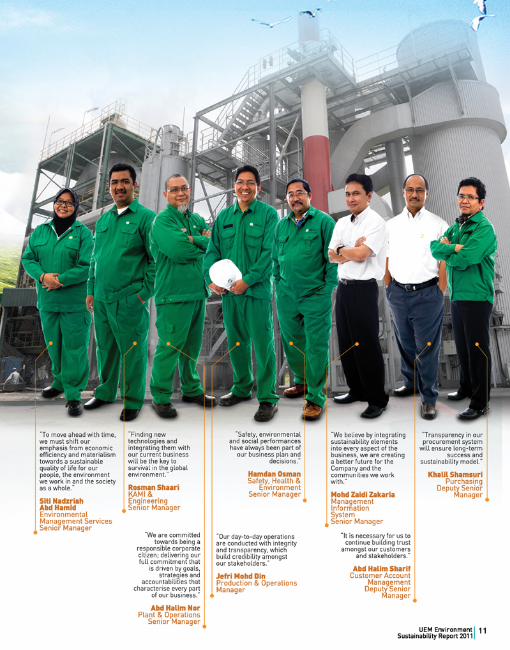
Management Team
Sustainability Focus
Our Sustainability Milestones
Our Sustainability Cost At A Glance
Corporate Governance
Good Corporate Citizenship
Performance Review
About UEME
At UEME, we provide complete value chain services for the most efficient and cost effective scheduled waste disposal.
Community
UEME focuses its community efforts on long-term social causes that leverage on its scale and position as a leader in the industry.
Workplace
Our hiring policy has been developed in-line with theGovernment’s Tenth Malaysia Plan of promoting localtalent.
48Environment
Our environmental conservation initiatives are developed internally and we encourage our employees to be eco-friendly in their daily routines.
05 22 28
Marketplace
We continue to comply with local and international standards on quality.
39
3UEM EnvironmentSustainability Report 2011|
01
04
02
03
01 www.globalreporting.org/reporting/latest-guidelines/g3-1-guidelines/Pagesvzdefault.aspx02 www.bursamalaysia.com/website/bm/about_us/the_organisation/csr/downloads/csr_writeup.pdf03 www.pcg.gov.my/trans_manual.asp04 www.iso.org/iso/iso_catalogue/management_and_leadership_standards/social_responsibility/ sr_discovering_iso26000.htm
In this Report, we commissioned comprehensive stakeholder analyses and materiality tests to identify and highlight major issues of interest to our stakeholders and develop an approach to these issues. This Report highlights our strategies, achievements and way forward for sustainability management, particularly in the areas of sustainable environmental management, community, ethics in the marketplace and corporate culture.
Scope of Report
Reporting Period : 1 January to 31 December 2011Reporting Cycle : AnnuallyCoverage :
Reference and Guidelines
Principal Guidelines• GRI-G3.1 Sustainability Reporting Framework
Additional Guidelines• Bursa Malaysia’s Corporate Social Responsibility (CSR) Framework• Silver Book: The Putrajaya Committee GLC Transformation Manual• ACCA Malaysia Sustainable Reporting Guidelines for Malaysian Companies• ISO 26000:2010 Guidance on Social Responsibility
Reliability of Information DisclosedWe strive to improve the materiality and reliability of the information presented and have adopted an approach aligned with the ISO 26000:2010, Guidance on Social Responsibility. The content of this Report has been verified and independently reviewed by Bureau Veritas Certification (M) Sdn Bhd and the assurance statement can be found on page 82. It has also been assessed by the Global Reporting Initiative (GRI) for how comprehensively we have applied the latest GRI-G3.1 guidelines to achieve a top application level of A+. The GRI results statement can be found on page 86.
UEME’s approach to sustainability is widely endorsed by its stakeholders. This is reflected in the many awards and certifications it has received from respected, independent organisations in the assessment of UEME’s performance as disclosed in the Report.
More information can be found on our website at www.kualitialam.com. We also welcome your comments. Please e-mail us at: [email protected].
Alternatively, you may contact:
Corporate Communications Department13-1, Mercu UEMJalan Stesen Sentral 5Kuala Lumpur Sentral50470 Kuala LumpurMalaysiaTel : +603 2727 6100Fax : +603 2727 2100
UEME and its subsidiaries Kualiti Alam Sdn Bhd (KASB), Kualiti Khidmat Alam Sdn Bhd (KKA), Kualiti Kitar Alam Sdn Bhd (KKI), Special Builders Sdn Bhd (SBSB) and Abu Dhabi Kualiti Alam Environmental Services Limited Liability Company (ADKA). E-Idaman Sdn Bhd (EISB), is a Joint Venture Company (JVC). Subsidiaries refer to all companies in which UEME holds a majority stake or has direct managerial control. A JVC refers to a contractual agreement between UEME and a third party company for the purpose of executing a particular business undertaking. Reference to “UEME”, “the Company”, “the Organisation” and “we” refer to UEM Environment Sdn Bhd and/or our affiliates and subsidiaries.
ABOUT THIS REPORT
This is the seventh Sustainability Report (Report) produced by UEM Environment Sdn Bhd (UEME). It covers our responsibilities to our stakeholders and the contributions we have made towards achieving sustainable development.
Link to website
References toother publications
4 UEM EnvironmentSustainability Report 2011|
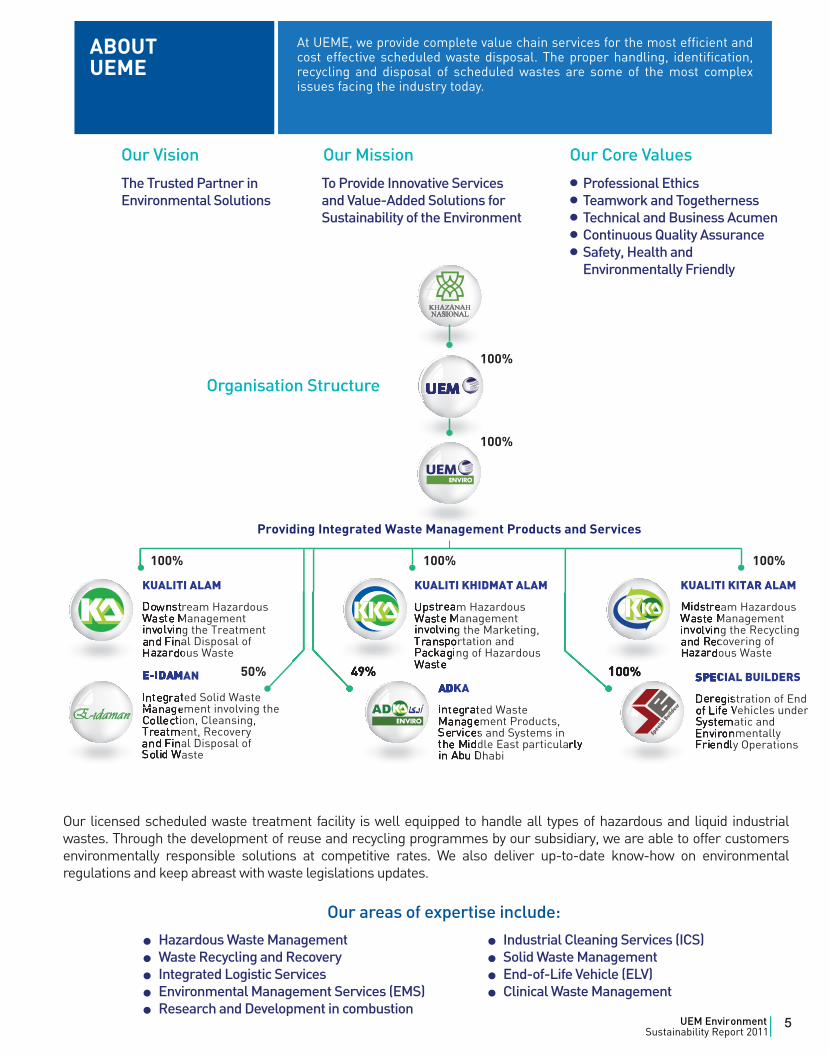
ABOUTUEME
At UEME, we provide complete value chain services for the most efficient and cost effective scheduled waste disposal. The proper handling, identification, recycling and disposal of scheduled wastes are some of the most complex issues facing the industry today.
5UEM EnvironmentSustainability Report 2011|
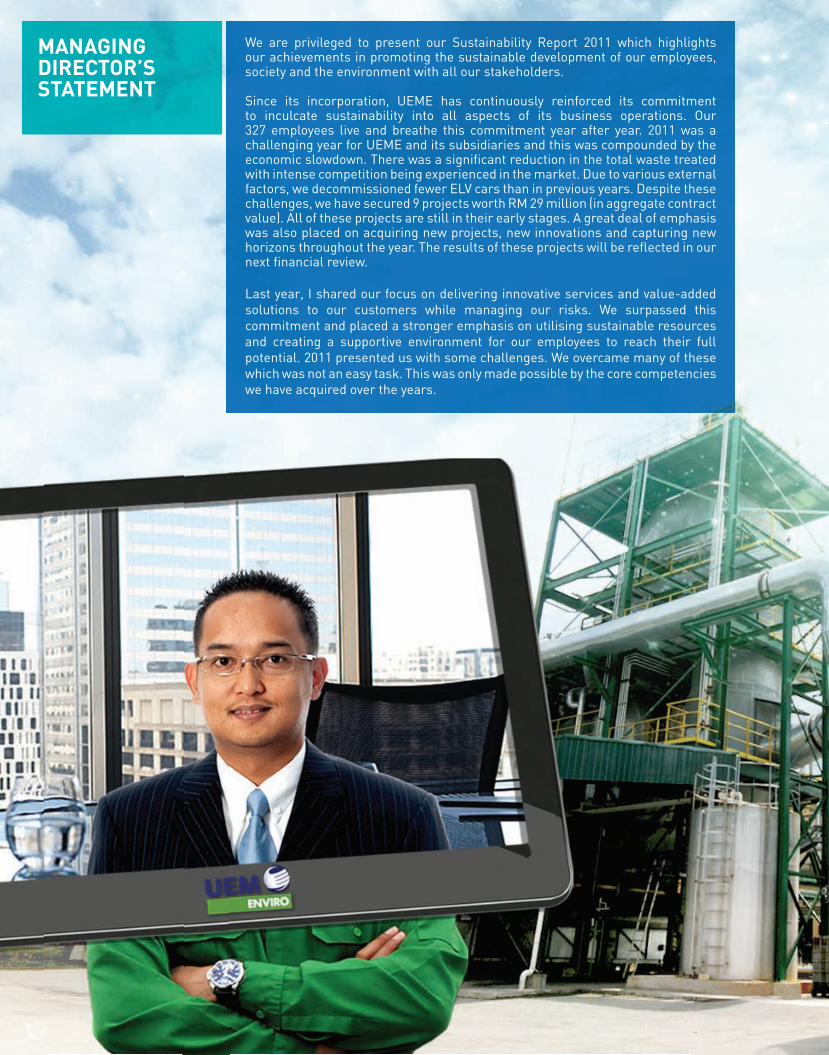
MANAGINGDIRECTOR’SSTATEMENT
We are privileged to present our Sustainability Report 2011 which highlights our achievements in promoting the sustainable development of our employees, society and the environment with all our stakeholders.
Since its incorporation, UEME has continuously reinforced its commitment to inculcate sustainability into all aspects of its business operations. Our 327 employees live and breathe this commitment year after year. 2011 was a challenging year for UEME and its subsidiaries and this was compounded by the economic slowdown. There was a significant reduction in the total waste treated with intense competition being experienced in the market. Due to various external factors, we decommissioned fewer ELV cars than in previous years. Despite these challenges, we have secured 9 projects worth RM 29 million (in aggregate contract value). All of these projects are still in their early stages. A great deal of emphasis was also placed on acquiring new projects, new innovations and capturing new horizons throughout the year. The results of these projects will be reflected in our next financial review.
Last year, I shared our focus on delivering innovative services and value-added solutions to our customers while managing our risks. We surpassed this commitment and placed a stronger emphasis on utilising sustainable resources and creating a supportive environment for our employees to reach their full potential. 2011 presented us with some challenges. We overcame many of these which was not an easy task. This was only made possible by the core competencies we have acquired over the years.
01
02
03
04
01 www.frost.com/prod/servlet/press-release.pag?docid=20944637402 www.malaysiandigest.com/news/31561-muhyiddin-privatization-of-solid-waste- management-will-raise-standard-of-service.html03 www.kpkt.gov.my/jpspn/main.php?Content=articles&ArticleID=57&IID=04 www2.accaglobal.com/pubs/malaysia/general/sustainability/archive/my10_jud.pdf
We had expanded our horizons geographically and increased our areas of focus with potential projects in Qatar pursued by our subsidiary, KASB. Our advisory services focus on sustainable and effective management of hazardous waste. We positioned ourselves as a total solutions provider and effective integrated wastewater management facility for wastewater management strategies.
UEME was also granted a temporary licence to treat clinical waste in 2011. This was the result of the request from the Ministry of Health (MOH) to assist 1 of the concession companies in managing the clinical waste backlog problem which occurred in the middle of the year. Our Incinerator (INC) 4 facility is now fully equipped to deal with this waste which received a total of 4,665 MT between June and December 2011. We see great business potential in treating clinical waste. This is supported by a Frost & Sullivan survey published in 2010 which estimated that Malaysia’s clinical waste may reach 33,000 MT annually by 2020 from the current 16,560 MT.
We have sufficient capacity in our plant to treat clinical waste. This combined with the positive outlook has led to our application for a full licence from the Department of Environment (DOE) to allow us to transport and treat clinical waste.
On 19 September 2011, EISB has secured a 22-year Concession Agreement (CA) with the Federal Government to manage solid waste collection and public cleansing management covering 12 Local Authorities in Kedah and 1 in Perlis. The CA came into force on 1 September 2011 in conjunction with the full implementation of the Solid Waste and Public Cleansing Management Act 2007 (Act 672).
Our Continuous Improvement Programme is testament to our commitment in delivering value to our customers. Our Acetylene Gas Processing Plant began full operations in 2011 where gas cylinders were treated with a 42% efficiency rate. 3 of our plants, an Oily Sludge Pre-treatment, a Spent Caustic Pre-treatment and a Sludge Destabilisation System (SDS), received approval by the DOE in 2011. All plants began generating savings and should be fully operational in 2012.
At UEME, sustainability is not just a catchword but a platform for us to create new value streams for the future. It is a key element of our growth strategy encompassing operations, employees, partners and customers. We believe this strong focus and commitment will support the long-term growth aspirations of UEME.
The diversity of our people serves as an engine for innovation. In 2011, we invested an additional 20% to train and develop our employees which resulted in an average of 7 additional training hours per employee. We always aim to be an employer of choice and grow symbiotically with them. Our commitment to our employees will not waver. We will continue to provide them with various talent development platforms and opportunities.
In the marketplace, we closely engaged with our suppliers and customers to deliver quality services and efficient supply chain management. We aim to fully migrate and implement an Electronic Integrated Waste Information System (EIWIS) by January 2012 which provides valuable benefits for UEME and its customers. This new centralised web-based tracking system platform provides comprehensive modules and a systematic approach providing greater efficiency and improved accessibility.
UEME is never complacent as we strive for greater achievements and improve our innovations. In reporting, we have made our metrics clearer and our data more transparent. The level of disclosure in this Report has resulted in a more holistic representation of our sustainability efforts and operations. Delivering integrated sustainability reporting is just one of the many initiatives we are undertaking to increase our transparency.
UEME was accorded with the highest honours, receiving the Reporting on Environmental Performance award at the Association of Chartered Certified Accountants (ACCA) Malaysia Sustainability Reporting Awards (MaSRA) 2011. The award, which we won for the fifth consecutive year, recognised our reporting on best practices in the areas of social, environmental and economic sustainability.
UEME will continue in its efforts and move closer in becoming Malaysia’s leading environmental solutions provider. We will continue to create value through sustainable business practices with an emphasis on mutual growth, compliance, environmental management, customers and social responsibility.
On behalf of the Board, I would like to thank all our stakeholders for their continuous dedication, commitment and contributions to making our business and country more sustainable. As always, we hope you find our report useful and informative. We appreciate your feedback for words are vital for the development of our future.
Azmanuddin Haq AhmadManaging Director
7UEM EnvironmentSustainability Report 2011|
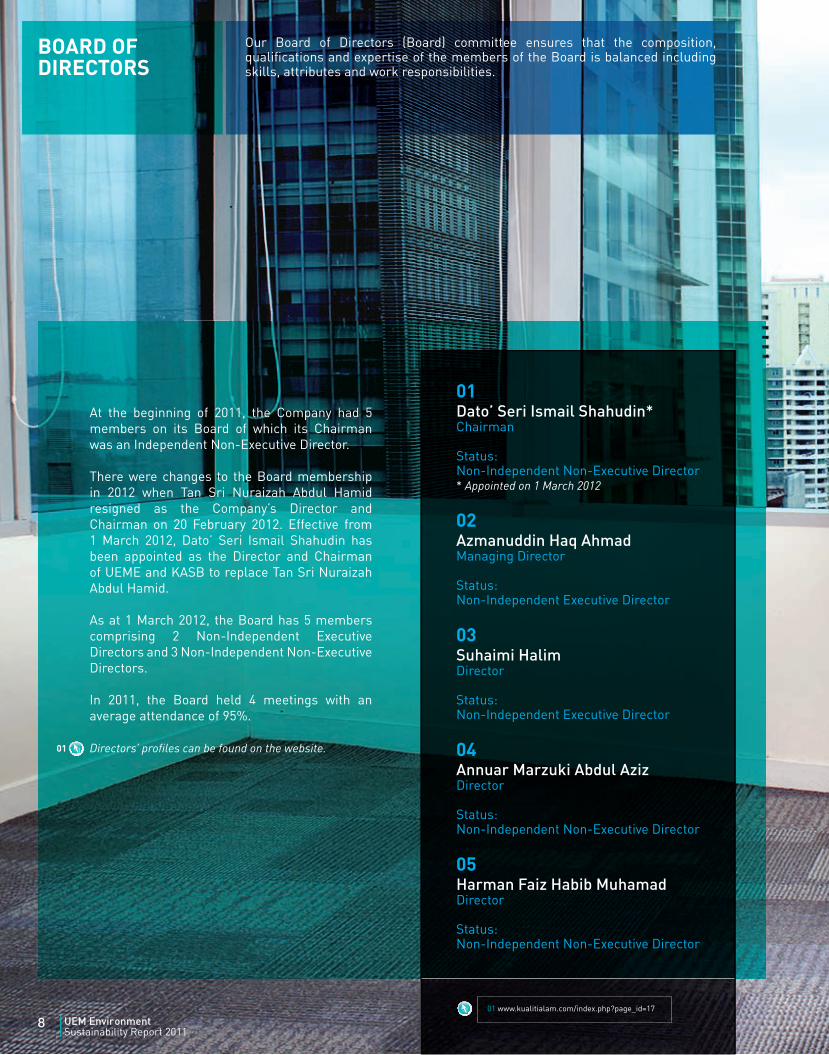
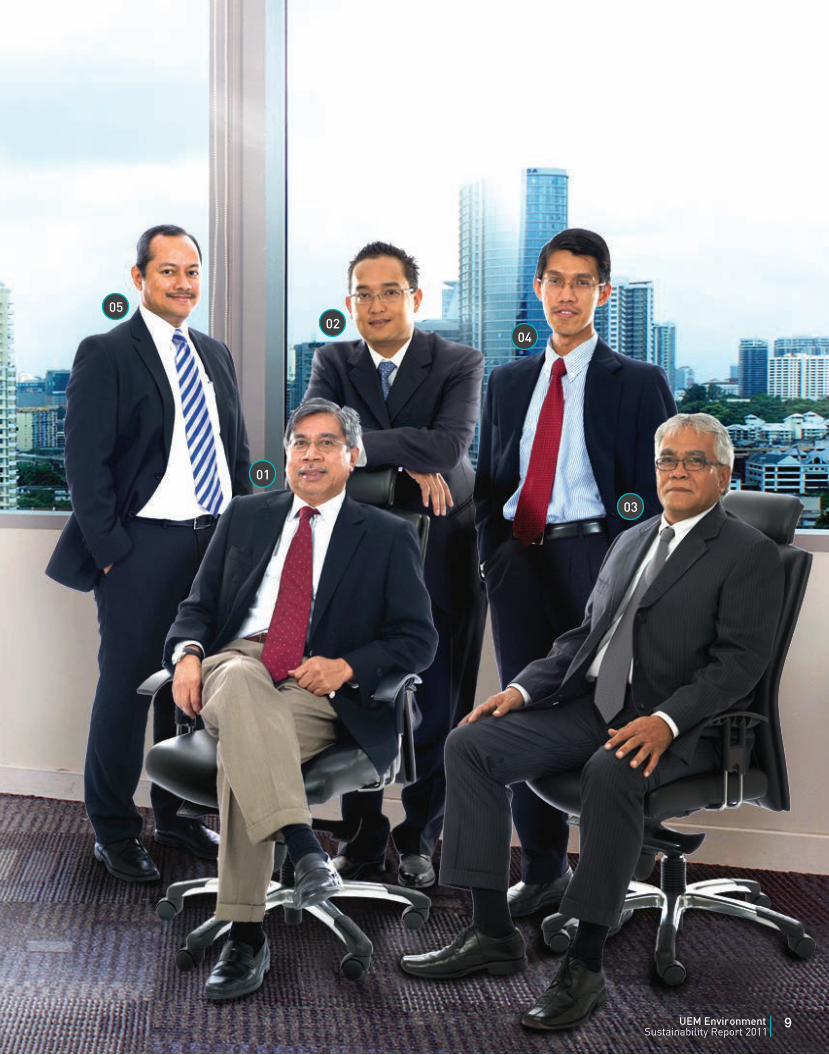
BOARD OFDIRECTORS
01Dato’ Seri Ismail Shahudin*Chairman
Status:Non-Independent Non-Executive Director* Appointed on 1 March 2012
02Azmanuddin Haq AhmadManaging Director
Status:Non-Independent Executive Director
03Suhaimi HalimDirector
Status:Non-Independent Executive Director
04Annuar Marzuki Abdul AzizDirector
Status:Non-Independent Non-Executive Director
05Harman Faiz Habib MuhamadDirector
Status:Non-Independent Non-Executive Director
At the beginning of 2011, the Company had 5 members on its Board of which its Chairman was an Independent Non-Executive Director.
There were changes to the Board membership in 2012 when Tan Sri Nuraizah Abdul Hamid resigned as the Company’s Director and Chairman on 20 February 2012. Effective from 1 March 2012, Dato’ Seri Ismail Shahudin has been appointed as the Director and Chairman of UEME and KASB to replace Tan Sri Nuraizah Abdul Hamid.
As at 1 March 2012, the Board has 5 members comprising 2 Non-Independent Executive Directors and 3 Non-Independent Non-Executive Directors.
In 2011, the Board held 4 meetings with an average attendance of 95%.
Directors’ profiles can be found on the website.01
01 www.kualitialam.com/index.php?page_id=17
Our Board of Directors (Board) committee ensures that the composition, qualifications and expertise of the members of the Board is balanced including skills, attributes and work responsibilities.
8 UEM EnvironmentSustainability Report 2011|
01
03
0502
04
9UEM EnvironmentSustainability Report 2011|
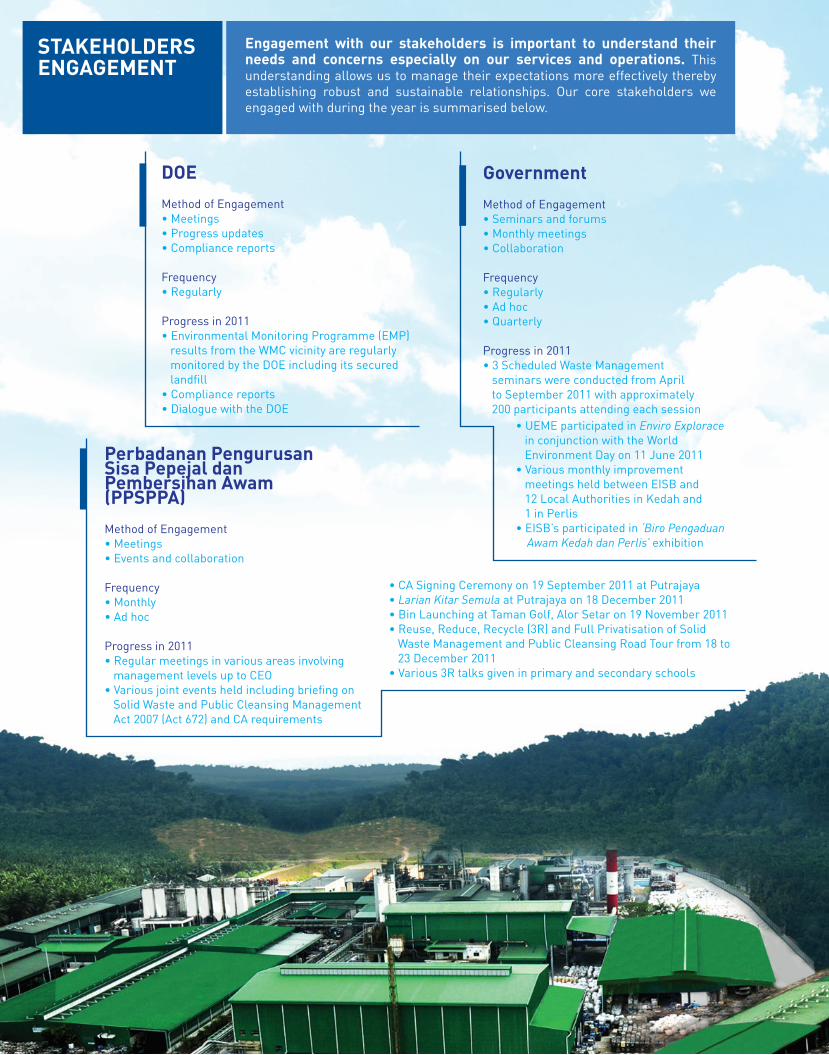
Perbadanan Pengurusan Sisa Pepejal dan Pembersihan Awam (PPSPPA)
Method of Engagement•Meetings•Eventsandcollaboration
Frequency•Monthly•Adhoc
Progress in 2011•Regularmeetingsinvariousareasinvolving management levels up to CEO•Variousjointeventsheldincludingbriefingon Solid Waste and Public Cleansing Management Act 2007 (Act 672) and CA requirements
•CASigningCeremonyon19September2011atPutrajaya•Larian Kitar Semula at Putrajaya on 18 December 2011•BinLaunchingatTamanGolf,AlorSetaron19November2011•Reuse,Reduce,Recycle(3R)andFullPrivatisationofSolid Waste Management and Public Cleansing Road Tour from 18 to 23 December 2011•Various3Rtalksgiveninprimaryandsecondaryschools
DOE
Method of Engagement•Meetings•Progressupdates•Compliancereports
Frequency•Regularly
Progress in 2011•EnvironmentalMonitoringProgramme(EMP) results from the WMC vicinity are regularly monitored by the DOE including its secured landfill•Compliancereports•DialoguewiththeDOE
Government
Method of Engagement•Seminarsandforums•Monthlymeetings•Collaboration
Frequency•Regularly•Adhoc•Quarterly
Progress in 2011•3ScheduledWasteManagement seminars were conducted from April to September 2011 with approximately 200 participants attending each session
•UEMEparticipatedinEnviro Explorace in conjunction with the World Environment Day on 11 June 2011•Variousmonthlyimprovement meetings held between EISB and 12 Local Authorities in Kedah and 1 in Perlis•EISB’sparticipatedin‘Biro Pengaduan Awam Kedah dan Perlis’ exhibition
STAKEHOLDERSENGAGEMENT
Engagement with our stakeholders is important to understand their needs and concerns especially on our services and operations. This understanding allows us to manage their expectations more effectively thereby establishing robust and sustainable relationships. Our core stakeholders we engaged with during the year is summarised below.
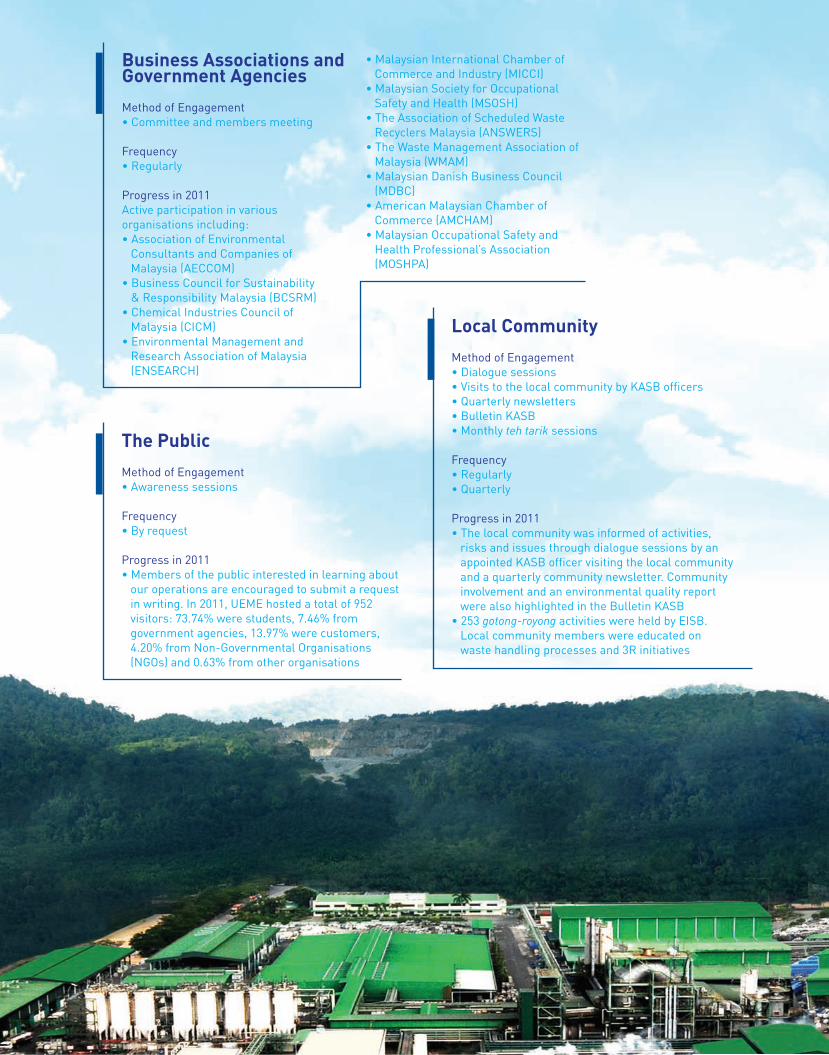
The Public
Method of Engagement•Awarenesssessions
Frequency•Byrequest
Progress in 2011•Membersofthepublicinterestedinlearningabout our operations are encouraged to submit a request in writing. In 2011, UEME hosted a total of 952 visitors: 73.74% were students, 7.46% from government agencies, 13.97% were customers, 4.20% from Non-Governmental Organisations (NGOs) and 0.63% from other organisations
Business Associations and Government Agencies
Method of Engagement•Committeeandmembersmeeting
Frequency•Regularly
Progress in 2011Active participation in various organisations including: •AssociationofEnvironmental Consultants and Companies of Malaysia (AECCOM)•BusinessCouncilforSustainability & Responsibility Malaysia (BCSRM)•ChemicalIndustriesCouncilof Malaysia (CICM)•EnvironmentalManagementand Research Association of Malaysia (ENSEARCH)
•MalaysianInternationalChamberof Commerce and Industry (MICCI)•MalaysianSocietyforOccupational Safety and Health (MSOSH)•TheAssociationofScheduledWaste Recyclers Malaysia (ANSWERS)•TheWasteManagementAssociationof Malaysia (WMAM)•MalaysianDanishBusinessCouncil (MDBC)•AmericanMalaysianChamberof Commerce (AMCHAM) •MalaysianOccupationalSafetyand Health Professional’s Association (MOSHPA)
Local Community
Method of Engagement•Dialoguesessions•VisitstothelocalcommunitybyKASBofficers•Quarterlynewsletters•BulletinKASB•Monthly teh tarik sessions
Frequency•Regularly•Quarterly
Progress in 2011•Thelocalcommunitywasinformedofactivities, risks and issues through dialogue sessions by an appointed KASB officer visiting the local community and a quarterly community newsletter. Community involvement and an environmental quality report were also highlighted in the Bulletin KASB•253gotong-royong activities were held by EISB. Local community members were educated on waste handling processes and 3R initiatives
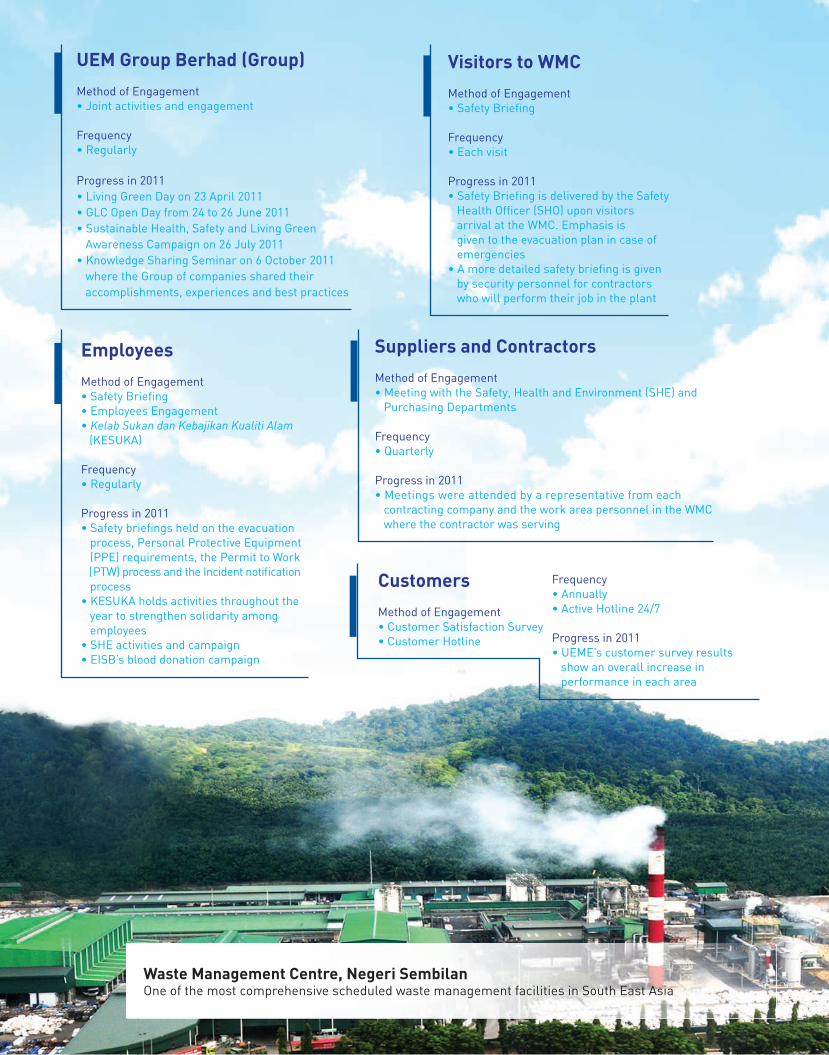
UEM Group Berhad (Group)
Method of Engagement•Jointactivitiesandengagement
Frequency•Regularly
Progress in 2011•LivingGreenDayon23April2011•GLCOpenDayfrom24to26June2011•SustainableHealth,SafetyandLivingGreen Awareness Campaign on 26 July 2011•KnowledgeSharingSeminaron6October2011 where the Group of companies shared their accomplishments, experiences and best practices
Employees
Method of Engagement•SafetyBriefing•EmployeesEngagement•Kelab Sukan dan Kebajikan Kualiti Alam (KESUKA)
Frequency•Regularly
Progress in 2011•Safetybriefingsheldontheevacuation process, Personal Protective Equipment (PPE) requirements, the Permit to Work (PTW) process and the Incident notification process•KESUKAholdsactivitiesthroughoutthe year to strengthen solidarity among employees•SHEactivitiesandcampaign•EISB’sblooddonationcampaign
Suppliers and Contractors
Method of Engagement•MeetingwiththeSafety,HealthandEnvironment(SHE)and Purchasing Departments
Frequency•Quarterly
Progress in 2011•Meetingswereattendedbyarepresentativefromeach contracting company and the work area personnel in the WMC where the contractor was serving
Visitors to WMC
Method of Engagement•SafetyBriefing
Frequency•Eachvisit
Progress in 2011•SafetyBriefingisdeliveredbytheSafety Health Officer (SHO) upon visitors arrival at the WMC. Emphasis is given to the evacuation plan in case of emergencies•Amoredetailedsafetybriefingisgiven by security personnel for contractors who will perform their job in the plant
Frequency•Annually•ActiveHotline24/7
Progress in 2011•UEME’scustomersurveyresults show an overall increase in performance in each area
Customers
Method of Engagement•CustomerSatisfactionSurvey•CustomerHotline
Waste Management Centre, Negeri SembilanOne of the most comprehensive scheduled waste management facilities in South East Asia
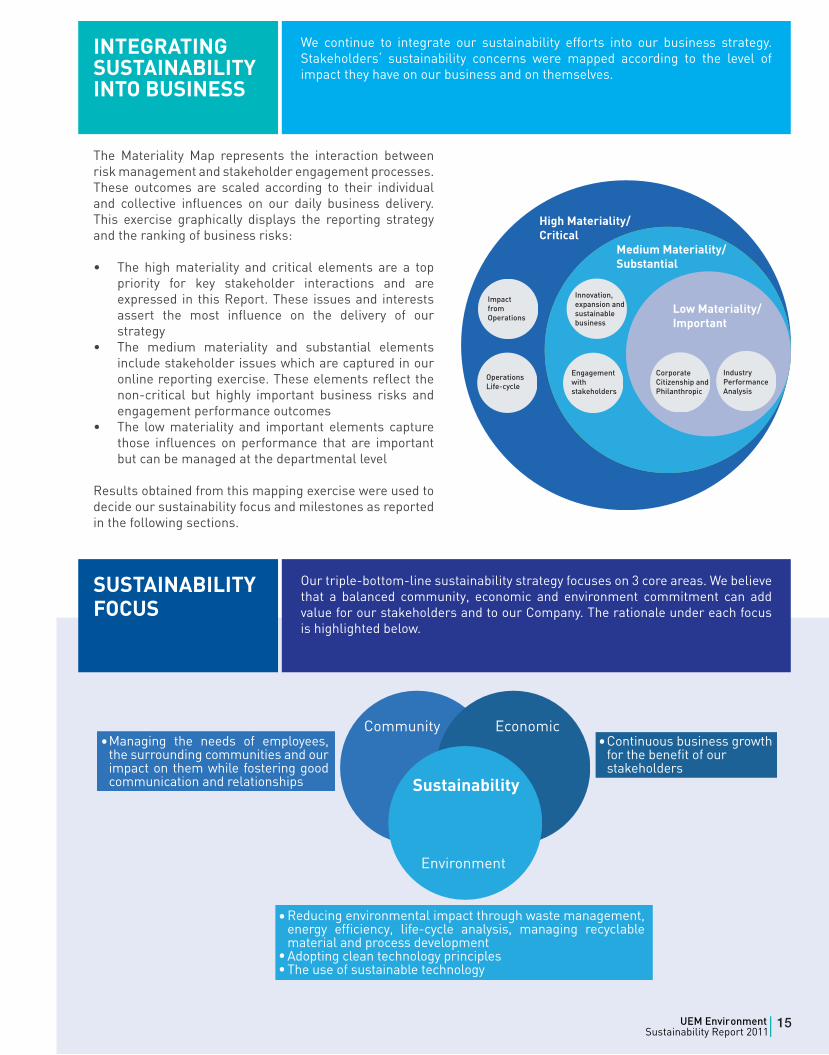
The Materiality Map represents the interaction between risk management and stakeholder engagement processes. These outcomes are scaled according to their individual and collective influences on our daily business delivery. This exercise graphically displays the reporting strategy and the ranking of business risks:
• The high materiality and critical elements are a top priority for key stakeholder interactions and are expressed in this Report. These issues and interests assert the most influence on the delivery of our strategy
• The medium materiality and substantial elements include stakeholder issues which are captured in our online reporting exercise. These elements reflect the non-critical but highly important business risks and engagement performance outcomes
• The low materiality and important elements capture those influences on performance that are important but can be managed at the departmental level
Results obtained from this mapping exercise were used to decide our sustainability focus and milestones as reported in the following sections.
INTEGRATING SUSTAINABILITY INTO BUSINESS
We continue to integrate our sustainability efforts into our business strategy. Stakeholders‘ sustainability concerns were mapped according to the level of impact they have on our business and on themselves.
SUSTAINABILITY FOCUS
Our triple-bottom-line sustainability strategy focuses on 3 core areas. We believe that a balanced community, economic and environment commitment can add value for our stakeholders and to our Company. The rationale under each focus is highlighted below.
15UEM EnvironmentSustainability Report 2011|
Sustainability Policy CommitmentsWe are committed to continue developing the nation focusing on making a positive impact on local communities surrounding our operations in particular
Achievements in 2011• Active engagement with the local
community• Wider scope of contributions
to local villages on education, infrastructure development, greening activities, religious causes and other welfare development
Way Forward• To be directly involved in
Promoting Intelligence, Nurturing Talent and Advocating Responsibility (PINTAR) programme activities namely the English Literacy Programme sponsored by UEM Group Berhad (UELP)
• To increase the number of engagement sessions with the local community
• To promote the usage of UEME’s hotline
• Adoption of mosques
Community
Sustainability Policy CommitmentsWe value the contribution of our employees and continue to strive to be an employer of choice. Employees’ rights, welfare, career growth, health and safety are closely monitored
Achievements in 2011• A more active role played by
KESUKA in enhancing employees’ welfare
• Non-discrimination and fair treatment at work
• Advanced career development for employees
• Changing Habits towards Living Green
Way Forward• To plan more employee
engagement programmes to nurture the spirit of teamwork
• To continue upgrading safety measures at work for employees, contractors and visitors especially at our plants
Workplace
Sustainability Policy CommitmentsWe value our relationships with our supply chain partners including suppliers and customers. We encourage two-way engagement with these stakeholders to ensure a smooth delivery process
Achievements in 2011• Innovation of various technologies in
upgrading our services - unfolding horizons
• Active engagement with customers and suppliers
• Improved overall customer satisfaction survey results
• Advanced safety measures for KKA drivers and employees in high risk employment
• Stringent processes to ensure a quality service
Way Forward• Full operations on our newly
introduced technologies• Extending our service coverage to
international markets• Continuous stringent monitoring of
each stage of our life-cycle
Marketplace
Sustainability Policy CommitmentsWe uphold good Corporate Governance practices which reflect integrity in-line with the Malaysian Code on Corporate Governance
Achievements in 2011• The development of a more
stringent risk management system which maps causes, consequences and existing controls against an action plan and timing
Way Forward• To review and update existing
systems to keep abreast with the latest international best practices
Corporate Governance
Sustainability Policy CommitmentsWe continue to work towards a cleaner, greener tomorrow by ensuring our operations have a minimal impact on the environment
Achievements in 2011• Detailed environmental
monitoring• Monitoring of environmental
impact at each stage of operation life-cycle
• Biodiversity and conservation programmes
Way Forward• To plan more biodiversity and
conservation programmes• Continuous monitoring of
environmental impact from all subsidiaries’ operations
Environment
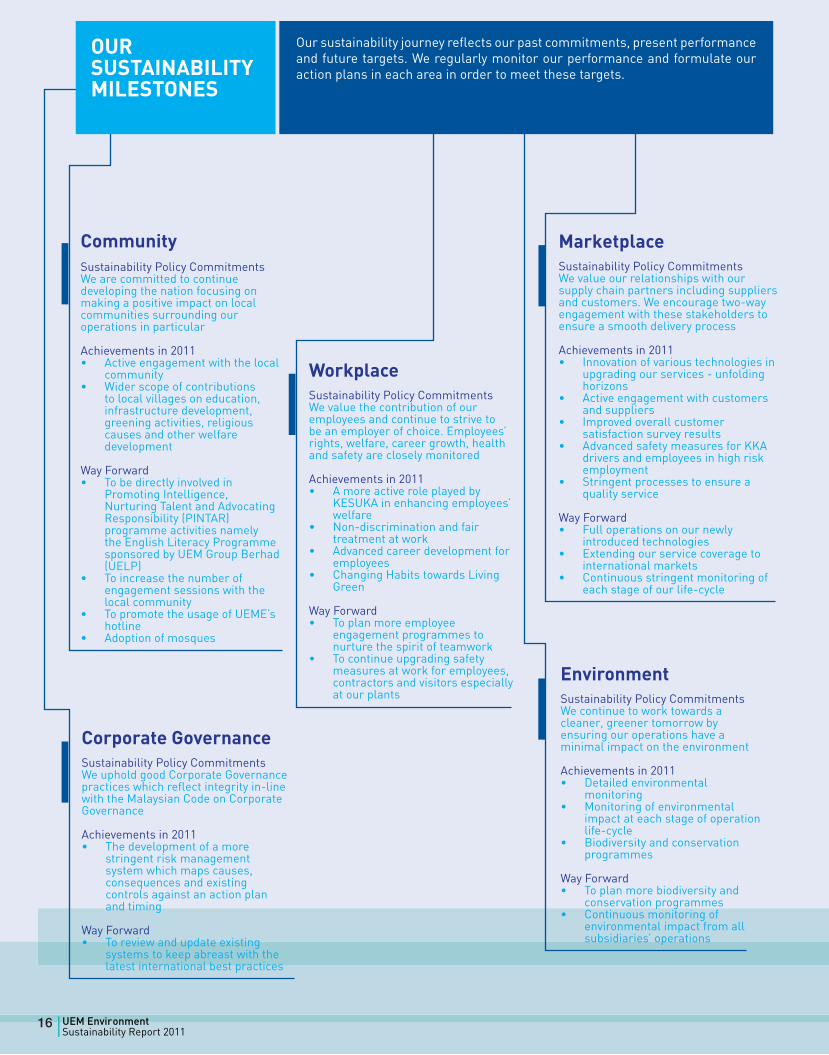
Our sustainability journey reflects our past commitments, present performance and future targets. We regularly monitor our performance and formulate our action plans in each area in order to meet these targets.
OUR SUSTAINABILITY MILESTONES
16 UEM EnvironmentSustainability Report 2011|
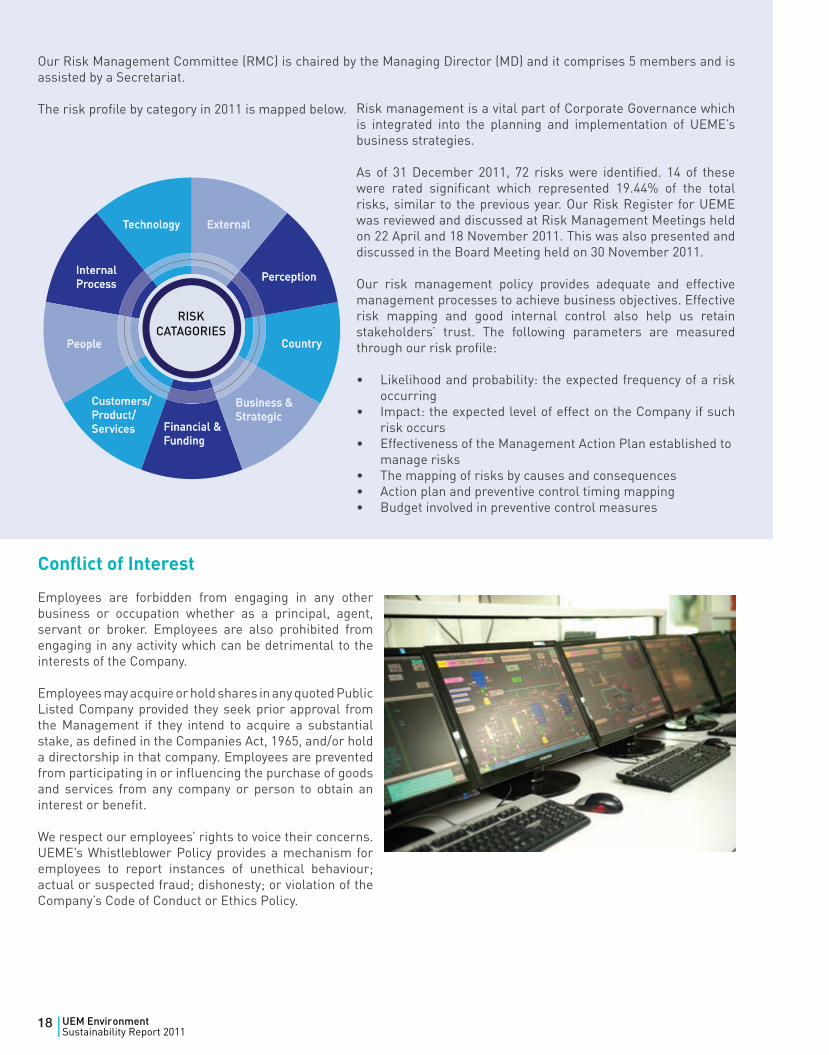
Our Risk Management Committee (RMC) is chaired by the Managing Director (MD) and it comprises 5 members and is assisted by a Secretariat.
The risk profile by category in 2011 is mapped below.
Conflict of Interest
Employees are forbidden from engaging in any other business or occupation whether as a principal, agent, servant or broker. Employees are also prohibited from engaging in any activity which can be detrimental to the interests of the Company.
Employees may acquire or hold shares in any quoted Public Listed Company provided they seek prior approval from the Management if they intend to acquire a substantial stake, as defined in the Companies Act, 1965, and/or hold a directorship in that company. Employees are prevented from participating in or influencing the purchase of goods and services from any company or person to obtain an interest or benefit.
We respect our employees’ rights to voice their concerns. UEME’s Whistleblower Policy provides a mechanism for employees to report instances of unethical behaviour; actual or suspected fraud; dishonesty; or violation of the Company’s Code of Conduct or Ethics Policy.
Risk management is a vital part of Corporate Governance which is integrated into the planning and implementation of UEME’s business strategies.
As of 31 December 2011, 72 risks were identified. 14 of these were rated significant which represented 19.44% of the total risks, similar to the previous year. Our Risk Register for UEME was reviewed and discussed at Risk Management Meetings held on 22 April and 18 November 2011. This was also presented and discussed in the Board Meeting held on 30 November 2011.
Our risk management policy provides adequate and effective management processes to achieve business objectives. Effective risk mapping and good internal control also help us retain stakeholders’ trust. The following parameters are measured through our risk profile:
• Likelihood and probability: the expected frequency of a risk occurring
• Impact: the expected level of effect on the Company if such risk occurs
• Effectiveness of the Management Action Plan established to manage risks
• The mapping of risks by causes and consequences• Action plan and preventive control timing mapping• Budget involved in preventive control measures
18 UEM EnvironmentSustainability Report 2011|
01
02
01 www.ecologyasia.com/news-archives/2003/dec-03/thestar_20031205_1.htm02 www.doe.gov.my/portal/legislation-actsregulation-order/
GOODCORPORATECITIZENSHIP
We recognise our responsibilities towards the society, especially the communities which are directly involved with our nature of business. As Malaysia’s trusted environmental solution provider, we continue to assist the nation in achieving environmentally balanced surroundings.
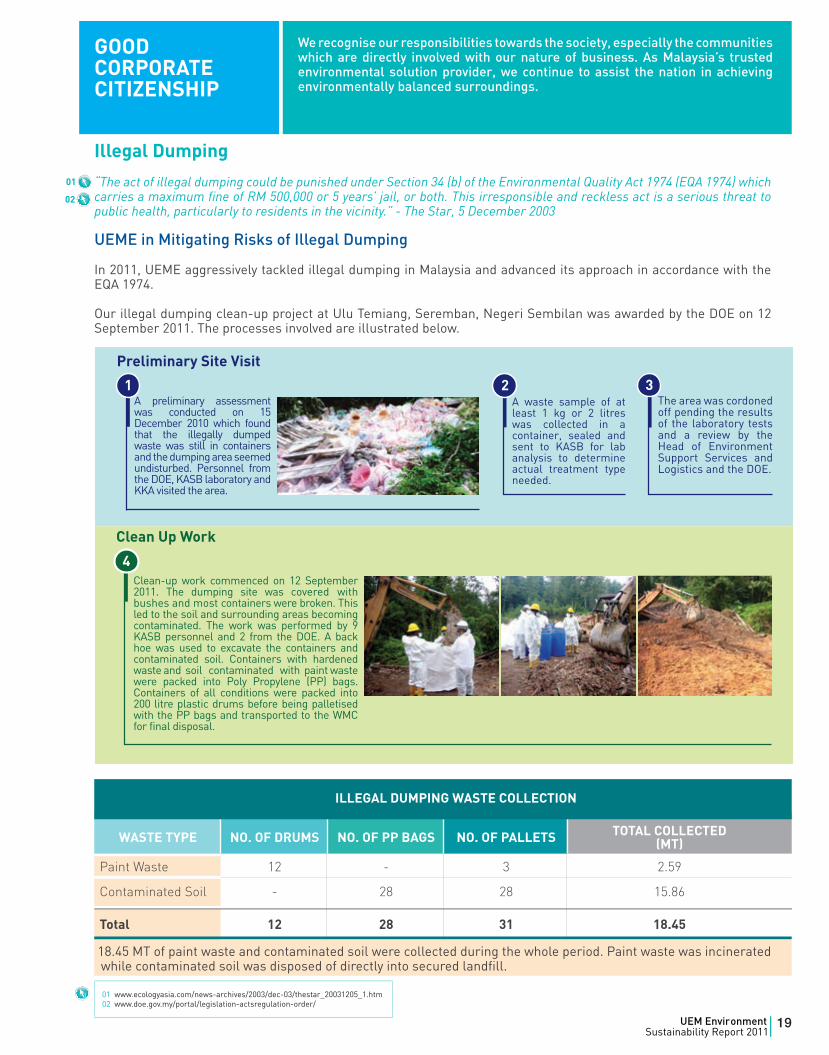
Illegal Dumping
“The act of illegal dumping could be punished under Section 34 (b) of the Environmental Quality Act 1974 (EQA 1974) which carries a maximum fine of RM 500,000 or 5 years’ jail, or both. This irresponsible and reckless act is a serious threat to public health, particularly to residents in the vicinity.” - The Star, 5 December 2003
UEME in Mitigating Risks of Illegal Dumping
In 2011, UEME aggressively tackled illegal dumping in Malaysia and advanced its approach in accordance with the EQA 1974.
Our illegal dumping clean-up project at Ulu Temiang, Seremban, Negeri Sembilan was awarded by the DOE on 12 September 2011. The processes involved are illustrated below.
ILLEGAL DUMPING WASTE COLLECTION
WASTE TYPE NO. OF DRUMS NO. OF PP BAGS NO. OF PALLETS TOTAL COLLECTED(MT)
Paint Waste 12 - 3 2.59
Contaminated Soil - 28 28 15.86
Total 12 28 31 18.45
18.45 MT of paint waste and contaminated soil were collected during the whole period. Paint waste was incinerated while contaminated soil was disposed of directly into secured landfill.
19UEM EnvironmentSustainability Report 2011|
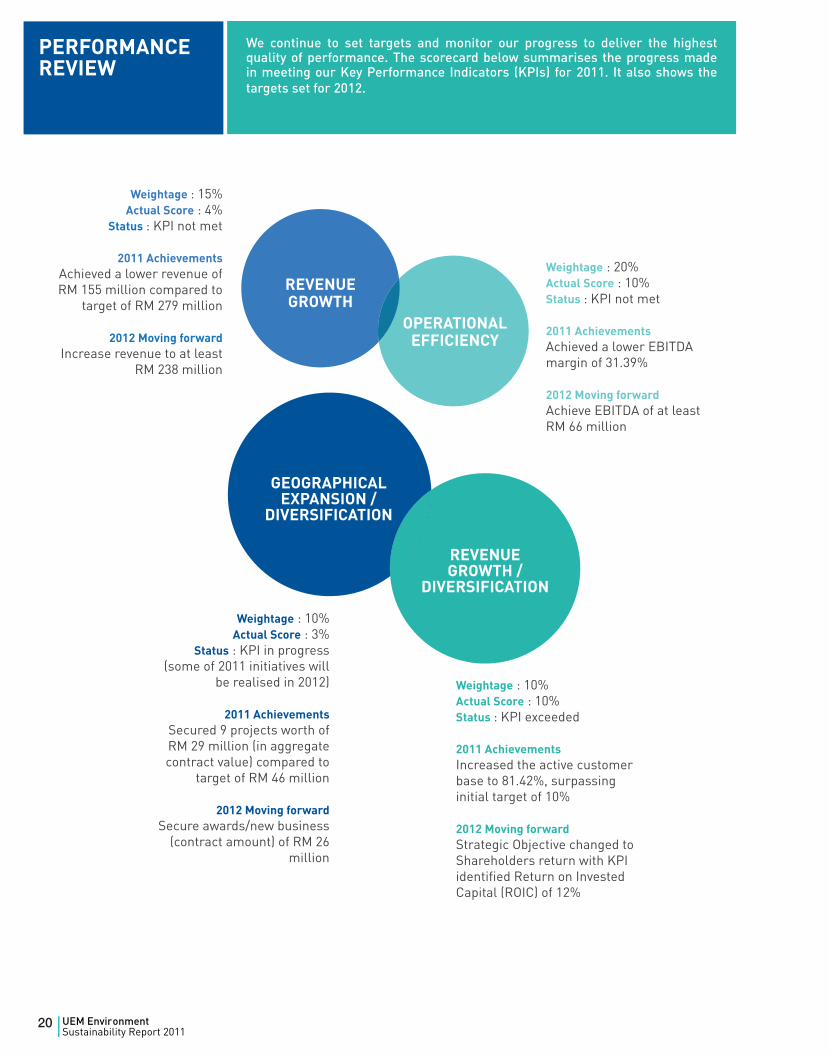
Weightage : 20% Actual Score : 10%Status : KPI not met
2011 AchievementsAchieved a lower EBITDA margin of 31.39%
2012 Moving forwardAchieve EBITDA of at least RM 66 million
OPERATIONALEFFICIENCY
Weightage : 10% Actual Score : 10%Status : KPI exceeded
2011 AchievementsIncreased the active customer base to 81.42%, surpassing initial target of 10%
2012 Moving forwardStrategic Objective changed to Shareholders return with KPI identified Return on Invested Capital (ROIC) of 12%
Weightage : 15%Actual Score : 4%
Status : KPI not met
2011 AchievementsAchieved a lower revenue of RM 155 million compared to
target of RM 279 million
2012 Moving forwardIncrease revenue to at least
RM 238 million
Weightage : 10%Actual Score : 3%
Status : KPI in progress (some of 2011 initiatives will
be realised in 2012)
2011 AchievementsSecured 9 projects worth of RM 29 million (in aggregate contract value) compared to
target of RM 46 million
2012 Moving forwardSecure awards/new business
(contract amount) of RM 26 million
GEOGRAPHICALEXPANSION /
DIVERSIFICATION
REVENUEGROWTH /
DIVERSIFICATION
REVENUEGROWTH
PERFORMANCEREVIEW
We continue to set targets and monitor our progress to deliver the highest quality of performance. The scorecard below summarises the progress made in meeting our Key Performance Indicators (KPIs) for 2011. It also shows the targets set for 2012.
20 UEM EnvironmentSustainability Report 2011|
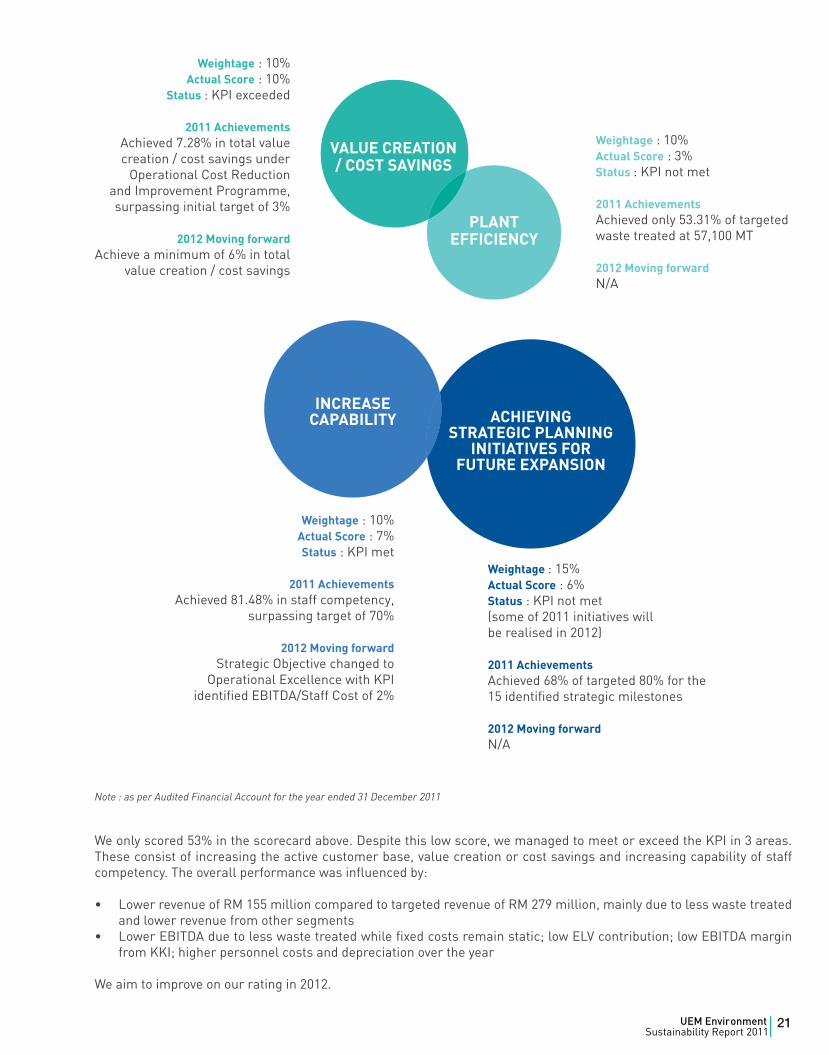
Weightage : 10%Actual Score : 7%Status : KPI met
2011 AchievementsAchieved 81.48% in staff competency,
surpassing target of 70%
2012 Moving forwardStrategic Objective changed to
Operational Excellence with KPI identified EBITDA/Staff Cost of 2%
PLANTEFFICIENCY
Weightage : 15% Actual Score : 6%Status : KPI not met(some of 2011 initiatives will be realised in 2012)
2011 AchievementsAchieved 68% of targeted 80% for the 15 identified strategic milestones
2012 Moving forwardN/A
Weightage : 10%Actual Score : 10%
Status : KPI exceeded
2011 AchievementsAchieved 7.28% in total value creation / cost savings under
Operational Cost Reduction and Improvement Programme, surpassing initial target of 3%
2012 Moving forwardAchieve a minimum of 6% in total
value creation / cost savings
Weightage : 10% Actual Score : 3%Status : KPI not met
2011 AchievementsAchieved only 53.31% of targeted waste treated at 57,100 MT
2012 Moving forwardN/A
INCREASE CAPABILITY ACHIEVING
STRATEGIC PLANNING INITIATIVES FOR
FUTURE EXPANSION
VALUE CREATION / COST SAVINGS
We only scored 53% in the scorecard above. Despite this low score, we managed to meet or exceed the KPI in 3 areas. These consist of increasing the active customer base, value creation or cost savings and increasing capability of staff competency. The overall performance was influenced by:
• Lower revenue of RM 155 million compared to targeted revenue of RM 279 million, mainly due to less waste treated and lower revenue from other segments
• Lower EBITDA due to less waste treated while fixed costs remain static; low ELV contribution; low EBITDA margin from KKI; higher personnel costs and depreciation over the year
We aim to improve on our rating in 2012.
Note : as per Audited Financial Account for the year ended 31 December 2011
21UEM EnvironmentSustainability Report 2011|
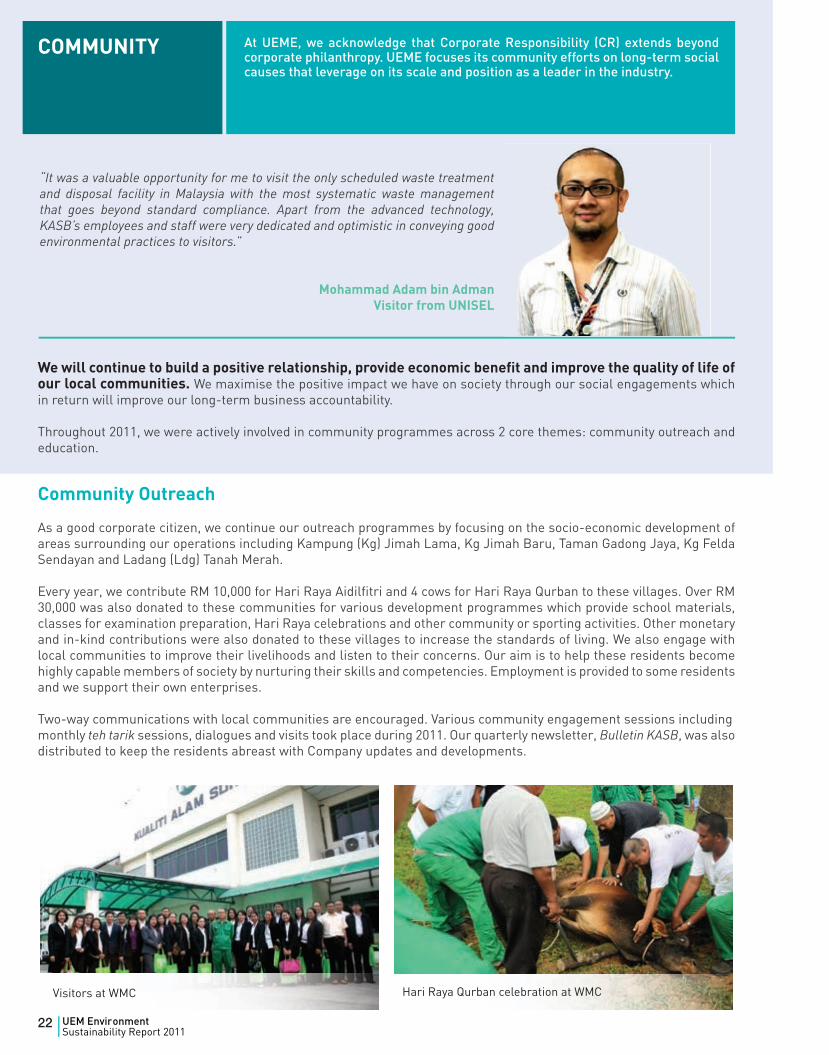
Visitors at WMC
We will continue to build a positive relationship, provide economic benefit and improve the quality of life of our local communities. We maximise the positive impact we have on society through our social engagements which in return will improve our long-term business accountability.
Throughout 2011, we were actively involved in community programmes across 2 core themes: community outreach and education.
Community Outreach
As a good corporate citizen, we continue our outreach programmes by focusing on the socio-economic development of areas surrounding our operations including Kampung (Kg) Jimah Lama, Kg Jimah Baru, Taman Gadong Jaya, Kg Felda Sendayan and Ladang (Ldg) Tanah Merah.
Every year, we contribute RM 10,000 for Hari Raya Aidilfitri and 4 cows for Hari Raya Qurban to these villages. Over RM 30,000 was also donated to these communities for various development programmes which provide school materials, classes for examination preparation, Hari Raya celebrations and other community or sporting activities. Other monetary and in-kind contributions were also donated to these villages to increase the standards of living. We also engage with local communities to improve their livelihoods and listen to their concerns. Our aim is to help these residents become highly capable members of society by nurturing their skills and competencies. Employment is provided to some residents and we support their own enterprises.
Two-way communications with local communities are encouraged. Various community engagement sessions includingmonthly teh tarik sessions, dialogues and visits took place during 2011. Our quarterly newsletter, Bulletin KASB, was also distributed to keep the residents abreast with Company updates and developments.
“It was a valuable opportunity for me to visit the only scheduled waste treatment and disposal facility in Malaysia with the most systematic waste management that goes beyond standard compliance. Apart from the advanced technology, KASB’s employees and staff were very dedicated and optimistic in conveying good environmental practices to visitors.”
Mohammad Adam bin AdmanVisitor from UNISEL
COMMUNITY At UEME, we acknowledge that Corporate Responsibility (CR) extends beyond corporate philanthropy. UEME focuses its community efforts on long-term social causes that leverage on its scale and position as a leader in the industry.
Hari Raya Qurban celebration at WMC
22 UEM EnvironmentSustainability Report 2011|
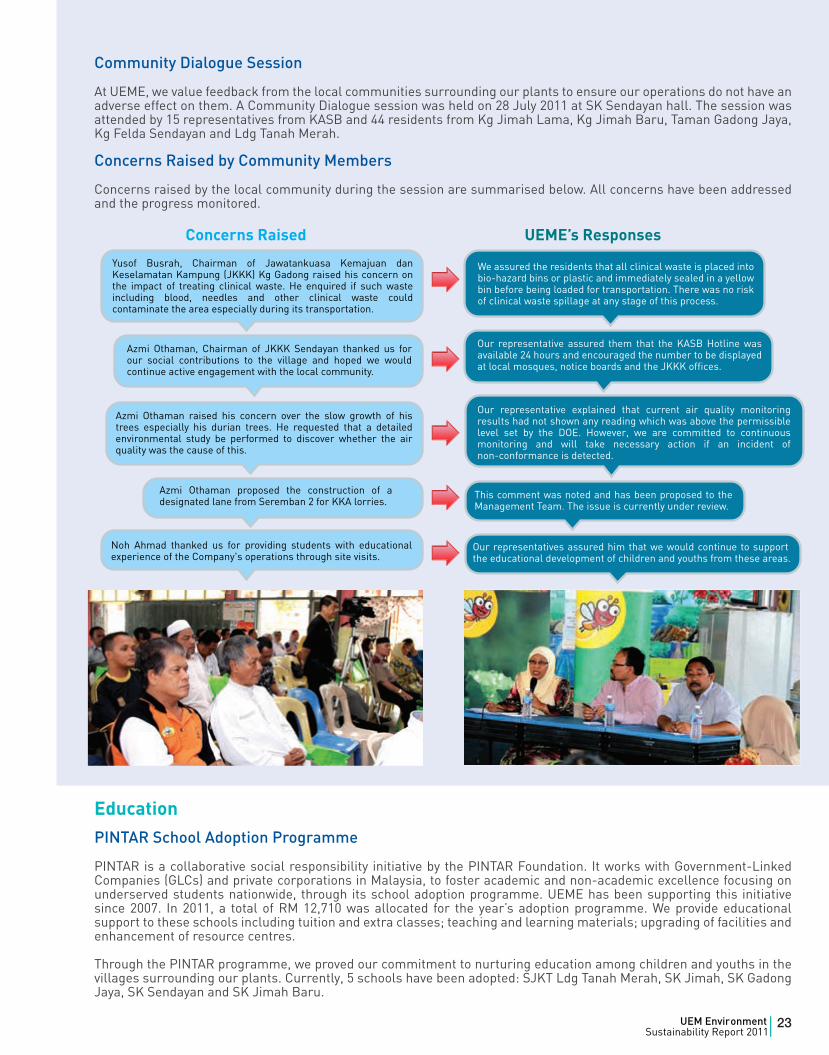
Community Dialogue Session
At UEME, we value feedback from the local communities surrounding our plants to ensure our operations do not have an adverse effect on them. A Community Dialogue session was held on 28 July 2011 at SK Sendayan hall. The session was attended by 15 representatives from KASB and 44 residents from Kg Jimah Lama, Kg Jimah Baru, Taman Gadong Jaya, Kg Felda Sendayan and Ldg Tanah Merah.
Concerns Raised by Community Members
Concerns raised by the local community during the session are summarised below. All concerns have been addressed and the progress monitored.
Concerns Raised UEME’s Responses
EducationPINTAR School Adoption Programme
PINTAR is a collaborative social responsibility initiative by the PINTAR Foundation. It works with Government-Linked Companies (GLCs) and private corporations in Malaysia, to foster academic and non-academic excellence focusing on underserved students nationwide, through its school adoption programme. UEME has been supporting this initiative since 2007. In 2011, a total of RM 12,710 was allocated for the year’s adoption programme. We provide educational support to these schools including tuition and extra classes; teaching and learning materials; upgrading of facilities and enhancement of resource centres.
Through the PINTAR programme, we proved our commitment to nurturing education among children and youths in the villages surrounding our plants. Currently, 5 schools have been adopted: SJKT Ldg Tanah Merah, SK Jimah, SK Gadong Jaya, SK Sendayan and SK Jimah Baru.
23UEM EnvironmentSustainability Report 2011|
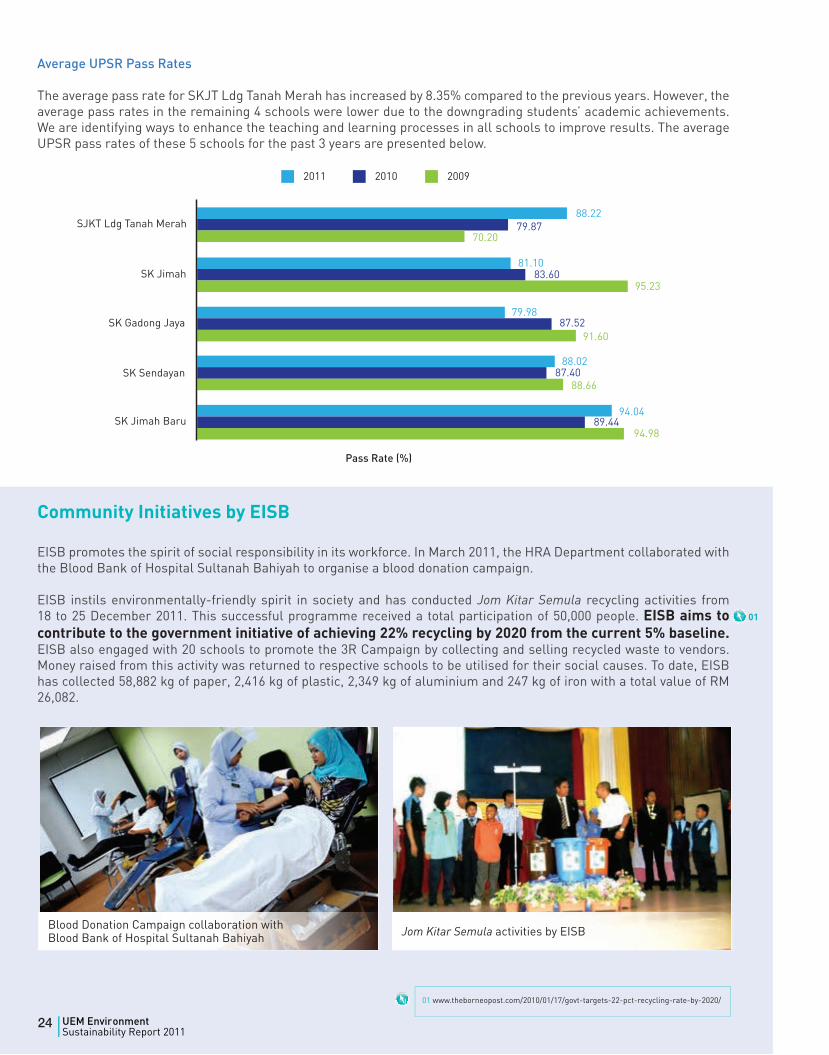
Average UPSR Pass Rates
The average pass rate for SKJT Ldg Tanah Merah has increased by 8.35% compared to the previous years. However, the average pass rates in the remaining 4 schools were lower due to the downgrading students’ academic achievements. We are identifying ways to enhance the teaching and learning processes in all schools to improve results. The average UPSR pass rates of these 5 schools for the past 3 years are presented below.
Community Initiatives by EISB
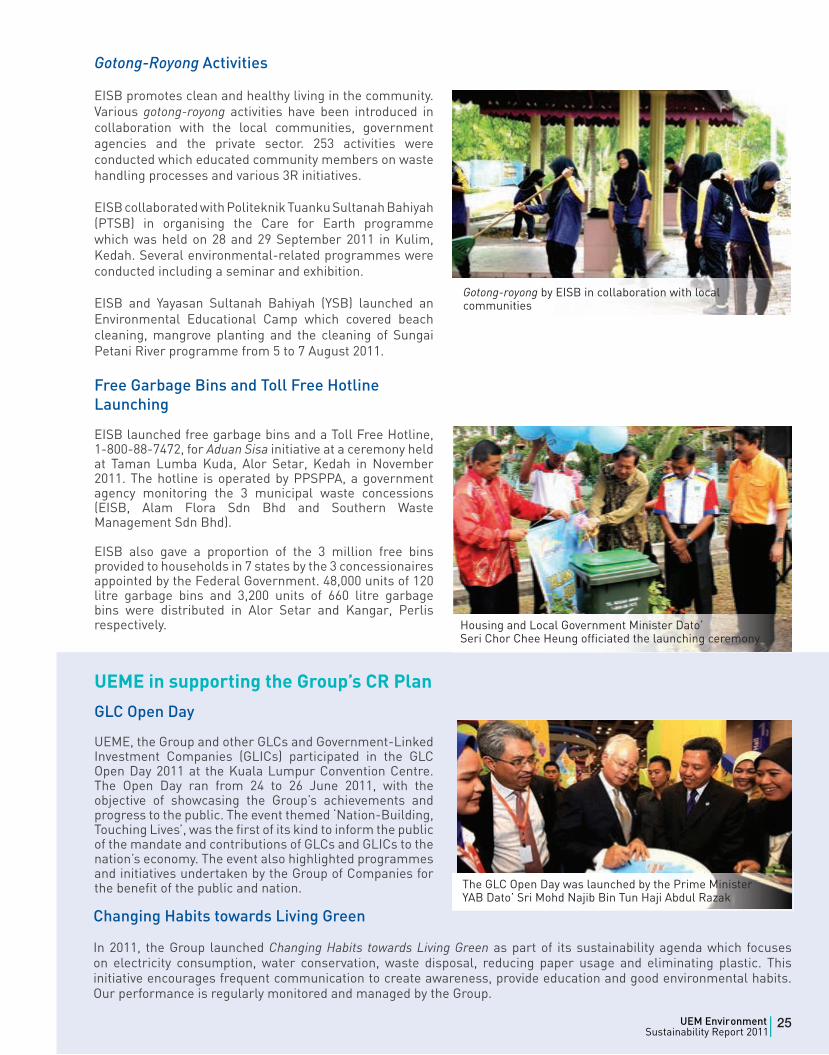
EISB promotes the spirit of social responsibility in its workforce. In March 2011, the HRA Department collaborated with the Blood Bank of Hospital Sultanah Bahiyah to organise a blood donation campaign.
EISB instils environmentally-friendly spirit in society and has conducted Jom Kitar Semula recycling activities from 18 to 25 December 2011. This successful programme received a total participation of 50,000 people. EISB aims to contribute to the government initiative of achieving 22% recycling by 2020 from the current 5% baseline. EISB also engaged with 20 schools to promote the 3R Campaign by collecting and selling recycled waste to vendors. Money raised from this activity was returned to respective schools to be utilised for their social causes. To date, EISB has collected 58,882 kg of paper, 2,416 kg of plastic, 2,349 kg of aluminium and 247 kg of iron with a total value of RM 26,082.
01
01 www.theborneopost.com/2010/01/17/govt-targets-22-pct-recycling-rate-by-2020/
Blood Donation Campaign collaboration withBlood Bank of Hospital Sultanah Bahiyah Jom Kitar Semula activities by EISB
24 UEM EnvironmentSustainability Report 2011|
Changing Habits towards Living Green
In 2011, the Group launched Changing Habits towards Living Green as part of its sustainability agenda which focuses on electricity consumption, water conservation, waste disposal, reducing paper usage and eliminating plastic. This initiative encourages frequent communication to create awareness, provide education and good environmental habits. Our performance is regularly monitored and managed by the Group.
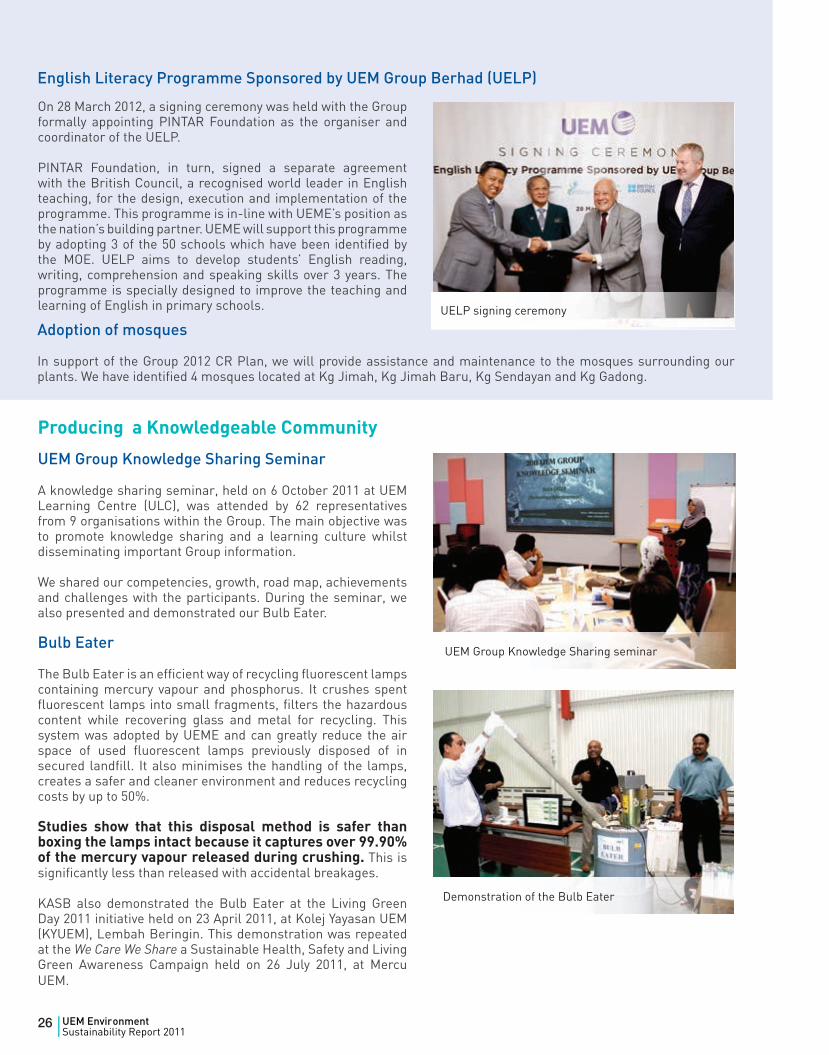
Gotong-Royong Activities
EISB promotes clean and healthy living in the community. Various gotong-royong activities have been introduced in collaboration with the local communities, government agencies and the private sector. 253 activities were conducted which educated community members on waste handling processes and various 3R initiatives.
EISB collaborated with Politeknik Tuanku Sultanah Bahiyah (PTSB) in organising the Care for Earth programme which was held on 28 and 29 September 2011 in Kulim, Kedah. Several environmental-related programmes were conducted including a seminar and exhibition.
EISB and Yayasan Sultanah Bahiyah (YSB) launched an Environmental Educational Camp which covered beach cleaning, mangrove planting and the cleaning of Sungai Petani River programme from 5 to 7 August 2011.
Free Garbage Bins and Toll Free Hotline Launching
EISB launched free garbage bins and a Toll Free Hotline, 1-800-88-7472, for Aduan Sisa initiative at a ceremony held at Taman Lumba Kuda, Alor Setar, Kedah in November 2011. The hotline is operated by PPSPPA, a government agency monitoring the 3 municipal waste concessions (EISB, Alam Flora Sdn Bhd and Southern Waste Management Sdn Bhd).
EISB also gave a proportion of the 3 million free bins provided to households in 7 states by the 3 concessionaires appointed by the Federal Government. 48,000 units of 120 litre garbage bins and 3,200 units of 660 litre garbage bins were distributed in Alor Setar and Kangar, Perlis respectively.
UEME in supporting the Group’s CR Plan
GLC Open Day
UEME, the Group and other GLCs and Government-Linked Investment Companies (GLICs) participated in the GLC Open Day 2011 at the Kuala Lumpur Convention Centre. The Open Day ran from 24 to 26 June 2011, with the objective of showcasing the Group’s achievements and progress to the public. The event themed ‘Nation-Building, Touching Lives’, was the first of its kind to inform the public of the mandate and contributions of GLCs and GLICs to the nation’s economy. The event also highlighted programmes and initiatives undertaken by the Group of Companies for the benefit of the public and nation.
Gotong-royong by EISB in collaboration with local communities
Housing and Local Government Minister Dato’Seri Chor Chee Heung officiated the launching ceremony
The GLC Open Day was launched by the Prime Minister YAB Dato’ Sri Mohd Najib Bin Tun Haji Abdul Razak
25UEM EnvironmentSustainability Report 2011|
English Literacy Programme Sponsored by UEM Group Berhad (UELP)
Producing a Knowledgeable Community
UEM Group Knowledge Sharing Seminar
A knowledge sharing seminar, held on 6 October 2011 at UEM Learning Centre (ULC), was attended by 62 representatives from 9 organisations within the Group. The main objective was to promote knowledge sharing and a learning culture whilst disseminating important Group information.
We shared our competencies, growth, road map, achievements and challenges with the participants. During the seminar, we also presented and demonstrated our Bulb Eater.
Bulb Eater
The Bulb Eater is an efficient way of recycling fluorescent lamps containing mercury vapour and phosphorus. It crushes spent fluorescent lamps into small fragments, filters the hazardous content while recovering glass and metal for recycling. This system was adopted by UEME and can greatly reduce the air space of used fluorescent lamps previously disposed of in secured landfill. It also minimises the handling of the lamps, creates a safer and cleaner environment and reduces recycling costs by up to 50%.
Studies show that this disposal method is safer than boxing the lamps intact because it captures over 99.90% of the mercury vapour released during crushing. This is significantly less than released with accidental breakages.
KASB also demonstrated the Bulb Eater at the Living Green Day 2011 initiative held on 23 April 2011, at Kolej Yayasan UEM (KYUEM), Lembah Beringin. This demonstration was repeated at the We Care We Share a Sustainable Health, Safety and Living Green Awareness Campaign held on 26 July 2011, at Mercu UEM.
On 28 March 2012, a signing ceremony was held with the Group formally appointing PINTAR Foundation as the organiser and coordinator of the UELP.
PINTAR Foundation, in turn, signed a separate agreement with the British Council, a recognised world leader in English teaching, for the design, execution and implementation of the programme. This programme is in-line with UEME’s position as the nation’s building partner. UEME will support this programme by adopting 3 of the 50 schools which have been identified by the MOE. UELP aims to develop students’ English reading, writing, comprehension and speaking skills over 3 years. The programme is specially designed to improve the teaching and learning of English in primary schools.
Adoption of mosques
In support of the Group 2012 CR Plan, we will provide assistance and maintenance to the mosques surrounding our plants. We have identified 4 mosques located at Kg Jimah, Kg Jimah Baru, Kg Sendayan and Kg Gadong.
UELP signing ceremony
Demonstration of the Bulb Eater
UEM Group Knowledge Sharing seminar
26 UEM EnvironmentSustainability Report 2011|
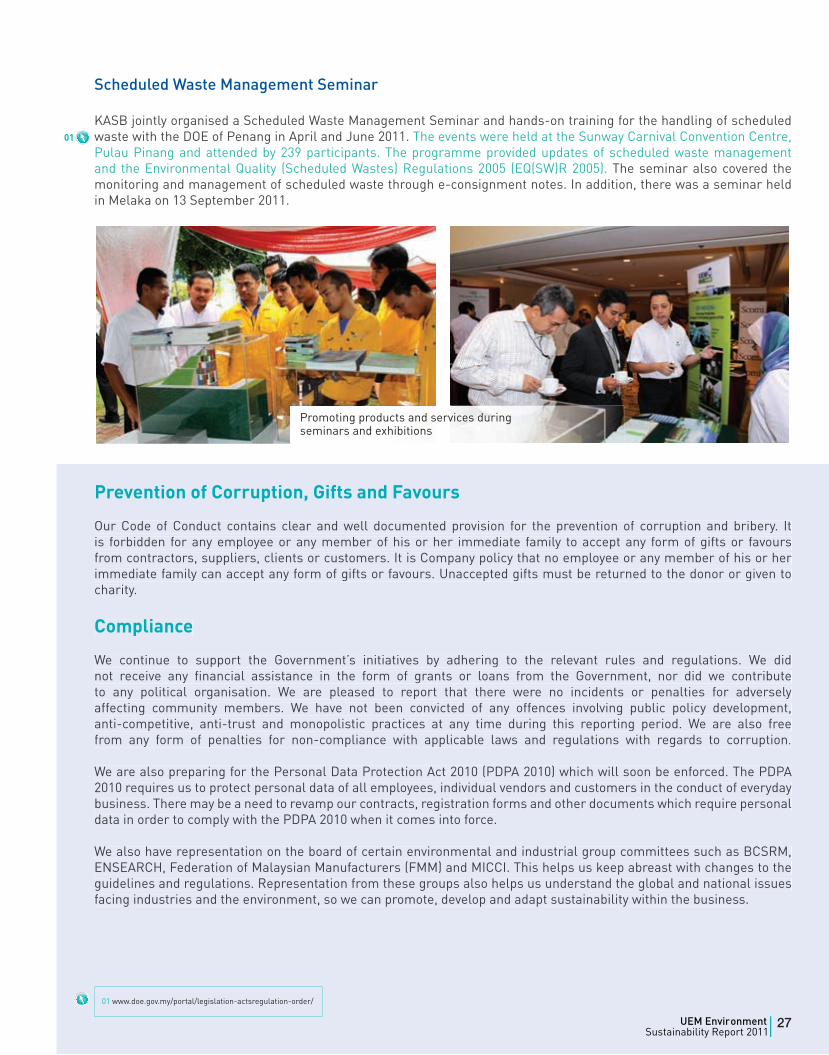
Scheduled Waste Management Seminar
KASB jointly organised a Scheduled Waste Management Seminar and hands-on training for the handling of scheduled waste with the DOE of Penang in April and June 2011. The events were held at the Sunway Carnival Convention Centre, Pulau Pinang and attended by 239 participants. The programme provided updates of scheduled waste management and the Environmental Quality (Scheduled Wastes) Regulations 2005 (EQ(SW)R 2005). The seminar also covered the monitoring and management of scheduled waste through e-consignment notes. In addition, there was a seminar held in Melaka on 13 September 2011.
Prevention of Corruption, Gifts and Favours
Our Code of Conduct contains clear and well documented provision for the prevention of corruption and bribery. It is forbidden for any employee or any member of his or her immediate family to accept any form of gifts or favours from contractors, suppliers, clients or customers. It is Company policy that no employee or any member of his or her immediate family can accept any form of gifts or favours. Unaccepted gifts must be returned to the donor or given to charity.
Compliance
We continue to support the Government’s initiatives by adhering to the relevant rules and regulations. We did not receive any financial assistance in the form of grants or loans from the Government, nor did we contribute to any political organisation. We are pleased to report that there were no incidents or penalties for adversely affecting community members. We have not been convicted of any offences involving public policy development, anti-competitive, anti-trust and monopolistic practices at any time during this reporting period. We are also free from any form of penalties for non-compliance with applicable laws and regulations with regards to corruption.
We are also preparing for the Personal Data Protection Act 2010 (PDPA 2010) which will soon be enforced. The PDPA 2010 requires us to protect personal data of all employees, individual vendors and customers in the conduct of everyday business. There may be a need to revamp our contracts, registration forms and other documents which require personal data in order to comply with the PDPA 2010 when it comes into force.
We also have representation on the board of certain environmental and industrial group committees such as BCSRM, ENSEARCH, Federation of Malaysian Manufacturers (FMM) and MICCI. This helps us keep abreast with changes to the guidelines and regulations. Representation from these groups also helps us understand the global and national issues facing industries and the environment, so we can promote, develop and adapt sustainability within the business.
01
01 www.doe.gov.my/portal/legislation-actsregulation-order/
Promoting products and services duringseminars and exhibitions
27UEM EnvironmentSustainability Report 2011|
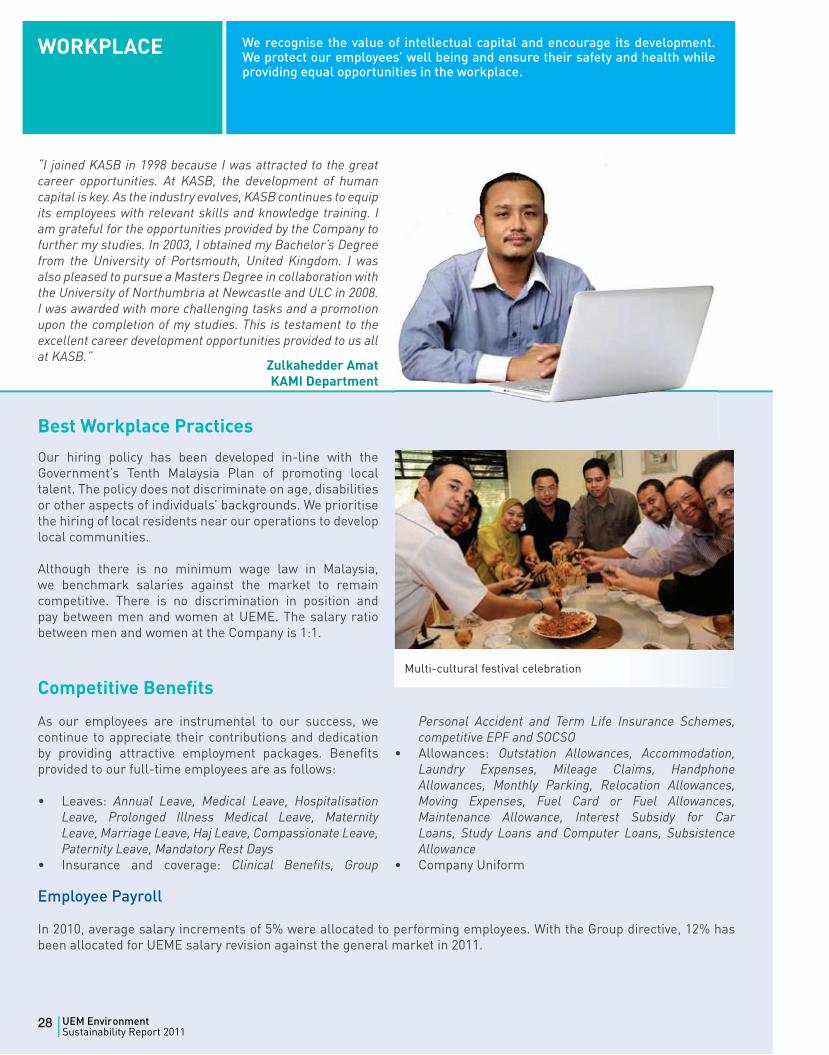
“I joined KASB in 1998 because I was attracted to the great career opportunities. At KASB, the development of human capital is key. As the industry evolves, KASB continues to equip its employees with relevant skills and knowledge training. I am grateful for the opportunities provided by the Company to further my studies. In 2003, I obtained my Bachelor’s Degree from the University of Portsmouth, United Kingdom. I was also pleased to pursue a Masters Degree in collaboration with the University of Northumbria at Newcastle and ULC in 2008. I was awarded with more challenging tasks and a promotion upon the completion of my studies. This is testament to the excellent career development opportunities provided to us all at KASB.”
As our employees are instrumental to our success, we continue to appreciate their contributions and dedication by providing attractive employment packages. Benefits provided to our full-time employees are as follows:
• Leaves: Annual Leave, Medical Leave, Hospitalisation Leave, Prolonged Illness Medical Leave, Maternity Leave, Marriage Leave, Haj Leave, Compassionate Leave, Paternity Leave, Mandatory Rest Days
• Insurance and coverage: Clinical Benefits, Group
Personal Accident and Term Life Insurance Schemes, competitive EPF and SOCSO
• Allowances: Outstation Allowances, Accommodation, Laundry Expenses, Mileage Claims, Handphone Allowances, Monthly Parking, Relocation Allowances, Moving Expenses, Fuel Card or Fuel Allowances, Maintenance Allowance, Interest Subsidy for Car Loans, Study Loans and Computer Loans, Subsistence Allowance
• Company Uniform
Our hiring policy has been developed in-line with the Government’s Tenth Malaysia Plan of promoting local talent. The policy does not discriminate on age, disabilities or other aspects of individuals’ backgrounds. We prioritise the hiring of local residents near our operations to develop local communities.
Although there is no minimum wage law in Malaysia, we benchmark salaries against the market to remain competitive. There is no discrimination in position and pay between men and women at UEME. The salary ratio between men and women at the Company is 1:1.
Best Workplace Practices
Competitive Benefits
Employee Payroll
In 2010, average salary increments of 5% were allocated to performing employees. With the Group directive, 12% has been allocated for UEME salary revision against the general market in 2011.
WORKPLACE We recognise the value of intellectual capital and encourage its development. We protect our employees’ well being and ensure their safety and health while providing equal opportunities in the workplace.
Multi-cultural festival celebration
Zulkahedder AmatKAMI Department
28 UEM EnvironmentSustainability Report 2011|
Diversity at Workplace
At UEME, we respect employees regardless of age, gender, ethnicity, background, religion or other personal traits. We promote diversity by acknowledging that each individual is unique.
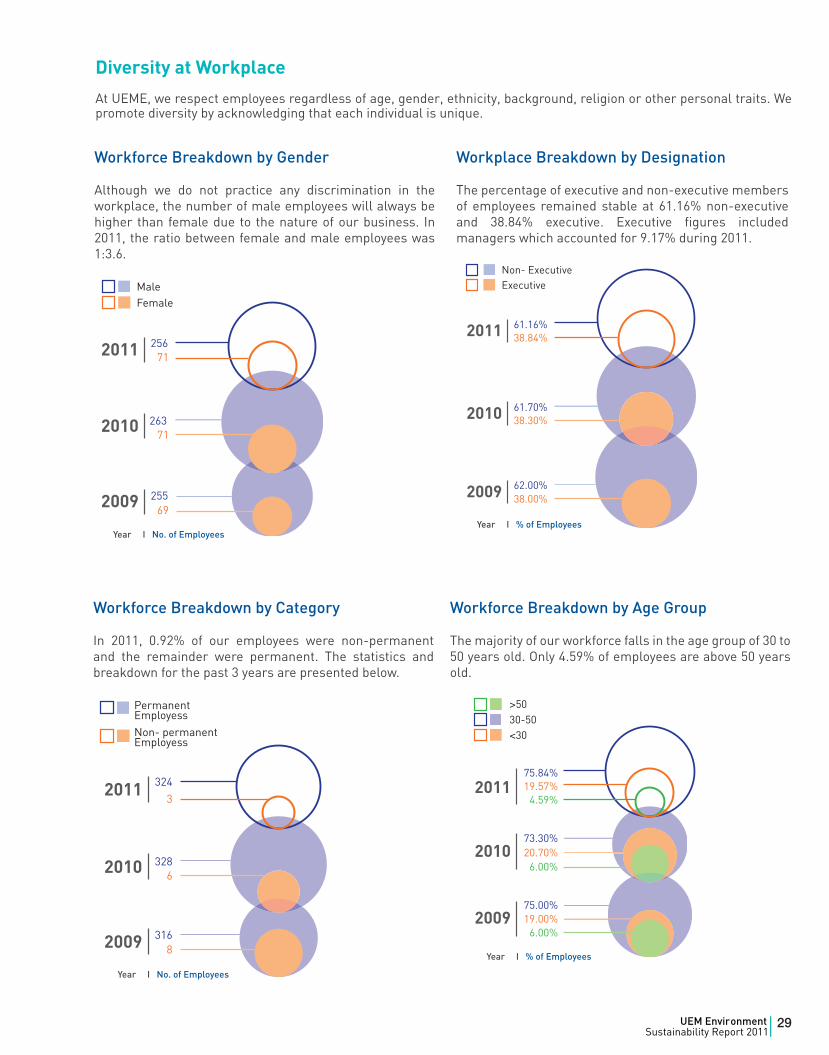
Workforce Breakdown by Gender
Although we do not practice any discrimination in the workplace, the number of male employees will always be higher than female due to the nature of our business. In 2011, the ratio between female and male employees was 1:3.6.
Workplace Breakdown by Designation
The percentage of executive and non-executive members of employees remained stable at 61.16% non-executive and 38.84% executive. Executive figures included managers which accounted for 9.17% during 2011.
Year I No. of EmployeesYear I % of Employees
Workforce Breakdown by Category
In 2011, 0.92% of our employees were non-permanent and the remainder were permanent. The statistics and breakdown for the past 3 years are presented below.
Workforce Breakdown by Age Group
The majority of our workforce falls in the age group of 30 to 50 years old. Only 4.59% of employees are above 50 years old.
Year I No. of Employees
Year I % of Employees
29UEM EnvironmentSustainability Report 2011|
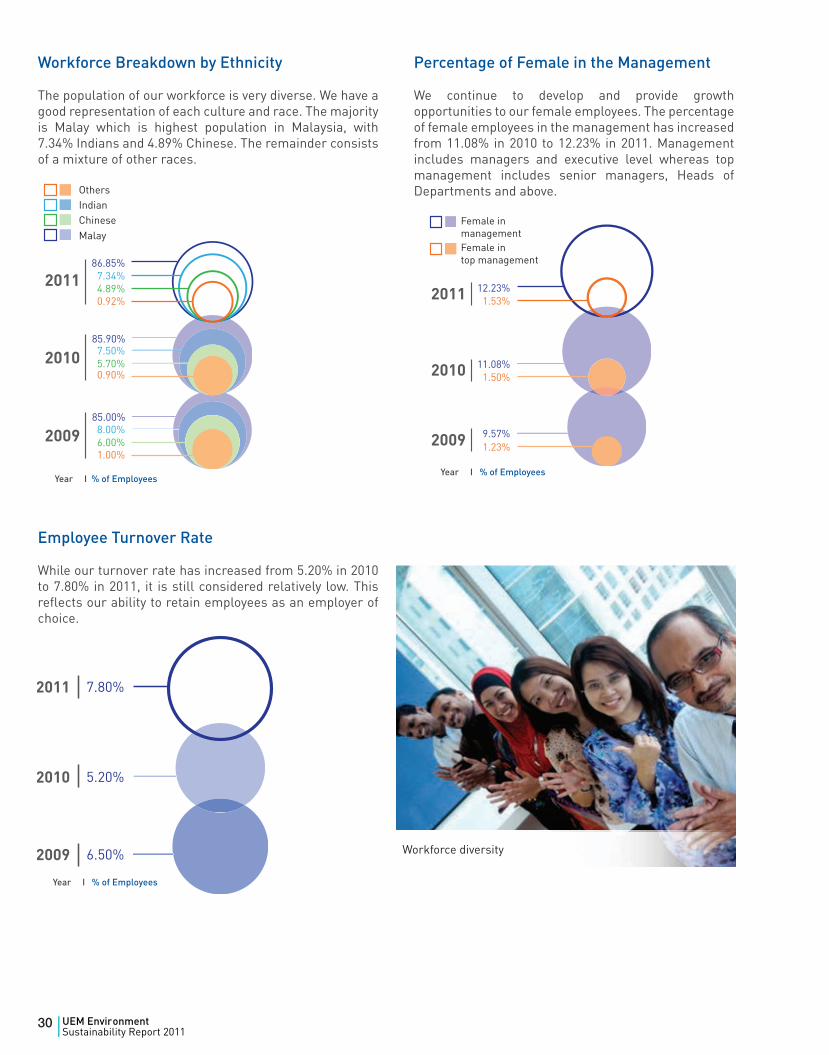
Workforce Breakdown by Ethnicity
The population of our workforce is very diverse. We have a good representation of each culture and race. The majority is Malay which is highest population in Malaysia, with 7.34% Indians and 4.89% Chinese. The remainder consists of a mixture of other races.
Percentage of Female in the Management
We continue to develop and provide growth opportunities to our female employees. The percentage of female employees in the management has increased from 11.08% in 2010 to 12.23% in 2011. Management includes managers and executive level whereas top management includes senior managers, Heads of Departments and above.
Year I % of Employees
Employee Turnover Rate
While our turnover rate has increased from 5.20% in 2010 to 7.80% in 2011, it is still considered relatively low. This reflects our ability to retain employees as an employer of choice.
Year I % of Employees
Year I % of Employees
Workforce diversity
30 UEM EnvironmentSustainability Report 2011|
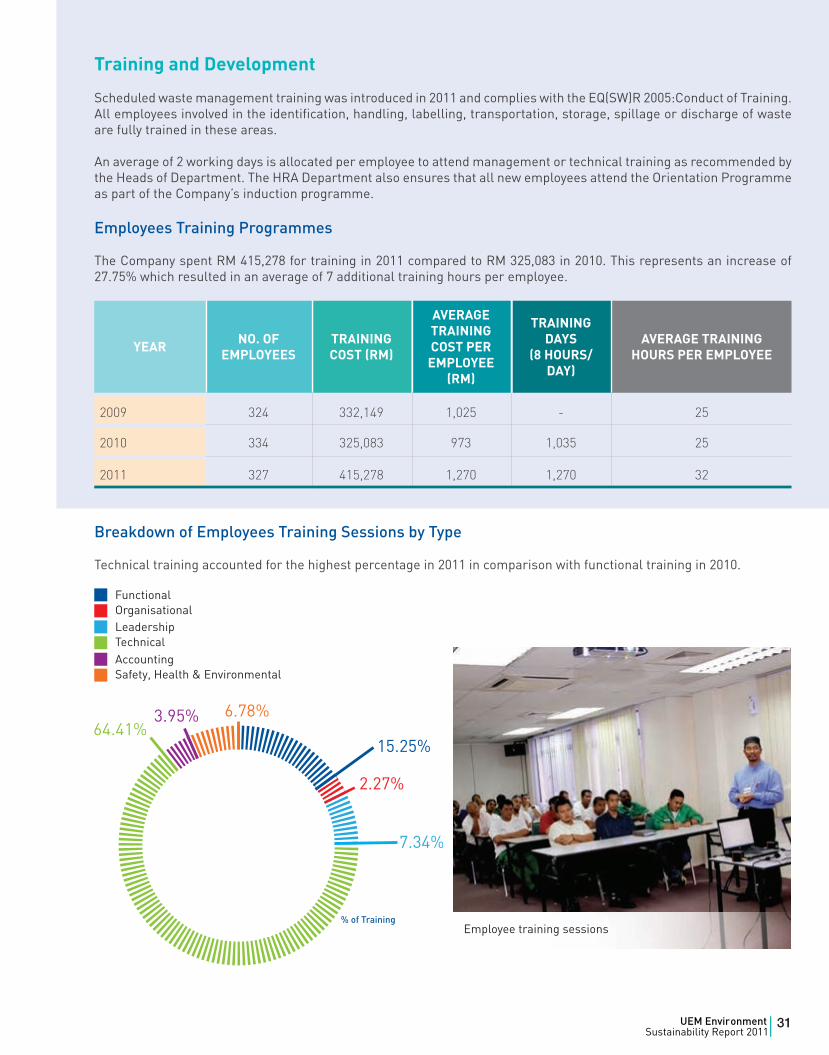
Training and Development
Scheduled waste management training was introduced in 2011 and complies with the EQ(SW)R 2005:Conduct of Training. All employees involved in the identification, handling, labelling, transportation, storage, spillage or discharge of waste are fully trained in these areas.
An average of 2 working days is allocated per employee to attend management or technical training as recommended by the Heads of Department. The HRA Department also ensures that all new employees attend the Orientation Programme as part of the Company’s induction programme.
Employees Training Programmes
The Company spent RM 415,278 for training in 2011 compared to RM 325,083 in 2010. This represents an increase of 27.75% which resulted in an average of 7 additional training hours per employee.
Breakdown of Employees Training Sessions by Type
Technical training accounted for the highest percentage in 2011 in comparison with functional training in 2010.
% of TrainingEmployee training sessions
YEAR NO. OF EMPLOYEES
TRAINING COST (RM)
AVERAGE TRAINING COST PER
EMPLOYEE (RM)
TRAINING DAYS
(8 HOURS/DAY)
AVERAGE TRAINING HOURS PER EMPLOYEE
2009 324 332,149 1,025 - 25
2010 334 325,083 973 1,035 25
2011 327 415,278 1,270 1,270 32
31UEM EnvironmentSustainability Report 2011|
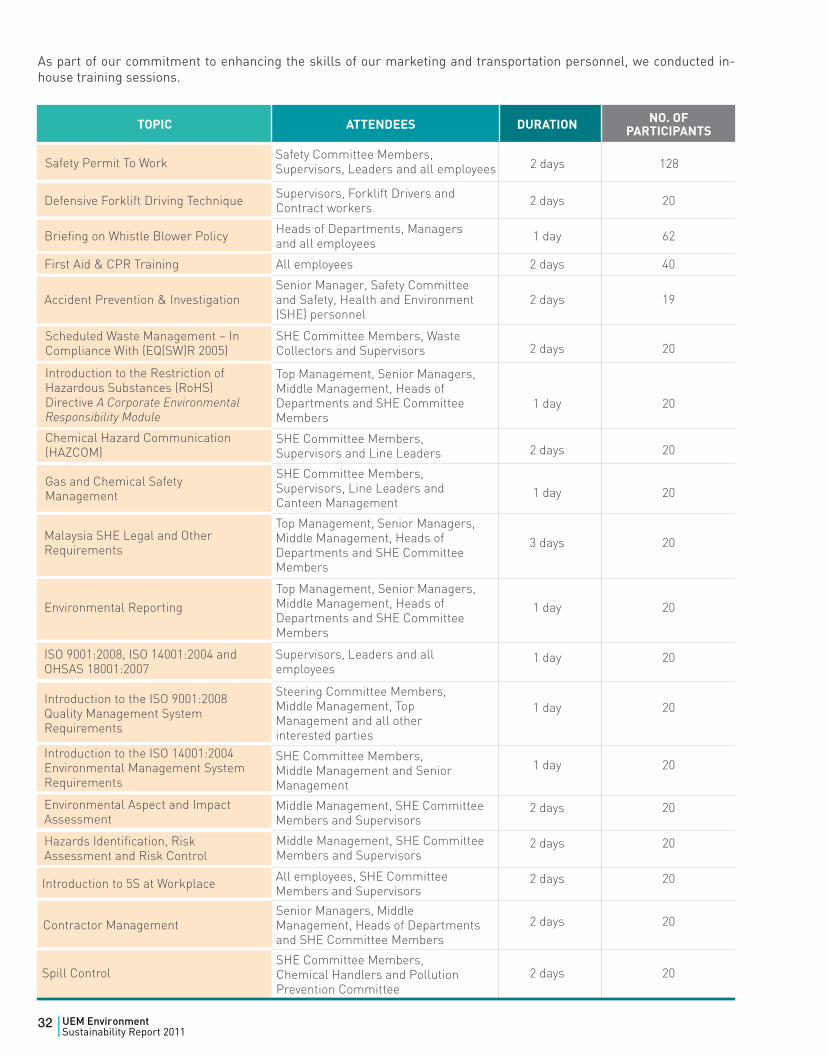
As part of our commitment to enhancing the skills of our marketing and transportation personnel, we conducted in-house training sessions.
TOPIC ATTENDEES DURATION NO. OF PARTICIPANTS
Defensive Forklift Driving Technique Supervisors, Forklift Drivers and Contract workers 2 days 20
Briefing on Whistle Blower Policy Heads of Departments, Managers and all employees 1 day 62
First Aid & CPR Training All employees 2 days 40
Accident Prevention & InvestigationSenior Manager, Safety Committee and Safety, Health and Environment (SHE) personnel
2 days 19
2 days 20
1 day 20
2 days 20
1 day 20
Malaysia SHE Legal and Other Requirements 3 days 20
Environmental Reporting 1 day 20
1 day 20
1 day 20
1 day 20
2 days 20
2 days 20
2 days 20
2 days 20
Spill Control 2 days 20
ISO 9001:2008, ISO 14001:2004 and OHSAS 18001:2007
Introduction to the ISO 9001:2008 Quality Management System Requirements
Introduction to the ISO 14001:2004 Environmental Management System Requirements
Environmental Aspect and Impact Assessment
Hazards Identification, Risk Assessment and Risk Control
Introduction to 5S at Workplace
Contractor Management
Top Management, Senior Managers, Middle Management, Heads of Departments and SHE Committee Members
Steering Committee Members, Middle Management, Top Management and all other interested parties
SHE Committee Members, Middle Management and Senior Management
Middle Management, SHE Committee Members and Supervisors
Middle Management, SHE Committee Members and Supervisors
All employees, SHE Committee Members and Supervisors
Senior Managers, Middle Management, Heads of Departments and SHE Committee Members
SHE Committee Members, Chemical Handlers and Pollution Prevention Committee
SHE Committee Members, Waste Collectors and Supervisors
SHE Committee Members, Supervisors and Line Leaders
SHE Committee Members, Supervisors, Line Leaders and Canteen Management
Top Management, Senior Managers, Middle Management, Heads of Departments and SHE Committee Members
Top Management, Senior Managers, Middle Management, Heads of Departments and SHE Committee Members
Supervisors, Leaders and all employees
Gas and Chemical Safety Management
Introduction to the Restriction of Hazardous Substances (RoHS) Directive A Corporate Environmental Responsibility Module
Chemical Hazard Communication (HAZCOM)
Scheduled Waste Management – In Compliance With (EQ(SW)R 2005)
Safety Permit To WorkSafety Committee Members, Supervisors, Leaders and all employees 2 days 128
32 UEM EnvironmentSustainability Report 2011|
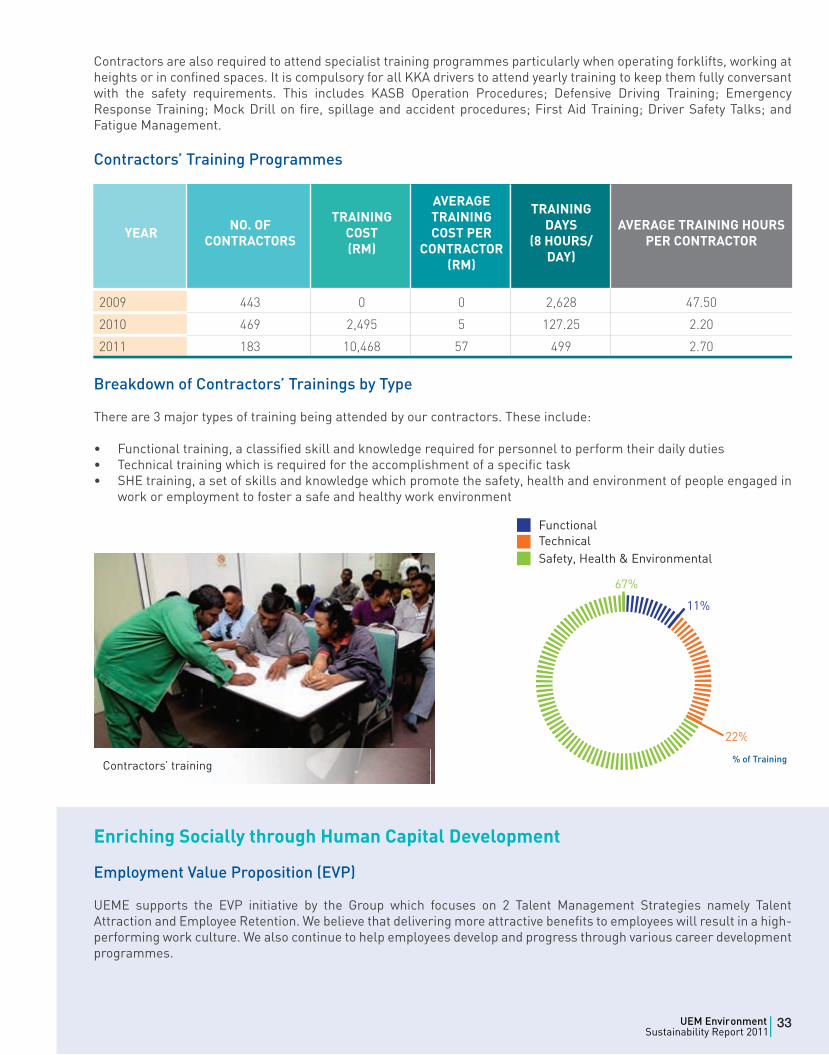
Contractors are also required to attend specialist training programmes particularly when operating forklifts, working at heights or in confined spaces. It is compulsory for all KKA drivers to attend yearly training to keep them fully conversant with the safety requirements. This includes KASB Operation Procedures; Defensive Driving Training; Emergency Response Training; Mock Drill on fire, spillage and accident procedures; First Aid Training; Driver Safety Talks; and Fatigue Management.
Contractors’ Training Programmes
YEAR NO. OF CONTRACTORS
TRAINING COST(RM)
AVERAGE TRAINING COST PER
CONTRACTOR (RM)
TRAINING DAYS
(8 HOURS/DAY)
AVERAGE TRAINING HOURS PER CONTRACTOR
2009 443 0 0 2,628 47.50
2010 469 2,495 5 127.25 2.20
2011 183 10,468 57 499 2.70
Breakdown of Contractors’ Trainings by Type
There are 3 major types of training being attended by our contractors. These include:
• Functional training, a classified skill and knowledge required for personnel to perform their daily duties • Technical training which is required for the accomplishment of a specific task• SHE training, a set of skills and knowledge which promote the safety, health and environment of people engaged in
work or employment to foster a safe and healthy work environment
Enriching Socially through Human Capital Development
Employment Value Proposition (EVP)
UEME supports the EVP initiative by the Group which focuses on 2 Talent Management Strategies namely Talent Attraction and Employee Retention. We believe that delivering more attractive benefits to employees will result in a high-performing work culture. We also continue to help employees develop and progress through various career development programmes.
% of TrainingContractors’ training
33UEM EnvironmentSustainability Report 2011|
Employee Engagement Survey (EES)
The EES was conducted to measure employees’ engagement levels within the Company. The EES focuses on retaining employees and understanding their concerns more effectively.
Long Service Awards
We acknowledge our employees’ contributions and reward them for their dedication. Long Service Awards are granted to employees in recognition of 10 years of service with the Company. Tokens of appreciation consist of a watch or voucher. 146 employees had received this award by 31 December 2011.
Manpower Rationalisation Programme
In February 2011, KASB began its Manpower Rationalisation Programme by reducing sub-contract labour at respective areas namely Production 1, Production 2 and Logistics. In September 2011, we also changed the shift pattern from 3 to 4 in order to meet the required manpower. In doing so, we have reduced the manpower required for each shift. This on-going exercise aims to maximise our manpower and increase employee productivity while reducing our dependency on contract labour.
Performance Appraisal
A KPI matrix is adopted to quantify financial and non-financial performance targets. This matrix measures employees’ achievements in meeting set targets. The KPIs are monitored periodically by Heads of Departments and identified variances are addressed. This structured approach is important as employees’ achievements directly affect the Company’s scorecard as a whole. At UEME, performance appraisal is conducted biannually, in the middle and end of each year. In 2011, all employees (100%) were formally appraised through this system.
In 2011, EISB introduced a matrix system which maps employees performance against an initial KPI set. This resulted in a higher level of performance being recorded as employees experienced increased motivation which led to improved performance.
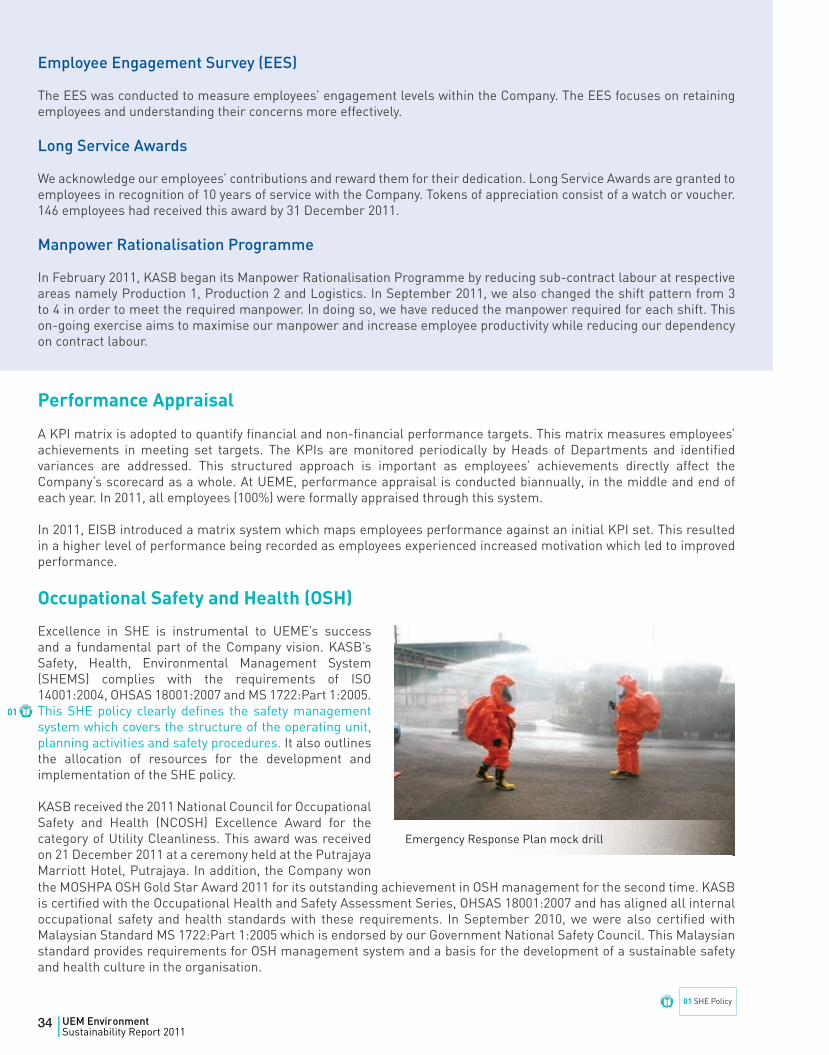
Occupational Safety and Health (OSH)
the MOSHPA OSH Gold Star Award 2011 for its outstanding achievement in OSH management for the second time. KASB is certified with the Occupational Health and Safety Assessment Series, OHSAS 18001:2007 and has aligned all internal occupational safety and health standards with these requirements. In September 2010, we were also certified with Malaysian Standard MS 1722:Part 1:2005 which is endorsed by our Government National Safety Council. This Malaysian standard provides requirements for OSH management system and a basis for the development of a sustainable safety and health culture in the organisation.
01 SHE Policy
01
Excellence in SHE is instrumental to UEME’s success and a fundamental part of the Company vision. KASB’s Safety, Health, Environmental Management System (SHEMS) complies with the requirements of ISO 14001:2004, OHSAS 18001:2007 and MS 1722:Part 1:2005. This SHE policy clearly defines the safety management system which covers the structure of the operating unit, planning activities and safety procedures. It also outlines the allocation of resources for the development and implementation of the SHE policy.
KASB received the 2011 National Council for Occupational Safety and Health (NCOSH) Excellence Award for the category of Utility Cleanliness. This award was received on 21 December 2011 at a ceremony held at the Putrajaya Marriott Hotel, Putrajaya. In addition, the Company won
Emergency Response Plan mock drill
34 UEM EnvironmentSustainability Report 2011|
01 SHE Policy
Each operating unit conducted safety and health training programmes to create safety risk awareness and precautionary measures amongst its employees. Hazard risk training programmes, including a Chemical Health Risk Assessment (CHRA), were also introduced and their effectiveness regularly evaluated. A Hazard Identification, Risk Assessment and Determine Control (HIRADC) was established for each work activity in order to identify hazards, assess the risks and determine the control process.
Emergency Preparedness
The following emergencies have been identified and registered with the KASB’s SHE Department. Various emergency facilities have been located around the plant to reduce the risk of emergencies occurring. Type of Risk Approaches
The OSH Committee
Our Safety and Health Committee (SHC) is chaired by the Chief Operating Officer (COO). The total committee consists of 26 members: 1 chairman, 1 alternate chairman, 1 secretary, 12 management executive level and 11 non-management non-executive representatives. The SHC members consist of 50% management and 50% non-management who are responsible for workplace inspections throughout the year to ensure high safety standards are adopted at all times.
The SHC is committed to continuous improvement in SHE Quality performance through extending Safety, Health, Environment and Quality (SHEQ) management systems to all employees, contractors and vendors. The SHC meets quarterly to promote consistency and continuous learning in all OSH matters. This has resulted in fewer incidents as highlighted below. The total number of incidents has not increased compared to 2010.
A total of 4 SHC meetings were held on 18 February, 6 May, 8 August and 6 December 2011. All meetings received an attendance rate of more than 60%.
• A sprinkler system in the plant• Fire extinguishers (dry powder/ CO2 /Foam)• A hose reel system• An argonite spray system• An automatic foam spray system• An automatic calling mechanism to Bomba
through CMS
• Fire or explosion• Uncontrolled released of hazardous fumes• Medical related emergencies• Spilage of Technically Enhanced Naturally
Occurence Radioactive Material (TENORM) Waste
Year I No. of Incidents% of Incidents
An evacuation drill was successfully performed at the WMC on 12 September 2011. A fire drill was also conducted at Mercu UEM on 14 December 2011.
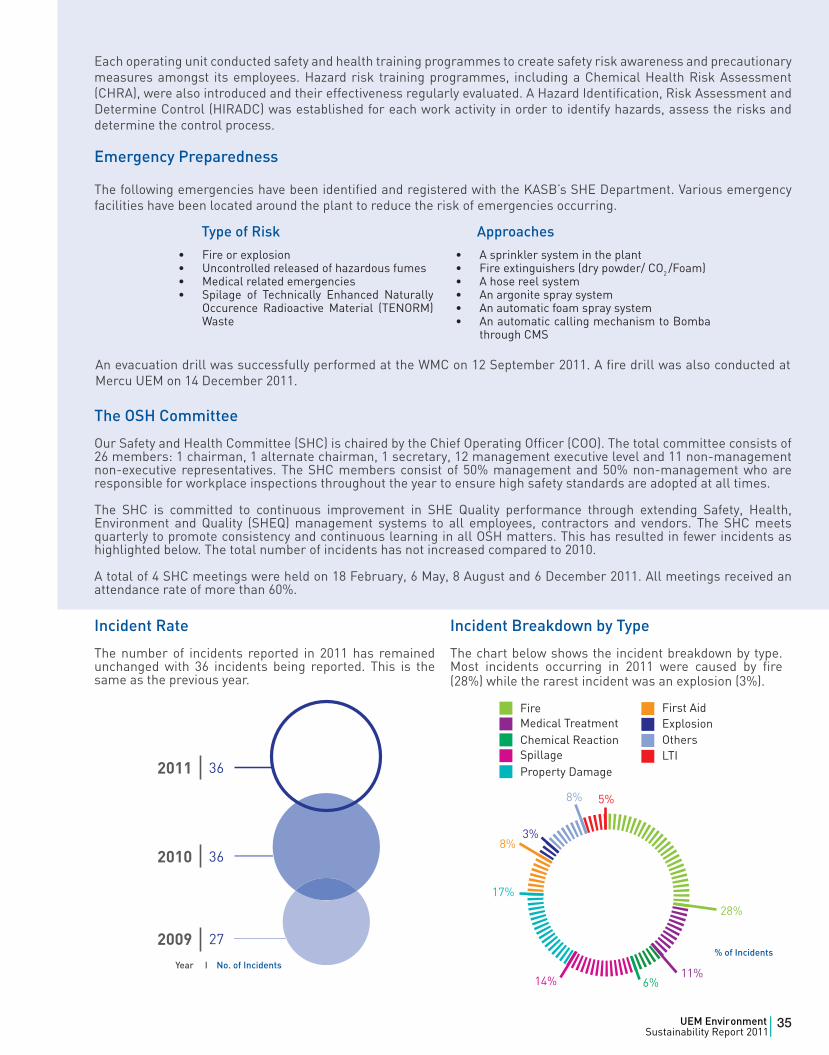
Incident Rate
The number of incidents reported in 2011 has remained unchanged with 36 incidents being reported. This is the same as the previous year.
Incident Breakdown by Type
The chart below shows the incident breakdown by type. Most incidents occurring in 2011 were caused by fire (28%) while the rarest incident was an explosion (3%).
35UEM EnvironmentSustainability Report 2011|
The number of Lost Time Injuries (LTI) cases reduced from 3 in 2010 to 2 in 2011. We conducted Safety PTW Training and implemented a Contractor Pass which required all contract workers to attend a Safety Briefing every 6 months. A summary of LTI incidents occurring in 2011 is presented below.
LOCATION INCIDENT SUMMARY CORRECTIVE ACTION TAKEN
28 June and 8 July 2011
Quench Chute INC 4
A worker was handling the drum changing process at quench chute with a forklift when hot water escaped from the chute to a full drum and splashed onto him. During the first incident, the victim suffered injury to his foot. The second occurrence was more serious where the victim was totally drenched with hot water.
Following the first incident, an outlet tube was fabricated and installed on the slag collection drums immediately. This ensures excess water can flow freely from the drum.
In response to the second incident:
• Visors were fabricated and installed on forklift trucks• Sliding gates were installed at the chute• Chemical suits are required to be worn by forklift
drivers• A buddy system and safety watch were introduced.
Workers were forbidden from handling sludge from the quench chute alone
• Awareness sessions were held for all INC 4 employees on emergency handling
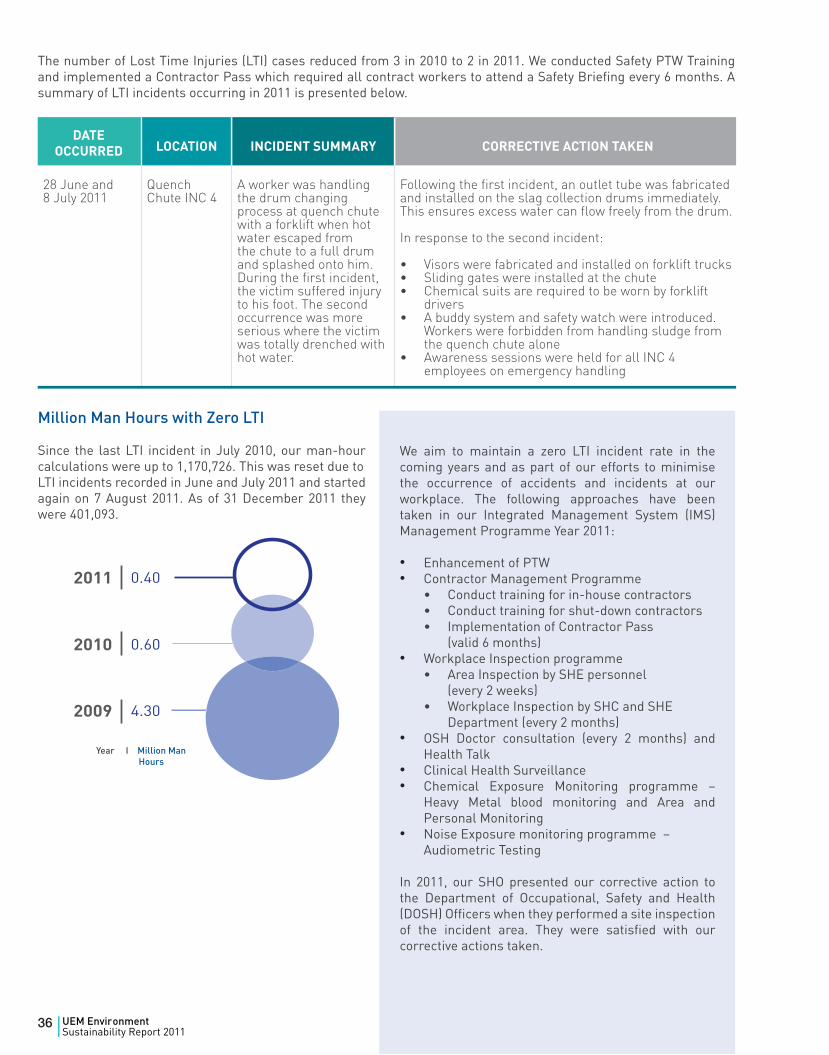
Million Man Hours with Zero LTI
Since the last LTI incident in July 2010, our man-hour calculations were up to 1,170,726. This was reset due to LTI incidents recorded in June and July 2011 and started again on 7 August 2011. As of 31 December 2011 they were 401,093.
We aim to maintain a zero LTI incident rate in the coming years and as part of our efforts to minimise the occurrence of accidents and incidents at our workplace. The following approaches have been taken in our Integrated Management System (IMS) Management Programme Year 2011:
• Enhancement of PTW • Contractor Management Programme• Conduct training for in-house contractors• Conduct training for shut-down contractors• Implementation of Contractor Pass
(valid 6 months)• Workplace Inspection programme• Area Inspection by SHE personnel
(every 2 weeks)• Workplace Inspection by SHC and SHE Department (every 2 months)
• OSH Doctor consultation (every 2 months) and Health Talk
• Clinical Health Surveillance • Chemical Exposure Monitoring programme –
Heavy Metal blood monitoring and Area and Personal Monitoring
• Noise Exposure monitoring programme – Audiometric Testing
In 2011, our SHO presented our corrective action to the Department of Occupational, Safety and Health (DOSH) Officers when they performed a site inspection of the incident area. They were satisfied with our corrective actions taken.
Year I Million Man Hours
DATE OCCURRED
36 UEM EnvironmentSustainability Report 2011|
Awareness Training for Serious Diseases
We are committed to preventing the spread of serious diseases despite all employees receiving full clinical insurance and health cover. For example, Influenza A (H1N1) has affected many Malaysian citizens and we conducted an education programme equipping all employees with the latest guidelines and preventative approaches. Awareness posters were also displayed at strategic points around the office buildings and plants.
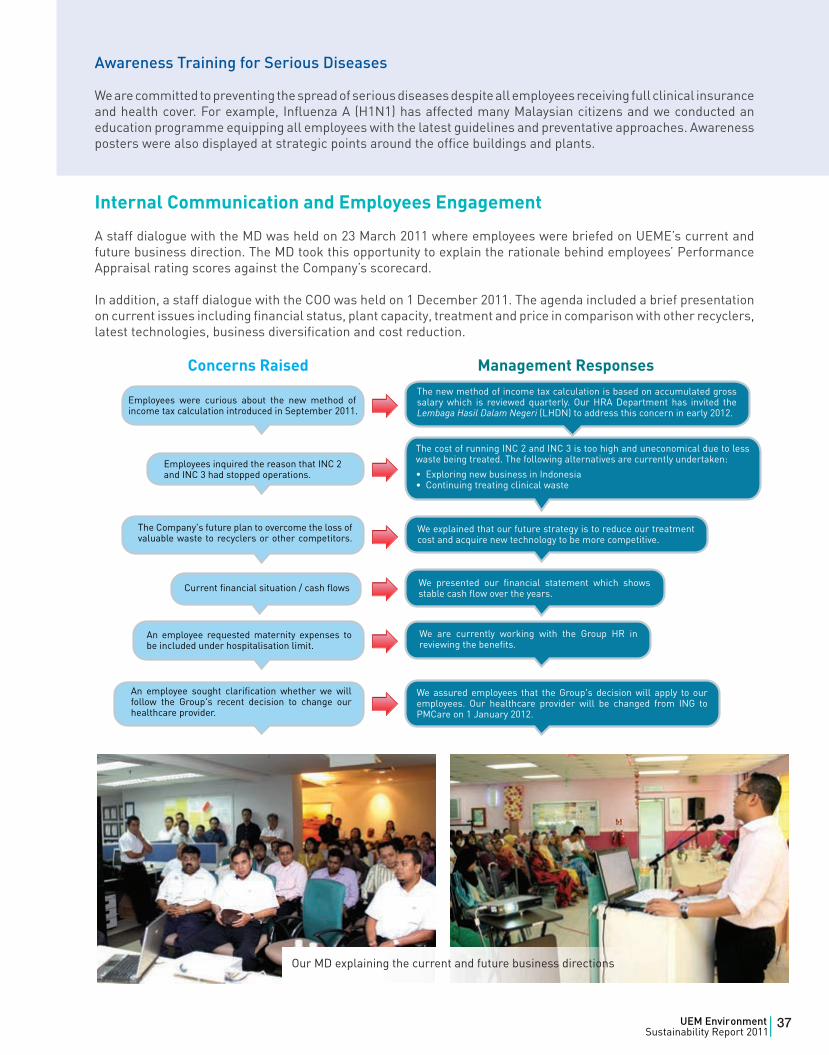
Internal Communication and Employees Engagement
A staff dialogue with the MD was held on 23 March 2011 where employees were briefed on UEME’s current and future business direction. The MD took this opportunity to explain the rationale behind employees’ Performance Appraisal rating scores against the Company’s scorecard.
In addition, a staff dialogue with the COO was held on 1 December 2011. The agenda included a brief presentation on current issues including financial status, plant capacity, treatment and price in comparison with other recyclers, latest technologies, business diversification and cost reduction.
Concerns Raised Management Responses
Our MD explaining the current and future business directions
37UEM EnvironmentSustainability Report 2011|
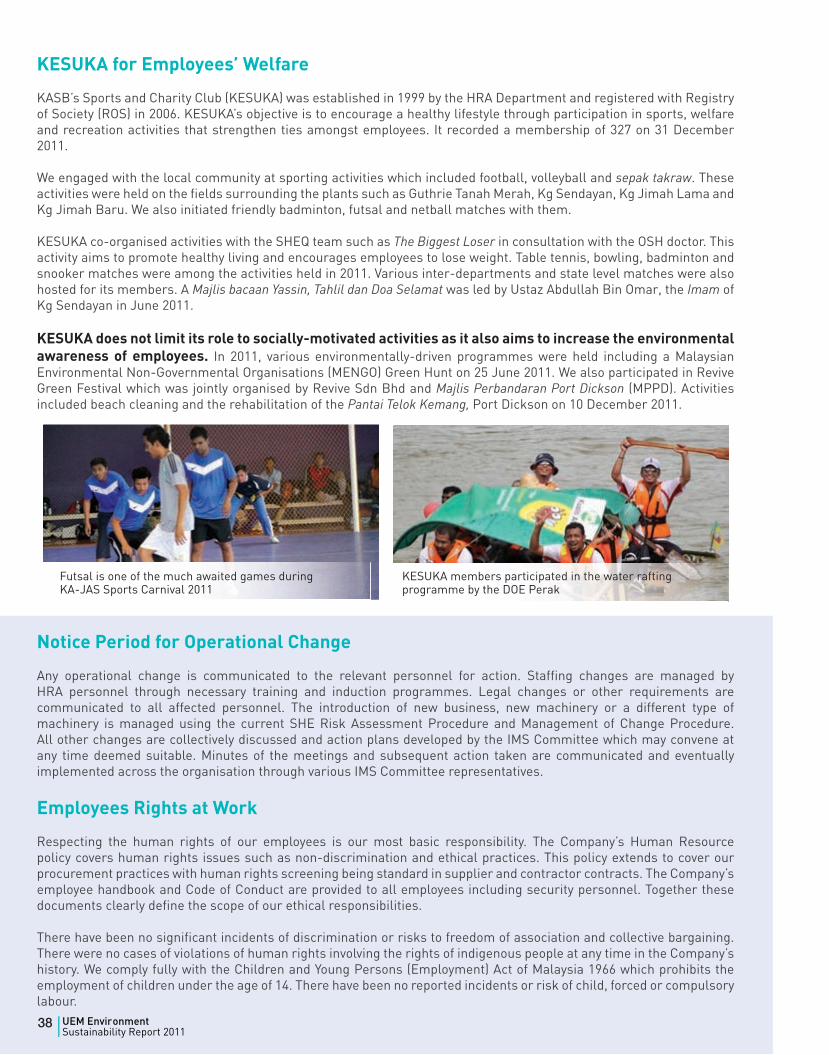
KESUKA for Employees’ Welfare
KASB’s Sports and Charity Club (KESUKA) was established in 1999 by the HRA Department and registered with Registry of Society (ROS) in 2006. KESUKA’s objective is to encourage a healthy lifestyle through participation in sports, welfare and recreation activities that strengthen ties amongst employees. It recorded a membership of 327 on 31 December 2011. We engaged with the local community at sporting activities which included football, volleyball and sepak takraw. These activities were held on the fields surrounding the plants such as Guthrie Tanah Merah, Kg Sendayan, Kg Jimah Lama and Kg Jimah Baru. We also initiated friendly badminton, futsal and netball matches with them.
KESUKA co-organised activities with the SHEQ team such as The Biggest Loser in consultation with the OSH doctor. This activity aims to promote healthy living and encourages employees to lose weight. Table tennis, bowling, badminton and snooker matches were among the activities held in 2011. Various inter-departments and state level matches were also hosted for its members. A Majlis bacaan Yassin, Tahlil dan Doa Selamat was led by Ustaz Abdullah Bin Omar, the Imam of Kg Sendayan in June 2011.
KESUKA does not limit its role to socially-motivated activities as it also aims to increase the environmental awareness of employees. In 2011, various environmentally-driven programmes were held including a Malaysian Environmental Non-Governmental Organisations (MENGO) Green Hunt on 25 June 2011. We also participated in Revive Green Festival which was jointly organised by Revive Sdn Bhd and Majlis Perbandaran Port Dickson (MPPD). Activities included beach cleaning and the rehabilitation of the Pantai Telok Kemang, Port Dickson on 10 December 2011.
Notice Period for Operational Change
Any operational change is communicated to the relevant personnel for action. Staffing changes are managed by HRA personnel through necessary training and induction programmes. Legal changes or other requirements are communicated to all affected personnel. The introduction of new business, new machinery or a different type of machinery is managed using the current SHE Risk Assessment Procedure and Management of Change Procedure. All other changes are collectively discussed and action plans developed by the IMS Committee which may convene at any time deemed suitable. Minutes of the meetings and subsequent action taken are communicated and eventually implemented across the organisation through various IMS Committee representatives.
Employees Rights at Work
Respecting the human rights of our employees is our most basic responsibility. The Company’s Human Resource policy covers human rights issues such as non-discrimination and ethical practices. This policy extends to cover our procurement practices with human rights screening being standard in supplier and contractor contracts. The Company’s employee handbook and Code of Conduct are provided to all employees including security personnel. Together these documents clearly define the scope of our ethical responsibilities.
There have been no significant incidents of discrimination or risks to freedom of association and collective bargaining. There were no cases of violations of human rights involving the rights of indigenous people at any time in the Company’s history. We comply fully with the Children and Young Persons (Employment) Act of Malaysia 1966 which prohibits the employment of children under the age of 14. There have been no reported incidents or risk of child, forced or compulsory labour.
Futsal is one of the much awaited games duringKA-JAS Sports Carnival 2011
KESUKA members participated in the water rafting programme by the DOE Perak
38 UEM EnvironmentSustainability Report 2011|
MARKETPLACE A sustainable marketplace consists of transparency, accountability and high value delivery within the supply-chain and customers. UEME regularly engages with its customers to understand their requirements and consistently delivers high quality services through its suppliers’ development management.
Certifications and Achievements
We continue to comply with local and international standards on quality. The certifications achieved by our Companies are testament to our commitment to deliver the best environmental solutions.
“UEME and its contractors need to recognise the risk that e-biddings can bring to long-term relationships, project performance and contractor sustainability. E-bidding and e-tendering processes must also consider value extraction and not ignore partnering, team-working and best value. Contractors view the e-bidding process as selecting suppliers and contractors on price, rather than value and quality.”
Haris SelvenPembinaan dan Kejuruteraan Damai
(Contractor)
In response to this, the e-bidding process actually involves 2 bidding areas, technical and commercial. The technical bid is reviewed first. Suppliers who pass this stage can then be considered for the commercial bid. This systematic bidding process ensures all suppliers are evaluated fairly and technical expertise is prioritised.
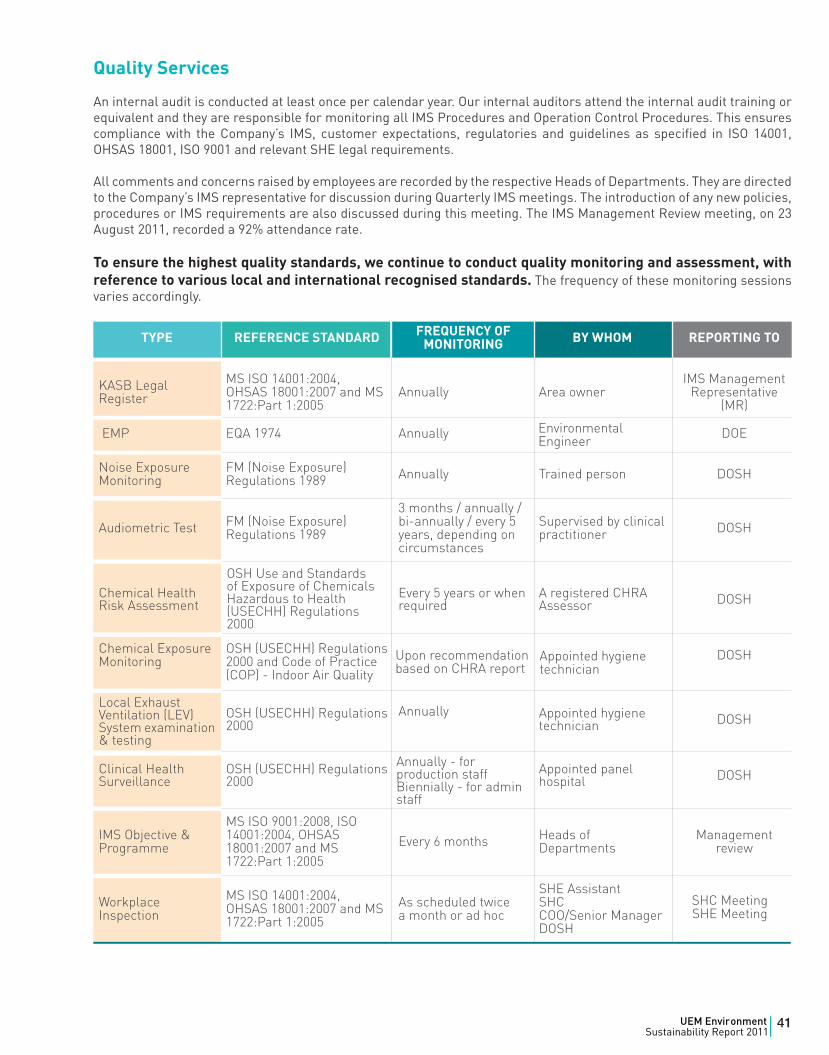
“Our Company has been engaging with KASB for scheduled waste disposal for more than 5 years. The overall services provided are good and always improving. We previously experienced transportation problems but action had been taken by KASB. Currently, the transportation and service are prompt and the communication with your employees and support team is very encouraging.”
Jamaluddin MansurKisswire Cord (Customer)
“There is now better engagement between KASB and the DOE especially when providing updated information on unexpected incidents such as fire, explosions or malfunctioning equipment. KASB’s compliance level is good based on investigations carried out. However, there were still companies which claimed that KASB does not entertain small quantities of waste which has been a concern for small scale companies.”
Rosli Bin MustafaDOE Negeri Sembilan
In response to this, we continue to emphasise that we do accept small quantities of waste. This is reiterated during DOE seminars, customer seminars and industrial association meetings. We also highlight this in other forums and feedback platforms. A console pick-up service is also available regardless of the quantity of waste.
WASTEWASTE
E-Bidding
WASTE
COMPANY CERTIFICATIONS ACHIEVED TO DATE
KASB MS ISO 9001:2008, ISO 14001:2004, OHSAS 18001:2007, MS 1722:Part 1:2005 and ISO/IEC 17025
KKA MS ISO 9001:2008, ISO 14001:2004, OHSAS 18001:2007 and MS 1722:Part 1:2005
KKI MS ISO 9001:2008, ISO 14001:2004 and OHSAS 18001:2007
SBSB MS ISO 9001:2008, ISO 14001:2004 and OHSAS 18001:2007
39UEM EnvironmentSustainability Report 2011|
01 Blue Book - Scheduled Waste Management
01
40 UEM EnvironmentSustainability Report 2011|
Quality Services
An internal audit is conducted at least once per calendar year. Our internal auditors attend the internal audit training or equivalent and they are responsible for monitoring all IMS Procedures and Operation Control Procedures. This ensures compliance with the Company’s IMS, customer expectations, regulatories and guidelines as specified in ISO 14001, OHSAS 18001, ISO 9001 and relevant SHE legal requirements.
All comments and concerns raised by employees are recorded by the respective Heads of Departments. They are directed to the Company’s IMS representative for discussion during Quarterly IMS meetings. The introduction of any new policies, procedures or IMS requirements are also discussed during this meeting. The IMS Management Review meeting, on 23 August 2011, recorded a 92% attendance rate.
To ensure the highest quality standards, we continue to conduct quality monitoring and assessment, with reference to various local and international recognised standards. The frequency of these monitoring sessions varies accordingly.
TYPE REFERENCE STANDARD FREQUENCY OF MONITORING BY WHOM REPORTING TO
KASB Legal Register
MS ISO 14001:2004, OHSAS 18001:2007 and MS 1722:Part 1:2005
Annually Area ownerIMS Management
Representative (MR)
EMP EQA 1974 Annually DOE
Noise Exposure Monitoring
FM (Noise Exposure) Regulations 1989 Annually Trained person DOSH
Audiometric Test FM (Noise Exposure) Regulations 1989
3 months / annually / bi-annually / every 5 years, depending on circumstances
Supervised by clinical practitioner DOSH
Chemical Health Risk Assessment
Every 5 years or when required
A registered CHRA Assessor DOSH
Chemical Exposure Monitoring
OSH (USECHH) Regulations 2000 and Code of Practice (COP) - Indoor Air Quality
DOSH
Local Exhaust Ventilation (LEV) System examination & testing
OSH (USECHH) Regulations 2000
Annually Appointed hygiene technician DOSH
Clinical Health Surveillance
OSH (USECHH) Regulations 2000
Appointed panel hospital DOSH
IMS Objective & Programme
MS ISO 9001:2008, ISO 14001:2004, OHSAS 18001:2007 and MS 1722:Part 1:2005
Every 6 months Heads of Departments
Management review
Workplace Inspection
MS ISO 14001:2004, OHSAS 18001:2007 and MS 1722:Part 1:2005
As scheduled twice a month or ad hoc
SHE AssistantSHCCOO/Senior Manager DOSH
OSH Use and Standards of Exposure of Chemicals Hazardous to Health (USECHH) Regulations 2000
Environmental Engineer
Upon recommendation based on CHRA report
Appointed hygiene technician
Annually - for production staffBiennially - for admin staff
SHC MeetingSHE Meeting
41UEM EnvironmentSustainability Report 2011|
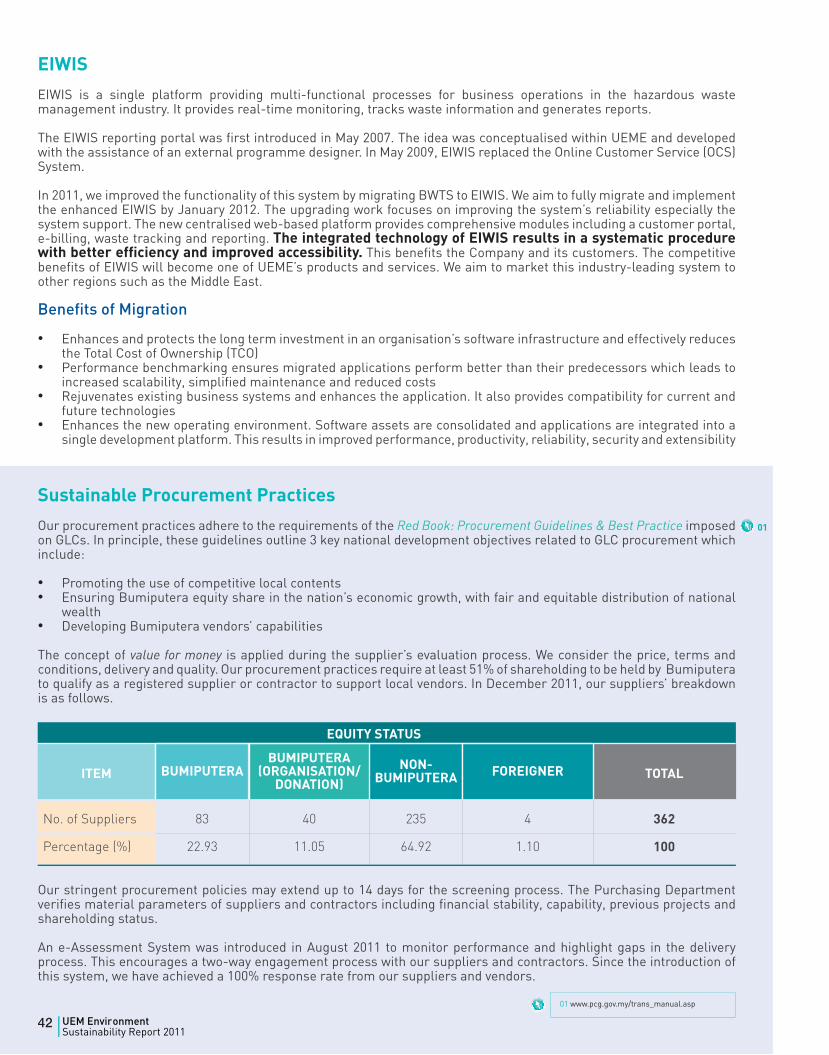
EIWIS
EIWIS is a single platform providing multi-functional processes for business operations in the hazardous waste management industry. It provides real-time monitoring, tracks waste information and generates reports. The EIWIS reporting portal was first introduced in May 2007. The idea was conceptualised within UEME and developed with the assistance of an external programme designer. In May 2009, EIWIS replaced the Online Customer Service (OCS) System.
In 2011, we improved the functionality of this system by migrating BWTS to EIWIS. We aim to fully migrate and implement the enhanced EIWIS by January 2012. The upgrading work focuses on improving the system’s reliability especially the system support. The new centralised web-based platform provides comprehensive modules including a customer portal, e-billing, waste tracking and reporting. The integrated technology of EIWIS results in a systematic procedure with better efficiency and improved accessibility. This benefits the Company and its customers. The competitive benefits of EIWIS will become one of UEME’s products and services. We aim to market this industry-leading system to other regions such as the Middle East.
Benefits of Migration
• Enhances and protects the long term investment in an organisation’s software infrastructure and effectively reduces the Total Cost of Ownership (TCO)
• Performance benchmarking ensures migrated applications perform better than their predecessors which leads to increased scalability, simplified maintenance and reduced costs
• Rejuvenates existing business systems and enhances the application. It also provides compatibility for current and future technologies
• Enhances the new operating environment. Software assets are consolidated and applications are integrated into a single development platform. This results in improved performance, productivity, reliability, security and extensibility
Sustainable Procurement Practices
Our procurement practices adhere to the requirements of the Red Book: Procurement Guidelines & Best Practice imposed on GLCs. In principle, these guidelines outline 3 key national development objectives related to GLC procurement which include:
• Promoting the use of competitive local contents• Ensuring Bumiputera equity share in the nation’s economic growth, with fair and equitable distribution of national
wealth• Developing Bumiputera vendors’ capabilities
The concept of value for money is applied during the supplier’s evaluation process. We consider the price, terms and conditions, delivery and quality. Our procurement practices require at least 51% of shareholding to be held by Bumiputera to qualify as a registered supplier or contractor to support local vendors. In December 2011, our suppliers’ breakdown is as follows.
ITEM
EQUITY STATUS
TOTALBUMIPUTERABUMIPUTERA
(ORGANISATION/DONATION)
NON-BUMIPUTERA FOREIGNER
No. of Suppliers 83 40 235 4 362
Percentage (%) 22.93 11.05 64.92 1.10 100
Our stringent procurement policies may extend up to 14 days for the screening process. The Purchasing Department verifies material parameters of suppliers and contractors including financial stability, capability, previous projects and shareholding status.
An e-Assessment System was introduced in August 2011 to monitor performance and highlight gaps in the delivery process. This encourages a two-way engagement process with our suppliers and contractors. Since the introduction of this system, we have achieved a 100% response rate from our suppliers and vendors.
01 www.pcg.gov.my/trans_manual.asp
01
42 UEM EnvironmentSustainability Report 2011|
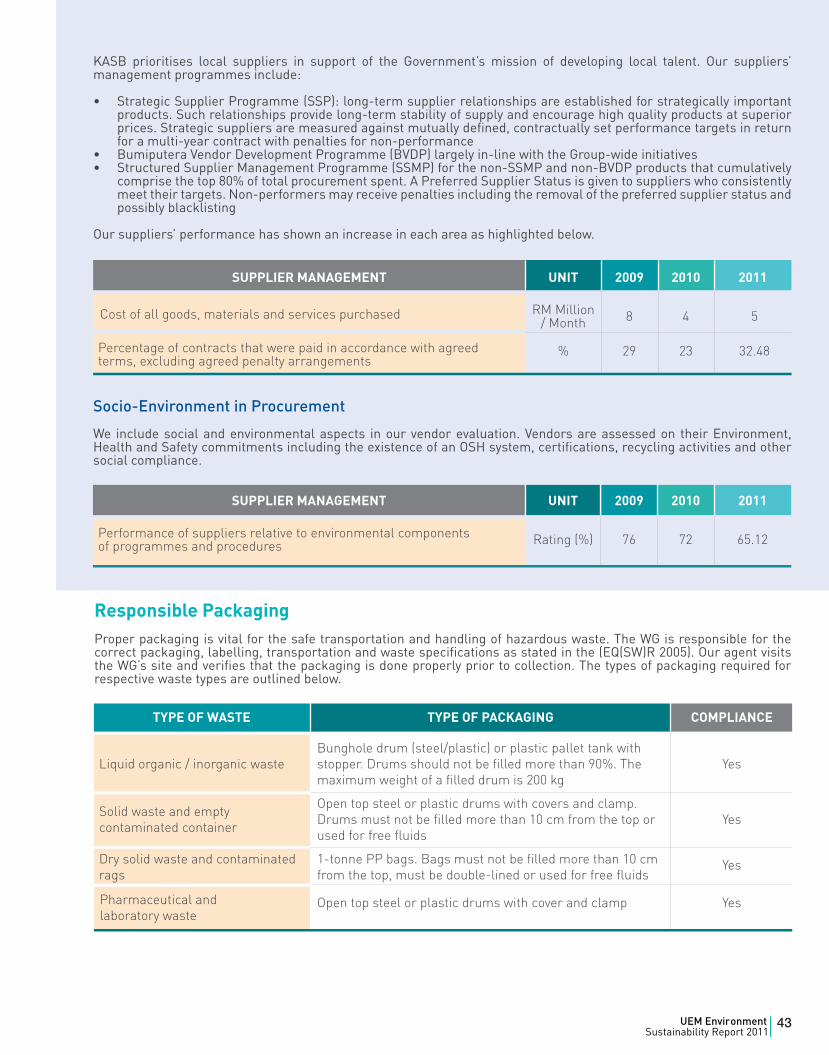
Percentage of contracts that were paid in accordance with agreed terms, excluding agreed penalty arrangements
SUPPLIER MANAGEMENT UNIT 2009 2010 2011
RM Million / Month 8 4 5
% 29 23 32.48
KASB prioritises local suppliers in support of the Government’s mission of developing local talent. Our suppliers’ management programmes include:
• Strategic Supplier Programme (SSP): long-term supplier relationships are established for strategically important products. Such relationships provide long-term stability of supply and encourage high quality products at superior prices. Strategic suppliers are measured against mutually defined, contractually set performance targets in return for a multi-year contract with penalties for non-performance
• Bumiputera Vendor Development Programme (BVDP) largely in-line with the Group-wide initiatives• Structured Supplier Management Programme (SSMP) for the non-SSMP and non-BVDP products that cumulatively
comprise the top 80% of total procurement spent. A Preferred Supplier Status is given to suppliers who consistently meet their targets. Non-performers may receive penalties including the removal of the preferred supplier status and possibly blacklisting
Our suppliers’ performance has shown an increase in each area as highlighted below.
Socio-Environment in Procurement
We include social and environmental aspects in our vendor evaluation. Vendors are assessed on their Environment, Health and Safety commitments including the existence of an OSH system, certifications, recycling activities and other social compliance.
01 www.pcg.gov.my/trans_manual.asp
TYPE OF WASTE TYPE OF PACKAGING COMPLIANCE
Liquid organic / inorganic wasteBunghole drum (steel/plastic) or plastic pallet tank with stopper. Drums should not be filled more than 90%. The maximum weight of a filled drum is 200 kg
Yes
Solid waste and empty contaminated container
Open top steel or plastic drums with covers and clamp. Drums must not be filled more than 10 cm from the top or used for free fluids
Yes
Dry solid waste and contaminated rags
1-tonne PP bags. Bags must not be filled more than 10 cm from the top, must be double-lined or used for free fluids
Yes
Open top steel or plastic drums with cover and clamp YesPharmaceutical and laboratory waste
SUPPLIER MANAGEMENT UNIT 2009 2010 2011
Performance of suppliers relative to environmental components of programmes and procedures Rating (%) 76 72 65.12
Cost of all goods, materials and services purchased
Responsible PackagingProper packaging is vital for the safe transportation and handling of hazardous waste. The WG is responsible for the correct packaging, labelling, transportation and waste specifications as stated in the (EQ(SW)R 2005). Our agent visits the WG’s site and verifies that the packaging is done properly prior to collection. The types of packaging required for respective waste types are outlined below.
43UEM EnvironmentSustainability Report 2011|
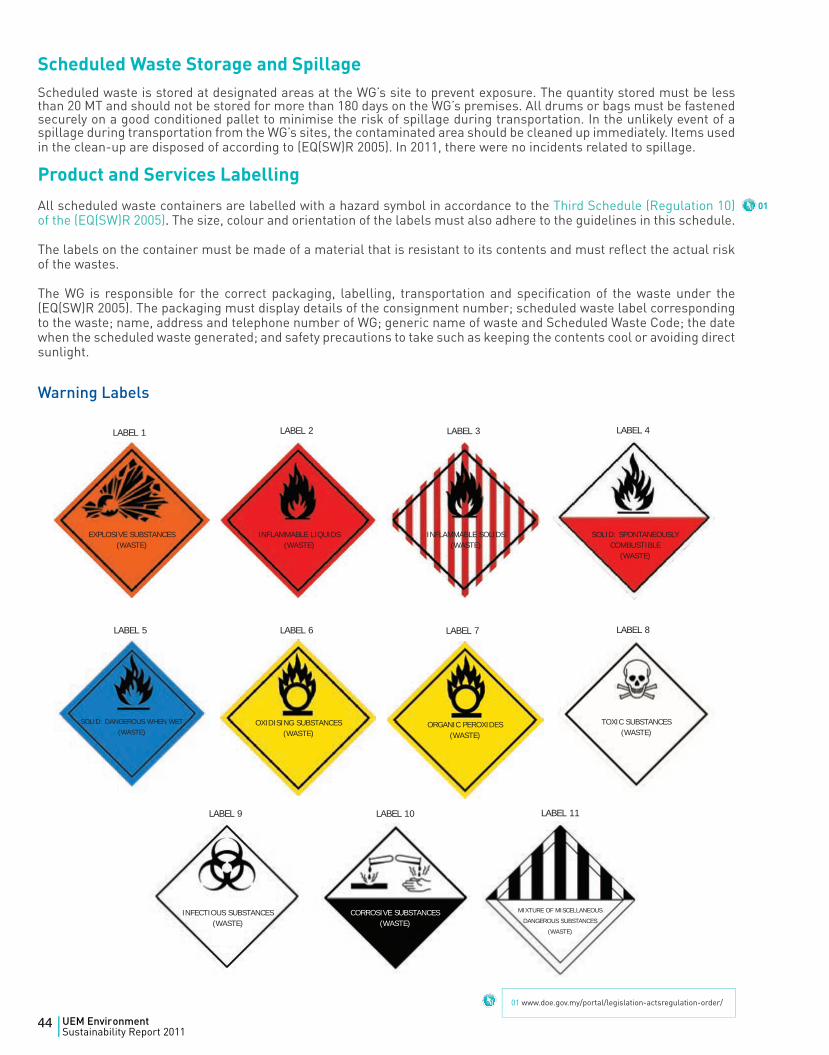
Warning Labels
Scheduled Waste Storage and Spillage Scheduled waste is stored at designated areas at the WG’s site to prevent exposure. The quantity stored must be less than 20 MT and should not be stored for more than 180 days on the WG’s premises. All drums or bags must be fastened securely on a good conditioned pallet to minimise the risk of spillage during transportation. In the unlikely event of a spillage during transportation from the WG’s sites, the contaminated area should be cleaned up immediately. Items used in the clean-up are disposed of according to (EQ(SW)R 2005). In 2011, there were no incidents related to spillage.
Product and Services Labelling
All scheduled waste containers are labelled with a hazard symbol in accordance to the Third Schedule (Regulation 10) of the (EQ(SW)R 2005). The size, colour and orientation of the labels must also adhere to the guidelines in this schedule.
The labels on the container must be made of a material that is resistant to its contents and must reflect the actual risk of the wastes.
The WG is responsible for the correct packaging, labelling, transportation and specification of the waste under the (EQ(SW)R 2005). The packaging must display details of the consignment number; scheduled waste label corresponding to the waste; name, address and telephone number of WG; generic name of waste and Scheduled Waste Code; the date when the scheduled waste generated; and safety precautions to take such as keeping the contents cool or avoiding direct sunlight.
01 www.doe.gov.my/portal/legislation-actsregulation-order/
01
LABEL 1
LABEL 5
LABEL 9
LABEL 2
LABEL 6
LABEL 10
LABEL 3
LABEL 7
LABEL 11
LABEL 4
LABEL 8
EXPLOSIVE SUBSTANCES(WASTE)
SOLID: DANGEROUS WHEN WET(WASTE)
INFECTIOUS SUBSTANCES(WASTE)
TOXIC SUBSTANCES(WASTE)
INFLAMMABLE SOLIDS(WASTE)
INFLAMMABLE LIQUIDS(WASTE)
SOLID: SPONTANEOUSLYCOMBUSTIBLE
(WASTE)
OXIDISING SUBSTANCES (WASTE)
ORGANIC PEROXIDES(WASTE)
CORROSIVE SUBSTANCES(WASTE)
MIXTURE OF MISCELLANEOUS
DANGEROUS SUBSTANCES
(WASTE)
44 UEM EnvironmentSustainability Report 2011|
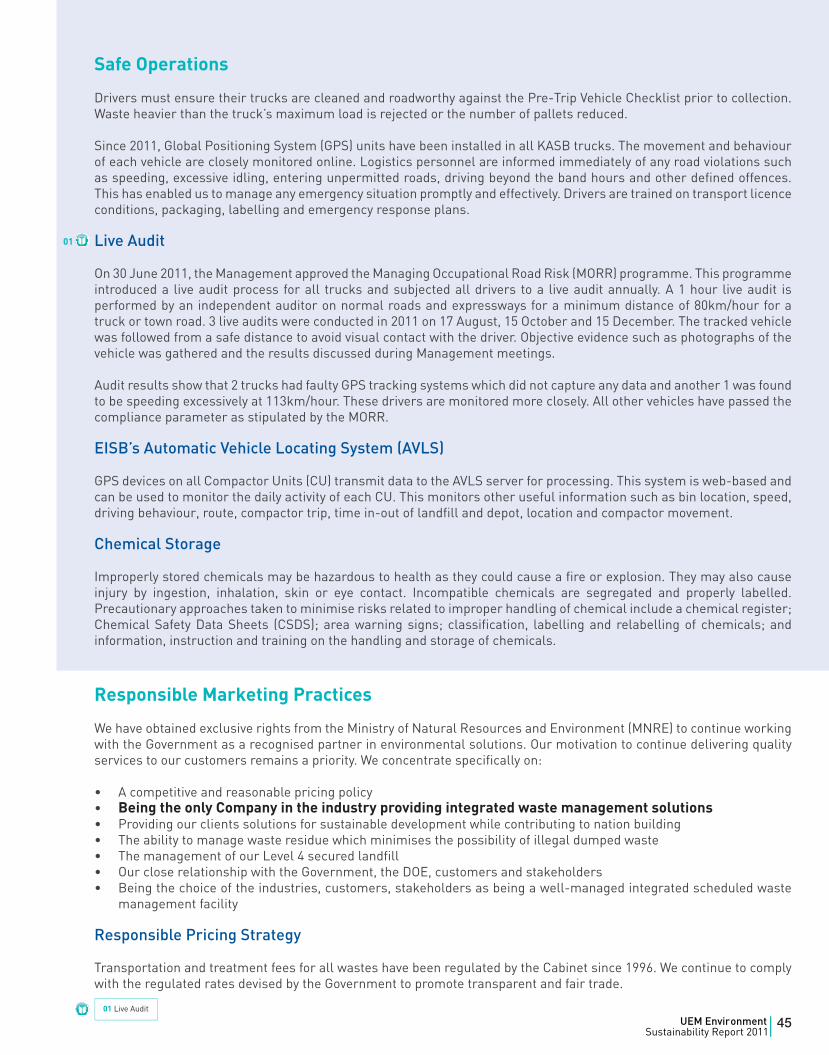
Safe Operations
Drivers must ensure their trucks are cleaned and roadworthy against the Pre-Trip Vehicle Checklist prior to collection. Waste heavier than the truck’s maximum load is rejected or the number of pallets reduced.
Since 2011, Global Positioning System (GPS) units have been installed in all KASB trucks. The movement and behaviour of each vehicle are closely monitored online. Logistics personnel are informed immediately of any road violations such as speeding, excessive idling, entering unpermitted roads, driving beyond the band hours and other defined offences. This has enabled us to manage any emergency situation promptly and effectively. Drivers are trained on transport licence conditions, packaging, labelling and emergency response plans.
Live Audit
On 30 June 2011, the Management approved the Managing Occupational Road Risk (MORR) programme. This programme introduced a live audit process for all trucks and subjected all drivers to a live audit annually. A 1 hour live audit is performed by an independent auditor on normal roads and expressways for a minimum distance of 80km/hour for a truck or town road. 3 live audits were conducted in 2011 on 17 August, 15 October and 15 December. The tracked vehicle was followed from a safe distance to avoid visual contact with the driver. Objective evidence such as photographs of the vehicle was gathered and the results discussed during Management meetings.
Audit results show that 2 trucks had faulty GPS tracking systems which did not capture any data and another 1 was found to be speeding excessively at 113km/hour. These drivers are monitored more closely. All other vehicles have passed the compliance parameter as stipulated by the MORR.
EISB’s Automatic Vehicle Locating System (AVLS)
GPS devices on all Compactor Units (CU) transmit data to the AVLS server for processing. This system is web-based and can be used to monitor the daily activity of each CU. This monitors other useful information such as bin location, speed, driving behaviour, route, compactor trip, time in-out of landfill and depot, location and compactor movement.
Chemical Storage
Improperly stored chemicals may be hazardous to health as they could cause a fire or explosion. They may also cause injury by ingestion, inhalation, skin or eye contact. Incompatible chemicals are segregated and properly labelled. Precautionary approaches taken to minimise risks related to improper handling of chemical include a chemical register; Chemical Safety Data Sheets (CSDS); area warning signs; classification, labelling and relabelling of chemicals; and information, instruction and training on the handling and storage of chemicals.
Responsible Marketing Practices
We have obtained exclusive rights from the Ministry of Natural Resources and Environment (MNRE) to continue working with the Government as a recognised partner in environmental solutions. Our motivation to continue delivering quality services to our customers remains a priority. We concentrate specifically on:
• A competitive and reasonable pricing policy • Being the only Company in the industry providing integrated waste management solutions• Providing our clients solutions for sustainable development while contributing to nation building • The ability to manage waste residue which minimises the possibility of illegal dumped waste • The management of our Level 4 secured landfill• Our close relationship with the Government, the DOE, customers and stakeholders • Being the choice of the industries, customers, stakeholders as being a well-managed integrated scheduled waste
management facility
Responsible Pricing Strategy
Transportation and treatment fees for all wastes have been regulated by the Cabinet since 1996. We continue to comply with the regulated rates devised by the Government to promote transparent and fair trade.
01 Live Audit
01
45UEM EnvironmentSustainability Report 2011|
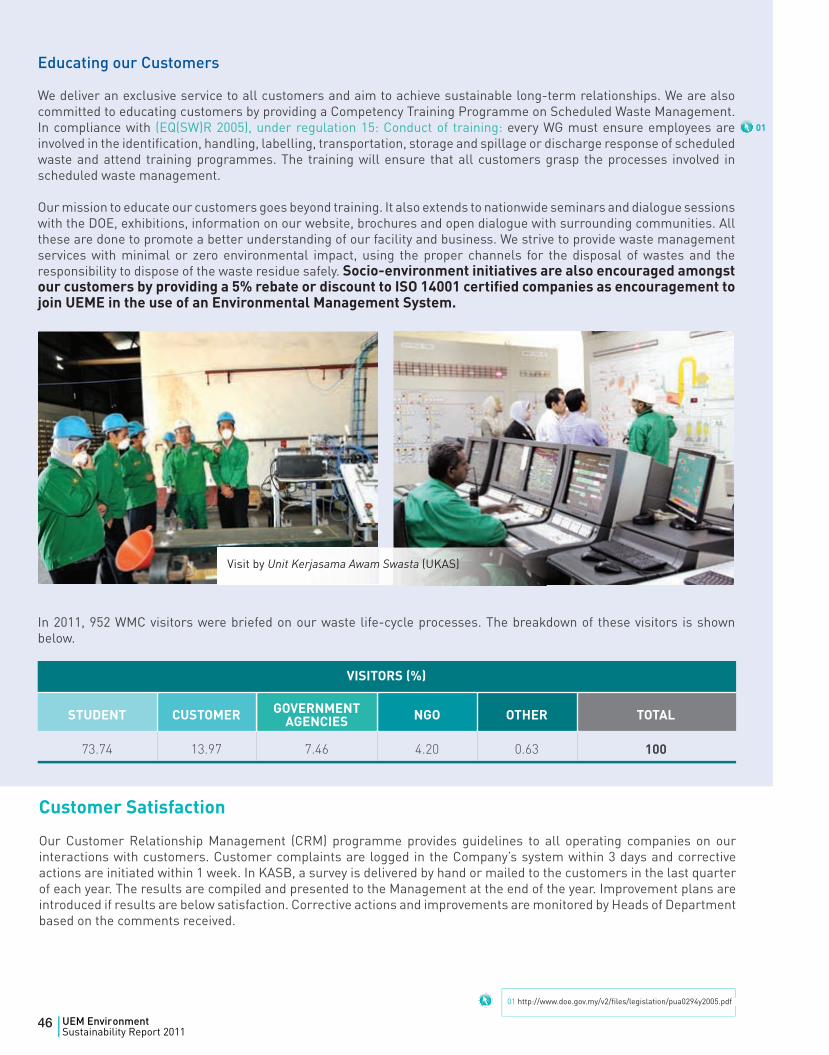
Educating our Customers
We deliver an exclusive service to all customers and aim to achieve sustainable long-term relationships. We are also committed to educating customers by providing a Competency Training Programme on Scheduled Waste Management. In compliance with (EQ(SW)R 2005), under regulation 15: Conduct of training: every WG must ensure employees are involved in the identification, handling, labelling, transportation, storage and spillage or discharge response of scheduled waste and attend training programmes. The training will ensure that all customers grasp the processes involved in scheduled waste management.
Our mission to educate our customers goes beyond training. It also extends to nationwide seminars and dialogue sessions with the DOE, exhibitions, information on our website, brochures and open dialogue with surrounding communities. All these are done to promote a better understanding of our facility and business. We strive to provide waste management services with minimal or zero environmental impact, using the proper channels for the disposal of wastes and the responsibility to dispose of the waste residue safely. Socio-environment initiatives are also encouraged amongst our customers by providing a 5% rebate or discount to ISO 14001 certified companies as encouragement to join UEME in the use of an Environmental Management System.
In 2011, 952 WMC visitors were briefed on our waste life-cycle processes. The breakdown of these visitors is shown below.
VISITORS (%)
STUDENT CUSTOMER GOVERNMENT AGENCIES NGO OTHER TOTAL
73.74 13.97 7.46 4.20 0.63 100
01 http://www.doe.gov.my/v2/files/legislation/pua0294y2005.pdf
01
http://www.doe.gov.my/v2/files/legislation/pua0294y2005.pdf
Visit by Unit Kerjasama Awam Swasta (UKAS)
Customer Satisfaction
Our Customer Relationship Management (CRM) programme provides guidelines to all operating companies on our interactions with customers. Customer complaints are logged in the Company’s system within 3 days and corrective actions are initiated within 1 week. In KASB, a survey is delivered by hand or mailed to the customers in the last quarter of each year. The results are compiled and presented to the Management at the end of the year. Improvement plans are introduced if results are below satisfaction. Corrective actions and improvements are monitored by Heads of Department based on the comments received.
46 UEM EnvironmentSustainability Report 2011|
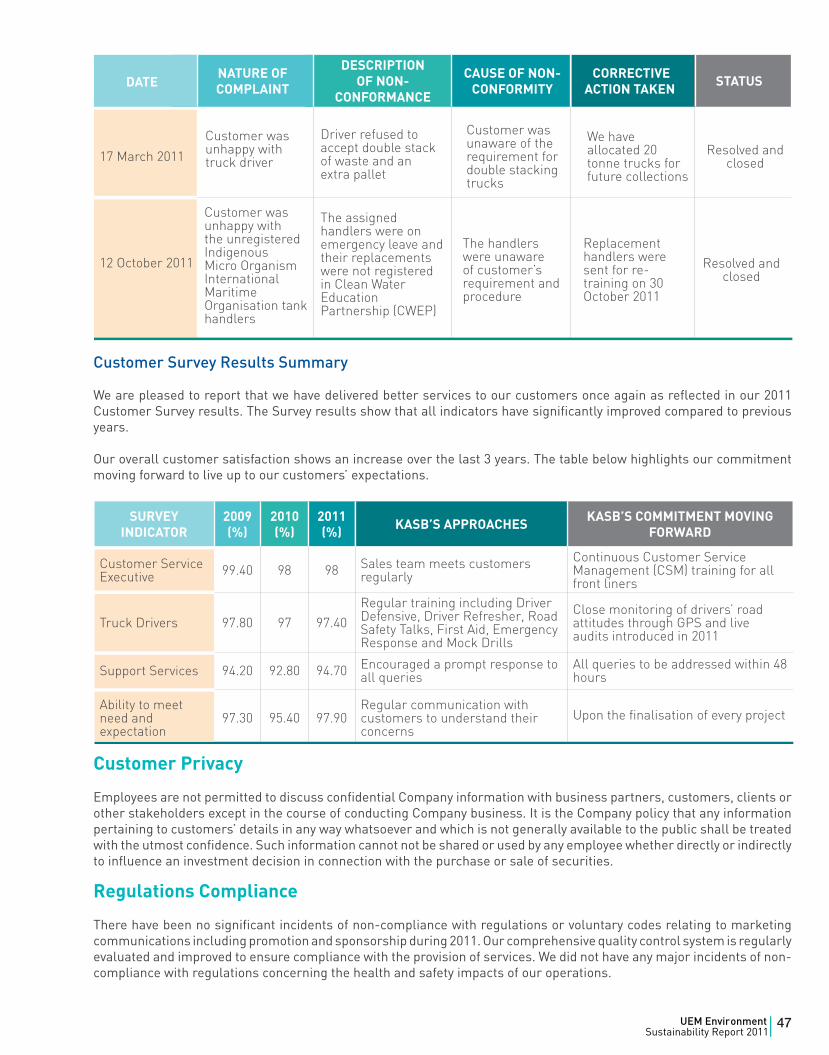
SURVEY INDICATOR
2009(%)
2010(%)
2011(%) KASB’S APPROACHES KASB’S COMMITMENT MOVING
FORWARD
Customer Service Executive 99.40 98 98 Sales team meets customers
regularlyContinuous Customer Service Management (CSM) training for all front liners
Truck Drivers 97.80 97 97.40Regular training including Driver Defensive, Driver Refresher, Road Safety Talks, First Aid, Emergency Response and Mock Drills
Close monitoring of drivers’ road attitudes through GPS and live audits introduced in 2011
Support Services 94.20 92.80 94.70 Encouraged a prompt response to all queries
All queries to be addressed within 48 hours
Ability to meet need and expectation
97.30 95.40 97.90Regular communication with customers to understand their concerns
Upon the finalisation of every project
17 March 2011
Customer was unaware of the requirement for double stacking trucks
We have allocated 20 tonne trucks for future collections
Resolved andclosed
Customer Survey Results Summary
We are pleased to report that we have delivered better services to our customers once again as reflected in our 2011 Customer Survey results. The Survey results show that all indicators have significantly improved compared to previous years.
Our overall customer satisfaction shows an increase over the last 3 years. The table below highlights our commitment moving forward to live up to our customers’ expectations.
Customer Privacy
Employees are not permitted to discuss confidential Company information with business partners, customers, clients or other stakeholders except in the course of conducting Company business. It is the Company policy that any information pertaining to customers’ details in any way whatsoever and which is not generally available to the public shall be treated with the utmost confidence. Such information cannot not be shared or used by any employee whether directly or indirectly to influence an investment decision in connection with the purchase or sale of securities.
Regulations Compliance
There have been no significant incidents of non-compliance with regulations or voluntary codes relating to marketing communications including promotion and sponsorship during 2011. Our comprehensive quality control system is regularly evaluated and improved to ensure compliance with the provision of services. We did not have any major incidents of non-compliance with regulations concerning the health and safety impacts of our operations.
The assigned handlers were on emergency leave and their replacements were not registered in Clean Water Education Partnership (CWEP)
Customer was unhappy with the unregistered Indigenous Micro Organism International Maritime Organisation tank handlers
Driver refused to accept double stack of waste and an extra pallet
Customer was unhappy with truck driver
NATURE OF COMPLAINT
DESCRIPTION OF NON-
CONFORMANCE
CAUSE OF NON-CONFORMITY
CORRECTIVE ACTION TAKEN STATUSDATE
The handlers were unaware of customer’s requirement and procedure
Replacement handlers were sent for re-training on 30 October 2011
Resolved andclosed
12 October 2011
47UEM EnvironmentSustainability Report 2011|
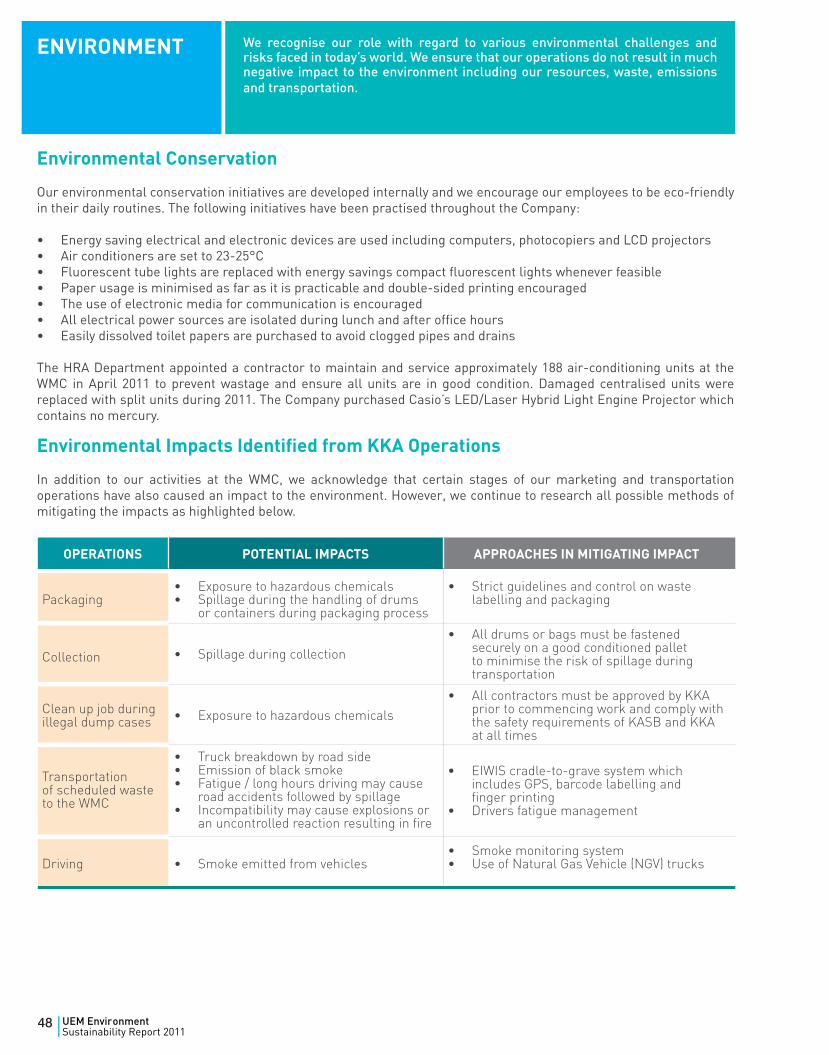
ENVIRONMENT
Environmental Conservation
Our environmental conservation initiatives are developed internally and we encourage our employees to be eco-friendly in their daily routines. The following initiatives have been practised throughout the Company:
• Energy saving electrical and electronic devices are used including computers, photocopiers and LCD projectors• Air conditioners are set to 23-25°C• Fluorescent tube lights are replaced with energy savings compact fluorescent lights whenever feasible• Paper usage is minimised as far as it is practicable and double-sided printing encouraged• The use of electronic media for communication is encouraged• All electrical power sources are isolated during lunch and after office hours• Easily dissolved toilet papers are purchased to avoid clogged pipes and drains
The HRA Department appointed a contractor to maintain and service approximately 188 air-conditioning units at the WMC in April 2011 to prevent wastage and ensure all units are in good condition. Damaged centralised units were replaced with split units during 2011. The Company purchased Casio’s LED/Laser Hybrid Light Engine Projector which contains no mercury.
Environmental Impacts Identified from KKA Operations
In addition to our activities at the WMC, we acknowledge that certain stages of our marketing and transportation operations have also caused an impact to the environment. However, we continue to research all possible methods of mitigating the impacts as highlighted below.
OPERATIONS POTENTIAL IMPACTS APPROACHES IN MITIGATING IMPACT
Packaging• Exposure to hazardous chemicals• Spillage during the handling of drums
or containers during packaging process
• Strict guidelines and control on waste labelling and packaging
Collection • Spillage during collection• All drums or bags must be fastened
securely on a good conditioned pallet to minimise the risk of spillage during transportation
Clean up job during illegal dump cases • Exposure to hazardous chemicals
• All contractors must be approved by KKA prior to commencing work and comply with the safety requirements of KASB and KKA at all times
Transportation of scheduled waste to the WMC
• Truck breakdown by road side• Emission of black smoke• Fatigue / long hours driving may cause
road accidents followed by spillage• Incompatibility may cause explosions or
an uncontrolled reaction resulting in fire
Driving • Smoke emitted from vehicles• Smoke monitoring system• Use of Natural Gas Vehicle (NGV) trucks
We recognise our role with regard to various environmental challenges and risks faced in today’s world. We ensure that our operations do not result in much negative impact to the environment including our resources, waste, emissions and transportation.
• EIWIS cradle-to-grave system which includes GPS, barcode labelling and finger printing
• Drivers fatigue management
48 UEM EnvironmentSustainability Report 2011|
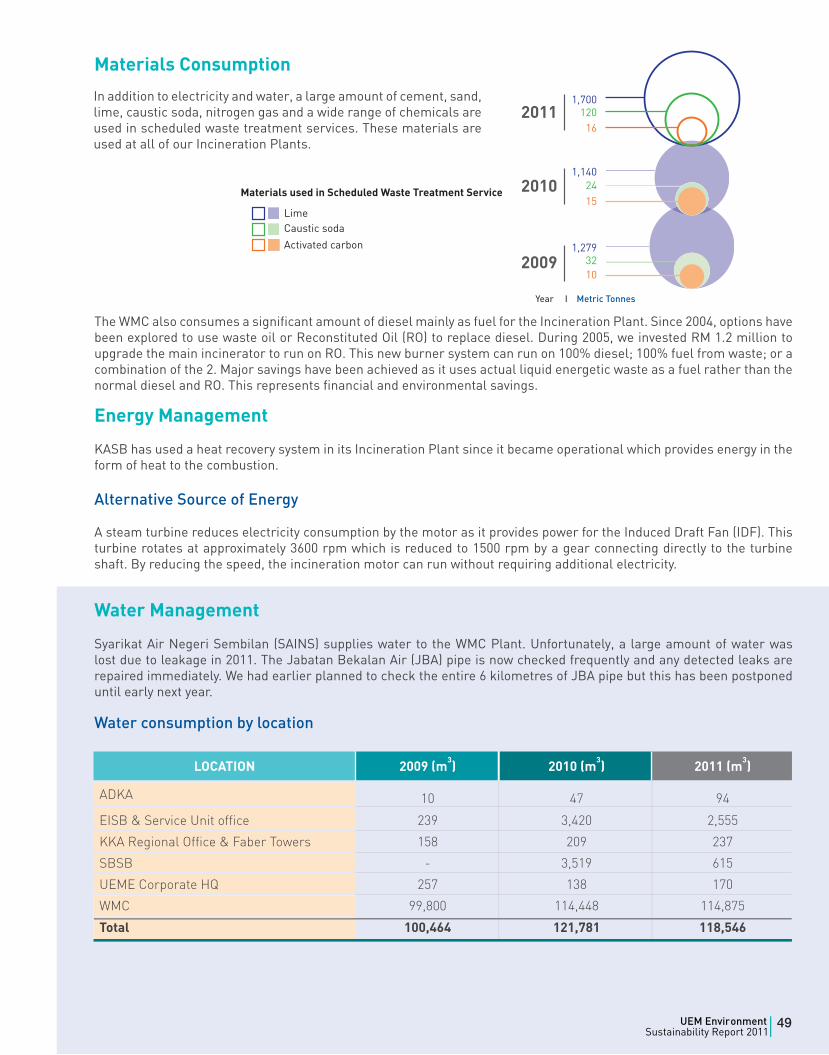
Materials Consumption
The WMC also consumes a significant amount of diesel mainly as fuel for the Incineration Plant. Since 2004, options have been explored to use waste oil or Reconstituted Oil (RO) to replace diesel. During 2005, we invested RM 1.2 million to upgrade the main incinerator to run on RO. This new burner system can run on 100% diesel; 100% fuel from waste; or a combination of the 2. Major savings have been achieved as it uses actual liquid energetic waste as a fuel rather than the normal diesel and RO. This represents financial and environmental savings.
Energy Management
KASB has used a heat recovery system in its Incineration Plant since it became operational which provides energy in the form of heat to the combustion.
Alternative Source of Energy
A steam turbine reduces electricity consumption by the motor as it provides power for the Induced Draft Fan (IDF). This turbine rotates at approximately 3600 rpm which is reduced to 1500 rpm by a gear connecting directly to the turbine shaft. By reducing the speed, the incineration motor can run without requiring additional electricity.
Water Management
Syarikat Air Negeri Sembilan (SAINS) supplies water to the WMC Plant. Unfortunately, a large amount of water was lost due to leakage in 2011. The Jabatan Bekalan Air (JBA) pipe is now checked frequently and any detected leaks are repaired immediately. We had earlier planned to check the entire 6 kilometres of JBA pipe but this has been postponed until early next year.
Water consumption by location
Year I Metric Tonnes
In addition to electricity and water, a large amount of cement, sand, lime, caustic soda, nitrogen gas and a wide range of chemicals are used in scheduled waste treatment services. These materials are used at all of our Incineration Plants.
LOCATION 2009 (m3) 2010 (m
3) 2011 (m
3)
10 47 94
EISB & Service Unit office 239 3,420 2,555
KKA Regional Office & Faber Towers 158 209 237
SBSB - 3,519 615
UEME Corporate HQ 257 138 170
WMC 99,800 114,448 114,875
Total 100,464 121,781 118,546
ADKA
49UEM EnvironmentSustainability Report 2011|
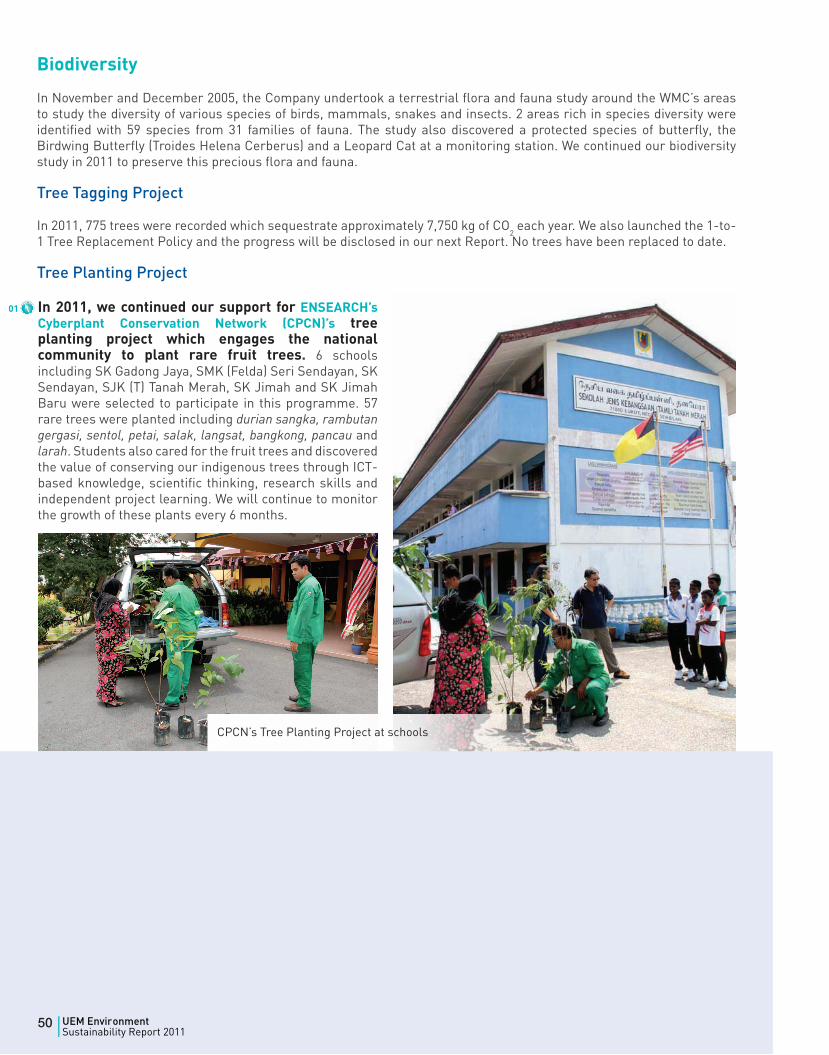
Biodiversity
In November and December 2005, the Company undertook a terrestrial flora and fauna study around the WMC’s areas to study the diversity of various species of birds, mammals, snakes and insects. 2 areas rich in species diversity were identified with 59 species from 31 families of fauna. The study also discovered a protected species of butterfly, the Birdwing Butterfly (Troides Helena Cerberus) and a Leopard Cat at a monitoring station. We continued our biodiversity study in 2011 to preserve this precious flora and fauna.
Tree Tagging Project
In 2011, 775 trees were recorded which sequestrate approximately 7,750 kg of CO2 each year. We also launched the 1-to-
1 Tree Replacement Policy and the progress will be disclosed in our next Report. No trees have been replaced to date.
Tree Planting Project
Emissions and Effluents
We are a moderately energy intensive Company committed to managing our Greenhouse Gas (GHG) emissions effectively. Energy-efficient and alternative-energy programmes have been implemented voluntarily regardless of the cost. The total GHG emissions of CO
2 equivalent have increased since 1999 due to business expansion.
Air Quality
A number of stations have been located to monitor ambient air quality and emissions from the incineration, solidification, physical-chemical plants, containerised mini incinerators and the ambient air. Each station monitors total suspended particulates, Volatile Organic Compounds (VOCs), Carbon Monoxide (CO), Nitrogen Oxides (NOx), Sulphur Oxides (SOx) and a number of other parameters. The stack monitoring stations recorded a number of hazardous gaseous substances that may result from the incineration of processed scheduled waste including dioxin and furans.
01 http://ensearch.org/projects/cyberplant-conservation-network-cpcn/
01
CPCN’s Tree Planting Project at schools
In 2011, we continued our support for ENSEARCH’s Cyberplant Conservation Network (CPCN)’s tree planting project which engages the national community to plant rare fruit trees. 6 schools including SK Gadong Jaya, SMK (Felda) Seri Sendayan, SK Sendayan, SJK (T) Tanah Merah, SK Jimah and SK Jimah Baru were selected to participate in this programme. 57 rare trees were planted including durian sangka, rambutan gergasi, sentol, petai, salak, langsat, bangkong, pancau and larah. Students also cared for the fruit trees and discovered the value of conserving our indigenous trees through ICT-based knowledge, scientific thinking, research skills and independent project learning. We will continue to monitor the growth of these plants every 6 months.
50 UEM EnvironmentSustainability Report 2011|
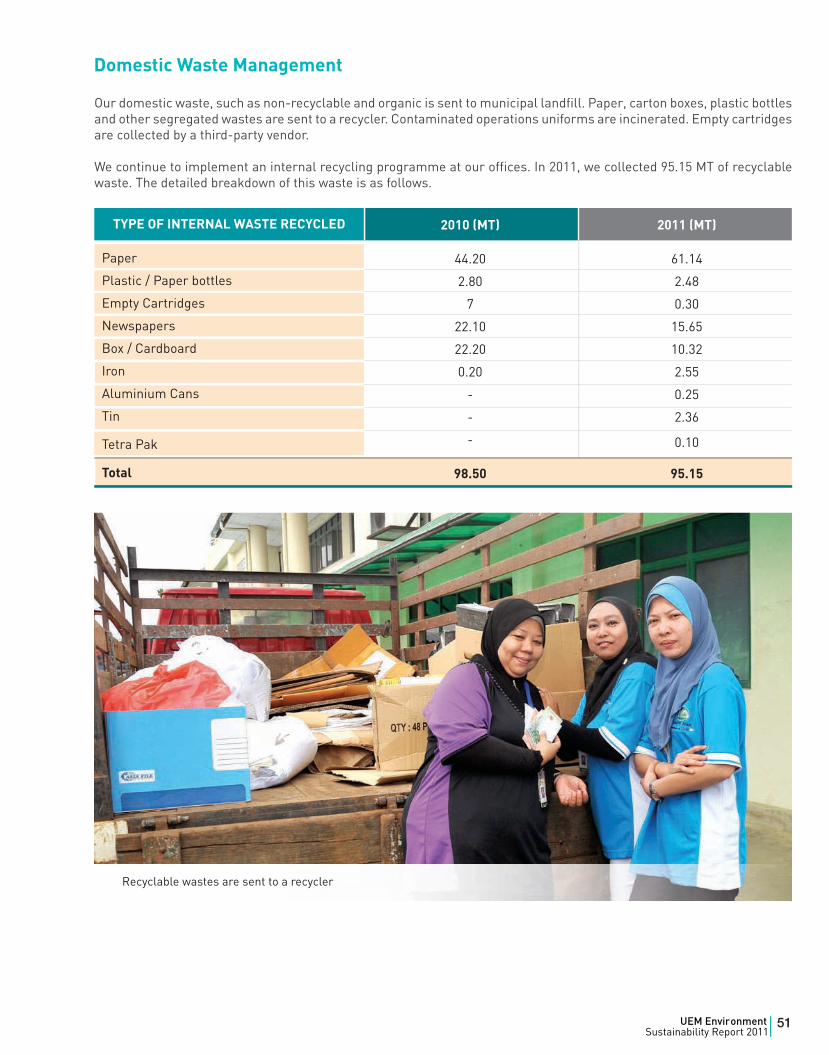
Domestic Waste Management
Our domestic waste, such as non-recyclable and organic is sent to municipal landfill. Paper, carton boxes, plastic bottles and other segregated wastes are sent to a recycler. Contaminated operations uniforms are incinerated. Empty cartridges are collected by a third-party vendor.
We continue to implement an internal recycling programme at our offices. In 2011, we collected 95.15 MT of recyclable waste. The detailed breakdown of this waste is as follows.
2010 (MT)
44.20
2.80
7
22.10
22.20
0.20
-
-
-
98.50
2011 (MT)
61.14
2.48
0.30
15.65
10.32
2.55
0.25
2.36
95.15
0.10
TYPE OF INTERNAL WASTE RECYCLED
Paper
Plastic / Paper bottles
Empty Cartridges
Newspapers
Box / Cardboard
Iron
Aluminium Cans
Tin
Total
Tetra Pak
Recyclable wastes are sent to a recycler
51UEM EnvironmentSustainability Report 2011|
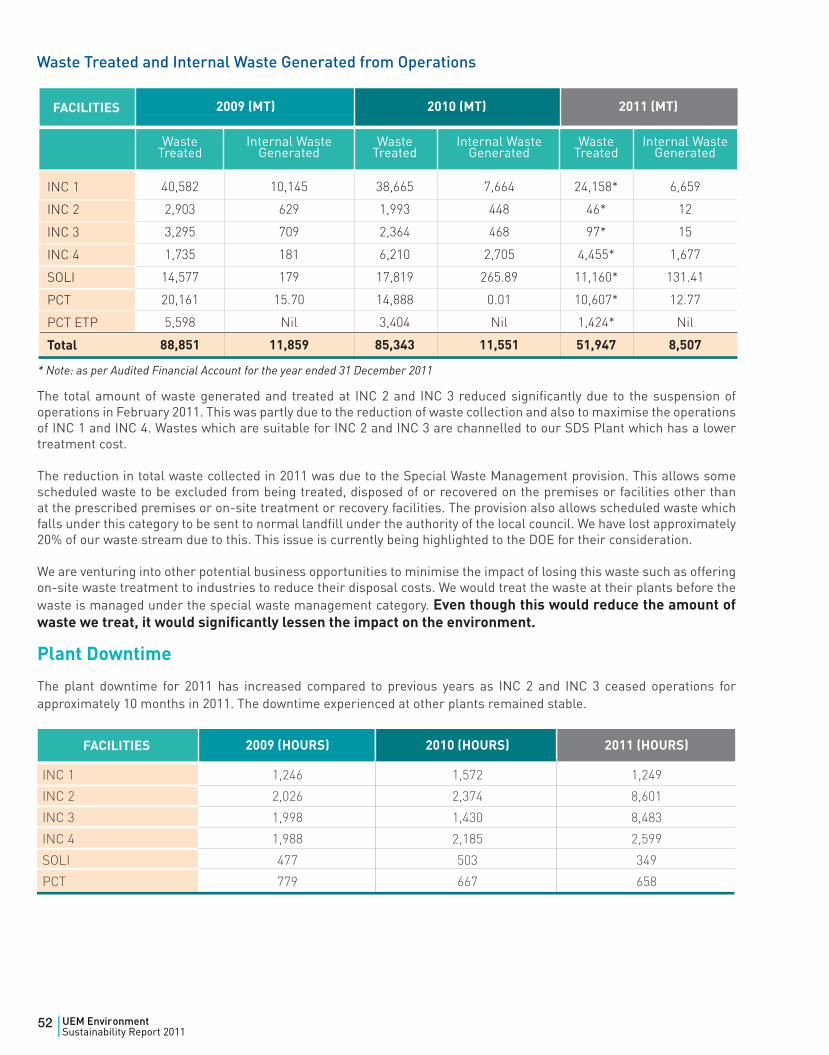
Waste Treated and Internal Waste Generated from Operations
* Note: as per Audited Financial Account for the year ended 31 December 2011
2009 (HOURS) 2010 (HOURS) 2011 (HOURS)
INC 1 1,246 1,572 1,249
INC 2 2,026 2,374 8,601
INC 3 1,998 1,430 8,483
INC 4 1,988 2,185 2,599
SOLI 477 503 349
PCT 779 667 658
The total amount of waste generated and treated at INC 2 and INC 3 reduced significantly due to the suspension of operations in February 2011. This was partly due to the reduction of waste collection and also to maximise the operations of INC 1 and INC 4. Wastes which are suitable for INC 2 and INC 3 are channelled to our SDS Plant which has a lower treatment cost.
The reduction in total waste collected in 2011 was due to the Special Waste Management provision. This allows some scheduled waste to be excluded from being treated, disposed of or recovered on the premises or facilities other than at the prescribed premises or on-site treatment or recovery facilities. The provision also allows scheduled waste which falls under this category to be sent to normal landfill under the authority of the local council. We have lost approximately 20% of our waste stream due to this. This issue is currently being highlighted to the DOE for their consideration.
We are venturing into other potential business opportunities to minimise the impact of losing this waste such as offering on-site waste treatment to industries to reduce their disposal costs. We would treat the waste at their plants before the waste is managed under the special waste management category. Even though this would reduce the amount of waste we treat, it would significantly lessen the impact on the environment.
Plant Downtime
The plant downtime for 2011 has increased compared to previous years as INC 2 and INC 3 ceased operations for approximately 10 months in 2011. The downtime experienced at other plants remained stable.
Internal Waste Generated
6,659
12
15
1,677
131.41
12.77
Nil
8,507
WasteTreated
24,158*
46*
97*
4,455*
11,160*
10,607*
1,424*
51,947
Internal Waste Generated
7,664
448
468
2,705
265.89
0.01
Nil
11,551
WasteTreated
38,665
1,993
2,364
6,210
17,819
14,888
3,404
85,343
Internal Waste Generated
10,145
629
709
181
179
15.70
Nil
11,859
INC 1
INC 2
INC 3
INC 4
SOLI
PCT
PCT ETP
Total
2009 (MT) 2010 (MT) 2011 (MT)
WasteTreated
40,582
2,903
3,295
1,735
14,577
20,161
5,598
88,851
FACILITIES
FACILITIES
52 UEM EnvironmentSustainability Report 2011|
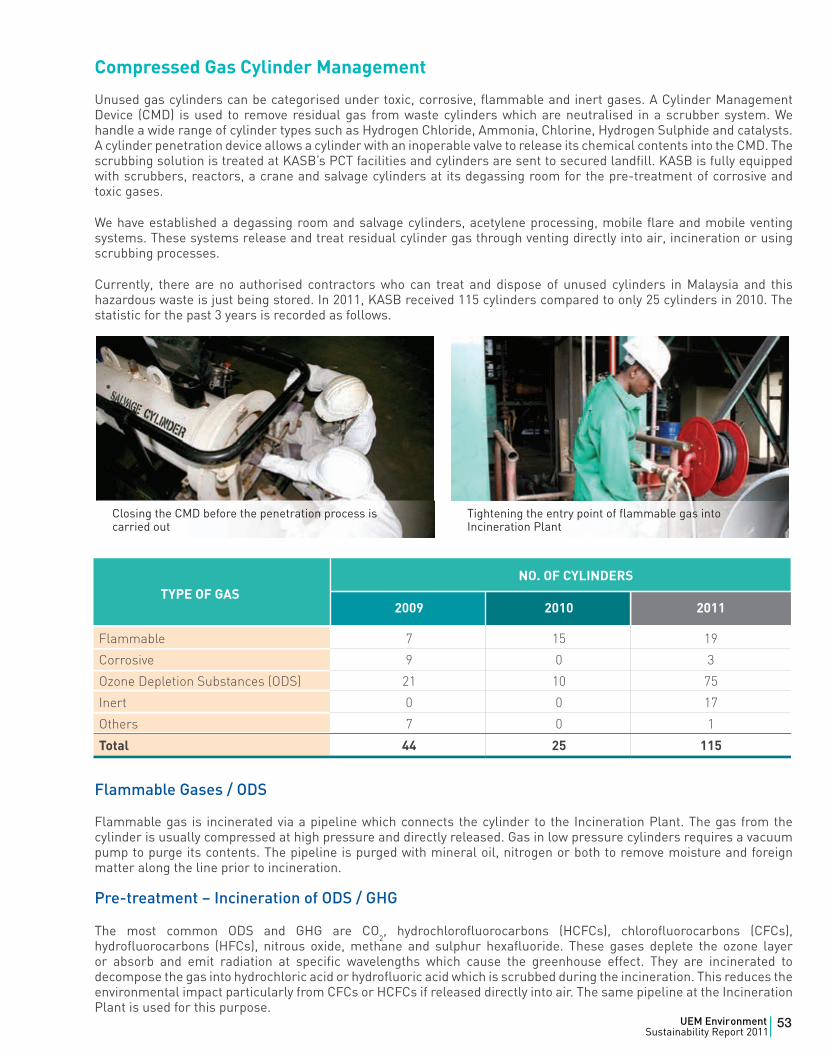
Compressed Gas Cylinder Management
Unused gas cylinders can be categorised under toxic, corrosive, flammable and inert gases. A Cylinder Management Device (CMD) is used to remove residual gas from waste cylinders which are neutralised in a scrubber system. We handle a wide range of cylinder types such as Hydrogen Chloride, Ammonia, Chlorine, Hydrogen Sulphide and catalysts. A cylinder penetration device allows a cylinder with an inoperable valve to release its chemical contents into the CMD. The scrubbing solution is treated at KASB’s PCT facilities and cylinders are sent to secured landfill. KASB is fully equipped with scrubbers, reactors, a crane and salvage cylinders at its degassing room for the pre-treatment of corrosive and toxic gases.
We have established a degassing room and salvage cylinders, acetylene processing, mobile flare and mobile venting systems. These systems release and treat residual cylinder gas through venting directly into air, incineration or using scrubbing processes.
Currently, there are no authorised contractors who can treat and dispose of unused cylinders in Malaysia and this hazardous waste is just being stored. In 2011, KASB received 115 cylinders compared to only 25 cylinders in 2010. The statistic for the past 3 years is recorded as follows.
Flammable Gases / ODS
Flammable gas is incinerated via a pipeline which connects the cylinder to the Incineration Plant. The gas from the cylinder is usually compressed at high pressure and directly released. Gas in low pressure cylinders requires a vacuum pump to purge its contents. The pipeline is purged with mineral oil, nitrogen or both to remove moisture and foreign matter along the line prior to incineration.
Pre-treatment – Incineration of ODS / GHG
The most common ODS and GHG are CO2, hydrochlorofluorocarbons (HCFCs), chlorofluorocarbons (CFCs),
hydrofluorocarbons (HFCs), nitrous oxide, methane and sulphur hexafluoride. These gases deplete the ozone layer or absorb and emit radiation at specific wavelengths which cause the greenhouse effect. They are incinerated to decompose the gas into hydrochloric acid or hydrofluoric acid which is scrubbed during the incineration. This reduces the environmental impact particularly from CFCs or HCFCs if released directly into air. The same pipeline at the Incineration Plant is used for this purpose.
Closing the CMD before the penetration process is carried out
Tightening the entry point of flammable gas into Incineration Plant
2009 2010 2011
Flammable 7 15 19
Corrosive 9 0 3
Ozone Depletion Substances (ODS) 21 10 75
Inert 0 0 17
Others 7 0 1
Total 44 25 115
NO. OF CYLINDERSTYPE OF GAS
53UEM EnvironmentSustainability Report 2011|
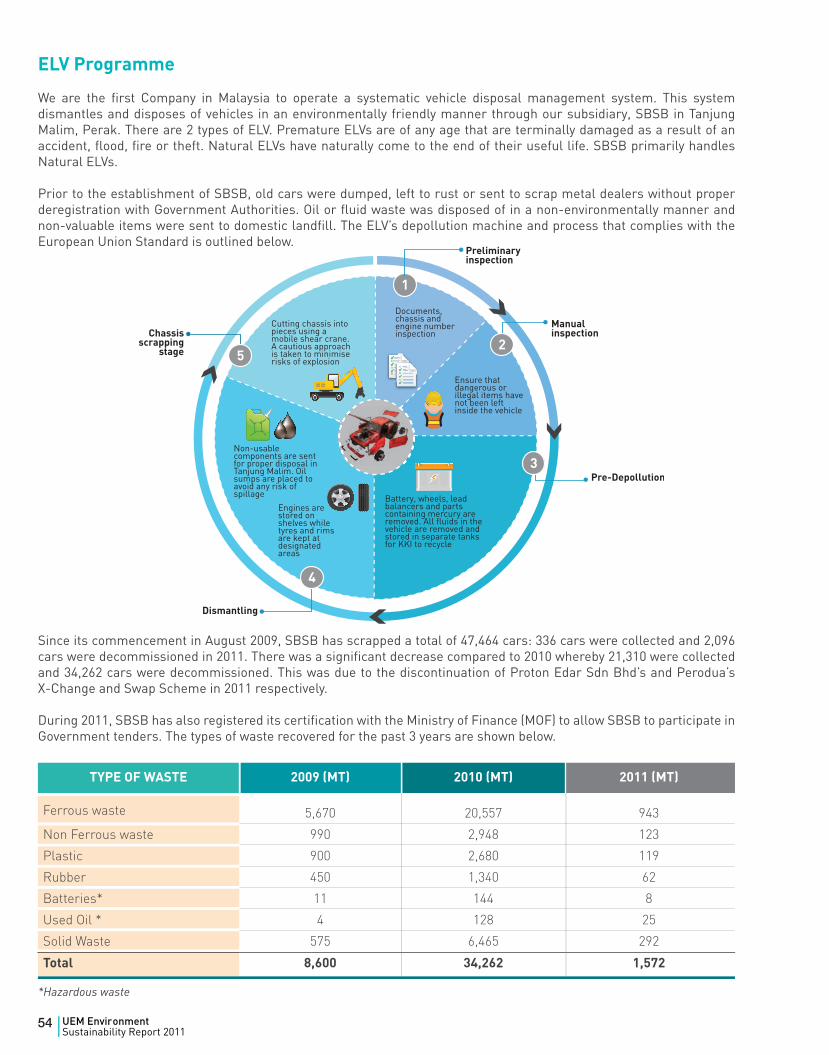
ELV Programme
We are the first Company in Malaysia to operate a systematic vehicle disposal management system. This system dismantles and disposes of vehicles in an environmentally friendly manner through our subsidiary, SBSB in Tanjung Malim, Perak. There are 2 types of ELV. Premature ELVs are of any age that are terminally damaged as a result of an accident, flood, fire or theft. Natural ELVs have naturally come to the end of their useful life. SBSB primarily handles Natural ELVs.
Prior to the establishment of SBSB, old cars were dumped, left to rust or sent to scrap metal dealers without proper deregistration with Government Authorities. Oil or fluid waste was disposed of in a non-environmentally manner and non-valuable items were sent to domestic landfill. The ELV’s depollution machine and process that complies with the European Union Standard is outlined below.
Since its commencement in August 2009, SBSB has scrapped a total of 47,464 cars: 336 cars were collected and 2,096 cars were decommissioned in 2011. There was a significant decrease compared to 2010 whereby 21,310 were collected and 34,262 cars were decommissioned. This was due to the discontinuation of Proton Edar Sdn Bhd’s and Perodua’s X-Change and Swap Scheme in 2011 respectively.
During 2011, SBSB has also registered its certification with the Ministry of Finance (MOF) to allow SBSB to participate in Government tenders. The types of waste recovered for the past 3 years are shown below.
TYPE OF WASTE 2009 (MT) 2010 (MT) 2011 (MT)
5,670 20,557 943
Non Ferrous waste 990 2,948 123
Plastic 900 2,680 119
Rubber 450 1,340 62
Batteries* 11 144 8
Used Oil * 4 128 25
Solid Waste 575 6,465 292
Total 8,600 34,262 1,572
Ferrous waste
*Hazardous waste
54 UEM EnvironmentSustainability Report 2011|
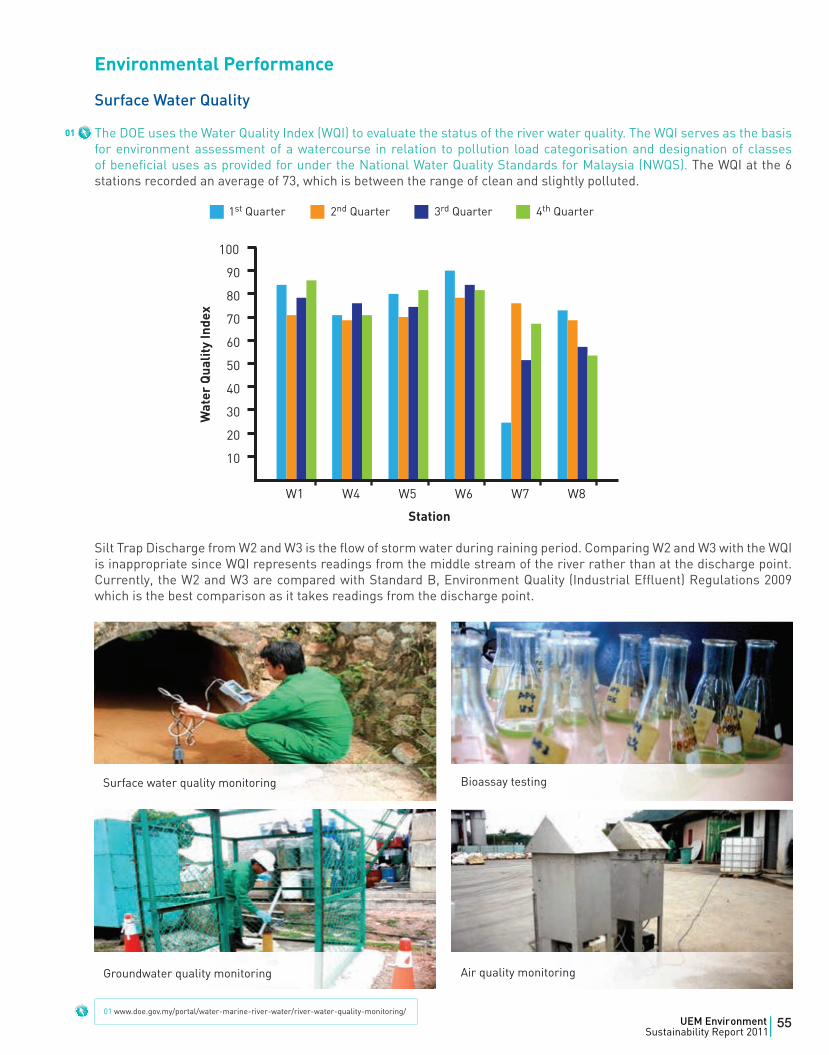
Environmental Performance
Surface Water Quality
The DOE uses the Water Quality Index (WQI) to evaluate the status of the river water quality. The WQI serves as the basis for environment assessment of a watercourse in relation to pollution load categorisation and designation of classes of beneficial uses as provided for under the National Water Quality Standards for Malaysia (NWQS). The WQI at the 6 stations recorded an average of 73, which is between the range of clean and slightly polluted.
Silt Trap Discharge from W2 and W3 is the flow of storm water during raining period. Comparing W2 and W3 with the WQI is inappropriate since WQI represents readings from the middle stream of the river rather than at the discharge point. Currently, the W2 and W3 are compared with Standard B, Environment Quality (Industrial Effluent) Regulations 2009 which is the best comparison as it takes readings from the discharge point.
01
01 www.doe.gov.my/portal/water-marine-river-water/river-water-quality-monitoring/
Groundwater quality monitoring
Bioassay testing
Air quality monitoring
Surface water quality monitoring
55UEM EnvironmentSustainability Report 2011|
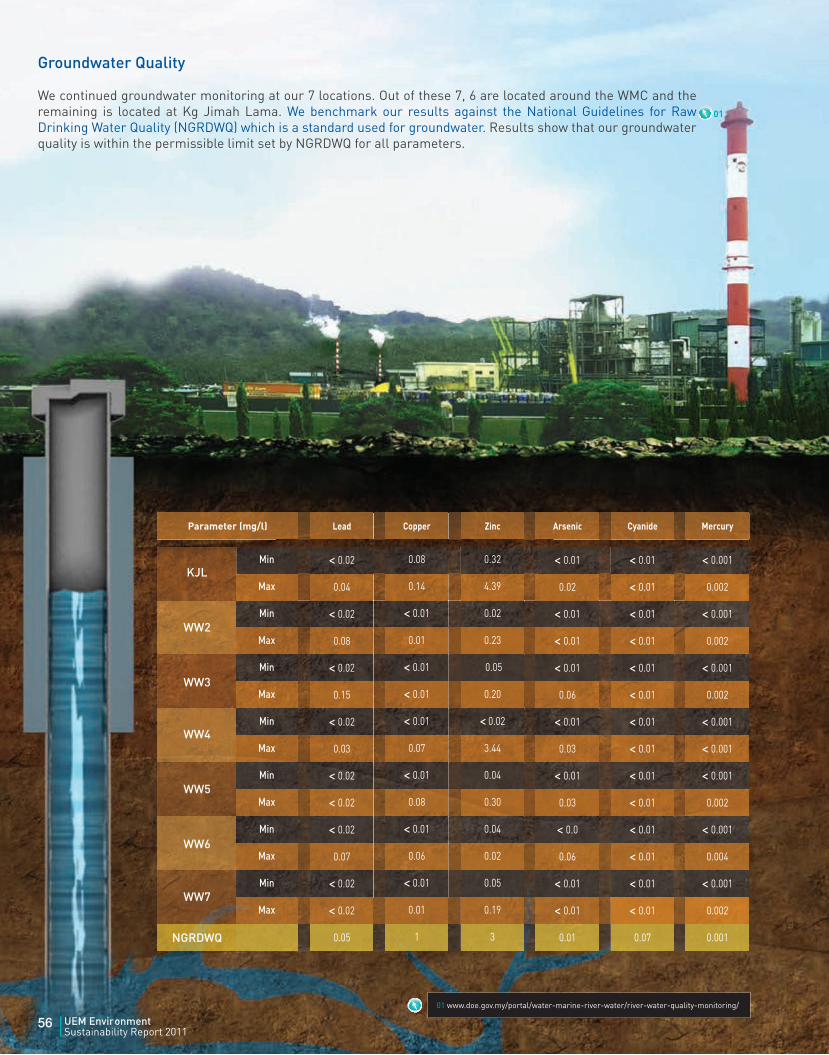
Groundwater Quality
We continued groundwater monitoring at our 7 locations. Out of these 7, 6 are located around the WMC and the remaining is located at Kg Jimah Lama. We benchmark our results against the National Guidelines for Raw Drinking Water Quality (NGRDWQ) which is a standard used for groundwater. Results show that our groundwater quality is within the permissible limit set by NGRDWQ for all parameters.
01
01 www.doe.gov.my/portal/water-marine-river-water/river-water-quality-monitoring/
56 UEM EnvironmentSustainability Report 2011|
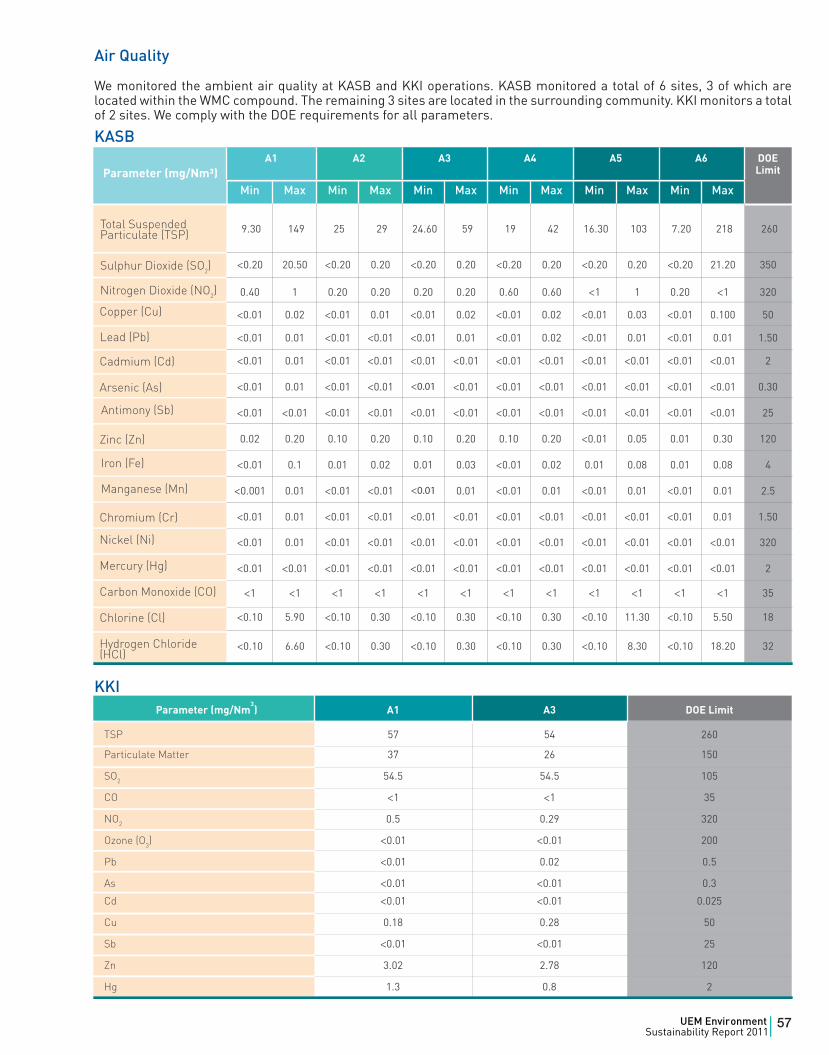
Air Quality
We monitored the ambient air quality at KASB and KKI operations. KASB monitored a total of 6 sites, 3 of which are located within the WMC compound. The remaining 3 sites are located in the surrounding community. KKI monitors a total of 2 sites. We comply with the DOE requirements for all parameters.
KASB
KKIParameter (mg/Nm
3) A1 A3 DOE Limit
TSP 57 54 260
Particulate Matter 37 26 150
SO2 54.5 54.5 105
CO <1 <1 35
NO2 0.5 0.29 320
Ozone (O3) <0.01 <0.01 200
Pb <0.01 0.02 0.5
As <0.01 <0.01 0.3
Cd <0.01 <0.01 0.025
Cu 0.18 0.28 50
Sb <0.01 <0.01 25
Zn 3.02 2.78 120
Hg 1.3 0.8 2
A1 A2 A3 A4 A5 A6 DOE Limit
Min Max Min Max Min Max Min Max Min Max Min Max
Copper (Cu) <0.01 0.02 <0.01 0.01 <0.01 0.02 <0.01 0.02 <0.01 0.03 <0.01 0.100 50
<0.01 0.01 <0.01 <0.01 <0.01 0.01 <0.01 0.02 <0.01 0.01 <0.01 0.01 1.50
Cadmium (Cd) <0.01 0.01 <0.01 <0.01 <0.01 <0.01 <0.01 <0.01 <0.01 <0.01 <0.01 <0.01 2
Arsenic (As) <0.01 0.01 <0.01 <0.01 <0.01 <0.01 <0.01 <0.01 <0.01 <0.01 <0.01 <0.01 0.30
<0.01 <0.01 <0.01 <0.01 <0.01 <0.01 <0.01 <0.01 <0.01 <0.01 <0.01 <0.01 25
Zinc (Zn) 0.02 0.20 0.10 0.20 0.10 0.20 0.10 0.20 <0.01 0.05 0.01 0.30 120
<0.01 0.1 0.01 0.02 0.01 0.03 <0.01 0.02 0.01 0.08 0.01 0.08 4
<0.001 0.01 <0.01 <0.01 <0.01 0.01 <0.01 0.01 <0.01 0.01 <0.01 0.01 2.5
Chromium (Cr) <0.01 0.01 <0.01 <0.01 <0.01 <0.01 <0.01 <0.01 <0.01 <0.01 <0.01 0.01 1.50
Nickel (Ni) <0.01 0.01 <0.01 <0.01 <0.01 <0.01 <0.01 <0.01 <0.01 <0.01 <0.01 <0.01 320
Mercury (Hg) <0.01 <0.01 <0.01 <0.01 <0.01 <0.01 <0.01 <0.01 <0.01 <0.01 <0.01 <0.01 2
Carbon Monoxide (CO)
Chlorine (Cl) <0.10 5.90 <0.10 0.30 <0.10 0.30 <0.10 0.30 <0.10 11.30 <0.10 5.50 18
Hydrogen Chloride (HCl)
Parameter (mg/Nm³)
0.40 1 0.20 0.20 0.20 0.20 0.60 0.60 <1 1 0.20 <1 320
<0.20 20.50 <0.20 0.20 <0.20 0.20 <0.20 0.20 <0.20 0.20 <0.20 21.20 350
Nitrogen Dioxide (NO2)
Sulphur Dioxide (SO2)
Total Suspended Particulate (TSP) 9.30 149 25 29 24.60 59 19 42 16.30 103 7.20 218 260
<1 <1 <1 <1 <1 <1 <1 <1 <1 <1 <1 <1 35
<0.10 6.60 <0.10 0.30 <0.10 0.30 <0.10 0.30 <0.10 8.30 <0.10 18.20 32
Lead (Pb)
Manganese (Mn)
Iron (Fe)
Antimony (Sb)
57UEM EnvironmentSustainability Report 2011|
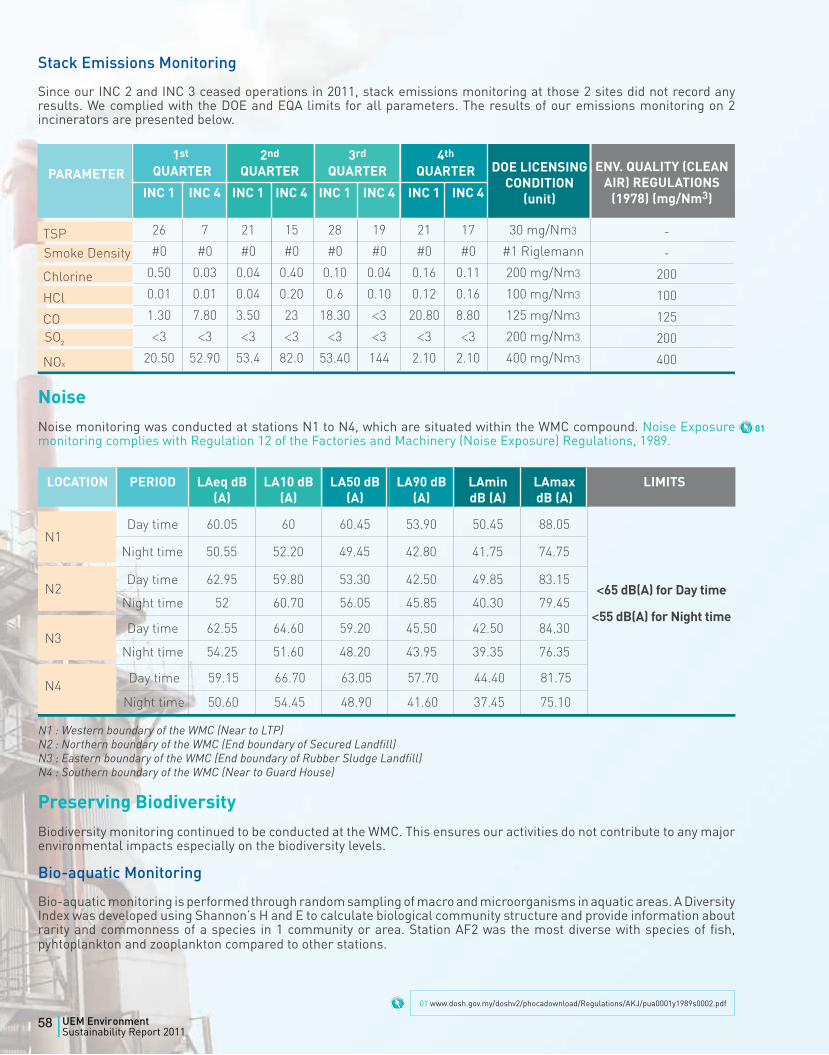
01
01 www.dosh.gov.my/doshv2/phocadownload/Regulations/AKJ/pua0001y1989s0002.pdf
Stack Emissions Monitoring
Since our INC 2 and INC 3 ceased operations in 2011, stack emissions monitoring at those 2 sites did not record any results. We complied with the DOE and EQA limits for all parameters. The results of our emissions monitoring on 2 incinerators are presented below.
NoiseNoise monitoring was conducted at stations N1 to N4, which are situated within the WMC compound. Noise Exposure monitoring complies with Regulation 12 of the Factories and Machinery (Noise Exposure) Regulations, 1989.
Preserving BiodiversityBiodiversity monitoring continued to be conducted at the WMC. This ensures our activities do not contribute to any major environmental impacts especially on the biodiversity levels.
Bio-aquatic Monitoring
Bio-aquatic monitoring is performed through random sampling of macro and microorganisms in aquatic areas. A Diversity Index was developed using Shannon’s H and E to calculate biological community structure and provide information about rarity and commonness of a species in 1 community or area. Station AF2 was the most diverse with species of fish, pyhtoplankton and zooplankton compared to other stations.
PARAMETER1st
QUARTER2nd
QUARTER3rd
QUARTER4th
QUARTER
INC 1 INC 4 INC 1 INC 4 INC 1 INC 4 INC 1 INC 4
TSP
Chlorine
HCl
CO
NOx
ENV. QUALITY (CLEAN AIR) REGULATIONS
(1978) (mg/Nm3)
LOCATION PERIOD LAeq dB (A)
LA10 dB (A)
LA50 dB (A)
LA90 dB (A)
LAmin dB (A)
LAmax dB (A)
LIMITS
Night time 52 60.70 56.05 45.85 40.30 79.45
Day time 62.55 64.60 59.20 45.50 42.50 84.30
Night time 54.25 51.60 48.20 43.95 39.35 76.35
N1 : Western boundary of the WMC (Near to LTP)N2 : Northern boundary of the WMC (End boundary of Secured Landfill)N3 : Eastern boundary of the WMC (End boundary of Rubber Sludge Landfill)N4 : Southern boundary of the WMC (Near to Guard House)
N1
N2
N3
N4
<65 dB(A) for Day time
<55 dB(A) for Night time
Day time 60.05 60 60.45 53.90 50.45 88.05
DOE LICENSING CONDITION
(unit)
26 7 21 15 28 19 21 17 30 mg/Nm3
#0 #0 #0 #0 #0 #0 #0 #0 #1 Riglemann
0.50 0.03 0.04 0.40 0.10 0.04 0.16 0.11 200 mg/Nm3
0.01 0.01 0.04 0.20 0.6 0.10 0.12 0.16 100 mg/Nm3
1.30 7.80 3.50 23 18.30 <3 20.80 8.80 125 mg/Nm3
<3 <3 <3 <3 <3 <3 <3 <3 200 mg/Nm3
20.50 52.90 53.4 82.0 53.40 144 2.10 2.10 400 mg/Nm3
-
-
200
100
125
200
400
Day time 62.95 59.80 53.30 42.50 49.85 83.15
Day time 59.15 66.70 63.05 57.70 44.40 81.75
Night time 50.60 54.45 48.90 41.60 37.45 75.10
Night time 50.55 52.20 49.45 42.80 41.75 74.75
Smoke Density
SO2
58 UEM EnvironmentSustainability Report 2011|
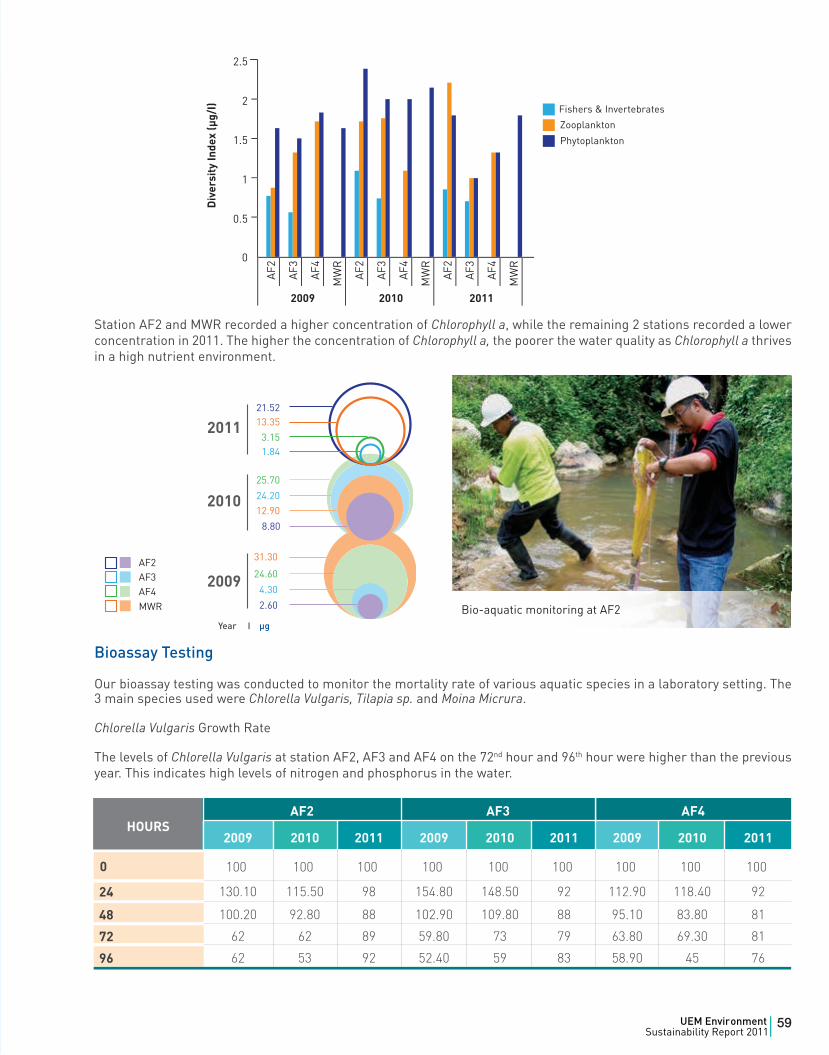
Station AF2 and MWR recorded a higher concentration of Chlorophyll a, while the remaining 2 stations recorded a lower concentration in 2011. The higher the concentration of Chlorophyll a, the poorer the water quality as Chlorophyll a thrives in a high nutrient environment.
Bioassay Testing
Our bioassay testing was conducted to monitor the mortality rate of various aquatic species in a laboratory setting. The 3 main species used were Chlorella Vulgaris, Tilapia sp. and Moina Micrura.
Chlorella Vulgaris Growth Rate The levels of Chlorella Vulgaris at station AF2, AF3 and AF4 on the 72nd hour and 96th hour were higher than the previous year. This indicates high levels of nitrogen and phosphorus in the water.
AF2 AF3 AF4
2009 2010 2011 2009 2010 2011 2009 2010 2011
24 130.10 115.50 98 154.80 148.50 92 112.90 118.40 92
48 100.20 92.80 88 102.90 109.80 88 95.10 83.80 81
72 62 62 89 59.80 73 79 63.80 69.30 81
96 62 53 92 52.40 59 83 58.90 45 76
HOURS
100 100 100 100 100 100 100 100 1000
Year I µg
Bio-aquatic monitoring at AF2
59UEM EnvironmentSustainability Report 2011|
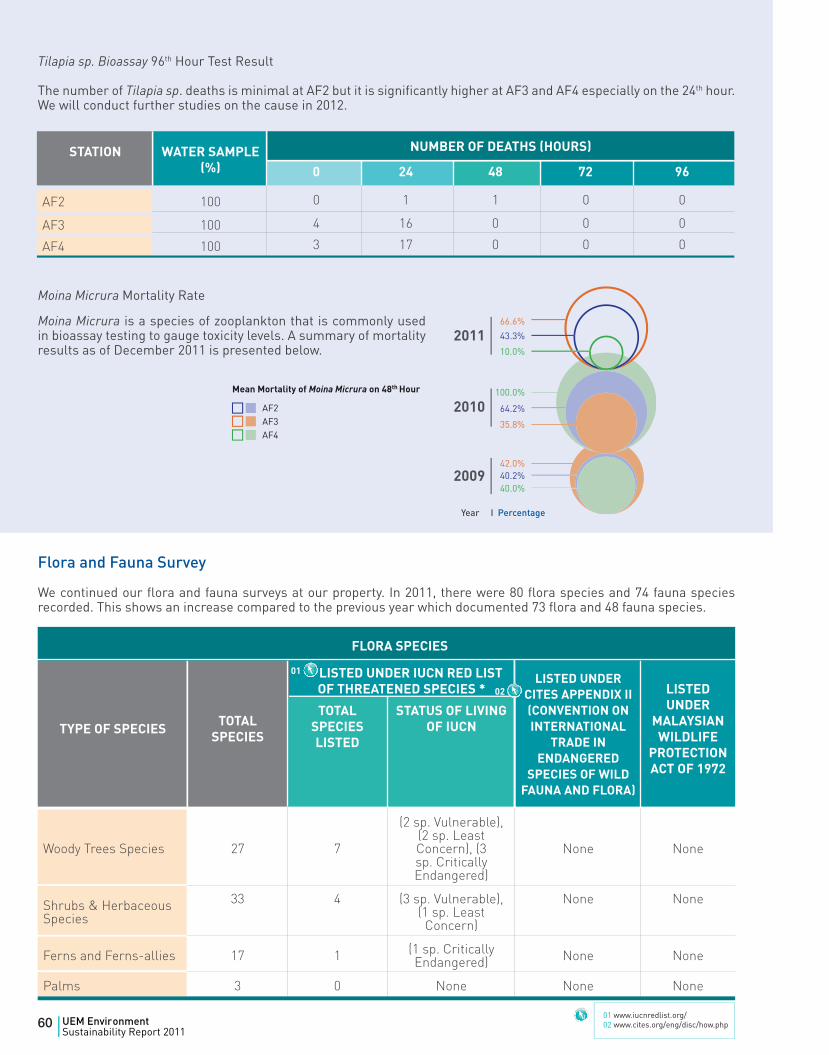
Tilapia sp. Bioassay 96th Hour Test Result
The number of Tilapia sp. deaths is minimal at AF2 but it is significantly higher at AF3 and AF4 especially on the 24th hour. We will conduct further studies on the cause in 2012.
Moina Micrura Mortality Rate
Flora and Fauna Survey
We continued our flora and fauna surveys at our property. In 2011, there were 80 flora species and 74 fauna species recorded. This shows an increase compared to the previous year which documented 73 flora and 48 fauna species.
01 www.iucnredlist.org/02 www.cites.org/eng/disc/how.php
Year I Percentage
FLORA SPECIES
TYPE OF SPECIES TOTAL SPECIES
LISTED UNDER IUCN RED LIST OF THREATENED SPECIES *
LISTED UNDER CITES APPENDIX II (CONVENTION ON INTERNATIONAL
TRADE IN ENDANGERED
SPECIES OF WILD FAUNA AND FLORA)
LISTED UNDER
MALAYSIAN WILDLIFE
PROTECTION ACT OF 1972
TOTAL SPECIES LISTED
STATUS OF LIVING OF IUCN
Woody Trees Species 27 7
(2 sp. Vulnerable),(2 sp. Least Concern), (3 sp. Critically Endangered)
None None
Shrubs & Herbaceous Species
33 4 (3 sp. Vulnerable), (1 sp. Least
Concern)
None None
Ferns and Ferns-allies 17 1 (1 sp. Critically Endangered) None None
Palms 3 0 None None None
01
02
Moina Micrura is a species of zooplankton that is commonly used in bioassay testing to gauge toxicity levels. A summary of mortality results as of December 2011 is presented below.
STATION WATER SAMPLE (%)
NUMBER OF DEATHS (HOURS)
AF2 100
AF3 100
AF4 100
0 24 48 72 96
0 1 1 0 0
4 16 0 0 0
3 17 0 0 0
60 UEM EnvironmentSustainability Report 2011|
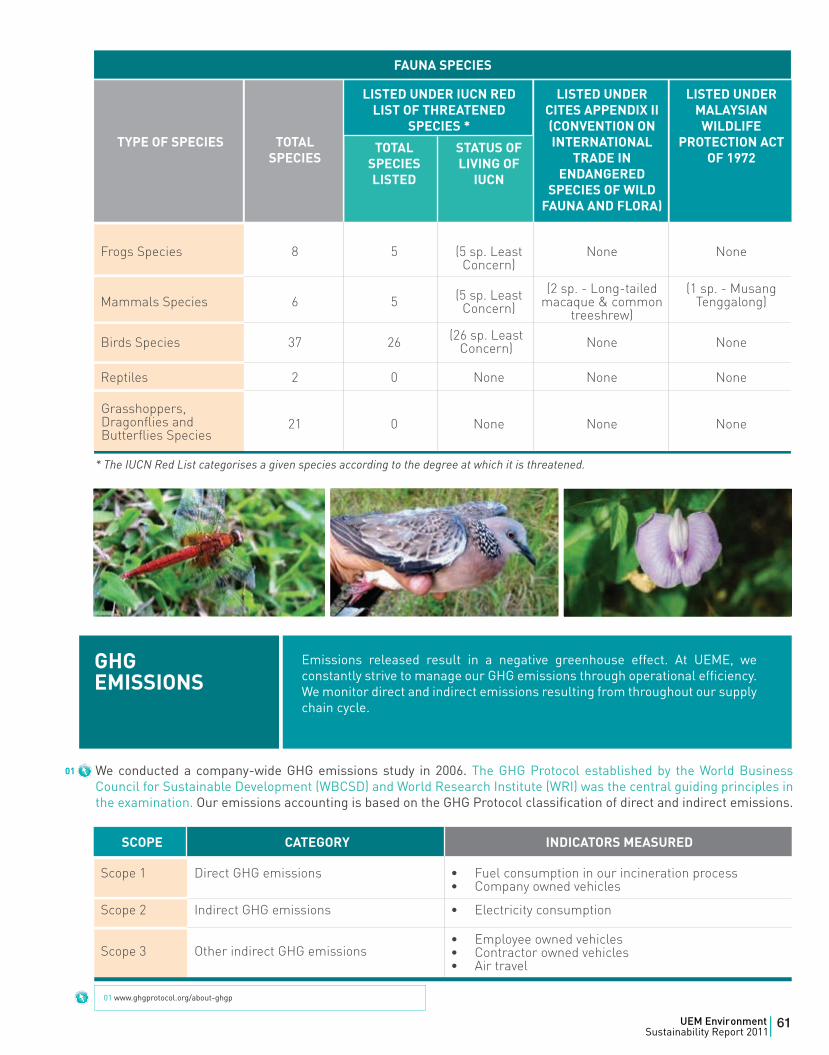
01 www.iucnredlist.org/02 www.cites.org/eng/disc/how.php
FAUNA SPECIES
01 www.ghgprotocol.org/about-ghgp
GHGEMISSIONS
01
TYPE OF SPECIES TOTAL SPECIES
LISTED UNDER IUCN RED LIST OF THREATENED
SPECIES *
LISTED UNDER CITES APPENDIX II (CONVENTION ON INTERNATIONAL
TRADE IN ENDANGERED
SPECIES OF WILD FAUNA AND FLORA)
LISTED UNDER MALAYSIAN
WILDLIFE PROTECTION ACT
OF 1972TOTAL
SPECIES LISTED
STATUS OF LIVING OF
IUCN
Frogs Species 8 5 (5 sp. Least Concern)
None None
Mammals Species 6 5 (5 sp. Least Concern)
(2 sp. - Long-tailed macaque & common
treeshrew)
(1 sp. - Musang Tenggalong)
Birds Species 37 26 None None
Reptiles 2 0 None None None
21 0 None None None
* The IUCN Red List categorises a given species according to the degree at which it is threatened.
We conducted a company-wide GHG emissions study in 2006. The GHG Protocol established by the World Business Council for Sustainable Development (WBCSD) and World Research Institute (WRI) was the central guiding principles in the examination. Our emissions accounting is based on the GHG Protocol classification of direct and indirect emissions.
SCOPE CATEGORY INDICATORS MEASURED
Scope 1 Direct GHG emissions • Fuel consumption in our incineration process • Company owned vehicles
Scope 2 Indirect GHG emissions • Electricity consumption
• Employee owned vehicles• Contractor owned vehicles• Air travel
Emissions released result in a negative greenhouse effect. At UEME, we constantly strive to manage our GHG emissions through operational efficiency. We monitor direct and indirect emissions resulting from throughout our supply chain cycle.
FAUNA SPECIES
Scope 3 Other indirect GHG emissions
Grasshoppers, Dragonflies and Butterflies Species
(26 sp. Least Concern)
61UEM EnvironmentSustainability Report 2011|
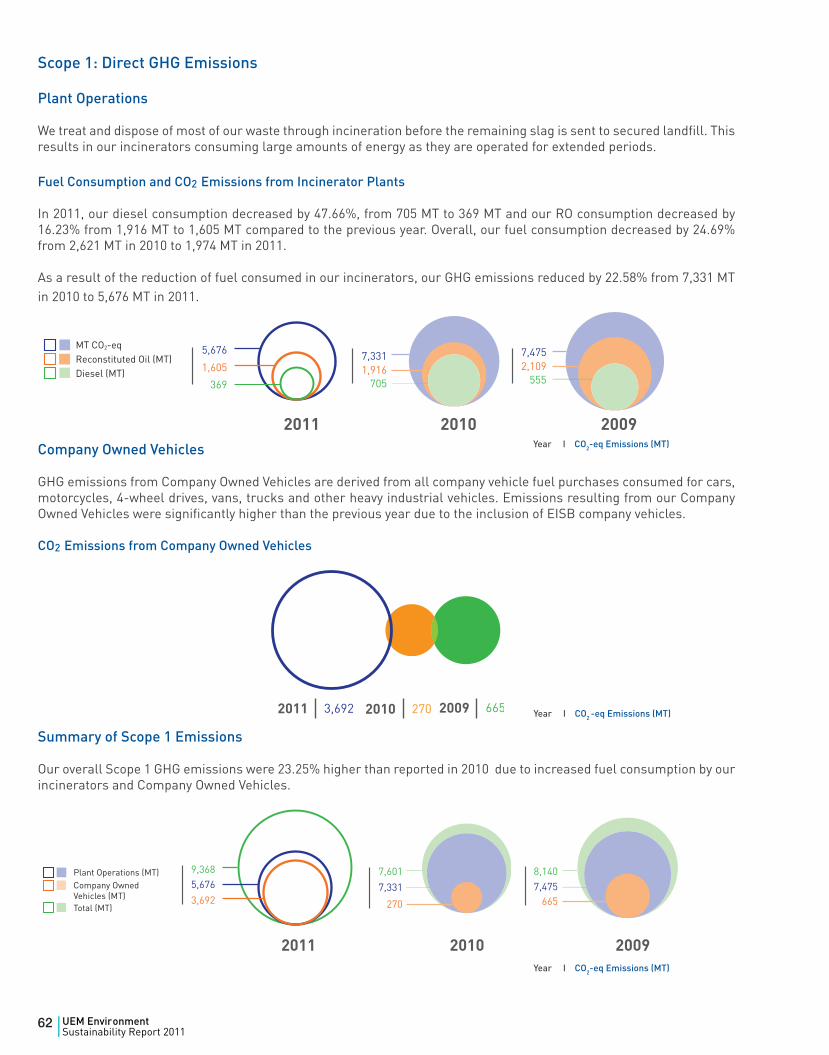
Scope 1: Direct GHG Emissions
Plant Operations
We treat and dispose of most of our waste through incineration before the remaining slag is sent to secured landfill. This results in our incinerators consuming large amounts of energy as they are operated for extended periods.
Fuel Consumption and CO2 Emissions from Incinerator Plants
In 2011, our diesel consumption decreased by 47.66%, from 705 MT to 369 MT and our RO consumption decreased by 16.23% from 1,916 MT to 1,605 MT compared to the previous year. Overall, our fuel consumption decreased by 24.69% from 2,621 MT in 2010 to 1,974 MT in 2011.
As a result of the reduction of fuel consumed in our incinerators, our GHG emissions reduced by 22.58% from 7,331 MT in 2010 to 5,676 MT in 2011.
Company Owned Vehicles
GHG emissions from Company Owned Vehicles are derived from all company vehicle fuel purchases consumed for cars, motorcycles, 4-wheel drives, vans, trucks and other heavy industrial vehicles. Emissions resulting from our Company Owned Vehicles were significantly higher than the previous year due to the inclusion of EISB company vehicles.
CO2 Emissions from Company Owned Vehicles
Summary of Scope 1 Emissions
Our overall Scope 1 GHG emissions were 23.25% higher than reported in 2010 due to increased fuel consumption by our incinerators and Company Owned Vehicles.
Year I CO2 -eq Emissions (MT)
Year I CO2-eq Emissions (MT)
Year I CO2-eq Emissions (MT)
62 UEM EnvironmentSustainability Report 2011|
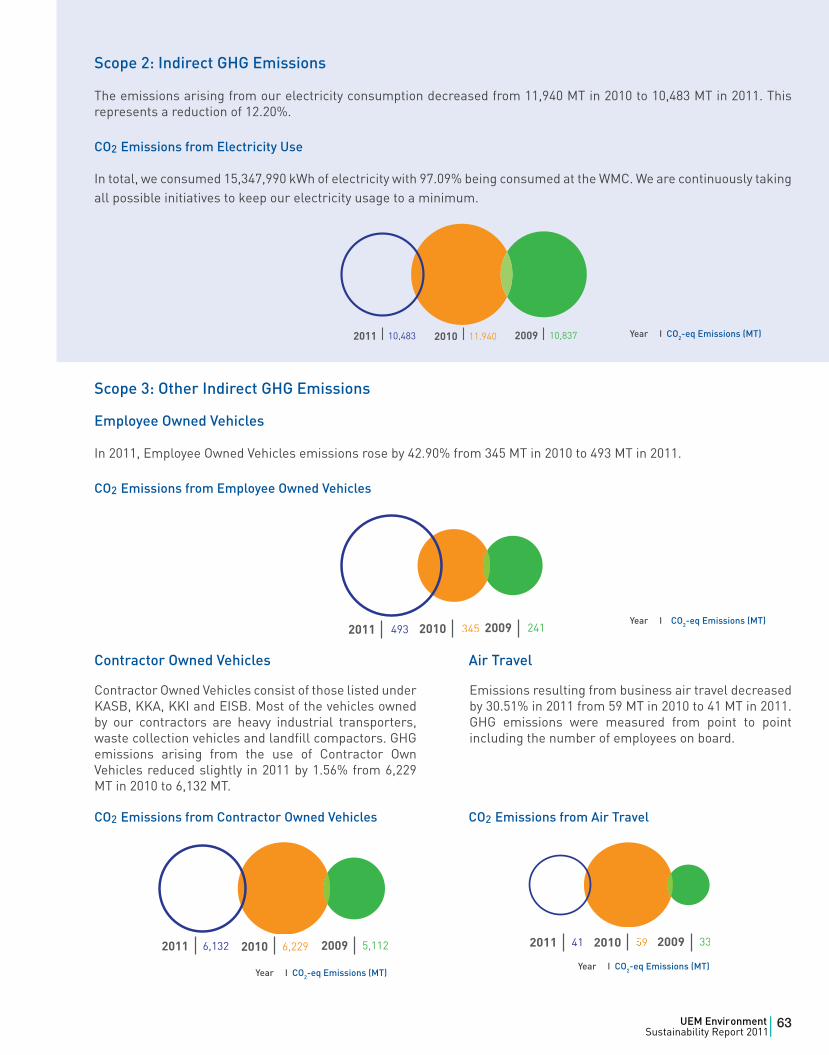
Scope 2: Indirect GHG Emissions
The emissions arising from our electricity consumption decreased from 11,940 MT in 2010 to 10,483 MT in 2011. This represents a reduction of 12.20%.
CO2 Emissions from Electricity Use
In total, we consumed 15,347,990 kWh of electricity with 97.09% being consumed at the WMC. We are continuously taking all possible initiatives to keep our electricity usage to a minimum.
Scope 3: Other Indirect GHG Emissions
Employee Owned Vehicles
In 2011, Employee Owned Vehicles emissions rose by 42.90% from 345 MT in 2010 to 493 MT in 2011.
CO2 Emissions from Employee Owned Vehicles
Contractor Owned Vehicles Air Travel
CO2 Emissions from Contractor Owned Vehicles CO2 Emissions from Air Travel
Year I CO2-eq Emissions (MT)
Year I CO2-eq Emissions (MT)
Year I CO2-eq Emissions (MT)Year I CO2-eq Emissions (MT)
Contractor Owned Vehicles consist of those listed under KASB, KKA, KKI and EISB. Most of the vehicles owned by our contractors are heavy industrial transporters, waste collection vehicles and landfill compactors. GHG emissions arising from the use of Contractor Own Vehicles reduced slightly in 2011 by 1.56% from 6,229 MT in 2010 to 6,132 MT.
Emissions resulting from business air travel decreasedby 30.51% in 2011 from 59 MT in 2010 to 41 MT in 2011.GHG emissions were measured from point to point including the number of employees on board.
63UEM EnvironmentSustainability Report 2011|
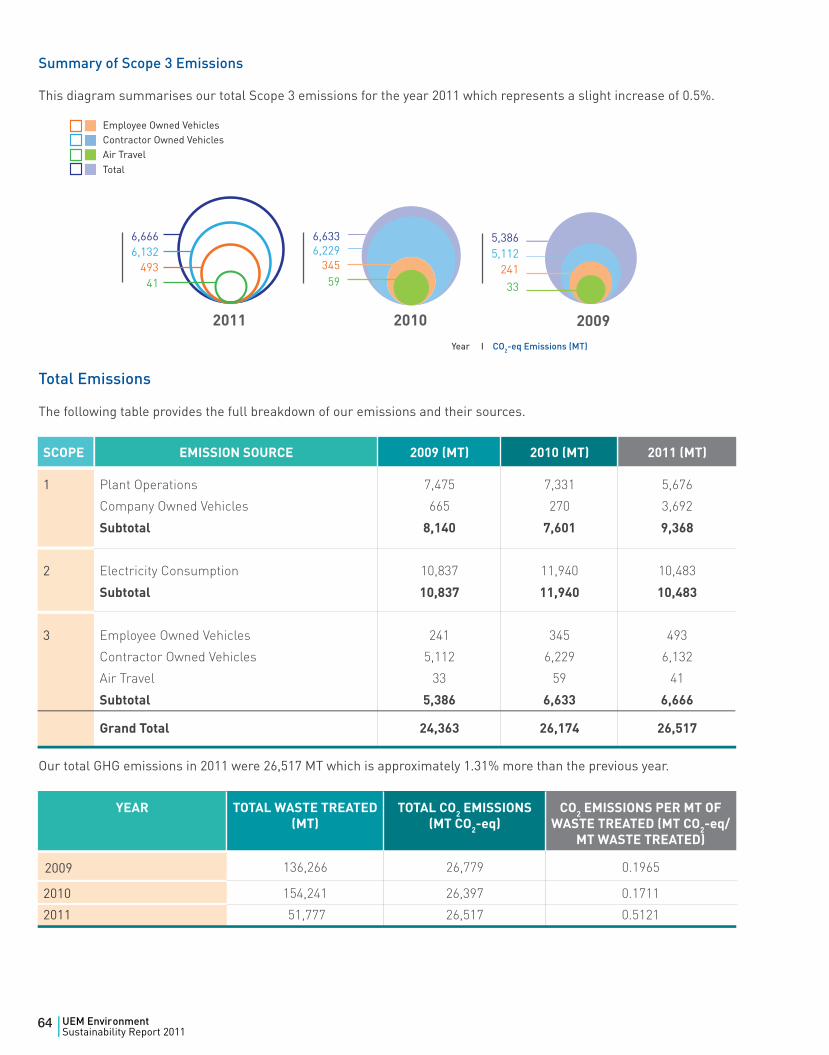
Year I CO2-eq Emissions (MT)
Summary of Scope 3 Emissions
This diagram summarises our total Scope 3 emissions for the year 2011 which represents a slight increase of 0.5%.
Total Emissions
The following table provides the full breakdown of our emissions and their sources.
Our total GHG emissions in 2011 were 26,517 MT which is approximately 1.31% more than the previous year.
SCOPE EMISSION SOURCE 2009 (MT) 2010 (MT) 2011 (MT)
1 Plant Operations 7,475 7,331 5,676
Company Owned Vehicles 665 270 3,692
Subtotal 8,140 7,601 9,368
2 Electricity Consumption 10,837 11,940 10,483
Subtotal 10,837 11,940 10,483
3 Employee Owned Vehicles 241 345 493
Contractor Owned Vehicles 5,112 6,229 6,132
Air Travel 33 59 41
Subtotal 5,386 6,633 6,666
YEAR TOTAL WASTE TREATED (MT)
TOTAL CO2 EMISSIONS (MT CO2-eq)
CO2 EMISSIONS PER MT OF WASTE TREATED (MT CO2-eq/
MT WASTE TREATED)
2010 154,241 26,397 0.1711
2011 51,777 26,517 0.5121
2009 136,266 26,779 0.1965
Grand Total 24,363 26,174 26,517
64 UEM EnvironmentSustainability Report 2011|
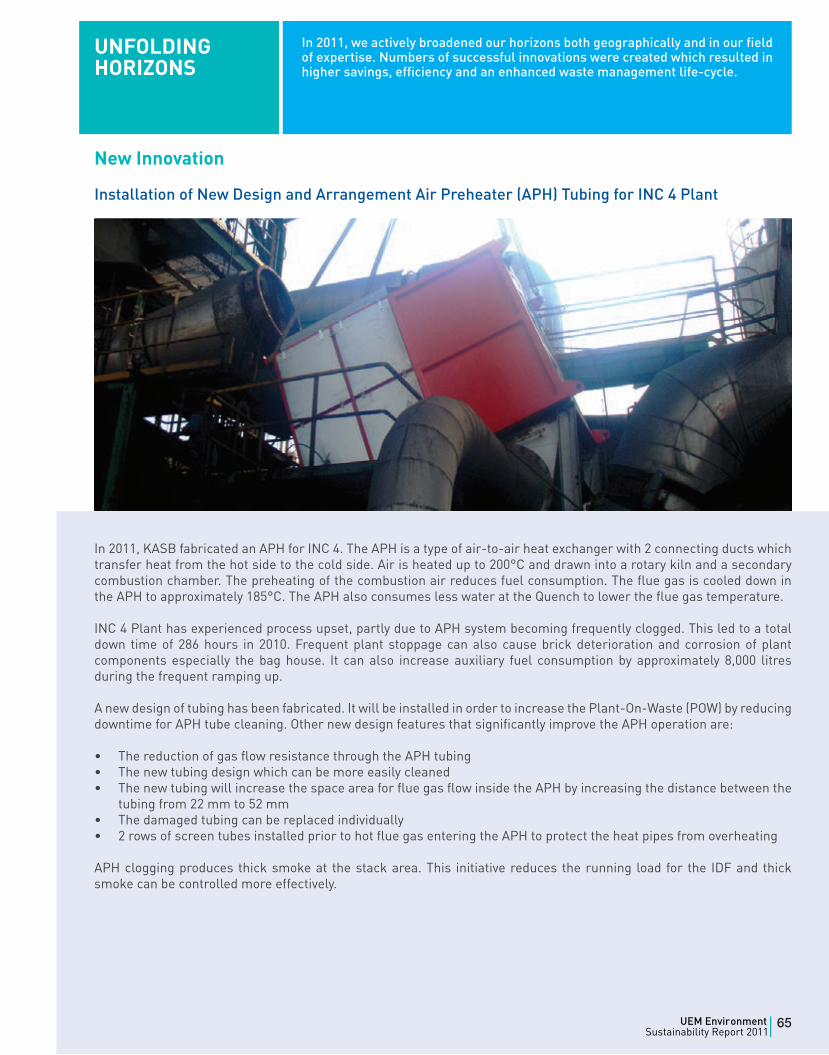
New Innovation
Installation of New Design and Arrangement Air Preheater (APH) Tubing for INC 4 Plant
UNFOLDING HORIZONS
In 2011, we actively broadened our horizons both geographically and in our field of expertise. Numbers of successful innovations were created which resulted in higher savings, efficiency and an enhanced waste management life-cycle.
In 2011, KASB fabricated an APH for INC 4. The APH is a type of air-to-air heat exchanger with 2 connecting ducts which transfer heat from the hot side to the cold side. Air is heated up to 200°C and drawn into a rotary kiln and a secondary combustion chamber. The preheating of the combustion air reduces fuel consumption. The flue gas is cooled down in the APH to approximately 185°C. The APH also consumes less water at the Quench to lower the flue gas temperature.
INC 4 Plant has experienced process upset, partly due to APH system becoming frequently clogged. This led to a total down time of 286 hours in 2010. Frequent plant stoppage can also cause brick deterioration and corrosion of plant components especially the bag house. It can also increase auxiliary fuel consumption by approximately 8,000 litres during the frequent ramping up.
A new design of tubing has been fabricated. It will be installed in order to increase the Plant-On-Waste (POW) by reducing downtime for APH tube cleaning. Other new design features that significantly improve the APH operation are:
• The reduction of gas flow resistance through the APH tubing• The new tubing design which can be more easily cleaned• The new tubing will increase the space area for flue gas flow inside the APH by increasing the distance between the
tubing from 22 mm to 52 mm• The damaged tubing can be replaced individually• 2 rows of screen tubes installed prior to hot flue gas entering the APH to protect the heat pipes from overheating
APH clogging produces thick smoke at the stack area. This initiative reduces the running load for the IDF and thick smoke can be controlled more effectively.
65UEM EnvironmentSustainability Report 2011|
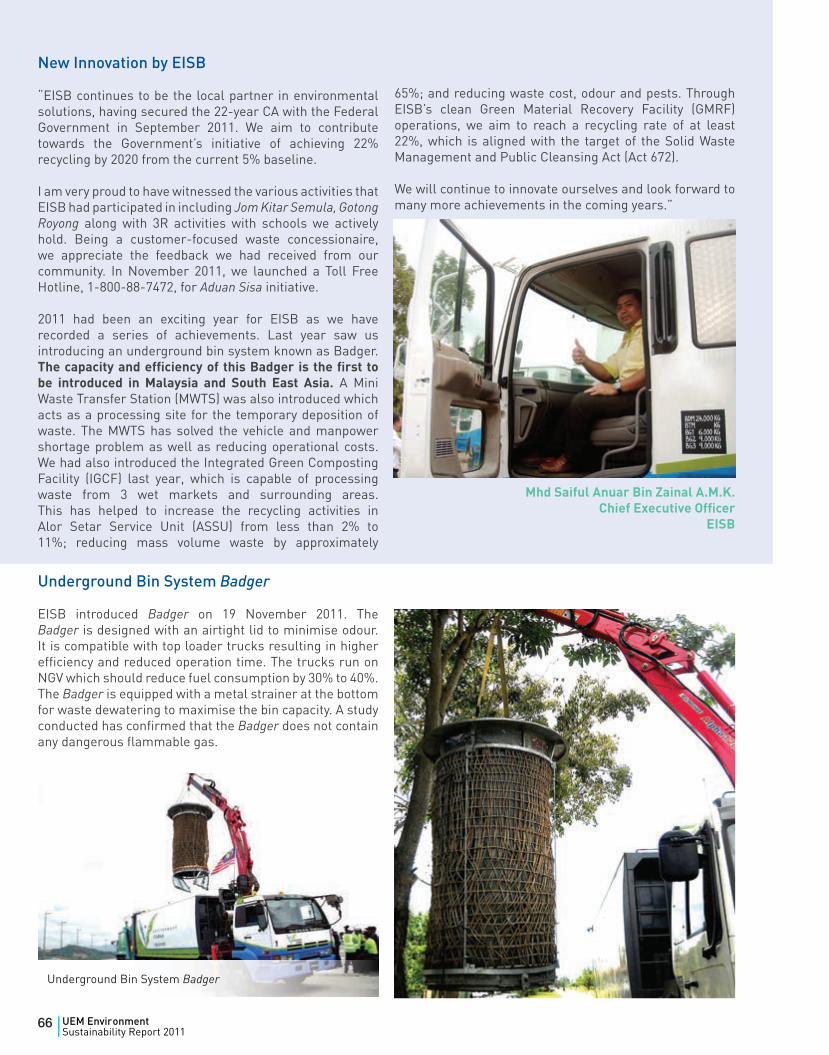
Underground Bin System Badger
EISB introduced Badger on 19 November 2011. The Badger is designed with an airtight lid to minimise odour. It is compatible with top loader trucks resulting in higher efficiency and reduced operation time. The trucks run on NGV which should reduce fuel consumption by 30% to 40%. The Badger is equipped with a metal strainer at the bottom for waste dewatering to maximise the bin capacity. A study conducted has confirmed that the Badger does not contain any dangerous flammable gas.
New Innovation by EISB
“EISB continues to be the local partner in environmental solutions, having secured the 22-year CA with the Federal Government in September 2011. We aim to contribute towards the Government’s initiative of achieving 22% recycling by 2020 from the current 5% baseline.
I am very proud to have witnessed the various activities that EISB had participated in including Jom Kitar Semula, Gotong Royong along with 3R activities with schools we actively hold. Being a customer-focused waste concessionaire, we appreciate the feedback we had received from our community. In November 2011, we launched a Toll Free Hotline, 1-800-88-7472, for Aduan Sisa initiative.
2011 had been an exciting year for EISB as we have recorded a series of achievements. Last year saw us introducing an underground bin system known as Badger. The capacity and efficiency of this Badger is the first to be introduced in Malaysia and South East Asia. A Mini Waste Transfer Station (MWTS) was also introduced which acts as a processing site for the temporary deposition of waste. The MWTS has solved the vehicle and manpower shortage problem as well as reducing operational costs. We had also introduced the Integrated Green Composting Facility (IGCF) last year, which is capable of processing waste from 3 wet markets and surrounding areas. This has helped to increase the recycling activities in Alor Setar Service Unit (ASSU) from less than 2% to 11%; reducing mass volume waste by approximately
65%; and reducing waste cost, odour and pests. Through EISB’s clean Green Material Recovery Facility (GMRF) operations, we aim to reach a recycling rate of at least 22%, which is aligned with the target of the Solid Waste Management and Public Cleansing Act (Act 672).
We will continue to innovate ourselves and look forward to many more achievements in the coming years.”
Mhd Saiful Anuar Bin Zainal A.M.K. Chief Executive Officer
EISB
Underground Bin System Badger
66 UEM EnvironmentSustainability Report 2011|
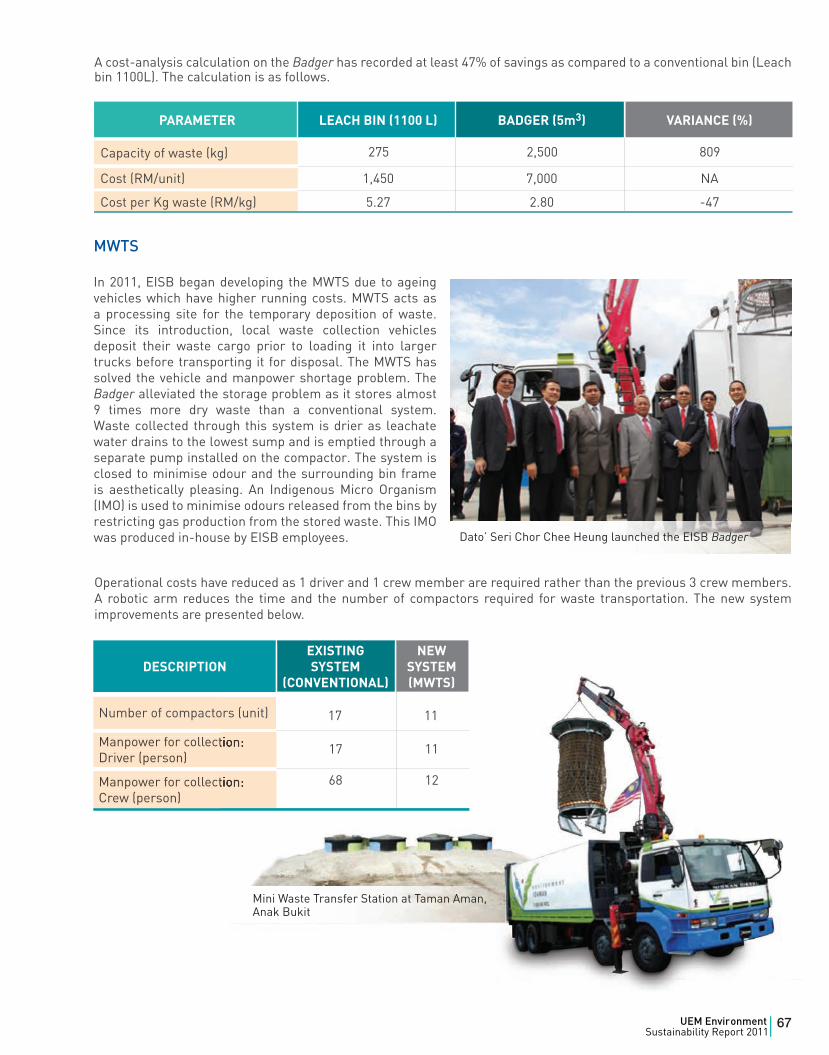
MWTS
In 2011, EISB began developing the MWTS due to ageing vehicles which have higher running costs. MWTS acts as a processing site for the temporary deposition of waste. Since its introduction, local waste collection vehicles deposit their waste cargo prior to loading it into larger trucks before transporting it for disposal. The MWTS has solved the vehicle and manpower shortage problem. The Badger alleviated the storage problem as it stores almost 9 times more dry waste than a conventional system. Waste collected through this system is drier as leachate water drains to the lowest sump and is emptied through a separate pump installed on the compactor. The system is closed to minimise odour and the surrounding bin frame is aesthetically pleasing. An Indigenous Micro Organism (IMO) is used to minimise odours released from the bins by restricting gas production from the stored waste. This IMO was produced in-house by EISB employees.
Operational costs have reduced as 1 driver and 1 crew member are required rather than the previous 3 crew members. A robotic arm reduces the time and the number of compactors required for waste transportation. The new system improvements are presented below.
A cost-analysis calculation on the Badger has recorded at least 47% of savings as compared to a conventional bin (Leach bin 1100L). The calculation is as follows.
Dato’ Seri Chor Chee Heung launched the EISB Badger
Mini Waste Transfer Station at Taman Aman,Anak Bukit
PARAMETER LEACH BIN (1100 L) BADGER (5m3) VARIANCE (%)
Cost (RM/unit) 1,450 7,000 NA
Cost per Kg waste (RM/kg) 5.27 2.80 -47
Capacity of waste (kg) 275 2,500 809
DESCRIPTIONEXISTING SYSTEM
(CONVENTIONAL)
NEW SYSTEM (MWTS)
Manpower for collection: Driver (person)
Manpower for collection: Crew (person)
68 12
Manpower for collection: Manpower for collection: Crew (person)
Manpower for collection: Manpower for collection: Driver (person)
17 11
Number of compactors (unit) 17 11
67UEM EnvironmentSustainability Report 2011|
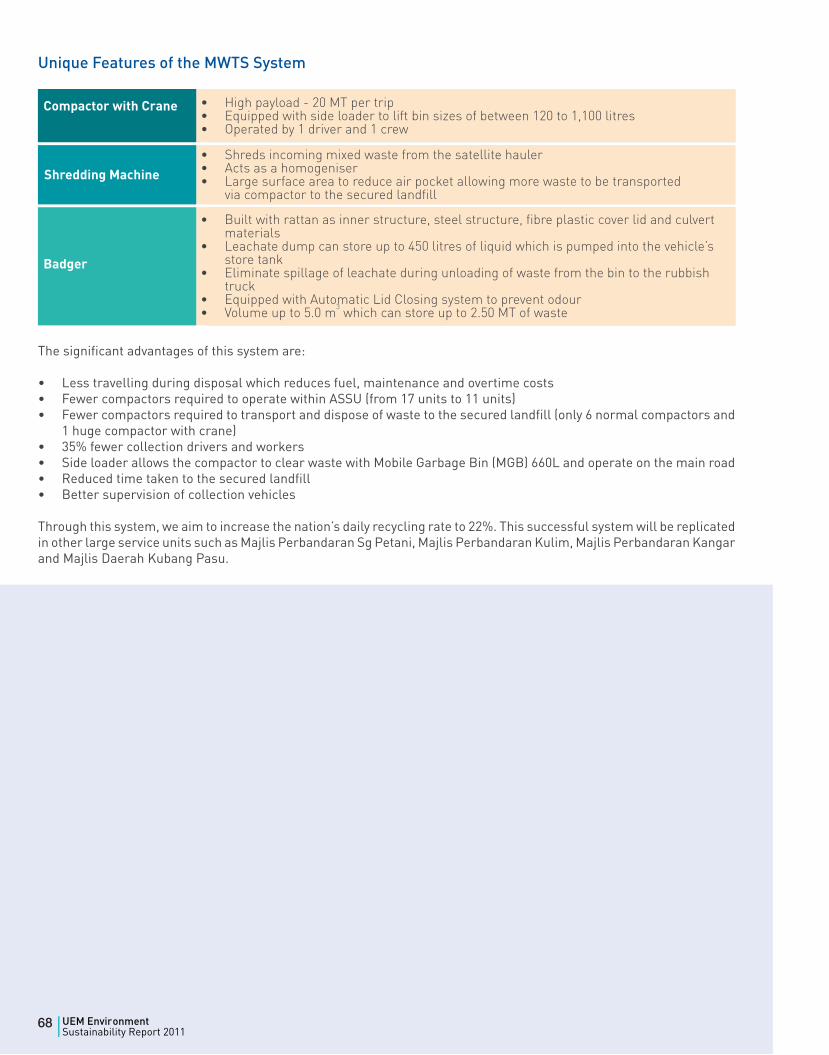
Unique Features of the MWTS System
The significant advantages of this system are:
• Less travelling during disposal which reduces fuel, maintenance and overtime costs• Fewer compactors required to operate within ASSU (from 17 units to 11 units)• Fewer compactors required to transport and dispose of waste to the secured landfill (only 6 normal compactors and
1 huge compactor with crane)• 35% fewer collection drivers and workers • Side loader allows the compactor to clear waste with Mobile Garbage Bin (MGB) 660L and operate on the main road• Reduced time taken to the secured landfill• Better supervision of collection vehicles
Through this system, we aim to increase the nation’s daily recycling rate to 22%. This successful system will be replicated in other large service units such as Majlis Perbandaran Sg Petani, Majlis Perbandaran Kulim, Majlis Perbandaran Kangar and Majlis Daerah Kubang Pasu.
Mini Composting Plant
In 2011, EISB introduced the IGCF which is able to process waste from 3 wet markets and surrounding areas. The IGCF is strategically located in Kubang Rotan, at the centre of the ASSU, to reduce fuel costs to the secured landfill.
Composting is considered one of the best approaches for developing countries to harvest 55% of their organic waste in the solid waste composition. It can be transformed into valuable and marketable bio organic fertiliser for landscaping and vegetable gardening. This process extends the service life of the secured landfill areas. It also increases recycling activities in ASSU from less than 2% to 11%; reduces mass volume waste by approximately 65%; and reduces waste cost, odour and pests.
EISB has also produced IMO from leftover fruits and other organic wastes. A chemical free solution is created which can accelerate the composting process from 90 days to 50 days. Compost samples are analysed by the Malaysian Agriculture Research and Development Institute (MARDI) for nutrients and to obtain compost certification.
Compactor with Crane
Badger
Shredding Machine
• High payload - 20 MT per trip• Equipped with side loader to lift bin sizes of between 120 to 1,100 litres• Operated by 1 driver and 1 crew
• Shreds incoming mixed waste from the satellite hauler• Acts as a homogeniser• Large surface area to reduce air pocket allowing more waste to be transported
via compactor to the secured landfill
• Built with rattan as inner structure, steel structure, fibre plastic cover lid and culvert materials
• Leachate dump can store up to 450 litres of liquid which is pumped into the vehicle’s store tank
• Eliminate spillage of leachate during unloading of waste from the bin to the rubbish truck
• Equipped with Automatic Lid Closing system to prevent odour• Volume up to 5.0 m3 which can store up to 2.50 MT of waste
68 UEM EnvironmentSustainability Report 2011|
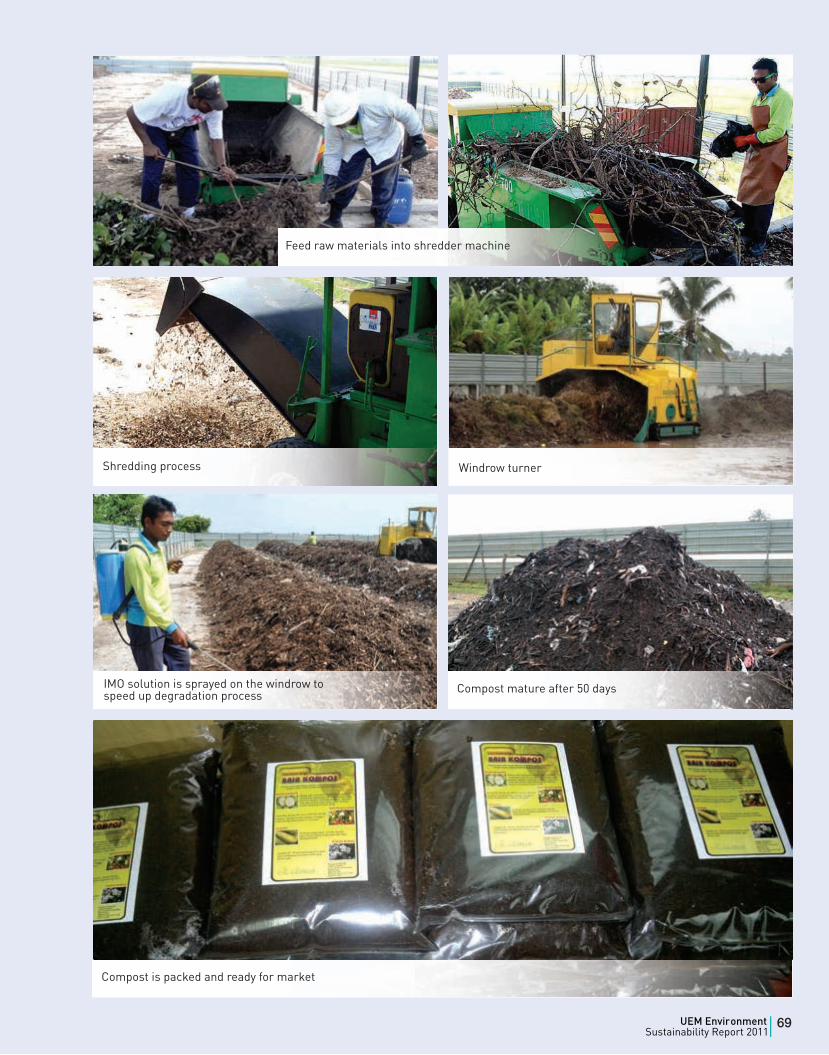
Windrow turnerShredding process
Compost mature after 50 days
Compost is packed and ready for market
IMO solution is sprayed on the windrow tospeed up degradation process
Feed raw materials into shredder machine
69UEM EnvironmentSustainability Report 2011|
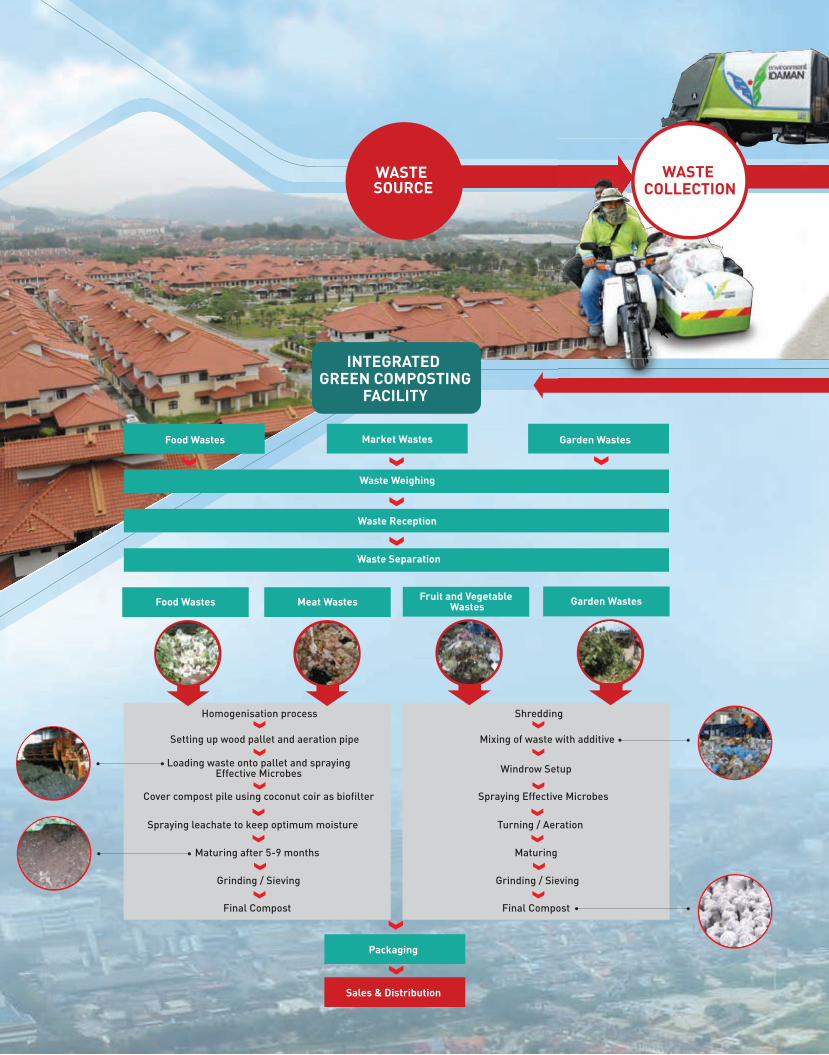
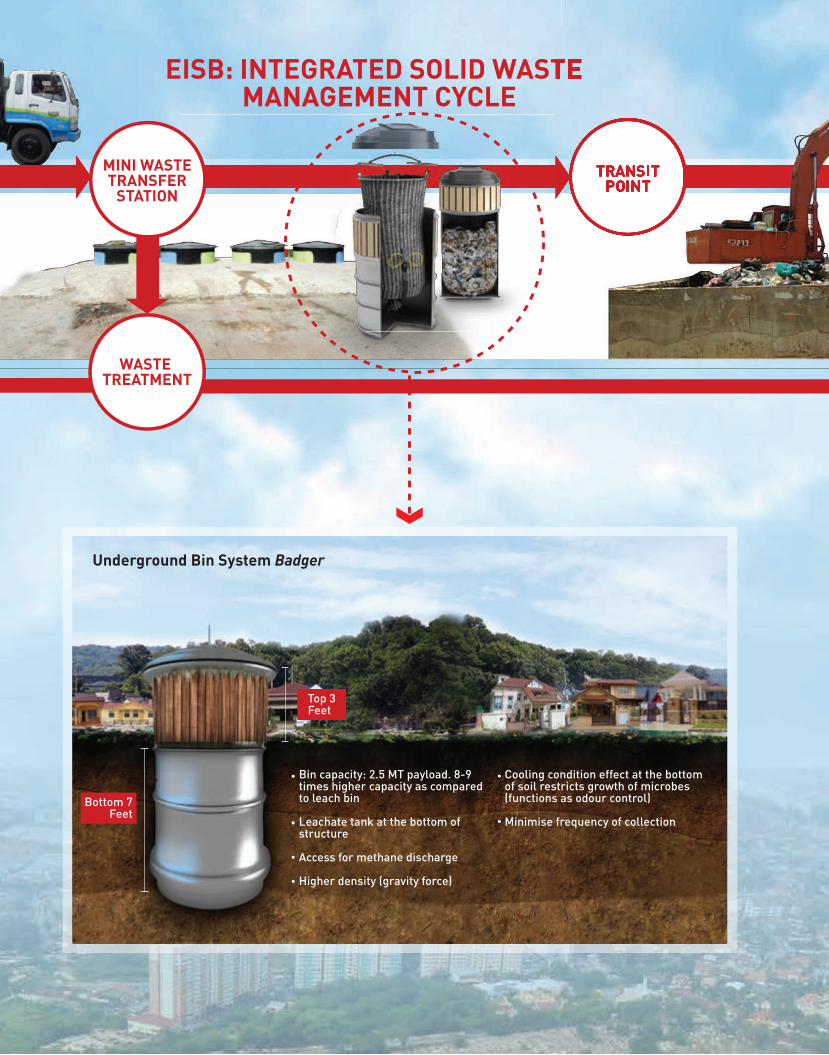
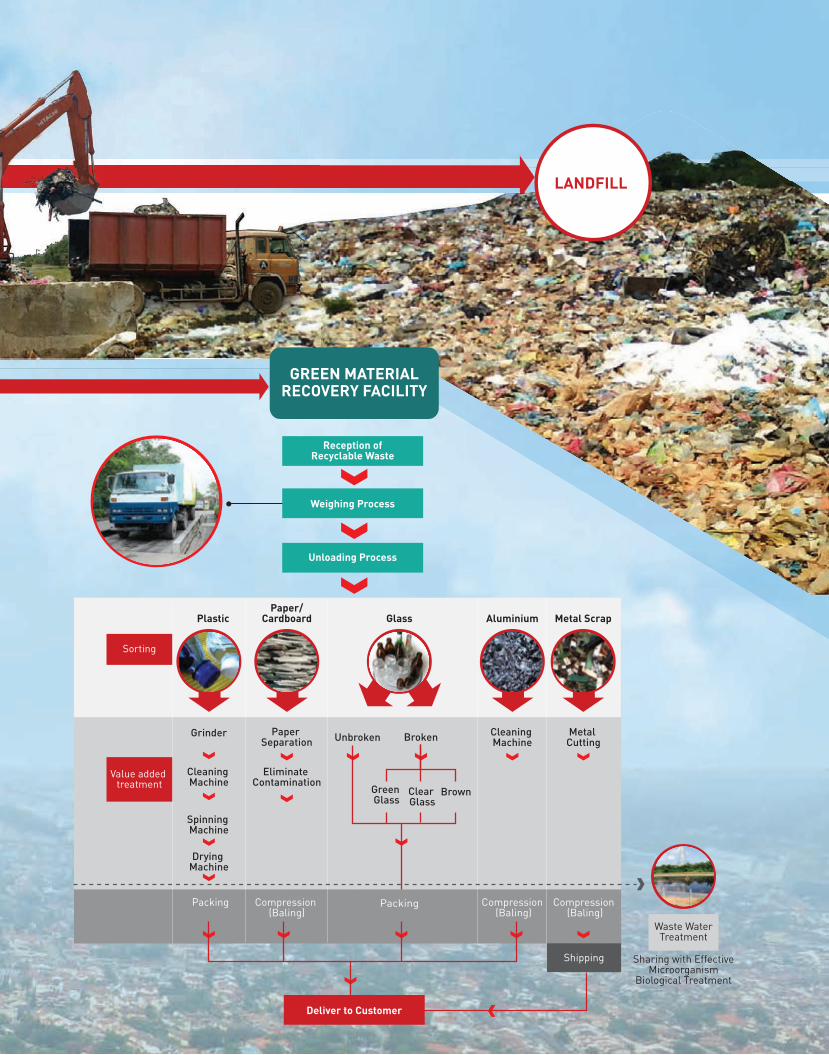
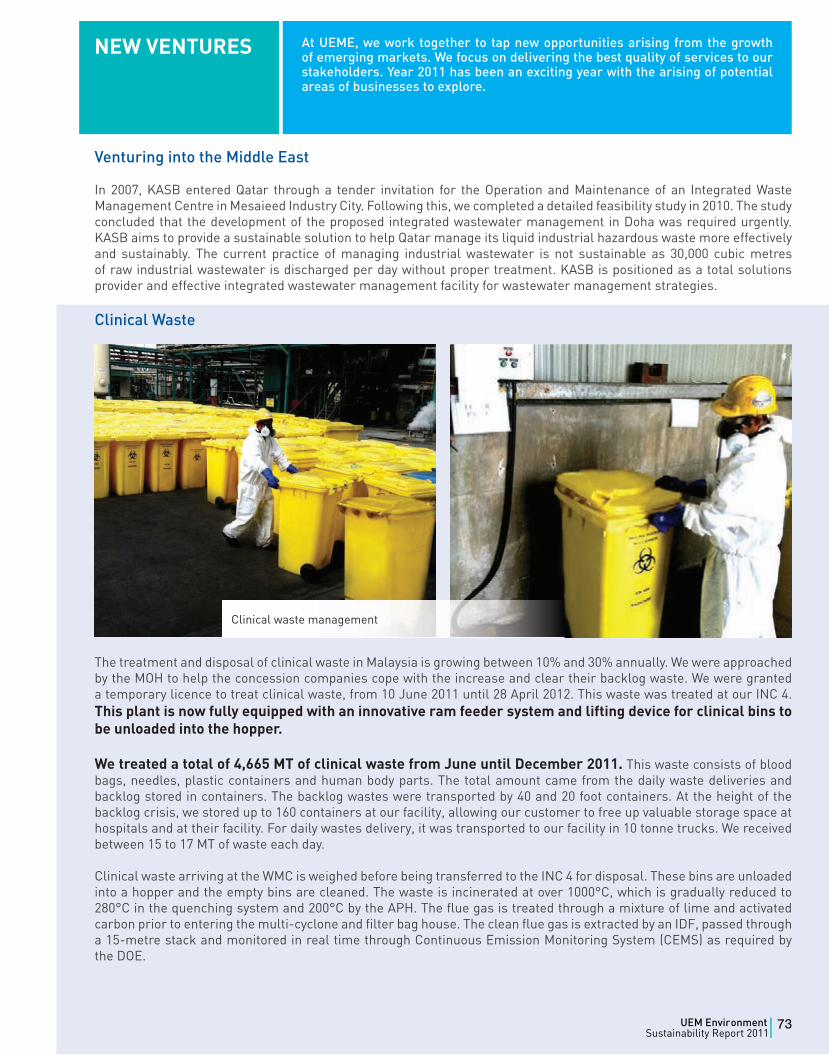
Venturing into the Middle East
In 2007, KASB entered Qatar through a tender invitation for the Operation and Maintenance of an Integrated Waste Management Centre in Mesaieed Industry City. Following this, we completed a detailed feasibility study in 2010. The study concluded that the development of the proposed integrated wastewater management in Doha was required urgently. KASB aims to provide a sustainable solution to help Qatar manage its liquid industrial hazardous waste more effectively and sustainably. The current practice of managing industrial wastewater is not sustainable as 30,000 cubic metres of raw industrial wastewater is discharged per day without proper treatment. KASB is positioned as a total solutions provider and effective integrated wastewater management facility for wastewater management strategies.
Clinical Waste
The treatment and disposal of clinical waste in Malaysia is growing between 10% and 30% annually. We were approached by the MOH to help the concession companies cope with the increase and clear their backlog waste. We were granted a temporary licence to treat clinical waste, from 10 June 2011 until 28 April 2012. This waste was treated at our INC 4. This plant is now fully equipped with an innovative ram feeder system and lifting device for clinical bins to be unloaded into the hopper.
We treated a total of 4,665 MT of clinical waste from June until December 2011. This waste consists of blood bags, needles, plastic containers and human body parts. The total amount came from the daily waste deliveries and backlog stored in containers. The backlog wastes were transported by 40 and 20 foot containers. At the height of the backlog crisis, we stored up to 160 containers at our facility, allowing our customer to free up valuable storage space at hospitals and at their facility. For daily wastes delivery, it was transported to our facility in 10 tonne trucks. We received between 15 to 17 MT of waste each day.
Clinical waste arriving at the WMC is weighed before being transferred to the INC 4 for disposal. These bins are unloaded into a hopper and the empty bins are cleaned. The waste is incinerated at over 1000°C, which is gradually reduced to 280°C in the quenching system and 200°C by the APH. The flue gas is treated through a mixture of lime and activated carbon prior to entering the multi-cyclone and filter bag house. The clean flue gas is extracted by an IDF, passed through a 15-metre stack and monitored in real time through Continuous Emission Monitoring System (CEMS) as required by the DOE.
NEW VENTURES At UEME, we work together to tap new opportunities arising from the growth of emerging markets. We focus on delivering the best quality of services to our stakeholders. Year 2011 has been an exciting year with the arising of potential areas of businesses to explore.
Clinical waste management
73UEM EnvironmentSustainability Report 2011|
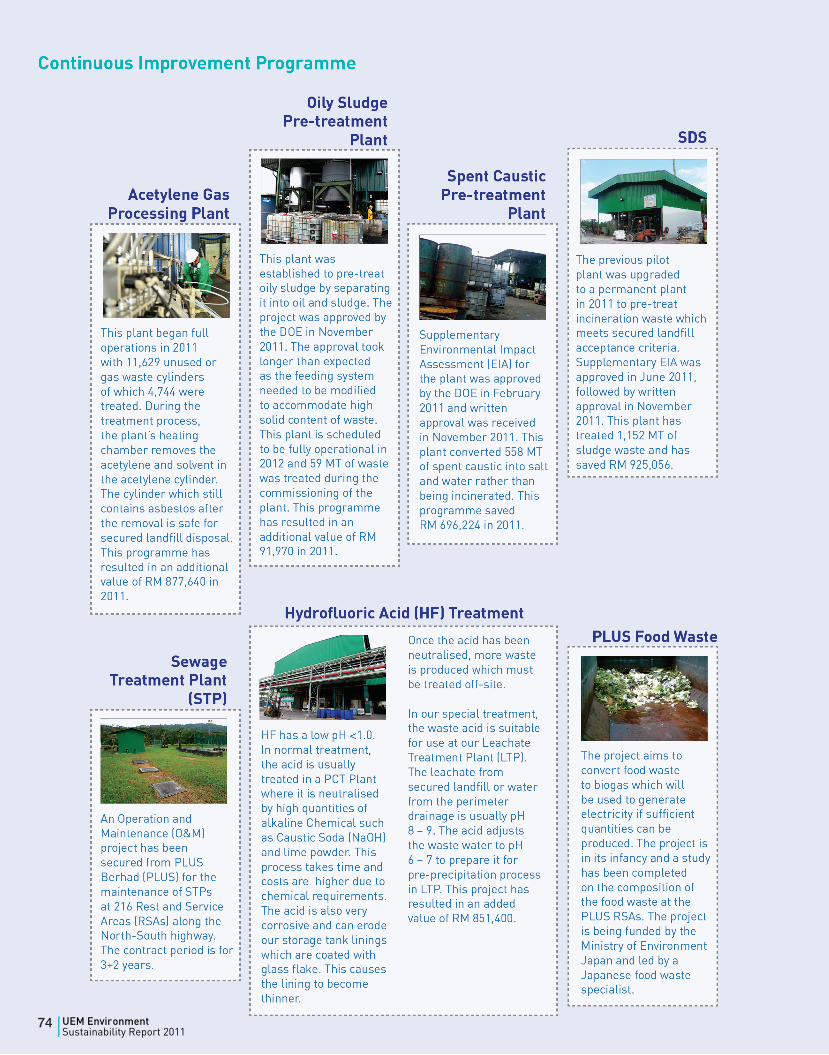
PLUS Food Waste
The project aims to convert food waste to biogas which will be used to generate electricity if sufficient quantities can be produced. The project is in its infancy and a study has been completed on the composition of the food waste at the PLUS RSAs. The project is being funded by the Ministry of Environment Japan and led by a Japanese food waste specialist.
This plant began full operations in 2011 with 11,629 unused or gas waste cylinders of which 4,744 were treated. During the treatment process, the plant’s heating chamber removes the acetylene and solvent in the acetylene cylinder. The cylinder which still contains asbestos after the removal is safe for secured landfill disposal. This programme has resulted in an additional value of RM 877,640 in 2011.
Acetylene Gas Processing Plant
Sewage Treatment Plant
(STP)
An Operation and Maintenance (O&M) project has been secured from PLUS Berhad (PLUS) for the maintenance of STPs at 216 Rest and Service Areas (RSAs) along the North-South highway. The contract period is for 3+2 years.
Spent Caustic Pre-treatment
Plant
Supplementary Environmental Impact Assessment (EIA) for the plant was approved by the DOE in February 2011 and written approval was received in November 2011. This plant converted 558 MT of spent caustic into salt and water rather than being incinerated. This programme saved RM 696,224 in 2011.
SDS
The previous pilot plant was upgraded to a permanent plant in 2011 to pre-treat incineration waste which meets secured landfill acceptance criteria. Supplementary EIA was approved in June 2011, followed by written approval in November 2011. This plant has treated 1,152 MT of sludge waste and has saved RM 925,056.
This plant was established to pre-treat oily sludge by separating it into oil and sludge. The project was approved by the DOE in November 2011. The approval took longer than expected as the feeding system needed to be modified to accommodate high solid content of waste. This plant is scheduled to be fully operational in 2012 and 59 MT of waste was treated during the commissioning of the plant. This programme has resulted in an additional value of RM 91,970 in 2011.
Oily Sludge Pre-treatment
Plant
Once the acid has been neutralised, more waste is produced which must be treated off-site.
In our special treatment, the waste acid is suitable for use at our Leachate Treatment Plant (LTP). The leachate from secured landfill or water from the perimeter drainage is usually pH 8 – 9. The acid adjusts the waste water to pH 6 – 7 to prepare it for pre-precipitation process in LTP. This project has resulted in an added value of RM 851,400.
Hydrofluoric Acid (HF) Treatment
HF has a low pH <1.0. In normal treatment, the acid is usually treated in a PCT Plant where it is neutralised by high quantities of alkaline Chemical such as Caustic Soda (NaOH) and lime powder. This process takes time and costs are higher due to chemical requirements. The acid is also very corrosive and can erode our storage tank linings which are coated with glass flake. This causes the lining to become thinner.
Continuous Improvement Programme
74 UEM EnvironmentSustainability Report 2011|
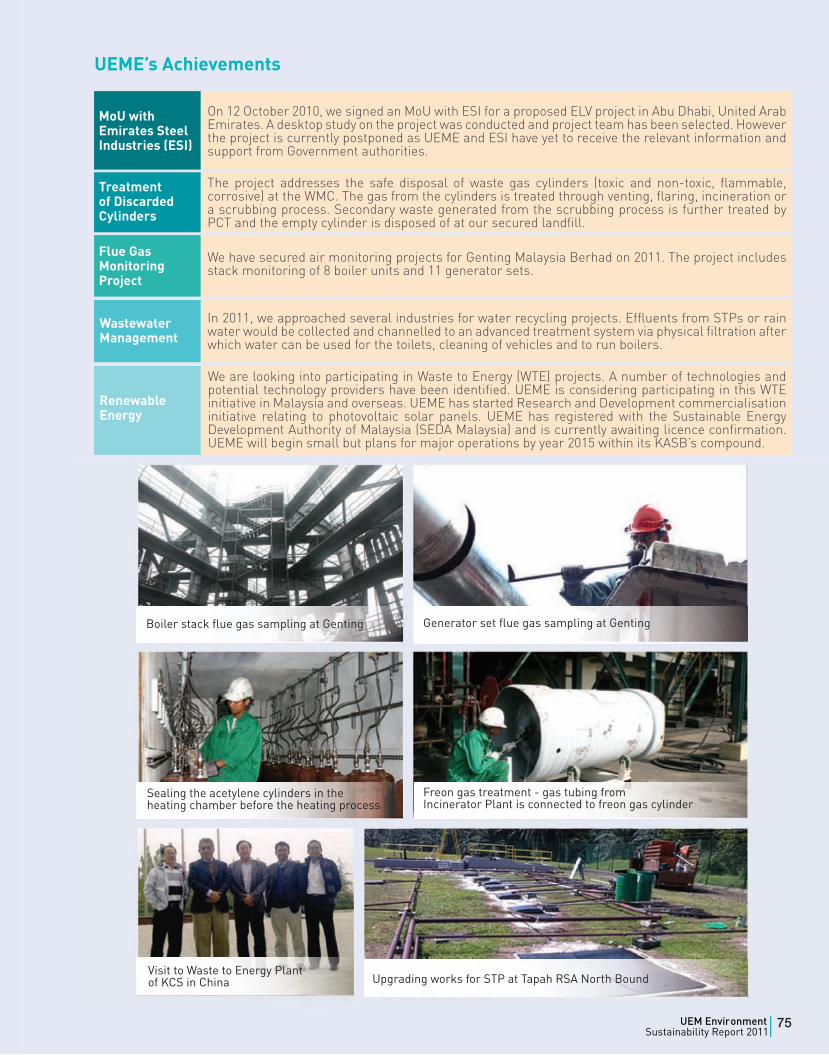
UEME’s Achievements
We are looking into participating in Waste to Energy (WTE) projects. A number of technologies and potential technology providers have been identified. UEME is considering participating in this WTE initiative in Malaysia and overseas. UEME has started Research and Development commercialisation initiative relating to photovoltaic solar panels. UEME has registered with the Sustainable Energy Development Authority of Malaysia (SEDA Malaysia) and is currently awaiting licence confirmation. UEME will begin small but plans for major operations by year 2015 within its KASB’s compound.
MoU with Emirates Steel Industries (ESI)
Treatment of Discarded Cylinders
Flue Gas Monitoring Project
Wastewater Management
Renewable Energy
On 12 October 2010, we signed an MoU with ESI for a proposed ELV project in Abu Dhabi, United Arab Emirates. A desktop study on the project was conducted and project team has been selected. However the project is currently postponed as UEME and ESI have yet to receive the relevant information and support from Government authorities.
The project addresses the safe disposal of waste gas cylinders (toxic and non-toxic, flammable, corrosive) at the WMC. The gas from the cylinders is treated through venting, flaring, incineration or a scrubbing process. Secondary waste generated from the scrubbing process is further treated by PCT and the empty cylinder is disposed of at our secured landfill.
We have secured air monitoring projects for Genting Malaysia Berhad on 2011. The project includes stack monitoring of 8 boiler units and 11 generator sets.
In 2011, we approached several industries for water recycling projects. Effluents from STPs or rain water would be collected and channelled to an advanced treatment system via physical filtration after which water can be used for the toilets, cleaning of vehicles and to run boilers.
Boiler stack flue gas sampling at Genting Generator set flue gas sampling at Genting
Freon gas treatment - gas tubing fromIncinerator Plant is connected to freon gas cylinder
Upgrading works for STP at Tapah RSA North BoundVisit to Waste to Energy Plant of KCS in China
Sealing the acetylene cylinders in the heating chamber before the heating process
75UEM EnvironmentSustainability Report 2011|
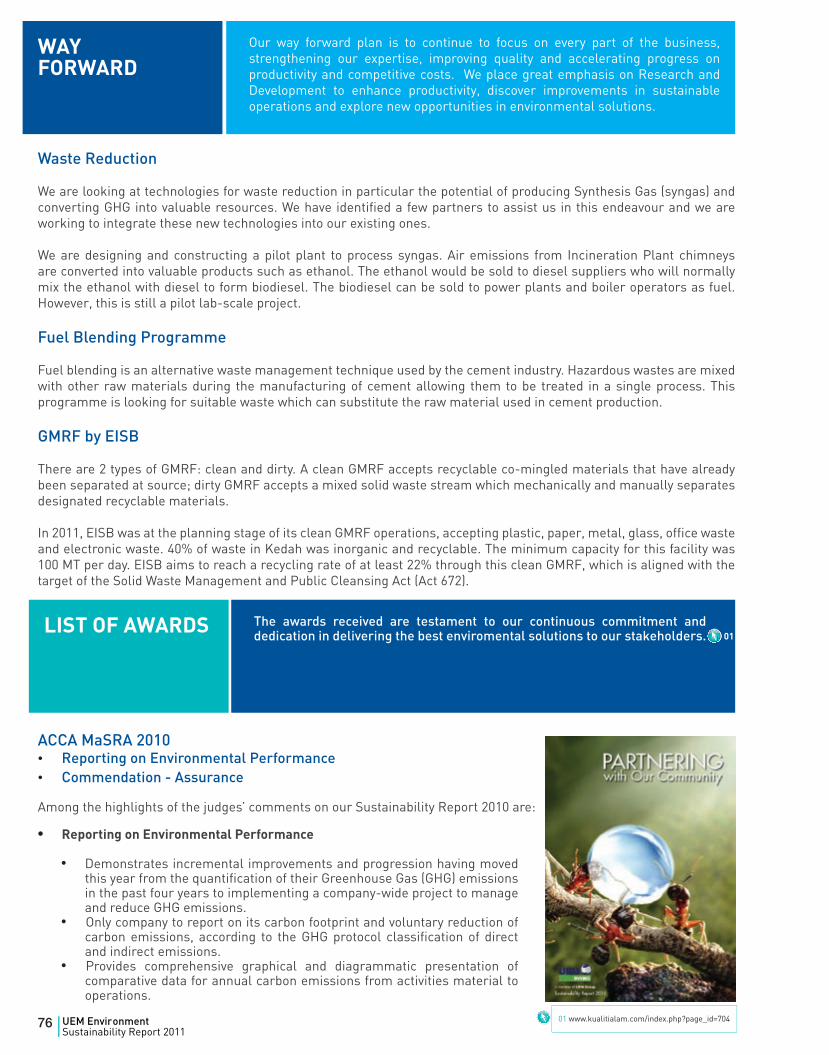
ACCA MaSRA 2010 • Reporting on Environmental Performance• Commendation - Assurance
Among the highlights of the judges’ comments on our Sustainability Report 2010 are:
Waste Reduction
We are looking at technologies for waste reduction in particular the potential of producing Synthesis Gas (syngas) and converting GHG into valuable resources. We have identified a few partners to assist us in this endeavour and we are working to integrate these new technologies into our existing ones. We are designing and constructing a pilot plant to process syngas. Air emissions from Incineration Plant chimneys are converted into valuable products such as ethanol. The ethanol would be sold to diesel suppliers who will normally mix the ethanol with diesel to form biodiesel. The biodiesel can be sold to power plants and boiler operators as fuel. However, this is still a pilot lab-scale project.
Fuel Blending Programme
Fuel blending is an alternative waste management technique used by the cement industry. Hazardous wastes are mixed with other raw materials during the manufacturing of cement allowing them to be treated in a single process. This programme is looking for suitable waste which can substitute the raw material used in cement production.
GMRF by EISB
There are 2 types of GMRF: clean and dirty. A clean GMRF accepts recyclable co-mingled materials that have already been separated at source; dirty GMRF accepts a mixed solid waste stream which mechanically and manually separates designated recyclable materials.
In 2011, EISB was at the planning stage of its clean GMRF operations, accepting plastic, paper, metal, glass, office waste and electronic waste. 40% of waste in Kedah was inorganic and recyclable. The minimum capacity for this facility was 100 MT per day. EISB aims to reach a recycling rate of at least 22% through this clean GMRF, which is aligned with the target of the Solid Waste Management and Public Cleansing Act (Act 672).
LIST OF AWARDS The awards received are testament to our continuous commitment and dedication in delivering the best enviromental solutions to our stakeholders.
• Reporting on Environmental Performance
• Demonstrates incremental improvements and progression having moved this year from the quantification of their Greenhouse Gas (GHG) emissions in the past four years to implementing a company-wide project to manage and reduce GHG emissions.
• Only company to report on its carbon footprint and voluntary reduction of carbon emissions, according to the GHG protocol classification of direct and indirect emissions.
• Provides comprehensive graphical and diagrammatic presentation of comparative data for annual carbon emissions from activities material to operations.
01 www.kualitialam.com/index.php?page_id=704
01
WAYFORWARD
Our way forward plan is to continue to focus on every part of the business, strengthening our expertise, improving quality and accelerating progress on productivity and competitive costs. We place great emphasis on Research and Development to enhance productivity, discover improvements in sustainable operations and explore new opportunities in environmental solutions.
76 UEM EnvironmentSustainability Report 2011|
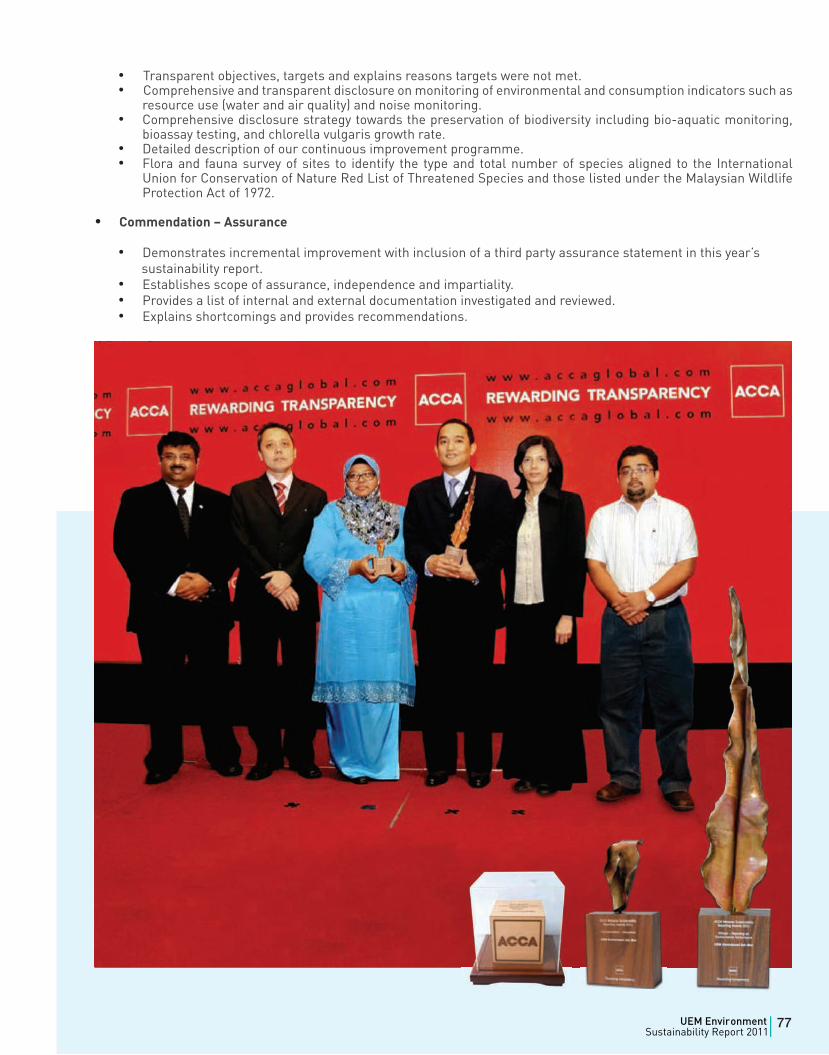
• Transparent objectives, targets and explains reasons targets were not met.• Comprehensive and transparent disclosure on monitoring of environmental and consumption indicators such as
resource use (water and air quality) and noise monitoring.• Comprehensive disclosure strategy towards the preservation of biodiversity including bio-aquatic monitoring,
bioassay testing, and chlorella vulgaris growth rate.• Detailed description of our continuous improvement programme.• Flora and fauna survey of sites to identify the type and total number of species aligned to the International
Union for Conservation of Nature Red List of Threatened Species and those listed under the Malaysian Wildlife Protection Act of 1972.
• Commendation – Assurance
• Demonstrates incremental improvement with inclusion of a third party assurance statement in this year’s sustainability report.• Establishes scope of assurance, independence and impartiality.• Provides a list of internal and external documentation investigated and reviewed.• Explains shortcomings and provides recommendations.
77UEM EnvironmentSustainability Report 2011|
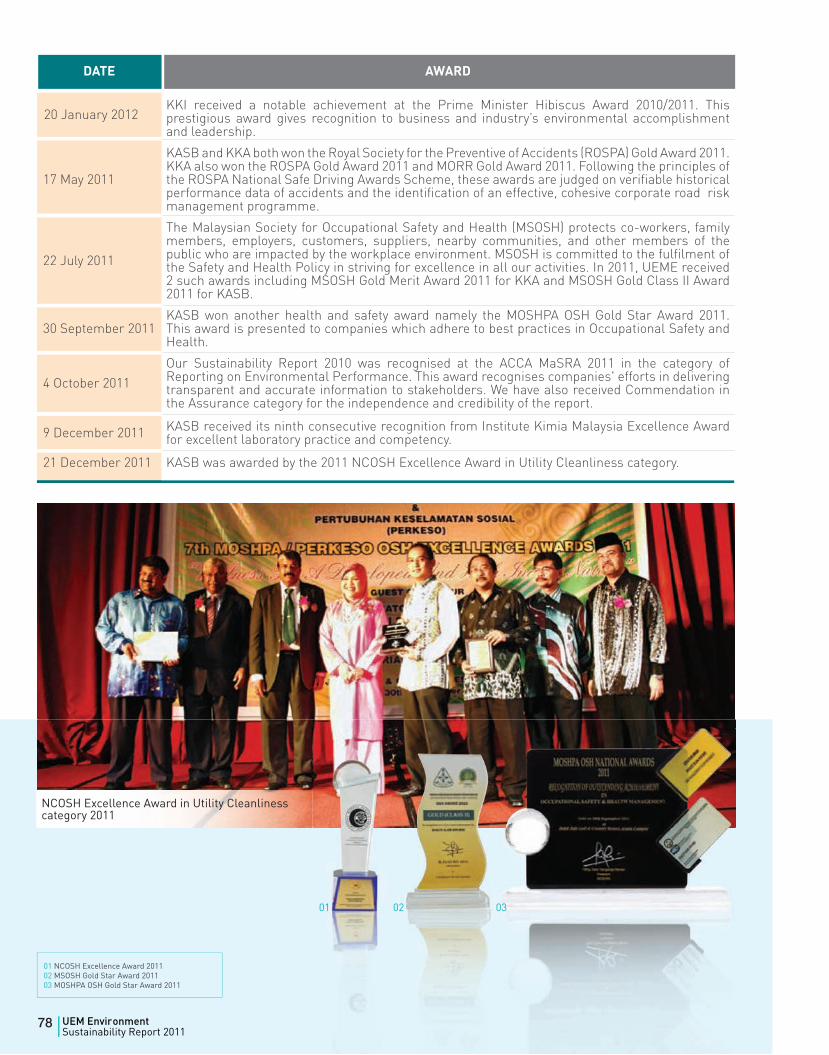
DATE AWARD
KKI received a notable achievement at the Prime Minister Hibiscus Award 2010/2011. This prestigious award gives recognition to business and industry’s environmental accomplishment and leadership.
17 May 2011
KASB and KKA both won the Royal Society for the Preventive of Accidents (ROSPA) Gold Award 2011. KKA also won the ROSPA Gold Award 2011 and MORR Gold Award 2011. Following the principles of the ROSPA National Safe Driving Awards Scheme, these awards are judged on verifiable historical performance data of accidents and the identification of an effective, cohesive corporate road risk management programme.
22 July 2011
The Malaysian Society for Occupational Safety and Health (MSOSH) protects co-workers, family members, employers, customers, suppliers, nearby communities, and other members of the public who are impacted by the workplace environment. MSOSH is committed to the fulfilment of the Safety and Health Policy in striving for excellence in all our activities. In 2011, UEME received 2 such awards including MSOSH Gold Merit Award 2011 for KKA and MSOSH Gold Class II Award 2011 for KASB.
30 September 2011KASB won another health and safety award namely the MOSHPA OSH Gold Star Award 2011. This award is presented to companies which adhere to best practices in Occupational Safety and Health.
4 October 2011Our Sustainability Report 2010 was recognised at the ACCA MaSRA 2011 in the category of Reporting on Environmental Performance. This award recognises companies' efforts in delivering transparent and accurate information to stakeholders. We have also received Commendation in the Assurance category for the independence and credibility of the report.
9 December 2011 KASB received its ninth consecutive recognition from Institute Kimia Malaysia Excellence Award for excellent laboratory practice and competency.
21 December 2011 KASB was awarded by the 2011 NCOSH Excellence Award in Utility Cleanliness category.
20 January 2012
NCOSH Excellence Award in Utility Cleanliness category 2011
01 NCOSH Excellence Award 201102 MSOSH Gold Star Award 201103 MOSHPA OSH Gold Star Award 2011
01 02 03
78 UEM EnvironmentSustainability Report 2011|
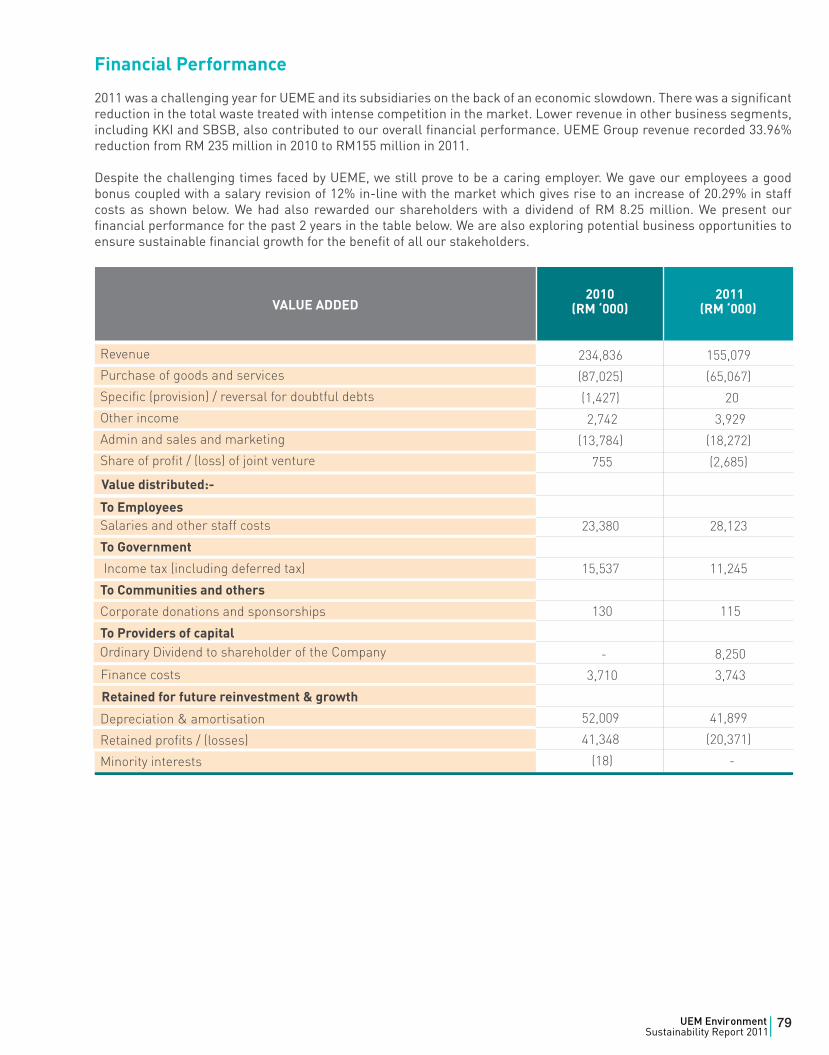
Financial Performance
2011 was a challenging year for UEME and its subsidiaries on the back of an economic slowdown. There was a significant reduction in the total waste treated with intense competition in the market. Lower revenue in other business segments, including KKI and SBSB, also contributed to our overall financial performance. UEME Group revenue recorded 33.96% reduction from RM 235 million in 2010 to RM155 million in 2011.
Despite the challenging times faced by UEME, we still prove to be a caring employer. We gave our employees a good bonus coupled with a salary revision of 12% in-line with the market which gives rise to an increase of 20.29% in staff costs as shown below. We had also rewarded our shareholders with a dividend of RM 8.25 million. We present our financial performance for the past 2 years in the table below. We are also exploring potential business opportunities to ensure sustainable financial growth for the benefit of all our stakeholders.
VALUE ADDED
Revenue
Purchase of goods and services
Specific (provision) / reversal for doubtful debts
Other income
Admin and sales and marketing
Share of profit / (loss) of joint venture
Salaries and other staff costs
To Government
Income tax (including deferred tax)
To Communities and others
Corporate donations and sponsorships
To Providers of capital
Depreciation & amortisation
Retained profits / (losses)
Minority interests
2010(RM ‘000)
2011(RM ‘000)
234,836
(87,025)
(1,427)
2,742
(13,784)
755
23,380
15,537
130
-
3,710
52,009
41,348
(18)
155,079
(65,067)
20
3,929
(18,272)
(2,685)
28,123
11,245
115
8,250
3,743
41,899
(20,371)
-
Retained for future reinvestment & growth
To Employees
Ordinary Dividend to shareholder of the Company
Value distributed:-
Finance costs
79UEM EnvironmentSustainability Report 2011|
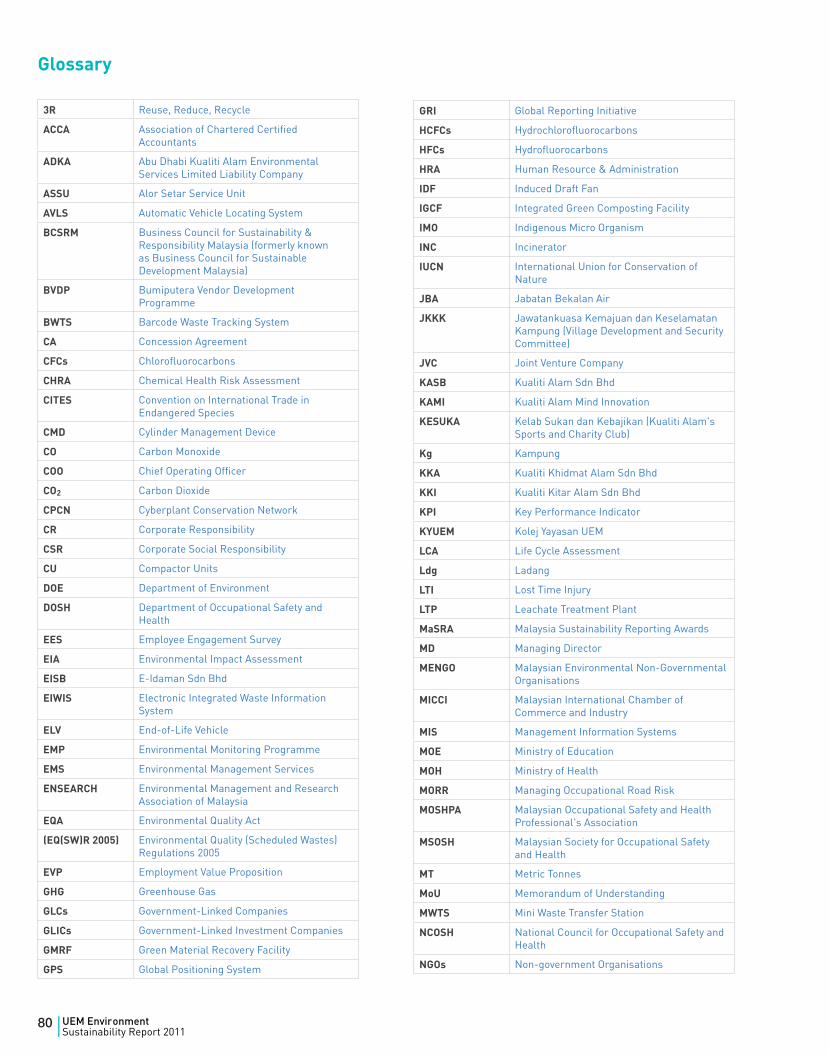
Glossary
3R Reuse, Reduce, Recycle
ACCA Association of Chartered Certified Accountants
ADKA Abu Dhabi Kualiti Alam Environmental Services Limited Liability Company
ASSU Alor Setar Service Unit
AVLS Automatic Vehicle Locating System
BCSRM Business Council for Sustainability & Responsibility Malaysia (formerly known as Business Council for Sustainable Development Malaysia)
BVDP Bumiputera Vendor Development Programme
BWTS Barcode Waste Tracking System
CA Concession Agreement
CFCs Chlorofluorocarbons
CHRA Chemical Health Risk Assessment
CITES Convention on International Trade in Endangered Species
CMD Cylinder Management Device
CO Carbon Monoxide
COO Chief Operating Officer
CO2 Carbon Dioxide
CPCN Cyberplant Conservation Network
CR Corporate Responsibility
CSR Corporate Social Responsibility
CU Compactor Units
DOE Department of Environment
DOSH Department of Occupational Safety and Health
EES Employee Engagement Survey
EIA Environmental Impact Assessment
EISB E-Idaman Sdn Bhd
EIWIS Electronic Integrated Waste Information System
ELV End-of-Life Vehicle
EMP Environmental Monitoring Programme
EMS Environmental Management Services
ENSEARCH Environmental Management and Research Association of Malaysia
EQA Environmental Quality Act
(EQ(SW)R 2005) Environmental Quality (Scheduled Wastes) Regulations 2005
EVP Employment Value Proposition
GHG Greenhouse Gas
GLCs Government-Linked Companies
GLICs Government-Linked Investment Companies
GMRF Green Material Recovery Facility
GPS Global Positioning System
GRI Global Reporting Initiative
HCFCs Hydrochlorofluorocarbons
HFCs Hydrofluorocarbons
HRA Human Resource & Administration
IDF Induced Draft Fan
IGCF Integrated Green Composting Facility
IMO Indigenous Micro Organism
INC Incinerator
IUCN International Union for Conservation of Nature
JBA Jabatan Bekalan Air
JKKK Jawatankuasa Kemajuan dan Keselamatan Kampung (Village Development and Security Committee)
JVC Joint Venture Company
KASB Kualiti Alam Sdn Bhd
KAMI Kualiti Alam Mind Innovation
KESUKA Kelab Sukan dan Kebajikan (Kualiti Alam's Sports and Charity Club)
Kg Kampung
KKA Kualiti Khidmat Alam Sdn Bhd
KKI Kualiti Kitar Alam Sdn Bhd
KPI Key Performance Indicator
KYUEM Kolej Yayasan UEM
LCA Life Cycle Assessment
Ldg Ladang
LTI Lost Time Injury
LTP Leachate Treatment Plant
MaSRA Malaysia Sustainability Reporting Awards
MD Managing Director
MENGO Malaysian Environmental Non-Governmental Organisations
MICCI Malaysian International Chamber of Commerce and Industry
MIS Management Information Systems
MOE Ministry of Education
MOH Ministry of Health
MORR Managing Occupational Road Risk
MOSHPA Malaysian Occupational Safety and Health Professional's Association
MSOSH Malaysian Society for Occupational Safety and Health
MT Metric Tonnes
MoU Memorandum of Understanding
MWTS Mini Waste Transfer Station
NCOSH National Council for Occupational Safety and Health
NGOs Non-government Organisations
80 UEM EnvironmentSustainability Report 2011|
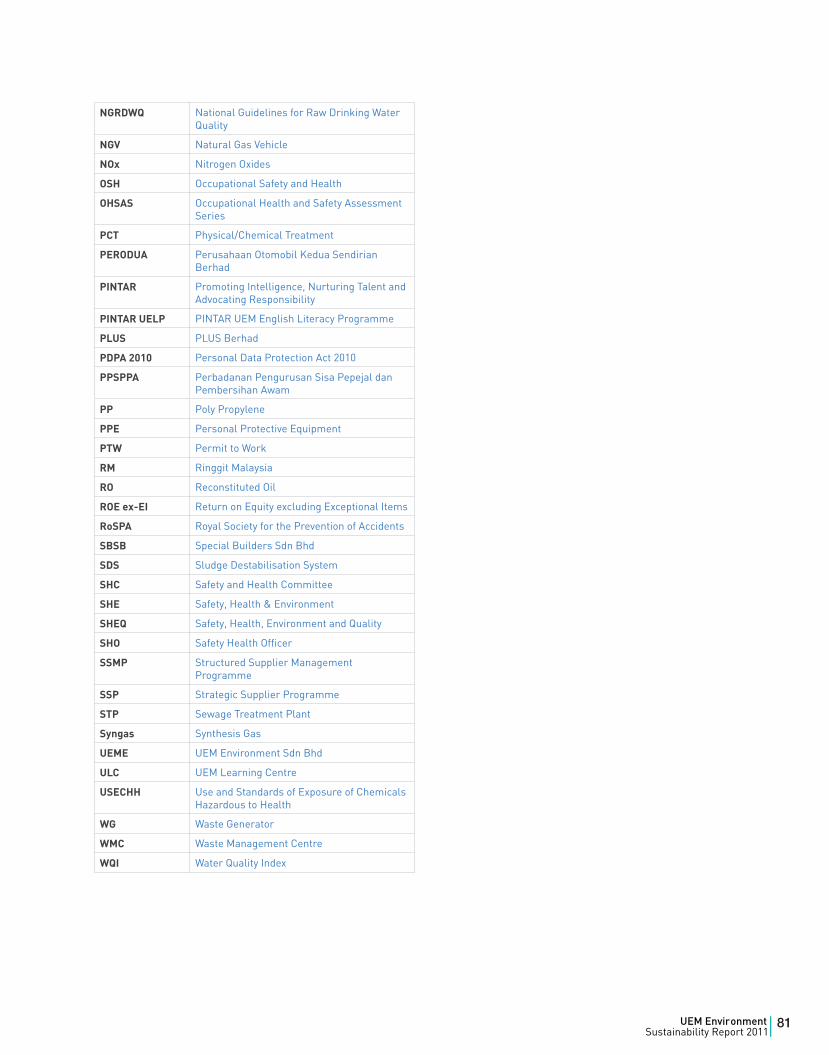
NGRDWQ National Guidelines for Raw Drinking Water Quality
NGV Natural Gas Vehicle
NOx Nitrogen Oxides
OSH Occupational Safety and Health
OHSAS Occupational Health and Safety Assessment Series
PCT Physical/Chemical Treatment
PERODUA Perusahaan Otomobil Kedua Sendirian Berhad
PINTAR Promoting Intelligence, Nurturing Talent and Advocating Responsibility
PINTAR UELP PINTAR UEM English Literacy Programme
PLUS PLUS Berhad
PDPA 2010 Personal Data Protection Act 2010
PPSPPA Perbadanan Pengurusan Sisa Pepejal dan Pembersihan Awam
PP Poly Propylene
PPE Personal Protective Equipment
PTW Permit to Work
RM Ringgit Malaysia
RO Reconstituted Oil
ROE ex-EI Return on Equity excluding Exceptional Items
RoSPA Royal Society for the Prevention of Accidents
SBSB Special Builders Sdn Bhd
SDS Sludge Destabilisation System
SHC Safety and Health Committee
SHE Safety, Health & Environment
SHEQ Safety, Health, Environment and Quality
SHO Safety Health Officer
SSMP Structured Supplier Management Programme
SSP Strategic Supplier Programme
STP Sewage Treatment Plant
Syngas Synthesis Gas
UEME UEM Environment Sdn Bhd
ULC UEM Learning Centre
USECHH Use and Standards of Exposure of Chemicals Hazardous to Health
WG Waste Generator
WMC Waste Management Centre
WQI Water Quality Index
81UEM EnvironmentSustainability Report 2011|
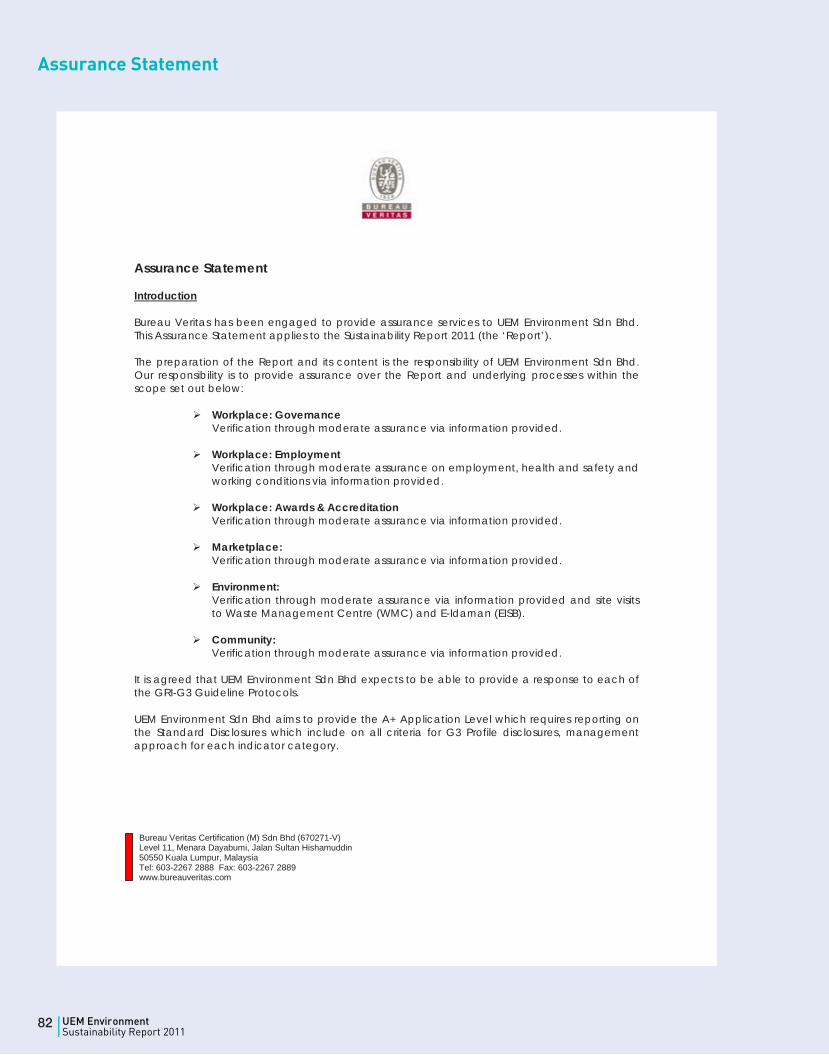
Assurance Statement
Bureau Veritas Certification (M) Sdn Bhd (670271-V)Level 11, Menara Dayabumi, Jalan Sultan Hishamuddin50550 Kuala Lumpur, MalaysiaTel: 603-2267 2888 Fax: 603-2267 2889www.bureauveritas.com
Assurance Statement
Introduction
Bureau Veritas has been engaged to provide assurance services to UEM Environment Sdn Bhd. This Assurance Statement applies to the Sustainability Report 2011 (the ‘Report’).
The preparation of the Report and its content is the responsibility of UEM Environment Sdn Bhd. Our responsibility is to provide assurance over the Report and underlying processes within the scope set out below:
Workplace: GovernanceVerification through moderate assurance via information provided.
Workplace: EmploymentVerification through moderate assurance on employment, health and safety and working conditions via information provided.
Workplace: Awards & AccreditationVerification through moderate assurance via information provided.
Marketplace:Verification through moderate assurance via information provided.
Environment: Verification through moderate assurance via information provided and site visits to Waste Management Centre (WMC) and E-Idaman (EISB).
Community:Verification through moderate assurance via information provided.
It is agreed that UEM Environment Sdn Bhd expects to be able to provide a response to each of the GRI-G3 Guideline Protocols.
UEM Environment Sdn Bhd aims to provide the A+ Application Level which requires reporting on the Standard Disclosures which include on all criteria for G3 Profile disclosures, management approach for each indicator category.
82 UEM EnvironmentSustainability Report 2011|
Bureau Veritas Certification (M) Sdn Bhd (670271-V)Level 11, Menara Dayabumi, Jalan Sultan Hishamuddin50550 Kuala Lumpur, MalaysiaTel: 603-2267 2888 Fax: 603-2267 2889www.bureauveritas.com
Exclusions from the scope of our work
Excluded from the scope of our work is information relating to:
Statements of commitment to, or intention to, undertake action in the future;
Statements of opinion, belief and / or aspiration;
Our assurance does not extend to the information hyper linked from the Report.
Basis of our opinion
In conducting this engagement we have considered the following guiding principles:
The principles of materiality, stakeholder inclusiveness, sustainability context, completeness, balance, comparability, accuracy, timeliness, clarity, relevance and reliability as per Sustainable Reporting Guideline version 3.1 (GRI-G3).
Our work was planned and carried out to provide reasonable, rather than absolute, assurance and we believe that the work conducted as described in the scope of work above provides a reasonable basis for our conclusions.
We relied on the representations made to us during the course of our assurance work by UEM Environment Sdn Bhd personnel and the audited financial statement 2011 by Ernst & Young.
Where we have provided assurance over numeric information, this has been achieved through review of consolidation processes and databases held at the Headquarters, UEM Environment Sdn Bhd, 13-1, Mercu UEM, Jalan Stesen Sentral 5, Kuala Lumpur Sentral, 50470 Kuala Lumpur, Malaysia.
This work is not considered sufficient for us to identify all misstatements.
Our review included the following activities:Interviewed with relevant staff at corporate and operation levels responsible for the information in the Report;
A review of internal and external documentation and displays such as awards, photos and pictures, minutes of meeting, TNB electricity bill, Syarikat Air Darul Aman water bill, statement account listing, Lembaga Air Perak, http:///www.kualitialam.com, Smartpay statement, debit note, Group human resource monthly report, training calendar 2011, receipts, data for RO & diesel consumption, environmental monitoring report for Kualiti Alam Waste Management Centre, electricity consumption summary, Syarikat Air Darul Aman, laporan data kutipan, World Resource Institute, 2006 IPCC guidelines for greenhouse gas inventories,
83UEM EnvironmentSustainability Report 2011|
Bureau Veritas Certification (M) Sdn Bhd (670271-V)Level 11, Menara Dayabumi, Jalan Sultan Hishamuddin50550 Kuala Lumpur, MalaysiaTel: 603-2267 2888 Fax: 603-2267 2889www.bureauveritas.com
www.terrapass.com, Green Tag, invitation letters, variance analysis reports, emsexpenditures, risk management committee members list, risk management report, invoice, consignment notes, reports, attendance list, Kosmo, Sinar Harian, Sin Chew, Bernama, Berita Minggu, STAR, online Berita Harian, recruitment log book, manpower rationalization report, SHC chart, incident statistic, incident investigation report, LTI mhrs, emails, memo, KA scheduled waste management guide, vendor assessment report, managing occupational risk live audit report, corrective action report, maintenance and service agreement, PRsummary, monthly power consumption 2011, electricity and water expenses, trees inventory, transfer ticket, daily treatment report, inventory of cylinder collection, sustainability report 2010, summary operation report 2011, e-perolehan MOF, weigh bridge ticket, summary of PPI, daily operation report, detailed feasibility study report 2010, summary clinical waste report, EIWIs system, weekly update acetylene plant, treatment file, PNL account, purchase order, bulletin, group statement of comprehensive income 2011, etc.
A review of the underlying systems and procedures used to collect and process the reported information, including the aggregation of data into the information in the Report;
A review of the reliability of the quantitative and qualitative information in the Report based on sampling;
Visited Waste Management Centre (WMC) office and E-Idaman HQ office and Alor Star Service Unit office to review the data collection process and implementation evidence on reported statements in the Report;
Challenged the related statements and claims made in the Report.
During our investigation we discussed the necessary changes in the Report with UEM Environment Sdn Bhd and determined that these changes have been adequately incorporated into the final version.
Conclusions
In our opinion, the report fulfills the A+ requirements of the GRI Sustainability Reporting Guidelines (Version 3.1).
During the course of our review nothing came to our attention to indicate that there was any material error, omission or misstatement. It is Bureau Veritas’ opinion that the statements in the Report are accurate and reliable based on UEM Environment Sdn Bhd presented data.
The Report provides a fair representation of UEM Environment Sdn Bhd’s sustainability reporting activity for the period from 1st January 2011 up to the data collection deadline on 31st December 2011.
84 UEM EnvironmentSustainability Report 2011|
Bureau Veritas Certification (M) Sdn Bhd (670271-V)Level 11, Menara Dayabumi, Jalan Sultan Hishamuddin50550 Kuala Lumpur, MalaysiaTel: 603-2267 2888 Fax: 603-2267 2889www.bureauveritas.com
Areas for ongoing improvement
The company could consider for inviting the verification body to observe any engagements or programmes to be conducted for the following year.
Considerations and limitations
In relation to our assurance work and conclusions, the following considerations and limitations should be noted:
Certain information is excluded from the scope of our assurance work, as stated above;
Environmental and social data are subject to inherent limitations due to its nature and the methods used for determining, calculating or estimating such data. Therefore this independent assurance statement should not be relied upon to detect all errors, omissions or misstatements in the Report, nor can it guarantee the quality of social accounting and reporting processes. We have provided reasonable assurance as to the quality and accuracy of the report within the scope of our investigations.
16th May 2012
Statement by Bureau Veritas of independence, impartiality and competence
Bureau Veritas is an independent professional services company that specialises in Quality, Health, Safety, Social and Environmental management with over 180 years history in providing independent assurance services.
Bureau Veritas has implemented a code of ethics across the business that is intended to ensure that all our staffs maintain high ethical standards in their day-to-day business activities; we are particularly vigilant in the prevention of conflicts of interest.
Competence: Our assurance teams completing the work for the Sustainability Report have extensive experience in conducting assurance over environmental, social, ethical and health and safety information, systems and processes and an excellent understanding of good practice in Corporate Responsibility reporting and assurance.
85UEM EnvironmentSustainability Report 2011|
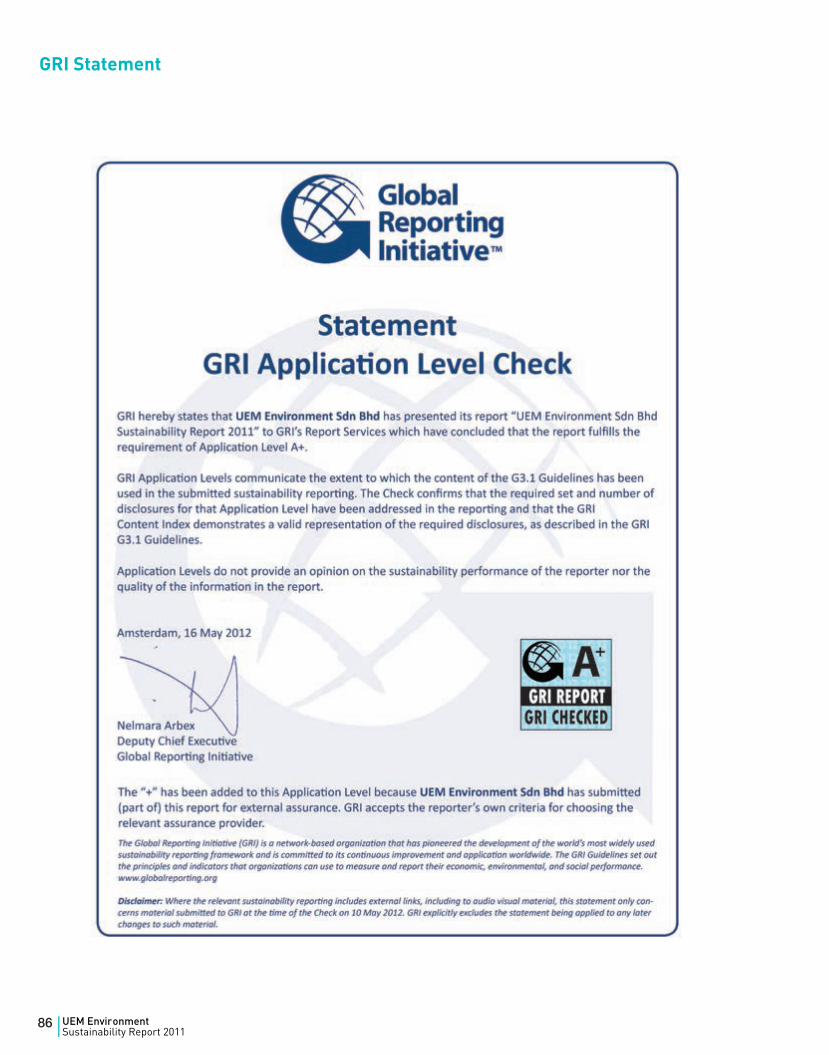
GRI Statement
86 UEM EnvironmentSustainability Report 2011|
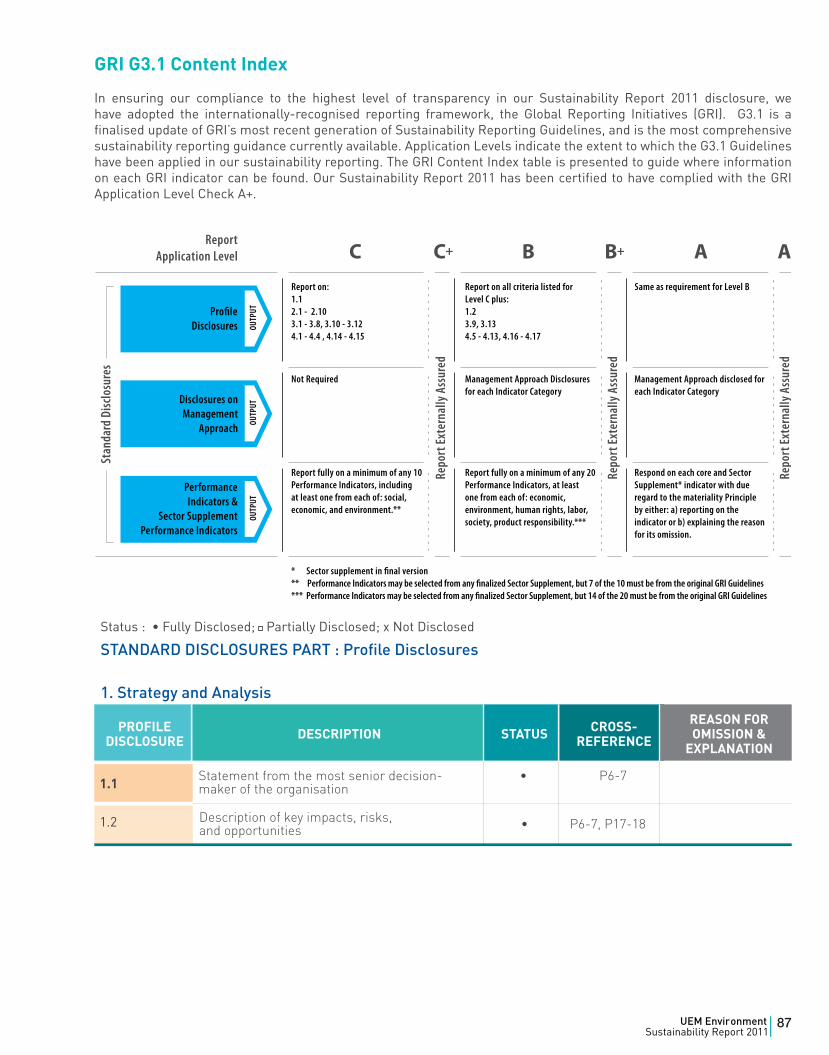
1.1 Statement from the most senior decision-maker of the organisation
• P6-7
GRI G3.1 Content Index
In ensuring our compliance to the highest level of transparency in our Sustainability Report 2011 disclosure, we have adopted the internationally-recognised reporting framework, the Global Reporting Initiatives (GRI). G3.1 is a finalised update of GRI’s most recent generation of Sustainability Reporting Guidelines, and is the most comprehensive sustainability reporting guidance currently available. Application Levels indicate the extent to which the G3.1 Guidelines have been applied in our sustainability reporting. The GRI Content Index table is presented to guide where information on each GRI indicator can be found. Our Sustainability Report 2011 has been certified to have complied with the GRI Application Level Check A+.
Status:•FullyDisclosed; Partially Disclosed; x Not Disclosed
STANDARD DISCLOSURES PART : Profile Disclosures
1. Strategy and Analysis
PROFILE DISCLOSURE DESCRIPTION STATUS CROSS-
REFERENCE
REASON FOR OMISSION &
EXPLANATION
• P6-7, P17-18Description of key impacts, risks, and opportunities
1.2
87UEM EnvironmentSustainability Report 2011|
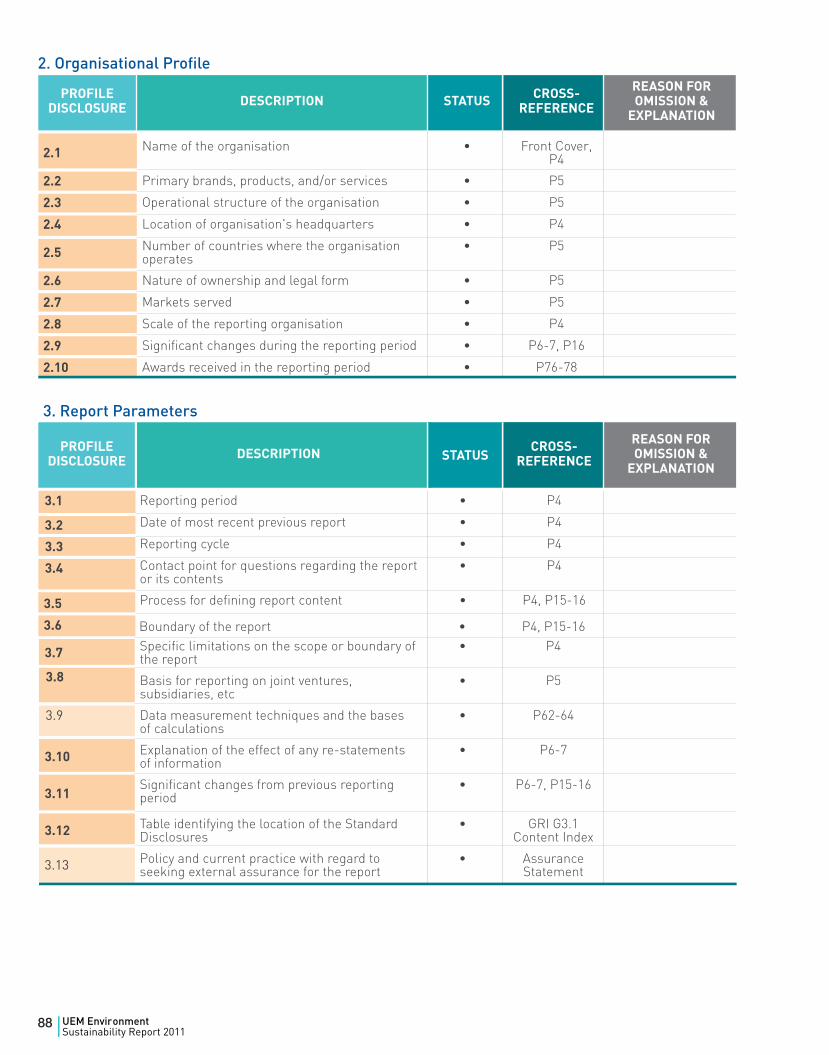
3.7 Specific limitations on the scope or boundary of the report
• P4
Basis for reporting on joint ventures, subsidiaries, etc
• P5
Data measurement techniques and the bases of calculations
• P62-64
3.10 Explanation of the effect of any re-statements of information
• P6-7
3.11 Significant changes from previous reporting period
• P6-7, P15-16
3.12 Table identifying the location of the Standard Disclosures
• GRI G3.1 Content Index
3.13 Policy and current practice with regard to seeking external assurance for the report
• Assurance Statement
PROFILE DISCLOSURE DESCRIPTION CROSS-
REFERENCE
REASON FOR OMISSION &
EXPLANATION
3.1 Reporting period • P4
Date of most recent previous report • P4
Reporting cycle • P4
Contact point for questions regarding the report or its contents
• P4
Process for defining report content • P4, P15-16
STATUS
PROFILE DISCLOSURE DESCRIPTION STATUS CROSS-
REFERENCE
REASON FOR OMISSION &
EXPLANATION
3. Report Parameters
PROFILE DISCLOSURE DESCRIPTION STATUS CROSS-
REFERENCE
REASON FOR OMISSION &
EXPLANATION
2.1 Name of the organisation • Front Cover, P4
2.2 Primary brands, products, and/or services • P5
2.3 Operational structure of the organisation • P5
2.4 Location of organisation's headquarters • P4
2.5 Number of countries where the organisation operates
• P5
2.6 Nature of ownership and legal form • P5
2.7 Markets served • P5
2.8 Scale of the reporting organisation • P4
2.9 Significant changes during the reporting period • P6-7, P16
2.10 Awards received in the reporting period • P76-78
3.2
3.3
3.4
3.8
3.5
3.6
3.9
Boundary of the report • P4, P15-16
2. Organisational Profile
88 UEM EnvironmentSustainability Report 2011|
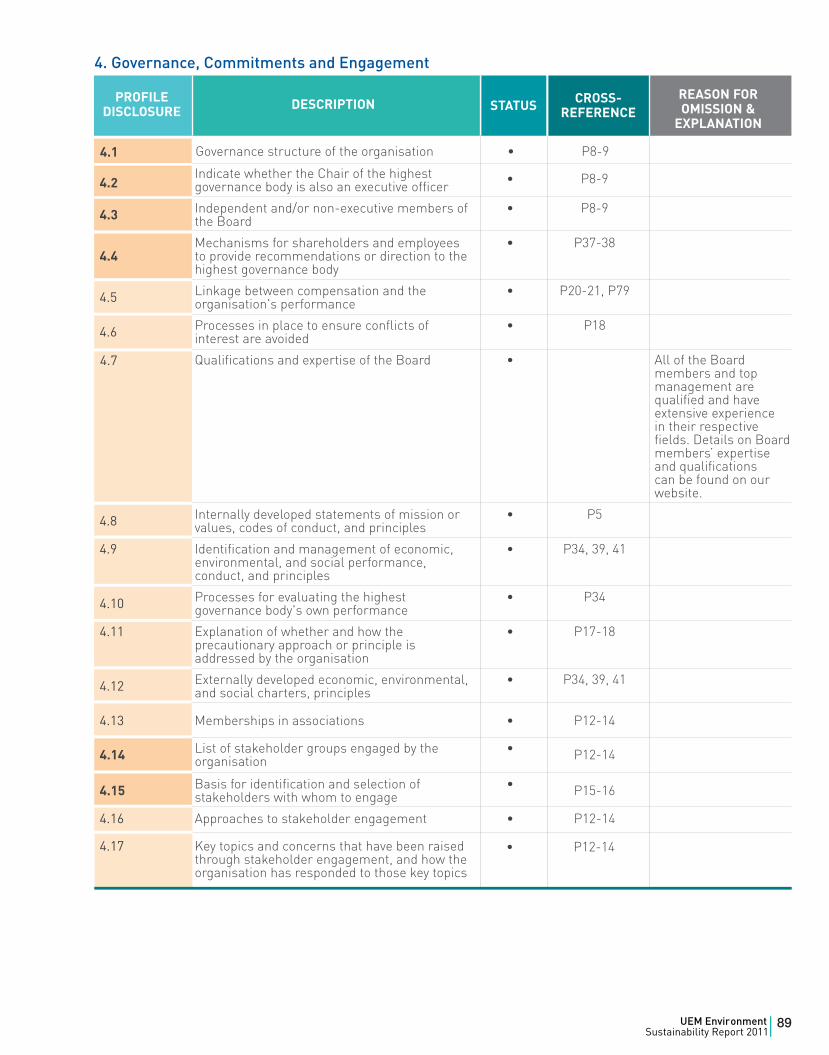
STATUS CROSS-REFERENCE
REASON FOR OMISSION &
EXPLANATION
Governance structure of the organisation • P8-9
4. Governance, Commitments and Engagement
4.1
PROFILE DISCLOSURE DESCRIPTION
4.2Indicate whether the Chair of the highest governance body is also an executive officer • P8-9
4.3 Independent and/or non-executive members of the Board
• P8-9
4.4Mechanisms for shareholders and employees to provide recommendations or direction to the highest governance body
• P37-38
4.5 Linkage between compensation and the organisation's performance
• P20-21, P79
4.6 Processes in place to ensure conflicts of interest are avoided
• P18
Qualifications and expertise of the Board •
4.8 Internally developed statements of mission or values, codes of conduct, and principles
• P5
4.9 Identification and management of economic, environmental, and social performance, conduct, and principles
• P34, 39, 41
4.10 Processes for evaluating the highest governance body's own performance
• P34
4.11 Explanation of whether and how the precautionary approach or principle is addressed by the organisation
• P17-18
4.12 Externally developed economic, environmental, and social charters, principles
• P34, 39, 41
4.15 Basis for identification and selection of stakeholders with whom to engage
• P15-16
4.16 Approaches to stakeholder engagement • P12-14
4.17 Key topics and concerns that have been raised through stakeholder engagement, and how the organisation has responded to those key topics
4.14 List of stakeholder groups engaged by the organisation
• P12-14
4.7
4.13 Memberships in associations • P12-14
• P12-14
All of the Board members and top management are qualified and have extensive experience in their respective fields. Details on Board members’ expertise and qualifications can be found on our website.
89UEM EnvironmentSustainability Report 2011|
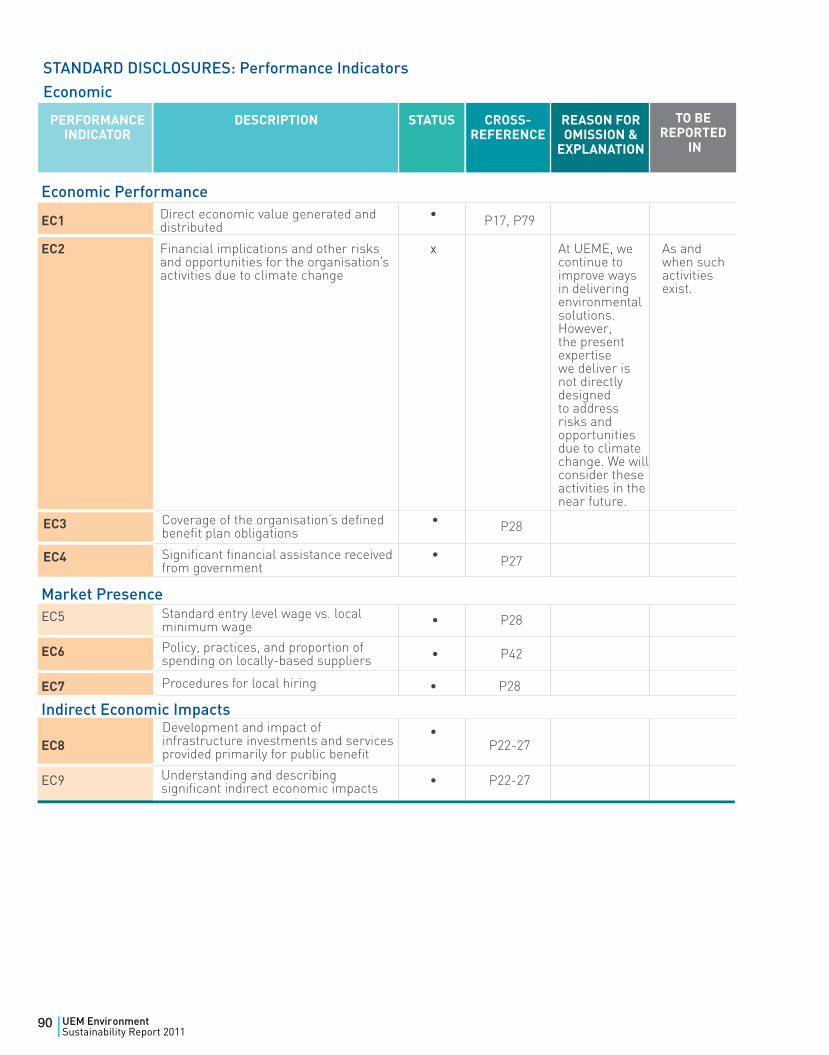
STANDARD DISCLOSURES: Performance IndicatorsEconomic
PERFORMANCE INDICATOR
DESCRIPTION STATUS CROSS-REFERENCE
REASON FOR OMISSION &
EXPLANATION
Economic Performance
EC1 Direct economic value generated and distributed
• P17, P79
EC2 Financial implications and other risks and opportunities for the organisation’s activities due to climate change
x At UEME, we continue to improve ways in delivering environmental solutions. However, the present expertise we deliver is not directly designed to address risks and opportunities due to climate change. We will consider these activities in the near future.
As and when such activities exist.
Market PresenceEC5
EC6
EC7 • P28
Indirect Economic Impacts
EC8 •
P22-27
EC9 • P22-27
TO BE REPORTED
IN
Coverage of the organisation’s defined benefit plan obligations
• P28
Significant financial assistance received from government
• P27
Procedures for local hiring
Policy, practices, and proportion of spending on locally-based suppliers • P42
Standard entry level wage vs. local minimum wage • P28
Understanding and describing significant indirect economic impacts
Development and impact of infrastructure investments and services provided primarily for public benefit
EC3
EC4
90 UEM EnvironmentSustainability Report 2011|
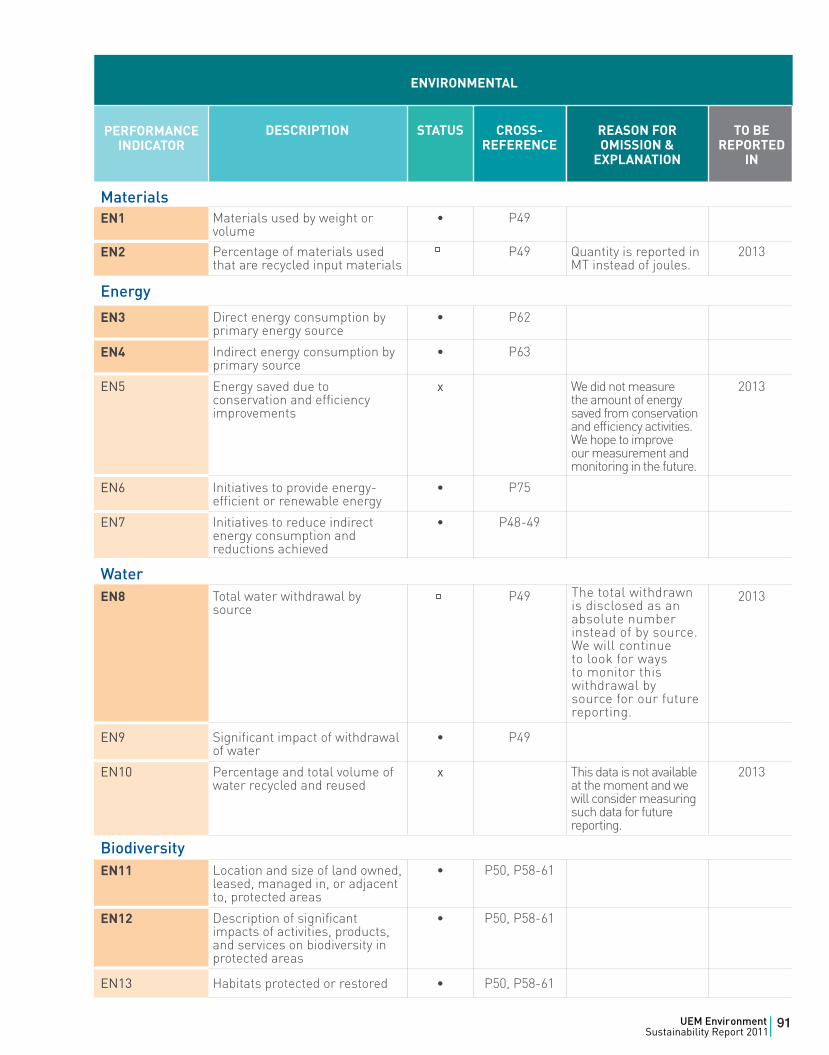
DESCRIPTION STATUS CROSS-REFERENCE
REASON FOR OMISSION &
EXPLANATION
TO BE REPORTED
IN
MaterialsEN1 Materials used by weight or
volume• P49
EN2 Percentage of materials used that are recycled input materials
P49 Quantity is reported in MT instead of joules.
2013
Energy
EN3 Direct energy consumption by primary energy source
• P62
EN4 Indirect energy consumption by primary source
• P63
EN5 Energy saved due to conservation and efficiency improvements
x We did not measure the amount of energy saved from conservation and efficiency activities. We hope to improve our measurement and monitoring in the future.
2013
EN6 Initiatives to provide energy-efficient or renewable energy
• P75
EN7 Initiatives to reduce indirect energy consumption and reductions achieved
• P48-49
WaterEN8 Total water withdrawal by
sourceP49 2013
EN9 Significant impact of withdrawal of water
• P49
EN10 Percentage and total volume of water recycled and reused
x This data is not available at the moment and we will consider measuring such data for future reporting.
2013
BiodiversityEN11 Location and size of land owned,
leased, managed in, or adjacent to, protected areas
• P50, P58-61
EN12 Description of significant impacts of activities, products, and services on biodiversity in protected areas
• P50, P58-61
EN13 Habitats protected or restored • P50, P58-61
PERFORMANCE INDICATOR
The total withdrawn is disclosed as an absolute number instead of by source. We will continue to look for ways to monitor this withdrawal by source for our future reporting.
ENVIRONMENTAL
91UEM EnvironmentSustainability Report 2011|
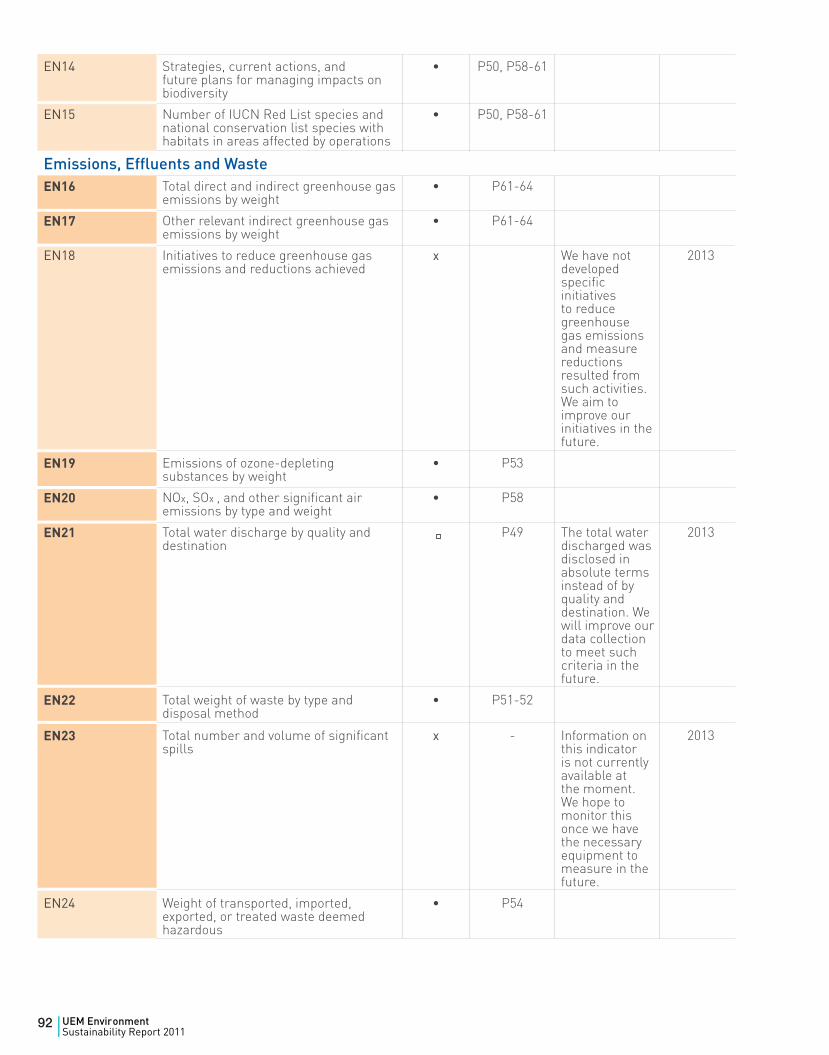
EN14 Strategies, current actions, and future plans for managing impacts on biodiversity
• P50, P58-61
EN15 Number of IUCN Red List species and national conservation list species with habitats in areas affected by operations
• P50, P58-61
Emissions, Effluents and WasteEN16 Total direct and indirect greenhouse gas
emissions by weight• P61-64
EN17 Other relevant indirect greenhouse gas emissions by weight
• P61-64
EN18 Initiatives to reduce greenhouse gas emissions and reductions achieved
x We have not developed specific initiatives to reduce greenhouse gas emissions and measure reductions resulted from such activities. We aim to improve our initiatives in the future.
2013
EN19 Emissions of ozone-depleting substances by weight
• P53
EN20 NOx, SOx , and other significant air emissions by type and weight
• P58
EN21 Total water discharge by quality and destination
P49 The total water discharged was disclosed in absolute terms instead of by quality and destination. We will improve our data collection to meet such criteria in the future.
2013
EN22 Total weight of waste by type and disposal method
• P51-52
EN23 Total number and volume of significant spills
x - Information on this indicator is not currently available at the moment. We hope to monitor this once we have the necessary equipment to measure in the future.
2013
EN24 Weight of transported, imported, exported, or treated waste deemed hazardous
• P54
92 UEM EnvironmentSustainability Report 2011|
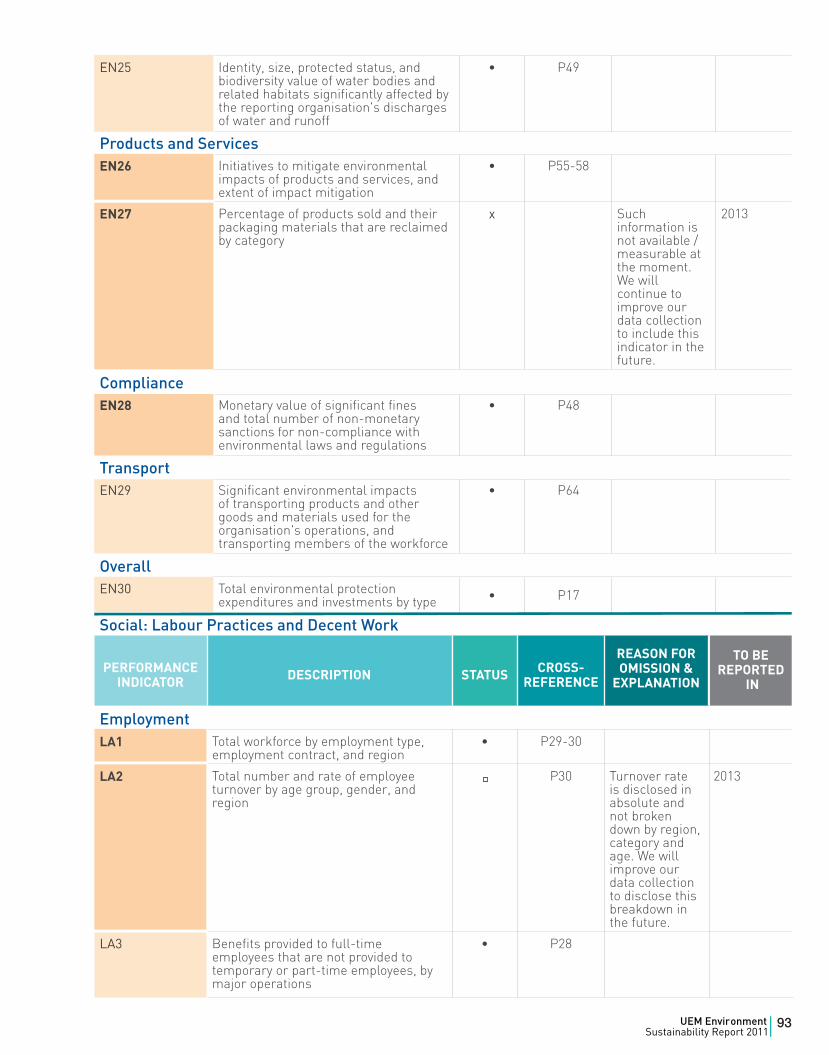
Social: Labour Practices and Decent Work
PERFORMANCE INDICATOR DESCRIPTION STATUS CROSS-
REFERENCE
REASON FOR OMISSION &
EXPLANATION
EmploymentLA1 Total workforce by employment type,
employment contract, and region• P29-30
LA2 Total number and rate of employee turnover by age group, gender, and region
P30 Turnover rate is disclosed in absolute and not broken down by region, category and age. We will improve our data collection to disclose this breakdown in the future.
2013
LA3 Benefits provided to full-time employees that are not provided to temporary or part-time employees, by major operations
• P28
EN25 Identity, size, protected status, and biodiversity value of water bodies and related habitats significantly affected by the reporting organisation's discharges of water and runoff
• P49
Products and ServicesEN26 Initiatives to mitigate environmental
impacts of products and services, and extent of impact mitigation
• P55-58
EN27 Percentage of products sold and their packaging materials that are reclaimed by category
x Such information is not available / measurable at the moment. We will continue to improve our data collection to include this indicator in the future.
2013
ComplianceEN28 Monetary value of significant fines
and total number of non-monetary sanctions for non-compliance with environmental laws and regulations
• P48
TransportEN29 Significant environmental impacts
of transporting products and other goods and materials used for the organisation's operations, and transporting members of the workforce
• P64
OverallEN30 Total environmental protection
expenditures and investments by type • P17
TO BE REPORTED
IN
93UEM EnvironmentSustainability Report 2011|
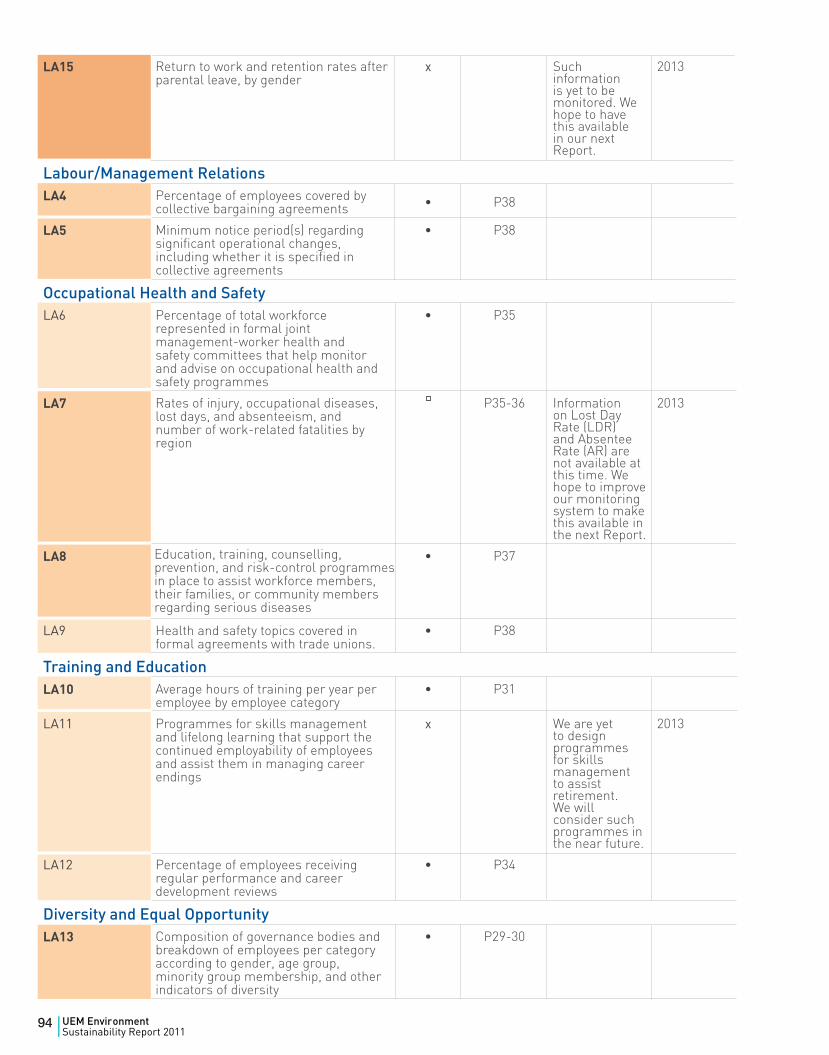
LA15 Return to work and retention rates after parental leave, by gender
x Such information is yet to be monitored. We hope to have this available in our next Report.
2013
Labour/Management RelationsLA4 Percentage of employees covered by
collective bargaining agreements • P38
LA5 Minimum notice period(s) regarding significant operational changes, including whether it is specified in collective agreements
• P38
Occupational Health and SafetyLA6 Percentage of total workforce
represented in formal joint management-worker health and safety committees that help monitor and advise on occupational health and safety programmes
• P35
LA7 Rates of injury, occupational diseases, lost days, and absenteeism, and number of work-related fatalities by region
P35-36 Information on Lost Day Rate (LDR) and Absentee Rate (AR) are not available at this time. We hope to improve our monitoring system to make this available in the next Report.
2013
LA8 • P37
LA9 Health and safety topics covered in formal agreements with trade unions.
• P38
Training and EducationLA10 Average hours of training per year per
employee by employee category• P31
LA11 Programmes for skills management and lifelong learning that support the continued employability of employees and assist them in managing career endings
x We are yet to design programmes for skills management to assist retirement. We will consider such programmes in the near future.
2013
LA12 Percentage of employees receiving regular performance and career development reviews
• P34
Diversity and Equal OpportunityLA13 Composition of governance bodies and
breakdown of employees per category according to gender, age group, minority group membership, and other indicators of diversity
• P29-30
Education, training, counselling, prevention, and risk-control programmes in place to assist workforce members, their families, or community members regarding serious diseases
94 UEM EnvironmentSustainability Report 2011|
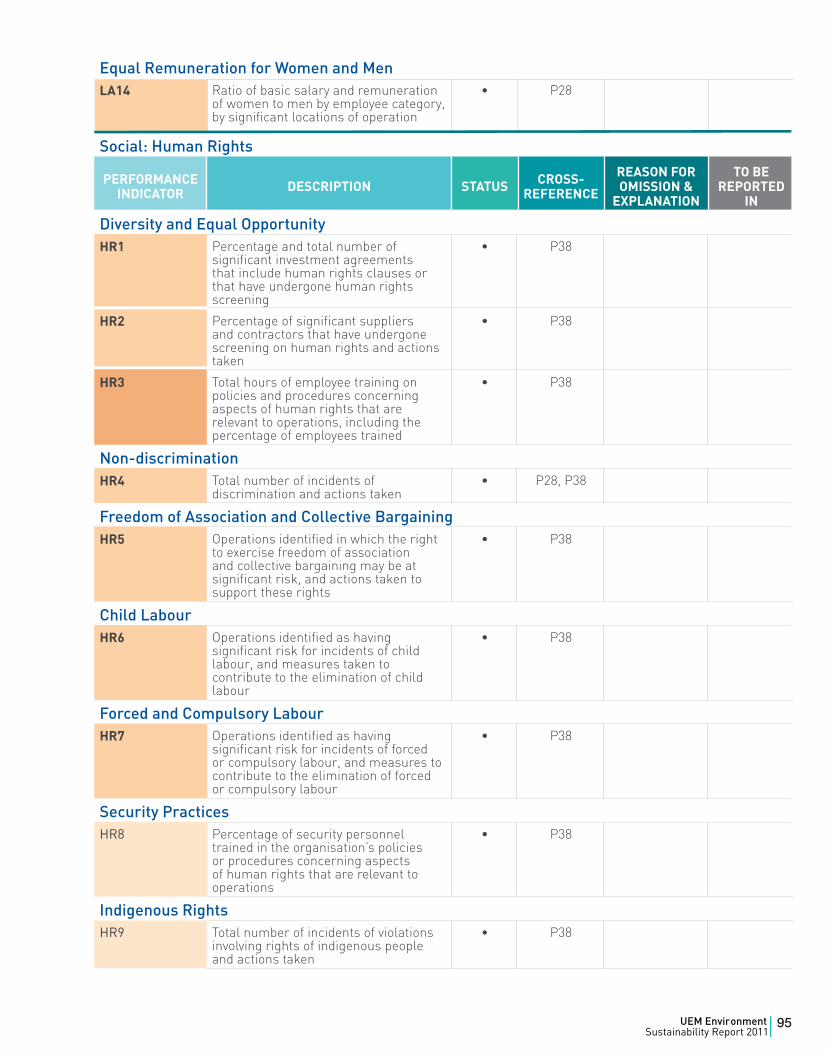
Social: Human Rights
PERFORMANCE INDICATOR DESCRIPTION STATUS CROSS-
REFERENCE
REASON FOR OMISSION &
EXPLANATION
TO BE REPORTED
IN
Diversity and Equal OpportunityHR1 Percentage and total number of
significant investment agreements that include human rights clauses or that have undergone human rights screening
• P38
HR2 Percentage of significant suppliers and contractors that have undergone screening on human rights and actions taken
• P38
HR3 Total hours of employee training on policies and procedures concerning aspects of human rights that are relevant to operations, including the percentage of employees trained
• P38
Non-discriminationHR4 Total number of incidents of
discrimination and actions taken• P28, P38
Freedom of Association and Collective BargainingHR5 Operations identified in which the right
to exercise freedom of association and collective bargaining may be at significant risk, and actions taken to support these rights
• P38
Child LabourHR6 Operations identified as having
significant risk for incidents of child labour, and measures taken to contribute to the elimination of child labour
• P38
Forced and Compulsory LabourHR7 Operations identified as having
significant risk for incidents of forced or compulsory labour, and measures to contribute to the elimination of forced or compulsory labour
• P38
Security PracticesHR8 Percentage of security personnel
trained in the organisation’s policies or procedures concerning aspects of human rights that are relevant to operations
• P38
Indigenous RightsHR9 Total number of incidents of violations
involving rights of indigenous people and actions taken
• P38
Equal Remuneration for Women and MenLA14 Ratio of basic salary and remuneration
of women to men by employee category, by significant locations of operation
• P28
95UEM EnvironmentSustainability Report 2011|
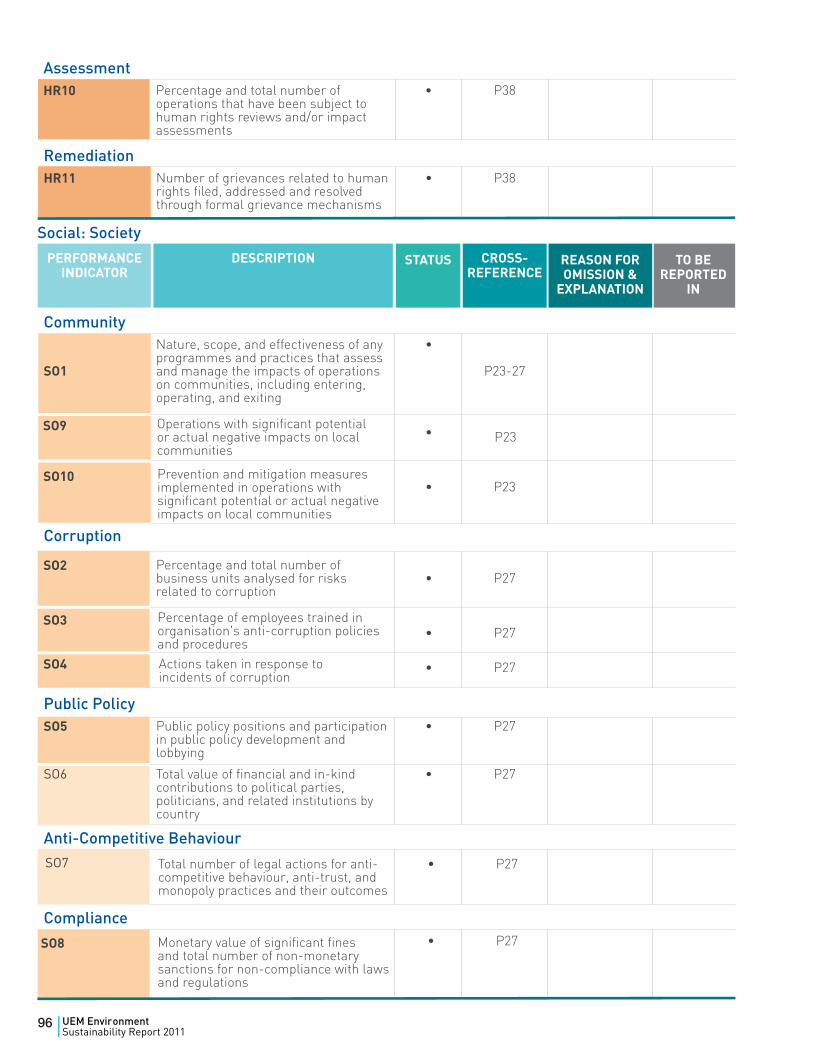
RemediationHR11 Number of grievances related to human
rights filed, addressed and resolved through formal grievance mechanisms
• P38
PERFORMANCE INDICATOR
DESCRIPTION CROSS-REFERENCE
Community
SO1
Nature, scope, and effectiveness of any programmes and practices that assess and manage the impacts of operations on communities, including entering, operating, and exiting
•
P23-27
•
• P23
Corruption
Percentage and total number of business units analysed for risks related to corruption
• P27
• P27
• P27
Public PolicySO5 Public policy positions and participation
in public policy development and lobbying
• P27
SO6 Total value of financial and in-kind contributions to political parties, politicians, and related institutions by country
• P27
Anti-Competitive Behaviour
Compliance
AssessmentHR10 Percentage and total number of
operations that have been subject to human rights reviews and/or impact assessments
• P38
TO BE REPORTED
IN
REASON FOR OMISSION &
EXPLANATION
STATUS
Social: Society
SO9 Operations with significant potential or actual negative impacts on local communities
P23
Prevention and mitigation measures implemented in operations with significant potential or actual negative impacts on local communities
SO2
SO3
SO4
Percentage of employees trained in organisation's anti-corruption policies and proceduresActions taken in response to incidents of corruption
SO8 Monetary value of significant fines and total number of non-monetary sanctions for non-compliance with laws and regulations
Total number of legal actions for anti-competitive behaviour, anti-trust, and monopoly practices and their outcomes
SO7
SO10
• P27
• P27
96 UEM EnvironmentSustainability Report 2011|
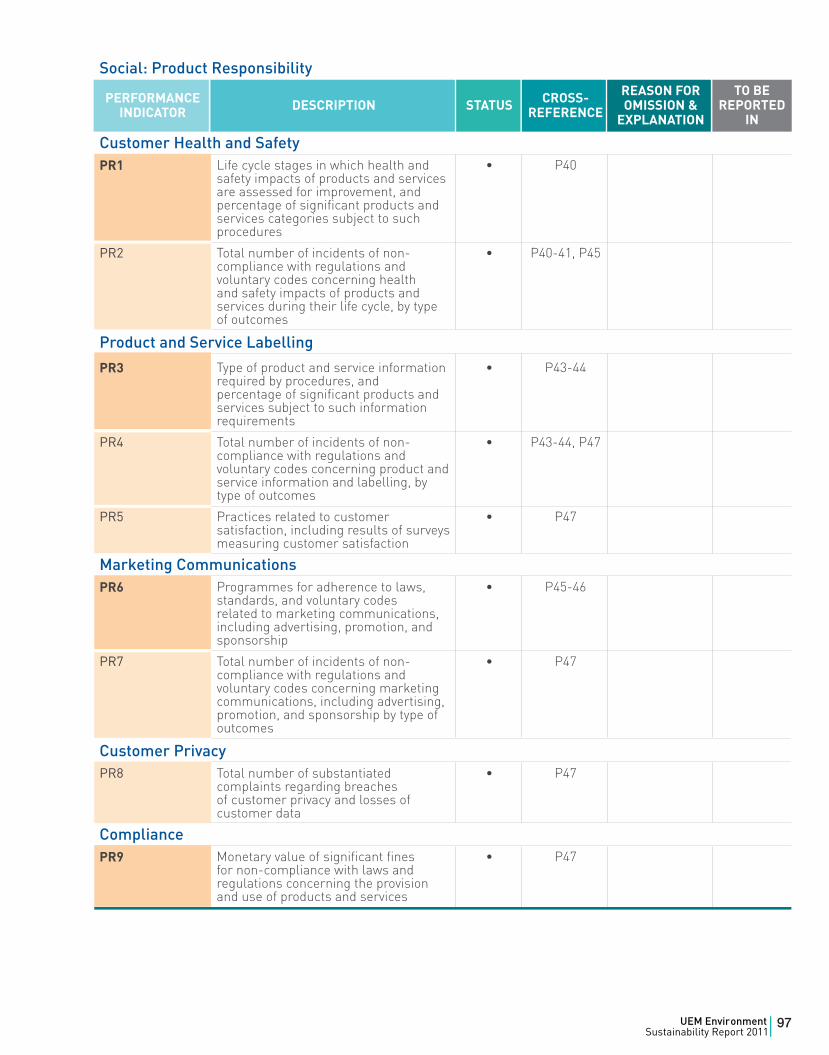
Social: Product Responsibility
PERFORMANCE INDICATOR DESCRIPTION STATUS CROSS-
REFERENCE
REASON FOR OMISSION &
EXPLANATION
Customer Health and SafetyPR1 Life cycle stages in which health and
safety impacts of products and services are assessed for improvement, and percentage of significant products and services categories subject to such procedures
• P40
PR2 Total number of incidents of non-compliance with regulations and voluntary codes concerning health and safety impacts of products and services during their life cycle, by type of outcomes
• P40-41, P45
Product and Service Labelling
PR3 Type of product and service information required by procedures, and percentage of significant products and services subject to such information requirements
• P43-44
PR4 Total number of incidents of non-compliance with regulations and voluntary codes concerning product and service information and labelling, by type of outcomes
• P43-44, P47
PR5 Practices related to customer satisfaction, including results of surveys measuring customer satisfaction
• P47
Marketing CommunicationsPR6 Programmes for adherence to laws,
standards, and voluntary codes related to marketing communications, including advertising, promotion, and sponsorship
• P45-46
PR7 Total number of incidents of non-compliance with regulations and voluntary codes concerning marketing communications, including advertising, promotion, and sponsorship by type of outcomes
• P47
Customer PrivacyPR8 Total number of substantiated
complaints regarding breaches of customer privacy and losses of customer data
• P47
CompliancePR9 Monetary value of significant fines
for non-compliance with laws and regulations concerning the provision and use of products and services
• P47
TO BE REPORTED
IN
97UEM EnvironmentSustainability Report 2011|