the possible environmental impacts of petroleum exploration activities on the georges bank ecosystem
TRANSCRIPT
EXPLORATION ACTIVITIES ON THE GEORGES BANK
P.R. Boudreau, D.C. Gordon, G.C. Harding, J.W. Loder, J. Black, W.D. Bowen, S. Carnpana, P.J. Cranford, K.F. Drinkwater, L. Van Eeddraute, S. Gavaris, C.G. Hannah, G. Hanison, J.J. Hunt, J. McMillan, G.D. MeMn, T.G. Milligan, D.K. Muschenheim, J.D. Neilson, F.H. Page, D.S. P e m k , G. Robert, D. Sameoto and H. Stone
I! Maritimes Region
DepaWnt of F ie r i es and Oceans P.O. Box 1006 Dartmouth, Nova Scotia B2Y 4A2 Canada
Canadian Technical Report of

Canadian Technical Report of
Fisheries and Aquatic Sciences 2259
THE POSSIBLE ENVIRONMENTAL IMPACTS OF PETROLEUM EXPLORATION ACTIVITIES ON THE GEORGES BANK ECOSYSTEM
P.R. Boudreau, D.C. Gordon, G.C. Harding, J.W. Loder, J, Black, W.D. Bowen, S, Campana, P.J. Cranford, K.F.Drinkwater, L. VanEeckhaute, S. Gavaris, C.G. Hannah, G. Harrison, J.J. Hunt,
J. McMillan, G.D. Melvin, T.G. Milligan, D.K. Muschenheim, J.D. Neilson, F.H. Page, D.S. Pezzack, G. Robert, D. Sameoto and H. Stone
Maritimes Region Department of Fisheries and Oceans
P.O. Box 1006 Dartmouth, Nova Scotia
B2Y 4A2 Canada

Minister of Public Works and Government Services Canada 1999 Cat. No. Fs 99-6/21 90 ISSN 0-662-26676-5
Correct citation for this publication:
Boudreau, P.R., D.C. Gordon, G.C. Harding, J.W. Loder, J. Black, W.D. Bowen, S. Campana, P.J. Cranford, K.F. Drinkwater, L. Van Eeckhaute, S. Gavarrs. C.G. Hannah, G. Harrison, J.J. Hunt, J. McMiilan, G.D. Melvin, T.G. Milligan, D.K. Muschenhe~m, J.D. Ne~lson, F.H. Page, D.S. Pezzack, G. Robert. D. Sameoto and H. Stone. 1999. The Poss~ble Envrronmental Impacts of Petroleum Explorat~on Activit~es on the Georges Bank Ecosystem. Can. Tech. Rep. Frsh. Aquat. SCI. 2259

TABLE OF CONTENTS ............................................................................................. I) PREFACE AND ACKNOWLEDGMENTS 1
11) INTRODUCTION ................................................................................................................................... 2 .................................................................. 111) DESCRIPTION OF THE GEORGES BANK ECOSYSTEM 4
General Overview .................................................................................................................................. 4 Topography ............................................................................................................................................... 4 Circulation. Hydrographic Structure and Mixing ........................................................................................ 5 Surficial Sediments and Sediment Transport .......................................................................................... 12 Biological Production ............................................................................................................................... 14 Biodiversity .............................................................................................................................................. 16 Habitat ..................................................................................................................................................... 18
IV) COMMERCIALLY IMPORTANT SPECIES .................................................................................. 19 Scallops .................................................................................................................................................. 19 Lobster in the vicinity of Georges Bank ................................................................................................... 21 Groundfish Resources .......................................................................................................................... 23
Cod ...................................................................................................................................................... 23 Eastern Georges Bank Haddock ......................................................................................................... 24 Pollock ............................................................................................................................................... 28 Yellowtail Flounder ............................................................................................................................... 29
Herring ..................................................................................................................................................... 30 Mackerel .................................................................................................................................................. 33 Large Pelagics ......................................................................................................................................... 33
..................................................................................................................................................... Sharks 33 Squid ...................................................................................................................................................... 33 Seasonal Use of the Bank ....................................................................................................................... 34
V) OTHER SPECIES OF INTEREST ..................................................................................................... 34 Marine Mammals ..................................................................................................................................... 34
VI) FISHERIES ACTIVITIES ..................................................................................................................... 37 VII) UNIQUENESS OF GEORGES BANK ................................................................................................. 51
Regulatory Restrictions . No OBMs to be discharged off Nova Scotia ................................................... 51 Comparison with Northwestern Atlantic ................................................................................................. 52 Comparison with North Sea ................................................................................................................... 53 Comparison with Gulf of Mexico ............................................................................................................ 55
VIII) EXPLORATORY ACTIVITIES AND THEIR POTENTIAL IMPACTS ................................................ 56 Seismic Survey ........................................................................................................................................ 56 Exploratory Drilling .................................................................................................................................. 57
Infrastructure ........................................................................................................................................ 57 Loss of Access ................................................................................................................................ 58 Operational Discharges ...................................................................................................................... 58
Mortality ......................................................................................................................................... 63 Sublethal effects on growth ............................................................................................................. 64 . Tainting ...................................................................................................................................... 67 Summary of Operational Discharges ............................................................................................... 67
Potential Distant Impacts ........................................................................................................................ 67 Potential Cumulative Impacts .................................................................................................................. 68
Multiple Exploratory Wells ................................................................................................................... 68 Development and Production Phases .............................................................................................. 68
IX) EXCEPTIONAL EVENTSICIRCUMSTANCES ................................................................................... 68 Oilspills and Blowouts .............................................................................................................................. 68 MeteorologicallHydrological events ......................................................................................................... 72
X) UNCERTAINTIES ................................................................................................................................ 73 XI) CONCLUSIONS .................................................................................................................................. 74 XII) REFERENCES .................................................................................................................................. 75 XIII) APPENDIX . Drilling Waste Dispersion Modelling and Potential Effects on Scallops ........................ 84
ABSTRACT
Boudreau, P.R., D.C. Gordon, G.C. Harding, J.W. Loder, J. Black, W.D. Bowen, S. Campana, P.J. Cranford, K.F. Drinkwater, L. Van Eeckhaute, S. Gavaris, C.G. Hannah, G. Harrison, J.J. Hunt, J. McMillan, G.D. Melvin, T.G. Milligan, D.K. Muschenheim, J.D. Neilson, F.H. Page, D.S. Pezzack, G. Robert, D. Sameoto and H. Stone. 1999. The Possible Environmental Impacts of Petroleum Exploration Activities on the Georges Bank Ecosystem. Can. Tech. Rep. Fish. Aquat. Sci. 2259.
A Department of Fisheries and Oceans (DFO) Regional Advisory Process (RAP) was carried out to generate a peer-reviewed summary of the Georges Bank ecosystem and potential impacts from petroleum exploratory activities. The process included input from Canadian and USA government scientists, external reviewers and representatives from fishers groups and the petroleum industy. The review resulted in the following conclusions: * Georges Bank is an important offshore bank that has a number of features, which, in combination with
its size, make it unique. Routine exploratory seismic activity might have a significant but temporary impact on adult fish behaviour and movement. This might affect fish catch rates and spawning behaviour.
* Routine operational exploratory drilling activity is likely to have only localised impacts on the ecosystem components reviewed. The actual impacts will be dependent on the location, timing of the activities, and the properties of discharges. There does exist a small probability that these impacts will have population and ecosystem level impacts. Exploration drilling would lead to a temporary loss of access to some portion of the fishing grounds, although the area lost would be relatively small. Seismic activity would lead to temporary space conflicts with fishing activities that would depend on the timing, location and the gear types involved. This conflict would be greatest during the summer months.
* There is a low probability of a large release of petroleum product from a well blowout. If this were to occur, it might have population and ecosystem level impacts. Routine exploratory seismic activity could have a localised impact on eggs and larvae depending on the time of year and location. Production activities were not reviewed but the impacts are expected to be different, both in scale and in nature, from those considered for exploratory activities. A review of specific production proposals is needed before any assessment of these can be carried out.
This research document provides the scientific information and references to support these conclusions.

Boudreau, P.R., D.C. Gordon, G.C. Harding, J.W. Loder, J. Black, W.D. Bowen, S. Campana, P.J. Cranford, K.F. Drinkwater. L. Van Eeckhaute, S. Gavaris, C.G. Hannah, G. Harrison, J.J. Hunt, J. McMillan, G.D. Melvin, T.G. Milligan, D.K. Muschenheim, J.D. Neilson, F.H. Page, D.S. Pezzack, G. Robert, D. Sameoto and H. Stone. 1999. The Possible Environmental Impacts of Petroleum Exploration Activities on the Georges Bank Ecosystem. Can. Tech. Rep. Fish. Aquat. Sci. 2259.
Le ministere des Peches et des Oceans (MPO) a eu recours au Processus consultatif regional (PCR) pour produire un sommaire, ayant fait l'objet d'un examen par les pairs, des incidences possibles d'activites d'exploration petroliere sur I'ecosysteme du banc Georges. Le processus faisait appel au concours de scientifiques gouvernementaux du Canada et des ~tats-Unis, a des examinateurs externes et a des representants de groupes de pecheurs et de I'industrie du petrole. I1 a debouche sur les conclusions suivantes : * Le banc Georges est un important banc du large, unique de par sa taille et de par la combinaison de
ses diverses caracteristiques. Les travaux courants de recherche sismique pourraient avoir une incidence importante, mais temporaire, sur le comportement et la migration des poissons adultes, ce qui risquerait d'infiuer sur les taux de prises et sur la reproduction. Les travaux courants de forage exploratoire operationnel n'auront vraisemblablement que des incidences localisees sur les elements de I'ecosysteme qui ont ete examines. Les incidences reelles dependront du lieu et de la periode choisis pour ces travaux, ainsi que des proprietes des rejets. II existe une faible probabilite d7ncidences sur les populations et sur I1ecosyst&me. Le forage exploratoire engendrerait une privation temporaire d'acces a une certaine partie, relativement petite, des lieux de pgche. Les travaux de recherche sismique occasionneraient temporairement des conflits d'utilisation de I'espace avec les operations de pkche, qui dependraient du lieu et de la periode choisis ainsi que des engins de peche employes. Ces conflits seraient plus marques en ete. II existe une faible probabilite de deversement majeur de produits petroliers par suite d'eruption incontrblee. Si une telle eruption se produisait, elle risquerait d'avoir des incidences sur les populations et sur I'ecosysteme. Les travaux courants de recherche sismique pourraient avoir des incidences localisees sur les oeufs et les larves, selon le lieu et la periode. On n'a pas etudie les incidences des operations de production, mais on s'attend a ce qu'elles soient differentes de celles des activites d'exploration, tant par leur ampleur que par leur nature. Un examen prealable des scenarios de production proposes est necessaire a toute evaluation de ces incidences.
Le present document de recherche contient les renseignements et references scientifiques qui etayent ces conclusions.


I) PREFACE AND ACKNOWLEDGMENTS
This manuscript updates information about the Georges Bank ecosystem and potential impacts of exploratory drilling originally presented in Gordon (1988). It attempts to document our increased understanding of this ecosystem concerning possible impacts of petroleum exploration since that publication.
This research document was prepared under the guidance of the Regional Advisory Process (RAP) Habitat Committee to provide a general scientific evaluation of the likely environmental impacts of exploratory drilling on Georges Bank, as perceived by the Department of Fisheries and Oceans (DFO) Maritimes Region at the present time. It is prepared to address only the possible extension of the moratorium on exploratory activities and not any specific proposal for exploration activities. It is intended that the general summary and conclusions would form the initial basis for any future review of proposed activities.
This report was completed under the guidance of the RAP Habitat Steering Committee: Paul Keizer, Paul Boudreau, Donald Gordon, John Loder and Michael Sinclair.
Attendees at the RAP meeting held December 1-4'~, 1998, also provided comments, suggestions and revisions through their participation in the meeting. See the RAP proceedings document for a full list of participants.
In addition to general comments, suggestions and support, by the RAP committee members and the RAP meeting attendees, specific sections of the document were contributed by the following DFO scientists:
Description of the Georges Bank ecosystem -John Loder and Ken Drinkwater. B~ologrcal Production - Gareth Harding, Glen Harrison and Doug Sameoto. Scallops - G~nette Robert. Lobster - Gareth Hardlng and Doug Pezzack. Cod - Joe Hunt. Haddock - Stratis Gavaris, Fred Page and Lutgarde Van Eeckhaute Pollock - John Netlson. Yellowtali Flounder - John Neilson. Herring - Gary Meivin. Large Pelagics - Heath Stone. Sharks - Steve Campana. Marine Mammals - Jim McM~llan and Don Bowen. F~sher~es activities - Sc~entrsts i~sted above plus Jerry Black and the Commerc~al Data
D~v~sion, Marit~mes Region, DFO. Operat~onal Discharges - Donald Gordon, Peter Cranford, John Loder, Tim Milligan and Kee
Muschenheim. Drilling Waste Dispersion Modell~ng and Potential Effects on Scallops - Donald Gordon, Peter Cranford,
John Loder, Charles Hannah, Tim Mill~gan and Kee Muschenheim.
If) INTRODUCTION
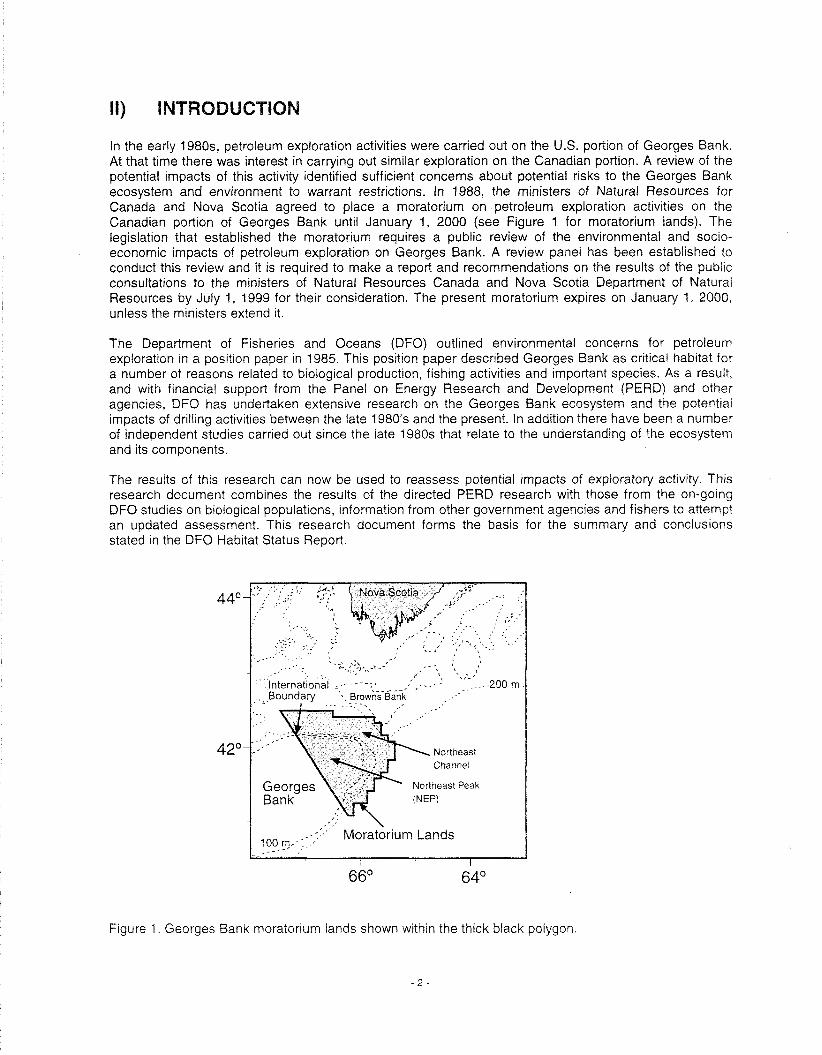
In the early 1980s, petroleum exploration activities were carried out on the U.S. portion of Georges Bank. At that time there was interest in carrying out similar exploration on the Canadian portion. A review of the potential impacts of this activity identified sufficient concerns about potential risks to the Georges Bank ecosystem and environment to warrant restrictions. In 1988, the ministers of Natural Resources for Canada and Nova Scotia agreed to place a moratorium on petroleum exploration activities on the Canadian portion of Georges Bank until January 1, 2000 (see Figure 1 for moratorium lands). The legislation that established the moratorium requires a public review of the environmental and soc~o- economic impacts of petroleum exploration on Georges Bank. A review panel has been established to conduct this review and it is required to make a report and recommendations on the results of the public consultations to the ministers of Natural Resources Canada and Nova Scotia Department of Natural Resources by July 1, 1999 for their consideration. The present moratorium expires on January 1, 2000, unless the ministers extend it.
The Department of Fisheries and Oceans (DFO) outlined environmental concerns for petroleum exploration in a position paper in 1985. Thrs position paper described Georges Bank as critical hab~tat for a number of reasons related to biological production, fishing activities and important species. As a result, and with financial support from the Panel on Energy Research and Development (PERD) and other agencies, DFO has undertaken extensive research on the Georges Bank ecosystem and the potential impacts of drilling activities between the late 1980's and the present. In addition there have been a number of independent studies carrred out since the late 1980s that relate to the understand~ng of the ecosystem and its components.
The results of th~s research can now be used to reassess potent~al ~mpacts of exploratory actrvrty. This research document comblnes the results of the directed PERD research wlth those from the on-golng DFO studres on b~ologlcal populations, informatron from other government agencles and frshers to attempt an updated assessment. Thrs research document forms the bass for the summary and conclus~ons stated In the DFO Hab~tat Status Report.
Northeast Peak
Figure 1. Georges Bank moratorium lands shown within the thick black polygon.

DFO Mandate
The main legislative base of the Department of Fisheries and Oceans (DFO) is the Government Organisation Act (1979) and the schedule of statutes attached thereto, including the Fisheries Act, the Fisheries Development Act, the Fish Inspection Act, the Fishing and Recreational Harbours Act, the Coastal Fisheries Protection Act, the Fisheries and Oceans Research Advisory Council Act, the Canada Shipping Act regarding charts and publications, regulations, and several international treaties and conventions. Under the Government Organisation Act (1 979), the duties, powers and functions of the Minister of Fisheries and Oceans include responsibilities for seacoast and inland fisheries, fishing and recreational harbours, hydrography and marine sciences, and for the co-ordination of the policies and programs of the Government of Canada respecting Oceans. Its responsibility for habitat protection is clearly described in the "Policy for the Management of Fish Habitat" (Anon. 1986) adopted in 1987 that describes the principle of "No Net Loss." The department also has a responsibility to provide advice to other government departments pursuant to the Canada Shipping Act, TERMPOL, Navigable Waters Protection Act, and the Canada Oil and Gas Conservation and Production Act. The Department's mandate in sustainable development has been further expanded by the Oceans Act, passed in 1997. The details of this responsibility are developed farther in the document "Sustainable Development - a Framework for Action" (Anon. 1997).
It is in this legislative context that DFO has a responsibility to provide advice on the possible extension of the Georges Bank moratorium.
Current Situation
The Georges Bank ecosystem supports a productive biological system with complex linkages among its component species. It exists in a dynamic environment and is subject to numerous physical influences having different spatial and temporal scales. Natural events include storms, that can quickly move both water and sediment large distances. Human influences include fishing activity that interacts with populations of both harvested and non-harvested species and the benthic habitat supporting them. It is located on the important shipping routes between the U.S., Canada and Europe. In the early 1980s, it was the site of oil and gas exploration activity on the southern flank.
Georges Bank is one of the world's richest fishing banks, characterised by a marine ecosystem of high diversity. It has been heavily fished for more than a hundred years by many nations, and is of major economic and social importance to coastal communities in Canada and the United States. Canada and the U.S. share jurisdiction over the Bank. Both have fisheries management programs aimed at rebuilding and sustaining the fisheries stocks and the supporting ecosystem.
On the American portion of Georges Bank eight exploratory wells were drilled in the early 1980s. No commercial reserves of hydrocarbons were discovered. Danenberger (1983) summarises the drilling that was carried out, equipment used, discharges and some of the physical impacts. Studies of these exploratory activities were unable to detect any impact on the benthic ecosystem (Phillips et a/. 1987; Neff el a/. 1989). However, in 1998 the U.S. president extended the moratorium on drilling on its continental shelf, including Georges Bank, until 2012. The strong biological and physical linkages between the Canadian and U.S. portions of the Bank are described in this research document.
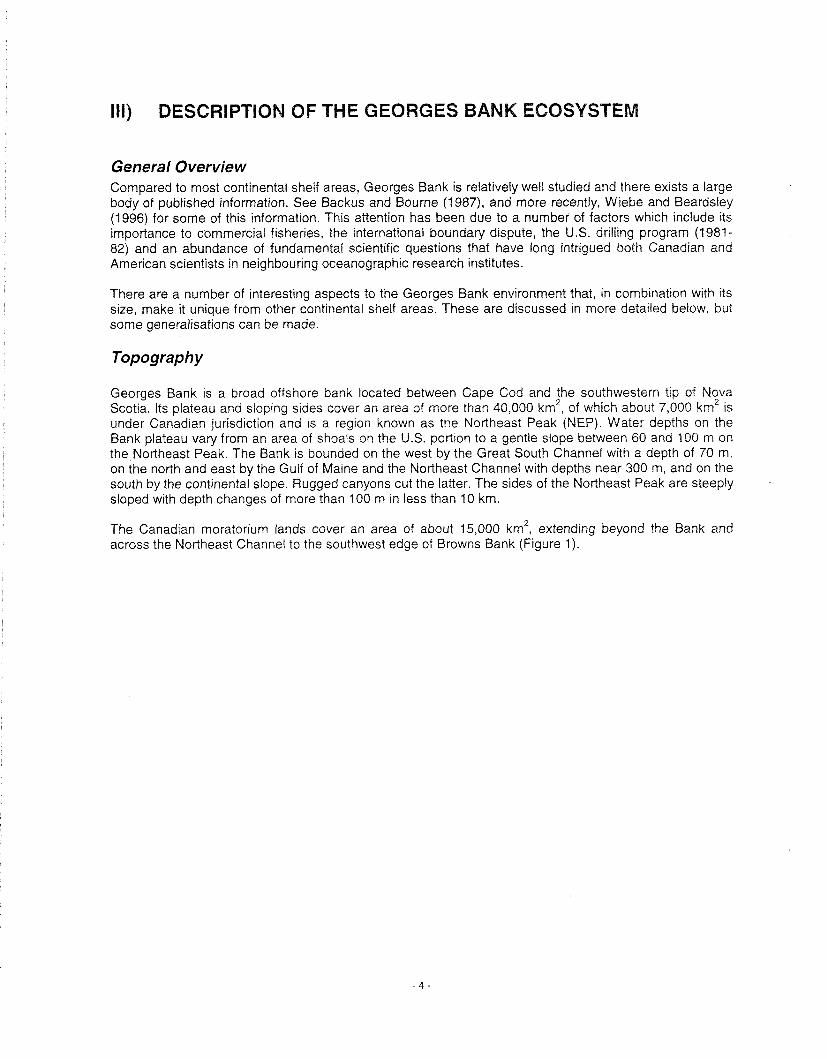
Ill) DESCRIPTION OF THE GEORGES BANK ECOSYSTEM
General Overview Compared to most continental shelf areas, Georges Bank is relatively well studied and there exists a large body of published information. See Backus and Bourne (1987), and more recently, Wiebe and Beardsley (1996) for some of this information. This attention has been due to a number of factors which include its importance to commercial fisheries, the international boundary dispute, the U.S. drilling program (1981- 82) and an abundance of fundamental scientific questions that have long intrigued both Canadian and American scientists in neighbour~ng oceanographic research institutes.
There are a number of interesting aspects to the Georges Bank environment that, in combination with its size, make it unique from other continental shelf areas. These are discussed in more detailed below, but some generalisations can be made.
Topography
Georges Bank is a broad offshore bank located between Cape Cod and ;he southwestern tip of Nova Scotia. Its plateau and sloping sides cover an area of more than 40,000 krn , of which about 7,000 km2 is under Canadian jurisdiction and IS a region known as the Northeast Peak (NEP). Water depths on the Bank plateau vary from an area of shoals on the U.S. portion to a gentle slope between 60 and 100 m on the Northeast Peak. The Bank is bounded on the west by the Great South Channel with a depth of 70 m, on the north and east by the Gulf of Maine and the Northeast Channel with depths near 300 m, and on the south by the continental slope. Rugged canyons cut the latter. The sides of the Northeast Peak are steeply sloped with depth changes of more than 100 m in less than 10 km.
The Canadian moratorium lands cover an area of about 15,000 km2, extending beyond the Bank and across the Northeast Channel to the southwest edge of Browns Bank (Figure 1).
Circulation, Hydrographic Structure and Mixing
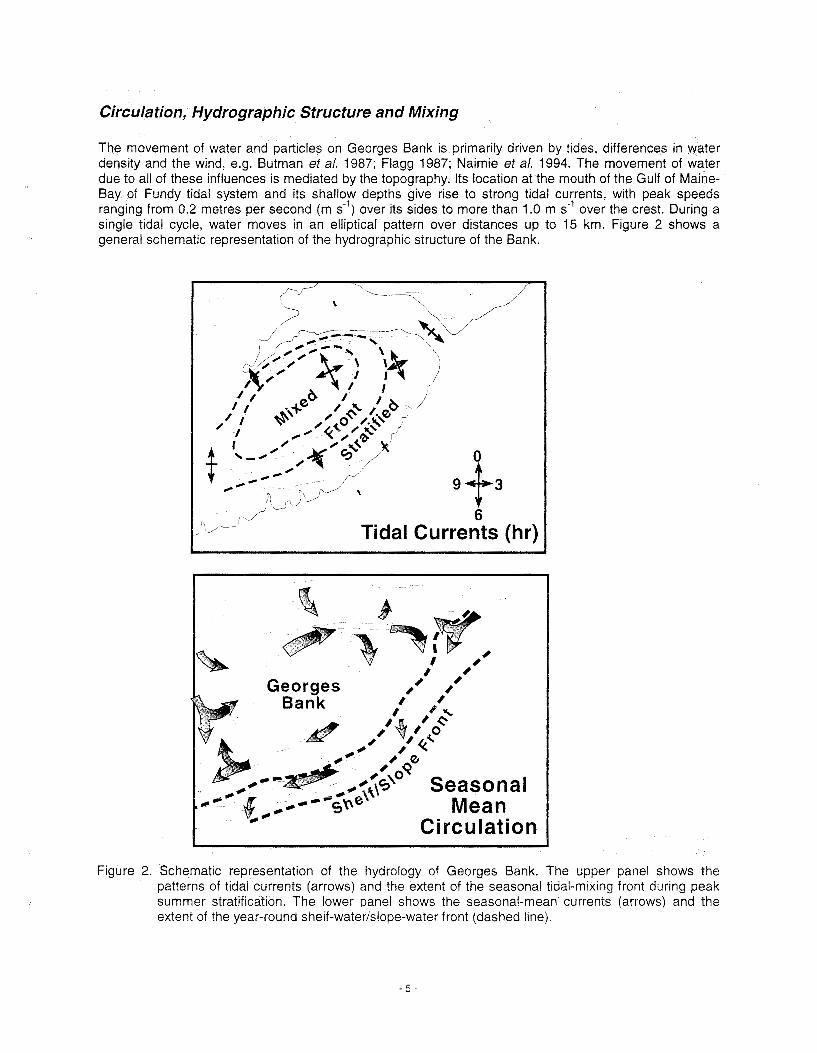
The movement of water and particles on Georges Bank is primarily driven by tides, differences in water density and the wind, e.g. Butman et a/. 1987; Flagg 1987; Naimie et at. 1994. The movement of water due to all of these influences is mediated by the topography. Its location at the mouth of the Gulf of Maine- Bay of Fundy tidal system and its shallow depths give rise to strong tidal currents, with peak speeds ranging from 0.2 metres per second (m s") over its sides to more than 1.0 m s-' over the crest. During a single tidal cycle, water moves in an elliptical pattern over distances up to 15 km. Figure 2 shows a general schematic representation of the hydrographic structure of the Bank.
Figure 2. Schematic representation of the hydrology of Georges Bank. The upper panel shows the patterns of tidal currents (arrows) and the extent of the seasonal tidal-mrxing front during peak summer stratif~cation. The lower panel shows the seasonal-mean currents (arrows) and the extent of the year-round shelf-waterlslope-water front (dashed line).
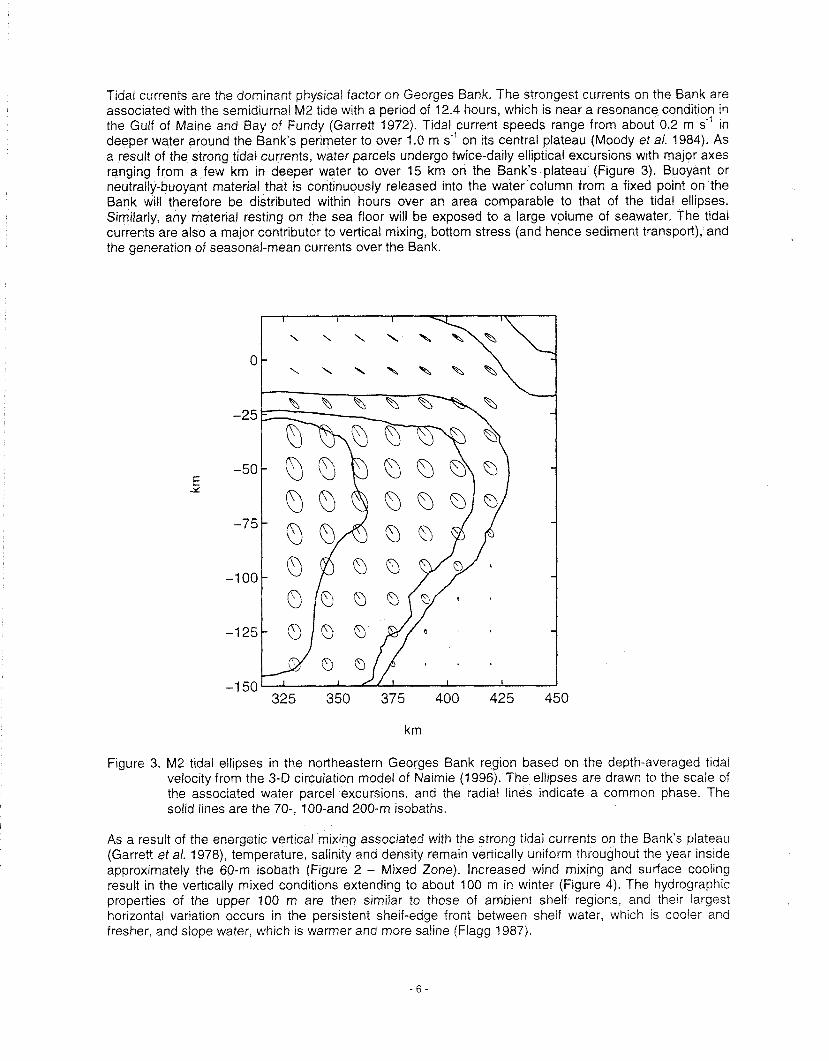
Tidal currents are the dominant physical factor on Georges Bank. The strongest currents on the Bank are associated with the semidiurnal M2 tide with a period of 12.4 hours, whrch is near a resonance condition in the Gulf of Maine and Bay of Fundy (Garrett 1972). Tidal ~ur ren t speeds range from about 0.2 m s*' in deeper water around the Bank's perimeter to over 1.0 m s- on its central plateau (Moody et a/. 1984). As a result of the strong tidal currents, water parcels undergo twice-daily elliptical excursions with major axes ranging from a few km in deeper water to over 15 km on the Bank's plateau (Figure 3). Buoyant or neutrally-buoyant material that is continuously released into the water column from a fixed point on the Bank will therefore be distributed within hours over an area comparable to that of the tidal ellipses. Similarly, any material resting on the sea floor will be exposed to a large volume of seawater, The tidal currents are also a major contributor to vertical mixing, bottom stress (and hence sediment transport), and the generation of seasonal-mean currents over the Bank.
Figure 3. M2 tidal ellipses in the northeastern Georges Bank region based on the depth-averaged tidal velocity from the 3-D circulatron model of Naimre (1996). The ellrpses are drawn to the scale of the associated water parcel excursions, and the radral l~nes indicate a common phase. The solid lrnes are the 70-. 100-and 200-m isobaths.
As a result of the energetic vertical mixing associated with the strong tidal currents on the Bank's plateau (Garrett et a/. 1978), temperature, salin~ty and density remain vertically uniform throughout the year ins~de approximately the 60-m isobath (Frgure 2 - Mixed Zone}. Increased wind mixrng and surface cooling result in the vertically mixed condit~ons extending to about 100 m In wlnter (F~gure 4). The hydrographic propertres of the upper 100 m are then s~mrlar to those of ambrent shelf reglons, and their largest horizontal var~atlon occurs rn the persistent shelf-edge front between shelf water, which is cooler and fresher, and slope water, wh~ch is warmer and more saline (Flagg 1987).

Figure 4. Vertical density difference (solid lines in 0, units) between 50 m (or the bottom, if shallower) and the surface on northeastern Georges Bank for six bimonthly periods. The difference is computed from density fields in Naimie's (1 995) 3-0 circulation model initialised with estimates from historical data (Hannah et a/. 1996). The dashed lines show the 60, 100 and 200-m isobaths.

Beginning in spring, seasonal surface heating results in the development of strong upper-ocean stratification around the Bank and a seasonal t~dal-m~xing front (or transition zone between m~xed and stratified waters) over its flanks (F~gure 2). The seasonal progression of this front is shown by the vertical density difference between 50 m and the surface in six bimonthly periods (Figure 4) which indicates that the front is most intense in summer when its width varies from 15-20 km over the Bank's northern edge to 40-50 km over the Northeast Peak. Frontal processes are important factors in both the retentive and dispersive characteristics of the Northeast Peak during much of the year, spring to fall, and have been a focus of DFO research over the past decade. This research has provided an improved quantitative description and understanding of hydrographic structure, vertical mixing, internal waves, circulation, surface convergence and dispersion in the frontal zone (e.g. Loder e t al. 1993). In particular, new field measurements have revealed the structure and extent of small- and intermediate-scale frontal-zone features, illustrated schematically in Figure 5. The Northeast Peak frontal zone can be conceptualised as a hybrid with characteristics of both tidal-mixing and bank-edge fronts (Loder e t a / , 1992). The vertlcal and cross-bank structure of the small-scale tidally-generated turbulence responsible for the strong vertical mixing on the Bank has been determined, providing information on the spatial and temporal variability of the bottom boundary layer (Horne e t a/. 1996; Yoshida and Oakey 1996). Large internal waves generated at the Bank edge and propagating into the frontal zone have been found to be an additional mid-depth source for turbulence and vertical mixing and a possible contributor to surface convergence in the frontal zone (Brickman and Loder 1993; Loder et a/. 1992). Surface drifter studies have identified surface convergence zones in the frontal zone, at the Bank edge and in the mixed central area, which result in the near-surface horizontal d~spersion rates on scales less than 20 km be~ng lower than typical shelf values (Drinkwater and Loder 1998).
MIXED FRONT STRATIFIED
Figure 5. Schematic representation of the vertical structure of the seasonal frontal system over the northern edge of the Bank's Northeast Peak. The structure of internal waves, small-scale turbulence and surface convergence at representative positions are indicated.

On longer time scales, there is a persistent movement of yater in a clockwise gyre around most of the Bank, at speeds of about 0.1-0.2 m s-' but 0.2-0.4 m s- along its northern edge. This partial gyre intensifies in summer and fall, but is "leaky", with significant exchange with surrounding waters. It can be temporarily disrupted by episodic events such as storms and Gulf Stream ring intrusions, e.g. Butman and Beardsley 1987. Key features of the physical regime are illustrated schematically in Figure 2.
The seasonal-mean circulation includes the persistent partial gyre with an intense eastward jet along the northern edge (e.g. Butman ef a/. 1987; Naimie ef al. 1994; Naimie 1996). At most locations, this flow component is a major factor in the drift of materials and organisms on northeastern Georges Bank on time scales longer than the tidal period. The partial gyre intensifies in summer reaching peak speeds near 40 cm s*' along the northern edge, and the jet-like flow increasingly spreads across the Northeast Peak associated with the seasonal on-bank migration of the tidal front (Figure 6). The gyre has a persistent year-round component associated primarily with non-linear interactions of the tidal currents over the Bank's topography, while the seasonal intensification is primarily associated with horizontal density gradients in the frontal system. The mean flows associated with the gyre are generally strongest in the upper half of the water column, and decrease substantially towards the seafloor.
Summer
Figure 6. Mean currents at 20 m below the surface (thin vectors) from the Naimie (1995) model solutions for winter (January-February) and summer (September-October). Observed seasonal-mean currents from moored measurements in the 10--50 m vertical interval are included (thick linesj, using July-August as the summer period.

The combined lniluences of the tidal and seasonal-mean currents, and the near-surface convergence in the frontal zone are illustrated by the paths of three near-surface drifters, at 20 m depth, released on the northern part of Georges Bank on July 27, 1989 (Figure 7). The drifters came together after release, and spiralled eastward due to the tidal ellipses and frontal-zone jet. Over two days the drifters travelled well over 100 km, but were recovered only a net distance of about 20 km from the release points and iess than 2 krn apart. These trajectories were obtained in the absence of strong weather systems or other short- term perturbations on the average current patterns.
Figure 7. Trajectories of three drifters released on the northern edge of Georges Bank on July 27'h, 1989.
Add~tronal important current components that can generally be thought of as peturbat~ons on the basic semldiurnal tidal and seasonal-mean flows on Georges Bank rnclude (e.g. Butman and Beardsley 1987).
other trdal components wh~ch result In dally, fortn~ghtly and monthly modulatrons of the tidal current magn~tude (due to rnteractlons with diurnal and other semidiurnal consutuents), and in changes in the basic shape of the semldiurnal var~ation In some areas (due to higher harmonrcs such as M4);
* low-frequency current fluctuations with periods ranging from hours to weeks associated with wind. eddies and offshore forcing, and whrch generally are strongest In the upper ocean; and, hrgh-frequency current fluctuations with perrods ranglng from seconds to an hour associated w~th surface waves, rnternal waves, and turbulence In the bottom boundary iayer or wind-driven surface layer.
The strong temporal and spatlai varrab~ltty of the currents on Georges Bank results in the net effect of varlous d~spersive and retentive processes being highly dependent on spatiai position, season and the occurrence of storms and other ep~sodic events. Robust estimates for the residence tlme of passive mater~als on the Bank or parts of the Bank have not been obtained. Drifter and model studies suggest thai the residence tlme on the whole Bank IS typically in the 20-80 day range. with a strong dependence on horizontal and vertrcal release positron (Flagg ef al. 1982; Loder ef al. 1987; Page ef a/ 7998) lmaonant factors in these extended residence times are the slze of the Bank and the tendency oi the seasonal-
mean fiows to move around rather than across the Bank. Highest residence trmes are expected for inrttaf positions on the central Bank, in the lower water column in general, and in the frontal zone in summer when the gyral circulation inside about the 70-m isobath tends to be closed (Limeburner and Beardsley 1996). Lowest values are expected for initial positions over the bank edges in general, in the near-surface layer in winter, and over the outer southern flank in summer. Recent model studies (Werner et a/. 1993; Hannah etal. 1998a) have provided some support for a two-layer system in winter and spring, with a wind- driven surface layer of reduced residence time consistent with historical drifter studies. However, the recent model and drifter studies have also indicated that there can be important deviations from th~s paradigm, such as convergence of surface drifters on the central bank during wind events (Drinkwater and Loder 1998; Hannah et a/. 1998a; Limeburner, R., personal communication). For the Northeast Peak, available information indicates that the weakest drift (and hence greatest residence time) occurs at depth on the Bank plateau in winter and spring when the seasonal-mean flow across the plateau is weakest (Page et a/. 1998; Loder et a/. 1998a).
A separate issue from residence time is the rate at which materials and organisms are dispersed or diluted while they are on the Bank. This rate depends strongly on their buoyancy and swimming abilities, the local vertical mixing rates, and the local horizontal dispersion rates (including the effects of convergence zones). The Bank's high vertical mixing rates should generally contribute to high dilution rates for neutrally buoyant materials, but will be less effective in diluting light (e.g. surface oil) or dense (e.g. drilling cuttings) materials. The strong currents and associated horizontal shears can be expected to contribute to relatively h~gh rates of horizontal disperston for neutrally buoyant material distributed over the water column, through mechanisms such as shear dispersion and chaotic stirring (Csanady and Magneil 1987; Ridderinkhof and Loder 1994). However, the mounting evidence for frequent and widespread near- surface convergence zones over the Bank (Loder etal. 1993; Drinkwater and Loder 1998; Limeburner and Beardsley 1996; Lough and Manning 1998) suggests that, for buoyant materials, the general tendency for high dispersion can often be at least partially offset by the concentrating effect of horizontal convergences. Recent estimates (Drinkwater and Loder 1998) that near-surface horizontal dispers~on rates on scales under 20 km on Georges Bank in summer and fall are often smaller than those in other shelf environments suggest that northeastern Georges Bank can at times have below-normal horizontal d~lution rates for buoyant materials, in spite of its energet~c currents. Similarly, the presence of active bedforms on parts of the Bank can be interpreted as evidence for at least transient near-bottom convergence mechanisms for dense materials.
While much is known and understood about its physical regime, the rich complexity of processes and scales on Georges Bank has made it difficult to obtain robust quantitative measures of many important quantities relevant to the fates of materials introduced to the Bank. New observational information and modelling capabilities are presently becoming available through the intensive studies being carried out by the US GLOBEC program on Georges Bank during the period 1994-2000. Many of the new findings have not yet been published but physical oceanographic areas in which new advances are emerging include: * near-surface drifter patterns and residence-time estimates (Limeburner 1998);
vertical motions associated with non-linear tidal interactions in the frontal zones over the Bank's sides (Chen and Beardsley 1998); sediment suspension and vertical motions over the central Bank (Pershing etal. 1998); cross-overs of Scotian Shelf water onto the Bank (Bisagni etal. 1996); entrainment of water from the Bank by Gulf Stream rings; and interannual and decadal-scale variability in hydrographic properties and circulation (Smith et a/. 1998; Loder et a/. l998b).
In summary, the physical environment on Georges Bank has both dispersive features, such as the strong currents and vertical mixing, and retentive features, such as the partial gyre and surface convergence zones. The net effect of these contrasting influences on the movement and concentration of materials and organisms depends on the geographic location, vertical position in the water column, time of the year, the effect of storms and Gulf Stream rings, as well as the space and time scales of interest.

Surficial Sediments and Sediment Transport The thin layer of sediment on top of Georges Bank is post-glacial in origin. During the last glacial period, sea level was about 100 m lower than present so most of Georges Bank was exposed and covered with coniferous forests inhabited by woolly mammoths and other ice-age fauna. The southern limit of glacial ice was probably along a line extending from the crest of the Bank westward to Nantucket. Since the last glacial retreat began about 10,000 years ago, sea level has steadily risen and flooded the Bank.
Tidal currents and waves are intermittently reworking surficial sediments on the Bank, particularly during winter storms. Both processes can be active to water depths of at least 100 m. As a result of this abundance of energy, sediments on the crest of the Bank, the shallowest area, are primarily sand and gravel. The relative abundance of finer sediment particles increases with increasing water depth, especially along the southern flank suggesting reduced winnowing and possibly deposition in these areas. A large area of silt and clay found south of Cape Cod, called the Mud Patch, is thought to be composed of fine sediment winnowed from Georges Bank and transported westward by the residual current. Other potential sinks for fine material transported off Georges Bank are the Gulf of Maine to the north, canyons along the southern flank and the continental slope.
The preceding section focused on the movement of water and particles in the water column. A patticular concern identified during the 1988 DFO assessment was the effect of drilling muds on scallops for which quantitative estimates of the near-bottom movement of dense materials are required (Muschenheim et a/. 1995). To address this issue, another focus of recent DFO research has been the development of numerical models for the dispersion and transport of suspended sediment (or drilling mud) in the benthic boundary layer, the bottom of the water column just above the seafloor. These models have been called benthic boundary layer transport (bblt) models (Hannah et a/. 1995; 1998b). The results from their application to Georges Bank have been used to estimate the impacts of drilling muds from exploratory drilling on adult scallops (Cranford et a/. 1999; see Section VIII) and Appendix), but the models can also be used to characterise the spatial and seasonal patterns of suspended sediment drift and dispersion on Georges Bank (Loder et a/. 1998a). In particular, the models provide new quantitative estimates of the complex process called "shear dispersion" through which vertical mixing interacts with vertical shear In horizontal currents to provide horizontal dispersion rates that far exceed those due to turbulence alone.
The predicted patterns of suspended sediment drift and dispersion in summer are shown in Figure 8 for two different settling velocities of the sediment, a low value (left panels) in wh~ch the sediment is distributed nearly uniformly over the boundary layer and a high value (right panels) in wh~ch the sediment is strongly bottom trapped. In each case, the mean height of the sediment (top panels) Increases proceeding onto the Bank because of the stronger currents and bottom stress in shallower water. The horizontal drift patterns (middle panels) for the two cases are similar, consistent with the influence of the spreading jet in the seasonal-mean circulation (Figure 6). However, the drift magnitudes are reduced for the sediment that is closer to the bottom.
In addition to the height of sediment suspension and the drift rate, another factor affecting the near-bottom concentration of suspended sed~ment is the rate of horizontal spreading or dispersion of patches of sediment, that is, from initial point sources. At the base of this work are the numerical models, called the benthic boundary layer (bblt), to study the dispersion and transport of suspended sediment in the benthic boundary layer on the continental shelf. Hannah et a/. (1995) describes formulation and exploratory applications. Numerous improvements have been made since that publication. The model is now ava~lable in two versions (Loder et a/. 1998). The local version neglects spatial variability in the physical environment around the discharge site and can be forced by either a measured (time-varying) current profile or a 3-0 time-varying circulation model field. The second, and more complex version, called the spatially variable bblt, allows spatial structure in the physical environment and is forced by a 3-5 time- varying circulation model field. The specifications of forcings and the choice of model parameters draw upon the results of other projects in this program.
The bblt model results show that the spatial pattern of the horizontal dispersion rates (lower panels) depends on the settling velocity (or the sediment height). In the case of strong bottom trapping, the dispersion rates increase proceeding toward the central Bank where the tidal currents are strongest. Thls
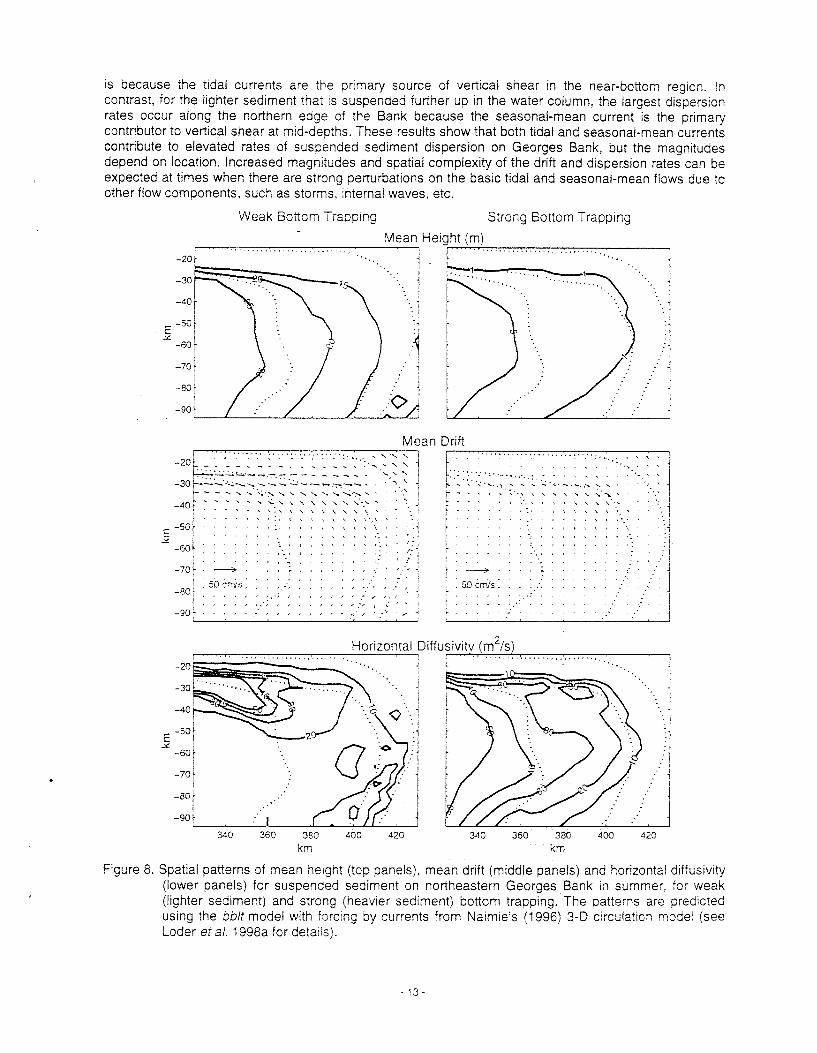
IS because the t~dal currents are the prtmary source of veriicai shear in the near-bottom reglon. In contrast, for the lighter sediment thar IS suspended further up In the water column, the largest dispers~on rates occur along the northern edge of the Bank because the seasonal-mean current is the primary contributor to vertical shear at mid-depths. These results show that both tidal and seasonal-mean currents contribute to elevated rates of suspended sediment dispersion on Georges Bank, but the magnrtudes depend on location. Increased magnlludes and spatial complexity of the drift and dispersion rates can be expected at times when there are strong perturbations on the basic tidal and seasonal-mean flows due to other flow components, such as storms, internal waves, etc.
Weak Bottom Trapping
Mean
Strong Bottom Trapp~ng
Height (m) 1 . . . . . . . . . . . . . . . . . . . . . . . . . . . . . . . . . .
Mean Drift
. . . . . . . . . . .... " < , $ * . :I
. . . . . I . , , , , . % . * , , . . , : ij . . . . . . . . . . . . . . .
- . . . . . . . .
I . - . . . . I . . . . . . . . . . . . . . . . . 5'b c s s . . . . : . . . . . . _'. . - .; 1 . . . . . . . . . . . .
1 . . . . . .;:' . . . . . . . . .' I
: ! . . . . . - . . . . . . . . i
Figure 8. Spatial patterns of mean height (top panels), mean drlft (middle panels) and horizontal drffus~vtty (lower panels) for suspended sediment on northeastern Georges Bank In summer, for weak (Irghter sediment) and strong (heav~er sediment) bottom trapping. The patterns are pred~cted uslng the bblt model with forc~ng by currents from Na~m~e's (1996) 3-D circulat~on model (see Loder eta/ . 1998a for detzils).

Biological Production
Georges Bank has long been recognised as an area of high biological productivity and provides large commercial catches of finfish (haddock, cod, etc.) and invertebrates (scallops and lobster) (Boudreau and Dickie 1992). Comparative studies with other regions have demonstrated that Georges Bank is one of the most productive fishing banks in the north Atlantic (Table 1).
Table 1. Generalised production estimates (kCal m-2 y') for various components of Georges Bank and comparable continental shelf ecosystems (from Cohen and Grosslein, 1987).
Georges Bank Gulf of Maine Scotian Shelf North Sea
Phytoplankton 3,342 2,566 2,280 2,280 Macrozooplankton 202 207 195 186 Microzooplankton 285 367 21 6 21 4 Macrobenthos 98 98 82 100 Meiobenthos 13 25 Fish 52 26 21 24
The most important producers at the base of the food web are the phytoplankton, microscopic green plants that require sunlight and inorganic nutrients (primarily nitrogen, phosphorus and silicon) to grow. They have no or limited mobility and so move passively with the water. Data on the detailed spatial and temporal distribution of phytoplankton biomass and productivity on Georges Bank have been collected as part of the Marine Resources Monitoring, Assessment and Prediction program (MARMAP) (O'Reilly and Busch 1984; O'Reilly et a/. 1987). As a general rule, productivity in continental shelf environments is greatest in tidally mixed and frontal zones where light and nutrient conditions are more favourable than other regions that have periods of summer stratification. In well-mixed areas, however, nutrients are usually in ample supply but vertical mixing can transport phytoplankton downward away from the light for varying periods of time. In stratified areas, phytoplankton are kept within the euphotic zone but nutrients are in short supply. Fronts, on the other hand, represent a transition zone in which a favourable balance of light and nutrients is generally found (Loder and Platt 1985).
Following these basic concepts, it is hypothesised and demonstrated during the MARMAP program that there are three general production zones on Georges Bank which are defined by physical mechanisms shown in Figure 2: mixed, frontal and stratified. The mixed zone is the continually weil-mixed area on top of the Bank where water depths are less than 60 m. Since the depth is shallow, solar radiation can reach the bottom and phytoplankton are not severely light-limited except in winter. Due to the proximity to the bank edge and its characteristic strong currents and water mixing, the mixed zone on the top of the Bank is suspected to have large inputs of nutrients from deep water that supports the high levels of phytoplankton production. The frontal zone straddles the seasonal tidal front (Figure 2). It occurs in the transition between the shallow well-mixed water and the deeper stratified water on the edge of the Bank. Available data suggest that high productivity levels also occur in this region because of an abundance of nitrate that can only be supplied by the inward movement of deep water onto the Bank. In fact, the highest NO3-based "new" productivity occurs in this frontal zone (Horne et a/. 1989; Sathyendranath et a/. 7 991). The stratified zone has been shown to have the lowest annual productivity of the three zones. It is the area of deeper water outside of the frontal zone that is stratified in the summer. Except for the spring and fall blooms, when nitrate is abundant, the nutrients in this zone are thought to be supplied primarily by regeneration within the surface mixed layer. High-resolution images of sea surface phytoplankton abundance derived from ocean colour satellite sensors have supported these results on the importance of Georges Bank in the regional biological productivity.

The phytoplankton are eaten by zoopiankton, a diverse assemblage of small animals. Some forms, such as some crustaceans, remaln in the plankton for their entire existence and are called holoplankton; although it is known that some holoplankters can produce resting eggs that lie dormant on the bottom. The bulk of the macrozooplankton in the summer are made up of the amphipod, Gammarus annulatus, that reside close to the surface in summer at dusk and close to the bottom at other times of the year. Meroplankton, on the other hand, are in the plankton for only part of their lives and include some crustaceans, the larvae of bottom invertebrates as well as the early life stages of most fishes. Many zooplankton swim actively enough to control their depth in the water column but are somewhat at the mercy of horizontal currents (Davis 1984). Species follow a seasonal successional cycle similar to that of phytoplankton (Davis 1987). The production of zooplankton (both macro and micro forms) on Georges Bank is not thought to be appreciably higher than found in other comparable regions (Table 1). There is evidence that the spatial distribution of zooplankton species in the upper water column on the Bank is influenced in part by the mean circulation pattern, that is, the age of development stages can be traced in a clockwise pattern around the Bank.
A large variety of benthic organisms including worms, crab, clams, scallops and lobsters live on and in the sediment. Some forms, mysids, amphipods, etc., leave the bottom at night and migrate into the water column. They feed on phytoplankton, zooplankton and detrltus and in turn are preyed upon by fish. Like zooplankton, the available data suggest that their composite production (both macro and mlcro forms) on Georges Bank may be slightly higher than other similar areas (Table 1). Although macrobenthos production IS similar to other areas, the structure is very different and this would likely affect the validity of comparisons with other areas. For instance, there is a greater predominance of filter feeders on Georges Bank compared to other areas where deposit feeders are the major component of the ecosystem. It is important to note that benthic filter feeders dominate the commercial landings. Some information exists about the structure of the megabenthlc communities and the associations with sediment type and food availability (Thouzeau etal. 1991). The feeding dynamics of sea scallops have also been studied (Grant et a/. 1997)
There are some suggestions that the higher phytoplankton productivity on Georges Bank may not translate into higher levels of secondary production in the benthos. One reason is that a large portion of the zooplankton feeding on the Bank may be lost by horizontal exchange with surrounding waters. This is possible because the average generation time of about two months for holoplankton is on the same order as the residence time of water on the Bank. Phytoplankton on the other hand are able to maintain high densities on the Bank despite their immobility because of their short generation time of just a few days. It is also possible that the deficit in secondary production is not real but reflects errors in measurement of production processes and the distribution of organisms. A number of recent studies have addressed these issues (e.g. Perry et a/. 1993; Durbin 1996; Franks and Chen 1996; Meise and O'Reilly 1996).
The available data suggest that fish production per unit area on Georges Bank is at least twlce that in other comparable areas (Table 1). Why it is so much higher when secondary production values appear to be comparable is not known. It has been suggested that the trophic linkages from the primary production to the fish are through the benthic populat~ons (Boudreau and Dickie 1992). Fish could also be obta~ning a large portion of their food during migrations off the Bank. It could also be that current understanding of food web dynamics is deficient. Despite all the research that has been conducted on Georges Bank, more is needed to understand the important interactions of this complex ecosystem.
A large proportion of the spring diatom production over Georges Bank is not utilised by zooplankton in contrast to the summer-fall situation when dinoflagellate production approximates its consumption. There are no depositionary regions on the Bank proper thus detrital material that does not get consumed by benthic filter feeders must be removed by winter storms to deeper waters surrounding the Bank. It was calculated from two large-scale studies of shelf exchange processes (SEEP I and II) that between 7 and 15% of the total primary production over the shelf in the Middle Atlantic Bight reaches the continental slope through processes of resuspension and near bottom currents. These values are undoubtedly an underestimate for Georges Bank because of its relatively narrow shape, large water movements and close proximity to deep waters both in the Gulf of Maine and the continental slope. The deeper waters are where the offshore lobsters and many demersal fish spend the winter months.

Biodiversify
Georges Bank is a biogeographical transition area for plankton, benthos and fish associated with influences from both subpolar and subtropical water. For example, the Bank is at the southern limit of the range for north temperate groundfish species and the northern limit for south temperate species. About 100 groundfish species are regularly taken in trawl surveys from Cape Hatteras to Cape Chidley. Of these 60 have been found in the moratorium area (see Figure 9 and 10 for sample distributions and Mahon ef a/. (1997) for detailed discussion). Thus the biodi$iersity of Georges Bank is high in relation to the contiguous shelf areas in the northwest Atlantic Ocean.
East Coast of North America Strategic Assessment Project Dtsrributton of Northern sand lance (Ammodytes dubius)
1 Projectton Lamberr Contorrnai Corrc 1 Sc~ence Sector,
Deparrrnent of Fisheries and Oceans (Canada) Off ice of Ocean Resources Conseivat ion and Assessmenr,
I Natronal Oceanic and Atmospherrc Adm~n~st ia r ion (USA)
Figure 9. Distribution of sand lance from research cruises compiled through the East Coast of North America Strategic Assessment Project (ECNASAP) (Sources: WWW-
orca.nos.noaa.gov/pro~ects/ecnasap/ecnasap.html).

East Coast of North America Strategic Assessment Project D ~ s t r~ bu t ~ o n o f Ocean pout [Maerozoarces americancxs)
Projection: Lambert Conformal Conic
Science Sect or, Department of F~sheries and Oceans (Canada1
Office of Ocean Resources Conservation and Assessment, National Ocean~c and A t mospher~c Admrnrst r a t ~ o n (USA)
Figure 10. Distribution of ocean pout from research cruises compiled through the East Coast of North America Strategic Assessment Project (ECNASAP) (Source: WWW-
orca.nos.noaa.gov/projecis/ecnasap/ecnasap. html).

Habitat
The Fish Habitat Management Policy of DFO that was adopted in 1987 includes the principle of "No Net Loss". Under this principle, the Department is committed to balance unavoidable habitat losses with habitat replacement on a project-by-project basis so that further reductions to Canada's fisheries resources due to habitat loss or damage are prevented. Thus far this policy has received limited attention in offshore areas.
Under the fisheries act, habitat is defined as: "spawning grounds and nursery, rearing, food supply, migration and any other areas on which fish depend directly or indirectly in order to carry out their life process."
For the purposes of this research document. habitat is seen as the living and non-living components of the ecosystem such as substrate, water quality, prey availability, etc.. These components of the ecosystem are required to ensure the long-term survival of the living marine resources associated with the area.
The 1985 DFO position paper on Georges Bank used the following criteria to delimit critical habitat: "major concentrations of harvestable or ecologically important fish species or spawning and nursery areas; year- round use or very high seasonal concentrations of marine mammals for feeding, calving or pupping; and other localities of notably high biological production and high fishing effort."
The importance of habitat has also been used in the management of commercially important fish species. For example, trawl fish~ng IS proh~bited on the Northeast Peak of the Bank during cod and haddock spawning season. This concept also underlies the US fisheries management system that uses closed areas and seasons to restrict fishing pressure. Efforts are also underway to delineate essential habitat for some species on the US portion of the Bank.
While the effect of drilling mud discharges on adult scallops is described in some detai! below, little is known of such activities on the other living and non-living resources on the Bank. Neff et a/. (1 989) shows little impact on the benthlc populations from exploratory wells drilled on the American portion of Georges Bank although it is important to note that in the area drilled there were no scallops.
Photos of benthic habitat and benthic resources on Georges Bank potentially at risk are given in Dorsey and Pederson (1 998).

IV) COMMERCIALLY IMPORTANT SPECIES
Scallops
The sea scallop, Placopecten magellanicus, is found only in the northwest Atlantic, from Cape Hatteras to Labrador. Scallops are aggregated in patches and harvestable concentrations are called beds. Major areas of offshore fishing activity are Georges Bank (Figure 1 I ) , the Scotian Shelf and St. Pierre Bank. Scallops prefer a sandy, gravel bottom and occur in depths from 35 to 120 m. Out of the benthic fauna of large invertebrates on Georges Bank, bivalves like scallops, rank first in abundance (55%) and biomass (86%). Scallops, surf clams and ocean quahogs make up to 71% of the total biomass overall (Thouzeau et al. 1991). On Georges Bank, scallops are found in 3 main aggregations, the Northeast Peak (NEP), the Great South Channel, and the Southern Part. The Northeast Peak (NEP) on the Canadian portion of Georges Bank yields the most productive flshery.
Individual scallops have separate sexes. They mature at age 2. The female gonad is red in colour and the male gonad is creamy white. The main annual spawning event takes place from late August to October with minor spring event (May-June) observed most years (DiBacco et a/. 1995). Recruitment is highly variable in strength. Adult females are h~ghly fecund, producing 50 million eggs per year per individual. Eggs released by the female are fertil~sed externally by male sperm. Larvae vertical distribution depends on the degree of mixing in the water column. Larvae are often aggregated near the pycnocline in stratified waters where their phytoplankton food accumuiates. Autumn surveys on the NEP have observed larvae most abundant in areas where water depths are between 60 and 100 m, corresponding to the areas and depths where adults are most abundant. After 6 to 8 weeks of planktonic life, larvae settle to the bottom at a size of about 300 microns. Models linking known aspects of larval biology and settlement numbers with simulations of particle trajectories and various flow field components suggest significant exchange among the 3 main aggregations (Tremblay etal. 1994). Self-seeding is possible for the NEP. The high retention of particles on Georges Bank would indicate that the Bank is self-sustaining for scallop stock replacement. Larval distribution surveys have shown that movements of larvae from the NEP to the Scotian Shelf are minimal for most years.
Juvenile scallops, under age 3, are most abundant on the NEP, associated with gravely substrates and some sand. They also occur on sandy bottoms that have some shell debris. Juveniles can be highly aggregated with over 10 scallops per metre square. The distribution of juveniles does not necessarily match the distribut~on of adults at any one time. Dense aggregations of juven~les are often found in areas where the density of adults had been low. Scallops are sedentary once they have settled on the bottom as spat. They do not undertake migrations. Tagging studies have shown that scallops do not move far but spend their life withln a radius of a few kllometres.
Growth is estimated from the positron of annual rrngs on the shell. The growth rate varies from one area to another and IS rnfluenced by season, depth and temperature. Georges Bank has dynamlc environmental conditions wlth good exchange of waters for food and oxygen. Growth of young scallops IS very fast. While the shell size of a young age 3 scallop increases by 250h In a year, the welght of the commercially important abductor muscle, or meat, will double durlng that tlme. Although the shell growth slows down from age 4 to age 5, the meat weight continues to increase by 50%. Hence, there are advantages to delaying exploitation and direct flsking on iarge scallops w~th better meat yleld.

Figure 11. Scallop distr~bution on the Northeast Peak of Georges Bank.

Lobster in the vicinity of Georges Bank
Lobsters inhabit coastal waters from southern Labrador to Maryland with highest population numbers in the southern Gulf of St Lawrence and the Gulf of Maine area. Lobsters also inhabit the outer shelf and upper slope between the Gully on the Scotian Shelf and South Carolina, and the deep basins in the Gulf of Maine. Offshore densities are 10 to 100 times lower then the more productive and densely populated nearshore waters (Uzmann et at. 1977) and their existence is related to the presence of warm bottom water along the upper slope and in the deep basins.
The highest number of lobsters in the vicinity of Georges Bank is found in the canyons along the outer slope and to a lesser extent along its northeastern edge. Lobsters make seasonal migrations between the shallower waters in summer and the deeper waters in winter. Over most of their range, these movements range from a few kilometres to 30 km. However in the Gulf of Maine, the outer continental shelf lobsters undertake long distance migrations of 10s to 100s of km. Tagging studies have also shown that at least some of these lobster return to the same area each year. On Georges Bank, lobsters undertake annual migrations between the deeper water (300-700 m) along the continental slope and Georges Basin - Northeast Channel region, to the shoal waters of the Bank in summer (Uzmann et a/. 1977; Pezzack 1987). During the summer months lobsters moult, mate and hatch their eggs in the shallow waters.
Mark recapture studies indicate that migratory movements are associated with maturity and that immature lobsters are nonmigratory (Campbell and Stasko 1986). Not all animals undertake the migration each year but it appears the majority of mature lobsters do in any given year. The immature lobsters are more closely tied to shelters in areas of rocks and cobble and compacted sediment in which they can burrow and are therefore less likely to be seen in traps or trawls. Practically nothing is known about the distribution, numbers and behaviour of the recently settled early benthic phase (EBP) and juveniles in any deep-water areas, including Georges Bank.
Fifty percent of the femaie lobsters are mature at 97-mm carapace length (CL) (Pezzack and Duggan 1989) and produce eggs every second year. The two-year reproductive cycle involves moulting and mating during the summer of year 1, extruding the following summer and carrying eggs for 10 months with hatching the following summer. This is followed by moulting and mating (Aiken and Waddy 1980). Lobsters larger than 140 mm CL may only produce eggs every 3 years. Laboratory work suggest they may be capable of producing 2 sets of eggs in a 3 year period (Waddy and Aiken 1986) but this has not yet been confirmed in the wild.
Offshore surveys of the Canadian portion of the Gulf of Maine from the Bedford Institute of Oceanography indicate that larval lobsters are hatched and released almost entirely over the banks. The timing of the summer hatch appears to be temperature dependent, with the first hatching on Georges in June and July, preceding Browns and German Banks where release occurs in late July and early August. The newly hatched larvae immediately swim to the surface waters where they remain for four moult stages. Again the duration of these developmental stages is temperature, and to a lesser extent food, dependent. Lobster larvae feed on a variety of plankters but predominately on cladocerans, copepods and crab larvae. In the highly productive mixed waters over Georges Bank, lobster larvae are in the plankton for about a month before settling and moulting into the fifth stage on the bottom. Larval stages I and II probably undergo diurnal vertical migrations to 20-30 m depth over Georges Bank, judging from the results of a study over Browns Bank (Harding et al. 1987). Stage iV seeks more surface waters, although they can also be present at various depths in the water column. It is during this stage that the lobsters settle on the bottom.
It is not known what proportion of the larvae over the Bank are retained by the gyre and what port~on leave the Bank. Surveys on the northeast edge of Georges Bank found Stages Ill and IV occurred both over and off the northern edge of Georges Bank in July and August (Harding ef al. 1995) (Figure 12). During the surveys, stage IV lobsters were more abundant off the northern edge than over the Bank itself and judging from their relative lipid stores, appear to have fed better off the Bank.
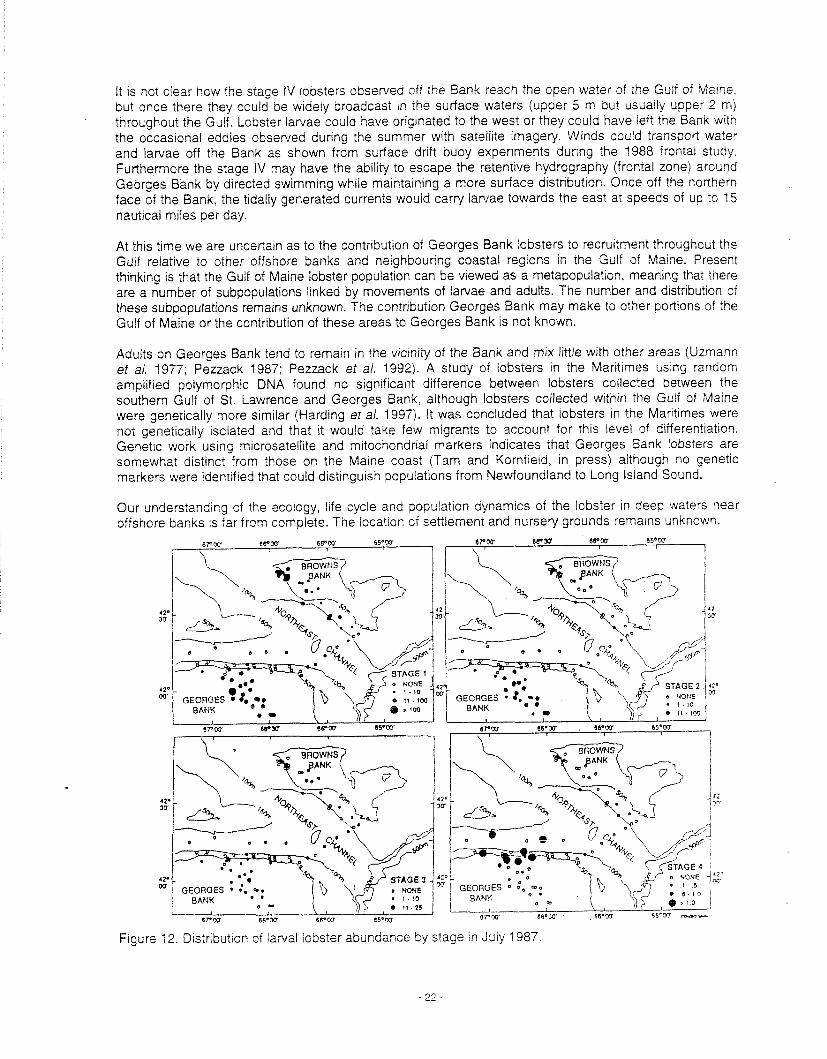
It is not clear how the stage IV lobsters observed off the Bank reach the open water of the Gblf of Malne. but once there they coula be widely broadcast in the surface waters (upper 5 m but usually upper 2 rn) throughout the Gulf. Lobster larvae could have originated to the west or they could have left the Bank with the occasional eddies observed during the summer wlth satellite Imagery. W~nds could transport water and larvae off the Bank as shown from surface drift buoy experiments during the 1988 frontal study Furthermore the stage IV may have the ab~ltty to escape the retentive hydrography (fronral zone) around Georges Bank by directed swimmlng wh~le maintaining a more surface distnbutron. Once off the northern face of the Bank, the tidally generated currents would carry larvae towards the east at speeds of up to 15 nautrcal mrles per day.
At this t~me we are uncertain as to the contribution of Georges Bank lobsters to recruitment throughout the Gulf relat~ve to other offshore banks and neighbouring coastal regrons in the Gulf of Maine. Prese~t thinking IS that the Gulf of Ma~ne lobster population can be viewed as a metapopulatlon, meaning that there are a number of subpopulations linked by movements of iarvae and adults. The number and distribution of these subpopulations remains unknown. The contrrbutron Georges Bank may make to other portions of the Gulf of Mame or the contribution of these areas to Georges Bank IS not known.
Adults on Georges Bank tend to remain in the v~cinity of the Bank and mix little w~th other areas (Uzrnann et a/. 1977; Pezzack 1987; Peuack et a/. 1992). A study of lobsters in the Maritrrnes using random amplified polymorphic DNA iound no signif~cant difference between lobsters collected between the southern Gulf of St. Lawrence and Georges Bank, although lobsters collected wtthin the Gulf of Marne were genetrcally more s~milar (Harding et a/. 1997). It was concluded that lobsters in the Marltimes were not genetically isolated and that it would take few rn~grants to account for th~s level of differentiation Genetic work usrng m~crosatellrte and mltochondr~al markers indicates that Georges Bank lobsters are somewhat dist~nct from those on the Marne coast (Tam and Kornfield. in press) although no genetlc markers were identrf~ed that could distinguish populations from Newfoundland to Long island Sound.
Our understand~ng of the ecology, life cycle and population dynam~cs of the iobster in deep waters near offshore banks 1s far from complete. The location of settlement and nursery grounds remains unknown.
Figure 12. Distribution of larval lobster abundance by stage in July 1987.
- 22 -

Groundfish Resources
Groundfish resources on Georges Bank are managed using DFO fishery statistical unit areas. Figure 13 shows the subareas for Georges Bank. Area 5Ze, referred to below, includes all of the subareas shown in the figure. Much of the scientific information on groundfish stocks is compiled for these areas. The different stocks occupy different geographic extents and this is reflected in the stock units and the reference areas.
Figure 13. DFO fishery statistical unit areas on Georges Bank.
Cod Georges Bank cod prey heavlly on flsh, but crustaceans and molluscs are also Included in their diet. Cod in thls area have a very fast growth rate, reach 50 cm and beg~n to spawn for the flrst time by age 2, and by age 3 almost all are sexually mature (Hunt 1996). Spawn~ng actlvrty IS concentrated on the northeast portron of Georges Bank durrng February/March but occurs over the entire 5Ze area from October to May. Page el a/. (1997) reported that 90% of cod spawnlng occurs after February 8'h and about 50% prior to March 14'~, based on the appearance of stage Ill eggs. Cod eggs and larvae are pelaglc and juveniles settle to the bottom at a length of about 10 cm. Adult cod appear to move from shallow waters about 100 m to deeper water off the edge of the bank ~n response to water temperatures and ~n pursult of prey. More widespread movement within the Gulf of Ma~ne IS known to occur ~ncluding movement from the NEP area towards the Bay of Fundy and the ScotIan Shelf. Results of tagglng experiments on Georges Bank and the adjacent Browns Bank areas are shown In Flgure 14.
In recent years, most of the biomass has been found on the Canadian portion of the Bank (Gavaris et a/. 1993) although substantial seasonal movements relative to the boundary occur.
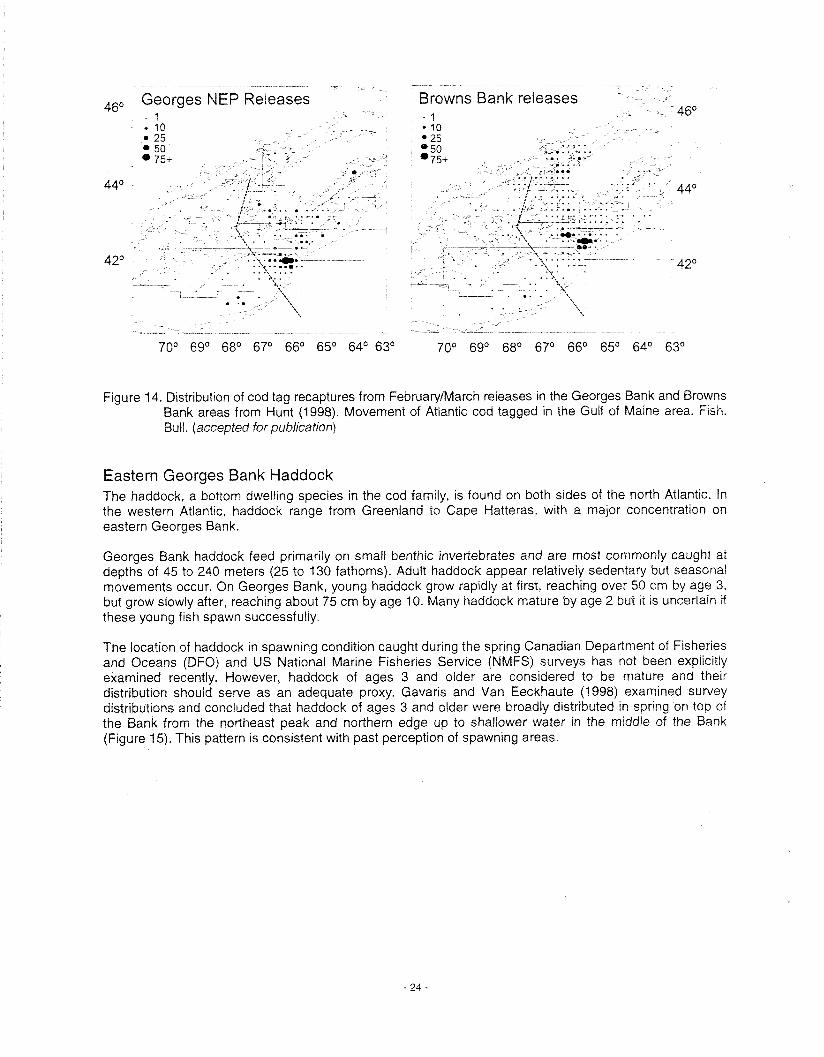
Figure 14. Distribution of cod tag recaptures from February/March releases in the Georges Bank and Browns Bank areas from Hunt (1998). Movement of Atlantic cod tagged in the Gulf of Maine area. Fish. Bull. (accepted for publication)
Eastern Georges Bank Haddock The haddock, a bottom dwelling species in the cod family, is found on both sides of the north Atlantic. In the western Atlantic. haddock range from Greenland to Cape Hatteras, with a major concentration on eastern Georges Bank.
Georges Bank haddock feed primarily on small benthic invertebrates and are most commonly caught at depths of 45 to 240 meters (25 to 130 fathoms). Adult haddock appear relatively sedentary but seasonal movements occur. On Georges Bank, young haddock grow rapidly at first, reaching over 50 cm by age 3, but grow slowly after, reaching about 75 cm by age 10. Many haddock mature by age 2 but it is uncertain if these young fish spawn successfully.
The location of haddock in spawning condition caught during the spring Canadian Department of Fisheries and Oceans (DFO) and US National Marine F~sher~es Service (NMFS) surveys has not been explicitly examined recently. However, haddock of ages 3 and older are considered to be mature and the~r distribution should serve as an adequate proxy. Gavaris and Van Eeckhaute (1998) examined survey distributions and concluded that haddock of ages 3 and older were broadly distributed in spring on top of the Bank from the northeast peak and northern edge up to shallower water in the middle of the Bank (Figure 15). This pattern is consistent with past perception of spawning areas.
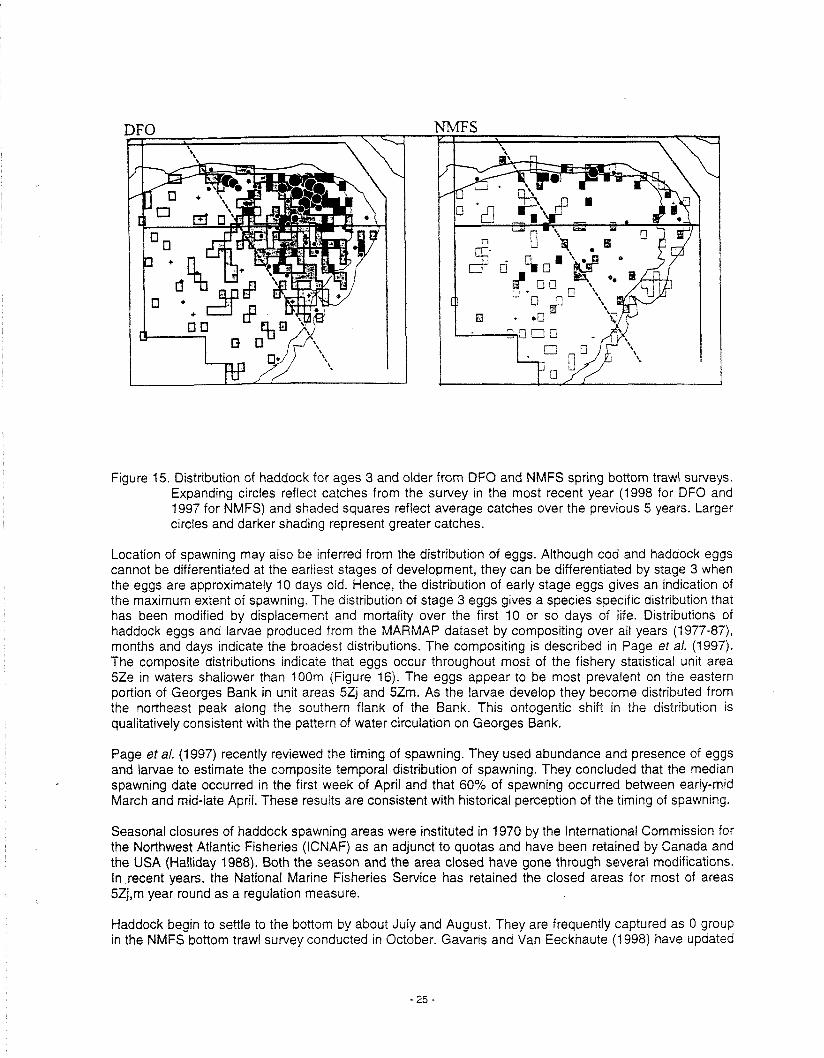
Figure 15. Distribution of haddock for ages 3 and older from DFO and NMFS spring bottom trawl surveys. Expanding circles reflect catches from the survey in the most recent year (1998 for DFO and 1997 for NMFS) and shaded squares reflect average catches over the previous 5 years. Larger circles and darker shading represent greater catches.
Location of spawning may also be inferred from the distribution of eggs. Although cod and haddock eggs cannot be differentiated at the earliest stages of development, they can be differentiated by stage 3 when the eggs are approximately 10 days old. Hence, the distribution of early stage eggs gives an indication of the maximum extent of spawning. The distribution of stage 3 eggs gives a species specific distr~bution that has been modified by displacement and mortality over the first 10 or so days of life. Distributions of haddock eggs and larvae produced from the MARMAP dataset by compositing over all years (1977-87), months and days indicate the broadest distributions. The composlting is described in Page et a/. (1997). The composite distributions indicate that eggs occur throughout most of the fishery statistical unit area 5Ze in waters shallower than 100m (Figure 16). The eggs appear to be most prevalent on the eastern portion of Georges Bank in unit areas 5Zj and 5Zm. As the larvae develop they become distributed from the northeast peak along the southern flank of the Bank. This ontogentic shift in the distribution is qualitatively consistent with the pattern of water circulation on Georges Bank.
Page et a/. (1997) recently reviewed the timing of spawning. They used abundance and presence of eggs and lawae to estimate the composite temporal distribution of spawning. They concluded that the median spawning date occurred in the first week of April and that 60% of spawning occurred between early-mid March and mid-late April. These results are consistent with historical perception of the timing of spawning.
Seasonal closures of haddock spawning areas were instituted in 1970 by the International Commission for the Northwest Atlantic Fisheries (ICNAF) as an adjunct to quotas and have been retained by Canada and the USA (Halliday 1988). Both the season and the area closed have gone through several modifications. In recent years, the National Marine Fisheries Service has retained the closed areas for most of areas 5Zj,m year round as a regulation measure.
Haddock begin to settle to the bottom by about July and August. They are frequently captured as 0 group in the NMFS bottom trawl survey conducted in October. Gavaris and Van Eeckhaute (1998) have updated

the information on distribution of juvenile haddock using recent bottom trawl surveys. Haddock appear to be broadly distributed over the Bank as 0 group and tend to start concentrating on the northern edge and northeast peak as they age (Figure 17). Overholtz (1985) examined the distribution of two dominant year classes 1975 and 1978, and observed that the distribution of age 2 haddock suggested a movement by summer to deeper water relative to the shallower depths generally occupied in spring. Van Eeckhaute ef al. (in press) concluded that juvenile haddock show a directional migration towards the northeast between ages 0 and 2. By age 2, they begin to display the seasonal migration associated with spawning, which is evident for adult haddock. (Figure 18)
Adult haddock move up onto the Bank between December and April for spawning and subsequently move to deeper water on the edge and slopes of the Bank where they reside during summer and fall. Colton (1955) reported that during spring, the greatest concentrations of larger haddock occurred in shallow water less than 110 m but that few haddock of any age were found shallower than 165 m during the July/August surveys undertaken in 1949 and 1950. Gavaris and Van Eeckhaute (1998) updated the information on distribution from the fall NMFS surveys and when these results are compared to the spring distribution (Figure 15) the historical pattern continues to be evident. The analysis of seasonal migration (Van Eeckhaute e l a/. in press) supports this interpretation and shows a net southwest migration across the Canada/USA boundary towards shallower depths during winter and a net northeast migration towards deeper slopes during the summer (Figure 18).
Stage1
Stage 2
Stage 3
Figure 16. Distributions of haddock eggs and larvae derived from the MARMAP dataset. Left-hand column shows morphological stages of egg development 7-3 (Page et al. 1997). Right-hand column shows larval stages by length intervals of 3-5 mm, 6-8 mm, 9-11 mm and 12-15 mm, respectively.

WlFS fall: age!
N?/LFS spnng: age ! f )yO spnng: age I \
DFO sunng. I ge 2
Figure 17. D~str~butron of juvenrle haddock from DFO and NMFS research surveys. Expanding clrcles reflect catches from the survey in the most recent year (1998 for DFO and 1997 for NMFS) and shaded squares reflect average catches over the prevlous 5 years. Larger circles and darker shading represent greater catches.
Net rnigratlon to Canad~an side I i A p r I - Sept. 30 /
3 Ocr. 1 - Mar. 31
Figure 18. Net migration rates (expressed as annual rates) across the Canada/USA boundary for 6-month time perrods for Georges Bank haddock. These rates show that during April ro September, net haddock mrgratron IS towards the northeast resuitfng rn almost all haddock residtr?g on the CanadIan portion In the fall. From October to March, haddock move toward the southwest, a mrgration associated iivrth spawnlng actrv~tres.
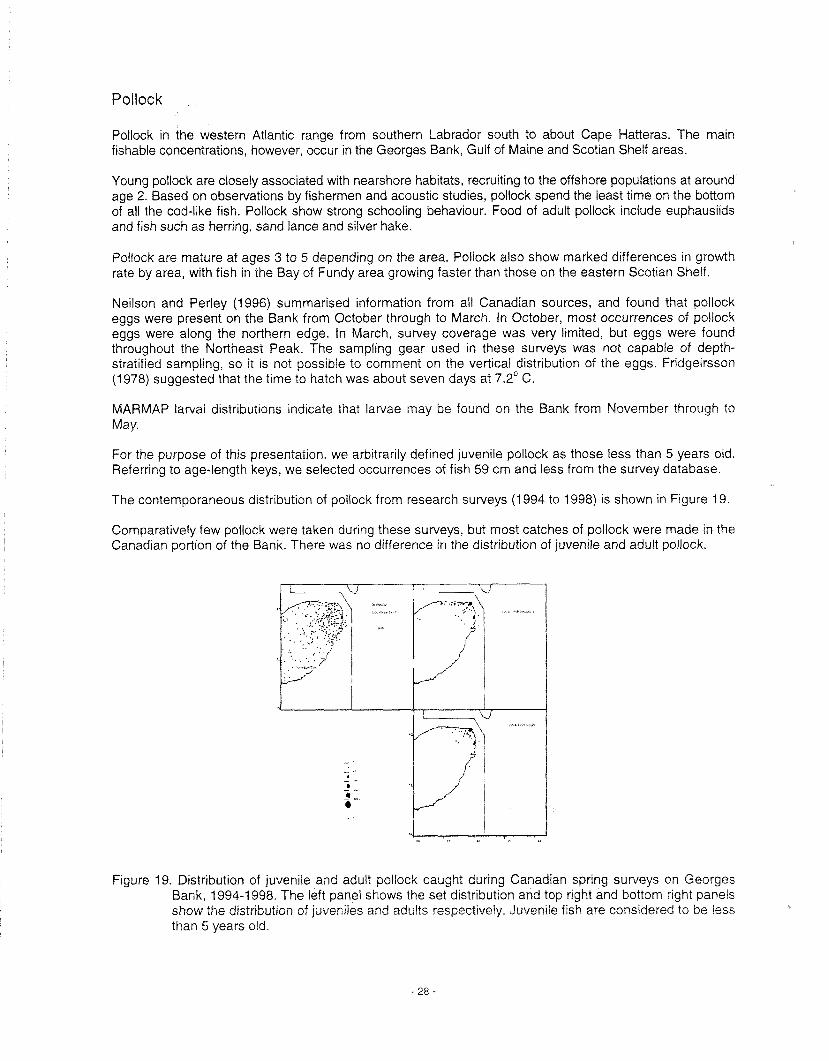
Pollock
Pollock in the western Atlantic range from southern Labrador south to about Cape Hatteras. The main fishable concentrations, however, occur in the Georges Bank, Gulf of Maine and Scotian Shelf areas.
Young pollock are closely associated with nearshore habitats, recruiting to the offshore populations at around age 2. Based on observations by fishermen and acoustic studies, pollock spend the least time on the bottom of all the cod-like fish. Pollock show strong schooling behaviour. Food of adult pollock include euphausiids and fish such as herring, sand lance and silver hake.
Pollock are mature at ages 3 to 5 depending on the area. Pollock also show marked differences in growth rate by area, with fish in the Bay of Fundy area growing faster than those on the eastern Scotian Shelf.
Neilson and Perley (1996) summarised information from all Canadian sources, and found that pollock eggs were present on the Bank from October through to March. In October, most occurrences of pollock eggs were along the northern edge. In March, survey coverage was very limited, but eggs were found throughout the Northeast Peak. The sampling gear used in these surveys was not capable of depth- stratified sampling, so it is not possible to comment on the vertical distribution of the eggs. Fridgeirsson (1 978) suggested that the time to hatch was about seven days at 7.2' C.
MARMAP larval distributions indicate that larvae may be found on the Bank from November through to May.
For the purpose of this presentation, we arbitrarily defined juvenile pollock as those less than 5 years old. Referring to age-length keys, we selected occurrences of fish 59 cm and less from the survey database.
The contemporaneous distribution of pollock from research surveys (1994 to 1998) is shown in Figure 19.
Comparatively few pollock were taken during these surveys, but most catches of pollock were made in the Canadian portion of the Bank. There was no difference in the distribution of juvenile and adult pollock.
Figure 19. Distribution of juvenile and adult pollock caught during Canadian spring surveys on Georges Bank, 1994-1998. The left panel shows the set distribution and top right and bottom right panels show the distrtbution of juveniles and adults respect~vely. Juvenile fish are considered to be less than 5 years old.

Yellovvtail Flounder
Yellowtail flounder range from Labrador to Chesapeake Bay and are considered relatively sedentary. A major concentration of yellowtail occurs on Georges Bank to the east of the Great South Channel. While tagging work indicates limited movement from Georges Bank to adjacent areas, knowledge of seasonal movement of yellowtail flounder on Georges Bank is poor. Yellowtail flounder are most commonly caught at depths between 37 and 73 meters (20 and 40 fathoms).
On Georges Bank, spawning occurs during the late spring period peaking in May. From the distribution of both ichthyoplankton and mature adults, it appears that spawning occurs on both sides of the International Boundary. Yellowtail flounder appear to have variable maturity schedules, with age 2 females considered 40% mature during periods of high stock biomass to 90°/~ mature during periods of low stock biomass.
The eggs of yellowtail flounder are buoyant. Neilson et a/. (1 986) described the distributions of eggs on the Northeast Peak of Georges Bank during surveys conducted from February to June of 1983 and February to May of 1984. Only late stage eggs of yellowtail flounder were discussed, as the early stage eggs cannot be positively identified.
The spatial distributions of yellowtail flounder eggs from this source were poorly resolved, since less than 20 stations were within the area of interest on Georges Bank, and only included Canadian waters. However, yellowtail flounder eggs were caught at most of the stations occupied.
Smigielski (1979) has found yellowtail flounder eggs hatch in a week at 10' C. Assuming temperatures of about 5' C, an incubation time of about 2-3 weeks is implied. Eggs were found in the surveys as early as April indicating that spawning was underway as early as late March.
MARMAP distributions of yellowtail indicate that the larvae occupy the Bank in April through to August. The largest catches of larvae occurred on the southern half of the Bank, typically in May and June. However, the coverage of the Canadian portion of the Bank was sometimes incomplete.
Smith eta/. (1978) studied the die1 vertical movements of larval yellowtail flounder near Long Island New York. They found that the amplitude of the migrations increased with the size of larvae, and recently hatched larvae remained just below the thermocline.
Recent Canadian spring survey data of the distribution of juvenile and adult flounder are shown on Figure 20.
The centre of the distribution of both juvenile and adult yellowtail flounder is in Canadian waters close to the International Boundary. The resource has been expanding its range in recent years.

Figure 20. Distribution of juvenile and adult yellowtail flounder caught during Canadian spring surveys on Georges Bank, 1994-98. The left panel shows the set distribution and top right and bottom right panels show the distribution of juveniles and adults respectively. Juvenile fish are considered to be less than 3 years old.
Herring
During the winter (November to March) Georges Bank herring were scattered from their southern extreme to the northeastern tip, with the bulk of the fish in February and March occurring south of Cape Cod (offshore waters off Long Island, in the Hudson Canyon and further south). In spring herring move from over-wintering areas to the southern part of Georges Bank where their numbers increase as summer approaches (Zinkevich 1967). Herring remain on the Bank for feeding and spawning until late Octoberiearly November when they disperse and slowly move south to over-wintering areas.
The distribution of adults during the spawning period (September-November) is summarised from the research survey data. Figure 21 depicts the location of adult herring on Georges Bank for 1966. 1975, 1988 and 1996 and can be generally considered an indication of spawning areas. Data from Canadian fali surveys (1987-95) indicates a similar trend with adults concentrated on the northern flank of the Bank from the Great South Channel to the Northeastern Peak (Melvin eta/. 1996).
The geographical distribution of larvae by year (all s~zes) collected during the 1987-1995 larval surveys IS
presented in Figure 22. The figure depicts the spread of larvae from primarily the eastern portion of the Bank during early years of recovery to almost complete coverage for the last two years of surveys (1994- 95). Lawal abundance as measured by the mean number of larvae per m-* also increased throughout the survey period.
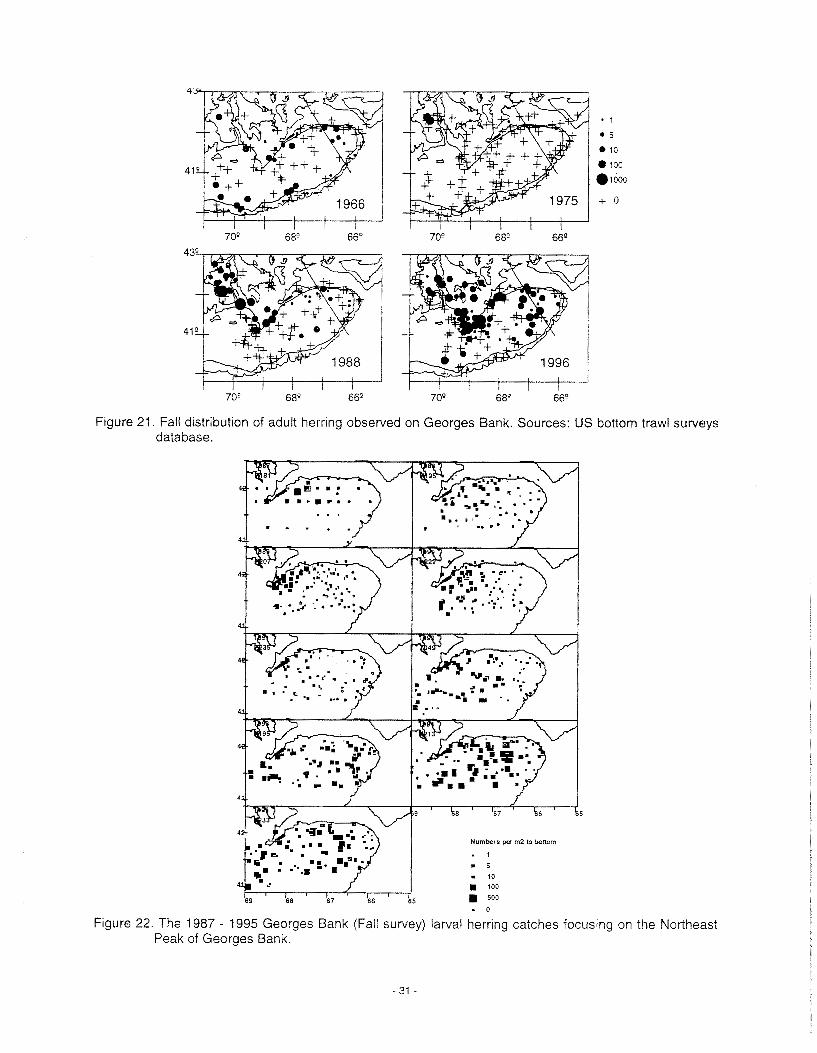
Figure 21. Fall distribution of adult herring observed on Georges Bank. Sources: US bottom trawl surveys database.
5
Numbers w m2 to bottom
1
1 5 . 10 100
- 0
Figure 22. The 1987 - 1995 Georges Bank (Fall survey) larval herring catches focusing on the Northeast Peak of Georges Bank.

Exam~nation of the distribution and abundance of larvae <I0 mm (generally considered an indication of spawning areas) for 1993 - 1995 showed a marked change from most of the earlier surveys. During the early years of the recovery (1 987-91) no small larvae were observed on the Canadian portion of the Bank. In 1992 two aggregations of larvae were found just east of the International Boundary suggesting that herring had, for the first time since the collapse, re-occupied their historical spawning grounds on the eastern portion of the Bank. In 1994 there was an apparent reduction of young larvae in the vicinity of Little Georges and Cultivator Shoals where most spawning occurred during the early stages of the recovery. This trend continued into 1995 with an almost complete absence of small larvae in the area where spawning was first detected. It now appears that the majority of spawning is occurring further eastward in the historical areas on the northeastern portion of the Bank. In 1994 and 1995 a large concentration of large and small herring larvae was observed near the southern extreme of the Canadian survey grid, suggesting spawning may be occurring south of the coverage area. In fact, in 1995 the largest concentration of larvae in a single set was taken in this area.
Herring eggs are adhesive and attach to the gravel substrate or benthic vegetation for 10-12 days before hatching. Once hatched, larval herring become pelagic and remain in the water column on Georges Bank for a period of up to 6 months when they metamorphose into juvenile fish. Their movements during the first year of life are uncertain. It is known that some portion remain on the Bank throughout the year while others appear to move into the coastal waters of Maine and perhaps New Brunswick.
Anthony and Waring (7980) showed a strong relationship between the predicted recruitment of age 3 herring from Georges Bank and the catch of juvenile fish along the Maine coast. Juvenile herring from coastal Maine are known to migrate north during the summer to waters of southern New Brunswick and form a major component of the weir fishery. Sinclair et a/. (1981) also noted a shift in the length characteristics of juvenile herring from the Passamaquoddy Bay, N.B., area coincident with the collapse of the Georges Bank Stock.
The stock collapsed in 1977 due to over fishing and poor recruitment. Between 1978 and 1984 virtually no adult or larval herring were detected on the Bank by USA fall research surveys. The first sign of recovery occurred in 1984 when the Canadian R N Alfred Needier collected more than 200 juvenile (age I+) herring in a mid-water trawl (IGYPT) on Georges Bank (Stephenson and Power 1989). However, it wasn't until 1986 that significant evidence appeared in both Canadian and US research surveys to indicate the stock was recovering. Canadian bottom trawl by-catches in the fall of 1986 were dominated by three-year olds from the 1983 year-class. The first observed spawning on historical grounds on the northeastern port~on of the Bank was reported in October of 1992 (Melvin and Fife 1993).
Since 1986, data collected by Canadian and US larval and bottom trawl surveys indicate the stock has expanded in numbers and distribution. Canada's last review of this stock in 1996 estimated a 3+ biomass of 100,000 to 200,000 t. However, recent reports from US surveys show the presence of several strong year-classes and suggest that abundance may have recovered to a level which exceeds the mid-sixties (Anon. 1994).

Mackerel Adult mackerel occupy Georges Bank for about a month in the spring and the fall during their annual spawning migration to the Gulf of St. Lawrence and their return to southern waters.
Large Pelagics The shelf and slope water of Georges Bank provide important foraging habitat for several large pelagic species (swordfish and tunas, including bluefin, bigeye, yellowfin and albacore) during their seasonal feeding migrations along the edge of the continental shelf. In addition, immature swordfish and bluefin tuna are attracted to the Bank during the summer to take advantage of the plentiful prey.
The distribution and relative abundance of large pelagics in the Canadian Fishing Zone is greatly influenced by oceanographic conditions and food availability and can vary considerably both seasonally and geographically from one year to the next. However, the shelf and slope waters of Georges Bank consistently provide an important foraging habit for all large pelagic species. Other features of this region, including the influence of warm core rings from the Gulf Stream, allow smaller, immature swordfish and bluefin tuna (which are less tolerant to cold water) to migrate into the region during summer months to take advantage of the higher levels of productivity and availability of prey. Therefore, the waters seaward of Georges Bank also provide an important foraging habitat for these pre-recruits to the fishery.
Sharks Ten species of sharks are regularly found on or around Georges Bank. These include porbeagle, thresher, basking, shortfin mako, oceanic whitetip, blue, dusky, smooth hammerhead, spiny dogfish and black dogfish.
Porbeagle sharks are large. fast-swimming, cold-water sharks that feed primarily on fish. Their range through the summer and fall is largely restricted to the coastal waters of eastern Canada, and is characterised by a generally northward migration through the course of the year. However, the return migration in winter is believed to take them to an overwintering ground near or south of Georges. Pupping probably occurs around Georges in late winter or early spring, after which the northward migration towards the Scotian Shelf begins once again. While winter distribution and biological information is still scanty, our current information suggests that the area around Georges is the key, and perhaps the only, pupping ground for porbeagle sharks in the NW Atlantic.
Spiny dogfish are an occasionally abundant small shark species of the coastal NW Atlantic. While their commercial value is often low, their relative abundance suggests that they are an important component of the ecosystem between Newfoundland and North Carolina. Spiny dogfish carry out a well-documented annual migration that takes them over or near Georges Bank twice each year: in March-April as they move north, and again in late fall as they move south. Thus Georges Bank lies midway along their migration route.
Basking sharks are very large, slow-moving, plankton-feeding sharks found in coastal waters of Canada and the Gulf of Maine in summer. While they are not restricted to Georges Bank during the summer, their plankton-feeding habits set them apart from most other sharks, and may make them more susceptible to contaminants accumulated in the lower trophic levels. Basking sharks form mating aggregations each summer, suggesting that Georges Bank may also serve as one of the mating grounds for this species.
Squid The U.S. has commercially exploited short-finned and long-finned squid in the Gulf of Maine area. Both species migrate considerable distances and are in the Gulf of Maine area only in summer and fall. The abundance of both species in the Gulf of Maine area is highly variable from year to year due to their short life span and highly migratory nature.

Seasonal Use of the Bank The species described above spend some or all of their life stages on the Bank. For many of these species, the spawning period is a particularly sensitive time when their eggs and subsequently their larvae are exposed to natural and human-made perturbations. Supported by the high year-round productivity of the Bank, a high diversity of organisms can coexist by spreading their spawning activities out seasonally throughout the year (Table 2).
Table 2. Approximate peak times when activities or life stages of selected commercial species occur on Georges Bank.
I Month
V) OTHER SPECIES OF INTEREST In addition to the species of commercial importance, there are numerous other species that are part of the ecosystem and interact biologically within the system. Some are essential as prey species, such as sand lance (Figure 9). Some are valued for non-commercial reasons, such as right whales, marine turtles and corals. Marine mammals are discussed below. Due to a lack of expertise, some ecosystem components were not considered in this review. Of particular note are seabirds that are an important component of the Georges Bank ecosystem and may be susceptible to the activities under review. There 1s substant~al knowledge about seabirds in this area and the potential Impacts of explorat~on act~vrty on this ~mportant and sensitive ecosystem component needs to be addressed.
Marine Mammals The two major orders of marine mamma!^, the whales and dolphins (Order Cetacea) and the seals (Order Pinnipedia) are both represented on Georges Bank, in the Gulf of Maine and on the southern ScotIan Shelf that encompass the moratorium lands of Georges Bank. About 23 species of cetaceans and 4 species of seals have been sighted ~n these areas. In the case of cetaceans, two or more species of beaked whales, pilot whales and spotted dolphins are likely present but not reported (Kenney eta/. 1997).
Data on the seasonal abundance of cetaceans in the area are taken from Kenney et a\. (1997). For most species, these abundances are based on surveys conducted between 1979 and 1982 during the Cetacean and Turtle Assessment Program (CETAP 1982). More recent data are available for a subset of cetacean species (e.g., harbour porpoise, minke whale) based on surveys conducted by NMFS. Few quantitative data are available on the distribution and abundance of seals in the area.
In this section the preferred habitat, residence time, distribution and diet of the most common species in the study area are summarised, as well as the significance of the study area for the species. Unless otherwise indicated the followrng sources were used: Wh~tehead et a/. (1998); Kenney et a/. (1997); Katona et a/. (1 993).

Pinnipeds Two species are known to frequent the study area: the grey seal (Halichoerus grypus) and the harbour seal (Phoca vitulina). However, only the grey seal is likely to be common. Tag returns and recent telemetry studies indicate that both juveniles and adult grey seals forage in the study area (Stobo et al. 1990, W.D. Bowen unpubl. data). Grey seals are likely most abundant in the study area during the summer and fall. However, these studies do not indicate how many grey seals use this area. Although the diet of grey seals has not been studied on Georges Bank, data from other areas would suggest the sandlance, herrlng and flatfish may be the most important foods. There are several coastal sites in the Gulf of Maine where small numbers of pups are born in January. However, the major breeding sites are further north from Sable Island to the Gulf of St. Lawrence.
Harbour seals inhabit the coastal areas of the Gulf of Maine and Bay of Fundy year round. Harbour seals give birth to a single pup in May and June at a number of coastal sites. Little is known of the extent to which harbour seals use this offshore area but it would likely be on a seasonal basis by small numbers of individuals.
Cetaceans Of the 23 or so species of cetaceans, only a subset IS abundant seasonally and the study area does not represent the core distribution for any of them. In other words, the range of each of these species IS far broader than the boundaries of the study area. Table 3 summarises estimates of the seasonal abundance of the more common species on Georges Bank. However, it IS important to emphasise that most of this ~nformation IS more than a decade old and the current s~tuation may be somewhat different.
Table 3. Relative seasonal abundance of the more common cetaceans on Georges Bank (adapted from Kenney et a/. 1 997).
Season Species Winter Spring Summer Fall Right whale + + Fin whale + ++ + + Sei whale + ++ + + Minke whale +++ + Humpback whale + + + Sperm whale + + ++ + Bottlenose whale + Beaked whales + + + Pilot whales + +++ +++ + Risso's dolphin + ++ ++ Bottlenose dolphin + ++ ++ + W hite-sided dolphin + ++ +++ +++ Common dolphin +++ ++ + +++ Striped dolphin + ++ ++ Spotted dolphin + + Harbour porpoise + +++ +, ++, +++ corresponds to low, medium and high abundance
Right whale (Eubalaena glacialis) This endangered 15-m species appears to use the study area mainly to transit from wintering areas further south to feeding areas in Canadian waters. One of its major feeding areas is just north of the Great South Channel. In recent years, the most important feeding area has been in the Bay of Fundy, but Roseway Basin, on the southwestern Scotian Shelf near Browns Bank, has been an important summer habitat for this species. Right whales feed mainly on copepods and euphausrids and are thought to be restricted to high concentrations of prey in order to feed efficiently. Significant threats to this species include collisions with large vessels and entanglement in fixed fishing gear.

Fin whale (Balaenopfera physalus) The fin whale is the second largest of all whales, reaching 24 m in length in the northern hemisphere. Fin whales are bulk feeders taking schooling fishes, zooplankton and squids. Fin whales are present in the study area throughout the year, although there is undoubtedly some turnover of the individuals using the area as the species exhibits seasonal migrations in the western north Atlantic. This species is quite widespread along northeastern United States and on the Scotian Shelf (Kenney eta/. 1997).
Sei whale (Balaenoptera borealis) The Sei whale reaches 18 m in length in the northern hemisphere and feeds by skimming the surface for copepods and other zooplankton. Sei whales are present in the study area at all times of the year, but again there is undoubtedly some turnover of the individuals using the area. This species is widespread in eastern north Atlantic waters.
Minke whale (Balaenoptera acutorostrata) The smallest of the baleen whales at about 9 m in length, minke whales are often seen alone and are widely distributed. They feed primarily on schools of fish and zooplankton. Along the USA northeastern shelf including Georges Bank, fish are thought to dominate the diet. They are most abundant in the study area during the spring, but are also seen during the summer.
Humpback whale (Megaptera novaeangliae) The 14-m humpback whale is a bulk feeder, taking mainly schooling fishes, but also some squids and euphuasiids. Humpback whales undergo extenswe seasonal migrations and thus are absent or rare during the winter in the study area. The population structure of this wide-ranging species is well understood both from photographic identifications of individuals (Katona and Beard 1990) and recent genetic studies. There are a number of quite distinct feeding aggregations, one of which occurs In the Georges BanWGulf of Maine area with a population size of several hundred individuals.
Sperm whale (Physeter macrocephalus) The sperm whale is the largest of the toothed whales and males (up to 18 m) are much larger than females (about 10 m). It is generally a deep-water species where it feeds mainly on mesopelagic and benthic squids, but fishes are also taken. Females and young are usually found at latitudes less than about 40°, such that sperm whales on Georges Bank and surrounding area are typically males. Here they are found mainly near the continental slope. Sperm whales off eastern United States and Canada are thought to belong to a single north Atlantic population.
Pilot whale (Globicephalus melaena) The long-finned pilot whale is an abundant, wide-ranging species reaching about 6 m in length. It IS a highly social (common school size up to 80 individuals) and vocal toothed whale which feeds primarily on squid. As such they tend to occur at the edge of the continental shelf. They are most abundant during the spring and summer, but are present in the study area throughout the year.
Bottlenose dolphln (Tursiops truncatus) Likely the most familiar and best-studied of the small toothed whales, the bottlenose dolphin (2-3 m) is a common, wide-ranging species. They appear to have a broad diet consisting of fish, squids and invertebrates. An offshore form of this species inhabits the study area throughout the year.
White-sided dolphin (Lagenorhynchus acutus) Probably the most abundant cetacean in the study area, this 2.5-m species is again wide-ranging. It is a highly social species with schools of 50 seen often and schools up to 500 are not uncommon. In the study area, white-sided dolphins feed mainly on fish such as sandlance, herring, silver hake, but squid are also taken. This species likely move further south in the winter, but is abundant at other times of the year.
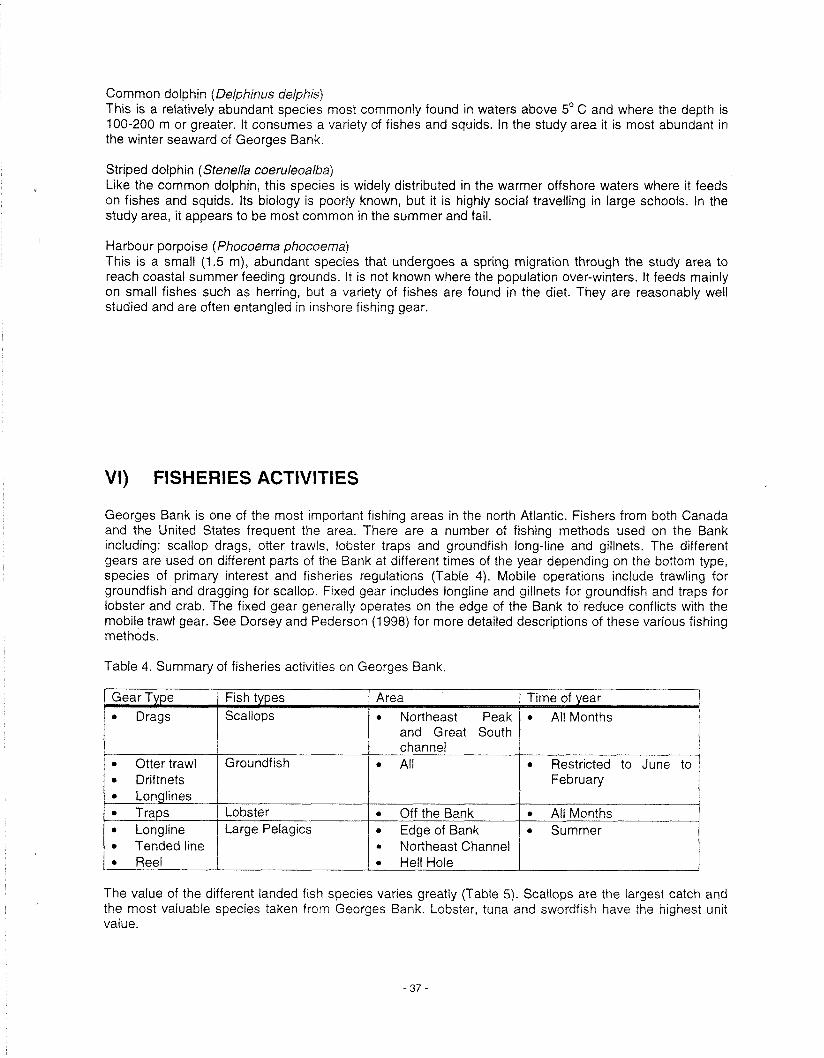
Common dolphin (Debhinus delphis) This is a relatively abundant species most commonly found in waters above 5' C and where the depth is 100-200 m or greater. It consumes a variety of fishes and squids. In the study area it is most abundant in the winter seaward of Georges Bank.
Striped dolphin (Stenella coeruleoalba) Like the common dolphin, this species is widely distributed in the warmer offshore waters where it feeds on fishes and squids. Its biology is poorly known, but it is highly social travelling in large schools. In the study area, it appears to be most common in the summer and fall.
Harbour porpoise (Phocoema phocoema) This is a small (1.5 m), abundant species that undergoes a spring migration through the study area to reach coastal summer feeding grounds. It is not known where the population over-winters. It feeds mainly on small fishes such as herring, but a variety of fishes are found in the diet. They are reasonably well studied and are often entangled in inshore fishing gear.
VI) FISHERIES ACTIVITIES
Georges Bank is one of the most important fishing areas in the north Atlantic. Fishers from both Canada and the United States frequent the area. There are a number of fishing methods used on the Bank including: scallop drags, otter trawls, lobster traps and groundfish long-line and gillnets. The different gears are used on different parts of the Bank at different times of the year depending on the bottom type, species of primary interest and fisheries regulations (Table 4). Mobile operations include trawling for groundfish and dragging for scallop. Fixed gear includes longline and gillnets for groundfish and traps for lobster and crab. The fixed gear generally operates on the edge of the Bank to reduce conflicts with the mobile trawl gear. See Dorsey and Pederson (1998) for more detailed descriptions of these various fishing methods.
Table 4. Summary of fisheries activities on Georges Bank.
The value of the different landed fish species varies greatly (Table 5). Scallops are the largest catch and the most valuable species taken from Georges Bank. Lobster, tuna and swordfish have the highest unit value.
ended line Reel
~ogheast Channel , Hell Hole
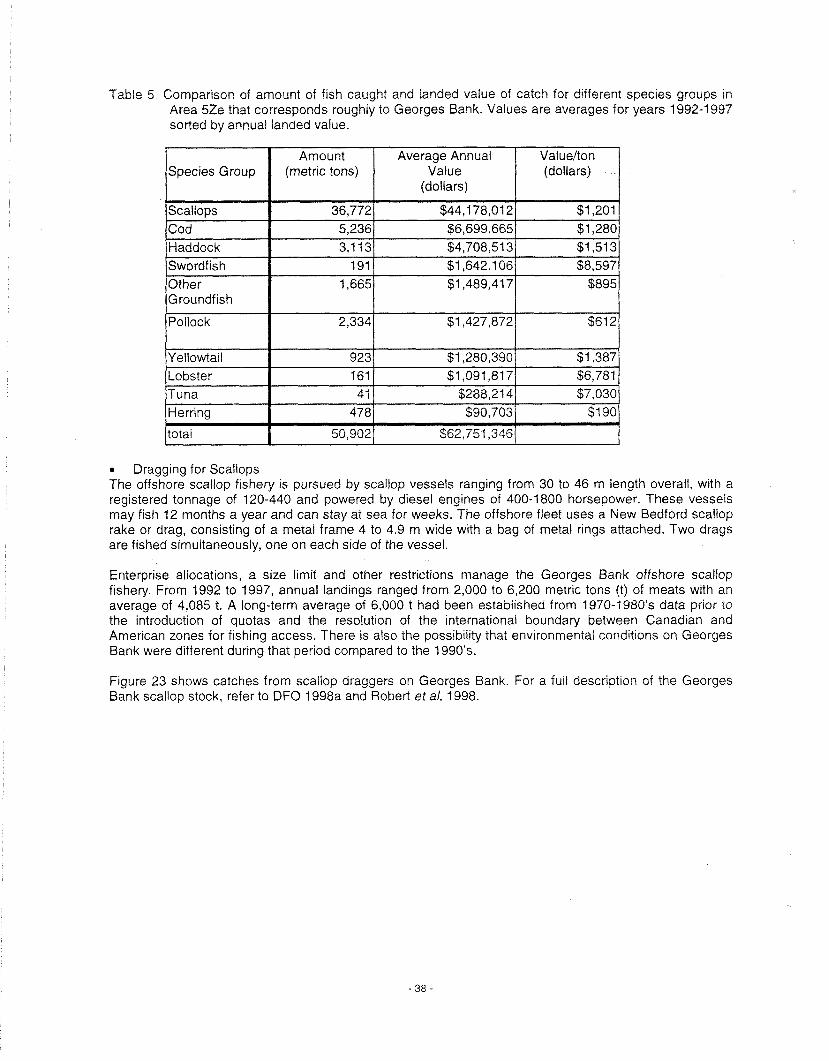
Table 5 Comparison of amount of fish caught and landed value of catch for different species groups in Area 5Ze that corresponds roughly to Georges Bank. Values are averages for years 1992-1997 sorted by annual landed value.
Dragging for Scallops The offshore scallop fishery is pursued by scallop vessels ranging from 30 to 46 m length overall, with a registered tonnage of 120-440 and powered by diesel engines of 400-1800 horsepower. These vessels may fish 12 months a year and can stay at sea for weeks. The offshore fleet uses a New Bedford scallop rake or drag, consisting of a metal frame 4 to 4.9 m wide with a bag of metal rings attached. Two drags are fished simultaneously, one on each side of the vessel.
Enterprise allocations, a size limit and other restrictions manage the Georges Bank offshore scallop fishery. From 1992 to 1997, annual landings ranged from 2,000 to 6,200 metric tons (t) of meats with an average of 4,085 t. A long-term average of 6,000 t had been established from 1970-1980's data prror to the introduction of quotas and the resolut~on of the international boundary between Canadian and Amer~can zones for flshing access. There is also the possibtlity that envtronmental conditions on Georges Bank were different during that period compared to the 1990's.
Figure 23 shows catches from scallop draggers on Georges Bank. For a full description of the Georges Bank scallop stock, refer to DFO 1998a and Robert et a/. 1998.

Figure 23. Distributions of commercial catch of scallops in areas 4X and 5Ze from drags aggregated by month and by 10-minute squares for 1993-1 997 from log data.
- 39 -
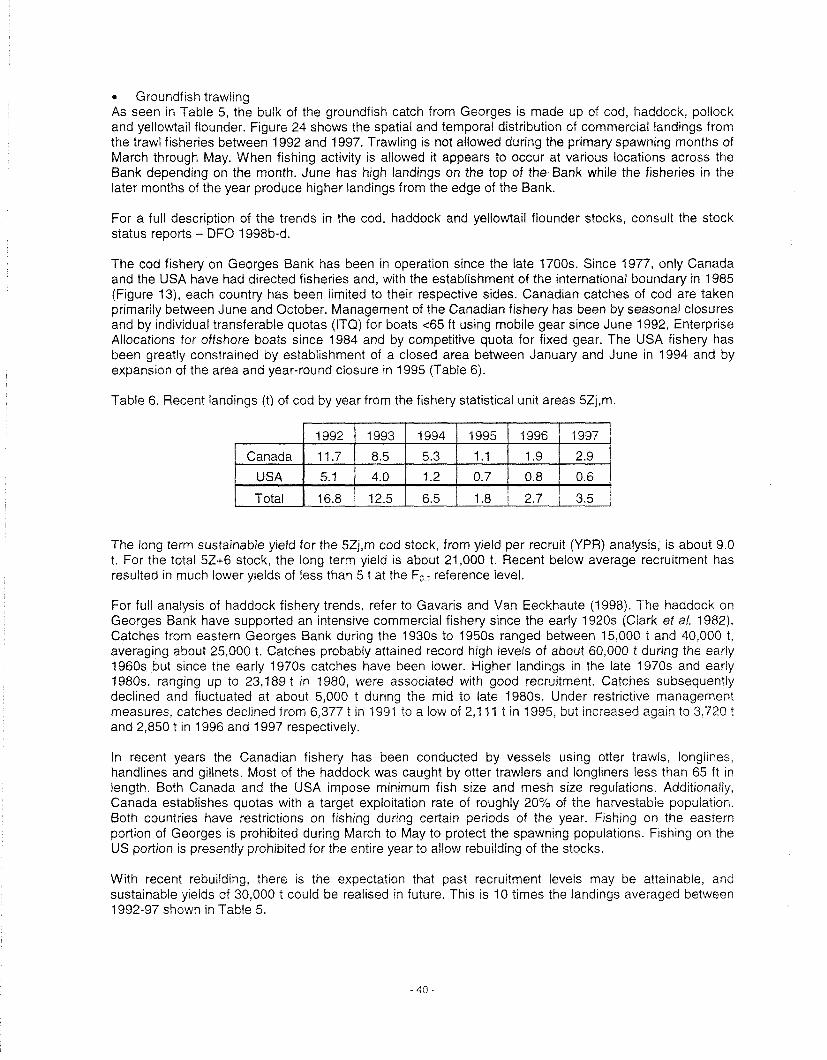
Groundfish trawling As seen in Table 5, the bulk of the groundfish catch from Georges is made up of cod, haddock, pollock and yellowtail flounder. Figure 24 shows the spatial and temporal distribution of commercial landings from the trawl fisheries between 1992 and 1997. Trawling is not allowed during the primary spawning months of March through May. When fishing activity is allowed it appears to occur at various locations across the Bank depending on the month. June has high landings on the top of the Bank while the fisheries in the later months of the year produce higher landings from the edge of the Bank.
For a full description of the trends in the cod, haddock and yellowtail flounder stocks, consult the stock status reports - DFO 1998b-d.
The cod fishery on Georges Bank has been in operation since the late 1700s. Since 1977, only Canada and the USA have had directed fisheries and, with the establishment of the international boundary in 1985 (Figure 13), each country has been limited to their respective sides. Canadian catches of cod are taken primarily between June and October. Management of the Canadian fishery has been by seasonal closures and by individual transferable quotas (ITQf for boats <65 ft using mobile gear since June 1992, Enterprise Allocations for offshore boats since 1984 and by competitive quota for fixed gear. The USA fishery has been greatly constrained by establishment of a closed area between January and June in 1994 and by expansion of the area and year-round closure in 1995 (Table 6).
Table 6. Recent landings (t) of cod by year from the fishery statistical unit areas 5Zj,m.
The long term sustainable yield for the 5Zj,m cod stock, from yield per recruit (YPR) analysis, is about 9.0 t. For the total 5Z+6 stock, the long term yield is about 21.000 t. Recent below average recruitment has resulted in much lower yields of less than 5 t at the Fo reference level.
For full analysrs of haddock f~shery trends, refer to Gavaris and Van Eeckhaute (1998). The haddock on Georges Bank have supported an intensive commercial fishery since the early 1920s (Clark et a/. 1982). Catches from eastern Georges Bank during the 1930s to 1950s ranged between 15,000 t and 40,000 t, averaging about 25,000 t. Catches probably attained record high levels of about 60,000 t during the early 1960s but since the early 1970s catches have been lower. Higher landings in the late 1970s and early 1980s, rangrng up to 23,189 t in 1980, were assocrated with good recruitment. Catches subsequently declined and fluctuated at about 5,000 t during the mid to late 1980s. Under restrictive management measures, catches declined from 6,377 t in 1991 to a low of 2,111 t in 1995, but increased again to 3,720 t and 2,850 t In 1996 and 1997 respectively.
In recent years the Canadian fishery has been conducted by vessels using otter trawls, longlines, handlines and gillnets. Most of the haddock was caught by otter trawlers and longliners less than 65 ft in length. Both Canada and the USA impose minimum fish size and mesh size regulations. Additionally, Canada establishes quotas with a target exploitation rate of roughly 20% of the harvestable population. Both countries have restrictions on fishing during certain periods of the year. Fishing on the eastern portion of Georges is prohibited during March to May to protect the spawning populations. Fishing on the US portion is presently prohibited for the entire year to allow rebuilding of the stocks.
With recent rebuilding, there is the expectation that past recruitment levels may be attainable, and sustainable yields of 30,000 t could be realised in future. This is 10 times the landings averaged between 1992-97 shown in Table 5.

Recent landings (000s t) of pollock by Canada are summarised in the table below, along with the total allowable catch (TAC) for the management unit:
Table 7. Recent Canadian landings of pollock (000s t) by year. Also shown is the TAC.
The potential yield that could be ascribed to the Georges Bank portion of the management unit is not known at present. However, from 1974 to 1998, average annual Canadian landings of pollock from Georges Bank were 2932 t, and comprised 10.6% of landings from the entire management unit. USA removals during the recent period that could be specifically ascribed to Georges Bank are not known.
Recent landings of yellowtail by Canada and the USA are summarised in Table 8 below, along with the total allowable catch (TAC):
Table 8. Recent Canadian landings of yellowtaif (000s t) by time period and year. Also shown is the TAC.
1
2 Canadian TAC only. Canadian yellowtail landings, plus prorated unspecified flounder
3 Estimated values, provided by US NMFS, include discards
An estimate of the potential yield in a rebuilt stock is available from surplus production models, and is 13,700 t (Neilson and Cadrin 1998).

/ tonnes /
Figure 24. Trawl fisheries catch of cod, haddock, pollock and yellowtail flounder in areas 4X and 5Ze aggregated by 10-minute squares for 1992-1 997 from log data.

e Gillnet for Groundfish and herring Figure 25 shows that much of the gillnet fisheries takes place on the edge of the Bank where there is less interference from the mobile gear such as trawlers and draggers. Catches are low during October to April.
I - _..- /
r- , - ,,' 4 \ I Oct. ~ . - - ~, ~ o v . 1 . ~ . r --
LA.-- ... L--- -- ~ s - - Dee..
tonnes
" 1 1 @ 32
Figure 25. Gillnet catch of cod, haddock, pollock and yellowtail flounder for areas 4X and 5Ze aggregated by 10-minute squares for 1992-1 997 from log data.

Longline for Groundfish and Large Pelagics
Figure 26 shows the landings of groundfish by iongline. Again. most of this activity is on the noahern edge of the Bank.
Figure 26. Commercial longline fisheries catch of cod, haddock, pollock and yellowtai flounder for areas 4X and 5Ze aggregated by 10-minute squares for 1992-1 997 from log data.
* Lobster trap fisheries Historically Americans have fished lobster with traps and trawls, with the use of trawls in recent years being greatly reduced. USA landings for Georges Bank have averaged around 510 t while Canadian landings averaged 150 t
Georges Bank lobster fishery is concentrated along the outer shelf edge and upper slope. The canyons along the outer slope are particularly important to the fishery with higher catch rates than the open slope regions. Lobsters are found down to 700 m but the fishery is generally between 220-400 m in the winter and 170-270 m in the late spring and early summer. The highest catches are in the fall and spring when the fishery targets the migrating lobsters.
The Canadian offshore lobster fishery began in 1972 and licences have been frozen at 8 since 1976 (Pezzack and Duggan 1995). Other grounds include the Scotian Shelf and slope east of Browns Bank and the Georges-Crowell Basin area west of Browns Bank just to the north of the moratorium lands. Georges Bank represented 30-40% of the Canadian offshore landings in the 1970s and early 1980s but declined to 15-18 % in the mid 1990s as vessels targeted the smaller more valuable and easier fished lobsters west of Browns Bank.
The size structure of lobsters on Georges Bank follows a trend from west to east with the smallest mean size in the American canyons near the Great South Channel and the largest in Corsair Canyon. Early work in the American offshore fishery suggests that part of the size difference is related to historic fishing effort (Skud 1969). The mean size in Corsair canyon is 120 mm carapace length (CL) or about 1.4kg,
Figure 27 shows catches from lobster traps on Georges Bank. For more information on the status of the offshore lobster stocks refer to DFO (1997).

Figure 27. Commercial catch of lobsters from traps for areas 4X and 5Ze by month and aggregated by 10- minute squares for 1992-1997 from log data.

Longline for Swordfish and Tuna The Canadian swordfish longline fishery operates from Georges Bank to the eastern edge of the Grand Banks when swordfish migrate into Canadian waters during summer and fall. Although few fish are taken on the Bank, more than 25% of Canadian annual landings occur within the moratorium lands. Fishing effort generally progresses from southwest to northeast and back again along the edge of the continental shelf, following swordfish movements associated with seasonal warming of surface water temperature. There is also a seasonal progression of effort from offshore to inshore, with longline sets occurring south of the Scot~an Shelf in May and June, shifting to the edge of the continental shelf (Georges Bank, Scotian Shelf, Grand Banks) from July through September. As quotas for swordfish have declined in recent years there has been a tendency for the longline fleet to redirect fishing for other tuna species, such as bigeye, yellowfin and albacore.
Monthly swordfish catches off Georges Bank for combined 1994-97 fishing seasons show an increasing trend from July through September, declining in October and November when the main distribution shifts to the Scotian Shelf region (Figure 28). Generally, catches are highest during August and September when swordfish concentrate along the eastern edge of the Bank. Catches in July are usually low because swordfish longline trips west of 65' 30' W are generally limited to only test fisheries until mid-August. This prevents catching small swordfish and bluefin tuna. After mid-August the entire area is opened to the fleet. This also applies to yellowfin, bigeye and albacore tuna. Catch per unit effort data (CPUE) indicates that swordfish were more abundant along the edge of Georges Bank in 1995 and 1997 compared to 1994 and 1996. Canadian fishermen generally attribute higher abundancefcatchability to favourable environmental conditions: low winds and development of a thermocline off the Bank along the slope in August. During the 1994-97 fishing seasons, commercial landings for swordfish longline within fishery statistical unit areas 4X+5Z have ranged from 108-502 t.
In general, the seasonal/geographic distribution of catches for other tuna species follows a pattern similar to that of swordfish. Over the past four years, yellowfin tuna have been captured along the edge of Georges Bank from June through October, with both catches and nominal biomass CPUE being highest in August and September. Annual trends in nominal biomass CPUE indicate that relative abundance off Georges Bank was higher during the 1994 and 1995 fishing seasons compared to 1996 and 1997. For 1994 through 1997, yellowfin landings from pelagic longline for 4X+5Z have ranged from 50-148 t.
Bigeye tuna are the most abundant tuna species captured in the longline fishery and are caught along the edge of Georges Bank from June through September. Relative abundance, based on nominal biomass catch per unit effort appears to be highest in July and August. Annual trends in nominal biomass CPUE indicate higher relative abundance along the outer edge of Georges and Browns Banks during the 1995 and 1997 fishing seasons. Landings of bigeye tuna from 1994-97 for 4X+5Y ranged from 108-1 50 t.
Albacore are the smallest tuna species captured in the longline fishery, therefore nominal biomass CPUE is always lower than for yellowfin and bigeye tuna. Off Georges Bank, albacore are present in catches from June through September, with relative abundance along the edge of the Bank being highest in July. As in the case of yellowfin and bigeye, annual variability in nominal biomass CPUE is apparent; relative abundance off Georges Bank was higher during the 1994 and 1997 fishing seasons. Commercial landings of albacore are generally quite low, ranging from 7-10 t for fishery statistical unit areas 4X+5Z from 1994 to 1997.

* e e ° @ a s e * O o i Q O
42' @ @ 5 6 * a e
O Q I 5 @ s S B ) e e
Q @ @ . a * * * .
June * a a July - - - - - -- - -- - - - -
* * m
a@@@ '3 - @ @ O @ a , e e @ @ e *
42' @Bee e a @ * e s o
e 0 e * = @B s @ e B B a
t.
Figure 28. Swordfish catch by month from Canadian large pelagics longline, aggregated by 20-minute squares for 1994-1 997.
Tended Line/Rod and Reel Fishing for Large Pelagics Canadian bluefin tuna fisheries currently operate in several geographic areas off the Atlantic coast from July to November when bluefin migrate into Canadian waters. The main commercial fisheries in the Georges Bank area occur off the Bank in the Northeast Channel between Browns Bank and Georges Bank. This area is referred to as the Hell Hole and is primarily fished using tended line gear. Over the past decade, bluefin tuna catches from the Hell Hole have greatly declined and have become more spatially d~spersed.
Bluefin tuna form distinct aggregations in Canadian waters that can vary from one year to the next. The Hell Hole aggregation has supported a significant commercial fishery since its inception in 1988. Over the past four years, monthly catches in the Hell Hole have shown an increasing trend from July through September, with the highest catches occurring in August and September (Figure 29). Annual trends in nominal biomass CPUE show a general decline in abundance from 1995 to 1997, although this trend will likely not continue into 1998, since fishermen have been reporting good catches this year (>I50 t landed to date). Bluefin tuna landings from the Hell Hole area for 1994-97 range from 91-392 t, and over the past four years have represented from 18% to 44% of the total annual catch.

e
July August
September October
68O 66O 64' 68O 66' 64O
tonnes
25 @ 50+
Figure 29. Bluefin tuna catch (t) by month from the Canadian tended line fishery, aggregated by 20-minute squares for 1994-1997 fishing seasons. The largest circles show the higher catches associated with the Hell Hole.
Harpoon Fishery for Swordfish Although a swordfish harpoon fishery occurs on Georges Bank from Corsair Canyon to the Northeast Peak during July and August and can account for up to 12% of the annual landings (1 -1 3% from 1994-97), log record information from this fishery is not available in computerised format for analysis of swordfish catch distribution.
Purse Seiners for herring Georges Bank once supported the largest herring fishery on the western Atlantic. During the late 1960's and early 19701s, reported annual commercial landings from the Bank exceeded 200,000 t. The fishery peaked in 1968 with reported landings in the 374,000 t range (NEFSC 1996), however, actual landings are suspected to have been substantially higher.
The commercial fishery on Georges Bank began in 1961 when the former USSR landed 68,000 t of herring. Between 1961 and 1965 the USSR dominated the herring fishery with annual catches ranging from 38,000 to 151,000 t. The fishery expanded rapidly from 1967 when Poland and the German Democratic Republic entered the fishery. Over the next 9 years, vessels from 12 countries harvested herring from the Bank, including Canada and the US which by reported landings were minor players (Anthony and Waring 1980). No directed fishery for herring occurred on the Bank between 1978 and 1993.
The Canadian fishery on Georges Bank reopened with 5,0004 allocation in 1994 with a herring catch of 228 t on the northern edge just east of the International Boundary. The USA catch, which occurred in the vicinity of the Great South Channel, was estimated at 350 t for 1994. No Canadian or US landings were reported for Georges Bank in 1995. During 1996 2,560 t were removed from the Canadian portion of the

Bank - 226 t in August, 232 1 in September and 2,102 t in October. US catch from Georges Bank for 1996 was estimated to be 1619 t. In 1997 101 t of herring were landed by Canadian seiners and 2,838 t by US vessels. US preliminary landings for 1998 are 13,000 t. No Canadian landings have been reported to date.
Recent landings of herring from Georges Bank proper are insignificant when compared to those of other areas in the Gulf of Maine and southward. However, it is important to note that the Southern New England herring landings have increased from less than 2,000 t annually prior to 1995 to in excess of 20,000 t in 1997 and 1998. This represents a major increase in effort south of Cape Cod where Georges Bank and other Gulf of Maine herring stocks are known to over-winter.
SUMMARY of FISHERIES ACTIVITIES
Georges Bank is one of the most important fishing areas in the north Atlantic. It supports a very diversified fishery with landings of scallops, lobster, groundfish and large and small pelagics. Recent landings for Canada and the United States exceed $100 million annually. Fishing activity by foreign and domestic fleets intensified in the years following World War It, leaving many stocks near collapse. Recently, both Canada and the U.S., following declaration of their 200-mile economic zones and the settlement of an international boundary dispute, instituted management programs to rebuild the stocks. While some stocks remain in a low or rebuilding state, scallops and lobsters are pedorming well (Table 9). However, in general, groundfish stocks remain in a depleted, fragile state. The fishery is being conducted with low quotas, closed seasons and spawning season closures in order to facilitate the rebuilding of the biomass of these species.
Overall fishery yields are considerably less than those that might be expected if stocks rebuild. Examples are provided below for some of the more highly valued fishery resources. The methods of estimating the potential yield and the uncertainty associated with the estimate vary depending upon the species.
Table 9. Table of current and estimated potential yield (t) from the major Georges Bank fisheries.
1 - Canadian landings 2 - Canadian and U.S. landings

VII) UNIQUENESS OF GEORGES BANK
The Georges Bank ecosystem has high biological diversity with many distinct physical oceanographic and biological features. In combination, these features make Georges Bank a unique marine ecosystem with:
strong and persistent tidal currents, resulting in high mixing rates, nutrient supply and overall dispersion; a partial gyre that typically provides a mechanism for recirculation and extended residence of a portion of the Bank's water during part of the year; a seasonal frontal system with enhanced around-bank drift, elevated phytoplankton production and near-surface convergence zones that may concentrate organisms; high productivity of phytoplankton, and fish; a relatively large number of commercially important fisheries on the Northeast Peak with benthic invertebrates including scallops and lobster, dominating the landed value; the co-occurrence on the Northeast Peak of spawning and nursery areas for many fish species; and, a broad and shallow plateau influenced by subpolar and subtropical water masses and organisms, resulting in high biodiversity of species.
There is a sound knowledge and description of most of these features, but their inter-relations, and the overall dynamics and basis for the resiliency of the ecosystem are not fully understood. While the unique features of Georges Bank provide a basis for special concern regarding impacts of petroleum activities, it is not clear whether overall they make the ecosystem more or less sensitive to such impacts.
For the purposes of this research document it is important to make use of scientific knowledge on the impacts of petroleum exploration and development from other parts of the world. In the sections that follow, attempts are made to make appropriate comparisons where possible. In many circumstances, comparisons between Georges Bank and other areas where petroleum is extracted are not valid. Th~s section will briefly characterise the other comparable petroleum extracting areas of the world pointing out particular cautions for making some comparisons.
Regulatory Restrictions - No OBMs to be discharged off Nova Scotia As will be seen in later sections, one of the most obvious impacts of exploratory drilling on the environment has been that associated with drilling muds. All petroleum extraction employs drilling muds. Although somewhat dated, the GESAMP (1993) Report provides a good general introduction into the composition of drilling muds and their impacts. Drilling muds are circulated around the drill bit to increase penetration rate, reduce jamming, increase the lifetime of drill bits and reduce formation washout. There are three classes of muds: water-based (WBM), diesel oil-based (OBM), and alternative-based muds (ABM) that includes both mineral oil and synthetics.
It is important to point out that, although petroleum extraction activities in many areas of the world, including Canada, have used oil-based drilling muds (OBMs), discharges with hydrocarbon contents of greater than 1 % will not be allowed after January lS', 1999. This is regulated by CanadianINova Scotian Offshore Petroleum Board (CNSOPB). It is essential that this distinction be kept in mind when carrying out any comparison of potential impacts with other areas.
The general experience in the North Sea, where high toxicity oil-based muds have been used in drilling multiple wells, is that the spatial extent of biological effects from the use of oil-based muds is greater than that of water-based muds. Generally, major impacts, such as organism mortality, are restricted to within 500 m of rigs but subtle effects in benthic organism diversity and community structure can be observed as far away as several kilometres (Olsgard and Gray 1995; Daan et a/. 1990; Kingston 1992). The shape and extent of impact zones varies with current regime and scale of drilling operation. Although North Sea operations have switched from diesel oil to mineral oil, experience has shown that this change has not reduced the benthic impact zones around the drilling rigs.
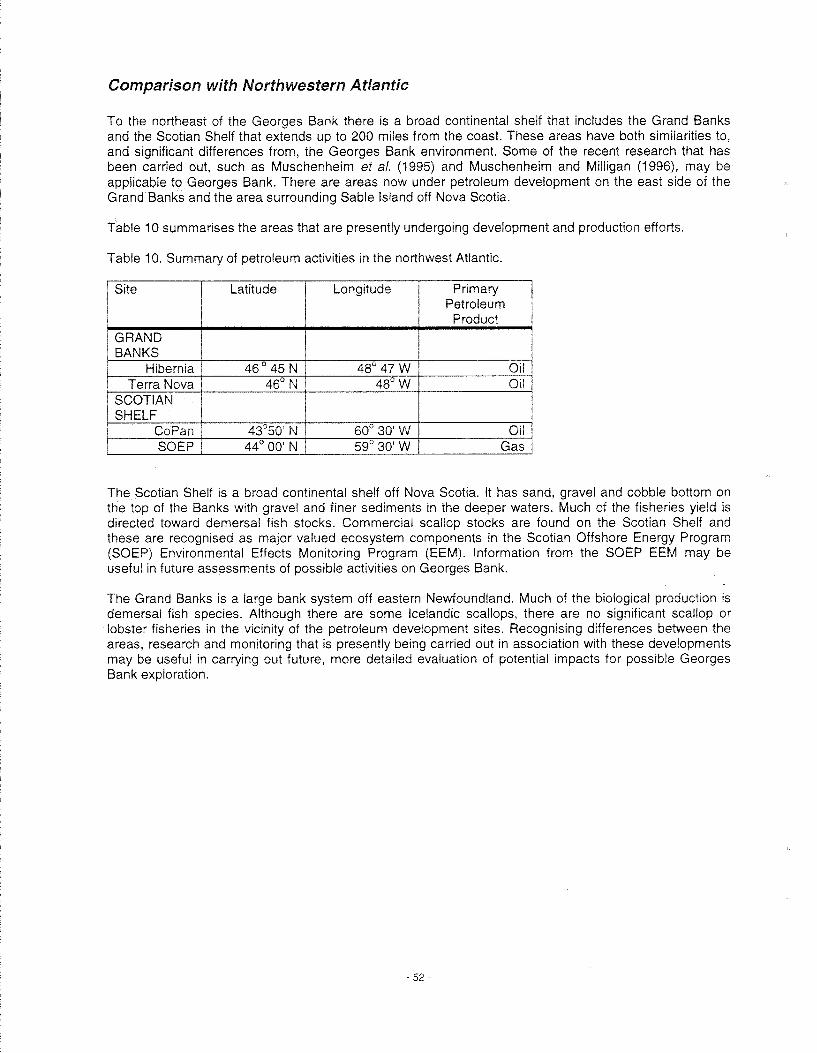
Comparison with North western A tiantic
To the northeast of the Georges Bank there is a broad continental shelf that includes the Grand Banks and the Scotian Shelf that extends up to 200 miles from the coast. These areas have both similarities to, and significant differences from, the Georges Bank environment. Some of the recent research that has been carried out, such as Muschenheim et a/. (1995) and Muschenheim and Milligan (1996), may be applicable to Georges Bank. There are areas now under petroleum development on the east side of the Grand Banks and the area surrounding Sable Island off Nova Scotia.
Table 10 summarises the areas that are presently undergoing development and production efforts.
Table 10. Summary of petroleum activities in the northwest Atlantic.
The Scotian Shelf is a broad continental shelf off Nova Scotia. It has sand, gravel and cobble bottom on the top of the Banks with gravel and finer sediments in the deeper waters. Much of the fisheries yield is directed toward demersal fish stocks. Commercial scallop stocks are found on the Scotian Shelf and these are recognised as major valued ecosystem components in the Scotian Offshore Energy Program (SOEP) Environmental Effects Monitoring Program (EEM). Information from the SOEP EEM may be useful rn future assessments of possible activitres on Georges Bank.
The Grand Banks is a large bank system off eastern Newfoundland. Much of the biological production is demersal fish species. Although there are some Icelandic scallops, there are no significant scallop or lobster fisheries in the vicinity of the petroleum development sites. Recognising differences between the areas, research and monitoring that is presently being carried out in association with these developments may be useful in carrying out future, more detailed evaluation of potential impacts for possible Georges Bank exploration.

Comparison with North Sea
In contrast to Georges Bank, the North Sea is a relatively contained shallow sea between latitudes 50-60' N. It has a lower tidal energy and lower average physical forcing but with frequent strong storms. The lower tidal forcing gives rise to a large area where the water is stratified for much of the growing period. The weaker currents make this a generally less dispersive environment than Georges Bank. Discharges from drilling platforms accumulate close to the rig site (Olsgard and Gray 1995; Daan et a/. 1990; Kingston 1992) and thus are expected to be more severe locally than on Georges Bank.
Oil based drilling muds have been used extensively in the development drilling in the North Sea. The higher toxicity of these muds relative to those expected for use on Georges Bank suggests that the impacts observed in the North Sea wilt probably be higher than similar volume discharges from possible Georges Bank activities. That is, impacts from development are not comparable to those expected from possible exploration activities.
In the North Sea much more of the fisheries yield results from demersal fish stocks in contrast to the higher yield from adult populations of benthic invertebrate species, such as scallops and lobsters, on Georges Bank. Although not as limited in their movements as scallops, it would be expected that lobsters on Georges would be more at risk than fish in the North Sea where the fisheries are almost entirely mobile fish stocks.
Much of the petroleum activity is concentrated in the southern North Sea and takes place within 150 krn to land (Figure 30). Th~s places the potential impacts much closer to the human population that lives around the North Sea. The population in the drainage basin of the North Sea is on the order of 150 Million people. This larger population, shorter distances and weaker circulation system results in higher background levels of pollution than is seen on the more pristine Georges Bank area.

Figure 30. Map of production platforms and pipelines on the whole of North Sea in 1991. Th~s map gives only an overali impression of locations. Note for this discussion that the size of the dots corresponds to approximately 10 km. (Source Anon. 1992).

Comparison with Gulf of Mexico
The Gulf of Mexico at latitudes between 20-30' N includes both tropical and temperate climate regimes with some coral reefs. It provides habitat for a large suite of tropical species of fish, warmer water invertebrates and marine turtles. The sea turtles have associated nesting beaches in the Gulf. There are fewer large whales although offshore in deeper waters there is a resident population of sperm whales.
The Gulf of Mexico is much warmer than Georges Bank with summer sea surface temperatures of around 28-30' C while in winter there is an offshore gradient with nearshore waters at 18-20' C and offshore waters near 23-24' C.
The tidal range in the Gulf is around 0.3 m with semi-diurnal tides in the east and diurnal in the west.
Circulation in the Gulf of Mexico is dominated by the Loop Current, which enters through the Yucatan Strait, bends eastward and southward. and exits through the Straits of Florida. The Loop Current is known to extend far to the north and occastonally intrude on the continental shelf of the north-central Gulf, with speeds of 1.27 to 1.77 m s*'. Large, clock-wise rotating eddies of the Loop Current occasionally break off the main current. These eddies spin westward toward the Texas coast, carrying vast amounts of water and marine life into the western Gutf (Source: wwvv.gomr.mms.gov/homepg/regulate/environ/env~pge2.html).
The Gulf is very much influenced by the outflow from the Mississippi River that carries large amounts of fresh water, sediments and nutrients to the Gulf. The large input of nutrients is rapidly utilised and creates excessive plankton production that often results in death and export of plankton cells into the bottom water layers. This is believed to be the principal reason for the extensive low oxygen or "dead" zone off Louisiana in the summer.
There are a large number of petroleum production structures in the Gulf of Mexico (Table 11).
Table 11. Number of wells in the Gulf of Mexico by water depths. (Source. www.qomr.mms.~ov!home~~/fastfactsNVaterDe~th~aterDepth.html)
Water Depth in Meters
Wells Being Drilled
Wells Producing
A recent issue of the Canadian Journal of Fisheries and Aquatic Sciences provides a number of papers summarising studies on the tmpacts of petroleum exploration and development in the Gulf of Mexico. Mahlon et a/. (1 997) provides an overview of the work.
VIII) EXPLORATORY ACTIVITIES AND THEIR POTENTIAL IMPACTS
Seismic Survey A class assessment document (Davis et a/. 1998) has just been completed that reviews the present knowledge on the impacts of seismic exploration in the marine environment. Although directed primarily to the Scotian Shelf situation, this class-screening document is also appropriate for considering potential impacts in the Georges Bank area.
Seismic exploration would be required on Georges to update information collected on earlier surveys. New surveys would provide more detailed information that is necessary for pianning any future steps in exploration. The general operation is for a vessel to sail along straight line transects towing a sound source at a predetermined water depth, and a string of hydrophones that record sound reflected from the different geological interfaces. From this information, analytical techniques can generate images of the geological strata and identify those with probable oil and/or gas.
A major known impact arising from these activities is the scaring of fish from their usual habitat. Thrs might have a number of impacts including increased stress on fish from having been deterred from the~r usual feeding grounds and decreased fishing catches for the fishers because the fish have moved to unknown areas and possible interference with spawning behaviour that would prevent successful spawning. These impacts are likely to be on the order of a couple of weeks as the highly mobile stocks should be able to repopulate the area once the seismic activities have stopped. Nevertheless, thrs may be sufficient to reduce fisheries yield and/or reduce the number of recruits produced.
A secondary concern is the potential mortality of fish, their eggs and larvae. The sound source generates a compression and decompression wave In the water that is sufficient to kill certain life stages. Most of the observed mortalities occur close to the sound source, within metres. Due to three dimensional dispersion and spreading, the impacts decrease quickly with distance from the sound source. Seismic operations In the vicinity of a frontal system or convergent zone that would at certain times of the year have higher densit~es of eggs and larvae may have the potential to significantly reduce year class size.
Another potential impact would be on marine mammals. Many marine mammals use the Georges Bank area on their migratory routes and as a feeding ground because of the high densities of prey. It IS unlikefy that seismic activities would come in direct contact with the large marine mammals that frequent Georges Bank. The standard practice of having trained observers on the vessels at the time of surveys should min~mise direct contact.
There is also the potential for space conflicts between the seismic boats and fishing boats In the area. As stated above the Bank is heavily used throughout the year when spawning is not occurring.
In summary, seismic exploration has been known to give rise to a number of impacts such as: a decreased catch rates due to scaring of fish ; interference with fish spawning; space conflicts with existing fishing activities; mortalities in a number of species and a number of life stages; and, possibly change marine mammal movements.
There are a number of steps that can be taken to minimise impacts such as: * Soft starts to warn mammals to vacate the area;
Maximising data and information generation based on new analytical techniques to minimise the need for seismic surveys; Avoidance of seasons with high density of vulnerable species or life stages; Avoidance of seasons and areas with fishing activities; and,
* Avoidance of seasons and areas with marine mammals.

Exploratory Drilling
Exploratory drilling is conducted to determine whether commercial accumulations of gas andlor oil are present in the most promising geological structures detected by seismic surveys. Drilling methodology on Georges Bank will be essentially the same as used previously on the eastern Canadian continental shelf. A rig is typically on location at each site for about 3-4 months and would be serviced approximately every other day by both helicopter and supply boat. Potential impacts from routine drilling operations may result from: o lnfrastructure - ship movements, anchors, cables, debris, domestic discharges, light and sounds;
Loss of access - fisheries interruptions; and, Operational discharges - mortality, sublethal effects and tainting.
lnfrastructure
Service traffic, both vessel and aircraft, should not cause any problems as long as operators respect fishing operations and stay clear of working vessels and unattended fishing gear, such as lobster pots and gill nets primarily on the edge of the Bank.
There are three classes of debris generated from drilling operations: solid domestic waste, liquid domestic waste and solid operation waste.
Based on the "Offshore Waste Treatment Guidelines" and the Nova Scotia Petroleum Drilling Regulations no solid waste is allowed to be dumped at sea. Liquid wastes, such as sewage and food wastes, are macerated, treated to some degree before any possible disposal at sea.
The discharge of liquid domestic wastes, sewage, should not pose significant impacts as long as the treatment technologies recommended by the Department of the Environment (DOE) are followed.
Solid operational debris from offshore activities has been a problem in the North Sea and the Gulf of Mexico. This material comprises anchors, chains, etc. that are placed on the sea floor. Canadian drilling regulations require that the sea floor be cleared of any material that could interfere with other commercial uses of the area when the well is abandoned. The well casing itself must be sealed at least 1 m below the sea floor to prevent damage to fishing gear. W~thin a year of the cessation of the US exploration activities on Georges Bank, only four large items remained unrecovered in the area. None exhibited sufficient relief to interfere with commercial fishing activities (Danenberger 1983).
The drilling rig. and its associated supply vessels, generates significant amounts of light and sound in the~r routine operations. These may have positive and negative impacts. Marine mammals may be scared from the vicinity of the rig due to the unusual and/or increased noise levels. Marine birds may be attracted to the lights of the rig. Some pelagic species, such as squid, are attracted to the lights and may be subject to higher predation due to this increased aggregation. There are directed studies underway in the SOEP Environmental Effects Monitor~ng program to study the levels of noise and potential impacts that may be appropriate for application to evaluating potential impacts to the Georges Bank ecosystem.
Loss of Access
A direct and quantifiable impact on fishing activities from drilling is the exclusion of the fishing activities from the areas around drilling sites.
While on location, a drilling rig is surrounded by a safety zone that more than covers all underwater equipment, i.e. anchors and cables, and is off-limits to all vessels except supply boats. The size of the zone depends upon the type of rig and depth of water. The radius usually ranges from 500 - 1,000 m. All fishing activity is excluded from this zone (and perhaps from a larger area depending upon type of fishery, fishery methods, topographic constraints, etc.) for the drilling periods of usually 3-4 months.
A rig w~th a 1.5 km safety zone radius would exclude approx~rnately 7 km2 from frshrng actrvity whrch rs about 0.2% of the total Canadian area of Georges Bank havlng a water depth less than 100 m (4500 krn2). The potential impact on the fish~ng industry, however, could be greater than this percentage suggests because the Bank IS not uniformly ftshed. For example, scallop distribution IS patchy (Figure 11) and fishing effort is focused on areas of greatest concentration. Any proposal for drillrng activit~es would have to consider the exact locat~on of the rrg In reference to the known distrtbutions of commercial stocks and the timing of such fisheries.
Impacts resulting from loss of access will depend upon the t~me of the year and the specles concerned because of the seasonal nature of most f~sh~ng actrv~ty. Experience shows that fishrng activity should be able to resume as soon as the rlg leaves the drill site
Operational Discharges Hydrocarbon exploration and development drilling on Georges Bank w~ll result in the routine release of different ktnds of drillrng muds and formatfon cutt~ngs. At the trme of the previous DFO assessment on the posstble environmental effects of exploratory drilling on Georges Bank (Gordon 1988), there was Iim~ted ~nformation on the potential impacts of these part~culate wastes on benth~c organisms. It was felt that measurable impacts mtght be expected under some conditions. Research recommendations at that time included developing better numerical models to understand discharges dispers~on and improving our understanding of the effects of drilling d~scharges on benthic organisms, in particular the sea scallop (Placopecten rnage//an~cus} whrch is the most valuable commercial species on Georges Bank. DFO subsequently developed a focused and well-integrated research program, which has been funded by the federal Panel on Energy Research and Development (PERD), to address these recommendat~ons Because of the nature of the questions being asked, thrs program has covered a w~de range of scrent~fic drsciplines including phystcal oceanography, sedtmentology, engineering and ecology. By coupl~ng the brological results to waste dispersron models, the spatral and temporal extent of potential impact zones around a drill site could be predicted. DFO scientists are currently complettng the modell~ng project and are applying the new models and understanding to predict impact zones around specific hypothetical drilling sites on Georges Bank. Much of this work IS summar~sed rn thrs section and additional detail is provided in Appendix.
Before considering environmental impacts of operational discharges, it is important to understand some of the details of drilling procedures, especially the drilling mud circulation system (Figure 31). Drilling mud is a suspension of solids and dissolved material in a carrier fluid of either seawater or oil. It circulates from the rig, down the drill string and up back to the rig. Muds serve several functions including transporting cuttings to the surface, balancing of subsurface and formation pressure to prevent blow-out, and cooling, lubricating and partly supporting the dri/l bit and drill pipe. They also stabilise the borehole wall and prevent fluid exchanges with the rock formation. The major components are barite (barium sulphate), clay (bentonite), lignosulfonate, lignite (soft coal), sodium hydroxide and carrier fluid, either water or oil. There are also numerous additives in trace amounts. Mud composition is continually changed during drilling to adjust to the specific down-hole conditions encountered.
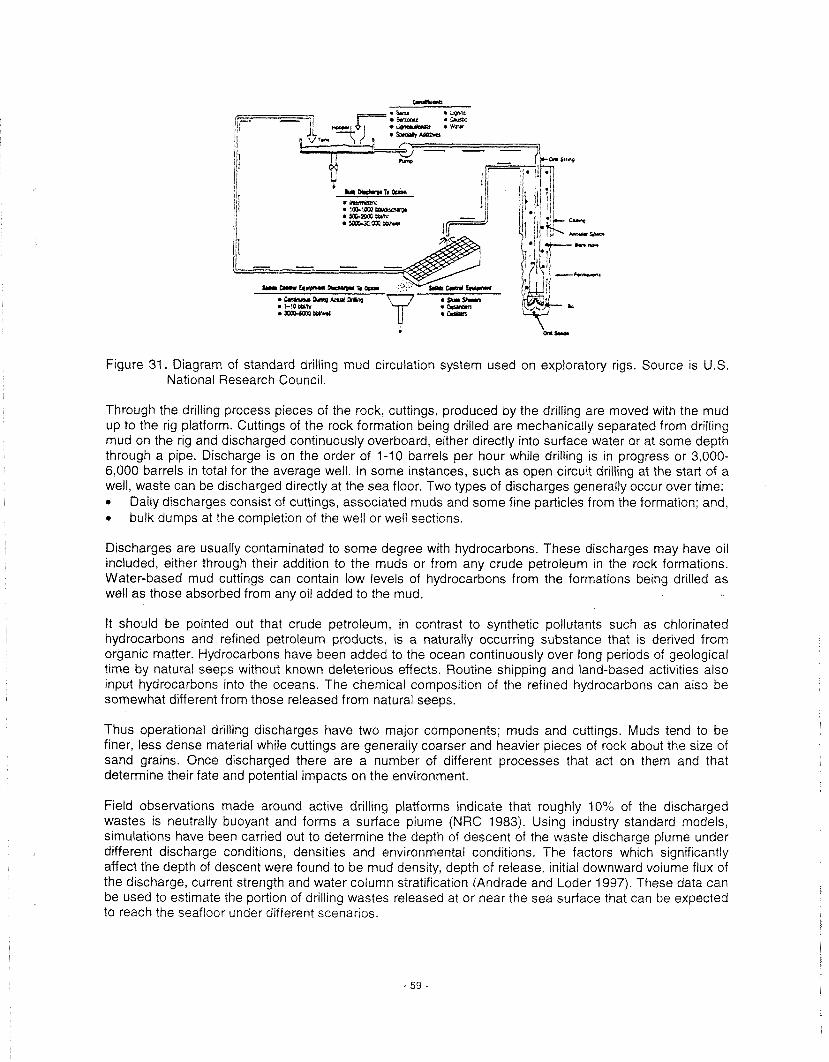
Figure 31. Diagram of standard drilling mud circulation system used on exploratory rigs. Source is U.S. National Research Council.
Through the drilling process pieces of the rock, cuttings, produced by the drilling are moved with the mud up to the rig platform. Cuttings of the rock formation being drilled are mechan~cally separated from drilling mud on the rig and discharged continuously overboard, either directly into surface water or at some depth through a pipe. Discharge is on the order of 1-10 barrels per hour while drilling is in progress or 3.000- 6,000 barrels in total for the average well. In some instances, such as open circuit drilling at the start of a well, waste can be discharged directly at the sea floor. Two types of discharges generally occur over time:
Daily discharges consist of cuttings, associated muds and some fine particles from the formation; and. * bulk dumps at the completion of the well or well sections.
Discharges are usually contaminated to some degree with hydrocarbons. These discharges may have oil included, either through their addition to the muds or from any crude petroleum In the rock formations. Water-based mud cuttings can contain low levels of hydrocarbons from the formations being drilled as well as those absorbed from any oil added to the mud.
It should be pointed out that crude petroleum, in contrast to synthetic pollutants such as chlorinated hydrocarbons and refined petroleum products, is a naturally occurring substance that is derived from organic matter. Hydrocarbons have been added to the ocean continuously over long periods of geological time by natural seeps without known deleterious effects. Routine shipping and land-based activities also input hydrocarbons into the oceans. The chemical composition of the refined hydrocarbons can also be somewhat different from those released from natural seeps.
Thus operational drilling discharges have two major components; muds and cuttings. Muds tend to be finer, less dense material while cuttings are generally coarser and heavier pieces of rock about the size of sand grains. Once discharged there are a number of different processes that act on them and that determine their fate and potential impacts on the environment.
Field obsewations made around active drilling platforms indicate that roughly of the discharged wastes is neutrally buoyant and forms a surface plume (NRC 1983). Using industry standard models, simulations have been carried out to determine the depth of descent of the waste discharge plume under different discharge conditions, densities and environmental conditions. The factors which significantly affect the depth of descent were found to be mud density, depth of release, initial downward volume flux of the discharge, current strength and water column stratification (Andrade and Loder 1997). These data can be used to estimate the portion of drilling wastes released at or near the sea surface that can be expected to reach the seafloor under different scenarios.


I 0 Observed Currents + Model Currents I
Figure 32. Location of physical oceanographic zones and bblt application sites on Georges Bank.
The drilling waste concentrations predicted in these applications are presented in Loder et a/. (1 998). The main findings are summarised as follows:
The spatial patterns and near-bottom concentrations predicted by observed and modelled currents are remarkably similar in most cases. Thls demonstrates the oceanic realism of the 3-0 circulation model that has been used to force bblt for those sites at which suitable current meter data are not available. However, additional model applications using bulk discharges (Loder et a/. 1998) indicate significant differences in some cases (e.g. NEP site in winter) which appear to reflect limitations of both the 3-D model and observational current data. The predicted near-bottom concentrations are very sensitive to the effective settllng velocities of drilling wastes. Those at the higher veloclty (0.5 cm s-') are about an order of magnitude greater than those at the lower velocity (0.1 cm s").
* In general, predicted near-bottom concentrations decrease rapidly over distances of 2-10 km from the release point. In some applicat~ons, substant~al waste concentrations are carried as far as 20-50 km from the release point at the higher settling velocity. These more distant concentratlons must be interpreted with caution because the assumptions in local bblt (i.e. uniform physical environment over the entire model domain) break down with increasing distance from the release point.
* The predicted near-bottom concentratlons are very dependent upon geographic locat~on. The highest concentrations occur on the side of the Bank (water depth greater than 100 m). Due to higher bottom stress and stronger dispersion, predicted near-bottom concentrations are much lower on the top of the Bank (less than 65 m). Near-bottom concentrations are also lower in the frontal area (65-100 m) due to higher bottom stress, stronger dispersion and stronger drift. This is illustrated according to oceanographic zone in Table 12 that summarises near-bottom waste concentrations at the high settling velocity (0.5 cm s-') at a distance of 20 km along the primary drift line.
* Both the observed and model current applications indicate that the predicted mean drift of the near- bottom drilling waste plume is generally along depth contours except over the Bank's side where more variability in drift direct~on is found. Thls pattern is consistent with the residual circulation. Results at Growler indicate that drift from the side of the Bank up into the frontal zone is possible under some conditions.
* Applications forced by the 3-5 model at GBFSl and GBFS2 indicate that waste concentrations in winter are lower than in summer. The reduced winter concentrations at the GBFS2 site (also expected for other frontal sites) reflect the Increased boundary thickness associate with reduced stratification and increased vertical mixing in winter. The reduced winter concentrations at the GBFS1 site are associated with stronger model t~dal currents in winter, the reliability of which is unclear. On the other hand, waste concentrations at NEP. where bblt was forced by observed currents, were higher in winter than summer.

* Near-bottom waste concentrations can be higher by up to a factor of two for neap tides because of reduced height of bottom-trapped sediment (i.e. in the benthic boundary layer) and reduced dispers~ori in the water column.
Table 12. Average number of hours that the near-bottom waste concentrations exceeded 1 mg along the primary drift line (out to 20 km) at the nine geographic locations grouped by oceanographfc zone. Both observation and model forcings combined. High settling velocity only (0.5 cm s-'l. First 62 days. Summarised from Loder et al. (1998).
The basis for the biological ~nterpretation of the drilling waste concentrations predicted by bblt are the results of laboratory tox~c~ty experiments reported by Cranford et a/. (1 999). These experiments exposed sea scallops to different cancentrat~ons of various driil~ng wastes ~n raceway tanks and determined the lethai and sublethal effects, ~ncluding trssue growth, of ~ntermittent exposure. The wastes tested were bentonite, barite and used WBM cuttings and used OBM. The results are summarfsed In F~gure 33. The most tox~c waste was the used OBM while the least was the used WBM cuttings.
Barite
!
i Z z ~ o Growth USED WB>I Cuttings Llowiies
Concentration (mg I-')
Figure 33. Summary of results from laboratory studies on the lethal and sublerhal effects on sea scallops of intermittant exposure (12 h each day for up to 68 days) to bentonite, barite, used WBM and OBM. Adapted from Cranford et al. (1 999).

Using the drilling waste concentrations predicted by bblt , and the biological effect from the laboratory studies, the effects on scallops are estimated for each model application by calculating the number of potential growth days lost over the exposure time. Waste concentrations predicted by bblt were assumed to be half barite and half bentonite. Although the drilling waste scenario used here indicates some change in the proportion of each component with time, this change was not large and the use of a variable proportion of waste constituents would require separate bblt runs for each component and hence a doubling of computational demand.
These calculations assume that there are no decomposition processes operating that would change toxicity with time and thereby alter individual effects threshold values. Microbial activity may alter the chemical speciation of trace metal impurities in barite to more bioavailable and toxic forms. The physical effects of both bentonite and barite should not change with time. Floculative processes may operate on the particles that would affect the settling rates and potential impacts.
Using the modelled and observed results, the potential lethal and sub-lethal impacts on adult scallops can be approximated.
Mortality Operational discharge of drilling muds can accumulate in low energy systems to smother benthic organisms near the rig and result in the smothering. Assuming that a well has a total operational discharge of 20,000 barrels and that 90% of the material reaches the sea floor, the average net accumulation on the bottom, if all discharged material was contained within an area 100 m2 would be 0.29 m, or 0.29 cm if evenly distributed over 1 km2. In actuality, it is expected that sed~mented material in the high energy environment of Georges Bank will be quickly spread over a much larger area because of the very high levels of tidal and storm energy. Due to the high settling velocity of the cuttings there is reason to believe that smothering might kill significant numbers of slow-moving or sessile organisms living in a small area directly under a drill rig.
The results of the American Georges Bank Monitoring Program have indicated that bottom currents on the Bank are sufficiently strong to disperse settling materials rapidly from drill sites (Phillips eta/. 1987; Neff ef al. 7989). Sea floor photographs showed no evident accumulations of drilling mud or cuttings. Chemical analyses of sediment collected at drill sites showed that the only element that increased in concentration during drilling was barium, a major constituent of drilhng mud. After drilling was completed, however, it dispersed rapidly. Elevated levels of hydrocarbons were found in near-rig sediments but are reported to have disappeared within one month after drilling terminated. In contrast, there is evidence that hydrocarbons may persist for several years at drill sites on the Scotian Shelf and Grand Banks due to the past use of OBMs and the lower energy environment.
Even if physical smothering of benthic organisms does not take place, mortality may result from direct toxicity of the materials discharged (Cranford and Gordon 1991). Over 70 different water-based drilling mud formulations have been tested in laboratory experiments for their lethal toxicity to a variety of species. Most acute toxicity thresholds for muds and their components are much higher than concentrations expected under field conditions. The observed acute toxicity is due primarily to special purpose additives such as diesel oil and various biocides. Because of rapid dispersion rates on Georges Bank, the zone of potentially lethal toxicity around drilling rigs using water-based drilling muds should be within a few hundred meters of the discharge pipe.
Prolonged exposure, on the order of a month, to high concentrations of bentonite and barite can cause mortality to scallops (Cranford and Gordon 1992, Cranford et al. 1999). However, analysis of the number of hours that concentrations exceed 10 mg I' at various distances along the primary drift line indicates that the waste concentrations predicted in these applicat~ons are not likely to cause scallop mortality, even at the release point. The bblt model simulations provide estimates of the duration of high near-bottom concentrations of drilling mud around release sites in different regions of Georges Bank. The longest durations of concentrations exceeding 10 mg I -bccur in the Stratified region, with values peaking at 9 days at the release site and falling off to 3 days at 5 km downstream for the higher settl~ng velocity. In the Frontal region, peak durations are about 1 day at the release site. These durations are much lower than

the 30-day period required for scallop mortalities with bentonite concentrations of 10 mg I-' in laboratory experiments, indicating that significant mortality of scallop populations for an exploratory well on Georges Bank is unlikely.
In summary, the toxicity of operational discharges depends primarily upon the type of drilling mud employed and the rock formations penetrated. By using a less toxic WBMs, effects from isolated exploratory wells in an energetic environment such as Georges Bank would be limited in space and time to the area under and adjacent to the rig. Resulting mortalities are not expected to have a significant impact on the key resource species. The importance of such mortalities on the population level is difficult to estimate but is expected to be lower than the sublethal impacts discussed in the next section.
Sublethal effects on growth
The drilling waste concentration fields predicted by the bblf modelling can be used to estimate potential sublethal effects on adult scallops over different distances from, and areas around, a drilling rig in the scenario presented above.
From the laboratory studies, two kinds of sublethal effects thresholds were estimated for exposure to bentonite and barite. The first is the zero growth concentration (Co). There is no scallop tissue growth at or above this threshold. The second is the no effects concentration (GI 1. There is no significant effect on scallop growth at or below this threshold. For bentonite, zero growth was observed at 10 mg I-' and no effects were detected below 2 mg I-' (Figure 33). The effects thresholds had to be estimated for :ante. as laboratory experrments observed zero growth at the lowest concentration tested (0.5 mg ). Other biological effects indices indicated that growth would occur at barite concentrations below 0.5 mg 1- (Cranford et al. 1999), and this value was used as the zero growth concentration. The no effects concentration for barite was estimated at 0.1 mg I" by assuming the ratio C,/Co was the same as observed for bentonite. The thresholds are substantially lower for barite than for bentonite, indicating its greater effect on scallop growth. Observed sublethal effects from both wastes resulted from the negative influence of fine inorganic particles on scallop feeding processes, but chemical toxicity may also be a factor with barite. Suspended WBM cuttings (30-60 pm diameter) did not affect feeding behaviour and growth (Figure 33) and are not included in model simulations.
These data have been applied to the time series concentration data provided by bblt models. Growth reduction factors (between 0 and 1) were calculated for each component at 30-min time steps assuming a linear relationship between waste concentration and growth as observed by Cranford et a/, (1999). These indices were subsequently added together and integrated over the entire exposure period. The percentage of total growth lost over the exposure period was also calculated. Full details of the methods and predicted effects on scallop growth are presented In the Appendix.
As expected, the number of potential growth days lost is greatest at the release point and decreases with increasing distance along the primary drift iine. In general, concentrations at the three locat~ons on the side of the Bank (GBFSI, Growler and Hunky Dory) drop less with increasing distance from the release site than application sites in the frontal zone or on top of the Bank. The modelling results suggest that growth days lost can exceed 10 at distances up to 40 km on the side of the Bank in the stratifled water during the summer.
When averaged along the primary diift iine, the potential scallop growth loss is predicted to be greatest on the side of the Bank. The average value calculated over a distance of 20-50 km along the primary dr~ft line at the two settling velocities ranged from 1.0 to 10.9 days for the first 62 days and from 0.7 to 5.0 days for the second 50 days. The potential scallop growth loss along the primary drift line is substantially less rn the frontal zone, ranging from ~ 0 . 1 to 2.1 days for the first 62 days and from ~ 0 . 1 to 2.0 days for the second 50 days. The potential growth loss on the top of Georges Bank is negl~gible, ranging from 0.0 to 0.4 days. Addlng the two time periods, the range of potential scallop growth loss for the full drilling waste release scenario ranges from 2 to 40 days for the stratified zone and from ~ 0 . 1 to 15 days in the frontal zone.

The ~nterpretatron of the results from these bbif appitcatrons on Georges Bank depends upon several factors which include the location of the release site, the distrrbutron of scallop stocks and the rime of year at which the wastes are released.
Most scallop growth on Georges Bank generaily takes place between April and October when condltlons are most favourable. Therefore, the potentral effects of drilling wastes illustrated in these applicatrons nave a higher probabrlrty of being attamed durlng this perrod. Wastes released between November and March would probably have a lesser effect because the scallops are not growrng as much. However, energy reserves would be depleted faster. Increased wind and wave rnfluences should further reduce the waste concentrations rn the winter (as shown in the modei sensrtrvity studies). Much of the scallop growth in the April to July period goes tnto the development of gonads. Spawning usually occurs between August and October. The laboratory experiments with drrllrng wastes (Cranford and Gordon 1992, Cranford et a/. 1999) rndicated that much of the observed growth loss was due to retarded gonad development and not adductor muscle. Therefore, it is likely that drrlling wastes would have more effect on spawning potential (an impact not apparent in the f~shery unt~l reduced recruttment in future years) than on muscle size.
The locatron of the nine appircatron srtes rn relatron to the scallop populations on Georges Bank IS shown rn Figure 34. The distrrbutron of scallops IS patchy and varies somewhat from year to year but, in general, the greatest densrt~es of scallops are found in the frontal zone. The s~tes wtth the fewest scaliops are GBFSl (strat~fted), GBFS4 (mtxed), and NEP (frontal zone). The Growler (stratifred), Hunky Dory (stratrfied) and SNEP (frontal) srtes have moderate scallop populations. The srtes with the greatest scallop denstties are GBFS2 (frontal zone), GBFSG (frontal zone) and ENEP (frontal zone).
I V
Avg. catch per 0.01 deg. square (1993-37; , 41"- 57" 56'
F~gure 34. Locatron of bbit appiication sires on Georges Bank in relatron to his:orical scalloo populalicns.

The potential impacts of the discharges predicted by the linked modelling are summarised as fotlows according to the summer physical oceanographic zones on Georges Bank: Mixed, Front and Stratified.
Mixed - Top of the Bank (<70 m i Due to high energy levels, predicted near-bottom waste concentrations at GBFS4 are very low and the potential growth loss, averaged along the primary drift line, is less than one day, even at the high settling velocity. This zone has lowest scallop density and thus impacts are expected to be low.
Frontal Zone - Edqe of the Bank (70-100 m i The near-bottom waste concentrations predicted by bblt for the complete waste release scenario would reduce potential scallop growth, averaged along the primary drift line, in the frontal zone on the order of <0.1 to 15 days depending on settllng velocity and the area over which the data are averaged. With the exception of NEP, all sites in this zone are in or near high scallop densities. However, it is not likely that the loss of several days growth would be detected in scallop populations.
The maximum effect in this zone would be losing about 16 potential growth days over the area covered by the near-bottom discharge plume. This area can be considerable because potential growth days lost can be on the order of 10 or greater at distances as far as 40 km from the release point. As stated above, the results of laboratory experiments suggest that gonadal growth would be affected more than somatic tissue growth so that the net effect might be reproductive loss which could affect the strength of future year classes. Due to the conservative nature of the parameters used in this modelling, it is expected that impacts would be lower than these predicted
Stratified - Side of the Bank (>I 00 m) The three sites on the side of the Bank produced the greatest concentrations and potential scallop growth loss. Total growth days lost ranged between 2 and 40 for the full waste release scenario depending on settling velocity and the area over which the data are averaged. The GBFSI site is in an area of low scallop abundance and the net drift of near-bottom discharge plume is predicted to be generally away from the scallop beds. Therefore, even though concentrations are predicted to be high, discharge at this location is unlikely to have a measurable effect on scallops. On the other hand, both Growler and Hunky Dory are located in areas of moderate scallop density. The net drift at Growler is predicted to be up on the Bank toward the scallop beds while that at Hunky Dory is to the north towards higher scallop densities.
In summary, the d~fferent oceanographic regions of the Bank are expected to experience d~fferent levels of Impacts depending on the movement of water and materials and the expected dens~t~es of scallops Table 13 shows the days of lost growth for the different regions, different settlrng velocities and drfferent distances from the potnt of dtscharge. The greatest sublethal impacts are expected in the stratifled zone and close to the polnt of discharge. Due to a number of factors associated w~th the conservative nature of the modelling, it is expected that the real values would be lower than those presented tn Table 13
Table 13. Estimates of days of lost growth for scallops. Estimates are given for two different settling velocities averaged within circular areas with three different radii around the discharge point. The relative densities of scallops in the regions are also indicated.
Settling Velocity Region
Radius (km) (em s" j Mixed Front Stratified 0.5 0.1 0 0 5
0.5 0 3 11 Relative density of Low MediumtoH~gh LowtoHigh scallops
Tainting GESAMP (1993) provides an excellent summary of reported tainting from petroleum products. It is possible that certain metals and organlc compounds contained in water-based drilling muds or released with cuttings may be concentrated In various tissues of organisms exposed to them, even at relatively low concentrations. Sublethal effects may or may not result. Other important concerns are whether these contaminants might be passed along the food web and influence predators or whether they might cause tainting.
Tainting might result from the use of water-based muds because of the possible oil additives. If tainting was detected under field conditions by a monitoring program, the area around a rig may have to be closed to fishing for a period of time after drilling ceases.
Canadian laboratory experiments have also indicated that scallops have the potential to concentrate both barium and chromium in their digestive tract, as well as clay particles, from water-based drilling muds but again it is difficult to apply these results to natural conditions. In regards to scallops this should not affect their marketability as only the muscle is eaten.
Measurements made during the US Georges Bank Monitoring Program could not detect any uptake or accumulation of trace metals or hydrocarbons by the ocean quahog in the wild but did not consider scallops as they are not present in the study area (Phillips et al. 1987).
Summary of Operational Discharges In summary, operational discharges would cause some biological effects over relatively short time periods and small distances from the discharge point. Smothering of benthic organisms by deposited mud and cuttings would not be anticipated outside about 0.5 km radius from the rig. The use of lower toxicity water- based drilling muds should minimise the direct mortality on organisms, as would the use of low toxicity oil for lubrication and a spotting fluid. The zone of impact around a rig would vary with location time and quantity of discharge. Impacts would disappear rapidly once drilling ceases. It is anticipated that the dispersed muds, cuttings and associated hydrocarbons would cause localised sublethal effects for some bottom dwelling organisms. Because of the large degree of spatial and temporal variability in natural populations and the limitations of current sampling methods, it is expected that it would be very difficult to detect the net result of any impact at the population level. There is little evidence to suggest concern over possible tainting of either finfish or invertebrate resources due to discharges. As with sublethal effects, potential impacts of tainting can be expected to be less with isolated exploratory wells than with a production field. Tainting should not be an issue in these WBM scenarios.
Potential Distant lrnpacts
Using a realistic scenario of exploration activities? one drilling rig operating at a time with 3-4 wells being completed over the exploration phase, it appears that impacts from routine seismic surveys and operational exploratory drilling activity is likely to have only locaiised impacts on the ecosystem components reviewed. The actual impacts will be dependent on the location, timing of the activities, and the properties of discharges. As a result of the low expected levels of impact on a local scale, such activity is not expected to have significant distant impacts. Distant impacts are estimated to be smail. These include the potential seeding of species, such as lobsters and herring, from the Georges Bank to the Gulf of Maine and possible impacts on migratory species such as marine mammals and birds that use the Bank as one part of their overall habitat. There does exist a small probability that these impacts will have population and ecosystem level impacts.

Potential Cumulative Impacts
Multiple Exploratory Wells Based on the high cost of drilling exploratory wells, it is expected that there will be only 3-4 wells drilled during exploratory activities on Georges Bank. If exploration identifies favourable quantities and the petroleum product is developed, the number of wells being drilled at any one time can be expected to increase in the production phase. As the number increases, so does the chance of detecting effects at the fisheries resource level since a greater area of the Bank would be affected and the rate of discharges would be proportionally higher.
The Bank has dispersive tidal currents in most locations that would tend to distribute discharges over a large area in a matter of days. In a single well situation, this would be helpful in diluting the discharge, and their impacts, over a large area and thus possibly reducing the impact. The critical issue would be whether threshold levels of discharge and toxins were reached at important areas of the Bank. The linked modelling of currents, benthic boundary layer transport and scallop growth impacts as described in this document would be useful in evaluating future proposals for drilling sites.
Development and Production Phases
This review and assessment was limited to petroleum exploration activities. A review of production activities that are unknown at present and their potential impacts was not conducted. However it is important to note that there are many aspects of productfon activity that have potential impacts on the marine ecosystem. Some of these activities are the same as for the exploration phase but are greater In scale. Other activities are unique to the development and production phases. Relative to the exploration phase, these include:
additional infrastructure, such as more or different platforms in place for a long time; * new infrastructure, such as pipelines; * different formulations of drilling muds; * additional discharges, such as sewage and biocides; * fishing community loss of access for the duration of the project; * potential release of produced water; and, * gas flaring.
Of particular note for production and development would be an increased potential for chronic impacts that might result from exposure to lower concentrations of materials over a longer period of time.
IX) EXCEPTIONAL EVENTSlClRCUMSTANCES
In addition to the possible impacts from routine exploration activities, there are a number of events that, although having a low probability of occurrence, have a much greater risk to the Georges Bank ecosystem.
Oilspills and Blowouts
With any petroleum development there IS always the chance of a major release of elther oil or gas into the env~ronment from an oil sprll assoc~ated with the storage and movement of the product after extract~on or a blowout dur~ng dr~ll~ng. Well blowouts and major sp~lls, however, have the potential of releasrng hydrocarbons at a rate faster than natural ecosystems can accommodate them and of affecting organisms not previously exposed to 011 derived hydrocarbons in concentrations greater than trace amounts In exploration there 1s usually no bulk storage or transfer of oil or gas, thus the r~sks and impacts of an oil sprli are no more than that usually associated wrth marine sh~pplng already occurring rn the area of the Bank.

Of greater interest to the potential impacts from exploration are the risks and potential impacts of a blowout where large quantities of oil or gas are released from well. A blowout occurs when operators of a drilling rig are unable to control the flow of petroleum product from the well and it is released into the environment. This might occur anywhere in the water column from the sea floor up through the water column to the rig itself. Not all blowouts lead to significant loss of hydrocarbons because often they seal naturally and cease flowing within a matter of hours or days. Regulations require that all feasible steps be taken to minimise the probability of a blowout while drilling wells. For example, blowout preventers are routinely installed on all wells at the seafloor that stop or slow the flow of petroleum product in unusual circumstances. However, there is always a chance that a blowout could occur as the result of human error or equipment failure.
Oil exploration and development has been underway in the Gulf of Mexico over the past 50 years. The regulatory and operational situation is somewhat comparable to that expected for Georges Bank. From January 1979 through December 1998 there were 19,821 wells drilled in the Gulf of Mexico which resulted in 118 uncontrolled flows or blowouts indicating a 0.6% occurrence rate. The vast majority of these events were the diversion of shallow gas and in only one event was there a release of any liquid hydrocarbons (87 barrels of condensate). There were no detectable environmental consequences. (W. Lang, MMS, personal communication).
If a blowout occurs it usually results in the release of a mixture of gas, gas condensate and/or oil. These three products behave differently in the water column and have different potential impacts.
The high volatility of the gas usually allows much of it to evaporate into the atmosphere and the bulk of material dissipates rapidly through the action of the wind. This is often true of the lighter components of the condensate and oil. In the first hours and days after release the lighter fractions evaporate. The impacts of such products in the atmosphere, including effects due to long distance transport, are not well known.
Gas condensate is made up of chemicals, associated with the gas, that become liquid at standard temperature and pressure. Much of this material is highly soluble in water. Many of the hydrocarbons found in gas condensate are highly toxic. For example, condensate from the Venture well on the Scotian shelf contains greater than 10% benzenes and naphthalenes, which are two of the most toxic groups of petroleum hydrocarbons. The high volatility of the material would result in much of it quickly evaporating at the sea surface. Release of large quantities of condensate at the seafloor would dissolve and may cause local mortalities because of its toxicity. It is expected that the impacts would be short-lived following the stoppage of flow, although depending on the duration, timing and location there could be significant mortalities.
Observations made during the Uniacke G-72 gas blowout are useful for evaluating a potential scenario for the gas and condensate release in the Georges Bank situation (Martec 1984). During the Unlacke G-72 blowout condensate was lost from the platform above the sea surface. This blowout, which occurred at the end of February 1984, was relatively short-lived and dispersion of its condensate was assisted by several winter storms. It is estimated that 75% of the condensate was lost by evaporation during the first 24 hours after release. The remainder either formed a temporary surface slick or became entrained in the water column. The surface slick of this light condensate persisted for several days and was observed up to 10 km from the rig. Condensate entrained in the water presumably persisted longer and travelled further because of the absence of evaporation. Measured hydrocarbon concentrations, detected to depths of at least 21 m, were usually under 100 parts per billion (ppb) compared with background levels of about 1 ppb. Biological effects were not observed or evaluated.
Released oil may form a surface slick, be mixed into the water column and/or become incorporated into sediments. The relative amounts entering each pathway and subsequent behaviour will depend upon the type of event (i.e. platform blowout, seafloor blowout, sea surface oil spill, etc.), composition and physical- chemical characteristics of the oil, environmental conditions (wind, temperature, etc.) and oceanographic features.

The environmental impacts of oil in the sea have been studied around the world for almost three decades. The GESAMP (1993) recently published a major review. DFO sc~ent~sts have played a major and important role in studying the fate of oif spills and their impacts. The GESAMP report rncludes case studies of blowouts and major oil spills under different environmental conditions, that summarises the general understanding of the behaviour, fate and effects of oil released into the sea. Much recent research provides a good understanding of the specific impacts that can be expected for Georges Bank.
It is expected that the bulk of any oil released on Georges Bank would initially concentrate at the sea surface to form a slick, even in the case of a subsurface blowout. The slick would immediately be subjected to evaporation. It has been estimated that evaporation removed 40-50°/0 of the Bunker C oil spill on Nantucket Shoals from the Argo Merchant in just 24 hours (Hoffman and Quinn 1979; Hoffman et a/. 1979) and that about 23% of spilled Hibernia crude oil would evaporate in the first five or six hours after a hypothetical spill. Since the portion of oil lost by evaporation consists largely of the lighter fractions, the composition of oil remaining in the surface slick after several days would be different from the original. Other processes that would play a major role in breaking up surface slicks just after a spill are dispersion and dissolution into the water column. Photo-oxidation (near the surface) and biodegradation would become increasingly important after a few days. Under most conditions, surface slicks of unrefined or1 should disappear after one to two weeks.
The presence of an oil slick on the surface will have the most serious biological impacts on birds, and marine mammals in the area. Greater shearwaters and razorbills spend considerable time sitting on the water and therefore have a high potential for coming into contact with oil. Oil can kill seabirds directly by removing their thermal protection, as well as interfere with their reproductive potential and induce sublethal physiological and behavioural effects. The federal Department of Environment has a role to play in providing data and information on these potential impacts, Impacts of oil slicks on marine mammals are not well understood and are species specific. Marine mammals as described above are known to frequent Georges Bank.
The amount of spilled oil that enters the water by dispersion and dissolution varies considerably with composition and environmental conditions but is generally on the order of 5-15%. Dissolution IS
considerably less than dispersion because of the low solubility of most oil components. Oil in the water may have a higher potential toxicity than surface slicks due to the reduced potential for evaporation of the lighter toxic components.
Oil products enter the water column primarily through downward mixrng. Short-term concentratlons that can be expected In the water column under blowout or spill conditions on Georges Bank are on the order of 10 to 200 ppb with an upper maximum of about 300 ppb. The depth to whtch otl penetrates wrfi depend upon wind, mixing, currents and water column structure. H~gh rates of vertical mixing observed on Georges Bank would probably increase the amount of petroleum product entrarned rn the water compared to other areas. Thrs tends to reduce the amount of petroleum components lost to the atmosphere through evaporation. A thicker mixed layer on the other hand should reduce concentratrons by increased downward mixing. Entrainment in the water could also be greater if a blowout occurred beneath the sea surface or under storm condttions. In the well-mixed central portion of the Bank, such concentrations could extend uniformly all the way to the bottom. For example, or1 sp~lled from the Argo Merchant was detected as deep as 20 m and probably penetrated deeper. Similar observations were made tn Chedabucto Bay and along the eastern shore of Nova Scotia following the Arrow spill. In stratified regions around the perimeter of the Bank, concentrat~ons in deeper water should be substantially lower. Any high concentrations should be short-lived and return to background levels with~n a week or two.
Once in the water column there are a number of ecosystem components potentially at risk.
Biological impacts on selected organisms and life stages in the water column have been demonstrated at oil concentrations that can occur under field conditions. Oil concentrations on the order of 100 ppb or less have been demonstrated to cause both lethal and sublethal effects on planktonic organisms. However, despite many studies, it is difficult to demonstrate that either major spills or chronic or1 input have any irreversible impacts on the marine planktonic communities. In most instances impacts at the ecosystem
level may be low for several reasons. The volume of water contaminated with high oil concentrations is limited in both space and time because of rapid dispersion and weathering. Secondly, planktonic organisms generally have rapid rates of regeneration on the order of days to months and can therefore quickly compensate for any loss. And thirdly, replacement phyto-and zooplankton can be readily mixed in from surrounding waters.
It remains very difficult to show the impacts of oil-induced mortality on early life stages of finfish and invertebrate resources because of large and variable natural mortality. Existing juvenile and pre-recruit survey methods are characterised by large variability that makes it almost impossible to detect mortality from oil unless it is major and extends over a large area. An idea of the potential effects of oil-induced mortality on early life stages can be obtained using ecosystem computer models that evaluate quantitatively the impacts of different spill conditions. American modelling studies have demonstrated the types of impacts that various spill scenarios on Georges Bank could have on cod, haddock and herring stocks. Some scenarios predict cumulative losses in excess of 20% for both cod and herring (Reed et al. 1984; Spaulding et a/. 1985).
There is, however, reason for continued concern about potential damage to the Georges Bank meroplankton which includes the early life stages of finfish as well as invertebrate larvae. Spawning events are generally restricted in space and time. If they coincide spatially and temporally with a spill, a significant portion of a year class could be affected. Laboratory studies have shown that eggs, larvae and juveniles of various species can demonstrate both lethal and sublethal effects when exposed to oil. Abnormal development has also been observed in the field under spill conditions. If convergence zones are sufficiently strong and persistent through time, they could tend to concentrate both oil and early life stages together in near surface waters thereby magnifying deleterious effects even further. All major commercial species on Georges Bank have pelagic eggs andlor larvae and therefore are potentially vulnerable.
The potential impact on fishery resources on Georges Bank will depend very much upon the timing and geographic location of a hydrocarbon release. Each species spawns during a limited time period. For example, scallops spawn in September-October, lobster in June-August, cod in January-June, haddock in January-May, herring in September-November, etc. Impact 'windows' can be defined which extend from the first day of spawning until such time that larvae or juveniles have sufficient mobility to avoid contaminated areas. Each species would therefore be more vulnerable at certain times of the year than others. A spill during October, for example, should not influence cod or haddock since the oil should disperse before winter spawning begins but summer spawning resources (e.g. scallops, lobster and herring) might be affected. The impact "window" for lobster may be substantially longer than other species because females carry their eggs for about nine months. Herring eggs are deposited on the bottom and remain attached for a couple of weeks. Since at least two species are spawning every month of the year, any hydrocarbon release has the potential to affect fishery resources.
The effects of oil on adult fish in the field are difficult to study and therefore knowledge is incomplete. Nevertheless, fish do have the poteniiai to avoid contaminated areas if the areas are smali enough and they are able to detect them. Even though estimates of adult stocks are more precise than those of the young, mortalities as high as 25% could go undetected. While it is possible that long-term impacts are in fact minor, it is also possible that significant impacts on aquatic populations do occur but may not be detected with present methodology. High levels of variability in resource levels result from both natural and human factors and stocks, such as some groundfish resources and some marine mammals, which are already under pressure, may be particularly sensitive to the impacts of low levels of oil.
Oil in the water column can result in the fouling of fishing gear or the closure of areas of the Bank due to suspected presence of oil. This loss of access to the Bank by the fishing industry could result in lower yields, depending on the duration and location of the blowout.
The amount of oil reaching bottom sediments depends upon numerous factors that include the volume of the blowout. type of blowout (platform or seafloor), hydrocarbon composition, depth of water and degree of water column mixing. Transport mechanisms inctude adherence to particles, incorporation into
zooplankton faecal pellets, direct sedimentation of weathered oil particies and vertical mixing. The greatest amount of oil should reach the bottom on Georges Bank in the shallow well-mixed central area and in possible convergence areas. Because of the strong tidal mixing, it is expected that more oil should reach the bottom of Georges Bank than other continental shelf environments of comparable depth.
Concentrations of hydrocarbons in sediment in the range of 10 to 100 parts per millron (ppm) could be expected from a blowout or spill. These should not persist on the Bank longer than a few months because of the strong currents that continually transport fine sediment particles out to deeper water. Any mortality of benthic species induced by a single event would probably be limited in both extent and t~me. The same is expected of sublethal effects although the extent and duration of impacts could be greater. Widely distributed species such as scallops should be subjected to little risk except in localised areas of high oil concentrations. However, species that utilise a limited portion of the Bank, such as herring at spawning, could be at higher risk if an oil release coincided with the location and timing of spawning (herring eggs adhere to the bottom for about 10 days before hatching).
Oil in the water will be transported through the influence of tides, surface currents and wind. While suspended in the water column, oil will be transported horizontally by tidal currents, eddies, residual flow and other currents. During the winter months, oil slicks are predicted to move off the Bank in a southeasterly direction away from the coast. This is the pattern followed by the oil spilled from the Argo Merchant in December 1976. Oil spill trajectory modelling for summer conditions on the northeast peak suggest that they would most likely travel in one of two principal directions. If winds are light, trajectories should be influenced primarily by the residual current and slicks would move generally to the south and southeast. Under storm conditions, surface water movement would be driven by the winds.
There is a slight probability that, if strong southerly winds occurred, such as may be associated with hurricanes, some portion of the oil couid move northwards towards the coast of Nova Scotia. The distance from the Georges Bank moratorium lands to the shore and the residual current, greatly reduce the probability of encountering the shoreline. A large portion of the crude oil in a slick should evaporate and disperse during transit so the probability of fouling the shoreline is thought to be low. Any oii that does reach the Nova Scotian coast from a release site on Georges Bank would be highly weathered and therefore less of an ecological threat than fresh oil.
It should be noted that trajectory calculations should be interpreted with caution. They are based upon long-term averages of oceanographic and meteorological conditions. Short-lived and unpredictable events, such as storms or hurricanes, can move slicks several hundred kilometres in unexpected directions relatively quickly. These same conditions, however, will accelerate the evaporation of oil and dispersion into the water column.
In general, scientists have been unable to detect effects of offshore oil blowouts on the abundance or wholesomeness of fisheries resources, including the Unlacke blowout near Sable Island However, this does not mean that effects do not occur. Furthermore, there are unique physical and biological features about Georges Bank that suggest the potential impacts could be greater than In other offshore regtons and may be detectable at the resource and ecosystem level. A gas or oil blowout could cause both lethal and sublethal brologrcal impacts on indiv~dual organisms that would vary In severrty accordrng to hydrocarbon compos~tion, type and blowout duration, location, time of year and environmental cond~tions.
Mete~r~lsgicallMydroIogical events STORMS AND HURRICANES The Georges Bank area is subject to strong storms that can affect the circulation of water year round. These winds typically blow across the shelf and can move large volumes of water off the Bank. Similarly, in the event of a blow out, the surface layers of water could move towards the southern portion of the Scotian Shelf or into the Gulf of Maine. Whereas the general circulation pattern would not predict this direct movement, it is reasonable to expect such movements within a number of days. Although thls IS a low probability and such strong winds would tend to disperse and weather the oil. thls type of circuiatron could put some coastal resources at risk.
GULF STREAM RINGS The Gulf Stream is a persistent oceanographic current that carries warm tropical water from the Gulf of Mexico north and eastward across the Atlantic. The location of this current is not fixed but in generai it passes about 200 km southeast of Georges Bank. As this current meanders east, rings of warm water often become separated from the general current and can move towards the Bank. Due to the shallow water depths on the Bank, this warm water is often stopped at the slope but in some cases this warm tropical water can flood the southern flank of the Bank and give rise to significant cross-bank exchange of water. This is a natural phenomenon that has been suspected of impacting certain populations. As with storms and hurricanes, the movement of Gulf Stream rings may give rise to circulation patterns that are not characteristic of the average circulation.
X) UNCERTAINTIES
As with any complex assessment, there are uncertainties associated with various aspects of this review. However, Georges Bank has been, and continues to be, one of the most extensively studied regions of the world's oceans. Its physical oceanography in particular is generally well described and understood, to the point that numerical circulation and dispersion models are now available that provide realistic quantitative descriptions of the effects of the predominant tidal and seasonal-mean currents, and the unique features identified above. Its biological resources are also generally well described and many of their linkages to the physical environment and other trophic levels have been identified.
However, there remain many areas of incomplete understanding, such as the role of episodic perturbations on the physical regime, some predator-prey relationships, and the overall dynamics and resiliency of the ecosystem.
Recent studies of drilling mud properties, dispersion and impacts on scallops in laboratory experiments, combined with our understanding of the physical environment and description of the scallop resource on Georges Bank, provide a substantial knowledge base for estimating potential impacts on scallop populations. The strong tidal mixing and coarse natural sediments on the Canadian portion of the Bank provide strong support for the dispersion model's prediction of relatively rapid dilution of drilling wastes in the benthic boundary layer. Most of the approximations in the model presented are conservative, in the sense of underestimating dispersion, and hence overestimating drilling mud concentrations and potential impacts, so that there is a moderate-to-high level of overall confidence in the predictions of drift, dispersion and mud concentrations. Confidence is highest for the shallower Mixed and Frontal zones where dispersion and suspension are highest, and where the highest density scallop beds occur, that is the Frontal zone. There is less conf~dence in the prediction for the Stratified zone that borders the densest scallop beds and where dispersion and suspension are lower.
The dispersion of drilling mud in the ocean is a complex phenomenon which is not fully understood and for which there are not adequate observations to validate a dispersion model in any rigorous sense. Thus, there is a small chance that drilling mud concentrations could be higher than predicted by the present dispersion model, but this is considered to be unlikely except for deeper areas away from the scallop beds.
There is uncertainty about the full range and nature of the impacts of drilling discharges on the ecosystem. Extensive studies have been conducted on the acute and sublethal toxicity of drilling muds to adult scallops and limited testing has been done with early life stages of sea scallop, lobster and haddock. These species and life stages are expected to be the most sensitive. However potentla1 lethal and sub- lethal impacts of operational discharges on other marine resources, and the overall ecosystem structure and function, on Georges Bank have not been investigated.
Much of this review deals with average conditions of physical oceanography, biological populations and weather. In reality, there can be significant deviations from the mean that would affect the assessment of potential impacts.
XI) CONCLUSIONS
As described in Section Vll) above, Georges Bank has a number of distinct features which, in combination, result in a unique marine ecosystem. Routine exploratory seismic activity might have a significant impact on adult fish behaviour that might potentially affect spawning behaviour and fish catch rates. It could also have a very localised impact on fish larvae, depending on the time of year and location. Routine operational exploratory drilling activity is likely to have only localised impacts on the ecosystem components reviewed. Actual impacts will be dependent on the location, timing of the activities, and the properties of discharges. There is a small probability of population and ecosystem level impacts.
There will be some temporary loss of access to fishing grounds during both the seismic surveys and exploration drilling. The total area that would be lost as a result of drilling activity is relatively smali. The loss of access due to the seismic surveys will depend on the timing and location of the surveys and the types of fishing gear that are being used. The greatest potential for conflict is in the summer t~me when fishing activity is high and weather conditions for seismic surveys are optimal.
As with any petroleum exploration or production activity, there is a low probability of a large release of petroleum product from a well blowout that might have an effect on the ecosystem or populations. Current technology helps to reduce this probability but most blowouts are the result of human error, a factor that is difficult to regulate other than through the training requirements specified by Canadian regulations.
Potential impacts from production activities were not included in this assessment but the impacts are expected to be different than those considered for expioratory activities. There is a wide range of production scenarios depending upon many factors, such as the product being produced, the market, available technology and best practices at the time of development. The potential impacts will be dependent, to a large degree, upon the actual production scenario.

Xli) REFERENCES
Aiken, D. E. and S. L. Waddy 1980. Reproductive biology of lobsters. in J.S. Cobb and B.F. Philipps (ed.) The Biology and Management of Lobsters. New York, N.Y., Academic Press. 1: 215-276.
Andrade, Y. and J.W. Loder. 1997. Convective descent simulations of drilling discharges on Georges and Sable Island Banks. Can. Tech. Rep. Hydrogr. Ocean Sci. 185: vi + 83 pp.
Anon. 1997. Sustainable Development - A framework for action. Comm. Dir. DFO. pp. 32.
Anon. 1994. Herring spawning is extensive on Georges Bank. NOANNEFC Research Highlights (Oct - Dec. 1993): 4.
Anon.1992. North Sea Atlas for Netherlands Policy and Management. ICONA (Interdepartmental Co- ordinating Committtee for North Sea Affairs. Stadsuitgeverij Amsterdam. pp 96.
Anon. 1986. The Department of Fisheries and Oceans Policy for the Management of Fish Habitat. Comm. Dir. DFO. pp. 28.
Anon. 1987. MARMAP Surveys of the Continental Shelf from Cape Hatteras, North Carolina, to Cape Sable, Nova Scotia (I 977-1984). Atlas No. 2. Annual Distribution Patterns of Fish Larvae. NOAA Techn~cal Memorandum NMFS-FINEC-47.
Anthony, V.C. and G. Waring. 1980. The assessment and management of the Georges Bank herring fishery. Rapp. P.-v. Reun. Cons. int. Explor. Mer. 177: 72-1 11.
Backus, R.H. and D.W. Bourne. 1987. Georges Bank. The MIT Press, Cambridge Massachusetts. pp 593.
Bisagni, J.J., R.C. Beardsley, C.M. Ruhsam, J.P. Manning and W.J. Williams. 1996. Historical and recent evidence of Scotian Shelf Water on southern Georges Bank. Deep-Sea Res. 11, 43, 1439-1471.
Boudreau, P.R. and L.M. Dickie. 1992. Biomass spectra of aquatic ecosystems in relation to fisheries yield. Can. J. Fish. Aquat. Sci. 49(8). 1528-1 538 p.
Brinkman, D. and J.W. Loder. 1993. Energetics of the internal tide on northern Georges Bank. J. Physical Ocean. 23:409-424.
Butman, B. and R.C. Beardsley. 1987. Physical oceanography. p.88-98. R.H. Backus and D.W. Bourne. (ed.). Georges Bank. MIT Press, Cambridge, Mass.
Butman, B., J.W. Loder and R.C. Beardsley. 1987. The seasonal mean circulation: observation and theory. p.125-138 in R.H. Backus and D.W. Bourne. (ed.). Georges Bank. MlT Press, Cambridge, Mass.
Campbeli, A. and A.B. Stask0. 1986. Movement of lobster (Homarus americanus), tagged in the Bay of Fundy, Canada. Mar. Biol. 92: 393-404.
CETAP. 1982. A characterization of Marine Mammals and Turtles in the Mid- and North Atlantic Areas of the US outer Continental Shelf. Cetacean and Turtle Assessment Program, Univ. Rhode Island. US Bureau of Land Management. Contract No. AA551 -CTB-48. Washington, DC.
Chen, 6. and R.C. Beardsley. 1998. Tidal rnix~ng and cross-frontal particle exchange over a finite amplitude asymmetric bank: A model study with application to Georges Bank. J. Mar. Res. 56.

Clark, S. H., W.J. Overholtz and R.C. Hennemuth. 1982. Review and assessment of the Georges Bank and Gulf of Maine haddock fishery. J. Northw. Ati. Fish. Sci. 3: 1-27.
Cohen, E.B. and M.D. Grosslein. 1987. Production on Georges Bank compared with other shelf ecosystems, in R.H. Backus and D.W. Bourne. (ed.). Georges Bank, The MIT Press, Cambridge, MA, 383-391.
Colton, J.B. 1955. Spring and summer distribution of haddock on Georges Bank. Special Scientific Report of the US Fish and Wildlife Service - Fisheries No. 156, 65 p.
Cranford, P.J. and D.C. Gordon, Jr. 1992. The influence of dilute clay suspensions on sea scallop (Placopecten magellanicus) feeding activity and tissue growth. Neth. J. Sea Res. 30, 107-1 20.
Cranford, P.J., and D.C. Gordon, Jr. 1991. Chronic sublethal impact of mineral oil-based drilling mud cuttings on adult sea scallops. Mar. Pollut. Bull. 22: 339-344.
Cranford, P.J., C.W. Emerson, B.T. Hargrave and T.G. Milligan. 1998. In situ feeding and absorption responses of sea scallops Placopecten magellanicus (Gmelin) to storm-induced changes in the quantity and composition of the seston. J. Exp. Mar. Biol. Ecol. 21 9, 45-70.
Cranford, P.J., D.C. Gordon Jr., K. Lee, S.L. Armsworthy and G.-H. Tremblay. 1999. Chronic toxicity and physical disturbance effects of water- and oil-based drilling fluids and some major constituents on adult sea scallops (Placopecten magellanicus). Mar. Envir. Res. accepted.
Csanady, G.T. and B.A. Magneil 1987. Mixing processes. p. 163-169. In: Georges Bank. R.H. Backus and D.W. Bourne (ed.). MIT Press, Cambridge, Mass.
Daan, R., W.E. Lewis and M. Murder. 1990. Biological effects of discharged oil-contaminated drill cuttings in the North Sea. NlOZ Rapp. 1990-5: 79 p.
Danenberger, E.P. 1983. Georges Bank Exploratory Drilling. US Dept. of Int., Minerals Management Service Report. Hyannis, MA. pp. 20.
Davis, R.A. D.H. Thomson and C.I. Malme. 1998. Environmental Assessment of Seismic Exploration on the Scotian Shelf. CanadalNova Scotia Offshore Petroleum Board. Halifax.
Davis, C.S. 1987. Zooplankton life cycles. in Georges Bank, R.H. Backus and D.W. Bourne (ed.). The MIT Press, Cambridge, MA, 256-267.
Davis, C.S. 1984. Interaction of a copepod population with the mean circulation on Georges Bank. J. Mar. Res. 42: 573-590.
DFO. 1998a. Georges Bank Scallop. Stock Status Report. C3-17. pp. 5.
DFO. 1998b. Eastern Georges Bank Cod. Stock Status Report. A3-04. pp. 6.
DFO. 1998~. Eastern Georges Bank Haddock. Stock Status Report. A3-08. pp. 9.
DFO. 1998d. Yellowtail Fiounder on Georges Bank. Stock Status Report. A3-15. pp. 6.
DFO. 1997. Georges Bank Lobsters. Stock Status Report. C3-14.
DFO. 1996. Georges Bank Herring. Stock Status Report. 96/36E. pp. 3.
DiBacco, C., G. Robert and J. Grant. 1995. Reproductive cycle of the sea scallop, Placopecten magellanicus (Gmelin, 17911, on northeastern Georges Bank. J. Shellfish Res. 14: 59-69.

Dorsey, E.M. and J. Pederson (eds.). 1998. Effects of Fishing Gear on the Sea Floor of New England. Conservation Law Foundation. Boston. MA. pp. 160.
Drinkwater, K.F. 1998. Horizontal Dispersion on the Northern Flank of Georges Bank. ICES C.M. 1988/R:15. pp17.
Drinkwater, K.F. and J.W. Loder. 1998. Near-surface horizontal convergence and dispersion near the tidal-mixing front on northeastern Georges Bank. Deep-Sea Res. II (submitted).
Durbin, E. 1996. Zooplankton dynamics of the Gulf of Maine and Georges Bank region, in G.T. Wallace and E.F. Braasch, (eds.) Proceedings of the Gulf of Maine Ecosystem Dynamics Scientific Symposium and Workshop. RARGOM Report 97-1, 53-67.
Flagg, C.N. 1987. Hydrographic structure and variability. p.108-124 in: R.H. Backus and D.W. Bourne (eds.). Georges Bank, MIT Press, Cambridge, Massachusetts.
Flagg, C.N., B.A. Magnell, D. Frye, J.J. Cura, S.E. McDowell and R.I. Scarlet. 1982. Interpretation of the physical oceanography of Georges Bank. EG&G Environmental Consultants, Waltham, Mass. Final report prepared for U.S. Dept. of Interior, Bureau of Land Management, 901 pp.
Franks, P.J.S. and C. Chen. 1996. Plankton production in tidal fronts: a model of Georges Bank in summer. J. Mar. Res. 54: 631 -651.
Fridgeirsson, E. 1978. Embryonic development of five species of gadoid fishes in Icelandic waters. Rit. Fiskideildar 5(6): 1-68.
Garrett, C.J.R. 1972. Tidal resonance in the Bay of Fundy and Gulf of Maine. Nature 238, 441-443.
Garrett, C.J.R., J.R. Keeley and D.A. Greenberg. 1978. Tidal mixing versus thermal stratification in the Bay of Fundy and Gulf of Maine, Atmosphere-Ocean, 16, 403-423.
Gavaris, S. and L. Van Eeckhaute. 1998. Assessment of haddock on eastern Georges Bank. DFOICSAS Res. Doc. 98/66: 75p.
Gavaris, S., L. Van Eeckhaute, M-I. Buzeta and J. Hunt. 1993. Yield projections for the transboundary cod and haddock resources on Eastern Georges Bank. DFO Atl. Fish. Res. Doc. 93/91
Grant, J., P.J. Cranford and C. Emerson. 1997. Sediment resuspension rates, organic matter quality and food utilization by sea scallops (Placopecten magellanicus) on Georges Bank. J. Mar. Res. 55: 965-994.
GESAMP. 1993. Impact of Oil and Related Chemicals on the Marine Environment. Reporis and Studies No. 50. pp 180.
Gordon, D.C. Jr. (ed.). 1988. An assessment of the possible environmental impacts of exploratory drilling on Georges Bank fishery resources. Can. Tech. Rep. Fish. Aquat. SCI. No. 1633: vi + 31 p.
Haiiiday, R.G. 1988. Use of seasonal spawning area ciosures in the management of haddock fisheries in the Northwest Atlantic. NAFO Sci. Coun. Studies 12: 27-36.
Hannah, C.G., C.E. Naimie, J.W. Loder and F.E. Werner. 1998a. Upper-ocean transport mechanisms from the Gulf of Maine to Georges Bank, with implications for Calanus supply. Cont. Shelf Res., 17, 1887- 1911.
Hannah. C.G., Z. Xu, Y. Shen and J.W. Loder. 1998b. Models for suspended sediment d~spersion and drift. p.708-722 in: Estuarine and Coastal Modeling: Proc. 5th lnternat~onal Conference, ASCE, New York.
Hannah, C.G., J.W. Loder and Y. Shen. 1996. Shear dispersion in the benthic boundary layer. p. 454-465 in: Estuarine and Coastal Modeling: Proc. 4th International Conference. M.L. Spaulding and R.T. Cheng (eds.), ASCE, New York.
Hannah, C.G., Y. Shen, J.W. Loder and D.K. Muschenheim. 1995. bblt formulation and exploratory applications of a benthic boundary layer transport model. Can. Tech. Rep. Hydrogr. Ocean Sci. 166: vi + 52 p.
Harding, G.C., E.L. Kenchington, C.J. Bird, D.S. Pezzack and D. Landry. 1997. Genetic relationships among subpopulations of the American lobster (Homarus americanus) as revealed by random amplified polymorphic DNA. Can. J. Fish. Aquat. Sci. 54: 1762-1771.
Harding, G.C., K. Drinkwater, J.D. Pringle, A.J. Fraser, J. Prena, S. Pearre, Jr., R.I. Petty and W.P. Vass. 1995. Studies on the Effect of the Frontal Zone on the Northern Face of Georges Bank, Gulf of Maine, on Larval Lobster and Plankton Distribution. ICES Annual Sci. Conf. Theme Session Q19.
Harding, G.C., J.D. Pringle, W.P. Vass, S. Pearre, Jr., and S.J. Smith. 1987. Vertical distribution and daily movements of larval lobsters ffornarus arnericanus larvae over Browns Bank, Nova Scotia. Mar. Ecol. Prog. Ser. 41: 29-41.
Hoffman, E.J. and J.G. Quinn. 1979. Gas chromatographic analyses of Argo Merchant oil and sediment hydrocarbons at the wreck site. Mar. Poll. Bull. 10: 20-24.
Hoffman, E.J., J.G. Quinn, R. Jademer and S.H. Foutier. 1979. Comparison of UV fluorescence and gas chromatographic analyses of hydrocarbons in sediments from the vicinity of the Argo Merchant wreck site. Bull. Environ. Contam. Toxicol. 23: 536-543.
Horne, E.P.W., J.W. Loder, C.E. Naime and N.S. Oakey. 1996. Turbulence dissipation rates and nitrate supply in the upper water column on Georges Bank. Deep-Sea Res. 11 43: 1683-1712.
Horne, E.P.W., J.W. Loder, W.G. Harrison, R. Mohn, M.R. Lewis, B. Irwin and T. Platt. 1989. Nitrate supply and demand at the Georges Bank tidal front. Sci. Mar. 53 (2-3): 145-158.
Hunt, J.J. 1996. Rate of sexual maturation of Atlantic Cod in NAFO Division 5Ze and commercial fishery implications. J. Northw. Atl. Fish. Sci. Vol. 18: 61-75
Katona, S.K. and J. A. Beard. 1990. Population size, migrations and feedrng aggregations of the humpback whale (Megapfera novaeangiiae) rn the western North Atlantic Ocean. in Harnrnond, P.S., Mizroch, S.A. and Donovan, G.P. (ed.) lnd~vidual recogn~tlon of cetaceans: Use of photo- identif~cation and other techniques to est~mate population parameters. The lnternat~onal Whaling Comm~ssion, Cambridge. pp. 295-306.
Katona, S., V. Rough and D.T. Richardson. 1993. A field guide to the whales, porpoises, and seals from Cape Cod to Newfoundland. Smithsonian Institution Press, Washington, D.C.
Kenney, R.D., G.P. Scott, T.J. Thompson and H.E. Winn. 1997. Estimates of prey consumption and trophic impacts of cetaceans in the USA northeast continental shelf ecosystem. J. Northw. Atl. Fish. Sci. 22: 155-1 71.
Kingston, P.F. 1992. Impact of offshore oil production installations on the benthos of the North Sea ICES J. Mar. Sci. 49: 45-53.

Limeburner, R. and R.C. Beardsley. 1996. Near-surface recirculation over Georges Bank. Deep-Sea Res. 11, 43, 1547-1574.
Loder, J. W. and T. Platt. 1985. Physical controls on phytoplankton production at tidal fronts, in Proceed. 19th Europ. Mar. Biol. Symp., P.E. Gibbs, (ed.), Cambridge Univ. Press, Cambridge, UK, 3-22.
Loder, J.W., C.G. Hannah, Y. Shen, E. Gonzalez and Z. Xu. 1998a. Suspended sediment drift and dispersion on Georges Bank. Can. Tech. Rep. Hydro. Ocean Sci., in preparation.
Loder, J.W., J.A. Shore, C.G. Hannah and B. Petrie. 1998b. Decadal-scale hydrographic and circulation variability in the Scotia-Maine region. Deep-Sea Res. II (submitted).
Loder, J.W., K.R. Drinkwater, N.S. Oakey and E.P.W. Horne. 1993. Circulation, hydrographic structure and mixing at tidal fronts: the view from Georges Bank. Phil. Trans. R. Soc. London. 343: 447- 460.
Loder, J.W., D. Brickman and E.P.W. Horne. 1992. Detailed structure of currents and hydrography on the northern side of Georges Bank. J. Geophys. Res., 97.4331-14351.
Loder, J.W., C.K. Ross and P.C. Smith. 1988. A space- and time-scale characterization of circulation and mixing over submarine banks, with application to the northwestern Atlantic continental shelf. Can. J. Fish. Aquat. Sci. 45, 1860-1885.
Lough, R.G. and J.P. Manning. 1998. Tidal-front entrainment and retention of fish larvae on Georges Bank. Deep-Sea Res. II (submitted).
Lough, R.G., P.C. Valentine, D.C. Potter, P.J. Auditore, G.R. Bolz, J.D. Neilson and R.I. Perry. 1989. Ecology and distribution of juvenile cod and haddock in relation to sediment type and bottom currents on eastern Georges Bank. Mar. Eco. Prog. Ser. 56. 1-1 2 p.
MacDonald, B.A., and R.J. Thompson. 1986. Influence of temperature and food availability on the ecological energetics of the giant scallop Piacopecten magellanicus. ill. Physiological ecology, the gametogenic cycle and scope for growth. Mar. Biol. (Berlin) 93: 37-48.
MacLaren Plansearch. 1997. Phase B - Impact Assessment Final Report. Physical fate of drilling and production effluent discharges and impact on marine environment. Part 1: Drilling waste discharges. Report prepared for Sable Offshore Energy Project and tabled at Joint Public Review Panel.
Mahon, R., S.K. Brown, K.C.T. Zwanenburg, D.B. Atkinson, K.R. Buja, L. Ciaflin, G.D. Howell, M.E. Monaco, R.N. O'Boyle and M. S~nclair. 1998. Assemblages and biogeography of demersal fishes of the east coast of North America. Can. J. F~sh. Aquat. Sci. 55: 1704-1738.
Mahlon, C.K., R.H. Green, P. Montagna and P.F. Roscigno. 1996. Gulf of Mexico offshore operations monitoring Experiment (GOOMEX), Phase I: Sublethal responses to contaminant exposure - introduction and overview. Can. J. Fish. Aqua. Sci. 53: 2540-2553.
Martec Ltd. 1984. Report on the Environmental Program Associated with the Blowout at Shell Uniacke G- 72. Report prepared for Shell Canada Resources Ltd.. Halifax, N.S.
Meise, C.J. and J. E. O'Reilly. 1996. Spatial and seasonal patterns in abundance and age-composition of Calanus finmarchicus in the Gulf of Maine and on Georges Bank: 1977-1987. Deep-Sea Res. 43: 1473-1 502.
Melvin, G.D., and J.F. Fife. 1993. Report on the 1992 Survey of Georges Bank using Commercial Herring Seiners. DFO Atl. Fish. Res. Doc. 93/73: 16p

Melvin, G.D., F.J. Fife, M.J. Power and R.L. Stephenson. 1996. The 1996 Review of Georges Bank (5Z) Herring Stock. DFO Atl. Fish. Res. DOC. 96/29: 54p.
Milligan, T.G. and P.S. Hill. 1998. A laboratory assessment of the relative importance of turbulence, particle composition, and concentration in limiting maximal floc size and settling behaviour. J. Sea Res. 39: 227-241.
Moody, J.A., B. Butman, R.C. Beardsley, W.S. Brown, P. Daifuku, J.D. Irish, D.A. Mayer, H.O. Mofjeld, B. Petrie, S. Ramp, P. Smith and W.R. Wright. 1984. Atlas of tidal elevation and current observations on the Northeast American continental shelf and slope. U.S. Geological Survey Bulletin 161 1, 122 p.
Muschenheim, D.K. and T.G. Miliigan. 1996. Flocculation and accumulation of fine drilling waste particulates on the Scotian Shelf (Canada). Mar. Pollut. Bull. 32: 740-745.
Muschenheim, D.K., T.C. Milligan and D.C. Gordon, Jr. 1995. New technology and suggested rnethodotogies for monitoring particulate wastes discharged from offshore oil and gas drilling platforms and their effects on the benthic boundary layer environment. Can. Tech. Rep. Fish. Aquat. Sci. 2049: x c 55 p.
Naimie, C.E. 1995. Georges Bank bi-monthly residual circulation - prognostic numerical model results. Report #NML 95-3, Numerical Methods Laboratory, Dartmouth College, Hanover, NH.
Naimie, C.E. 1996. Georges Bank residual circulation during weak and strong stratification periods - Prognostic numerical model results. Journal of Geophysical Research 101, 6469-6486.
Naimie, C.E., J.W. Loder and D.R. Lynch. 1994. Seasonal variation of the three-dimensional residual circulation on Georges Bank. J. Geophysical Res. 99: 7 5967-1 5989.
National Energy Board (NEB). 1996. Offshore waste release guidelines. Report issued by the National Energy Board, Canada-Newfoundland Offshore Petroleum Board and Canada-Nova Scotia Offshore Petroleum Board, 18 p.
NEFSC (Northeast Fisheries Science Center). 1996. Report of the 21th Northeast Regional Stock Assessment Workshop (21th SAW). Woods Hole, MA: NOAA/NMFS/NEFSC. NEFSC Ref. DOC. 9 6 1 ~ ~ : 60-74.
Neff, J.M, M.H. Bothner, N.J. Maciolek and J.F. Grassle. 1989. Impacts of Exploratory Drilling for Oil and Gas on the Benthic Environment of Georges Bank. Marine Environmental Research 27: 77-1 14.
Neff, J.M. 1987. The potential effects of drilling effluents on marine organisms on George Bank. In: Backus and Bourne (ed.). Georges Bank, MIT Press, pp. 551-5539.
Neilson, J.D. and S.X. Cadrin. 1998. 1998 Assessment of Georges Bank (5Zjmnh) yellowtail flounder Can. Stock Assess. Sec. Res. Doc. 98/67, 90 p.
Neilson, J.D., P. Hurley and R.I. Perry. 1986. Stock structure of yellowtail flounder in the Gulf of Maine area: implications for management. CAFSAC Res. Doc. 86164, 28 p.
Neilson, J.D. and P. Perley. 1996. Can lchthyoplankton Data be Used to Describe Spawning Areas of Marine Fish? In: D.L. Burke, R.N. O'Boyle, P. Partington and M. Sinclair (eds.). Report of the Second Workshop on Scotia-Fundy Groundfish Management. Can. Tech. Rep. Fish. Aquat. Sci. 2100: V11+247 p.
NRC (National Research Council). 1983. Driiling discharges in the marine environment. National Academy Press, 180 p.
O'Reilly, J. E. and D. A. Busch. 1984. Phytoplankton primary production of the northwestern Atlantic shelf. Rapp. P.-v. Reun. 183: 255-268.
O'Reilly, J.E., C. Evans-Zeltin and D.A. Busch. 1987. Primary production, in Georges Bank, R.H. Backus and D.W. Bourne (ed.), The MIT Press, Cambridge, MA, 220-233.
Olsgard, F. and J.S. Gray. 1995. A comprehensive analysis of the effects of offshore oil and gas exploration and production on the benthic communities of the Nowegian continental shelf. Mar. Ecol. Prog. Ser. 122: 277-306.
Overholtz, W.J. 1985. Seasonal and age-specific distribution of the 1975 and 1978 yearclasses of haddock on Georges Bank. NAFO Sci. Coun. Studies. 8: 77-82.
Page, F.H., M. Sinclair, C.E. Naimie, J.W. Loder, R.J. Losier, P.L. Berrien and R.G. Lough. 1998. Cod and haddock spawning on Georges Bank in relation to water residence times. Fish. Oceanogr. (submitted).
Page, F.H., R. Losier and P. Berrien. 1997. Spawning time of haddock and cod on Georges Bank as indicated by the MARMAP ichthyoplankton data set. CSAS Res. Doc. 971130 26p.
Perry, R.I., G.C. Harding, J.W. Loder, M.J. Tremblay, M.M. Sinclair and K.F. Drinkwater. 1993. Zooplankton distributions at the Georges Bank frontal system: retention or dispersal? Cont. Shelf. Res. 13: 357-383.
Pershing, A.J., P.H. Wiebe, J.P. Manning and M.J. Copley. 1998. Evidence for vertical circulation cells in the well-mixed area of Georges Bank and possible biological implications. Deep-Sea Res. II (submitted).
Pezzack, D.S. 1987. Lobster (Homarus americanus) stock structure in the Gulf of Maine. ICES Res. Doc. C.M. 1987/K:17: 18.
Pezzack, D.S. and D.R. Duggan 1989. Female size-maturity relationships for offshore lobsters (Homarus americanus). Can. Atl. Fish. Sci. Adv. Comm. Res. Doc. 89/66: 9.
Pezzack, D.S. and D.R. Duggan 1995. The 1995 Review of the Canadian Offshore Lobster Fishery - LFA 41. DFO Atl. Fish. Res. Doc. 95/91: 35.
Pezzack, D.S., M.J. Tremblay, C. Hudson and R.J. Miller. 1992. The inshore-offshore lobster issue in Southwestern Nova Scotia, Can. Manuscr. Rep. Fish. Aquat. Sci. 2165: 23.
Phillips, C.R., J.R. Payne, J.L. Lambach, G.H. Farmer and R.R. Sims, Jr. 1987. Georges Bank monitoring program: hydrocarbons in bottom sediments and hydrocarbons and trace metals in tissues. Mar. Environ. Res. 22: 33-74.
Reed, M., M.L. Spaulding, E. Lorda, H. Walder and S.B. Saila. 1984. Oil spill fishery impact assessment modelling: The fisheries recruitment problem. Est. Coastal Shelf Sci. 19: 591 -610.
Ridderinkhof, H. and J.W. Loder. 1994. Lagrangian characterization of circulation over submarine banks with application to the outer Gulf of Maine. J. Phys. Ocean. 24:1184-1200.
Robert, G., M.A.E. Butler and S.J. Smith. 1998. Georges Bank Scallop stock assessment - 1997. DFO Can. Stock Assess. Sec. Res. Doc. 98/69.
Robinson, W.E., W.E. Wehling, M.P. Morse and G.S. McLeod. 1981. Seasonal changes in soft-body component indices and energy reserves in the Atlantic deep-sea scallop, Placopecten mageiianicus. Fish. Bull (US) 79: 449-458.
Sathyendranath, S., T. Platt, E.P.W. Horne, W.G. Harrison, 0. Ulloa, R. Outerbridge and N. Hoepffner. 1991. Estimation of new production in the ocean by compound remote sensing. Nature 353: 129- 133.
Skud, B.E. 1969. The effects of fishing on size composition and sex ratios of offshore lobster stocks. Fisk. Dir. Skr. Ser. Havunderes 15: 295-309.
Sinclair, A., M. Sinclair and T.D. Iles. 1981. An analysis of some biological characteristics of the 4X juvenile-herring fisheries. Proc. N.S. Inst. Sci. Vol. 31: 155-171.
Smith, P.C., R.W. Houghton and D.G. Mountain. 1998. Interannual variability of boundary fluxes and water mass properties in the Gulf of Maine and on Georges Bank: 1993-97. Deep-Sea Res. I I (submitted).
Smigielski, A.S. 1979. Induced spawning and larval rearing of yellowtail flounder, Limanda ferruginea. Fish. Bull., U.S. 76: 931-936.
Smith, W.G., J.D. Siirenka and A. Wells. 1978. Diet movements of larval yellowtail flounder, Limanda ferruginea, determined from discrete depth sampling. Fish. Bull. , U.S. 76:167-178.
Spaulding, M.L., M. Reed, E. Anderson, T. Isaji, J.C. Swanson, S.B. Saiia, E. Lorda and H. Walker. 1985. Oil spill fishery impact assessment model: Sensitivity to spill iocation and timing. Est. Coastal Shelf Sci. 20: 41-53.
Stephenson, R.L., and M.J. Power. 1989. Reappearance of Georges Bank herring: A biological update. Can. Atl. Sci. Adv. Comm. Res. Doc. 89/60: 14p.
Stobo. W. T., B. Beck and J. K. Horne. 1990. Seasonal movements of grey seals (Halichoerus grypus) in the Northwest Atlantic. in W.D. Bowen (ed.). Population biology of sealworm (Pseudoterranova decipiens) in relation to its intermediate and seal hosts. pp. 199-21 3.
Tam, Y.K. and I. Kornfield. In press. Population genetics of the American lobster (Homarus americanus) in the Northwest Atlantic: assessment with microsatellite and mitochondria1 markers.
Thouzeau, G., G. Robert and R. Ugarte. 1991. Faunal assemblages of benthic megainvertebrates inhabiting sea scallop grounds from eastern Georges Bank, in relation to environmental factors. Mar. Ecol. Prog. Ser. 74: 61-82.
Tremblay, M. J., J.W. Loder, F.E. Werner. C.E. Naime, F.H. Page and M.M. Sinclair. 1994. Drift of sea scaliop larvae Piacopecten mageiianicus on Georges Bank: a model study of the roles of mean advection, larval behaviour and larval origin. Deep-Sea Res. 1 1 41: 7-49.
Uzmann, J.R., R.A. Cooper and K.J. Pecci. 1977. Migration and dispersion of tagged American lobsters, Homarus americanus, on the southern New England continental shelf. NOAA Tech. Rep. NMFS SSRF 705.
Van Eeckhaute, L., S. Gavaris and E.A. Trippel. In press. Movements of haddock on eastern Georges Bank obtained from a population model incorporating temporal and spatial detail. Fish. Bull.
Waddy, S.L. and D.E. Aiken 1986. Multiple fertilization and consecutive spawning in large American lobsters, Homarus americanus. Can. J. Fish. Aqual. Sci. 43: 2291 -2294.
Werner, F.E.. F.H. Page, D.R. Lynch, J.W. Loder, R.G. Lough, R.I. Perry, D.A. Greenberg and M.M. Sinclair. 1993. Influences of mean advection and simple behaviour on the distributions of cod and haddock early life stages on Georges Bank. Fish. Oceanogr. 2(2), 43-64.

White, M.J. 1997. The effect of flocculat~on on the size-selective feeding capabilities of the sea scallop Placopecten mageilanicus. M.Sc. Thesis, Dalhousie University, Halifax, Nova Scotia, 77 p.
Whitehead, H., W.D. Bowen, S.K. Hooker and S. Gowns. 1998. Marine mammals. in W.G. Harrison and D.G. Fenton (ed.). The Gully: A scientific review of its Environment and Ecosystem. Department of Fisheries and Oceans, Ottawa, Canada. pp. 186-221.
Wiebe, P.H. and R.C. Beardsley (ed.). 1996. Physical-Biological interactions on Georges Bank and its environs. Deep-Sea Res. Part I I .
Yoshida, J. and N.S. Oakey. 1996 Characterization of vertical mixing at a tidal front on Georges Bank. Deep- Sea Research 1 1 43, 171 3-1 744.
Zinkevich, V.N. 1967. Observations on the distribution of herring, Clupea harengus L., on Georges Bank and in adjacent waters in 1962-1 965. ICNAF Res. Bull 4: 101 -1 15.
XIII) APPENDIX - Drilling Waste Dispersion Modelling and Potential Effects on Scallops
Introduction Hydrocarbon exploration and development drilling in the Atlantic Canada offshore includes the routine release (with some restrictions) of different kinds of drilling muds (which vary widely in composition and properties) and formation cuttings to the marine environment. At the time of the previous DFO assessment on the possible environmental effects of exploratory drilling on Georges Bank (Gordon 1988), there was limited information on the potential impacts of these particulate wastes on benthic organisms. It was felt that measurable impacts might be expected under some conditions. Research recommendations included developing better numerical models to understand waste dispersion and improving our understanding of the effects of drilling wastes on benthic organisms, in particular the sea scallop (Placopecten magellanicus) which is the most valuable commercial species on Georges Bank. By coupling the biological results to waste dispersion modeis, the spatial and temporal extent of potential impact zones around a drill site could be predicted.
DFO subsequently developed a focused and well-integrated research program, which has been funded by the federal Panel on Energy Research and Development (PERD), to address these recommendat~ons. Because of the nature of the questions being asked, this program has covered a wide range of sc~ent~frc d~sc~plines rncluding physrcal oceanography, sedimentology, engineering and ecology. Speciftc research projects have included physical oceanograph~c field programs on Georges Bank, sedimentological field studies on Georges Bank, Sable Island Bank and the Grand Banks (the latter two around active drilling sites), laboratory studies on the flocculation of drilling muds and on the effects of varlous drilling wastes on adult sea scallops, the development of new instrumentation for measuring dr~lling wastes In the offshore environment, and the development of numerrcal circulat~on and dispersion models.
The results of these projects have greatly increased the understanding of the behaviour, transport and effects of particulate drilling wastes in continental shelf environments. Numerous publications have been completed or are in progress. The modelling project is currently being completed and the new models are applied here to the hypothetical drilling scenario for sites on Georges Bank. Two technical reports are in preparation. This report is a brief overview of the results and current interpretation.
Background Information
Drilling wastes Operational drlll~ng discharges have two major components; muds and cuttings. Muds are specially- formulated mixtures of clay and numerous other materials suspended in a carrier flu~d whlch is either water (WBM), oil (OBM) or a synthetrc orgapic mrxture (e g esters, ethers, polyalphaolefrns, synthetic 011.
etc.). The latter mud types can be ciassrfred as WBM or OBM, but are generally referred to by industry as alternative-based muds (ABM). Muds serve several functions including transporting cuttings to the surface, balancing of subsurface and format~on pressure to prevent blow-out, and cooling, lubricat~ng and partly supporting the dr~ll bit and drill pipe. They also stabilise the borehole wall and prevent fluid exchanges with the rock formation. Mud composition is continually changed during driii~ng to adjust to the specif~c down-hole conditions encountered. Cuttlngs are particles of formation rock produced by the actron of the drrll bit which are carried to the surface with drilling mud.
Mud and cuttings are typically discharged through a pipe at a depth on the order of 5-10 m below the sea surface. However, in some instances, such as open circuit drilling at the start of a well, waste can be discharged directly at the sea floor. Two types of discharges generally occur. Daily discharges consist of cuttings, associated muds and some fine particles from the formation. In addition, bulk dumps of WBM occur at the completion of the well or well sections.

Existing Canadian offshore waste treatment guidelines (NEB 1996) allow the discharge of WBM from drilling platforms without treatment. However, OBM and ABM must be recovered and recycled or transferred to shore. Cuttings produced using WBM and ABM can be discharged without treatment. Current guidelines stipulate that OBM cuttings can not be discharged until treatment has reduced the oil content to 15% by weight or less. However, the Canada-Nova Scotia Offshore Petroleum Board (CNSOPB) has recently stipulated that beginning 1 January 2000 the oil content on discharged OBM cuttings must not exceed 1% by weight.
Exptoration wells are usually drilled with WBM over a period of several months. Development wells have typically been drilled with a combination of WBM and OBM, but ABM is increasing in popularity given the tougher regulations on the discharge of OBM cuttings. Total waste release during development drilling is generally much greater since mult~ple wells are usually drilled at the same location. This modelling project has focused on WBM as regulatory pol~cy indicates it would be used for exploration drilling on Georges Bank.
Field Observations Field observations made around active drilling platforms indicate that roughly looh of the discharged wastes is neutrally buoyant and forms a surface plume (NRC 1983). The balance of the wastes (on the order of 90%) is denser than seawater and, if released at or near the sea surface, forms a plume that descends through the water column unt~l it either reaches the seafloor or becomes neutrally buoyant. Therefore. in shailow water, a large fraction of the discharge will reach the seafloor close to the platform. The resuspension, dispersion, drift and final deposition site of this materiai will depend upon such physical variables as water depth, currents (t~dai and residual), waves and storms. Most of this lateral transport takes place in the benth~c boundary layer (the bottom of the water column just above the seafloor) where sea scallops obtain their particulate food resources.
Observations by DFO using different kinds of oceanographic instrumentation around the PanCanadian CoPan oil field on Sable Island Bank (34 m water depth) have confirmed that discharged drilling wastes flocculate, sediment rapldly and concentrate in the benthic boundary layer (Muschenheim and Milligan 1996). On certain occasions during developmental drilling, fine particulates from drilling wastes were present in the benthic boundary layer up to 8 km from the platform. Field observations at several locations on Georges Bank not affected by drilltng indicate the presence of elevated levels of natural suspended matter in the benthic boundary layer but the absence of fine particulates (Muschenheim eta/. 1995).
Flocculation and effective settling velocity of drilling wastes Laboratory experiments carried out with whole WBM, particulate-drilling wastes and two major mud constituents (barite and bentonite) have provided estimates of flocculation and settling rates. Flocculation increases effective particle size and therefore increases settling velocity. These experiments indicated that the settling rates of flocculated drilling wastes under laboratory conditions could be as high as 1.5 cm s-I. However, these flocs were densely packed and did not look like the "fluffy" drilling waste flocs observed at CoPan (Muschenheim and Milligan 1996). On the basis of these results, measurable drilling waste concentration gradients in the benthic boundary layer at CoPan, and literature values, the expected range of effective settling velocities for flocculated drilling wastes under natural conditions in tidally-energetic environments is estimated to be 0.1-0.5 cm s".
Plume dispersion modelling Using industry standard models, simulations were carried out to determine the depth of descent of the waste discharge plume under different discharge conditions, densities and environmental conditions. The factors which significantly affect the depth of descent were found to be mud density, depth of release, initial downward volume flux of the discharge. current strength and water column stratification (Andrade and Loder 1997). These data can be used to estimate the portion of drilling wastes released at or near the sea surface that can be expected to reach the seafloor under different scenarios.
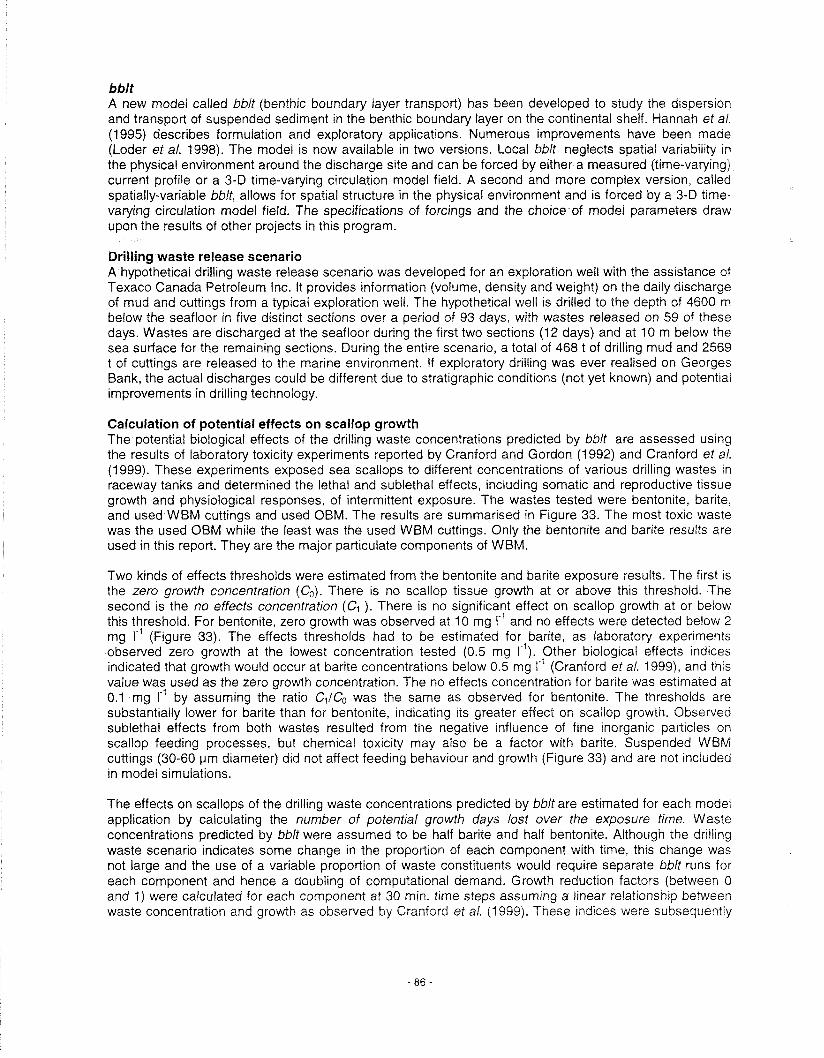
bblt A new model called bblt (benthic boundary layer transport) has been developed to study the dispersion and transport of suspended sediment in the benthic boundary layer on the continental shelf. Hannah et at. (1995) describes formulation and exploratory applications. Numerous improvements have been made (Loder et a/. 1998). The model is now available in two versions. Local bblt neglects spatial variability in the physical environment around the discharge site and can be forced by either a measured (time-varying) current profile or a 3-D time-varying circulation model field. A second and more complex version, called spatially-variable bblt, allows for spatial structure in the physical environment and is forced by a 3-0 time- varying circulation model field. The specifications of forcings and the choice of model parameters draw upon the results of other projects in this program.
Drilling waste release scenario A hypothetical drilling waste release scenario was developed for an exploration well with the assistance of Texaco Canada Petroleum Inc. It provides information (volume, density and weight) on the daily discharge of mud and cuttings from a typical exploration well. The hypothetical well is drilled to the depth of 4600 m below the seafloor in five distinct sections over a period of 93 days, with wastes released on 59 of these days. Wastes are discharged at the seafloor during the first two sections (12 days) and at 10 m below the sea surface for the remaining sections. During the entire scenario, a total of 468 t of drilling mud and 2569 t of cuttings are released to the marine environment. If exploratory drilling was ever realised on Georges Bank, the actual discharges could be different due to stratigraphic conditions (not yet known) and potentral improvements in drilling technology.
Calculation of potential effects on scallop growth The potential biological effects of the drilling waste concentrations predicted by bblt are assessed using the results of laboratory toxicity experiments reported by Cranford and Gordon (1 992) and Cranford et a/. (1 999). These experiments exposed sea scallops to different concentrations of various drilling wastes in raceway tanks and determined the lethal and sublethal effects, including somatic and reproductive tissue growth and physiological responses, of intermittent exposure. The wastes tested were bentonite, barite, and used WBM cuttings and used OBM. The results are summarised in Figure 33. The most toxic waste was the used OBM while the least was the used WBM cuttings. Only the bentonrte and barite results are used in this report. They are the major particulate components of WBM.
Two krnds of effects thresholds were estimated from the bentonite and barite exposure results. The first IS
the zero growth concentrat~on (Go). There 1s no scallop tissue growth at or above this threshold. The second is the no effects concentrat~on (C, ). There IS no s~gn~frcant effect on scallop growth at or below this threshold. For bentonite, zero growth was observed at 10 mg I-' and no effects were detected below 2 mg 1 - 9 ~ i ~ u r e 33). The effects thresholds had to be estrmated for bar~te, as laboratory experiments observed zero growth at the lowest concentration tested (0.5 mg I-'). Other biological effects ~ndlces indicated that growth would occur at barite concentrations below 0.5 mg I*' (Cranford et al. 1999), and this value was used as the zero growth concentrat~on. The no effects concentration for barite was estimated at 0.1 mg K' by assuming the ratio C1/Co was the same as observed for bentonite. The thresholds are substantially lower for barite than for bentonite, indicat~ng ~ t s greater effect on scarlop growtn. Observed sublethal effects from both wastes resulted from the negative influence of f~ne inorganic particles on scallop feeding processes, but chemrcal toxrcity may also be a factor w~th barite. Suspended WBM cuttings (30-60 pm d~ameter) did not affect feed~ng behav~our and growth (Frgure 33) and are not included in model simulat~ons.
The effects on scallops of the drilling waste concentrations predicted by bblt are estimated for each model application by calculating the number of potential growth days lost over the exposure time. Waste concentrations predicted by bblt were assumed to be half barite and half bentonite. Although the drilling waste scenario indicates some change in the proportion of each component with time, this change was not large and the use of a variable proportion of waste constituents would require separate bblt runs for each component and hence a doubling of computational demand. Growth reduction factors (between O and 1) were calculated for each component at 30 min. time steps assuming a linear relationship between waste concentration and growth as observed by Cranford el a/. (1999). These indices were subsequently

added together and integrated over the entire exposure period. The percentage of total growth lost over the exposure period was also calculated.
These calculations assume that there are no decomposition processes operating that would change toxicity with time and thereby alter individual effects threshold values. The physical effects of both bentonite and barite should not change with time. However, microbial activity may alter the chemical speciation of trace metal impurities in barite to more bioavailable and toxic forms.
Review Process During this program, the Georges Bank Steering Committee was created to provide advice on the general direction of the research and to serve as a means of informally communicating the results to clients. In addition to DFO, membership included Natural Resources Canada, Environment Canada, the National Energy Board, the Canada-Nova Scotian Offshore Petroleum Board, provincial agencies and representatives of the fishing and hydrocarbon industries. Progress of this modelling project was reported twice a year. In addition, special review sessions were held on several occasions at critical stages of the project.
Summary of bblt Applications Run on Georges Bank Using the drilling waste release scenario described above, local bblt has been used to run twenty-two applications on Georges Bank, each at two effective settling velocities (0.1 and 0.5 cm s-'j. The applications are summarised in Table 14 (forced by observed currents) and Table 15 (forced by currents predicted by 3-0 model). They were run at nine different locations (Figure 32). The results of the water column plume dispersion modelling (Andrade and Loder 1997) were used to estimate the fraction of waste released at 10 m below the sea surface in Sections 3-5 that would reach the seafloor (f in Table 14 and Table 15). One application site is on the top of the Bank (less than 65 m), five are in the frontal zone (65- 100 m) and three are located on the side of the Bank (greater than 100 m). These applications were selected to determine the influence of physical forcing (observed versus modelled currents), springheap tidal cycle, season, effective settling velocity, and geographic location on waste concentrations in the benthic boundary layer.
Table 14. Summary of local bblt applications results from observed currents and the realistic waste discharge scenario for two time periods. Each was run at two effective settling velocities (0.1 and 0.5 cm s7'). f represents the fraction of wastes released at 10 m below the sea surface in the later sections of drilling (3-5j predicted to reach the seafloor.
NEP
GBFSl
73
155
Summer Winter Summer
208 ( 1 .O 8 1 1.0
189 1 0.2
225 200 50

Table 15. Summary of local bblt applications results from currents predicted by 3-D model using the realistic waste discharge scenario for summer and winter seasons. Each was run at two effective settling velocities (0.1 and 0.5 cm s"). f represents the fraction of wastes released at 10 m below the sea surface in the later sections of drilling (3-5) predicted to reach the seafloor.
0 Observed Currents + Model Currents
Figure 32 (reprinted). Location of physical oceanographic zones and bblf appi~cation sites on Georges Bank.

Results
Drilling waste concentrations The bblt model provides predictions of drilling waste concentrations in the benthic boundary layer as a function of space and time around the release point. Standard model output is time series of bulk properties, snapshots of the horizontal distribution of near-bottom concentrations at regular time intervals, and time series of near-bottom concentrations at specific locations. For these applications, drilling waste concentrations were averaged for the bottom 10 cm of the water column.
The drilling waste concentrations predicted in these applications are presented by Loder et a/. (1 998). The main findings are summarised as follows: 0 The spatial patterns and near-bottom concentrations predicted by observed and modelled currents are
remarkably similar in most cases. This demonstrates the oceanic realism of the 3-D circulation model that has been used to force bblt for those sites at which suitable current meter data are not available. However, additional model applications using bulk discharges (Loder et a/. 1998) indicate significant differences in some cases (e.g. NEP site in winter) which appear to reflect limitations of both the 3-0 model and observational current data. The predicted near-bottom concentrations are very sensitive to the effective settling velocities of driliing wastes. Those at the higher velocity (0.5 cm s-') are about an order of magnitude greater than those at the lower velocity (0.1 cm s"). In general, predicted near-bottom concentrations decrease rapidly over distances of 2-10 km from the release point. In some applications, substantial waste concentrations are carried as far as 20-50 km from the release point at the higher settling velocity. These more distant concentrations must be interpreted with caution because the assumptions in local bblt (i.e. uniform physical environment over the entire model domain) break down with increasing distance from the release point.
* The predicted near-bottom concentrations are very dependent upon geographic location. The highest concentrations occur on the side of the Bank (water depth greater than 100 m). Due to higher bottom stress and stronger dispersion, predicted near-bottom concentrations are much lower on the top of the Bank (less than 65 m). Near-bottom concentrations are also lower in the frontal area (65-100 m) due to higher bottom stress, stronger dispersion and stronger drift. This is illustrated according to oceanographic zone in Table 12 that summarises near-bottom waste concentrations at the high settling velocity (0.5 cm s+') at a distance of 20 km along the primary drift line. Both the observed and model current applications indicate that the predicted mean drift of the near- bottom drilling waste plume is generally along depth contours except over the Bank's side where more variability in drift direction is found. This pattern is consistent with the residual circulation. Results at Growler indicate that drift from the side of the Bank up into the frontal zone is possible under some conditions. Applications forced by the 3-D model at GBFSl and GBFS2 indicate that waste concentrations in winter are lower than in summer. The reduced winter concentrations at the GBFS2 site (also expected for other frontal sites) reflect the increased boundary thickness associate with reduced stratification and increased vertical mixing in winter. The reduced winter concentrations at the GBFSl site are associated with stronger model tidal currents in winter, the reliability of which is unclear. On the other hand, waste concentrations at NEP, where bblt was forced by observed currents, were higher in winter than summer. Near-bottom waste concentrations can be higher by up to a factor of two for neap tides because of reduced height of bottom-trapped sediment (i.e. in the benthic boundary layer) and reduced dispersion in the water column.
The scale of the drift and dispersion of the near-bottom waste plume is illustrated by the snapshots at different time intervals at three locations: GBFSl (Figure 35) and Growler (Figure 36) on the side of the Bank and NEP (Figure 37) in the frontal zone.

Table 12 (reprinted). Average number of hours that the near-bottom waste concentrat~ons exceeded I rng i.' at a distance of 20 krn from the release point along the primary drift line at the nine geograph~c locat~ons grouped by oceanographic zone. Multiple values indicate different cases with observational or 3-D model forc~ng. Htgh settl~ng velocity only (0.5 crn s I ) . F~rst 62 days of t
I -20 h i m e (day) - L i m e (day) -...
I 192.0 I 195:1 , , ,
I -20 birne (day) - '6irne (day) 4 '%me (day) -
1201.1 , , , 1 j204,O I I , 207.0 ,
-20 k i m e (day) 4 birne (day) -j Kzel (day) - 1 209,9 , , I I / ! 2 1 3 , ~ I I I I I I
-20-10 O 10 20 30 -20 -10 0 10 20 30 -20 -10 0 10 20 30 krn km krn
Figure 35. Snapshots of near-bottom waste concentrat~ons (logro mg i') at GBFSI. First 62 Gays of the discharge scenario. effectwe settling velocity of 0.5 cm 5'. and obsewed summer currents starling at day 189.

I I I
1 Tine (day) 5 . 2
-
1
I
-10 - F-
I I
1 -20 , L
I I ' I I / I I
30 i I I 1 1 I I t l I
Time (day) 20 - ,9.4
10 7 I E 0 -
x i -10 .-
I -20 t- I
I I ! I 1
Figure 36. Snapshots of near-bottom waste concentrat~ons floglo mg r l ) at Growler. F~rst 62 days of the discharge scenario, effectwe settlrng velocity of 0.5 cm s-', and 3-0 model summer currents.
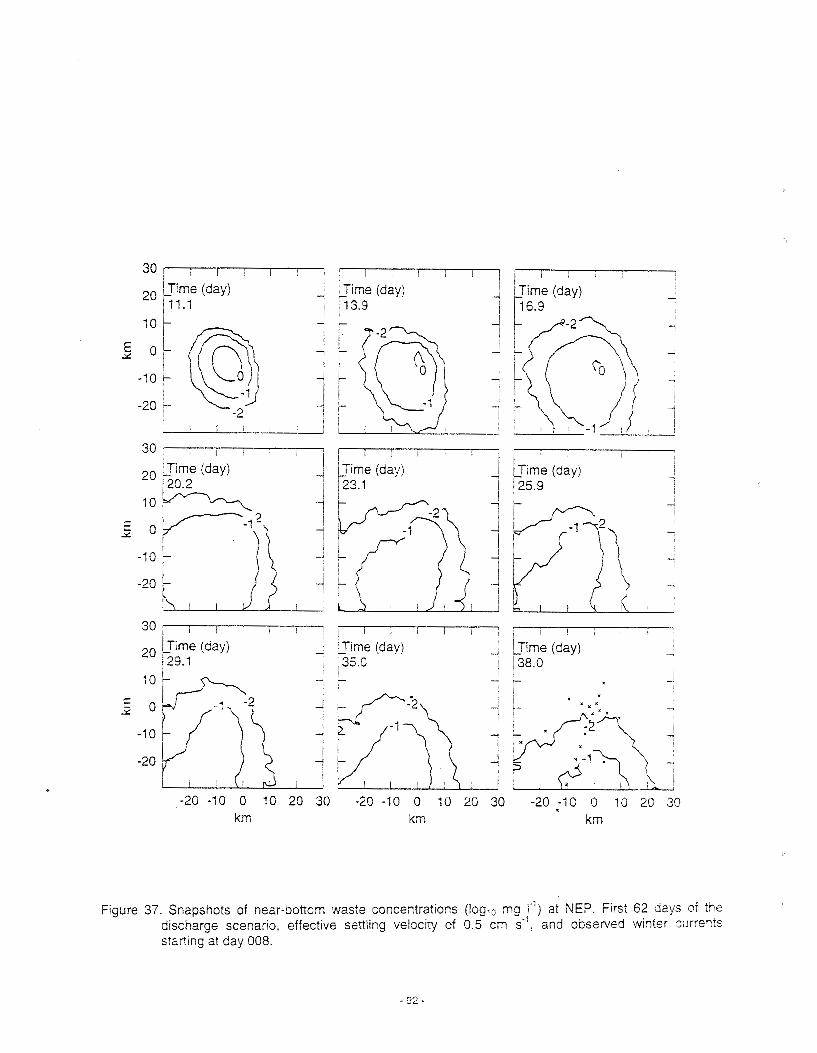
p ime (day) -
-20 -10 0 10 20 30 -20-10 0 10 28 30 -20 -10 0 10 20 30 krn km km
Figure 37. Snapshots of near-bottom waste concentrations (logio mg I-') at NEP. First 62 days of the d~scharge scenano, effectwe settling veloclty of 0.5 cm s-', and obseried winter currents start~ng at day 008.
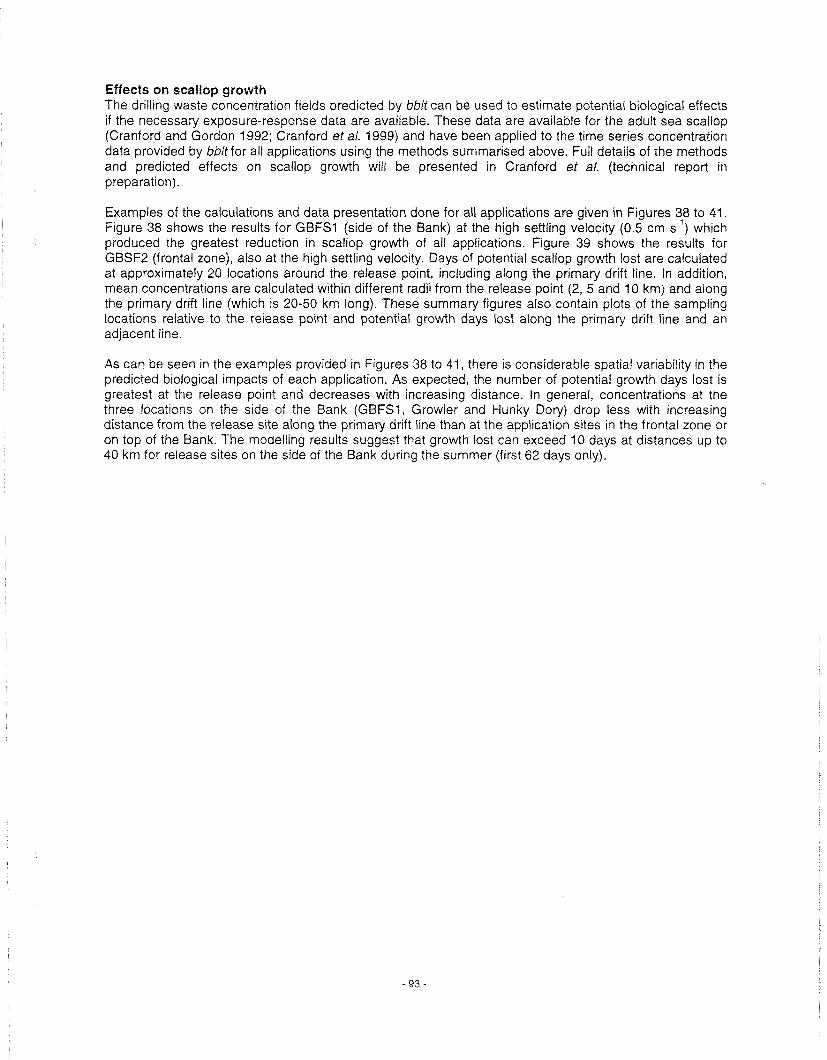
Effects on scallop growth The drilling waste concentration fields predicted by bbit can be used to estimate potential biological effects if the necessary exposure-response data are available. These data are available for the adult sea scallop (Cranford and Gordon 1992; Cranford et al. 1999) and have been applied to the time series concentration data provided by bbitfor all applications using the methods summarised above. Full details of the methods and predicted effects on scallop growth will be presented in Cranford et a/. (technical report in preparation).
Examples of the calculations and data presentation done for all applications are given in Figures 38 to 41. Figure 38 shows the results for GBFSl (side of the Bank) at the high settling velocity (0.5 cm s-') which produced the greatest reduction in scallop growth of all applications. Figure 39 shows the results for GBSF2 (frontal zone), also at the high settling velocity. Days of potential scallop growth lost are calculated at approximately 20 locations around the release point, including along the primary drift line. In addition, mean concentrations are calculated within different radii from the release point (2, 5 and 10 km) and along the primary drift line (which is 20-50 km long). These summary figures also contain plots of the sampling locations relative to the release point and potential growth days lost along the primary drift line and an adjacent line.
As can be seen in the examples provided in Figures 38 to 41, there is considerable spatial variability in the predicted biological impacts of each application. As expected, the number of potential growth days lost is greatest at the release point and decreases with increasing distance. In general, concentrations at the three locations on the side of the Bank (GBFSI, Growler and Hunky Dory) drop less with increasing distance from the release site along the primary drift line than at the application sites in the frontal zone or on top of the Bank. The modelling results suggest that growth lost can exceed 10 days at distances up to 40 km for release sites on the side of the Bank during the summer (f~rst 62 days only).

Growth Growth aistance LOSS Days
S ~ t e x itn y ~ r n 'km) (%) Lost
0 00 0 00 0 00 48 13 29 84 * -1 00 1 73 2.00 34 65 27 48 3 - f 73 -1 00 2 0 0 20 15 12 50 S~imoiinc iacailensj 4 1 00 -1 73 200 1432 8.88 30 5 1 73 1 00 2.00 27 34 16 95 5 -2 50 4 33 5 00 32 32 20 04 -
-4 33 -2 50 5 00 8 63 5 35 20 -
3 *
2 50 -4 33 5 C0 0 99 0 61 e 3 4 33 2 50 5 0 0 1845 1 1 4 4
'0 -5 00 8 86 10 50 27 34 1695 - '0 - * e - 4 -8 56 -5 00 '0 30 0 00 0 00 5
5 00 0 00 0 0 0 >- 0 . "2 -8 66 '0 20 0
12 8 66 5 0 0 1000 7 18 4 45 9 .+*-ec---t--e * * 14 -10C0 1732 2000 1284 7 96 * 15 1732 1000 2030 1555 9 54 (L
1 6 5 C0 0 30 5 SO 8 90 5 52 - . - 10 00 0 20 '0 00 0 91 0 57
t a zc 00 0 OG 20 00 4 24 2 53 ,, '9 30 C0 0 30 30 30 a 24 5 31 i a 'C 3 ' 0 :C 3c
20 0 0 0 1050 ' 030 2615 16 22 A GT
2' 0 00 20 50 20 30 L.ZQ 2 3 ~ e a n 'or CRR axis ~ i a t i o f ~ 20 22 12 54 mear for 10 km r a a i ~ s 18 42 11 42
5 km r a d i ~ s 2278 1 4 ' 2 2 xrn radr~s 2892 1793
Acjacecr line - SO de~rees
-10 9 1 a 20 20 O~srance from source 'km) Dfstancs *om source (km)
Figure 38. Summary data and plots of potential scallop growth days lost at GBFSI. First 62 days of the discharge scenarro, effective settling velocity of 0.5 cm s-I, and observed summer currents startrng at day 189.

Growth Growth distance Loss Days
Stte x krn Y km (0'0) Lost
1 2 3 4 .i * 6 7 8 9
10 1 : 12 13 14 15 16 17 18 19 20 21
mean for dnft axis stations mean for 10 krn radius
5 k n :adlUS 2 krn raarus
Pl-rmarj Drift Line - 140 decrees 1
0 v' -10 '0 30 50
D~staoce fmm source (krn)
Adjacent line - 120 degrees 1 ' 0
3 3 - - n > 7
2 8 - - s 2
4 - - - ,- a 2 2 -
5 -'0 10 30 50
Disonce fmm source [km)
Figure 39. Summary data and plots of potentla1 scallop growth days lost at GBFS2. First 62 days of the discharge scenario, effective settl~ng velocity of 0.5 cm s", and obsented summer currents starting at day 189.

First 62 Days
m -
GBFSi - Stan . e 3 !\
20 - / I I ..
M : :aFS4 - Stan 2'- ' I
, UEP - Slln 8 -
I I
Last 50 Days
Figure 40. Potential growth days lost of sea scallops at various distances along the primary drtf! line during the first 62 (left) and last 50 (nght) days of the Georges Bank d~scharge scenario. Resolts are from the local bblt model w~th observed current forcing and an effective settling velocity of 0.5 crn s
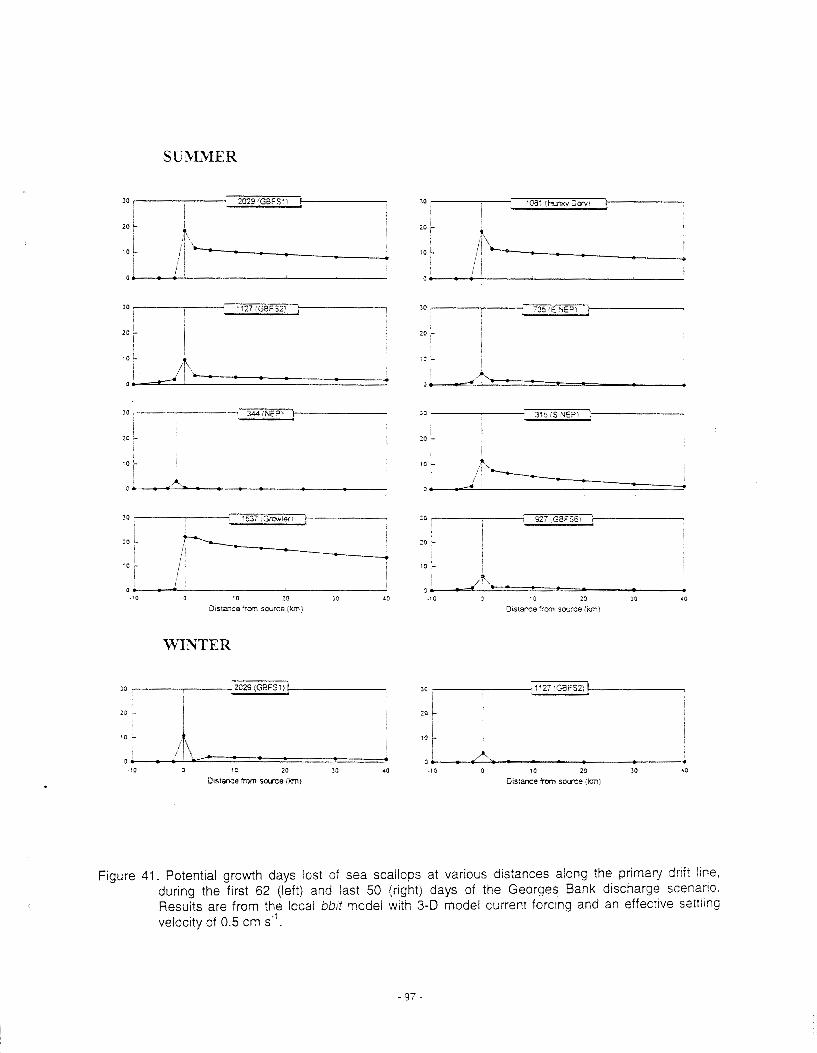
0. : - 0 0 '3 20 30 40
Disrance ' ran source (km'
WIXTER
20 - I I I
20 - I I I ' 0 1 4 1 I I I I
10 - 0. = - - - - - - - : I
10 9 10 20 0, = - : - - 2
30 40 10 3 1 0 20 30 40
D~stance from -e (kn) Distance brn s a n e rb,
F~gure 41. Potential growth days lost cf sea scallops at various d~stances along the pnrnary drift l~ne. durlng the first 62 (left) and last 50 (r~ghtj days of the Georges Bank discharge scenario. Results are from the local bbii model wrth 3-0 model current forc~ng and an effec~rve settlins velocity of 0.5 crn s' .
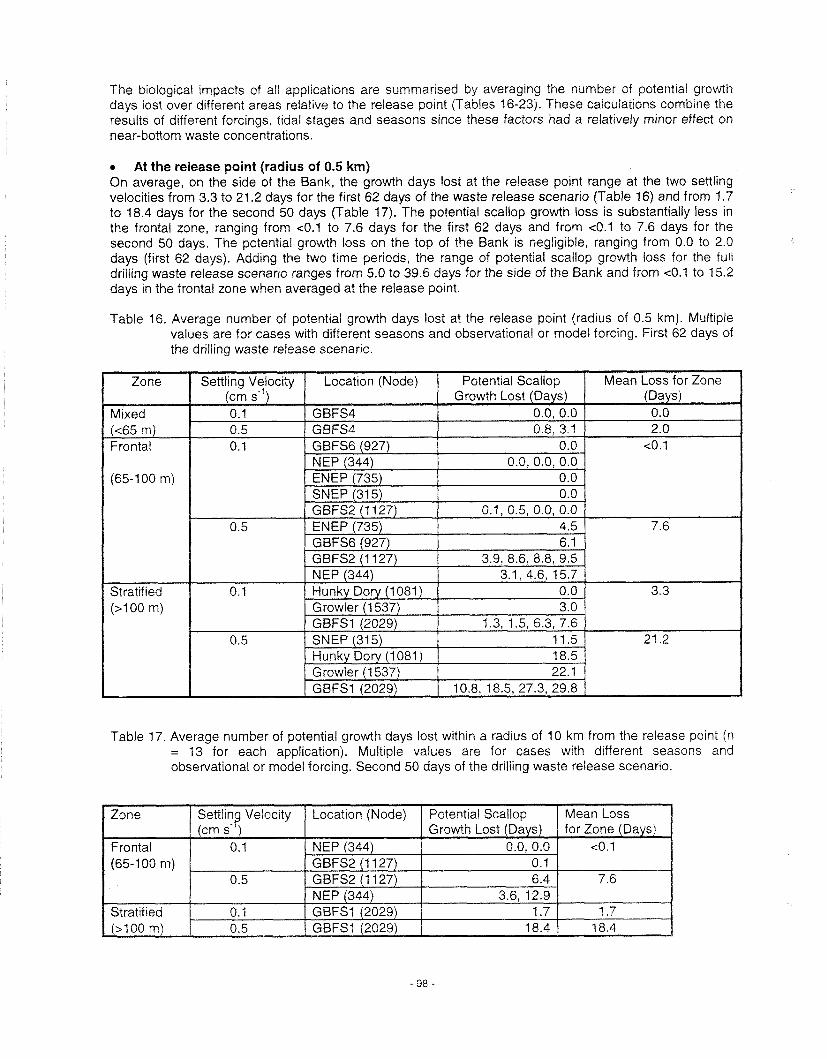
The biological impacts of all applications are summarised by averaging the number of potential growth days lost over different areas relative to the release point (Tables 16-23). These calculations combine the results of different forcings, tidal stages and seasons since these factors had a relatively minor effect on near-bottom waste concentrations.
* At the release point (radius of 0.5 km) On average, on the side of the Bank, the growth days lost at the release point range at the two settling velocities from 3.3 to 21.2 days for the first 62 days of the waste release scenario (Table 16) and from 1.7 to 18.4 days for the second 50 days (Table 17). The potential scallop growth ioss is substantially less in the frontal zone, ranging from c0.1 to 7.6 days for the first 62 days and from ~ 0 . 1 to 7.6 days for the second 50 days. The potential growth ioss on the top of the Bank is negligible, ranging from 0.0 to 2.0 days (first 62 days). Adding the two time periods, the range of potential scallop growth loss for the full drilling waste release scenario ranges from 5.0 to 39.6 days for the side of the Bank and from c0.1 to 15.2 days in the frontal zone when averaged at the release point.
Table 16. Average number of potential growth days lost at the release point (radius of 0.5 km). Multipie values are for cases with different seasons and observational or model forcing. First 62 days of the drilling waste release scenario.
Table 17. Average number of potential growth days lost within a radius of 10 km from the release point (n = 13 for each application). Multiple values are for cases with different seasons and observational or model forcing. Second 50 days of the drilling waste release scenario.

* Radius of 2 krn from release point Potential growth loss is less when averaged over a radius of 2 km from the release point (n = 5). On average, on the side of the Bank, it ranges at the two settling velocities from 1.5 to 10.4 days for the first 62 days (Table 18) and from 1.0 to 8.5 days for the second 50 days (Table 19). Again, the potential scallop growth loss is substantially less in the frontal zone, ranging from ~ 0 . 1 to 2.9 days for the first 62 days and from 40.1 to 2.9 days for the second 50 days. The potential growth loss on the top of the Bank is negligible, ranging from 0.0 to 0.7 days (first 62 days only). Adding the two time periods, the range of potential scallop growth loss for the full drilling waste release scenario ranges from 2.5 to 18.9 days for the side of the Bank and from <0.1 to 5.8 days in the frontal zone when averaged over a radius of 2 km from the reiease point.
Table 18. Average number of potential growth days lost within a radius of 2 km from the release point (n = 5 for each application). Multiple values are for cases with different seasons and observational or model forcing. First 62 days of the drilling waste release scenario.
Table 19. Average number of potentrat growth days lost w~thin a rad~us of 2 km from the release point (n = 5 for each applrcation). Mult~ple values are for cases wrth drfferent seasons and observational or model forcing. Second 50 days of the drllllng waste release scenario.
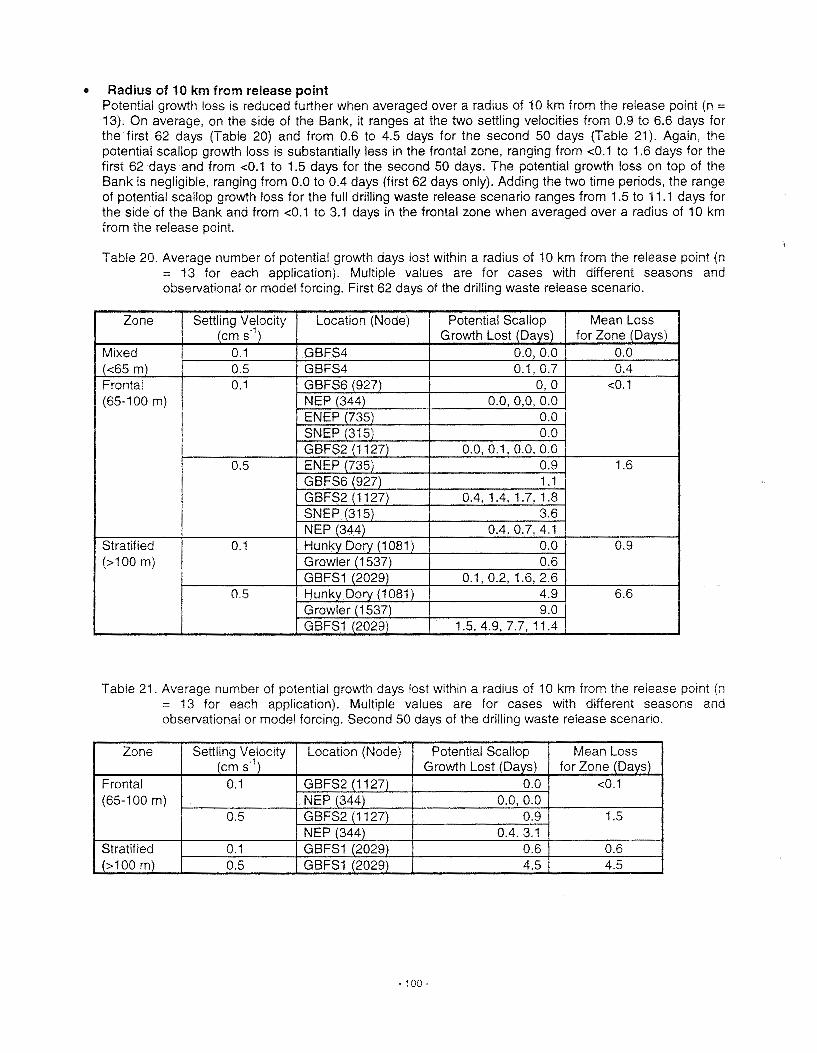
* Radius of 10 km from release point Potentla1 growth loss is reduced further when averaged over a radius of 10 km from the release point (n = 13). On average, on the side of the Bank, it ranges at the two settling velocities from 0.9 to 6.6 days for the first 62 days (Table 20) and from 0.6 to 4.5 days for the second 50 days (Table 21). Again, the potential scallop growth loss is substantially less in the frontal zone, ranging from <0.1 to 1.6 days for the first 62 days and from ~ 0 . 1 to 1.5 days for the second 50 days. The potential growth loss on top of the Bank is negligible, ranging from 0.0 to 0.4 days (first 62 days only). Adding the two time periods, the range of potential scallop growth loss for the full drilling waste release scenario ranges from 1.5 to 11.1 days for the side of the Bank and from <0.1 to 3.1 days in the frontal zone when averaged over a radius of 10 km from the release point.
Table 20. Average number of potential growth days lost within a radius of 10 km from the release point jn = 13 for each application). Multiple values are for cases with different seasons and obsewational or model forcing. First 62 days of the drilling waste release scenario.
Table 21. Average number of potential growth days lost within a radius of 10 km from the release point (n = 13 for each application). Multiple values are for cases with different seasons and observational or model forcing. Second 50 days of the drilling waste release scenario.

Along the primary drift line The potential scallop growth loss is somewhat higher when averaged along the primary drift line. On average, on the side of the Bank, it ranges at the two settling velocities from 1.0 to 10.9 days for the first 62 days (Table 22) and from 0.7 to 5.1 days for the second 50 days (Table 23). Again, the potential scallop growth loss is substantially less in the frontal zone, ranging from <0.1 to 2.1 days for the first 62 days and from c0.1 to 2.0 days for the second 50 days. The potential growth loss on top of the Bank is negligible, ranging from 0.0 to 0.4 days (first 62 days only). Adding the two time periods, the range of potential scallop growth loss for the full drilling waste release scenario ranges from 1.7 to 16.0 days for the side of the Bank and from ~ 0 . 1 to 4.1 days in the frontal zone when concentrations are averaged along the primary drift line.
Table 22. Average number of potential growth days lost along the primary drift path (20-50 long). Multiple values are for cases with different seasons and observational or model forcing. First 62 days of the drilling waste release scenario.
Table 23. Average number of potential growth days lost along the primary drift path (20-50 long). Multiple values are for cases with different seasons and observational or model forcing. Second 50 days of the drilling waste release scenario.

Mortality Prolonged exposure, on the order of a month, to high concentratrons of bentonite and barite can cause mortality to scallops (Cranford and Gordon 1992; Cranford et a/. 1999). However, analysis of the number of hours that concentrations exceed 10 mg 1-I at various distances along the primary drift line indicates that the waste concentrations predicted in these applications are not likely to cause scallop mortality, even at the release point.
lnterpretation of Results The interpretation of the results from these bblt applications on Georges Bank depends upon severai factors which include the location of the release site, the distribution of scaliop stocks and the time of year at which the wastes are released.
The location of the nine application sites in relation to the scallop populations on Georges Bank IS shown in Figure 34. The distribution of scallops is patchy and varies somewhat from year to year. In general, the greatest densities of scallops are found in the frontal zone. The application sites with the greatest scallop densities are GBFS2 (frontal zone), GBFSG (frontal zone) and ENEP (frontal zone). The sites with the fewest scallops are GBFSl (stratified), GBFS4 (mixed), and NEP (frontal zone). The Growler (stratified), Hunky Dory (stratified) and SNEP (frontal) sites have moderate scallop populations. Maximum densities of juvenile scallops are recorded in the northern area of the frontal zone near GBFS2 and GBFSG (Thouzeau et al. 1991). Release points that are closest to high scallop densities will tend to have a greater chance for impacts, but the impacts will also depend on waste concentrations and net drift direction.
Interpretation of the predicted growth impacts at the population level requires knowledge of growth trends and the life history of sea scallops on Georges Bank. The growth rate of scallops depends on seasonal cycles of food availability, water temperature and gametogenesis (development of gametes for spawning). Scallops on Georges Bank display a semi-annual reproductive cycle, with spawning occurring in May-June and September-October. The autumn spawn is larger then the spring spawn and, while only mature gametes are released during the spring, the scallops are reproductively spent after the fall spawn. Gametogenesis is immediately reinitiated after spawning in the fall. Somatic weight tends to decrease during gametogenesis as accumulated energy reserves are utilised to support gonad growth, but increases outside the reproductive period and when food is abundant. Sea scallops appear to invest mainly surplus energy into the production of gametes such that reproductive effort (fecundity) increases only when conditions are favourable. As a result of this conservative strategy of controlled growth and opportunistic reproduction, interannual variations in environmental conditions greatly aiter the timing (semi-annual or annual) and nature (synchronised or protracted) of spawning events on Georges Bank (DiBacco et a/. 1995).
Nutrient stress during gametogenesis, resulting from the presence of dr~lling wastes In the diet, can result in reduced gonad growth rates (Cranford and Gordon 1992) that results in the production of fewer gametes and/or smaller ova having a reduced energy content. More severe nutrient or chemical stress resulting from barrle exposure can result In the resorption of gametes (Cranford ef a/. 1999). Consider~ng that gametogenes~s is near continuous on Georges Bank, exposure to drilling wastes would have some impact on fecundity and egg viability regardless of the time of drilling. However, the sprlng and summer are of greatest concern as the majorrty of annual gonad productton occurs between March and August The loss of 10 consecutive days of growth during thls perlod could reduce fecundity by 5 to 10%. Because of the large variability In natural mortalities of early l~fe stages, it IS unlikely that a 10% reductron In fecundity would be detectable In future stocks unless it occurred over a very large area in a region of abundant scallop stocks. Cons~der~ng the naturally erratic nature of spring spawning, any Impacts on reproductive growth between March and June could limit spawning to the fall. Presently, little 1s known of the relat~ve rmportance of spring and fall spawns to future year class strength.
Any reductions In somatic tissue growth caused by dr~ll~ng muds could also affect reproduct~ve success as the accumulation of carbohydrate and l ~ p ~ d energy reserves rn the muscle and digestive gland IS belreved essent~al for the initlation of gametogenes~s and the later maturat~on of gonad (Robinson e l a/ 1981) Although much of the observed growth loss resulting from bentonite and barlte exposure was due tci retarded gonad development, both wastes were shown to be capable of reduc~ng sornat~c t~ssue growth

(Cranford and Gordon 1992; Cranford et a/. 1999). However, it is likely that drilling wastes would have more effect on the scallop fishery through changes in fecundity (an impact not apparent in the fishery until reduced recruitment in future years) than on muscle size.
The viability of eggs in adults exposed to drilling wastes may be of greater concern than impacts on fecundity as the potential consequences to larval survival could have a large impact on future year class strength. It is unlikely, however, that the scallops would release non-viable eggs, but would resorb and utilise the high nutritive content of some gametes to allow others to reach the critical size for spawning (DiBacco et a/. 1995). Scallop populations from regions characterised by nutritive stress were observed to produce viable gametes even though reproductive effort was low (MacDonald and Thompson 1986).
Large spatial differences in the reproductive condition and growth of scaHop stocks have been observed on Georges Bank (DiBacco et a/. 1997; Thouzeau et a/. 1991). Scallops are distributed primarily in water depths less than 85 m owing to reduced food availability in deeper waters. The lower condition of scallops in deeper waters along the edge of the bank may increase their susceptibility to the lethal and sublethal effects of drilling wastes owing to increased nutritive stress. Any additional stress on populations experiencing marginal food supplies can reduce energy reserves to a point where successful spawning is prevented.
The potential impacts of the near-bottom drilling waste concentrations predicted by the bblt applications are summarised as follows according to physical oceanographic zone on Georges Bank.
Mixed Zone (<65 m) Due to high energy levels, predicted near-bottom waste concentrations at GBFS4 are very low and the potential growth loss is less than one day, even at the high settling velocity. This zone does not have many scallops, presumably due to unfavourable habitat (i.e. active bedforms). Even if scallops were present, it is highly unlikely that the drilling waste release scenario used in these applications would have any measurable effects on scallop growth in th~s zone because of rapid dispersion.
Frontal Zone (65-100 m) The near-bottom waste concentratrons predicted by bblt for the complete waste release scenario would reduce potential scallop growth in the frontal zone on the order of <O.1 to 15.2 days depending on settling velocity and the area over which data are averaged. With the exception of NEP, all sites in this zone are In or near high scallop densit~es and therefore the potential of drilling wastes to come into contact w~th scallop stocks is high. However, it is not likely that the predicted growth loss could be detected in scallop populations, except perhaps at the release point where waste concentrations are highest.
Stratified Zone (>I00 m) The three application sites on the s~de of the Bank have the highest drilling waste concentrations and potential scallop growth losses. Average growth days lost range between 1.5 and 39.6 for the full waste release scenario depending on settling velocity and the area over which data are averaged. The GBFSI site is In an area of low scallop abundance and the net drift of the near-bottom discharge plume is predicted to be northeast, generally away from the scallop beds. Therefore, even though the waste concentrations are predicted to be high, the model results suggest that discharge at this location IS
unlikely to have a measurable effect on scallops. On the other hand, both Growler and Hunky Dory are located in areas of moderate scallop density. The net drift at Growler is predicted to be to the south up on the Bank toward the scallop beds while that at Hunky Dory is predicted to be to the north towards h~gher scallop densities.
As stated above, the results of laboratory experiments suggest that gonadal growth would be affected more than somatic tissue growth so that the net effect might be reproductive loss which could affect the strength of future year classes.

Confidence in Results There is a moderate to high degree of confidence in reliability of bblfs representation of the important physical processes that control sediment dispersion and transportation. Fundamental assumptions and structure have been widely reviewed. Model output appears to be reasonable and consistent wrth empirical observations. Laboratory experiments indicate that drilling wastes flocculate rapidly in seawater and therefore have high effective settling velocities. Observations at the CoPan production site on Sable Island Bank (34 m) indicate that drilling waste flocs are bottom-trapped and can be seen as far as 8 km from the release site (Muschenheim and Milligan 1996). The expected range of settling velocities was estimated using measured drilling waste concentration profiles around the CoPan site, but it appears that these did not fully resolve the dense mats seen in video images. Thus, higher effective settling velocities and hence near-bottom concentrations are possible but considered unlikely to occur under the tidally- energetic conditions on George Bank. If they were to occur on the Bank, near-bottom concentrations and scallop growth loss could be increased by several fold above the present model predictions.
The present applications use the local version of bblt in which the physical conditions are uniform over the entire model domain which can be on the order of 50 km. Physical conditions on Georges Bank can change markedly over distances of just a few kilometres. Therefore, confidence in model output drops with increasing distance from the release polnt. Initial evaluation using the spatiatly-varying version of bblt indicates that local bblf will tend to underestimate dispersion and hence overestimate waste concentrations on the side of the bank where the highest concentrations are predicted, but that in generat the additional influences of spatial variability can result in reduced or increased concentrations depending on the site. But this effect is generally small compared to those from geographic location and settling velocity. Small scale variat~ons rn bottom topography can create local dispersive or depositional niches where the actual waste concentrations will differ from those calculated by bblt.
Observation data sets for forcing bblt on Georges Bank are limited. Therefore, many of the applications had to be forced using the 3-0 finite element model. Where comparisons were made, there was excellent agreement between the results of the two forcings with the exception of winter at NEP where observed currents from 14 m above bottom were used.
The models do not include all of the physical processes that influence the resuspension and vertical mixing of fine sediments in the benthic boundary layer. This means that the concentrations predicted in these applications are probably slightly higher than would occur in the natural env~ronment. On the other hand, there may be transient local near-bottom convergence zones (e.g. sand waves) not represented tn the present flow fields.
The results are very dependent on settling velocity. Therefore a range of effective settling veloc~tres was used (0.1-0.5 cm s") wh~ch are thought to bracket those expected to occur in the natural environment. However, uncertainties in the vertical distribution of drilling mud in different oceanographic env~ronments remain, and higher effective settling velocities (and hence greater near-bottom waste concentrations), while not considered likely, can not be ruled out. Model applications for settling velocities above 0.5 cm s-" indicate very strong sensitivity. The size of drilling mud flocs is very dependent on turbulence levels (Milligan and Hill 1998). Floc break-up under tidally induced shear could reduce settling velocity by an order of magnitude (Milligan and Hill 1998).
The drilling waste release scenario, while hypothetical, is considered to be realistic. It was developed wrth the assistance of Texaco and reviewed by the Georges Bank Steering Committee. The amounts of waste released are similar to those reported for the exploration wells drilled on the U.S. portion of George Bank in the early 1980's (Neff ef a/. 1987).
The biological effects are estimated using the results of extensive laboratory experiments conducted wrth adult scallops. The zero growth threshold for barite had to be estimated but should be reasonable. However, there is some uncertainty whether flocculation, whrch was limrted ~n the laboratory experiments, influences the toxicity of drilling wastes. Cons~derrng that the larger WBM cuttings had a much lower impact on scarlops than bentonite and barite, natural aggregation processes may rnit~gate the effects of flne part~culate wastes on scallop feeding behaviour. This is suggested by observat~ons that sea scallops

exposed to aggregated bentonite in the laboratory did not reduce feeding rate ((White 1997) as was observed for scaliops feeding on disaggregated bentonite (Cranford and Gordon 1992). However, field observations of sea scallops feeding on flocculated suspensions (Cranford et a/. 1998) showed that natural flocs are fragile and are easily disrupted by the animal's feeding processes. Once disaggregated, the scallop would be exposed to a similar size spectrum of particles as was presented in the laboratory experiments, and similar results are anticipated.
The biological effects predicted in these applications apply only to adult scallops (4-5 years old). The sensitivity of early life-stages of scallops to WBM is currently being studied as part of a project funded by the Georges Bank Review Panel. Contaminated sediments might interfere with the settlement of larvae on the seabed.
e Possible Effects on Other Species The near-bottom waste concentrations predicted by bblt can be used to explore the potential effects on other benthic species if exposure-response data were available. Prime candidates would be filter-feeding molluscs (primarily surf clams and ocean quahogs) that dominate the benthic megafauna on Georges Bank (Thouzeau et al. 1991), herring (eggs), lobster and groundfish. Data on the effects of WBM on haddock and lobster larvae will be available soon as part of the Georges Bank Review Panel-funded study.
Possible Effects of Cuttings These bblt applications consider only the fate and effects of discharged WBM. The drilling waste discharge scenario also includes the release of 2569 t of cuttings that could cause scallop mortality at the release site through burial.

bblt is a valuable quantitative tool for investigating the drift and dispersion of particulate drilling wastes in the benthic boundary layer of continental shelf environments. Model output can be used to estimate potential biological effects where exposure-response data are available. The availability of an extensive database on the effects of drilling wastes on scallops allows the results of bblt simulations to be used to evaluate their potential effects on scailop populations.
o Near-bottom waste concentrations predicted by bblt are very sensitive to the settling velocity of drilling wastes. This is difficult to determine with certainty because of flocculation processes, the changing dynamics of the benthic boundary layer, and sampling difficulties.
Biological effects of a single exploration well utilising WBM under current regulations depend very much upon location on Georges Bank.
The greatest potential effects of near-bottom drilling waste concentrations are at the application sites on the side of the Bank (>A00 m). The predicted effect would be a loss of 1.5 to 39.6 growth days depending upon settling velocity and the area over which data are averaged. Generally speaking, this zone has low to moderate scallop densities but high scallop densities are nearby and could be influenced by the waste plume as it drifts away from the reiease point. Under some conditions, it appears possible to see effects at the population level. This is expected lo be seen more as a loss of reproductive potential rather than reduced somatic tissue (i.e. muscle) or a reduction in egg viability. Potential effects at the application sites in the frontal zone are lower. The predicted effect would be a loss of <0.1 to 15.2 growth days depending upon settling velocity and the area over which data are averaged. This zone contains the highest concentrations of scallops but it is unlikely that the predicted growth losses could be detected at the population level, except perhaps at or close to the release point. Potential effects on top of the Bank appear to be negligible.
Potential effects on scallop growth could be mitigated by modifying (or eliminating) the discharge of WBM, reducing the amount of mud discharged at the seafloor, reducing the amount of barite used in the drill~ng mud, and by drilling during the November-February period when scallop growth is low.
The bblt models, coupled with biological effects data. provide a valuable quantitative pred~ctive tool for environmental assessment studies, designing environmental effects monitoring programs and exploring the effectiveness of different mitigation options.