an air quality emission inventory of offshore operations for the exploration and production of...
TRANSCRIPT

Atmospheric Environment 37 (2003) 3713–3729
An air quality emission inventory of offshore operations for
the exploration and production of petroleum by the Mexican
oil industry
R. Villasenora,*, M. Magdalenoa, A. Quintanara, J.C. Gallardoa, M.T. L !opeza,R. Juradoa, A. Mirandaa, M. Aguilara, L.A. Melgarejoa, E. Palmer!ına,
C.J. Vallejoa, W.R. Barchetb
a Instituto Mexicano del Petr !oleo, Eje C. L !azaro C. No. 152, Delegaci !on Gustavo A. Madero, 07730 M!exico, DF, MexicobBattelle, Pacific Northwest Division, Richland, WA, USA
Received 4 April 2002; accepted 5 March 2003
Abstract
An air quality screening study was performed to assess the impacts of emissions from the offshore operations of the
oil and gas exploration and production by Mexican industry in the Campeche Sound, which includes the states of
Tabasco and Campeche in southeast Mexico. The major goal of this study was the compilation of an emission inventory
(EI) for elevated, boom and ground level flares, processes, internal combustion engines and fugitive emissions. This
inventory is so far the most comprehensive emission register that has ever been developed for the Mexican petroleum
industry in this area. The EI considered 174 offshore platforms, the compression station at Atasta, and the Maritime
Ports at Dos Bocas and Cayo Arcas. The offshore facilities identified as potential emitters in the area were the
following: (1) trans-shipment stations, (2) a maritime floating port terminal, (3) drilling platforms, (4) crude oil
recovering platforms, (5) crude oil production platforms, (6) linking platforms, (7) water injection platforms, (8)
pumping platforms, (9) shelter platforms, (10) telecommunication platforms, (11) crude oil measurement platforms, and
(12) flaring platforms. Crude oil storage tanks, helicopters and marine ship tankers were also considered to have an EI
accurate enough for air quality regulations and mesoscale modeling of atmospheric pollutants. Historical ambient data
measure at two onshore petroleum facilities were analyzed to measure air quality impacts on nearby inhabited coastal
areas, and a source–receptor relationship for flares at the Ixtoc marine complex was performed to investigate health-
based standards for offshore workers. A preliminary air quality model simulation was performed to observe the
transport and dispersion patterns of SO2, which is the main pollutant emitted from the offshore platforms. The
meteorological wind and temperature fields were generated with CALMET, a diagnostic meteorological model that
used surface observations and upper air soundings from a 4-day field campaign conducted in February of 1999. The
CALMET meteorological output and the generated EI drove the transport and dispersion model, CALPUFF. Model
results were compared with SO2 measurements taken from the monitoring network at Dos Bocas.
r 2003 Elsevier Ltd. All rights reserved.
Keywords: Emission inventory; Emission factors; Marine platforms; Gulf of Mexico; Air quality modeling
1. Introduction
The Campeche Sound in the southwest portion of the
Gulf of Mexico (GOM), off the coast of the states of
Tabasco and Campeche in Mexico, represents an
ARTICLE IN PRESS
AE International – Central & South America
*Corresponding author. Av. Platanales 252-5 Col. Nueva
Santa Maria, 02800 Mexico, DF, Mexico. Tel.: +52-5333-6909.
E-mail address: [email protected] (R. Villasenor).
1352-2310/03/$ - see front matter r 2003 Elsevier Ltd. All rights reserved.
doi:10.1016/S1352-2310(03)00445-X

important region of expanding economic development
for Mexico. This region is an oceanographically complex
and dynamic system characterized by its benthic shelf
production (Soto and Escobar-Briones, 1995). Besides
the fishery resources that it encompasses, it is a
strategically crucial area for the Mexican oil industry,
since approximately 80% of the national fossil fuel
production is derived from offshore wells. The two
major industries, shrimp fisheries and petroleum pro-
duction, have coexisted since 1976, when major oil
extraction operations began. There is a growing concern
by local and federal authorities that the increased
demand for fossil fuels in urban areas will intensify oil
and gas production activities in this potentially sensitive
area. These prospects may put at risk oceanic biological
diversity and the local ecosystems, which include coastal
lagoons and estuaries. The prospect of increased off-
shore petroleum production activity will surely provoke
many future debates at both national and local levels.
Therefore, identifying some of the direct impacts of
oil industry operations, and predicting non-desirable
effects for various sources is mandatory if enviro-
nmental equilibrium among the ecosystems is to be
maintained in the marine region (MR) of Tabasco and
Campeche.
Ciudad del Carmen, the largest urban center in the
area, is located along the strand arm of the Laguna de
Terminos where the lagoon connects to the GOM and is
adjacent to the offshore marine platform area. Two
important onshore petroleum facilities are the gas
recompression station in Atasta, Campeche, and the
Dos Bocas Marine Terminal located near Paraiso,
Tabasco. The principal function of the Atasta facility,
about 25 km east of Ciudad del Carmen, is gas
recompression between the offshore platforms and four
inland gas-processing centers. Dos Bocas, located
approximately 100 km east of Ciudad del Carmen, is
the primary storage and treatment facility for crude oil
from the offshore area.
Among the most important emission sources from the
oil industry are flares, discharges to water, cuttings from
drilling activities and crude oil spills. An integrated
study to characterize each of these sources in the
Campeche Sound and the risk that these exert over the
marine environment along with toxicology studies is
definitely needed. Such a task demands a considerable
amount of time as well as human and financial
resources, and it is therefore outside the scope of this
work. Nonetheless, the impacts of atmospheric emis-
sions of current petroleum operations in the region can
be assessed through a screening study using, for
instance, records of flaring operations taken by the
personnel at the gas and oil production sites, and by
analyzing available meteorological and air quality data
measured at stations located near anthropogenic
sources.
Of the four aforementioned sources discussed above,
flares release approximately 82% of all pollutants
discharged into ambient air by the oil industry in this
region. Chemical analysis of the flue gas emitted into the
air by flares indicates that unburned hydrocarbons
(HC), nitrogen oxides (NOx), sulfur dioxide (SO2),
carbon monoxide (CO), hydrogen sulfide (H2S), and
particulate matter (PM) are the major constituents.
According to a recent report on air pollutant emissions,
SO2 is the second largest pollutant emitted after
hydrocarbons (PEMEX, 2001). The high relative hu-
midity and the presence of chlorides from sea spray in
the Campeche region together with industrial SO2
emissions can promote corrosion and soil acidification.
The screening study looks at emissions (SO2 and NO2)
that can contribute to wet and dry deposition of
chemicals that promote corrosion (SO42� and NO3
�) of
common construction and agricultural materials in
Tabasco and Campeche as a means of accounting for
atmospheric impacts of the Mexican oil industry in the
region.
Climatic data analysis of southeast Mexico (Magana-
Rueda et al., 1999) indicates three major scenarios, each
involving a different mix of sources and occurring at
different times of the year under different meteorological
conditions. For the first period that runs from Novem-
ber to end of January, strong synoptic northerly winds
enhanced atmospheric dispersion of pollutants leaving
the Campeche Sound in compliance with ambient air
quality standards. During the dry period at the end of
winter sooty flames from elevated flares at offshore
facilities are significant sources, and their impact
continues until the beginning of June. High solar
radiation and moderate to weak gradient winds mark
the dry period between February and June. In the
summer and fall, periodic thunderstorms and rainstorms
maintain the area relatively clean of gaseous pollutants
while wet and dry deposition exacerbates acidification of
the region. From July through November moist weather
conditions give rise to fogs, clouds, and rainstorms.
Determining whether potential effects from the oil
and gas industry exist or not that merit further study is
important for assessing the expected impacts of devel-
oping new offshore fields in deeper water that will
exploit deeper petroleum reserves. As a first step towards
the completion of this goal an estimate of ambient
primary pollutants emissions was obtained with the
application of emission factors reported in the literature.
Thus, the major goal of this screening study was to
provide an emission inventory (EI) accurate enough for
both air quality policy makers and mesoscale modeling
of atmospheric pollutants. The EI is the most compre-
hensive characterization of pollutant emissions ever
attempted for the Campeche Sound. Another facet of
this study addressed the question of whether SO2 and
NO2 emissions met air quality standards or not. Finally,
ARTICLE IN PRESS
R. Villasenor et al. / Atmospheric Environment 37 (2003) 3713–37293714
air quality modeling work was performed to observe
degradation of ambient air downwind of the potential
emission sources in the Bay of Campeche. Available
concurrent meteorological and air quality data were
used for conducting the atmospheric simulations. A
scenario in February 1999 was chosen to simulate the
transport and dispersion of precursors of acid deposi-
tion during the dry season since this is the time of the
year when the plumes from offshore facilities are more
prone to impinge upon the coastal communities during
the diurnal cycle.
2. Approach
The project was divided into several tasks conducted
in the following sequence. The first and major activity of
this investigation was centered on the development of an
EI for the oil and gas facilities of the Mexican Petroleum
Industry in the Campeche Sound. The verification of
whether air quality standards for SO2 and NO2
concentrations measured at Atasta and Dos Bocas were
exceeded, and if so, how often and by how much was the
second task. The selection of an episode for air quality
modeling along with a regional meteorological simula-
tion of the selected episode using a prognostic model for
which surface and upper air soundings were available
became next as the third task. This step was of utmost
importance for delimiting the size of the dispersion
modeling domain if the loss of pollutant mass at the
edges of the computational grid boundary were to be
avoided when applying the EPA transport/dispersion
modeling system, CALMET/CALPUFF. The chosen
event was decided upon air quality data becoming
available that, conjointly with historic meteorological
data, allowed us to study dispersion patterns of plumes
from flaring operations in the bay of Campeche during
the dry season. The last task focused on performing an
analysis of the source–receptor relationship for flares at
the Ixtoc marine complex to investigate health-based
standards for offshore workers.
An EI for exploration and production by Mexican oil
company was not available at the time this work began.
The EI of hydrocarbon-combustion processes in the
Campeche sound was long required to assess the impact
of atmospheric emissions on ambient air, and for
decision making on future expansion of offshore
petroleum production. In this work an EI was generated
using published emission factors and other sources of
information supplied by the oil company. Combustion
sources were first allocated with the aid of geographic
maps, and then classified by fuel-type emission and
characteristics of the combustion system including fuel
composition. Emission fluxes were estimated with
published emission factors in conjunction with process
charts, flow diagrams, layouts of pipelines, fittings and
valves, and reported flow rates fed to flares, tanks,
separators and other various types of industrial equip-
ment. The compilation of the EI included mass fluxes of
flares, pits, and stationary sources such as compressors,
pumps and diesel generators. Incorporated in the EI are
the emission sources of the offshore fields, the recom-
pression station of Atasta and the crude-oil treatment
terminal at Dos Bocas and the Cayo Arcas port.
Historical ambient measurements in the vicinity of
Atasta and Dos Bocas for the period 1999–2000 were
reviewed to measure the quality of the air in the coastal
region of Campeche. The databases were provided by
the Air Quality Division personnel of the Mexican oil
company at Atasta and Dos Bocas. Time series of SO2
and NOx were analyzed to detect exceedances of these
primary pollutants, and to determine if any violations to
the national air quality standards were being made.
Concurrent meteorological and air quality data were
only available in February 1999. Air quality modeling
work was performed to simulate transport and disper-
sion of precursors of acid deposition in the Bay of
Campeche for this month, which happened to take place
during the dry season. The air quality model chosen for
this task was the EPA approved CALMET/CALPUFF
modeling system (Scire et al., 1997, 2000).
Upper air soundings were available from a 4-day field
study carried out by IMP researchers in the state of
Tabasco during early February in 1999. Two of the
platform complexes continually collected hourly surface
meteorological data during the entire year. The oversea
database supplied by the Mexican oil company along
with the measurements made at the Dos Bocas maritime
terminal were used to produce the surface file for the
diagnostic meteorological code. Wind observations
treated with an objective analysis procedure yielded
the three-dimensional wind and temperature field output
needed by the diagnostic meteorological model CAL-
MET. CALPUFF was then used to predict concentra-
tions and depositions fluxes of SO2. Model simulations
were compared to air quality data reported from the
monitoring site at the Dos Bocas network for SO2 and
NO2. Meteorological and air quality measurements were
unavailable during February 1999 for Atasta.
The size of the computational domain is an important
key element for accurately predicting mass concentra-
tions of pollutants by CALPUFF. CALPUFF has been
traditionally used in US Environmental Protection
Agency’s (EPA) regulatory applications, where environ-
mental impacts due to routine industrial releases or wild
fires are modeled. The errors associated with the loss of
pollutant mass at the edges of the computational grid
boundary were recently evaluated for CALPUFF
considering different modeling domain sizes (Venegas
et al., 2002). The average percent error was found
to increase with additional volume sources and as
the computational domain size approached a
ARTICLE IN PRESS
R. Villasenor et al. / Atmospheric Environment 37 (2003) 3713–3729 3715

100 km� 60 km grid mesh. To avoid pollutant mass loss
at the edges of the computational grid boundary due to
the significantly large number of emission sources that
were simulated the domain has to be sized without
compromising computational efficiency. To do that the
Regional Atmospheric Modeling System, RAMS (Pielke
et al., 1992) was run to study the mesoscale flow patterns
in the region. This approach allowed us to decide on the
appropriate size of the CALMET/CALPUFF domain
that will secure a maximum source-to-grid boundary
distance thus reducing mass loss at the edges of the
domain.
The RAMS model incorporated global NCEP data
with four-dimensional data assimilation of surface and
upper air wind observations made from 2 to 5 February
1999. To predict the local wind circulation near the
shoreline RAMS was supplied with sea surface tem-
perature (SST) on a 1� � 1� grid for February 1999 from
a climatic data set obtained from NOAA. To identify
average meteorological scenarios for February, the
National Center for Environmental Prediction (NCEP)
reanalysis database for sea level pressure and wind field
data was downloaded from the Climate Diagnostics
Center run by National Oceanic Atmospheric Admin-
istration (NOAA). The meteorological fields are global
and have a horizontal resolution of 2.5� � 2.5�.
The outer domain of the RAMS prognostic model
covered most of Mexico, Central America, and the
GOM with a horizontal spatial resolution of
30 km� 30 km. The finer nested domain extended
336 km to the east, and 345 km to the north encom-
passing the Campeche Sound, and portions of the states
of Tabasco and Campeche. The coarse-to-fine grid mesh
ratio required that horizontal cells of 5 km� 5 km be
used for the finer inner grid in RAMS. The CALMET
domain was made equivalent to the RAMS inner
domain. Wind patterns for the inner domain predicted
by RAMS served as a benchmark for the wind fields
calculated by CALMET for the same simulated episode.
The vertical resolution of the cells in the fine and coarse
grids that RAMS used varied from 100m close to the
ground to 1000m above a height of 3 km. Topography
of the area of interest was downloaded from the NOAA
web-site (www.ngdc.noaa.gov) and land use data were
obtained from the geographic facility at IMP. RAMS
used a 2.5� � 2.5� spatial resolution, which is obviously
too coarse for the domain of study but adequate to
characterize the prevailing synoptic conditions.
The first component of the meteorological/transport
dispersion system, CALMET used surface and upper air
meteorological data to predict winds and turbulence
parameters in each grid of the modeling domain for each
ARTICLE IN PRESS
Fig. 1. Southeast portion of the GOM showing the physical domain used for the air quality screening study.
R. Villasenor et al. / Atmospheric Environment 37 (2003) 3713–37293716

hour of a modeling period. Three surface meteorological
stations were used for this work; the onshore station at
Dos Bocas (18.585�N, 93.170�W), the offshore stations
of Eco 1 (19.029�N, 92.047�W), and Ixtoc (19.406�N,
92.211�W). The origin of the computational domain was
placed at (17.251�N, 94.250�W). The size of the inner
grid that RAMS used turned out to be appropriate for
the CALMET/CALPUFF simulations since the distance
from the sources to the computational boundary
ensured minimum mass loss, as seen in the contour
maps of predicted concentrations shown in later
sections, thus guaranteeing low error in the computa-
tions. The selected domain in this work is about 19 times
larger than the domain of Venegas et al. (2002).
A 3 km� 3 km horizontal grid cell was chosen for
CALMET, to give adequate model resolution, while
yielding an acceptable execution time. The orthogonal
axes extend to the north (115 nodes) and east (112
nodes) creating a uniform grid system on the 15-UTM
zone projection. The maximum acceptable divergence in
the divergence minimization procedure was taken as
5.0� 10�6 s�1. Sounding data were obtained every 6 h
starting at 06:00 local time from 2 to 5 February 1999.
The last sounding was released at 18:00 local time. The
modeling domain encompassing the coastal oil and gas
facilities and the marine platforms is shown in Fig. 1.
The modeling system was complemented with the EI
produced in this work. The SO2/NOx emissions were
treated as time-invariant point sources. In this work, the
SO2/NOx emissions undergo chemical reaction accord-
ing to the RIVAD (Scire et al., 2000) pseudo-first-order
chemical scheme, which considers their conversion into
SO2�4 and NO�
3 : The RIVAD reduced mechanism treats
only six species (SO2, SO2�4 ; NO, NO2, HNO3, and
NO�
3 ) in the acid formation process. The nighttime
conversion rates for SO2/NOx/HNO3 used in RIVAD
were taken from the CALPUFF database and are as
follows 0.2%/2%/2/%/h. The RIVAD chemical me-
chanism assumes a background concentration for O3 as
a substitute of the OH radical concentration. The O3
background concentration was assumed to be 30 ppb,
while the NH3 concentration was taken to be 1 ppb.
3. Emission inventory
Emission factors specific to the petroleum operations
in the Campeche Sound do not exist. Thus an EI had to
be constructed from international emission factors
reported in the literature for the regulated air pollutants
in Mexico: sulfur oxides, nitrogen oxides, carbon
monoxide, and particulate matter. Other air pollutants
like total hydrocarbons and hydrogen sulfide were
included because of their toxic characteristics.
Offshore operations consist of platforms, oil wells,
repumping/compression stations, pipelines, and trans-
shipment stations (Cayo Arcas and Dos Bocas) where
oil is loaded onto tankers. Fig. 1 shows the actual layout
of wells and pipelines. Also, in Fig. 1 a schematic layout
of the offshore platforms, pipelines, and trans-shipment
stations is depicted. The offshore fields, northeastern
and southwestern fields collectively called MR, produce
two kinds of crude oil, the Maya and Istmo, respec-
tively.
The wells in the northeastern field produce the Maya
crude from wells that are approximately 6 km deep.
Most of the Maya crude oil is pumped to Cayo Arcas
for direct shipment from Cayo Arcas onto Tankers, and
does not reach Dos Bocas. Four platforms comprise the
primary pumping stations for the Maya crude oil. On
the other hand, the wells in the southwestern field, which
are about 4.5 km deep, produce a lighter crude oil. Three
main pumping platforms deliver the Istmo crude oil to a
repumping station, which in turn distributes the crude
oil to four lines that divert the load for nearly 80 km to
Dos Bocas. The heavy Maya crude is very low in
produced water (1%) and gas, whereas the Istmo crude,
produced mainly from the southwestern wells, contains
more produced water (5%) and gas than the Maya
crude. Because produced water contains a number of
components of crude oil in solution as well as heavy
metals, the produced mixture of crude and water is
piped to the Dos Bocas Marine Terminal where water is
separated and treated.
The facilities considered in the EI consider the main
offshore platform complexes at the southwestern and
northeastern petroleum fields including Cantarell, Ek,
Balam, Ixtoc, Ku, Abkatum, Cayo Arcas and Pool, and
the onshore installations of the Atasta Gas Compression
Station and the Marine Terminal of Dos Bocas. To
undertake the task of compiling a brand new EI from
scratch, five types of platforms were characterized:
extraction, production, compression, pumping, and
flaring. Crude oil and gas from the extraction platforms
are pumped through pipelines undersea to the produc-
tion platforms. Other offshore facilities include lodging,
linking, and treatment and services platforms.
The associated gas from wells in the southwestern and
northwestern oil fields is sent out to compression
platforms; thereafter the gas is transported through
gasoducts to the Compression Station in Atasta,
Campeche. The gas undergoes recompression in Atasta
(see Fig. 1) including separation and pumping of con-
densates before being delivered to the four major gas
processing complexes scattered about in the State of
Tabasco and northern Chiapas. Excess gas is burned on
the flaring platforms that are the main sulfur dioxide
emitters in the area.
In addition, the Atasta station recompresses residual
gas coming from the gas-processing center of Ciudad
PEMEX for use on the platforms in the MR. Major
equipment installed at Centro Atasta consists of
ARTICLE IN PRESS
R. Villasenor et al. / Atmospheric Environment 37 (2003) 3713–3729 3717

turbocompressors for sour gas, separation batteries,
residual gas turbocompressors, condensate pumps,
electric power turbogenerators, and a sour water
treatment plant. Natural gas fired turbines provide
power for compressors, pumps and electrical generators
at Atasta. These gas turbines are major sources of NOx
and volatile organic compounds. The separation bat-
teries are major sources of volatile organic compounds
and H2S. Atasta has five elevated flares, of which
four are operational, each consuming on average
14� 103m3/day. One ground flare, 100 by 40m, burns
pig waste along with approximately 28� 103m3/day of
condensate.
The crude oil that is not transferred to the Cayo Arcas
offshore facility for export is pumped in via oleoducts to
the port of Dos Bocas. The Dos Bocas Marine Terminal
is located near Paraiso, Tabasco (see Fig. 1). This facility
is the primary storage and treatment facility for crude oil
from the offshore area. Part of the crude oil in Dos
Bocas is sent to refineries for processing and final
domestic consumption. Water and gas separations are
conducted at this facility, along with storage and mixing
of crude oils from offshore and the inland centers for
trans-shipment to tankers. This facility also comprises
the principal port for exploration, drilling, and produc-
tion activities, including supplying drilling muds to the
platforms and receiving spent muds, sanitary wastes,
and hazardous wastes from the platforms for treatment
and disposal/recycling. Excess gases released during the
separations and dewatering operations are burned at
two active elevated flares. Pumping and compression
stations within the Dos Bocas facility include diesel-
powered compression stations, diesel-powered pumps.
The engines are sources of volatile organic compounds,
SO2, and NOx.
The three types of offshore flaring operations used
either elevated, boom or ground level flares. Each of the
seven major oil and gas producing platform complexes
mentioned above may have one or more elevated flares.
Some vertically pointing flares operate at either high
flow (4.2� 106m3/day) or low flow (9.1–24� 105m3/
day). Several platforms have ‘‘boom’’ flares rated at
2.3� 105m3/day. The designed flows to boom flaring are
generally much higher than the average flows (0.85–
25� 105m3/day). In addition to flares, other air
pollutant sources include diesel-powered pumps, com-
pressors and generators, which contribute to emissions
of volatile organic compounds, NOx and SO2 into the
air at offshore platforms (Hansell and England, 1998).
No data were available on the fuel consumption rates of
these diesel engines. Internal combustion devices on
onshore and offshore facilities run with either natural gas,
diesel or sweetened gas, whereas oil tankers are powered
by diesel and heavy fuel oil. Crude oil storage tanks, and
pollutants emitted from vessels (mainly oil ship tankers)
in the MR of Campeche are considered in the EI.
The tasks that summarize the procedure for generat-
ing the EI are discussed next. The first task in achieving
this major goal was to geographically allocate the
emission sources distributed over the southwestern and
northeastern oil fields. The Universal Traverse Mercator
(UTM) System of coordinates was selected for that
purpose. The use of geographical maps, technical
reports and census of the facilities were valuable aids
to obtaining the UTM coordinates of each emission
source. Geographical maps were the most useful
materials for this job since they provided the location
in UTM coordinates of equipment, plants, devices and
emission sources, and in some cases detailed zooms of
petroleum platforms. A big effort was done to ensure
that every potential air pollution source was inventoried
in order to generate the most thorough EI ever
attempted for the MR. The EI that was undertaken in
this work considered 174 offshore platforms, the
compression station at Atasta, and the Maritime Port
at Dos Bocas.
The second step in preparing the EI had as the main
objective identifying the emission sources and their
pollutants emitted from the allocated facilities in the
previous step. To accomplish this, several sources of
information were consulted among which the most
indispensable were the following: (1) Detailed layout
plans showing an aerial view of the facilities on each
level of the platforms, the main pieces of equipment,
tags, their physical location and some design specifica-
tions as name of the equipment, internal key, and
operating capacities; (2) Process flow diagrams depicting
the main stages of the process, principal equipment,
product streams with chemical composition, mass
balance of processes, flow and physical properties like
density, pressure and temperature; and (3) Piping and
instrumentation diagrams presenting the equipment-
valves, piping and instruments used in the facilities
including some design specifications for pipes (construc-
tion material, diameter, length, transported product),
the main equipment (name, design capacity) and
instruments controlling the process.
The combustion equipment catalog prepared by
personnel that operates the facilities was another source
of information that proved helpful. The entries recorded
in this register included equipment name, location, tag,
brand, model, kind of service, design capacity, type and
consumption of fuel. Technical documents dealing with
quantities of hazardous wastes along with Environmen-
tal Assessment reports were also consulted to obtain
valuable information regarding the design and operating
conditions of air pollution sources. Internet web pages
of the Mexican petroleum industry were also checked for
additional information concerning the location, purpose
and installed capacities of the petroleum facilities in the
MR. The emissions of marine traffic were estimated
from detailed reports of the Port Authority of Ciudad
ARTICLE IN PRESS
R. Villasenor et al. / Atmospheric Environment 37 (2003) 3713–37293718

del Carmen showing the kind of ships, commercial
license, capacity, size, fuel used, trajectories source–
destination, and itinerary. For the quantification of the
emissions from helicopters, reports of the oil company
schedules, trajectories, brand and model of the aircraft
were used.
Once the information was sorted out and classified,
the name and type of the facility were recorded
identifying in each case: (1) trans-shipment stations
(Cayo Arcas and Dos Bocas), (2) maritime floating
port terminal (Ta’kuntah Ship), (3) drilling
(extraction) platforms, (4) crude oil recovering plat-
forms, (5) crude oil production platforms, (6) linking
platforms, (7) water injection platforms, (8) Pumping
platforms, (9) shelter platforms, (10) telecommunication
platforms, (11) crude oil measurement platforms,
and (12) flaring platforms. In the Campeche Sound the
oil fields are denoted as: Cantarell, Ek-Balam-Ixtoc,
Ku-Mallopb-Zaap, Abkatum, Tabasco’s Littoral,
and Pool Chuc. The list of pieces of equipment that
each facility comprises was also incorporated in to the
database.
The compacted database that was finally compiled
consider the entries given next. (1) Name and UTM
location of the facility, (2) name of equipment, (3)
equipment’s tag, (4) brand and model, (5) name of the
unitary operation or process, (6) type of emission (i.e.
fugitive, evaporative, combustion), (7) design capacity of
equipment, (8) type of fuel: diesel, natural gas, and
process-gas, (9) consumption of fuel, and (10) emitted
mass for each of the following air pollutants: SO2, NOx,
CO, H2S, CH4, Total Hydrocarbons, and particulate
matter.
The emission factors for flares, stationary equipment
and internal combustion engines used to calculate the
emissions were obtained from two sources: (1) AP-42:
Compilation of Air Pollutant Emission Factors (USE-
PA, 2001), and (2) Guidelines for Atmospheric Emis-
sions Inventory Methodologies in the Petroleum
Industry (ARPEL, 1998). The Mexico EI program
manuals, volume V: Area Sources Inventory Develop-
ment (WGA & RI, 1997) provided emission factors for
helicopters and marine traffic. Fugitive emission factors
came from the handbook of control techniques for
fugitive VOC emissions in chemical processes facilities
(USEPA, 1993). When estimating fugitive emissions of
each facility, detailed piping and instrumentation dia-
grams and information on number and type of
compressors, pumps, flanges, valves and accessories
were used. Table 1 shows the emission factors for flares,
stationary equipment and internal combustion engines.
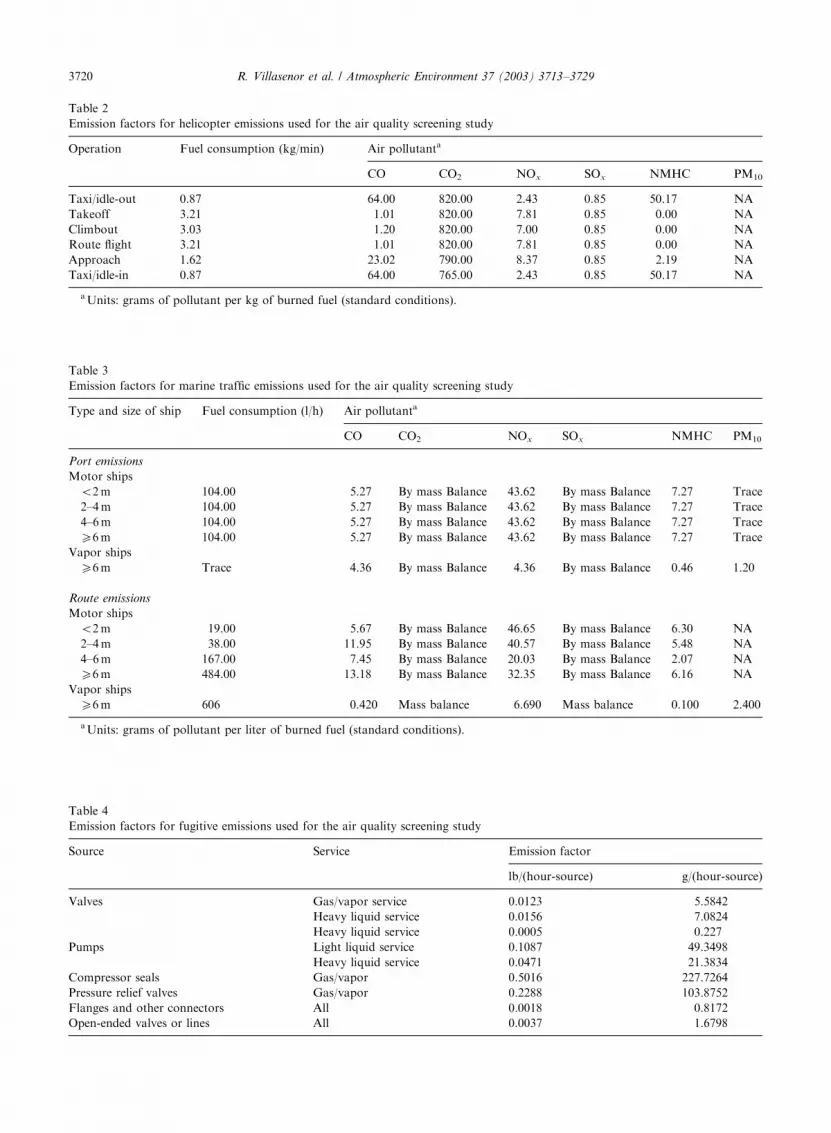
Tables 2–4 list the emission factors for helicopters,
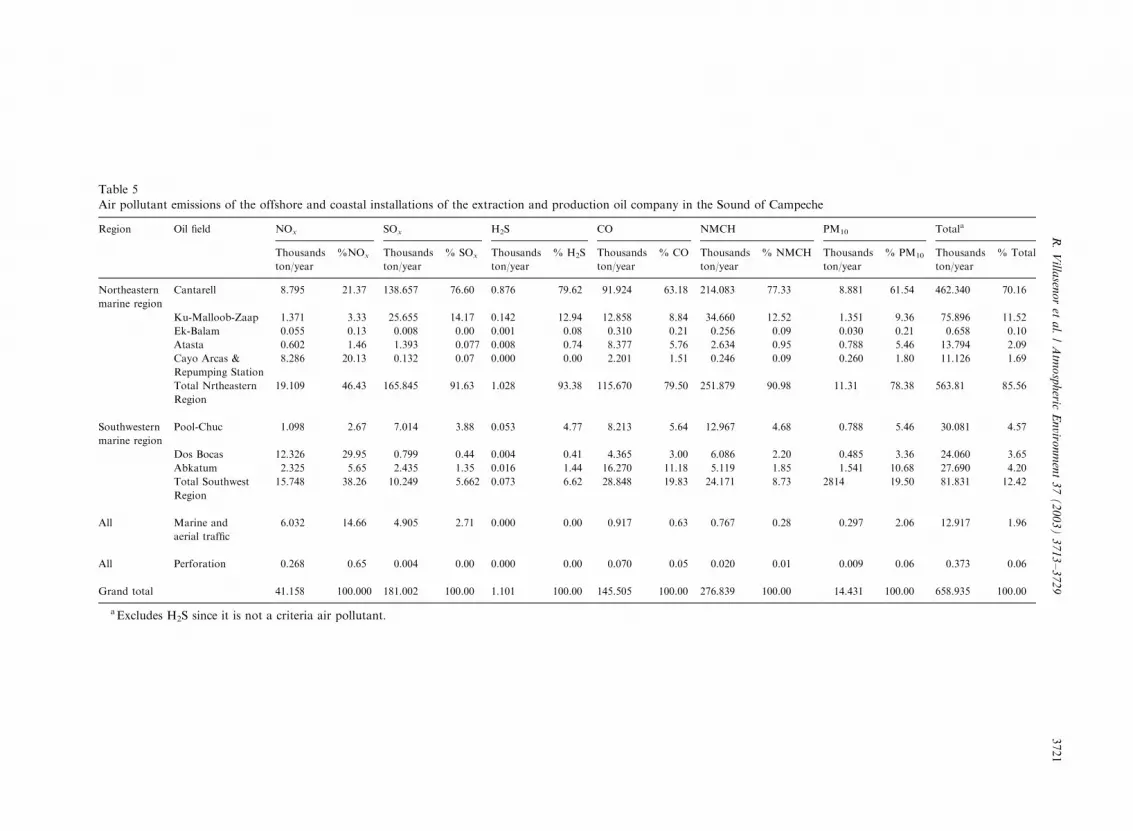
marine traffic and fugitive emissions. Table 5 sum-
marizes total pollutant emissions for each contaminant
in thousands of ton per year inventoried for the two MR
of the Campeche Sound.
ARTICLE IN PRESS
Table1
Emissionfactorsforflares,stationary
equipmentandinternalcombustionengines
usedfortheairquality
screeningstudy
Equipment
Fuel
Airpollutant
CO
CO2
NO
xSO
xH2S
CH4
NMHC
PM
10
Units:gramsofpollutantsper
cubicmeter
ofburned
gas(standard
conditions)
Turbine-operatedpumps,power
generators
andcompressors
Sweetgas
24.50
Bymassbalance
1.70
Bymassbalance
Trace
0.20
2.00
2.30
Processheaterso10.4GJ/h
Sweetgas
24.50
Bymassbalance
1.60
Bymassbalance
Trace
Trace
0.30
2.30
Processheaters
10.4–104GJ/h
Sweetgas
24.50
Bymassbalance
2.20
Bymassbalance
Trace
Trace
0.30
2.30
Processheaters>104GJ/h
Sweetgas
24.50
Bymassbalance
8.80
Bymassbalance
Trace
Trace
0.30
2.30
Internalcombustionengines
Sweetgas
24.50
Bymassbalance
15.00
Bymassbalance
Trace
9.30
115.00
2.30
Flares
Sourgas
21.60
Bymassbalance
1.60
Bymassbalance
0.28
9.90
67.30
2.10
Units:gramsofpollutantsper
literburned
diesel(standard
conditions)
Internalcombustionengines
Diesel
13.97
Bymassbalance
52.57
Bymassbalance
NA
NA
1.48
1.64
Cranes
Diesel
15.61
Bymassbalance
72.76
Bymassbalance
NA
NA
5.92
5.09
R. Villasenor et al. / Atmospheric Environment 37 (2003) 3713–3729 3719
ARTICLE IN PRESS
Table 2
Emission factors for helicopter emissions used for the air quality screening study
Operation Fuel consumption (kg/min) Air pollutanta
CO CO2 NOx SOx NMHC PM10
Taxi/idle-out 0.87 64.00 820.00 2.43 0.85 50.17 NA
Takeoff 3.21 1.01 820.00 7.81 0.85 0.00 NA
Climbout 3.03 1.20 820.00 7.00 0.85 0.00 NA
Route flight 3.21 1.01 820.00 7.81 0.85 0.00 NA
Approach 1.62 23.02 790.00 8.37 0.85 2.19 NA
Taxi/idle-in 0.87 64.00 765.00 2.43 0.85 50.17 NA
aUnits: grams of pollutant per kg of burned fuel (standard conditions).
Table 3
Emission factors for marine traffic emissions used for the air quality screening study
Type and size of ship Fuel consumption (l/h) Air pollutanta
CO CO2 NOx SOx NMHC PM10
Port emissions
Motor ships
o2m 104.00 5.27 By mass Balance 43.62 By mass Balance 7.27 Trace
2–4m 104.00 5.27 By mass Balance 43.62 By mass Balance 7.27 Trace
4–6m 104.00 5.27 By mass Balance 43.62 By mass Balance 7.27 Trace
X6m 104.00 5.27 By mass Balance 43.62 By mass Balance 7.27 Trace
Vapor ships
X6m Trace 4.36 By mass Balance 4.36 By mass Balance 0.46 1.20
Route emissions
Motor ships
o2m 19.00 5.67 By mass Balance 46.65 By mass Balance 6.30 NA
2–4m 38.00 11.95 By mass Balance 40.57 By mass Balance 5.48 NA
4–6m 167.00 7.45 By mass Balance 20.03 By mass Balance 2.07 NA
X6m 484.00 13.18 By mass Balance 32.35 By mass Balance 6.16 NA
Vapor ships
X6m 606 0.420 Mass balance 6.690 Mass balance 0.100 2.400
aUnits: grams of pollutant per liter of burned fuel (standard conditions).
Table 4
Emission factors for fugitive emissions used for the air quality screening study
Source Service Emission factor
lb/(hour-source) g/(hour-source)
Valves Gas/vapor service 0.0123 5.5842
Heavy liquid service 0.0156 7.0824
Heavy liquid service 0.0005 0.227
Pumps Light liquid service 0.1087 49.3498
Heavy liquid service 0.0471 21.3834
Compressor seals Gas/vapor 0.5016 227.7264
Pressure relief valves Gas/vapor 0.2288 103.8752
Flanges and other connectors All 0.0018 0.8172
Open-ended valves or lines All 0.0037 1.6798
R. Villasenor et al. / Atmospheric Environment 37 (2003) 3713–37293720
ARTICLEIN
PRESS
Table 5
Air pollutant emissions of the offshore and coastal installations of the extraction and production oil company in the Sound of Campeche
Region Oil field NOx SOx H2S CO NMCH PM10 Totala
Thousands
ton/year
%NOx Thousands
ton/year
% SOx Thousands
ton/year
% H2S Thousands
ton/year
% CO Thousands
ton/year
% NMCH Thousands
ton/year
% PM10 Thousands
ton/year
% Total
Northeastern
marine region
Cantarell 8.795 21.37 138.657 76.60 0.876 79.62 91.924 63.18 214.083 77.33 8.881 61.54 462.340 70.16
Ku-Malloob-Zaap 1.371 3.33 25.655 14.17 0.142 12.94 12.858 8.84 34.660 12.52 1.351 9.36 75.896 11.52
Ek-Balam 0.055 0.13 0.008 0.00 0.001 0.08 0.310 0.21 0.256 0.09 0.030 0.21 0.658 0.10
Atasta 0.602 1.46 1.393 0.077 0.008 0.74 8.377 5.76 2.634 0.95 0.788 5.46 13.794 2.09
Cayo Arcas &
Repumping Station
8.286 20.13 0.132 0.07 0.000 0.00 2.201 1.51 0.246 0.09 0.260 1.80 11.126 1.69
Total Nrtheastern
Region
19.109 46.43 165.845 91.63 1.028 93.38 115.670 79.50 251.879 90.98 11.31 78.38 563.81 85.56
Southwestern
marine region
Pool-Chuc 1.098 2.67 7.014 3.88 0.053 4.77 8.213 5.64 12.967 4.68 0.788 5.46 30.081 4.57
Dos Bocas 12.326 29.95 0.799 0.44 0.004 0.41 4.365 3.00 6.086 2.20 0.485 3.36 24.060 3.65
Abkatum 2.325 5.65 2.435 1.35 0.016 1.44 16.270 11.18 5.119 1.85 1.541 10.68 27.690 4.20
Total Southwest
Region
15.748 38.26 10.249 5.662 0.073 6.62 28.848 19.83 24.171 8.73 2814 19.50 81.831 12.42
All Marine and
aerial traffic
6.032 14.66 4.905 2.71 0.000 0.00 0.917 0.63 0.767 0.28 0.297 2.06 12.917 1.96
All Perforation 0.268 0.65 0.004 0.00 0.000 0.00 0.070 0.05 0.020 0.01 0.009 0.06 0.373 0.06
Grand total 41.158 100.000 181.002 100.00 1.101 100.00 145.505 100.00 276.839 100.00 14.431 100.00 658.935 100.00
aExcludes H2S since it is not a criteria air pollutant.
R.Villa
senoret
al./Atm
ospheric
Enviro
nment37(2003)3713–3729
3721
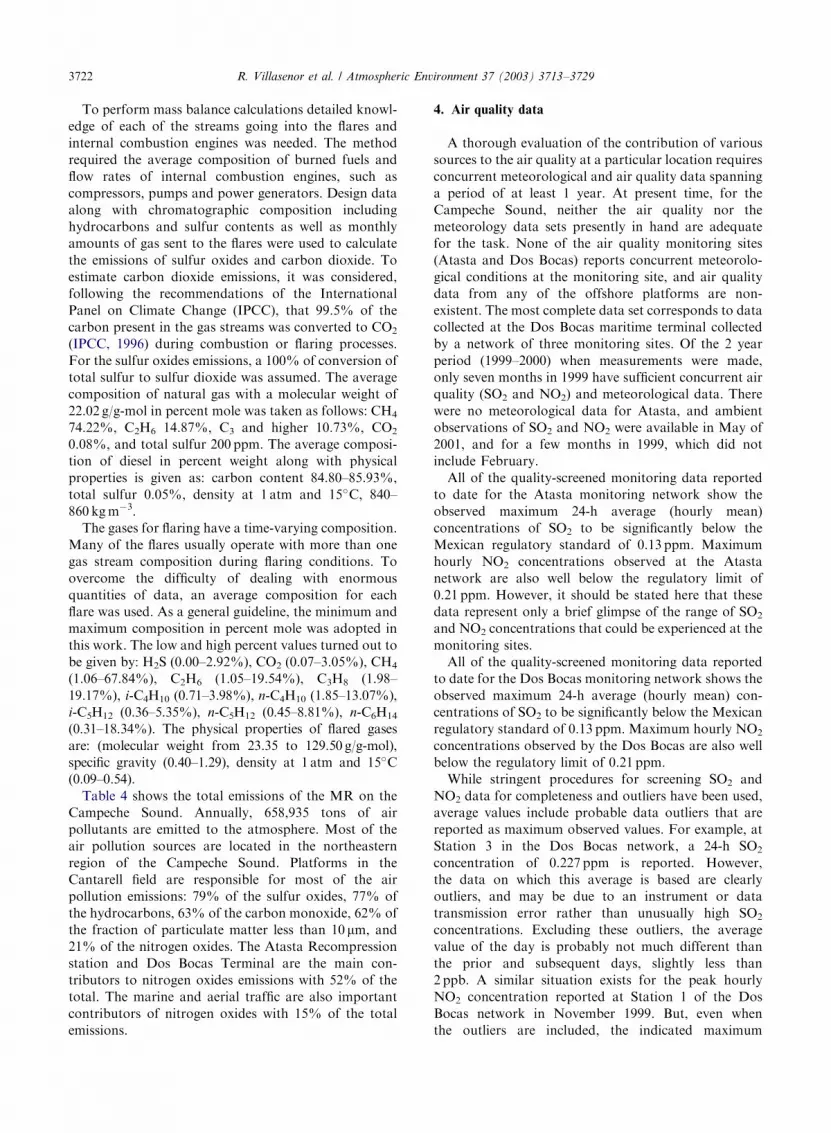
To perform mass balance calculations detailed knowl-
edge of each of the streams going into the flares and
internal combustion engines was needed. The method
required the average composition of burned fuels and
flow rates of internal combustion engines, such as
compressors, pumps and power generators. Design data
along with chromatographic composition including
hydrocarbons and sulfur contents as well as monthly
amounts of gas sent to the flares were used to calculate
the emissions of sulfur oxides and carbon dioxide. To
estimate carbon dioxide emissions, it was considered,
following the recommendations of the International
Panel on Climate Change (IPCC), that 99.5% of the
carbon present in the gas streams was converted to CO2
(IPCC, 1996) during combustion or flaring processes.
For the sulfur oxides emissions, a 100% of conversion of
total sulfur to sulfur dioxide was assumed. The average
composition of natural gas with a molecular weight of
22.02 g/g-mol in percent mole was taken as follows: CH4
74.22%, C2H6 14.87%, C3 and higher 10.73%, CO2
0.08%, and total sulfur 200 ppm. The average composi-
tion of diesel in percent weight along with physical
properties is given as: carbon content 84.80–85.93%,
total sulfur 0.05%, density at 1 atm and 15�C, 840–
860 kgm�3.
The gases for flaring have a time-varying composition.
Many of the flares usually operate with more than one
gas stream composition during flaring conditions. To
overcome the difficulty of dealing with enormous
quantities of data, an average composition for each
flare was used. As a general guideline, the minimum and
maximum composition in percent mole was adopted in
this work. The low and high percent values turned out to
be given by: H2S (0.00–2.92%), CO2 (0.07–3.05%), CH4
(1.06–67.84%), C2H6 (1.05–19.54%), C3H8 (1.98–
19.17%), i-C4H10 (0.71–3.98%), n-C4H10 (1.85–13.07%),
i-C5H12 (0.36–5.35%), n-C5H12 (0.45–8.81%), n-C6H14
(0.31–18.34%). The physical properties of flared gases
are: (molecular weight from 23.35 to 129.50 g/g-mol),
specific gravity (0.40–1.29), density at 1 atm and 15�C
(0.09–0.54).
Table 4 shows the total emissions of the MR on the
Campeche Sound. Annually, 658,935 tons of air
pollutants are emitted to the atmosphere. Most of the
air pollution sources are located in the northeastern
region of the Campeche Sound. Platforms in the
Cantarell field are responsible for most of the air
pollution emissions: 79% of the sulfur oxides, 77% of
the hydrocarbons, 63% of the carbon monoxide, 62% of
the fraction of particulate matter less than 10mm, and
21% of the nitrogen oxides. The Atasta Recompression
station and Dos Bocas Terminal are the main con-
tributors to nitrogen oxides emissions with 52% of the
total. The marine and aerial traffic are also important
contributors of nitrogen oxides with 15% of the total
emissions.
4. Air quality data
A thorough evaluation of the contribution of various
sources to the air quality at a particular location requires
concurrent meteorological and air quality data spanning
a period of at least 1 year. At present time, for the
Campeche Sound, neither the air quality nor the
meteorology data sets presently in hand are adequate
for the task. None of the air quality monitoring sites
(Atasta and Dos Bocas) reports concurrent meteorolo-
gical conditions at the monitoring site, and air quality
data from any of the offshore platforms are non-
existent. The most complete data set corresponds to data
collected at the Dos Bocas maritime terminal collected
by a network of three monitoring sites. Of the 2 year
period (1999–2000) when measurements were made,
only seven months in 1999 have sufficient concurrent air
quality (SO2 and NO2) and meteorological data. There
were no meteorological data for Atasta, and ambient
observations of SO2 and NO2 were available in May of
2001, and for a few months in 1999, which did not
include February.
All of the quality-screened monitoring data reported
to date for the Atasta monitoring network show the
observed maximum 24-h average (hourly mean)
concentrations of SO2 to be significantly below the
Mexican regulatory standard of 0.13 ppm. Maximum
hourly NO2 concentrations observed at the Atasta
network are also well below the regulatory limit of
0.21 ppm. However, it should be stated here that these
data represent only a brief glimpse of the range of SO2
and NO2 concentrations that could be experienced at the
monitoring sites.
All of the quality-screened monitoring data reported
to date for the Dos Bocas monitoring network shows the
observed maximum 24-h average (hourly mean) con-
centrations of SO2 to be significantly below the Mexican
regulatory standard of 0.13 ppm. Maximum hourly NO2
concentrations observed by the Dos Bocas are also well
below the regulatory limit of 0.21 ppm.
While stringent procedures for screening SO2 and
NO2 data for completeness and outliers have been used,
average values include probable data outliers that are
reported as maximum observed values. For example, at
Station 3 in the Dos Bocas network, a 24-h SO2
concentration of 0.227 ppm is reported. However,
the data on which this average is based are clearly
outliers, and may be due to an instrument or data
transmission error rather than unusually high SO2
concentrations. Excluding these outliers, the average
value of the day is probably not much different than
the prior and subsequent days, slightly less than
2 ppb. A similar situation exists for the peak hourly
NO2 concentration reported at Station 1 of the Dos
Bocas network in November 1999. But, even when
the outliers are included, the indicated maximum
ARTICLE IN PRESS
R. Villasenor et al. / Atmospheric Environment 37 (2003) 3713–37293722

concentrations are still well below regulatory limits
for 24-h average SO2 and for hourly NO2 at the
Dos Bocas sites. However, a longer-term monitoring
data set is needed to determine if these outliers
represent transient phenomena emanating from
the Dos Bocas facility, or are instrumental or transcrip-
tion errors.
5. Synoptic meteorological conditions
During the month of February, local winds near the
surface and within the boundary layer are influenced by
large scale wind conditions that are often associated
with winter storms in the GOM (Schultz et al., 1998;
Magana-Rueda et al., 1999). This condition produces
moderate to strong northeasterly winds near the surface
favoring long range transport of pollutants inland and
very efficient dispersion near the sources. February 1999
shows important departures from the long-term Feb-
ruary climatology (not shown). Data extracted from the
NCEP Reanalysis for February 1999 at 850mb geopo-
tential height show a high pressure center over the
GOM that is shifted about 10� towards the east relative
to the climatic high pressure center. As a conseq-
uence, a stronger easterly wind component over the
Campeche Sound is observed (Fig. 2) during the month
of February of 1999.
During the field experiment, departures from the
above-mentioned climatic condition were observed. An
average of days 2 and 3 of February (Fig. 3) shows
easterly winds over much of south central and the
southeastern portions of the country. A deep trough
associated with a frontal zone is noted over the west
part of Mexico at this period of time. This cold front
traveled to the east causing the winds in the Campeche
area change from easterly to southeasterly (not shown)
during days 3 and 4. On 4 and 5 February the cold
front weakened substantially as the high pressure center
that previously remained stationary on days 2 and 3
of February at about 80�W moved 8� to the west.
As a result, wind direction over the Campeche area
shifted to the northeast during the last part of the
campaign.
These results may suggest that if the dispersing plumes
were able to penetrate into the upper air layers
(B1500m) by vertical mixing during midday, the trend
would indicate that from days 2 to 4 of February
pollutants at 850mb will be transported out into the
GOM. Contour maps for the 950-mb geopotential
height and wind field (B600m), the lowest level for
which data were available, were produced in order to
verify if there were notable changes in relation to the
850mb charts. It was found that both maps displayed
very little differences, thus the above scheme on the fate
of pollutants would not be invalidated.
ARTICLE IN PRESS
Fig. 2. February 1999 monthly mean for 850mb geopotential height (m) and wind field.
R. Villasenor et al. / Atmospheric Environment 37 (2003) 3713–3729 3723

6. Model simulations
RAMS and CALMET models were initialized with
the same rawinsonde and meteorological surface data.
Figs. 4–6 show simulated surface wind fields predicted
with the inner grid mesh with RAMS (left panel) and
CALMET (right panel) for 3 February at three local
times (03:00, 12:00, and 20:00 h). Surface concentrations
of SO2 are adjacently displayed to show plume disper-
sion patterns from the MR sources overlay with the
diagnosed CALMET vector field. The start time for the
CALMET/CALPUFF model simulations was 18:00 h
local time on 1 February 1999, while the RAMS
computation initiated at 00:00 h on 1 February 1999.
A direct comparison between these two models has to
be exercised with caution as there is not a one-to-one
correspondence since RAMS spatial resolution slightly
differs from that of CALMET, despite their identical
size domain. Figs. 4 and 6 can rightly be said to be
similar but discrepancies between the RAMS and
CALMET wind fields arise as observed in Fig. 5. The
surface flow structure that RAMS shows at 12:00 h is
not captured by CALMET along the seashore. The
RAMS simulation shows a well-defined line of conver-
gence along the western coast of Tabasco (see Fig. 5 left
panel). A noteworthy feature when examining Figs. 4–6
outside the coastal line reveals an outstanding resem-
blance of predicted surface wind patterns between
RAMS and CALMET simulations, particularly in areas
where there are either clusters of observational stations,
or where the effect of topography is not as abrupt as in
the mountainous region.
The distinct behavior shown by the models is
related to their design. Both RAMS and CALMET
extrapolate sparse wind field and thermodynamic
data within the domain of interest to their computa-
tional grids. While RAMS is a full fledged
atmospheric model that solves for the governing
equations as a boundary and initial value problem,
CALMET works more as an interpolator, albeit,
maintaining near-zero wind divergence, conserving
energy, and allowing for topographic effects. Thus
RAMS recognizes the sea–land temperature contrast
that drives sea–land breeze development, while CAL-
MET can only adjust the wind field to the available
observations, while maintaining the above divergence
and energy conservation conditions.
The transport of SO2 and dispersion trajectories in the
Campeche Sound airshed was investigated with CAL-
PUFF. The CALPUFF model uses the same grid system
as CALMET, consisting of 9 layers over the 112� 115
horizontal grid cells. The vertical layers were specified
with variable spacing heights of 20, 80, 160, 300, 600,
1000, 1500, 2000, and 2130m to ensure that the mixed
ARTICLE IN PRESS
Fig. 3. Days 2 and 3 of February 1999 for 850mb geopotential height (m) and wind field.
R. Villasenor et al. / Atmospheric Environment 37 (2003) 3713–37293724

layer height and the entrainment layer were well below
the domain top. To increase computational efficiency
the emission sources were grouped according to their
elevation referred to sea level, taking into account the
plume rise effect since all point sources had stack
emission temperatures higher than ambient temperature.
It was possible to estimate plume rise considering certain
average parameters for stacks such as wind speed, stack
height, stack exit velocity, gas temperature and stack
diameter. The plume-rise Briggs formulas were applied
for plumes dominated by buoyancy forces resulting in
plume rise values ranging from 10 to 70m for stable,
neutral and unstable atmospheres (Seinfeld and Pandis,
1998). This means that the effective stack height for the
emissions sources injected into the upper air layers lie
within 50–110m, and therefore the model layers that
received flare emissions were the second and third from
the bottom up.
ARTICLE IN PRESS
Fig. 4. Left panel: RAMS surface wind simulations. Right panel CALMET surface wind simulations and surface SO2 concentration
predicted with CALPUFF for 3 February 1999 at 03:00LST.
Fig. 5. Left panel: RAMS surface wind simulations. Right panel CALMET surface wind simulations and surface SO2 concentration
predicted with CALPUFF for 3 February 1999 at 12:00LST.
R. Villasenor et al. / Atmospheric Environment 37 (2003) 3713–3729 3725
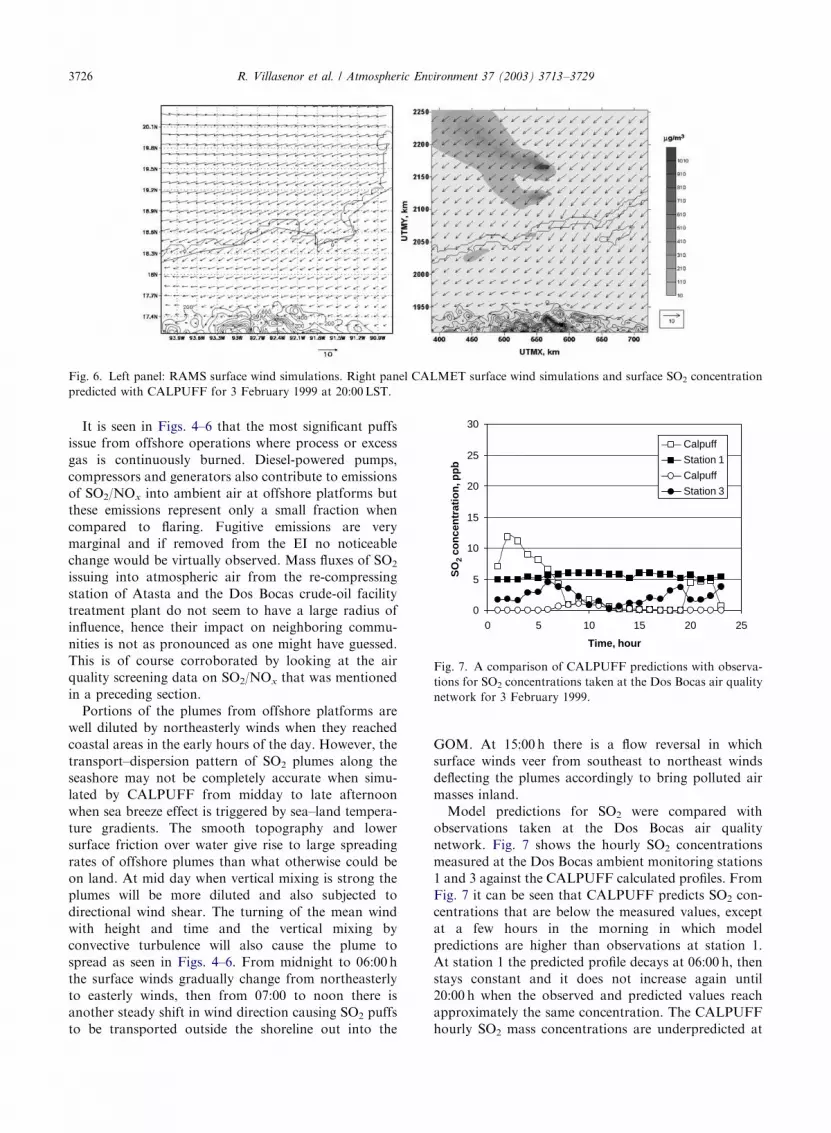
It is seen in Figs. 4–6 that the most significant puffs
issue from offshore operations where process or excess
gas is continuously burned. Diesel-powered pumps,
compressors and generators also contribute to emissions
of SO2/NOx into ambient air at offshore platforms but
these emissions represent only a small fraction when
compared to flaring. Fugitive emissions are very
marginal and if removed from the EI no noticeable
change would be virtually observed. Mass fluxes of SO2
issuing into atmospheric air from the re-compressing
station of Atasta and the Dos Bocas crude-oil facility
treatment plant do not seem to have a large radius of
influence, hence their impact on neighboring commu-
nities is not as pronounced as one might have guessed.
This is of course corroborated by looking at the air
quality screening data on SO2/NOx that was mentioned
in a preceding section.
Portions of the plumes from offshore platforms are
well diluted by northeasterly winds when they reached
coastal areas in the early hours of the day. However, the
transport–dispersion pattern of SO2 plumes along the
seashore may not be completely accurate when simu-
lated by CALPUFF from midday to late afternoon
when sea breeze effect is triggered by sea–land tempera-
ture gradients. The smooth topography and lower
surface friction over water give rise to large spreading
rates of offshore plumes than what otherwise could be
on land. At mid day when vertical mixing is strong the
plumes will be more diluted and also subjected to
directional wind shear. The turning of the mean wind
with height and time and the vertical mixing by
convective turbulence will also cause the plume to
spread as seen in Figs. 4–6. From midnight to 06:00 h
the surface winds gradually change from northeasterly
to easterly winds, then from 07:00 to noon there is
another steady shift in wind direction causing SO2 puffs
to be transported outside the shoreline out into the
GOM. At 15:00 h there is a flow reversal in which
surface winds veer from southeast to northeast winds
deflecting the plumes accordingly to bring polluted air
masses inland.
Model predictions for SO2 were compared with
observations taken at the Dos Bocas air quality
network. Fig. 7 shows the hourly SO2 concentrations
measured at the Dos Bocas ambient monitoring stations
1 and 3 against the CALPUFF calculated profiles. From
Fig. 7 it can be seen that CALPUFF predicts SO2 con-
centrations that are below the measured values, except
at a few hours in the morning in which model
predictions are higher than observations at station 1.
At station 1 the predicted profile decays at 06:00 h, then
stays constant and it does not increase again until
20:00 h when the observed and predicted values reach
approximately the same concentration. The CALPUFF
hourly SO2 mass concentrations are underpredicted at
ARTICLE IN PRESS
Fig. 6. Left panel: RAMS surface wind simulations. Right panel CALMET surface wind simulations and surface SO2 concentration
predicted with CALPUFF for 3 February 1999 at 20:00LST.
0
5
10
15
20
25
30
0 5 10 15 20 25
Time, hour
SO
2 co
nce
ntr
atio
n, p
pb
Calpuff
Station 1
Calpuff
Station 3
Fig. 7. A comparison of CALPUFF predictions with observa-
tions for SO2 concentrations taken at the Dos Bocas air quality
network for 3 February 1999.
R. Villasenor et al. / Atmospheric Environment 37 (2003) 3713–37293726
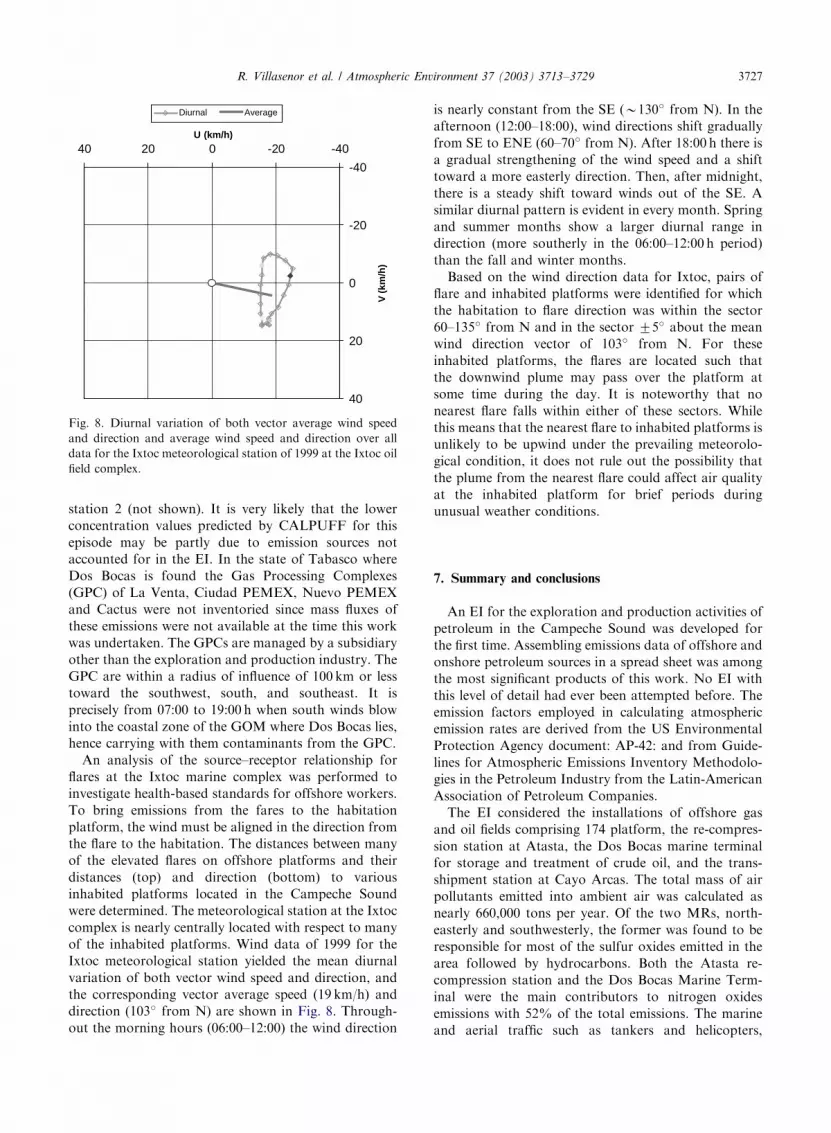
station 2 (not shown). It is very likely that the lower
concentration values predicted by CALPUFF for this
episode may be partly due to emission sources not
accounted for in the EI. In the state of Tabasco where
Dos Bocas is found the Gas Processing Complexes
(GPC) of La Venta, Ciudad PEMEX, Nuevo PEMEX
and Cactus were not inventoried since mass fluxes of
these emissions were not available at the time this work
was undertaken. The GPCs are managed by a subsidiary
other than the exploration and production industry. The
GPC are within a radius of influence of 100 km or less
toward the southwest, south, and southeast. It is
precisely from 07:00 to 19:00 h when south winds blow
into the coastal zone of the GOM where Dos Bocas lies,
hence carrying with them contaminants from the GPC.
An analysis of the source–receptor relationship for
flares at the Ixtoc marine complex was performed to
investigate health-based standards for offshore workers.
To bring emissions from the fares to the habitation
platform, the wind must be aligned in the direction from
the flare to the habitation. The distances between many
of the elevated flares on offshore platforms and their
distances (top) and direction (bottom) to various
inhabited platforms located in the Campeche Sound
were determined. The meteorological station at the Ixtoc
complex is nearly centrally located with respect to many
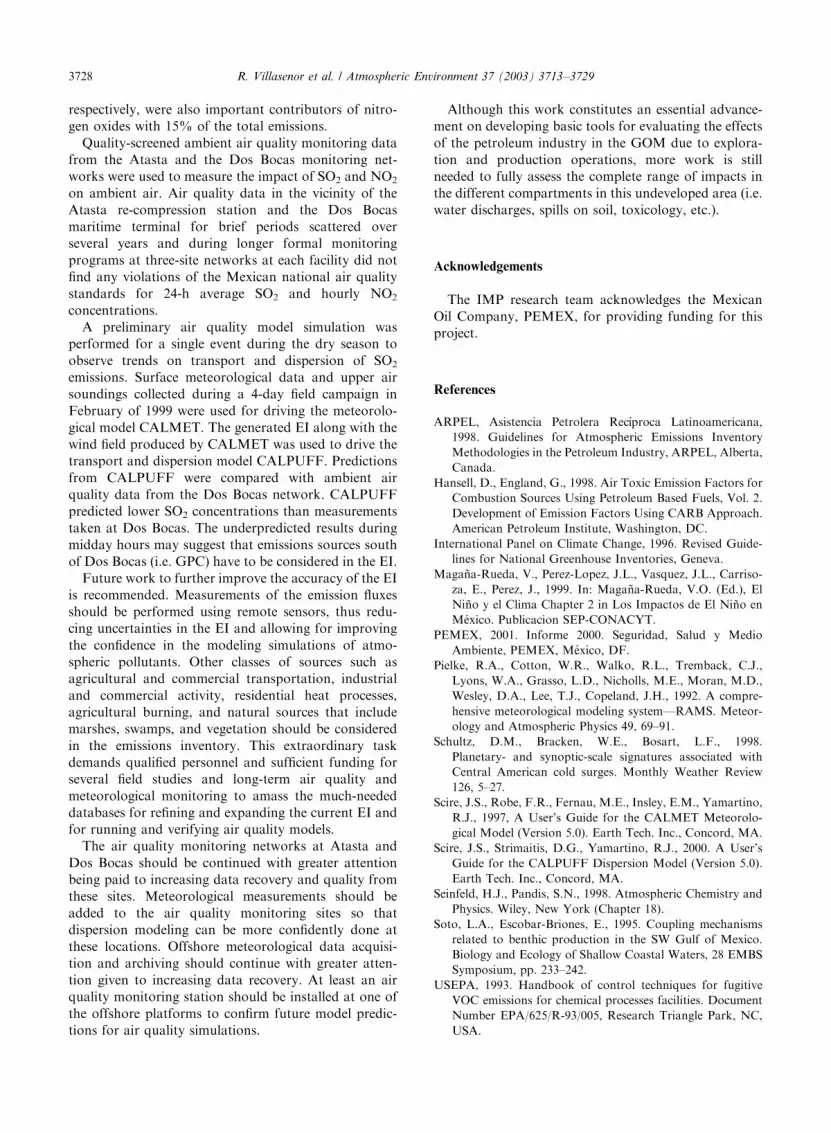
of the inhabited platforms. Wind data of 1999 for the
Ixtoc meteorological station yielded the mean diurnal
variation of both vector wind speed and direction, and
the corresponding vector average speed (19 km/h) and
direction (103� from N) are shown in Fig. 8. Through-
out the morning hours (06:00–12:00) the wind direction
is nearly constant from the SE (B130� from N). In the
afternoon (12:00–18:00), wind directions shift gradually
from SE to ENE (60–70� from N). After 18:00 h there is
a gradual strengthening of the wind speed and a shift
toward a more easterly direction. Then, after midnight,
there is a steady shift toward winds out of the SE. A
similar diurnal pattern is evident in every month. Spring
and summer months show a larger diurnal range in
direction (more southerly in the 06:00–12:00 h period)
than the fall and winter months.
Based on the wind direction data for Ixtoc, pairs of
flare and inhabited platforms were identified for which
the habitation to flare direction was within the sector
60–135� from N and in the sector 75� about the mean
wind direction vector of 103� from N. For these
inhabited platforms, the flares are located such that
the downwind plume may pass over the platform at
some time during the day. It is noteworthy that no
nearest flare falls within either of these sectors. While
this means that the nearest flare to inhabited platforms is
unlikely to be upwind under the prevailing meteorolo-
gical condition, it does not rule out the possibility that
the plume from the nearest flare could affect air quality
at the inhabited platform for brief periods during
unusual weather conditions.
7. Summary and conclusions
An EI for the exploration and production activities of
petroleum in the Campeche Sound was developed for
the first time. Assembling emissions data of offshore and
onshore petroleum sources in a spread sheet was among
the most significant products of this work. No EI with
this level of detail had ever been attempted before. The
emission factors employed in calculating atmospheric
emission rates are derived from the US Environmental
Protection Agency document: AP-42: and from Guide-
lines for Atmospheric Emissions Inventory Methodolo-
gies in the Petroleum Industry from the Latin-American
Association of Petroleum Companies.
The EI considered the installations of offshore gas
and oil fields comprising 174 platform, the re-compres-
sion station at Atasta, the Dos Bocas marine terminal
for storage and treatment of crude oil, and the trans-
shipment station at Cayo Arcas. The total mass of air
pollutants emitted into ambient air was calculated as
nearly 660,000 tons per year. Of the two MRs, north-
easterly and southwesterly, the former was found to be
responsible for most of the sulfur oxides emitted in the
area followed by hydrocarbons. Both the Atasta re-
compression station and the Dos Bocas Marine Term-
inal were the main contributors to nitrogen oxides
emissions with 52% of the total emissions. The marine
and aerial traffic such as tankers and helicopters,
ARTICLE IN PRESS
-40
-20
0
20
40
-40-2002040U (km/h)
V (k
m/h
)
Diurnal Average
Fig. 8. Diurnal variation of both vector average wind speed
and direction and average wind speed and direction over all
data for the Ixtoc meteorological station of 1999 at the Ixtoc oil
field complex.
R. Villasenor et al. / Atmospheric Environment 37 (2003) 3713–3729 3727
respectively, were also important contributors of nitro-
gen oxides with 15% of the total emissions.
Quality-screened ambient air quality monitoring data
from the Atasta and the Dos Bocas monitoring net-
works were used to measure the impact of SO2 and NO2
on ambient air. Air quality data in the vicinity of the
Atasta re-compression station and the Dos Bocas
maritime terminal for brief periods scattered over
several years and during longer formal monitoring
programs at three-site networks at each facility did not
find any violations of the Mexican national air quality
standards for 24-h average SO2 and hourly NO2
concentrations.
A preliminary air quality model simulation was
performed for a single event during the dry season to
observe trends on transport and dispersion of SO2
emissions. Surface meteorological data and upper air
soundings collected during a 4-day field campaign in
February of 1999 were used for driving the meteorolo-
gical model CALMET. The generated EI along with the
wind field produced by CALMET was used to drive the
transport and dispersion model CALPUFF. Predictions
from CALPUFF were compared with ambient air
quality data from the Dos Bocas network. CALPUFF
predicted lower SO2 concentrations than measurements
taken at Dos Bocas. The underpredicted results during
midday hours may suggest that emissions sources south
of Dos Bocas (i.e. GPC) have to be considered in the EI.
Future work to further improve the accuracy of the EI
is recommended. Measurements of the emission fluxes
should be performed using remote sensors, thus redu-
cing uncertainties in the EI and allowing for improving
the confidence in the modeling simulations of atmo-
spheric pollutants. Other classes of sources such as
agricultural and commercial transportation, industrial
and commercial activity, residential heat processes,
agricultural burning, and natural sources that include
marshes, swamps, and vegetation should be considered
in the emissions inventory. This extraordinary task
demands qualified personnel and sufficient funding for
several field studies and long-term air quality and
meteorological monitoring to amass the much-needed
databases for refining and expanding the current EI and
for running and verifying air quality models.
The air quality monitoring networks at Atasta and
Dos Bocas should be continued with greater attention
being paid to increasing data recovery and quality from
these sites. Meteorological measurements should be
added to the air quality monitoring sites so that
dispersion modeling can be more confidently done at
these locations. Offshore meteorological data acquisi-
tion and archiving should continue with greater atten-
tion given to increasing data recovery. At least an air
quality monitoring station should be installed at one of
the offshore platforms to confirm future model predic-
tions for air quality simulations.
Although this work constitutes an essential advance-
ment on developing basic tools for evaluating the effects
of the petroleum industry in the GOM due to explora-
tion and production operations, more work is still
needed to fully assess the complete range of impacts in
the different compartments in this undeveloped area (i.e.
water discharges, spills on soil, toxicology, etc.).
Acknowledgements
The IMP research team acknowledges the Mexican
Oil Company, PEMEX, for providing funding for this
project.
References
ARPEL, Asistencia Petrolera Rec!ıproca Latinoamericana,
1998. Guidelines for Atmospheric Emissions Inventory
Methodologies in the Petroleum Industry, ARPEL, Alberta,
Canada.
Hansell, D., England, G., 1998. Air Toxic Emission Factors for
Combustion Sources Using Petroleum Based Fuels, Vol. 2.
Development of Emission Factors Using CARB Approach.
American Petroleum Institute, Washington, DC.
International Panel on Climate Change, 1996. Revised Guide-
lines for National Greenhouse Inventories, Geneva.
Magana-Rueda, V., Perez-Lopez, J.L., Vasquez, J.L., Carriso-
za, E., Perez, J., 1999. In: Magana-Rueda, V.O. (Ed.), El
Nino y el Clima Chapter 2 in Los Impactos de El Nino en
M!exico. Publicacion SEP-CONACYT.
PEMEX, 2001. Informe 2000. Seguridad, Salud y Medio
Ambiente, PEMEX, M!exico, DF.
Pielke, R.A., Cotton, W.R., Walko, R.L., Tremback, C.J.,
Lyons, W.A., Grasso, L.D., Nicholls, M.E., Moran, M.D.,
Wesley, D.A., Lee, T.J., Copeland, J.H., 1992. A compre-
hensive meteorological modeling system—RAMS. Meteor-
ology and Atmospheric Physics 49, 69–91.
Schultz, D.M., Bracken, W.E., Bosart, L.F., 1998.
Planetary- and synoptic-scale signatures associated with
Central American cold surges. Monthly Weather Review
126, 5–27.
Scire, J.S., Robe, F.R., Fernau, M.E., Insley, E.M., Yamartino,
R.J., 1997, A User’s Guide for the CALMET Meteorolo-
gical Model (Version 5.0). Earth Tech. Inc., Concord, MA.
Scire, J.S., Strimaitis, D.G., Yamartino, R.J., 2000. A User’s
Guide for the CALPUFF Dispersion Model (Version 5.0).
Earth Tech. Inc., Concord, MA.
Seinfeld, H.J., Pandis, S.N., 1998. Atmospheric Chemistry and
Physics. Wiley, New York (Chapter 18).
Soto, L.A., Escobar-Briones, E., 1995. Coupling mechanisms
related to benthic production in the SW Gulf of Mexico.
Biology and Ecology of Shallow Coastal Waters, 28 EMBS
Symposium, pp. 233–242.
USEPA, 1993. Handbook of control techniques for fugitive
VOC emissions for chemical processes facilities. Document
Number EPA/625/R-93/005, Research Triangle Park, NC,
USA.
ARTICLE IN PRESS
R. Villasenor et al. / Atmospheric Environment 37 (2003) 3713–37293728

USEPA, AP-42, 2001. Compilation of air pollutant emission
factors. Research Triangle Park, NC, USA. Available on
the web page: www.epa.gov/ttn/chieff.
Venegas, L., Hannaway, G.R., Poor, N.D., 2002. An evalua-
tion of the errors associated with loss of puffs at the
boundary of the CALPUFF modeling domain. Proceedings
of the Air and Waste Management Association, Baltimore,
23–27 June.
Western Governors’ Association and Radian International,
1997. Mexico emission inventory program manuals, Vol. V:
Area Source Inventory Development.
ARTICLE IN PRESS
R. Villasenor et al. / Atmospheric Environment 37 (2003) 3713–3729 3729