petroleum and coal
TRANSCRIPT
Petroleum and Coal
Pet Coal (2019); 61(6) 1282-1299 ISSN 1337-7027 an open access journal
Review Open Access
PVT PROPERTIES OF BLACK CRUDE OIL-A REVIEW A. N. El-hoshoudy Production Department, Egyptian Petroleum Research Institute, Naser City, Cairo, Egypt
Received June 15, 2019; Accepted October 10 2019
Abstract
Precise PVT studies and performance of phase-equilibria for petroleum reservoir fluid are essential for describing these fluids and appraising their volumetric behavior at several pressure stages. There are
numerous laboratory studies that can be generated in a reservoir sample. The amount of available
data regulates the number of tests that can be achieved in the laboratory. Generally, there are three
laboratory tests that characterize hydrocarbon fluids, including primary study, constant mass depletion, and differential vaporization test. Generally, PVT properties determined either
experimentally or calculated theoretically through published correlations. In this chapter, the author
details different PVT laboratory tests utilized to distinguish the phase behavior of black oil.
Keywords: PVT Experiments; Black oil properties; and Petroleum reservoirs .
1. Introduction
PETROLEUM (an equivalent term is crude oil) is a complex mixture consisting predominantly of hydrocarbons and containing sulfur, nitrogen, oxygen, and helium as minor constituents. The physical and chemical properties of crude oils vary considerably and depend on the con-centration of the various types of hydrocarbons and minor constituents present. Crude oil reservoirs are classified according to initial reservoir pressure into the following categories; 1) Undersaturated Oil Reservoir; in which initial reservoir pressure is greater than the bubble
point pressure of reservoir fluid; 2) Saturated Oil Reservoir; in which initial reservoir pressure is equal to the bubble point pressure of reservoir fluid; 3) Gas - cap Reservoir; in which initial reservoir pressure is below the bubble point pressure of reservoir fluid, so reservoir is termed as gas-cap or two-phase reservoir, since the gas or vapor phase is underlain by an oil phase. Petroleum hydrocarbons exist as gaseous or liquid phases depending on reservoir tempera-
ture. If it is higher than the critical temperature of the fluid, the reservoir fluid is gas. Other-wise, the reservoir fluid is oil [1]. Black oil reservoirs considered one of the most precious reservoir fluids.it constitutes the majority of oil reservoirs and exists in every basin. An accu-rate description of the physical properties of crude oils is of considerable importance in the fields of both applied and theoretical science and especially in the solution of petroleum res-
ervoir engineering problems. Some of these physical properties are of primary interest in petroleum engineering studies and detected through PVT tests, which aim to determine res-ervoir fluid behavior at simulated reservoir conditions. Data on these fluid properties are usu-ally determined by laboratory experiments performed on samples of actual reservoir fluids. In the absence of experimentally measured properties of crude oils, it is necessary for the petro-
leum engineer to determine the properties from empirically derived correlations. However, correlations are approximations and may be useful only in regional geological provinces.
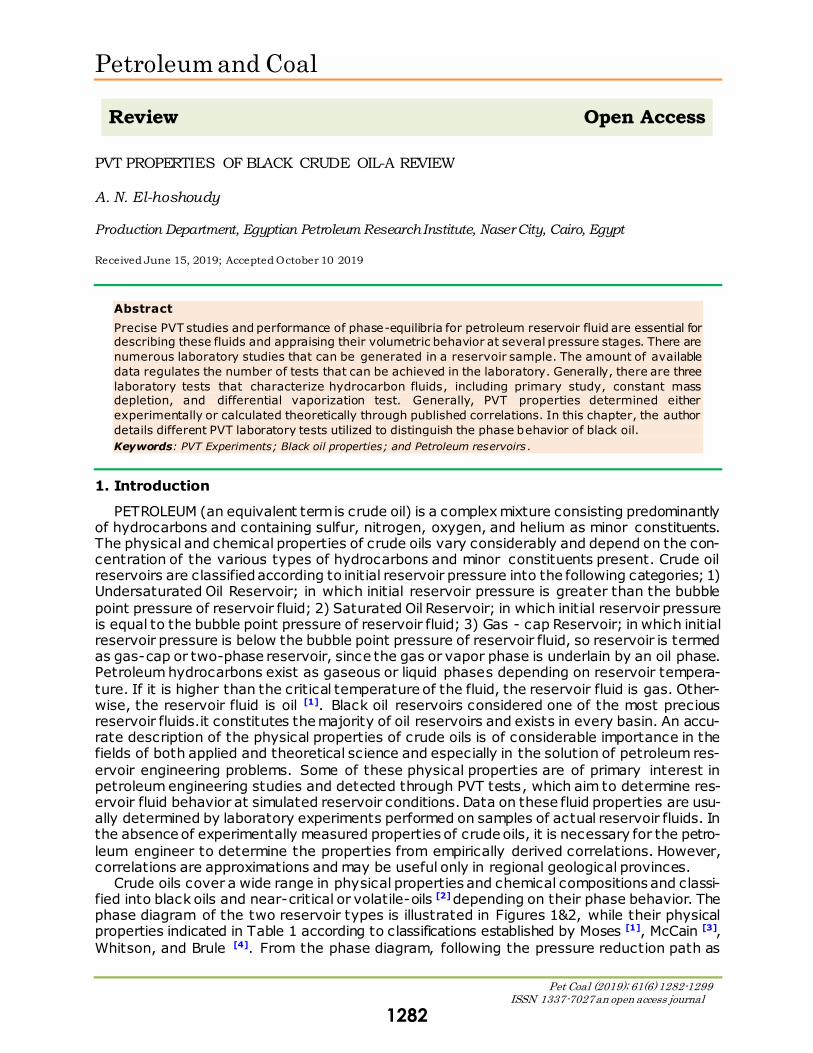
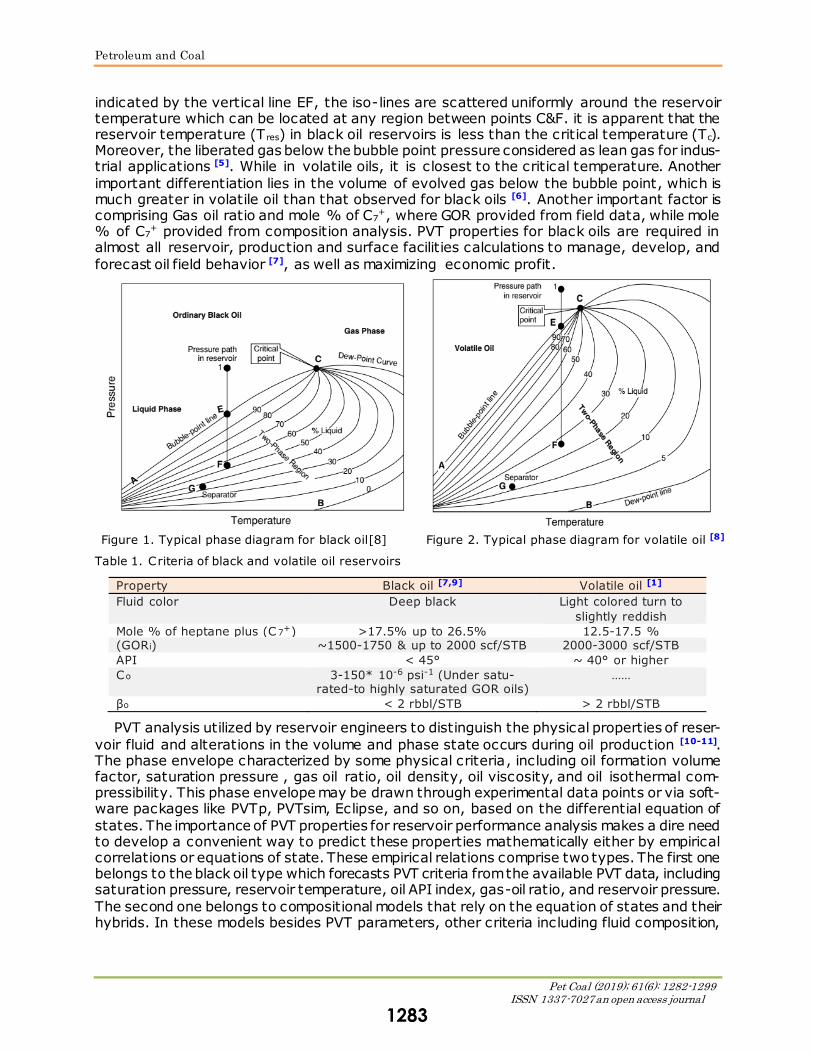
Crude oils cover a wide range in physical properties and chemical compositions and classi-fied into black oils and near-critical or volatile-oils [2] depending on their phase behavior. The phase diagram of the two reservoir types is illustrated in Figures 1&2, while their physical properties indicated in Table 1 according to classifications established by Moses [1], McCain [3],
Whitson, and Brule [4]. From the phase diagram, following the pressure reduction path as
1282
Petroleum and Coal
Pet Coal (2019); 61(6): 1282-1299 ISSN 1337-7027 an open access journal
indicated by the vertical line EF, the iso-lines are scattered uniformly around the reservoir temperature which can be located at any region between points C&F. it is apparent that the reservoir temperature (T res) in black oil reservoirs is less than the critical temperature (Tc). Moreover, the liberated gas below the bubble point pressure considered as lean gas for indus-trial applications [5]. While in volatile oils, it is closest to the critical temperature. Another
important differentiation lies in the volume of evolved gas below the bubble point, which is much greater in volatile oil than that observed for black oils [6]. Another important factor is comprising Gas oil ratio and mole % of C7
+, where GOR provided from field data, while mole % of C7
+ provided from composition analysis. PVT properties for black oils are required in almost all reservoir, production and surface facilities calculations to manage, develop, and
forecast oil field behavior [7], as well as maximizing economic profit.
Figure 1. Typical phase diagram for black oil[8] Figure 2. Typical phase diagram for volatile oil [8]
Table 1. Criteria of black and volatile oil reservoirs
Property Black oil [7,9] Volatile oil [1]
Fluid color Deep black Light colored turn to
slightly reddish
Mole % of heptane plus (C 7+) >17.5% up to 26.5% 12.5-17.5 %
(GORi) ~1500-1750 & up to 2000 scf/STB 2000-3000 scf/STB
API < 45° ~ 40° or higher
Co 3-150* 10-6 psi-1 (Under satu-rated-to highly saturated GOR oils)
……
βo < 2 rbbl/STB > 2 rbbl/STB
PVT analysis utilized by reservoir engineers to distinguish the physical properties of reser-
voir fluid and alterations in the volume and phase state occurs during oil production [10-11]. The phase envelope characterized by some physical criteria, including oil formation volume factor, saturation pressure , gas oil ratio, oil density, oil viscosity, and oil isothermal com-pressibility. This phase envelope may be drawn through experimental data points or via soft-ware packages like PVTp, PVTsim, Eclipse, and so on, based on the differential equation of
states. The importance of PVT properties for reservoir performance analysis makes a dire need to develop a convenient way to predict these properties mathematically either by empirical correlations or equations of state. These empirical relations comprise two types. The first one belongs to the black oil type which forecasts PVT criteria from the available PVT data, including saturation pressure, reservoir temperature, oil API index, gas-oil ratio, and reservoir pressure.
The second one belongs to compositional models that rely on the equation of states and their hybrids. In these models besides PVT parameters, other criteria including fluid composition,
1283
Petroleum and Coal
Pet Coal (2019); 61(6): 1282-1299 ISSN 1337-7027 an open access journal
critical temperature, molar masses and components acentric factor are utilized [12-13]. Alt-hough Accuracy of the empirical PVT correlations is often limited due to variation and complexity of multicomponent reservoir fluid systems, these correlations still used on field scale [14-17].
2. PVT physical parameters and black oil modeling
In a black oil reservoir, the oil and gas formation volume factors, gas densities, the solution
gas-oil ratio, and the viscosities of oil and gas are implemented at reservoir temperature as a function of pressure. Once obtaining these parameters, it can be applied in empirical correla-tions to obtain the relative in situ amounts of oil and gas during the production life of the reservoir. These physical parameters include the following;
2.1. The crude oil API gravity
Crude oil density defined as the mass of a unit volume of the crude at a specified pressure and temperature and expressed in g/cc. In typical oil reservoirs, the oil density decreases with pressure depletion until it reaches the lowest value at the bubble point. The higher oil density at higher pressures resorts to the high oil molecules compressing per the unit volume. By reducing pressure beneath the bubble-point pressure, gas ejected from the solution and formed a free gas. The released gas is saturated with some of oil intermediate components,
while the heavier one remains in the reservoir. These intermediates release results in the density reversal trend versus pressure beneath the saturation pressure. It is calculated either by compositional models or by correlating parameters. The API gravity is the preferred gravity scale, and related to the specific gravity which defined as the ratio of the oil density to water density at 60°F and atmospheric pressure by the following relation;
𝐴𝑃𝐼 =141.5
𝛾𝑜− 131.5 (eq. 1)
2.2. Solution gas specific gravity
It is a dimensionless property represent the ratio between hydrocarbon gas density and the air density at standard conditions. It is ascribed practically by the weighted average of the specific gravities of the separated gas from each separator, and expressed by the following relation;
𝛾𝑔 =𝛴𝑖=1
𝑛 (𝑅𝑠𝑒𝑝)𝑖 (𝛾𝑠𝑒𝑝)𝑖 + 𝑅𝑠𝑡𝛾𝑠𝑡
𝛴𝑖=1𝑛 (𝑅𝑠𝑒𝑝)𝑖 + 𝑅𝑠𝑡
(eq. 2)
2.3. Gas solubility
It is defined as the number of standard cubic feet of gas that dissolve in one stock-tank barrel of crude oil at certain pressure and temperature and defined in SCF/STB [18].
𝑅𝑠 =(𝑉𝑔)𝑃, 𝑇
(𝑉𝑜)𝑠𝑐 (eq. 3)
At standard conditions, dissolved gas is completely released from the oil, and therefore the oil contains no gas. Gas solubility increase with pressure increasing until it reaches a maximum value at saturation pressure. Below the bubble point pressure, gas evolves with pressure de-cline, and gas solubility decrease. Generally, the lighter the oil, the higher the gas solubility,
therefore volatile oils often have a higher solution GOR than black oils.
2.4. Bubble point pressure
It is defined as the highest pressure at which a bubble of gas is first liberated from the oil, and determined experimentally by conducting a constant mass depletion test or estimated from empirical correlations. By reservoir pressure depletion beneath the saturation pressure,
a released gas formed in the reservoir. Since gas mobility > oil mobility, the produced GOR increases with continual pressure depletion beneath the saturation pressure. Other PVT criteria greatly affected by reservoir pressure depletion.
1284
Petroleum and Coal
Pet Coal (2019); 61(6): 1282-1299 ISSN 1337-7027 an open access journal
2.5. Isothermal oil compressibility
It is the change in the fluid volume with respect to the change in pressure at isothermal
conditions, expressed in psi-1 and calculated above and bubble point pressure from the equa-tions 4&5 respectively;
𝐶𝑜 = −1
𝑑𝑣
𝑑𝑣
𝑑𝑝 (eq. 4)
𝐶𝑜 = −1
𝐵𝑜[(
𝜕𝐵𝑜
𝜕𝑃)
𝑇− 𝐵𝑔 (
𝜕𝑅𝑠
𝜕𝑃)
𝑇] (eq. 5)
Oil compressibility is determined during constant mass depletion test. In that procedure, the oil in the PVT cell is allowed to expand by reducing the pressure, and both the increase in oil volume and the decrease in oil pressure are measured. Oil compressibility above the satu-ration pressure greatly affects the material balance calculations for estimating volumetric re-
serve in oil reservoirs, as well as pressure transient analysis for undesaturated oils. Moreover, it is used in the estimation of vertical lift performance.
2.6. Gas compressibility factor
It is a dimensionless quantity used for gas correction at higher pressures and temperature, calculated from the basic equation of state;
𝑍 =𝑃𝑉
𝑛𝑅𝑇 (eq. 6)
2.7. Oil formation volume factor
It is defined as the ratio of oil volume either at the reservoir or separator condition to the volume of oil at standard conditions.
(𝐵𝑜)𝑟𝑒𝑠 =(𝑉𝑜)(𝑝,𝑇)𝑟𝑒𝑠
(𝑉𝑜)𝑠𝑐 (eq. 7)
(𝐵𝑜)𝑠𝑒𝑝 =(𝑉𝑜)(𝑝,𝑇)𝑠𝑒𝑝
(𝑉𝑜)𝑠𝑐 (eq. 8)
The oil formation volume factor is expressed in units of reservoir volume over standard volume (bbl./STB). At the surface, the oil loses the dissolved gas; it contained under high pressure and temperature in the reservoir. By pressure decline falling down from reservoir pressure to surface conditions, the following scenarios generated; 1) The oil weight decrease
owing to the loss of dissolved gas by pressure decrease; 2) The oil volume reduced slightly owing to the temperature reduction. However, the oil slightly expands owing to the pressure decrease. The volume reduction and expansion due to temperature and pressure successively usually cancel each other, and no significant changes occur. Practically, (Bo) determined from residual oil volume at 60°F at the end of differential liberation. The increase of Bo above bubble point pressure resort to oil expansion by pressure decline so the oil volume at P & T (the
nominator in equation 8) increase and consequently, Bo increase. Below bubble point, the oil shrinkage due to gas evolving tends to overcome its expansion by pressure reduction, conse-quently Bo decline steeply.
2.8. Gas formation volume factor
Defined as the gas volume at the temperature and pressure of any stage below the bubble
point, divided by the volume of the same gas at standard conditions through differential lib-eration, Bg can also be calculated from composition analysis as a function of Z-factor as stated in equation 10.
𝐵𝑔 =(𝑉𝑔)𝑃,𝑇
(𝑉𝑔)𝑠𝑐
(eq. 9)
𝐵𝑔 =0.028269𝑍(𝑇)𝑅
(𝑃)𝑝𝑠𝑖𝑎
(eq. 10)
1285
Petroleum and Coal
Pet Coal (2019); 61(6): 1282-1299 ISSN 1337-7027 an open access journal
2.9. Crude oil viscosity
It is defined as the resistance of the fluid to flow, expressed in centipoise (cP). It is affected
by oil composition, GOR, and reservoir temperature. Oil viscosity represents internal dynamic fluid friction relevant to fluid layers. Higher and lower viscosity depends on the gas/oil ratio. The behavior of viscosity is similar to that of density since, oil viscosity shrinks with pressure decreasing, owing to reduced friction between fluid layers, and reach to its minimal at the saturation pressure. With further pressure depletion, more and more gas escaped from the oil, so the oil becomes denser (i.e., more viscous) owing to the loss of lighter components.
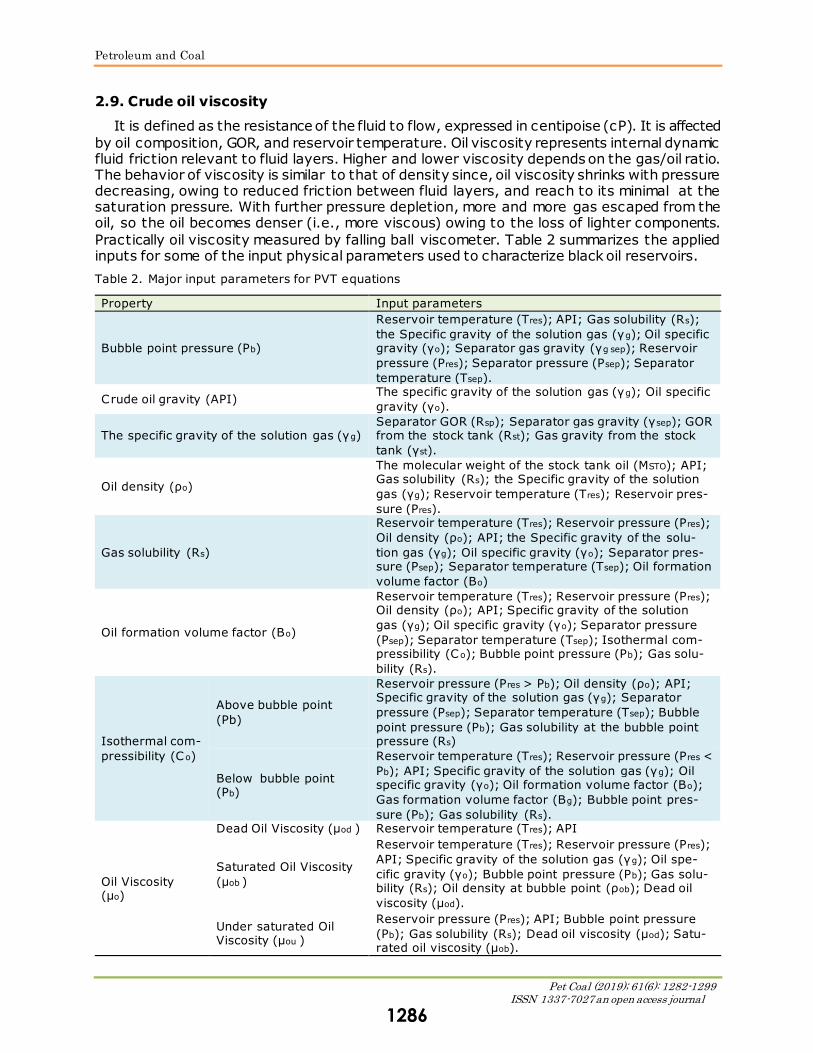
Practically oil viscosity measured by falling ball viscometer. Table 2 summarizes the applied inputs for some of the input physical parameters used to characterize black oil reservoirs.
Table 2. Major input parameters for PVT equations
Property Input parameters
Bubble point pressure (Pb)
Reservoir temperature (Tres); API; Gas solubility (Rs);
the Specific gravity of the solution gas (γg); Oil specific gravity (γo); Separator gas gravity (γg sep); Reservoir
pressure (Pres); Separator pressure (Psep); Separator
temperature (Tsep).
Crude oil gravity (API) The specific gravity of the solution gas (γg); Oil specific
gravity (γo).
The specific gravity of the solution gas (γg) Separator GOR (Rsp); Separator gas gravity (γsep); GOR from the stock tank (Rst); Gas gravity from the stock
tank (γst).
Oil density (ρo)
The molecular weight of the stock tank oil (MSTO); API; Gas solubility (Rs); the Specific gravity of the solution
gas (γg); Reservoir temperature (Tres); Reservoir pres-
sure (Pres).
Gas solubility (Rs)
Reservoir temperature (Tres); Reservoir pressure (Pres);
Oil density (ρo); API; the Specific gravity of the solu-
tion gas (γg); Oil specific gravity (γo); Separator pres-sure (Psep); Separator temperature (Tsep); Oil formation
volume factor (Bo)
Oil formation volume factor (Bo)
Reservoir temperature (Tres); Reservoir pressure (Pres); Oil density (ρo); API; Specific gravity of the solution
gas (γg); Oil specific gravity (γo); Separator pressure
(Psep); Separator temperature (Tsep); Isothermal com-pressibility (C o); Bubble point pressure (Pb); Gas solu-
bility (Rs).
Isothermal com-
pressibility (C o)
Above bubble point
(Pb)
Reservoir pressure (Pres > Pb); Oil density (ρo); API; Specific gravity of the solution gas (γg); Separator
pressure (Psep); Separator temperature (Tsep); Bubble
point pressure (Pb); Gas solubility at the bubble point pressure (Rs)
Below bubble point (Pb)
Reservoir temperature (Tres); Reservoir pressure (Pres <
Pb); API; Specific gravity of the solution gas (γg); Oil specific gravity (γo); Oil formation volume factor (Bo);
Gas formation volume factor (Bg); Bubble point pres-
sure (Pb); Gas solubility (Rs).
Oil Viscosity (µo)
Dead Oil Viscosity (µod ) Reservoir temperature (Tres); API
Saturated Oil Viscosity
(µob )
Reservoir temperature (Tres); Reservoir pressure (Pres);
API; Specific gravity of the solution gas (γg); Oil spe-
cific gravity (γo); Bubble point pressure (Pb); Gas solu-bility (Rs); Oil density at bubble point (ρob); Dead oil
viscosity (µod).
Under saturated Oil Viscosity (µou )
Reservoir pressure (Pres); API; Bubble point pressure
(Pb); Gas solubility (Rs); Dead oil viscosity (µod); Satu-rated oil viscosity (µob).
1286
Petroleum and Coal
Pet Coal (2019); 61(6): 1282-1299 ISSN 1337-7027 an open access journal
3. Experimental PVT analysis
Crude oil samples can be obtained from downhole using a wireline sampling chamber, or
at the separator, using separation facilities [19]. To carry a successful PVT analysis, the sam-ples should be generated through the following procedure;
3.1. Sample handling
The pressurized liquid sample was heated to 200°F and stabilized in the single phase prior to the removal of any sample in order to ensure sample integrity and avoid any wax precipi-tation.
3.2. Sample validation
Carried out for both surface and bottom hole samples to ensure that no leakage occurs for the samples, and the fluid is virtually represented for the reservoir.
A) Surface samples obtained from the separator
They are subjected to assuring cylinders integrity during transportation through measure-
ment of opening pressures of the separator oil cylinder and separator gas cylinder at ambient temperature and separator temperature. If the measured pressure equals the separator pres-sure, the sample is valid; otherwise, the sample is invalid. Moreover, quality control of sepa-rator samples carried out through measurement of the saturation pressure (bubble point) of the separator oil sample at the separator temperature and compared with the separator pres-
sure. The sample was then transferred to the Lab cylinder, and the amount of water, if present in the separator oil was determined, and discharged.
B) Bottom hole sample:
Also, check of cylinders integrity during transportation and sampling carried out by measurement of sample opening pressures at transferring temperature and reservoir tem-
perature. The sample cylinder was then agitated and transferring to Lab cylinder at reservoir temperature and pressure of 1000 psi above reservoir pressure.
3.3. Primary study
3.3.1. Surface samples obtained from separator:
A primary study carried only for surface samples as follow;
i. Atmospheric flashing of separator oil:
A portion of the separator oil sample was charged to a high-pressure visual PVT cell and thermally expanded to the separator temperature till equilibrium. The sample was subjected
to flash separation from separator conditions to standard conditions of 14.73 psia and 60°F. The dissolved Gas-oil ratio and oil formation volume factor were calculated using the volumet-ric data obtained so that the supplied stock-tank oil rate could be adjusted to the separator oil rate for the well-stream calculations. The density and API gravity of the stock-tank oil were also measured using density meter. The dissolved gas composition was determined using ex-
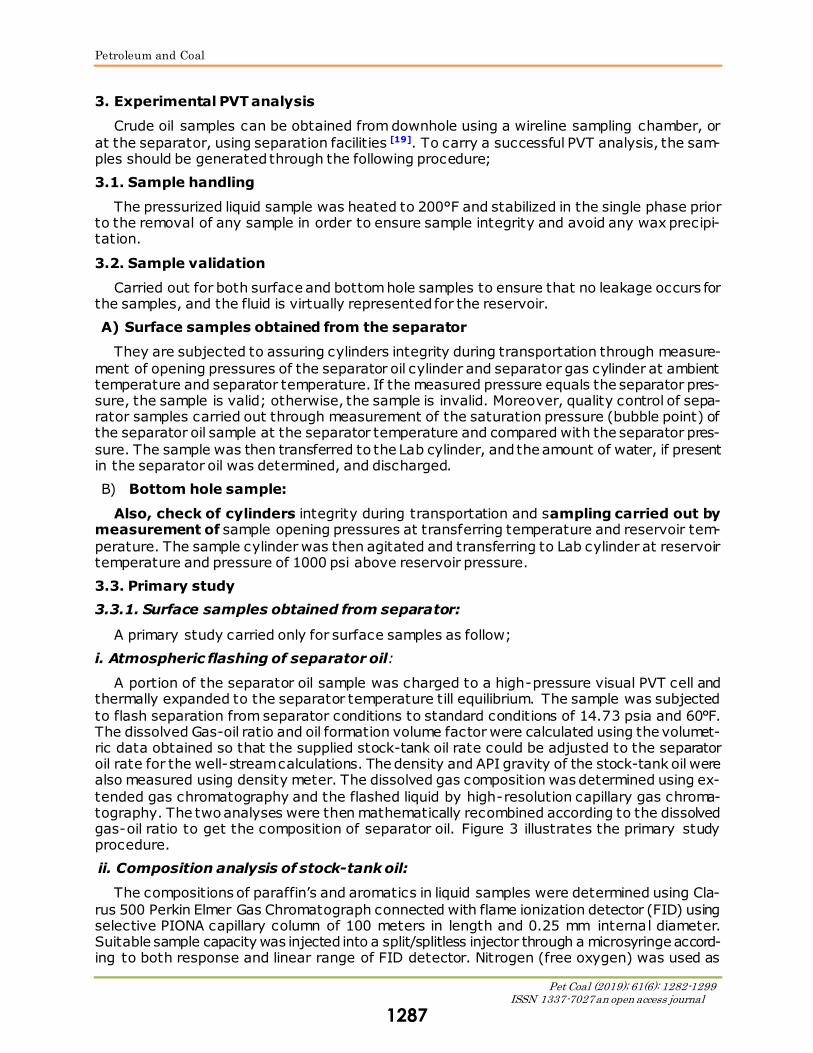
tended gas chromatography and the flashed liquid by high-resolution capillary gas chroma-tography. The two analyses were then mathematically recombined according to the dissolved gas-oil ratio to get the composition of separator oil. Figure 3 illustrates the primary study procedure.
ii. Composition analysis of stock-tank oil:
The compositions of paraffin’s and aromatics in liquid samples were determined using Cla-
rus 500 Perkin Elmer Gas Chromatograph connected with flame ionization detector (FID) using selective PIONA capillary column of 100 meters in length and 0.25 mm internal diameter. Suitable sample capacity was injected into a split/splitless injector through a microsyringe accord-ing to both response and linear range of FID detector. Nitrogen (free oxygen) was used as
1287
Petroleum and Coal
Pet Coal (2019); 61(6): 1282-1299 ISSN 1337-7027 an open access journal
carrier gas at its optimum flow rate. The system enables to detect the composition up to C36+.
Further Oil analysis includes density, viscosity, pour point, and distillation analysis, in addition to water, solids (BS), and sulfur contents, in order to determine the oil quality.
Figure 3. Diagram of the primary study steps
iii. Gas composition analysis:
The analysis of both separator gas and dissolved gas was determined according to ASTM 1945, using Clarus 500 PerkinElmer gas chromatograph online with the condensate cell utiliz-ing four packed columns connected in series with a thermal conductivity detector and DP-1
capillary column matched with flame ionization detector. Helium was used as the carrier gas, and the oven isothermal temperature 100ºC in order to provide highly efficient detection of aromatics and hydrocarbons paraffin (normal and iso) from methane (C1) up to Undecane (C11) components and non-hydrocarbons including H2S, CO2, and N2. Once repeatability is verified, the validated bottle generated to proceed the complete PVT analysis, which, in the
case of the reservoir fluid be a black oil, is composed of three main assays; constant Mass depletion (CMD), Differential Liberation (DL), and separator test.
iv. Measurement of density
The density of oil is measured by Anton Paar Density Meter. The density meter is calibrated with air and distilled water. The procedure reference is ASTM D-4052.
v. Measurement of molecular weight
The average molecular weight number is determined by using cryoscopy (freezing point depression of benzene).
vi. Corrected and adjustment of field separator GOR
Adjustment of field GOR carried out in the lab through the following equations, owing to higher deviations of the measured field gas deviation factor (Zf)
Corrected separator GOR=(𝐹𝑖𝑒𝑙𝑑 𝐺𝑂𝑅 ∗𝜌𝑓 ∗ 𝑍𝑓
𝜌𝑙 ∗ 𝑍𝑙)0.5 (eq. 11)
𝑍𝑓 = (1
𝑓𝑝𝑣)
0.5
(eq. 12)
1288
Petroleum and Coal
Pet Coal (2019); 61(6): 1282-1299 ISSN 1337-7027 an open access journal
𝐴𝑑𝑗𝑢𝑠𝑡𝑒𝑑 𝑆𝑒𝑝𝑎𝑟𝑎𝑡𝑜𝑟 𝐺𝑂𝑅 = 𝐶𝑜𝑟𝑟𝑒𝑐𝑡𝑒𝑑 𝑆𝑒𝑝𝑎𝑟𝑎𝑡𝑜𝑟 𝐺𝑂𝑅/𝐵𝑜 (eq. 13)
vii. Quality control of primary study:
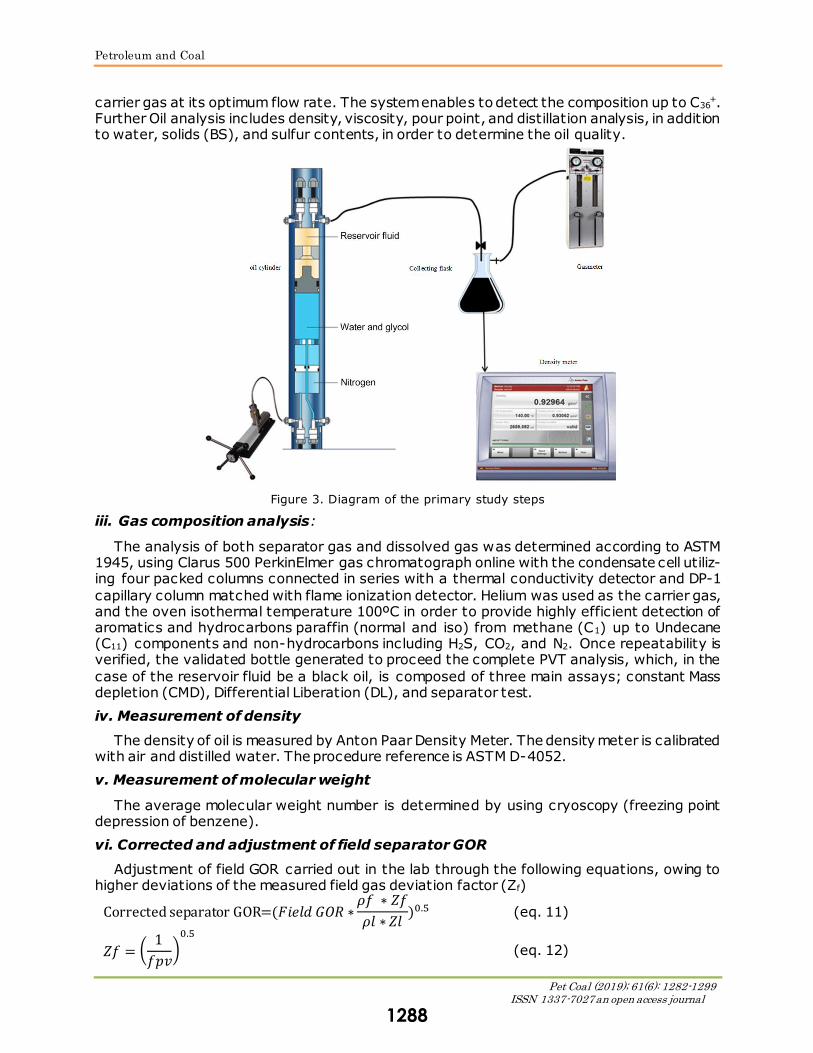
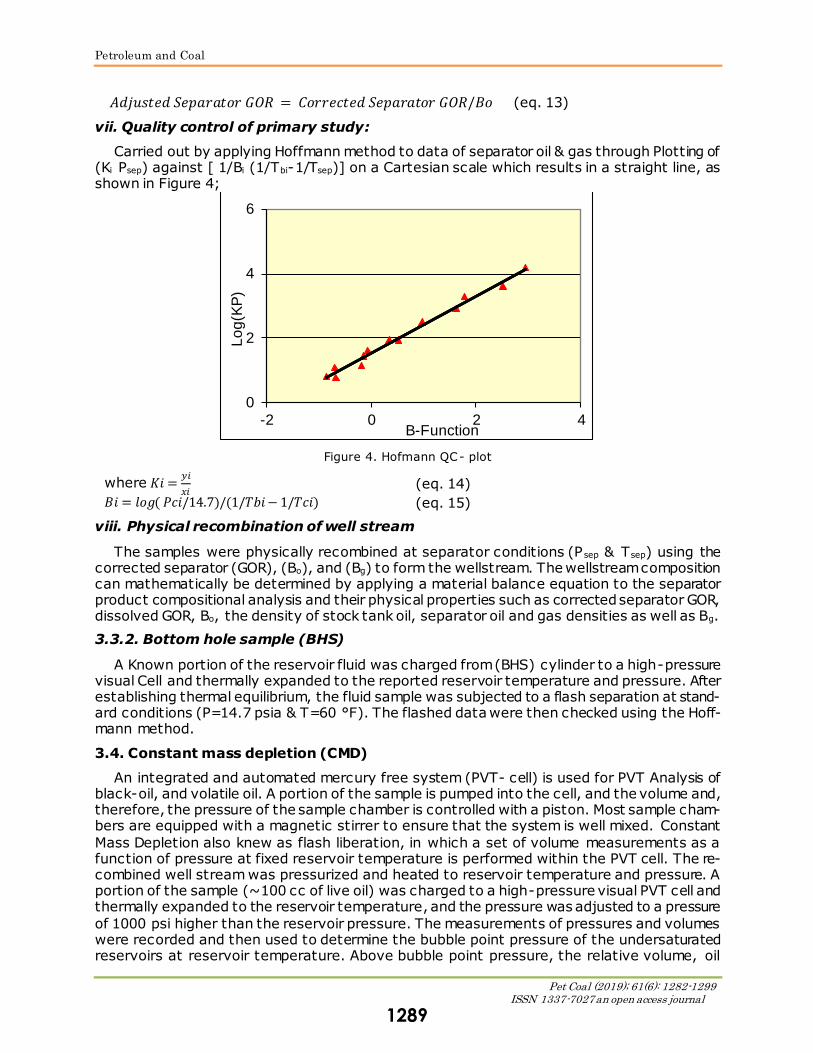
Carried out by applying Hoffmann method to data of separator oil & gas through Plotting of (Ki Psep) against [ 1/Bi (1/Tbi-1/Tsep)] on a Cartesian scale which results in a straight line, as shown in Figure 4;
Figure 4. Hofmann QC- plot
where 𝐾𝑖 =𝑦𝑖
𝑥𝑖 (eq. 14)
𝐵𝑖 = 𝑙𝑜𝑔( 𝑃𝑐𝑖/14.7)/(1/𝑇𝑏𝑖 − 1/𝑇𝑐𝑖) (eq. 15)
viii. Physical recombination of well stream
The samples were physically recombined at separator conditions (P sep & Tsep) using the corrected separator (GOR), (Bo), and (Bg) to form the wellstream. The wellstream composition can mathematically be determined by applying a material balance equation to the separator product compositional analysis and their physical properties such as corrected separator GOR, dissolved GOR, Bo, the density of stock tank oil, separator oil and gas densities as well as Bg.
3.3.2. Bottom hole sample (BHS)
A Known portion of the reservoir fluid was charged from (BHS) cylinder to a high-pressure visual Cell and thermally expanded to the reported reservoir temperature and pressure. After establishing thermal equilibrium, the fluid sample was subjected to a flash separation at stand-ard conditions (P=14.7 psia & T=60 °F). The flashed data were then checked using the Hoff-mann method.
3.4. Constant mass depletion (CMD)
An integrated and automated mercury free system (PVT- cell) is used for PVT Analysis of black-oil, and volatile oil. A portion of the sample is pumped into the cell, and the volume and, therefore, the pressure of the sample chamber is controlled with a piston. Most sample cham-bers are equipped with a magnetic stirrer to ensure that the system is well mixed. Constant
Mass Depletion also knew as flash liberation, in which a set of volume measurements as a function of pressure at fixed reservoir temperature is performed within the PVT cell. The re-combined well stream was pressurized and heated to reservoir temperature and pressure. A portion of the sample (~100 cc of live oil) was charged to a high-pressure visual PVT cell and thermally expanded to the reservoir temperature, and the pressure was adjusted to a pressure
of 1000 psi higher than the reservoir pressure. The measurements of pressures and volumes were recorded and then used to determine the bubble point pressure of the undersaturated reservoirs at reservoir temperature. Above bubble point pressure, the relative volume, oil
0
2
4
6
-2 0 2 4
Lo
g(K
P)
B-Function
1289
Petroleum and Coal
Pet Coal (2019); 61(6): 1282-1299 ISSN 1337-7027 an open access journal
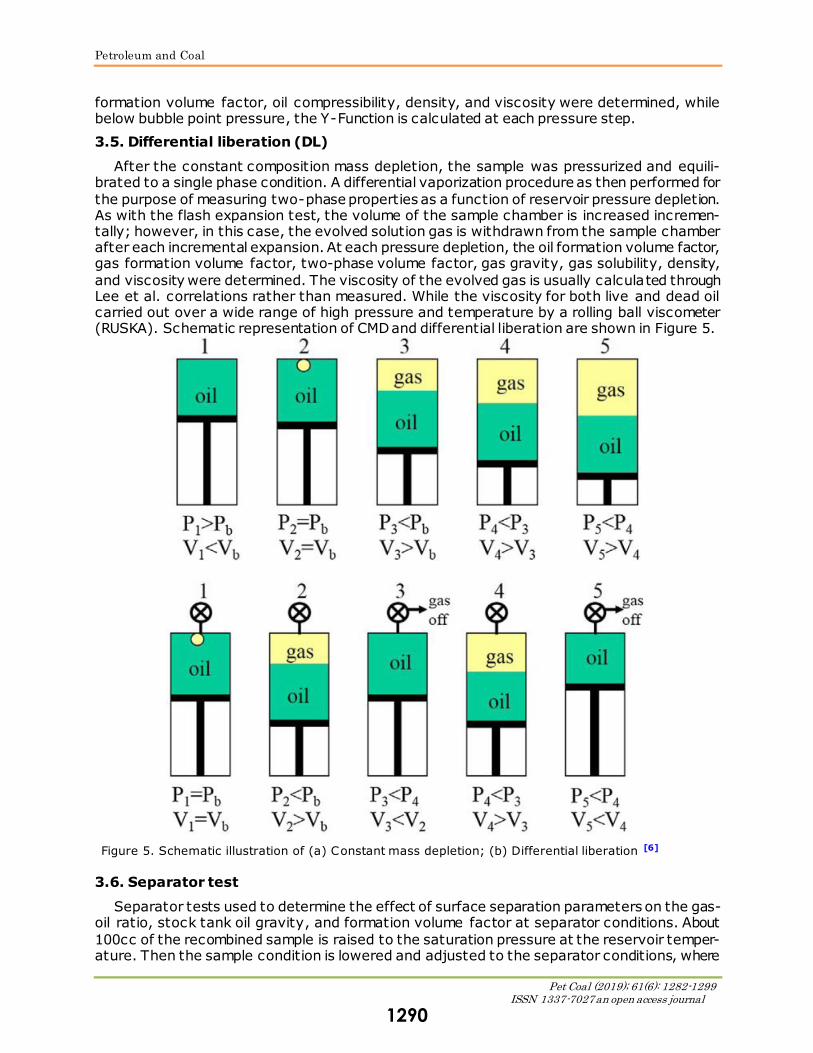
formation volume factor, oil compressibility, density, and viscosity were determined, while below bubble point pressure, the Y-Function is calculated at each pressure step.
3.5. Differential liberation (DL)
After the constant composition mass depletion, the sample was pressurized and equili-brated to a single phase condition. A differential vaporization procedure as then performed for
the purpose of measuring two-phase properties as a function of reservoir pressure depletion. As with the flash expansion test, the volume of the sample chamber is increased incremen-tally; however, in this case, the evolved solution gas is withdrawn from the sample chamber after each incremental expansion. At each pressure depletion, the oil formation volume factor, gas formation volume factor, two-phase volume factor, gas gravity, gas solubility, density,
and viscosity were determined. The viscosity of the evolved gas is usually calculated through Lee et al. correlations rather than measured. While the viscosity for both live and dead oil carried out over a wide range of high pressure and temperature by a rolling ball viscometer (RUSKA). Schematic representation of CMD and differential liberation are shown in Figure 5.
Figure 5. Schematic illustration of (a) Constant mass depletion; (b) Differential liberation [6]
3.6. Separator test
Separator tests used to determine the effect of surface separation parameters on the gas-oil ratio, stock tank oil gravity, and formation volume factor at separator conditions. About
100cc of the recombined sample is raised to the saturation pressure at the reservoir temper-ature. Then the sample condition is lowered and adjusted to the separator conditions, where
1290
Petroleum and Coal
Pet Coal (2019); 61(6): 1282-1299 ISSN 1337-7027 an open access journal
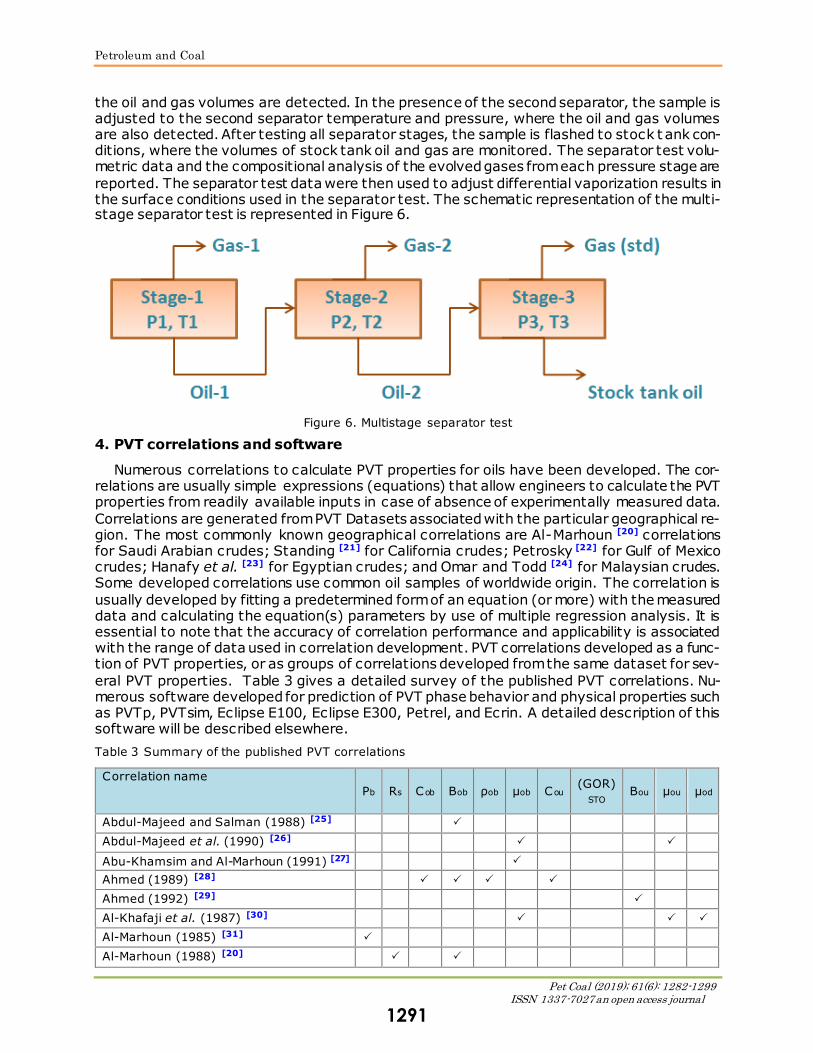
the oil and gas volumes are detected. In the presence of the second separator, the sample is adjusted to the second separator temperature and pressure, where the oil and gas volumes are also detected. After testing all separator stages, the sample is flashed to stock t ank con-ditions, where the volumes of stock tank oil and gas are monitored. The separator test volu-metric data and the compositional analysis of the evolved gases from each pressure stage are
reported. The separator test data were then used to adjust differential vaporization results in the surface conditions used in the separator test. The schematic representation of the multi-stage separator test is represented in Figure 6.
Figure 6. Multistage separator test
4. PVT correlations and software
Numerous correlations to calculate PVT properties for oils have been developed. The cor-relations are usually simple expressions (equations) that allow engineers to calculate the PVT properties from readily available inputs in case of absence of experimentally measured data.
Correlations are generated from PVT Datasets associated with the particular geographical re-gion. The most commonly known geographical correlations are Al-Marhoun [20] correlations for Saudi Arabian crudes; Standing [21] for California crudes; Petrosky [22] for Gulf of Mexico crudes; Hanafy et al. [23] for Egyptian crudes; and Omar and Todd [24] for Malaysian crudes. Some developed correlations use common oil samples of worldwide origin. The correlation is
usually developed by fitting a predetermined form of an equation (or more) with the measured data and calculating the equation(s) parameters by use of multiple regression analysis. It is essential to note that the accuracy of correlation performance and applicability is associated with the range of data used in correlation development. PVT correlations developed as a func-tion of PVT properties, or as groups of correlations developed from the same dataset for sev-
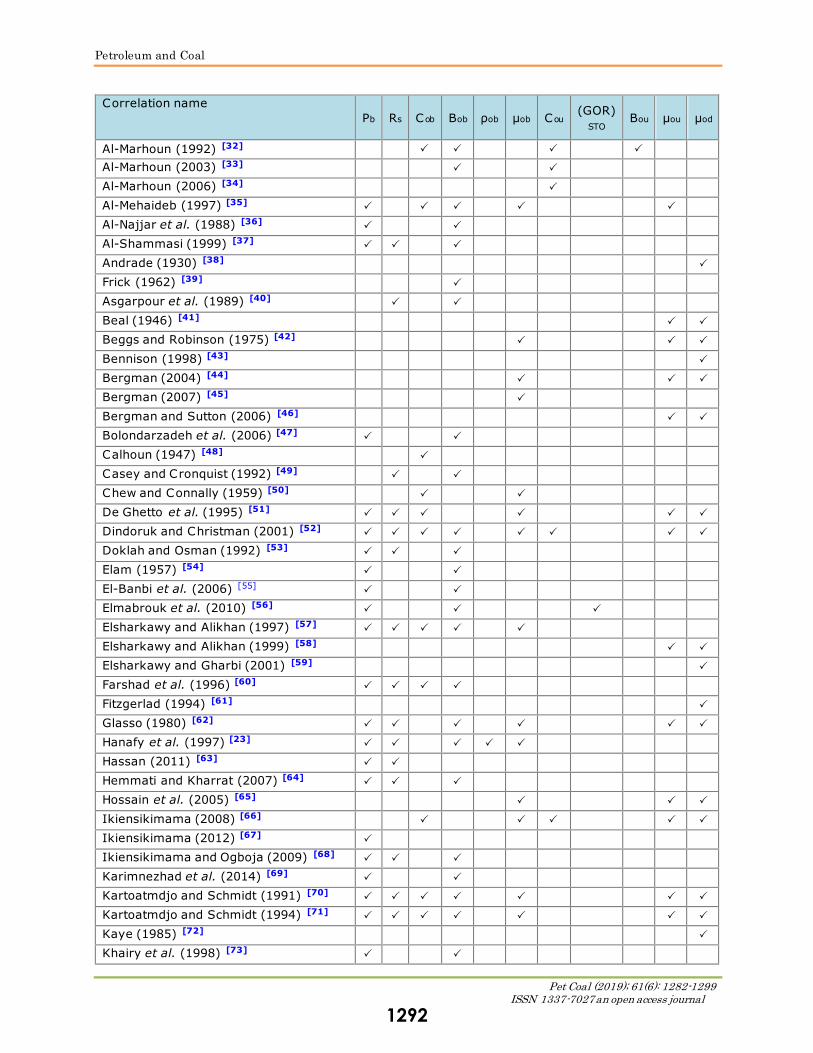
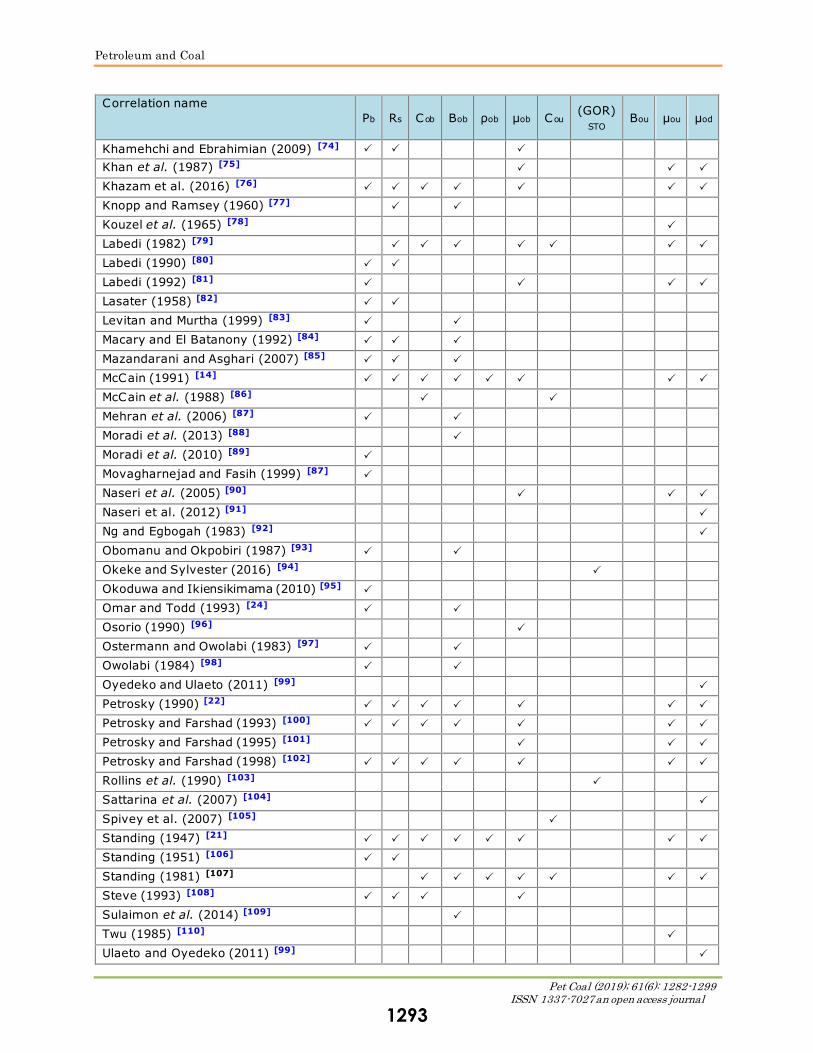
eral PVT properties. Table 3 gives a detailed survey of the published PVT correlations. Nu-merous software developed for prediction of PVT phase behavior and physical properties such as PVTp, PVTsim, Eclipse E100, Eclipse E300, Petrel, and Ecrin. A detailed description of this software will be described elsewhere.
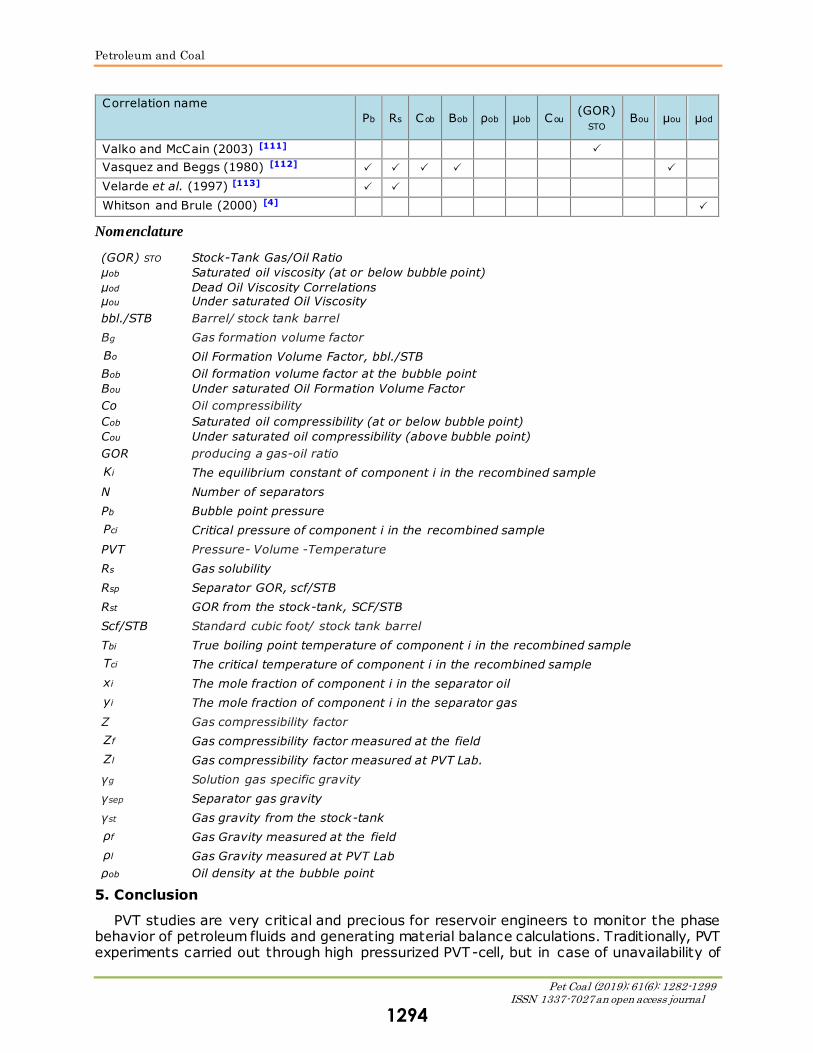
Table 3 Summary of the published PVT correlations
Correlation name
Pb Rs Cob Bob ρob µob Cou (GOR)
STO Bou µou µod
Abdul-Majeed and Salman (1988) [25]
Abdul-Majeed et al. (1990) [26]
Abu-Khamsim and Al-Marhoun (1991) [27]
Ahmed (1989) [28]
Ahmed (1992) [29]
Al-Khafaji et al. (1987) [30]
Al-Marhoun (1985) [31]
Al-Marhoun (1988) [20]
1291
Petroleum and Coal
Pet Coal (2019); 61(6): 1282-1299 ISSN 1337-7027 an open access journal
Correlation name
Pb Rs Cob Bob ρob µob Cou (GOR)
STO Bou µou µod
Al-Marhoun (1992) [32]
Al-Marhoun (2003) [33]
Al-Marhoun (2006) [34]
Al-Mehaideb (1997) [35]
Al-Najjar et al. (1988) [36]
Al-Shammasi (1999) [37]
Andrade (1930) [38]
Frick (1962) [39]
Asgarpour et al. (1989) [40]
Beal (1946) [41]
Beggs and Robinson (1975) [42]
Bennison (1998) [43]
Bergman (2004) [44]
Bergman (2007) [45]
Bergman and Sutton (2006) [46]
Bolondarzadeh et al. (2006) [47]
Calhoun (1947) [48]
Casey and Cronquist (1992) [49]
Chew and Connally (1959) [50]
De Ghetto et al. (1995) [51]
Dindoruk and Christman (2001) [52]
Doklah and Osman (1992) [53]
Elam (1957) [54]
El-Banbi et al. (2006) [55]
Elmabrouk et al. (2010) [56]
Elsharkawy and Alikhan (1997) [57]
Elsharkawy and Alikhan (1999) [58]
Elsharkawy and Gharbi (2001) [59]
Farshad et al. (1996) [60]
Fitzgerlad (1994) [61]
Glasso (1980) [62]
Hanafy et al. (1997) [23]
Hassan (2011) [63]
Hemmati and Kharrat (2007) [64]
Hossain et al. (2005) [65]
Ikiensikimama (2008) [66]
Ikiensikimama (2012) [67]
Ikiensikimama and Ogboja (2009) [68]
Karimnezhad et al. (2014) [69]
Kartoatmdjo and Schmidt (1991) [70]
Kartoatmdjo and Schmidt (1994) [71]
Kaye (1985) [72]
Khairy et al. (1998) [73]
1292
Petroleum and Coal
Pet Coal (2019); 61(6): 1282-1299 ISSN 1337-7027 an open access journal
Correlation name
Pb Rs Cob Bob ρob µob Cou (GOR)
STO Bou µou µod
Khamehchi and Ebrahimian (2009) [74]
Khan et al. (1987) [75]
Khazam et al. (2016) [76]
Knopp and Ramsey (1960) [77]
Kouzel et al. (1965) [78]
Labedi (1982) [79]
Labedi (1990) [80]
Labedi (1992) [81]
Lasater (1958) [82]
Levitan and Murtha (1999) [83]
Macary and El Batanony (1992) [84]
Mazandarani and Asghari (2007) [85]
McCain (1991) [14]
McCain et al. (1988) [86]
Mehran et al. (2006) [87]
Moradi et al. (2013) [88]
Moradi et al. (2010) [89]
Movagharnejad and Fasih (1999) [87]
Naseri et al. (2005) [90]
Naseri et al. (2012) [91]
Ng and Egbogah (1983) [92]
Obomanu and Okpobiri (1987) [93]
Okeke and Sylvester (2016) [94]
Okoduwa and Ikiensikimama (2010) [95]
Omar and Todd (1993) [24]
Osorio (1990) [96]
Ostermann and Owolabi (1983) [97]
Owolabi (1984) [98]
Oyedeko and Ulaeto (2011) [99]
Petrosky (1990) [22]
Petrosky and Farshad (1993) [100]
Petrosky and Farshad (1995) [101]
Petrosky and Farshad (1998) [102]
Rollins et al. (1990) [103]
Sattarina et al. (2007) [104]
Spivey et al. (2007) [105]
Standing (1947) [21]
Standing (1951) [106]
Standing (1981) [107]
Steve (1993) [108]
Sulaimon et al. (2014) [109]
Twu (1985) [110]
Ulaeto and Oyedeko (2011) [99]
1293
Petroleum and Coal
Pet Coal (2019); 61(6): 1282-1299 ISSN 1337-7027 an open access journal
Correlation name
Pb Rs Cob Bob ρob µob Cou (GOR)
STO Bou µou µod
Valko and McCain (2003) [111]
Vasquez and Beggs (1980) [112]
Velarde et al. (1997) [113]
Whitson and Brule (2000) [4]
Nomenclature
(GOR) STO Stock-Tank Gas/Oil Ratio
µob Saturated oil viscosity (at or below bubble point)
µod Dead Oil Viscosity Correlations µou Under saturated Oil Viscosity
bbl./STB Barrel/ stock tank barrel
Bg Gas formation volume factor
Bo Oil Formation Volume Factor, bbl./STB
Bob Oil formation volume factor at the bubble point
Bou Under saturated Oil Formation Volume Factor
Co Oil compressibility
Cob Saturated oil compressibility (at or below bubble point)
Cou Under saturated oil compressibility (above bubble point)
GOR producing a gas-oil ratio
Ki The equilibrium constant of component i in the recombined sample
N Number of separators
Pb Bubble point pressure
Pci Critical pressure of component i in the recombined sample
PVT Pressure- Volume -Temperature
Rs Gas solubility
Rsp Separator GOR, scf/STB
Rst GOR from the stock-tank, SCF/STB
Scf/STB Standard cubic foot/ stock tank barrel
Tbi True boiling point temperature of component i in the recombined sample
Tci The critical temperature of component i in the recombined sample
xi The mole fraction of component i in the separator oil
yi The mole fraction of component i in the separator gas
Z Gas compressibility factor
Zf Gas compressibility factor measured at the field
Zl Gas compressibility factor measured at PVT Lab.
γg Solution gas specific gravity
γsep Separator gas gravity
γst Gas gravity from the stock-tank
ρf Gas Gravity measured at the field
ρl Gas Gravity measured at PVT Lab
ρob Oil density at the bubble point
5. Conclusion
PVT studies are very critical and precious for reservoir engineers to monitor the phase behavior of petroleum fluids and generating material balance calculations. Traditionally, PVT experiments carried out through high pressurized PVT-cell, but in case of unavailability of
1294
Petroleum and Coal
Pet Coal (2019); 61(6): 1282-1299 ISSN 1337-7027 an open access journal
experimental facilities, we resort to empirically derived correlations. Several empirical corre-lations were published, depending on geographical provinces. In this chapter, a brief descrip-tion of the phase diagram for black and volatile oil was introduced as well as the importance of PVT properties in predicting petroleum fluid's behavior. Then PVT physical parameters and its meanings were briefly illustrated, and a summary of the input parameters in their predic-
tions as well as a survey of the published correlations was provided. Moreover, a detailed description of the experimental PVT procedures and tests were illustrated to help engineers and analysts in conducting such tests.
References
[1] Moses PL. Engineering applications of phase behavior of crude oil and condensate systems
(includes associated papers 16046, 16177, 16390, 16440, 19214 and 19893). Journal of Petroleum Technology 1986; 38(07): 715-23.
[2] Mukerji T, Jørstad A, Avseth P, Mavko G, Granli J. Mapping lithofacies and pore-fluid proba-
bilities in a North Sea reservoir: Seismic inversions and statistical rock physics. Geophysics 2001; 66(4): 988-1001.
[3] McCain Jr WD. Revised gas-oil ratio criteria key indicators of reservoir fluid type; Part 5.
Petroleum Engineer International;(United States) 1994; 66(4). [4] Whitson C, Brule M. Phase Behavior, Monograph Vol. 20 SPE Henry L. Doherty Series, Rich-
ardson, Texas 2000.
[5] Holditch S, Hill AD, Zhu D. Advanced Hydraulic Fracturing Technology for Unconventional Tight Gas Reservoirs. Texas Engineering Experiment Station; 2007.
[6] Danesh A. PVT and phase behaviour of petroleum reservoir fluids. Elsevier; 1998.
[7] Jarrahian A, Moghadasi J, Heidaryan E. Empirical estimating of black oils bubblepoint (satu-ration) pressure. Journal of Petroleum Science and Engineering 2015; 126: 69-77.
[8] Ahmed T. Reservoir engineering handbook. Elsevier; 2006.
[9] McCain WD, Spivey JP, Lenn CP. Petroleum reservoir fluid property correlations. PennWell Books; 2011.
[10] Di Primio R, Dieckmann V, Mills N. PVT and phase behaviour analysis in petroleum explora-
tion. Organic Geochemistry 1998; 29(1-3): 207-22. [11] Mansour E, Farag A, El-Dars F, Desouky S, Batanoni M, Mahmoud M. Predicting PVT properties
of Egyptian crude oils by a modified Soave–Redlich–Kowng equation of state. Egyptian Journal
of Petroleum 2013; 22(1): 137-48. [12] El-hoshoudy A, Farag A, Ali O, El-Batanoney M, Desouky S, Ramzi M. New correlations for
prediction of viscosity and density of Egyptian oil reservoirs. Fuel 2013; 112: 277-82.
[13] El-Hoshoudy A, Desouky S, Betiha M, Abdelraouf S, Elaily M. Mathematical correlation pre-dicting stock tank oil density for Egyptian crude oils at standard conditions. International
Journal of Oil, Gas and Coal Engineering 2014; 2(4): 55-8.
[14] McCain Jr W. Reservoir-Fluid Property Correlations-State of the Art (includes associated pa-pers 23583 and 23594). SPE Reservoir Engineering 1991; 6(02): 266-72.
[15] El-hoshoudy AN, Desouki SM. An Empirical Correlation for Estimation of Formation Volume
Factor of Gas Condensate Reservoirs at Separator Conditions. Petroleum & Petrochemical Engineering Journal 2018; 2(2): 000147.
[16] El-hoshoudy AN. Numerical Prediction of Oil Formation Volume Factor at Bubble Point for
Black and Volatile Oil Reservoirs Using Non-Linear Regression Models. Petroleum & Petro-chemical Engineering Journal 2018; 2(2): 000145.
[17] El-hoshoudy AN, Gomaa S, Desouki SM. Prediction of Dew Point Pressure in Gas Condensate
Reservoirs Based On a Combination of Gene Expression Programming (GEP) and Multiple Regression Analysis. Petroleum & Petrochemical Engineering Journal 2018; 2(5): 000163.
[18] Vazquez M, Beggs HD. Correlations for fluid physical property prediction. SPE Annual Fall
Technical Conference and Exhibition. Society of Petroleum Engineers; 1977. [19] Starling KE. Fluid thermodynamic properties for light petroleum systems. Gulf Pub. Co.; 1973.
[20] Al-Marhoun MA. PVT correlations for Middle East crude oils. Journal of Petroleum Technology
1988; 40(05): 650-66. [21] Standing M. A pressure-volume-temperature correlation for mixtures of California oils and
gases. Drilling and Production Practice. American Petroleum Institute; 1947.
[22] Petrosky GE. PVT correlations for gulf of mexico crude oils. University of Southwestern Loui-siana; 1990.
1295
Petroleum and Coal
Pet Coal (2019); 61(6): 1282-1299 ISSN 1337-7027 an open access journal
[23] Hanafy H, Macary S, ElNady Y, Bayomi A, El Batanony M. Empirical PVT correlations applied to Egyptian crude oils exemplify significance of using regional correlations. International Sym-
posium on Oilfield Chemistry. Society of Petroleum Engineers; 1997.
[24] Omar M, Todd A. Development of new modified black oil correlations for Malaysian crudes. SPE Asia Pacific oil and gas conference. Society of Petroleum Engineers; 1993.
[25] Abdul-Majeed GH, Salman NH. An empirical correlation for oil FVF prediction. Journal of Ca-
nadian Petroleum Technology 1988; 27(06). [26] Abdul-Majeed GH, Kattan RR, Salman NH. New correlation for estimating the viscosity of
undersaturated crude oils. Journal of Canadian Petroleum Technology 1990;29(03).
[27] Abu-Khamsin SA, Al-Marhoun MA. Development of a New Correlation for Bubble-point Oil Viscosity. Arabian J of Science and Engineering 1991; 16: 99-106.
[28] Ahmed T. Hydrocarbon Phase Behavior (Contributions in Petroleum Geology and Engineer-
ing). Gulf Publishing Co; 1989. [29] Ahmed T. Oil Recovery Mechanisms and the Material Balance Equation Reservoir Engineering
Handbook. Gulf Prof Publ 2010: 733-809.
[30] Al-Khafaji AH, Abdul-Majeed GH, Hassoon SF. Viscosity correlation for dead, live and under-saturated crude oils. J Pet Res 1987; 6(2): 1-16.
[31] Al-Marhoun M. Pressure-volume-temperature correlations for Saudi crude oils. Univ. of Pe-
troleum and Minerals; 1985. [32] Al-Marhoun MA. New Correlation for formation Volume Factor of oil and gas Mixtures. Journal
of Canadian Petroleum Technology 1992; 31(3): 22-6.
[33] Al-Marhoun MA. The coefficient of isothermal compressibility of black oils. Middle East Oil Show. Society of Petroleum Engineers; 2003.
[34] Al-Marhoun MA. A New correlation for undersaturated isothermal oil compressibility. 2006.
[35] AL-MEHAIDEB R. Improved PVT correlations for UAE offshore crudes. Journal of The Japan Petroleum Institute 1997; 40(3): 232-5.
[36] Al-Najjar H, Al-Soof N, Al-Khalisy K. Correlations for bubble-point pressures, gas oil ratios
and formation volume factors for Iraqi crude oils. Journal of Petroleum Research (June 1988) 1988; 13.
[37] Al-Shammasi A. Bubble point pressure and oil formation volume factor correlations. Middle
East Oil show and conference. Society of Petroleum Engineers; 1999. [38] Andrade EdC. The viscosity of liquids. Nature Publishing Group; 1930.
[39] Frick TC. Petroleum Production Handbook. McGraw-Hill; 1962.
[40] Asgarpour S, McLauchlin L, Wong D, Cheung V. Pressure-volume-temperature correlations for Western Canadian gases and oils. Journal of Canadian Petroleum Technology 1989; 28(04).
[41] Beal C. The viscosity of air, water, natural gas, crude oil and its associated gases at oil field
temperatures and pressures. Transactions of the AIME 1946; 165(01):9 4-115.
[42] Beggs HD, Robinson J. Estimating the viscosity of crude oil systems. Journal of Petroleum technology 1975; 27(09): 1,140-1,1.
[43] Bennison T. Prediction of heavy oil viscosity. Presented at the IBC Heavy Oil Field Develop-
ment Conference. 2. 1998:4. [44] Bergman D. Don’t forget viscosity. Petroleum Technology Transfer Council 2nd Annual Res-
ervoir Engineering Symposium, Lafayette, Louisiana. 28. 2004.
[45] Bergman DF, Sutton RP. An update to viscosity correlations for gas-saturated crude oils. SPE Annual Technical Conference and Exhibition. Society of Petroleum Engineers; 2007.
[46] Sutton RP, Bergman DF. Undersaturated oil viscosity correlation for adverse conditions. SPE
Annual Technical Conference and Exhibition. Society of Petroleum Engineers; 2006. [47] Bolondarzadeh A, Hashemi S, Solgani B. The new PVT generated correlations of Iranian oil
properties. 4th Iranian Petroleum Engineering Student conference. 2006.
[48] Calhoun Jr J. New methods for determining permeability. The Petroleum Engineer, February 1947: 103-8.
[49] Casey J. Estimate GOR and FVF using dimensionless PVT analysis. World Oil;(United States)
1992; 213(11). [50] Chew J-N, Connally Jr CA. A viscosity correlation for gas-saturated crude oils. 1959.
[51] De Ghetto G, Paone F, Villa M. Pressure-volume-temperature correlations for heavy and extra
heavy oils. SPE International Heavy Oil Symposium. Society of Petroleum Engineers; 1995. [52] Dindoruk B, Christman PG. PVT properties and viscosity correlations for Gulf of Mexico oils.
SPE annual technical conference and exhibition. Society of Petroleum Engineers; 2001.
[53] Dokla M, Osman M. Correlation of PVT Properties for UAE Crudes (includes associated papers 26135 and 26316). SPE Formation Evaluation 1992; 7(01): 41-6.
1296
Petroleum and Coal
Pet Coal (2019); 61(6): 1282-1299 ISSN 1337-7027 an open access journal
[54] Elam FM. Prediction of Bubble Point Pressures and Formation Volume Factors from Field Data. University of Texas; 1957.
[55] El-Banbi AH, Fattah KA, Sayyouh H. New modified black-oil PVT correlations for Gas conden-
sate and volatile oil fluids. SPE Annual Technical Conference and Exhibition. Society of Petro-leum Engineers; 2006.
[56] Elmabrouk SK, Zekri AY, Shirif EE. Prediction of Bubblepoint Pressure and Bubblepoint Oil
Formation Volume Factor in the Absence of PVT Analysis. SPE Latin American and Caribbean Petroleum Engineering Conference. Society of Petroleum Engineers; 2010.
[57] Elsharkawy AM, Alikhan AA. Correlations for predicting solution gas/oil ratio, oil formation
volume factor, and undersaturated oil compressibility. Journal of Petroleum Science and En-gineering 1997;17(3-4):291-302.
[58] Elsharkawy A, Alikhan A. Models for predicting the viscosity of Middle East crude oils. Fuel
1999;78(8):891-903. [59] Elsharkwy A, Gharbi R. Comparing classical and neural regression techniques in modeling
crude oil viscosity. Advances in Engineering Software 2001; 32(3): 215-24.
[60] Frashad F, LeBlanc J, Garber J, Osorio J. Empirical PVT correlations for Colombian crude oils. SPE Latin America/Caribbean petroleum engineering conference. Society of Petroleum Engi-
neers; 1996.
[61] Fitzgerald D. A Predictive Method for Estimating the Viscosity of Undefined Hydrocarbon Liquid Mixtures. Pennsylvania State University, State College, PA, United States 1994.
[62] Glaso O. Generalized pressure-volume-temperature correlations. Journal of Petroleum Tech-
nology 1980; 32(05): 785-95. [63] Hassan OF. Correlation for solution gas-oil ratio of Iraqi oils at pressures below the bubble
point pressure. Iraqi Journal of Chemical and Petroleum Engineering 2011;12(2):1-8.
[64] Hemmati MN, Kharrat R. A correlation approach for prediction of crude oil PVT properties. SPE Middle East Oil and Gas Show and Conference. Society of Petroleum Engineers; 2007.
[65] Hossain MS, Sarica C, Zhang H-Q, Rhyne L, Greenhill K. Assessment and development of
heavy oil viscosity correlations. SPE International Thermal Operations and Heavy Oil Sympo-sium. Society of Petroleum Engineers; 2005.
[66] Ikiensikimama S, Egbe T, Effiong E, Ogboja O. New Screening Technique for PVT Correlations
as Applied to the Niger Delta Crude. Refereed Proceedings 2008. [67] Ikiensikimama S, Azubuike I. Modeling approach for Niger-Delta oil formation volume factor
prediction using artificial neural network. Nigeria Annual International Conference and Exhi-
bition. Society of Petroleum Engineers; 2012. [68] Ikiensikimama SS, Ogboja O. New bubblepoint pressure empirical PVT correlation. Nigeria
Annual International Conference and Exhibition. Society of Petroleum Engineers; 2009.
[69] Karimnezhad M, Heidarian M, Kamari M, Jalalifar H. A new empirical correlation for estimating
bubble point oil formation volume factor. Journal of Natural Gas Science and Engineering 2014; 18: 329-35.
[70] Kartoatmodjo TR, Schmidt Z. New correlations for crude oil physical properties. 1991.
[71] Kartoatmodjo T, Schmidt Z. Large data bank improves crude physical property correlations. Oil and Gas Journal; (United States) 1994; 92(27).
[72] Kaye S. Offshore California viscosity correlations. COFRC, TS85000940 1985.
[73] Khairy M, El-Tayeb S, Hamdallah M. PVT correlations developed for Egyptian crudes. Oil and Gas Journal 1998;96(18).
[74] Khamehchi E, Rashidi F, Rasouli H, Ebrahimian A. Novel empirical correlations for estimation
of bubble point pressure, saturated viscosity and gas solubility of crude oils. Petroleum Sci-ence 2009; 6(1): 86-90.
[75] Khan S, Al-Marhoun M, Duffuaa S, Abu-Khamsin S. Viscosity correlations for Saudi Arabian
crude oils. Middle East Oil Show. Society of Petroleum Engineers; 1987. [76] Khazam M, Alkhaboli M, Shlak M. New PVT Correlations for Libyan Crudes.
[77] Knopp C, Ramsey L. Correlation of oil formation volume factor and solution gas-oil ratio.
Journal of Petroleum Technology 1960;12(08):27-9. [78] Kouzel B. How pressure affects liquid viscosity. Hydrocarb Process (March 1965) 1965; 120.
[79] Labedi RM. PVT correlations of the African crudes. Colorado School of Mines; 1982.
[80] Labedi RM. Use of production data to estimate the saturation pressure, solution GOR, and chemical composition of reservoir fluids. SPE Latin America petroleum engineering confer-
ence. Society of Petroleum Engineers; 1990.
[81] Labedi R. Improved correlations for predicting the viscosity of light crudes. Journal of Petro-leum Science and Engineering 1992; 8(3): 221-34.
1297
Petroleum and Coal
Pet Coal (2019); 61(6): 1282-1299 ISSN 1337-7027 an open access journal
[82] Lasater J. Bubble point pressure correlation. Journal of Petroleum Technology 1958; 10(05): 65-7. [83] Levitan LL, Murtha M. New correlations estimate PH, FVF. Oil & gas journal 1999; 97(10).
[84] Macary S, El-Batanoney M. Derivation of PVT correlations for the Gulf of Suez crude oils.
Journal of The Japan Petroleum Institute 1993; 36(6): 472-8. [85] Mazandarani MT, Asghari SM. Correlations for predicting solution gas-oil ratio, bubblepoint
pressure and oil formation volume factor at bubblepoint of Iran crude oils. European Congress
of Chemical Engineering (ECCE-6). 2007: 16-20. [86] McCain Jr WD, Rollins JB, Lanzi AJV. The coefficient of isothermal compressibility of black oils
at pressures below the bubblepoint. SPE formation evaluation 1988; 3(03): 659-62.
[87] Mehran F, Movagharnejad K, Didanloo A. New correlation for estimation of formation vilume factor and bubblepoint pressure for Iranian oil Fields. 1st Iranian Pet. Eng. Conference. 2006.
[88] Moradi B, Malekzadeh E, Mohammad A, Awang M, Moradie P. New Oil Formation Volume
Factor Empirical Correlation for Middle East Crude Oils. International Journal of Petroleum and Geoscience Engineering (IJPGE) 2013: 12-23.
[89] Moradi B, Malekzadeh E, Amani M, Boukadi FH, Kharrat R. Bubble point pressure empirical
correlation. Trinidad and Tobago Energy Resources Conference. Society of Petroleum Engi-neers; 2010.
[90] Naseri A, Nikazar M, Dehghani SM. A correlation approach for prediction of crude oil viscosi-
ties. Journal of Petroleum Science and Engineering 2005; 47(3-4): 163-74. [91] Naseri A, Yousefi S, Sanaei A, Gharesheikhlou A. A neural network model and an updated
correlation for estimation of dead crude oil viscosity. Brazilian journal of petroleum and gas
2012; 6(1). [92] Ng J, Egbogah E. An improved temperature-viscosity correlation for crude oil systems. Annual
Technical Meeting. Petroleum Society of Canada; 1983.
[93] Obomanu D, Okpobiri G. Correlating the PVT properties of Nigerian crudes. Journal of energy resources technology 1987; 109(4): 214-7.
[94] Okeke H, Sylvester O. Improved Correlation for Predicting Stock Tank Gas-Oil Ratio in Niger
Delta. SPE Nigeria Annual International Conference and Exhibition. Society of Petroleum En-gineers; 2016.
[95] Okoduwa I, Ikiensikimama S. Bubble point pressure correlations for Niger Delta crude oils.
Nigeria Annual International Conference and Exhibition. Society of Petroleum Engineers; 2010.
[96] Osorio JG. Empirical PVT correlations for Colombian crude oil. University of Southwestern
Louisiana. 1990.; 1990. [97] Ostermann R, Owolabi O. Correlations for the reservoir fluid properties of Alaskan crudes.
SPE California Regional Meeting. Society of Petroleum Engineers; 1983.
[98] Owolabi OO. Reservoir fluid properties of Alaskan crudes. University of Alaska, Fairbanks;
1984. [99] Oyedeko KF, Ulaeto UW. Predicting the Dead Oil Viscosity of Reservoir Fluids: a case study of
the Niger Delta. Journal of Energy Technology and Policy 2011.
[100] Petrosky Jr G, Farshad F. Pressure-volume-temperature correlations for Gulf of Mexico crude oils. SPE annual technical conference and exhibition. Society of Petroleum Engineers; 1993.
[101] Petrosky Jr G, Farshad F. Viscosity correlations for Gulf of Mexico crude oils. SPE Production
Operations Symposium. Society of Petroleum Engineers; 1995. [102] Petrosky Jr G, Farshad F. Pressure-Volume-Temperature Correlations for Gulf of Mexico Crude
Oils. SPEREE 1 (5): 416–420. SPE-51395-PA. DOI: 10.2118/51395-PA; 1998.
[103] Rollins JB, McCain Jr WD, Creeger TJ. Estimation of solution GOR of black oils. Journal of petroleum technology 1990; 42(01): 92-4.
[104] Sattarin M, Modarresi H, Bayat M, Teymori M. New viscosity correlations for dead crude oils.
Petroleum & Coal 2007; 49(2): 33-9. [105] Spivey JP, Valkó PP, McCain WD. Applications of the coefficient of isothermal compressibility
to various reservoir situations with new correlations for each situation. SPE Reservoir Evalu-
ation & Engineering 2007; 10(01): 43-9. [106] Standing MB. Volumetric and phase behavior of oil field hydrocarbon systems: PVT for engi-
neers. California Research Corp.; 1951.
[107] Standing M. Volumetric and Phase Behavior of Oil Field Hidrocarbon Systems. SPE, Richard-son, Texas 1981.
[108] Sim SSK. Pressure-volume-temperature correlations for crude oils from the Illinois Basin.
Illinois petroleum no 140 1993.
1298
Petroleum and Coal
Pet Coal (2019); 61(6): 1282-1299 ISSN 1337-7027 an open access journal
[109] Sulaimon A, Ramli N, Adeyemi B, Saaid I. New correlation for oil formation volume factor. SPE Nigeria Annual International Conference and Exhibition. Society of Petroleum Engineers;
2014.
[110] Twu CH. Internally consistent correlation for predicting liquid viscosities of petroleum frac-tions. Industrial & Engineering Chemistry Process Design and Development 1985; 24(4):
1287-93.
[111] Valko P, McCain Jr W. Reservoir oil bubblepoint pressures revisited; solution gas–oil ratios and surface gas specific gravities. Journal of Petroleum Science and Engineering 2003; 37(3-4):
153-69.
[112] Vazquez M, Beggs H. Correlations for Fluid Physical Property Prediction. JPT 32 (6): 968–970. SPE-6719-PA. DOI: 10.2118/6719-PA; 1980.
[113] Velarde J, Blasingame T, McCain Jr W. Correlation of black oil properties at pressures below
bubble point pressure-A new approach. Annual Technical Meeting. Petroleum Society of Can-ada; 1997.
To whom correspondence should be addressed: Dr. A. N. El-hoshoudy, Production Department, Egyptian Petroleum
Research Institute, Naser City, Cairo, Egypt, E-mail [email protected]
1299