article open access - petroleum and coal
TRANSCRIPT
Petroleum and Coal
Pet Coal (2017); 59(5): 620-640 ISSN 1337-7027 an open access journal
Article Open Access
THREE DIMENSIONAL SEISMIC, WELL LOG AND STRUCTURAL ANALYSIS OF
“IGBOBI” FIELD, OFFSHORE NIGER DELTA
O. S. Hammed1, M. O.Awoyemi2, W. N. Igboama1, D. O. Ebun3, J. O. Fatoba5, O. T. Olurin6, M. Aroyehun5, G. O.Badmus4, A. B. Arogundade2, and S. C. Falade2 1 Department of Physics, Federal University, Oye-Ekiti, Nigeria 2 Department of Physics, Obafemi Awolowo University, Ile-Ife, Nigeria 3 Department of Physical Science, Ondo State University of Science and Technology, Okitipupa, Nigeria 4 Department of Mathematics and Physics, Afe-babalola University, Ado-Ekiti 5 Department of Geophysics, Federal University, Oye-Ekiti, Nigeria 6 Department of Physics, Federal University of Agriculture, Abeokuta, Nigeria
Received June 18, 2017; Accepted September 30, 2017
Abstract
The search for Hydrocarbon as the main energy source for the development of the world economy is based on the experience from sandstone environment. Therefore, it is imperative to evaluate the targets (pay zone) within the available fields to determine the extent of the known reservoirs for
assessment and development. To achieve this, three dimensional seismic, well logs and structural interpretations of Igbobi Field in the Niger Delta were carried out to characterise the reservoir. Data used were well logs, seismic section and the structural map of the sand tops. The Interactive Petrel Software was used in the Interpretation. An integration of well and seismic data in conjunction with time-depth relationship was employed to identify where the hydrocarbon bearing sands from well, post on the seismic lines. Good tie was obtained for well to seismic data. The depth converted structural maps correlated with the time structural maps. The identified prospects were viewed and evaluation
of tested traps was carried out to characterise the reservoir. The correlating zones where hydrocarbon
bearing sands from wells, post on the seismic lines were identified. It is therefore recommended that Igbobi field is prospective and should proceed to further stage.
Keywords: Hydrocarbon Volume; 3D Seismic; sand tops; structural interpretation; well logs.
1. Introduction
The advantage of using wells and seismic instead of just wells alone, is that the seismic
data can be used to interpolate and extrapolate between and beyond sparse well control. Seis-
mic data encompasses a wide spectrum of information from 2-D, 3-D or 4-D surveys and
vertical seismic profile (VSP) studies. These data can be integrated to overcome the limitations
inherent in any single data domain. For example, 3-D seismic data can sample a large aerial
extent of a particular reservoir, but it provides only limited vertical resolution. This research
will reveal the potential of combining seismic reflection, structural maps and wire line logs in
the estimation of reservoir, since seismic sections have good lateral resolution but poor vertical
resolution. And the wire‐line logs on the other hand have good vertical resolution but poor
lateral resolution.
The introduction of the 3D seismic revolution has made the use of amplitudes an integral
part of seismic interpretation and has allowed more valuable geological information to be
discerned as seismic attributes (i.e. phase, amplitude, instantaneous frequency) [1]. A seismic
attribute is any measure of seismic data that helps to visually enhance or quantify features of
interpretation interest. A good seismic attribute is either directly sensitive to the desired geo-
logic feature or reservoir property of interest, or allows us to define the structural or deposi-
620
Petroleum and Coal
Pet Coal (2017); 59(5): 620-640 ISSN 1337-7027 an open access journal
tional environment and thereby enables us to infer some features or properties of interest.
Attributes can be defined as all parameters contained in seismic data. This “boom” of attributes
came about especially after the introduction of coloured seismic sections by [2], followed by
the work of Taner et al. [3] on complex seismic trace analysis, and lastly by the generalization
of 3D seismic data and interpretation workstations [3-5]. Seismic attributes form an integral
part of qualitative interpretative tool that facilitates structural and stratigraphic (channels, pinch
out, meanders) interpretation as well as offer clues to lithology type and fluid content
estimation with a potential benefit of detailed reservoir characterization [6]. For instance, fault
structures which have been classified into seismically resolvable and sub-seismic scale (subtle)
faults [7] can be interpreted more effectively with the aid of seismic attribute.
Surface and volume seismic attributes can be used in every stage of the hydrocarbon
reservoir modelling process to reduce uncertainty and complement the available data. Inter-
pretation workflows for structural geology, stratigraphy analysis and rock/pore fluid properties
based on attributes derived from processed seismic data, are now daily routines in oil and gas
companies [5].
2. Geology of Niger Delta and petroleum history
The geology of the Niger delta has been extensively discussed by several authors like [8-10].
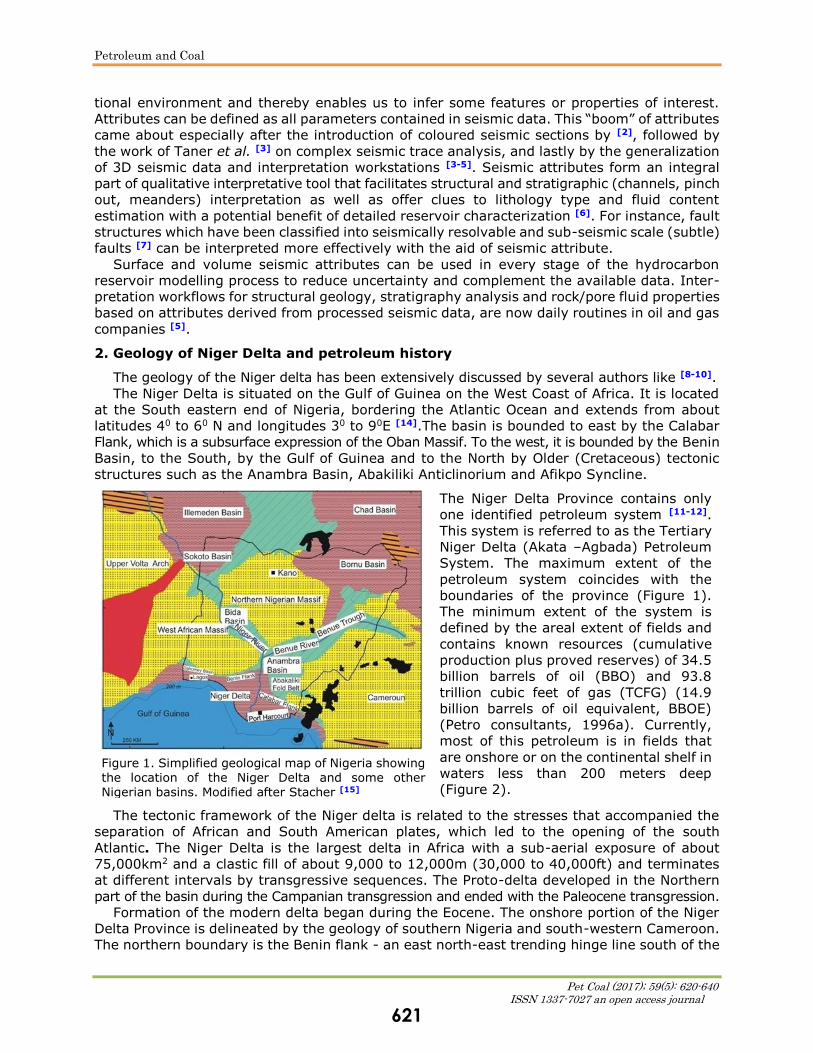
The Niger Delta is situated on the Gulf of Guinea on the West Coast of Africa. It is located
at the South eastern end of Nigeria, bordering the Atlantic Ocean and extends from about
latitudes 40 to 60 N and longitudes 30 to 90E [14].The basin is bounded to east by the Calabar
Flank, which is a subsurface expression of the Oban Massif. To the west, it is bounded by the Benin
Basin, to the South, by the Gulf of Guinea and to the North by Older (Cretaceous) tectonic
structures such as the Anambra Basin, Abakiliki Anticlinorium and Afikpo Syncline.
Figure 1. Simplified geological map of Nigeria showing the location of the Niger Delta and some other Nigerian basins. Modified after Stacher [15]
The Niger Delta Province contains only
one identified petroleum system [11-12].
This system is referred to as the Tertiary
Niger Delta (Akata –Agbada) Petroleum
System. The maximum extent of the
petroleum system coincides with the
boundaries of the province (Figure 1).
The minimum extent of the system is
defined by the areal extent of fields and
contains known resources (cumulative
production plus proved reserves) of 34.5
billion barrels of oil (BBO) and 93.8
trillion cubic feet of gas (TCFG) (14.9
billion barrels of oil equivalent, BBOE)
(Petro consultants, 1996a). Currently,
most of this petroleum is in fields that
are onshore or on the continental shelf in
waters less than 200 meters deep
(Figure 2).
The tectonic framework of the Niger delta is related to the stresses that accompanied the
separation of African and South American plates, which led to the opening of the south
Atlantic. The Niger Delta is the largest delta in Africa with a sub-aerial exposure of about
75,000km2 and a clastic fill of about 9,000 to 12,000m (30,000 to 40,000ft) and terminates
at different intervals by transgressive sequences. The Proto-delta developed in the Northern
part of the basin during the Campanian transgression and ended with the Paleocene transgression.
Formation of the modern delta began during the Eocene. The onshore portion of the Niger
Delta Province is delineated by the geology of southern Nigeria and south-western Cameroon.
The northern boundary is the Benin flank - an east north-east trending hinge line south of the
621
Petroleum and Coal
Pet Coal (2017); 59(5): 620-640 ISSN 1337-7027 an open access journal
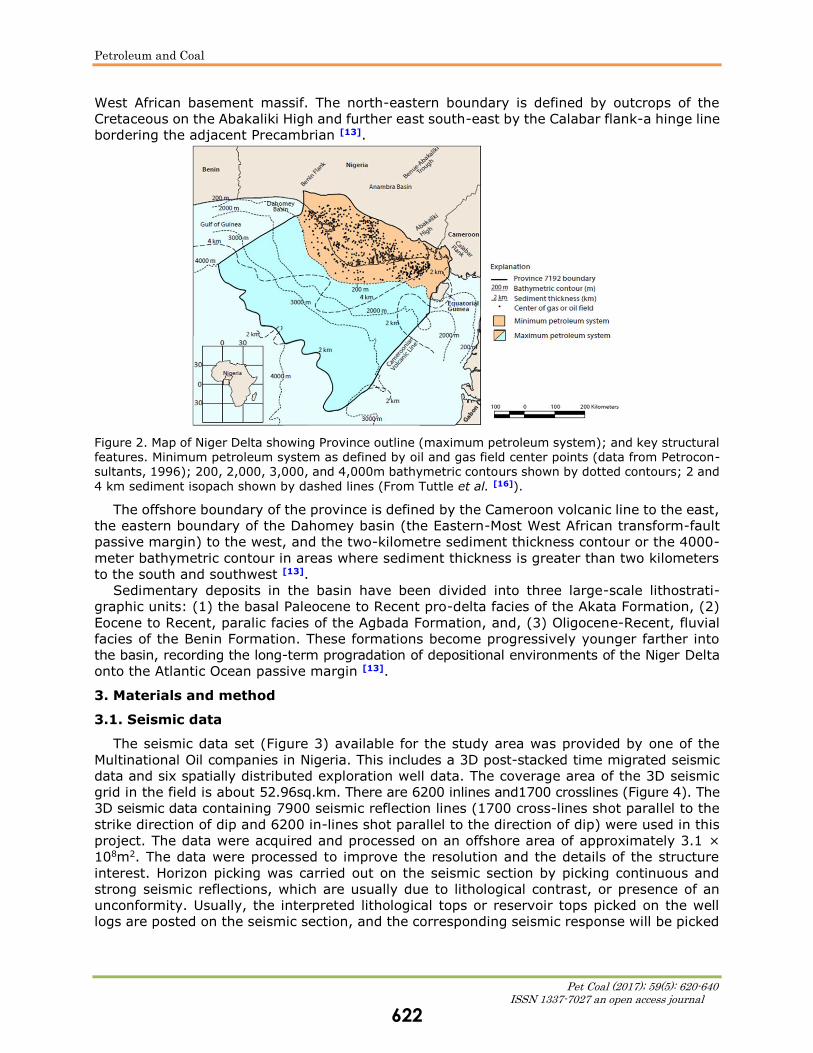
West African basement massif. The north-eastern boundary is defined by outcrops of the
Cretaceous on the Abakaliki High and further east south-east by the Calabar flank-a hinge line
bordering the adjacent Precambrian [13].
Figure 2. Map of Niger Delta showing Province outline (maximum petroleum system); and key structural features. Minimum petroleum system as defined by oil and gas field center points (data from Petrocon-sultants, 1996); 200, 2,000, 3,000, and 4,000m bathymetric contours shown by dotted contours; 2 and
4 km sediment isopach shown by dashed lines (From Tuttle et al. [16]).
The offshore boundary of the province is defined by the Cameroon volcanic line to the east,
the eastern boundary of the Dahomey basin (the Eastern-Most West African transform-fault
passive margin) to the west, and the two-kilometre sediment thickness contour or the 4000-
meter bathymetric contour in areas where sediment thickness is greater than two kilometers
to the south and southwest [13].
Sedimentary deposits in the basin have been divided into three large-scale lithostrati-
graphic units: (1) the basal Paleocene to Recent pro-delta facies of the Akata Formation, (2)
Eocene to Recent, paralic facies of the Agbada Formation, and, (3) Oligocene-Recent, fluvial
facies of the Benin Formation. These formations become progressively younger farther into
the basin, recording the long-term progradation of depositional environments of the Niger Delta
onto the Atlantic Ocean passive margin [13].
3. Materials and method
3.1. Seismic data
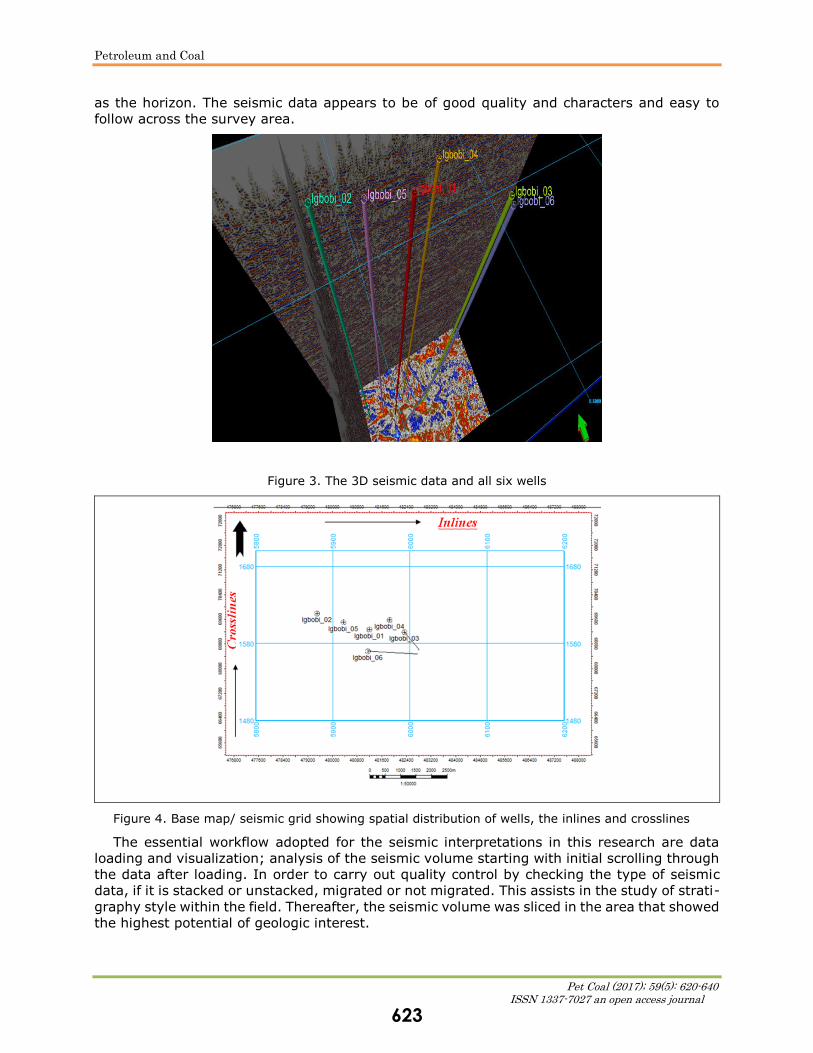
The seismic data set (Figure 3) available for the study area was provided by one of the
Multinational Oil companies in Nigeria. This includes a 3D post-stacked time migrated seismic
data and six spatially distributed exploration well data. The coverage area of the 3D seismic
grid in the field is about 52.96sq.km. There are 6200 inlines and1700 crosslines (Figure 4). The
3D seismic data containing 7900 seismic reflection lines (1700 cross-lines shot parallel to the
strike direction of dip and 6200 in-lines shot parallel to the direction of dip) were used in this
project. The data were acquired and processed on an offshore area of approximately 3.1 ×
108m2. The data were processed to improve the resolution and the details of the structure
interest. Horizon picking was carried out on the seismic section by picking continuous and
strong seismic reflections, which are usually due to lithological contrast, or presence of an
unconformity. Usually, the interpreted lithological tops or reservoir tops picked on the well
logs are posted on the seismic section, and the corresponding seismic response will be picked
622
Petroleum and Coal
Pet Coal (2017); 59(5): 620-640 ISSN 1337-7027 an open access journal
as the horizon. The seismic data appears to be of good quality and characters and easy to
follow across the survey area.
Figure 3. The 3D seismic data and all six wells
Figure 4. Base map/ seismic grid showing spatial distribution of wells, the inlines and crosslines
The essential workflow adopted for the seismic interpretations in this research are data
loading and visualization; analysis of the seismic volume starting with initial scrolling through
the data after loading. In order to carry out quality control by checking the type of seismic
data, if it is stacked or unstacked, migrated or not migrated. This assists in the study of strati-
graphy style within the field. Thereafter, the seismic volume was sliced in the area that showed
the highest potential of geologic interest.
623
Petroleum and Coal
Pet Coal (2017); 59(5): 620-640 ISSN 1337-7027 an open access journal
Attribute extraction was carried out on the time slices to construct attribute extraction maps
for the visualization of stratigraphic and geomorphological features that may be diagnostic of
specific areas of prospective interests.
3.2. Well LOG data
The data used in the study included digital suites of well logs which were imported into the
interactive Petrel’s software, seismic sections, base map and structure map of the study area.
Out of six wells explored, wells Igbobi_1 to Igbobi_4 have composite logs suites including
gamma ray, resistivity, sonic, neutron density logs and checkshot data. Wells Igbobi_3 and
Igbobi_6 have deviated data. The seismic sections highlighted the fault enclosing the reservoir
brought about by direct hydrocarbon indicators while revealing the horizons tracked on the
reflections across the field. The relevant wire line log signatures and cut-offs were employed
to identify the hydrocarbon-bearing reservoirs.
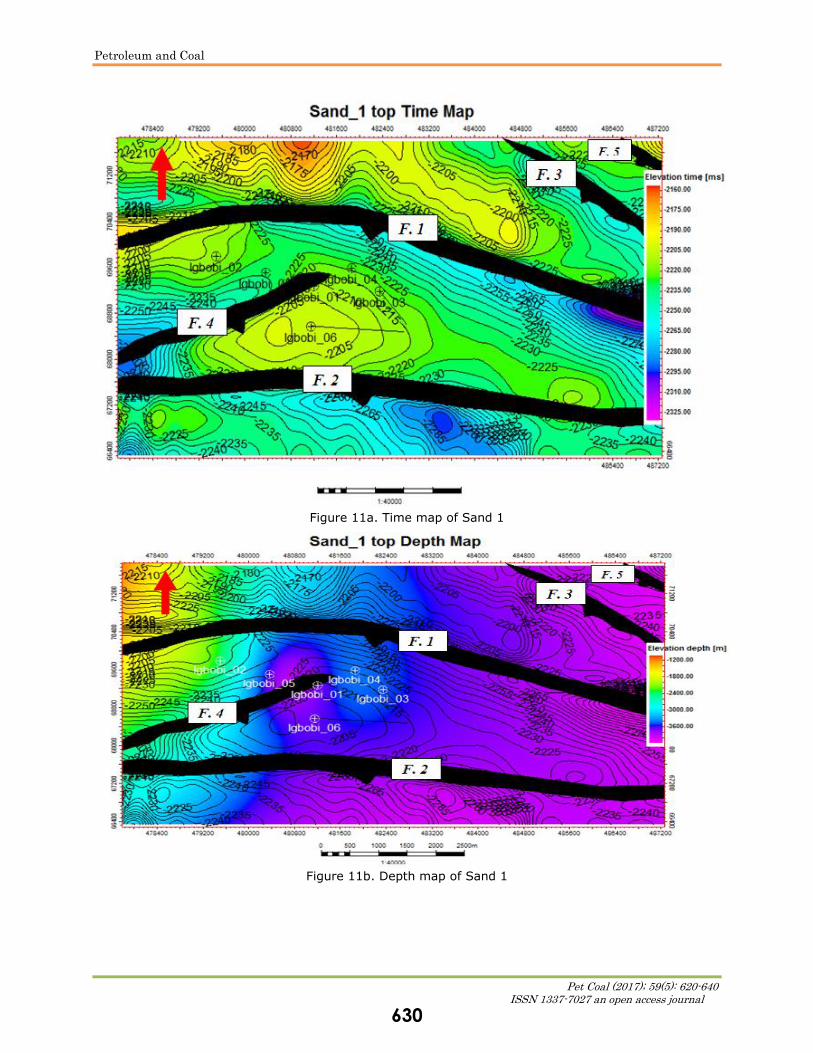
3.3. Generation of time and depth map
The mapped horizons in time were depth converted to depth map by the time-depth
relationship using a velocity function and is presented in figures 11-13. The identified pay
zones on seismic were mapped throughout the seismic cube on both inline and cross lines.
The mapped horizons were named Sand 1 to Sand 5 as identified on wells. Seismic mis-tie
was carefully observed and corrected before conversion into time maps.
The time maps were converted to depth map with the time depth relationship using a
velocity function and then compared with the depth map. Contour patterns were consistent
which indicates that the velocity model utilised is applicable. Fault polygons were digitised and
posted on both time and depth maps.
4. Results and discussion
4.1. Seismic interpretation
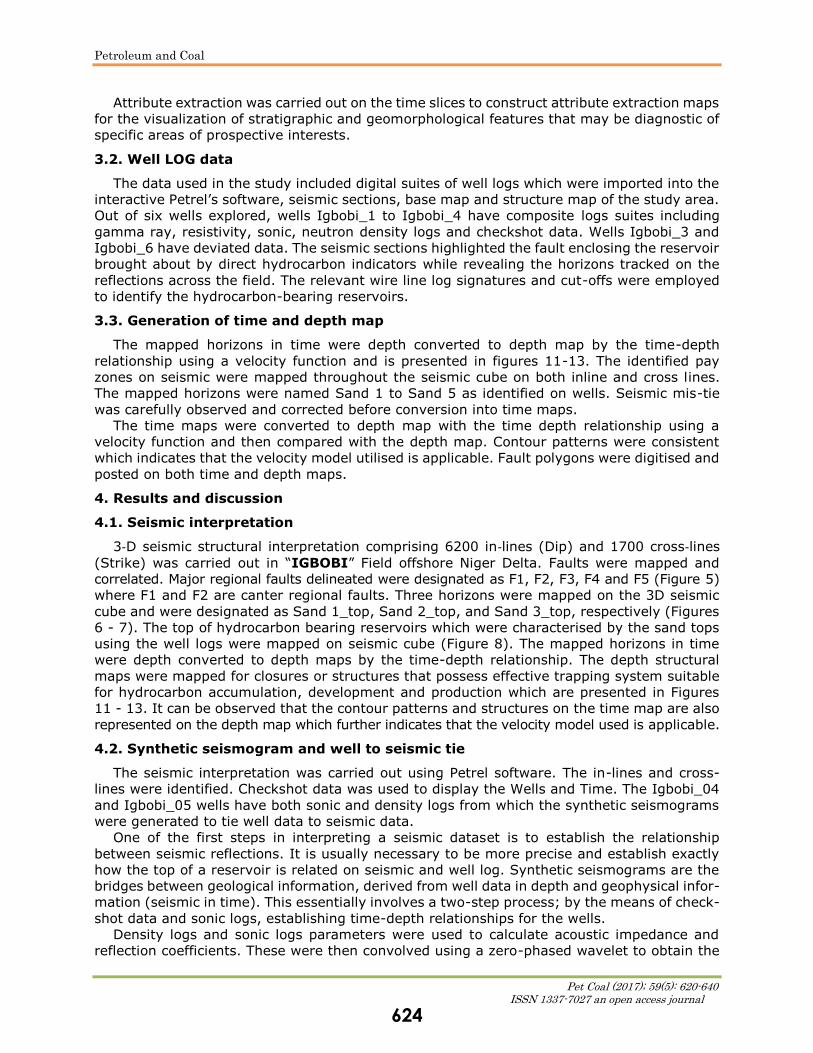
3‐D seismic structural interpretation comprising 6200 in‐lines (Dip) and 1700 cross‐lines
(Strike) was carried out in “IGBOBI” Field offshore Niger Delta. Faults were mapped and
correlated. Major regional faults delineated were designated as F1, F2, F3, F4 and F5 (Figure 5)
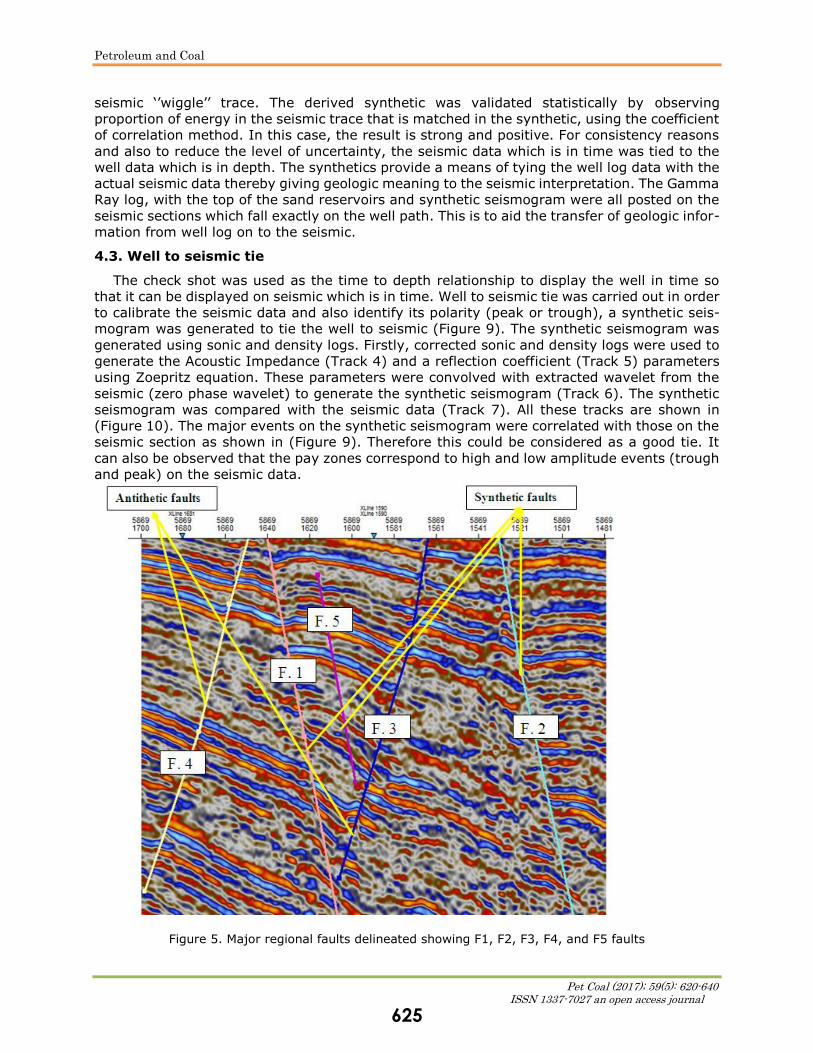
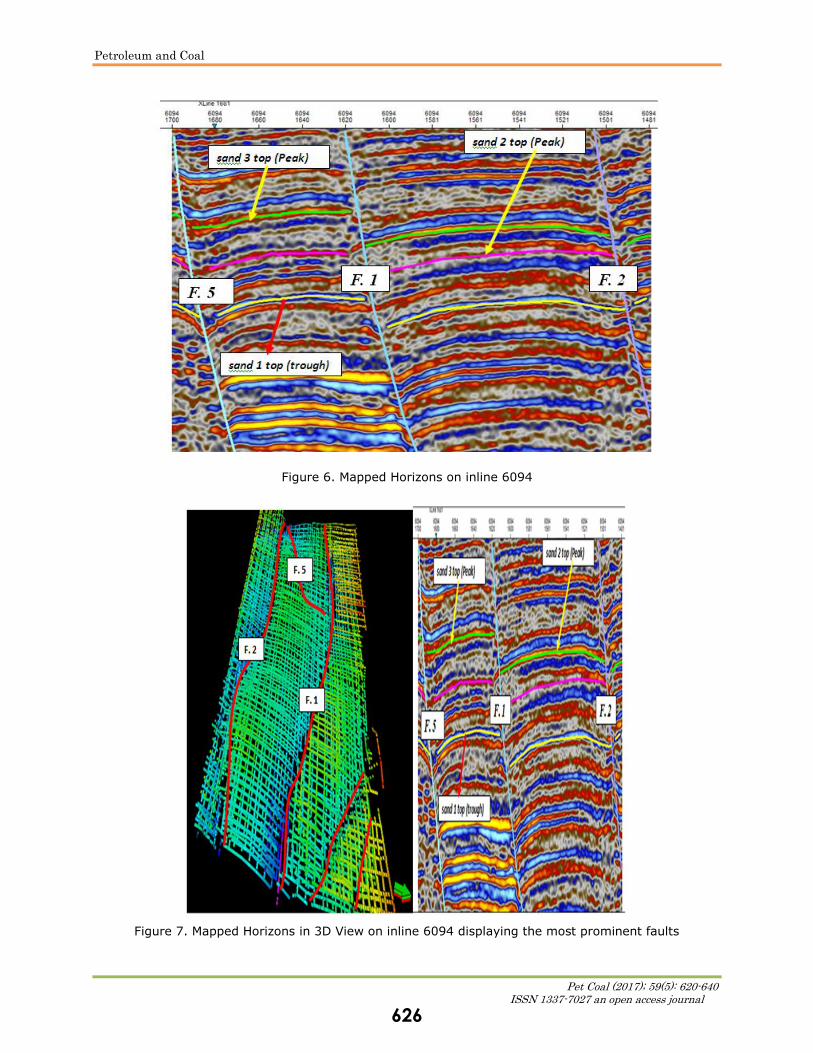
where F1 and F2 are canter regional faults. Three horizons were mapped on the 3D seismic
cube and were designated as Sand 1_top, Sand 2_top, and Sand 3_top, respectively (Figures
6 - 7). The top of hydrocarbon bearing reservoirs which were characterised by the sand tops
using the well logs were mapped on seismic cube (Figure 8). The mapped horizons in time
were depth converted to depth maps by the time-depth relationship. The depth structural
maps were mapped for closures or structures that possess effective trapping system suitable
for hydrocarbon accumulation, development and production which are presented in Figures
11 - 13. It can be observed that the contour patterns and structures on the time map are also
represented on the depth map which further indicates that the velocity model used is applicable.
4.2. Synthetic seismogram and well to seismic tie
The seismic interpretation was carried out using Petrel software. The in-lines and cross-
lines were identified. Checkshot data was used to display the Wells and Time. The Igbobi_04
and Igbobi_05 wells have both sonic and density logs from which the synthetic seismograms
were generated to tie well data to seismic data.
One of the first steps in interpreting a seismic dataset is to establish the relationship
between seismic reflections. It is usually necessary to be more precise and establish exactly
how the top of a reservoir is related on seismic and well log. Synthetic seismograms are the
bridges between geological information, derived from well data in depth and geophysical infor-
mation (seismic in time). This essentially involves a two-step process; by the means of check-
shot data and sonic logs, establishing time-depth relationships for the wells.
Density logs and sonic logs parameters were used to calculate acoustic impedance and
reflection coefficients. These were then convolved using a zero-phased wavelet to obtain the
624
Petroleum and Coal
Pet Coal (2017); 59(5): 620-640 ISSN 1337-7027 an open access journal
seismic ‘’wiggle’’ trace. The derived synthetic was validated statistically by observing
proportion of energy in the seismic trace that is matched in the synthetic, using the coefficient
of correlation method. In this case, the result is strong and positive. For consistency reasons
and also to reduce the level of uncertainty, the seismic data which is in time was tied to the
well data which is in depth. The synthetics provide a means of tying the well log data with the
actual seismic data thereby giving geologic meaning to the seismic interpretation. The Gamma
Ray log, with the top of the sand reservoirs and synthetic seismogram were all posted on the
seismic sections which fall exactly on the well path. This is to aid the transfer of geologic infor-
mation from well log on to the seismic.
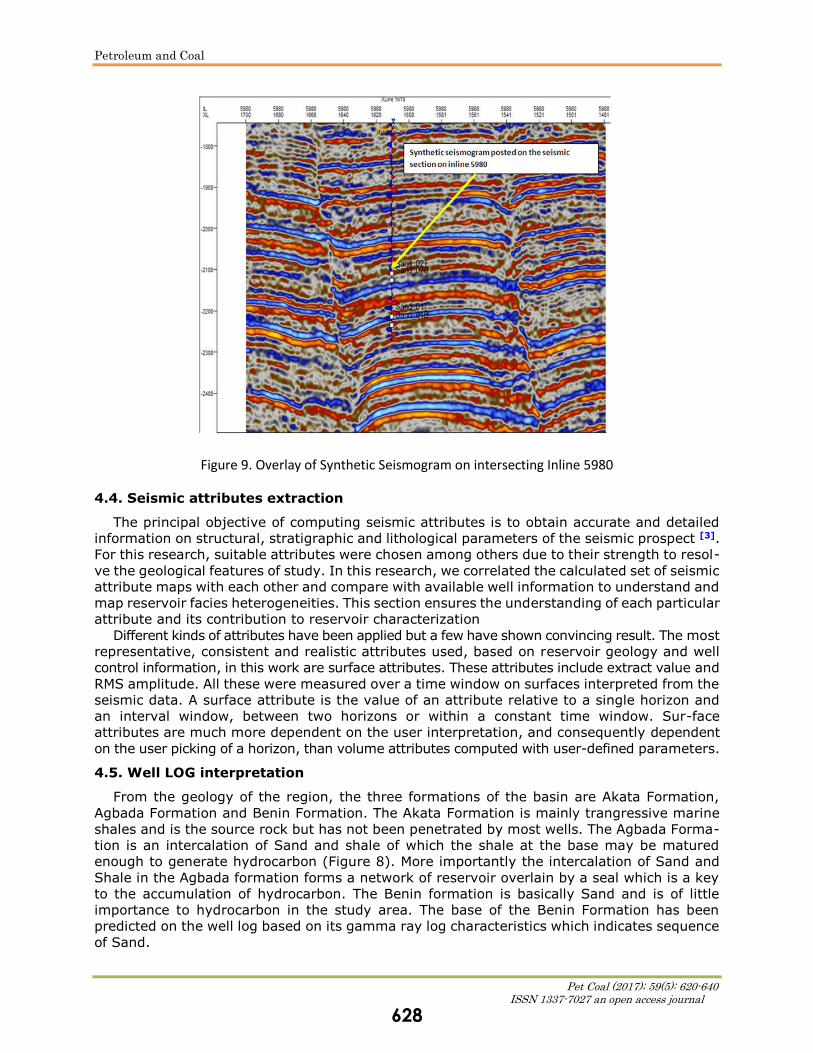
4.3. Well to seismic tie
The check shot was used as the time to depth relationship to display the well in time so
that it can be displayed on seismic which is in time. Well to seismic tie was carried out in order
to calibrate the seismic data and also identify its polarity (peak or trough), a synthetic seis-
mogram was generated to tie the well to seismic (Figure 9). The synthetic seismogram was
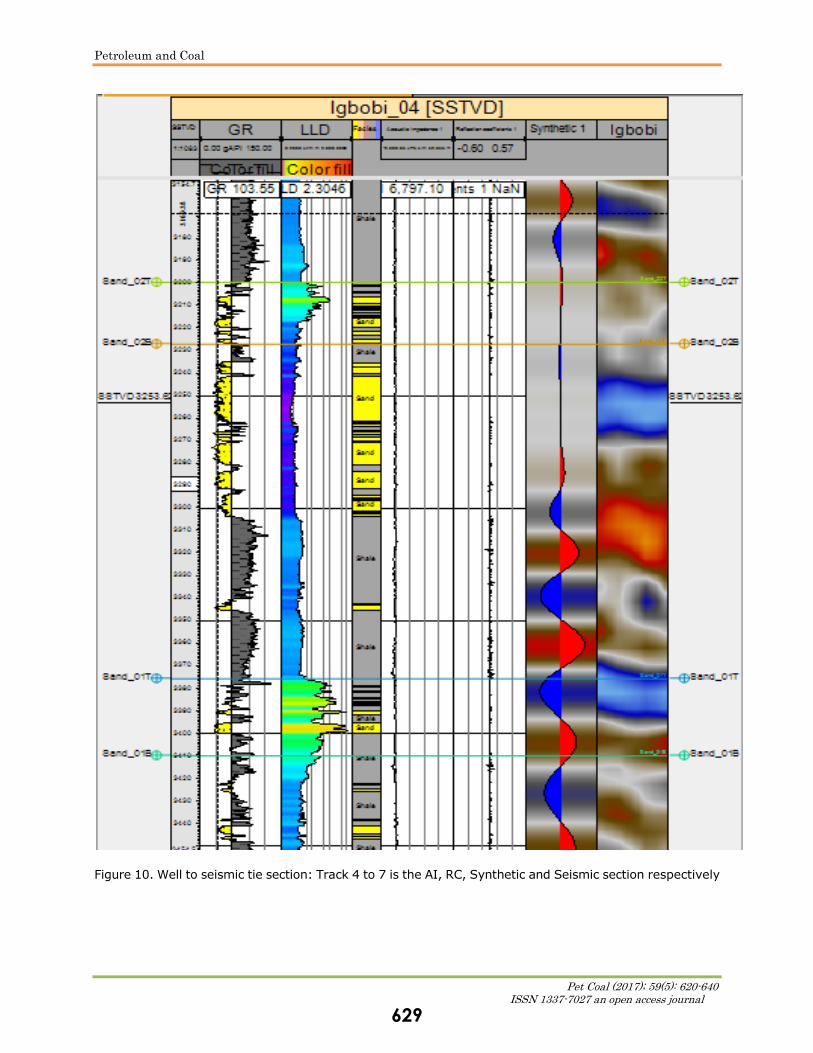
generated using sonic and density logs. Firstly, corrected sonic and density logs were used to
generate the Acoustic Impedance (Track 4) and a reflection coefficient (Track 5) parameters
using Zoepritz equation. These parameters were convolved with extracted wavelet from the
seismic (zero phase wavelet) to generate the synthetic seismogram (Track 6). The synthetic
seismogram was compared with the seismic data (Track 7). All these tracks are shown in
(Figure 10). The major events on the synthetic seismogram were correlated with those on the
seismic section as shown in (Figure 9). Therefore this could be considered as a good tie. It
can also be observed that the pay zones correspond to high and low amplitude events (trough
and peak) on the seismic data.
Figure 5. Major regional faults delineated showing F1, F2, F3, F4, and F5 faults
625
Petroleum and Coal
Pet Coal (2017); 59(5): 620-640 ISSN 1337-7027 an open access journal
Figure 6. Mapped Horizons on inline 6094
Figure 7. Mapped Horizons in 3D View on inline 6094 displaying the most prominent faults
626
Petroleum and Coal
Pet Coal (2017); 59(5): 620-640 ISSN 1337-7027 an open access journal
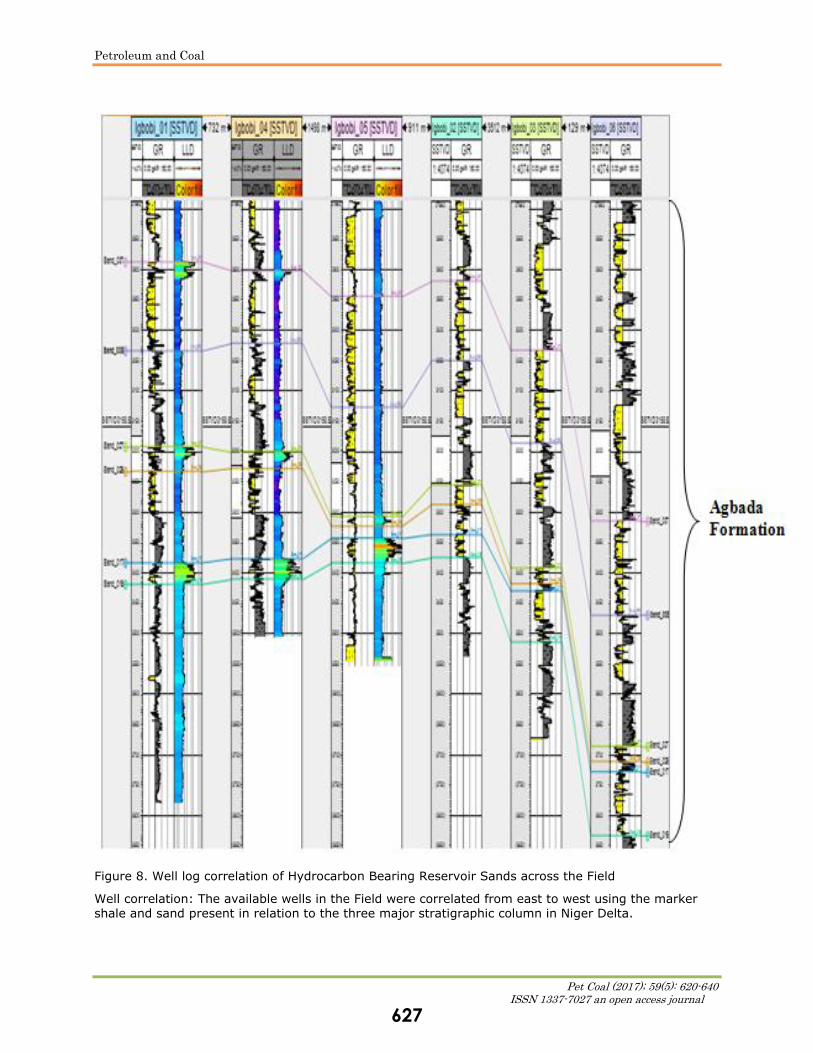
Figure 8. Well log correlation of Hydrocarbon Bearing Reservoir Sands across the Field
Well correlation: The available wells in the Field were correlated from east to west using the marker shale and sand present in relation to the three major stratigraphic column in Niger Delta.
627
Petroleum and Coal
Pet Coal (2017); 59(5): 620-640 ISSN 1337-7027 an open access journal
Figure 9. Overlay of Synthetic Seismogram on intersecting Inline 5980
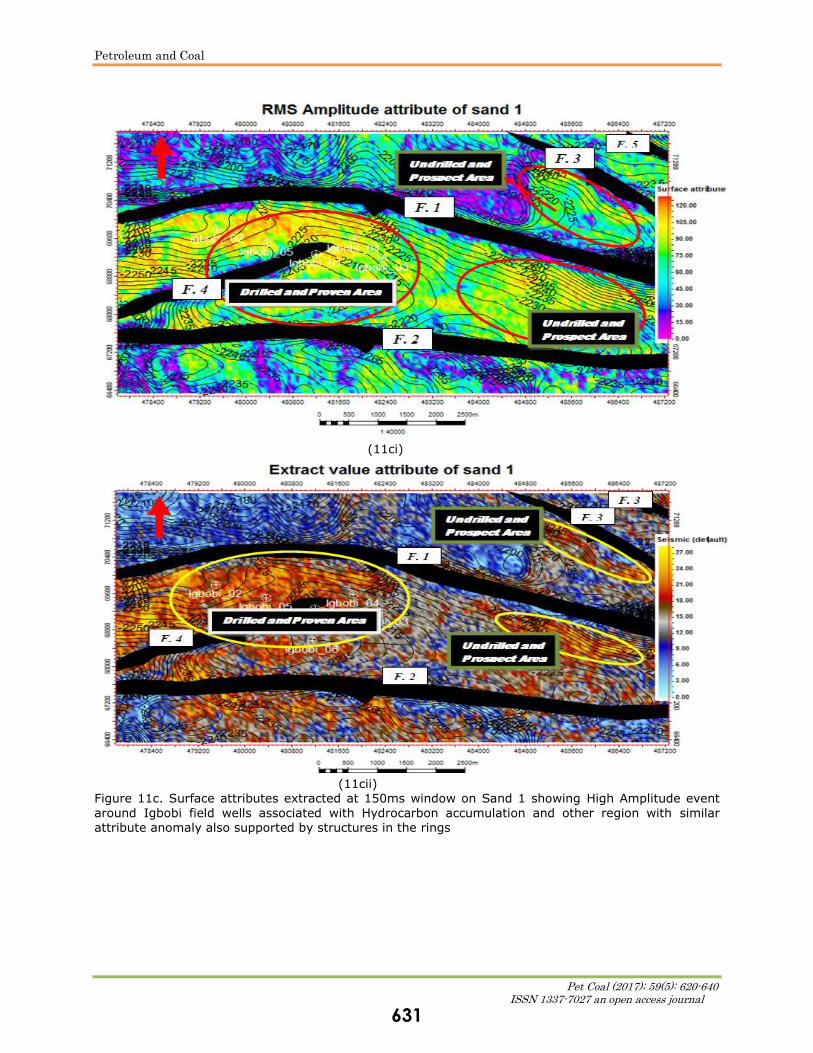
4.4. Seismic attributes extraction
The principal objective of computing seismic attributes is to obtain accurate and detailed
information on structural, stratigraphic and lithological parameters of the seismic prospect [3].
For this research, suitable attributes were chosen among others due to their strength to resol-
ve the geological features of study. In this research, we correlated the calculated set of seismic
attribute maps with each other and compare with available well information to understand and
map reservoir facies heterogeneities. This section ensures the understanding of each particular
attribute and its contribution to reservoir characterization
Different kinds of attributes have been applied but a few have shown convincing result. The most
representative, consistent and realistic attributes used, based on reservoir geology and well
control information, in this work are surface attributes. These attributes include extract value and
RMS amplitude. All these were measured over a time window on surfaces interpreted from the
seismic data. A surface attribute is the value of an attribute relative to a single horizon and
an interval window, between two horizons or within a constant time window. Sur-face
attributes are much more dependent on the user interpretation, and consequently dependent
on the user picking of a horizon, than volume attributes computed with user-defined parameters.
4.5. Well LOG interpretation
From the geology of the region, the three formations of the basin are Akata Formation,
Agbada Formation and Benin Formation. The Akata Formation is mainly trangressive marine
shales and is the source rock but has not been penetrated by most wells. The Agbada Forma-
tion is an intercalation of Sand and shale of which the shale at the base may be matured
enough to generate hydrocarbon (Figure 8). More importantly the intercalation of Sand and
Shale in the Agbada formation forms a network of reservoir overlain by a seal which is a key
to the accumulation of hydrocarbon. The Benin formation is basically Sand and is of little
importance to hydrocarbon in the study area. The base of the Benin Formation has been
predicted on the well log based on its gamma ray log characteristics which indicates sequence
of Sand.
628
Petroleum and Coal
Pet Coal (2017); 59(5): 620-640 ISSN 1337-7027 an open access journal
Figure 10. Well to seismic tie section: Track 4 to 7 is the AI, RC, Synthetic and Seismic section respectively
629
Petroleum and Coal
Pet Coal (2017); 59(5): 620-640 ISSN 1337-7027 an open access journal
Figure 11a. Time map of Sand 1
Figure 11b. Depth map of Sand 1
630
Petroleum and Coal
Pet Coal (2017); 59(5): 620-640 ISSN 1337-7027 an open access journal
(11ci)
(11cii) Figure 11c. Surface attributes extracted at 150ms window on Sand 1 showing High Amplitude event
around Igbobi field wells associated with Hydrocarbon accumulation and other region with similar
attribute anomaly also supported by structures in the rings
631
Petroleum and Coal
Pet Coal (2017); 59(5): 620-640 ISSN 1337-7027 an open access journal
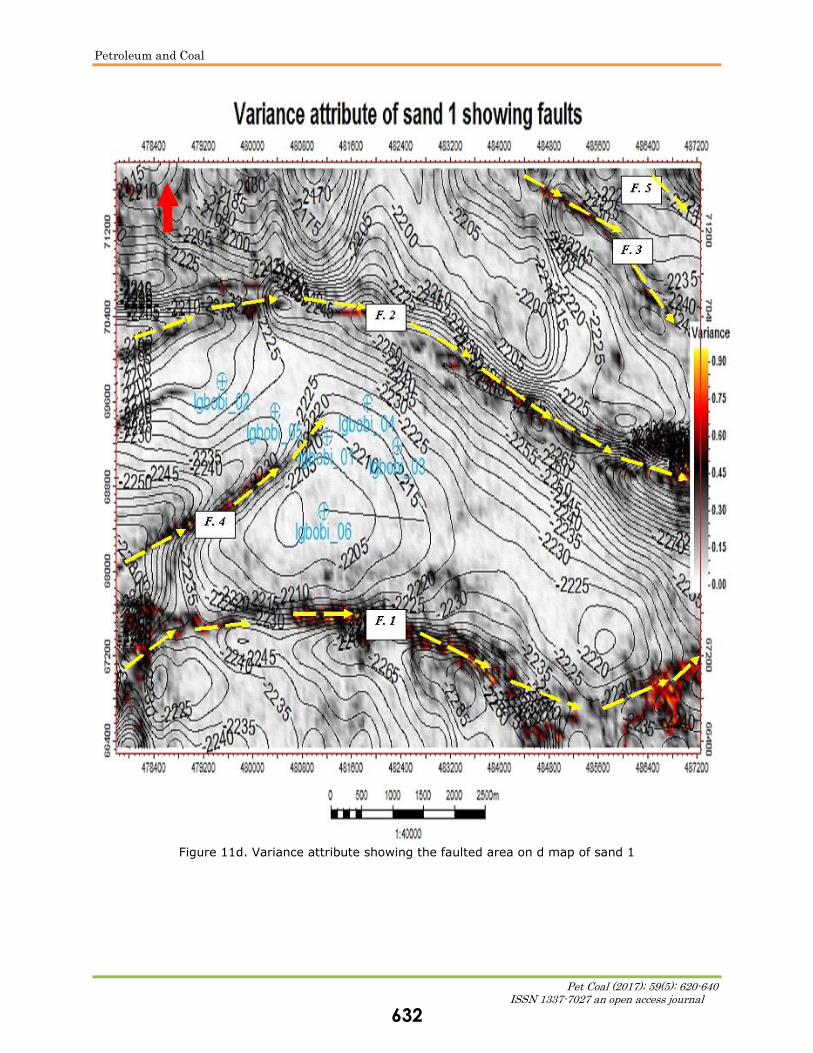
Figure 11d. Variance attribute showing the faulted area on d map of sand 1
632
Petroleum and Coal
Pet Coal (2017); 59(5): 620-640 ISSN 1337-7027 an open access journal
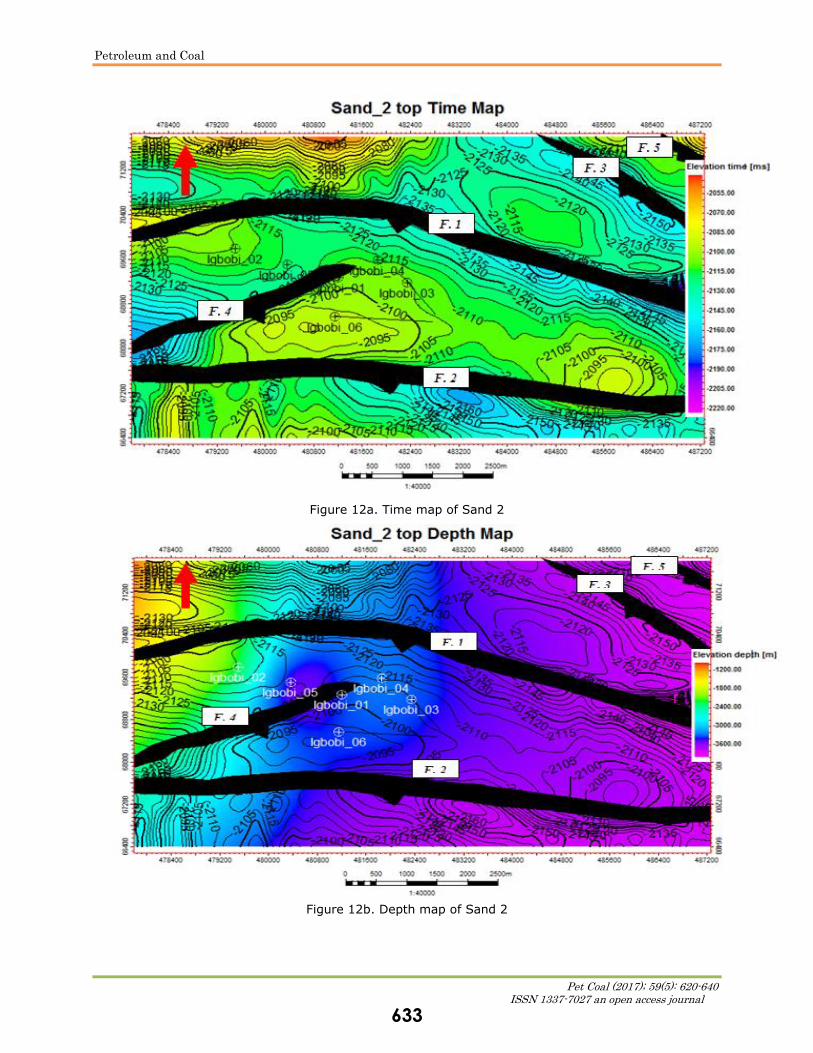
Figure 12a. Time map of Sand 2
Figure 12b. Depth map of Sand 2
633
Petroleum and Coal
Pet Coal (2017); 59(5): 620-640 ISSN 1337-7027 an open access journal
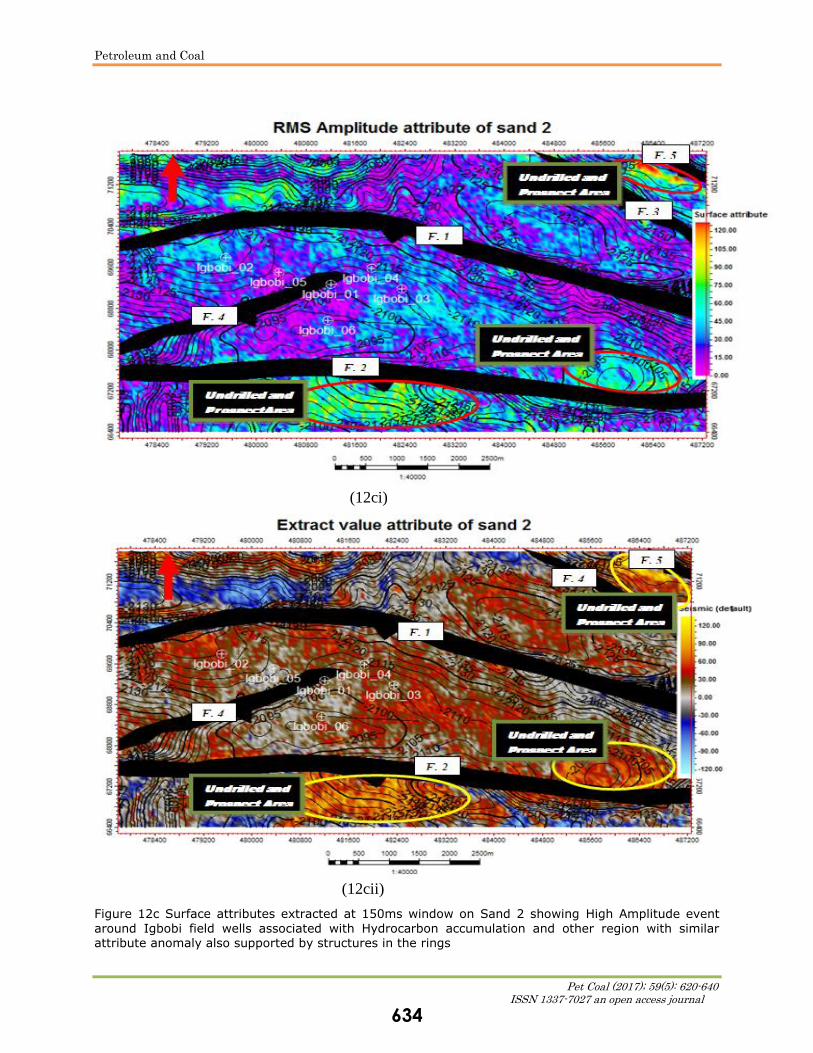
(12ci)
(12cii)
Figure 12c Surface attributes extracted at 150ms window on Sand 2 showing High Amplitude event
around Igbobi field wells associated with Hydrocarbon accumulation and other region with similar attribute anomaly also supported by structures in the rings
634
Petroleum and Coal
Pet Coal (2017); 59(5): 620-640 ISSN 1337-7027 an open access journal
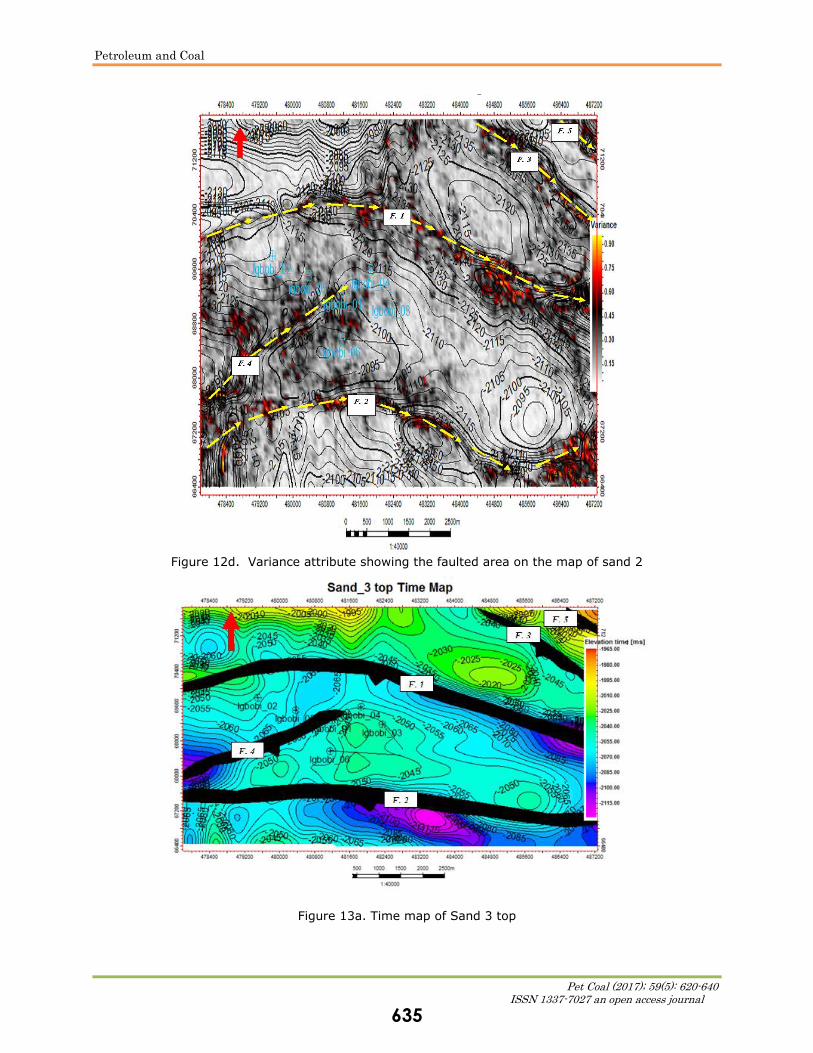
Figure 12d. Variance attribute showing the faulted area on the map of sand 2
Figure 13a. Time map of Sand 3 top
635
Petroleum and Coal
Pet Coal (2017); 59(5): 620-640 ISSN 1337-7027 an open access journal
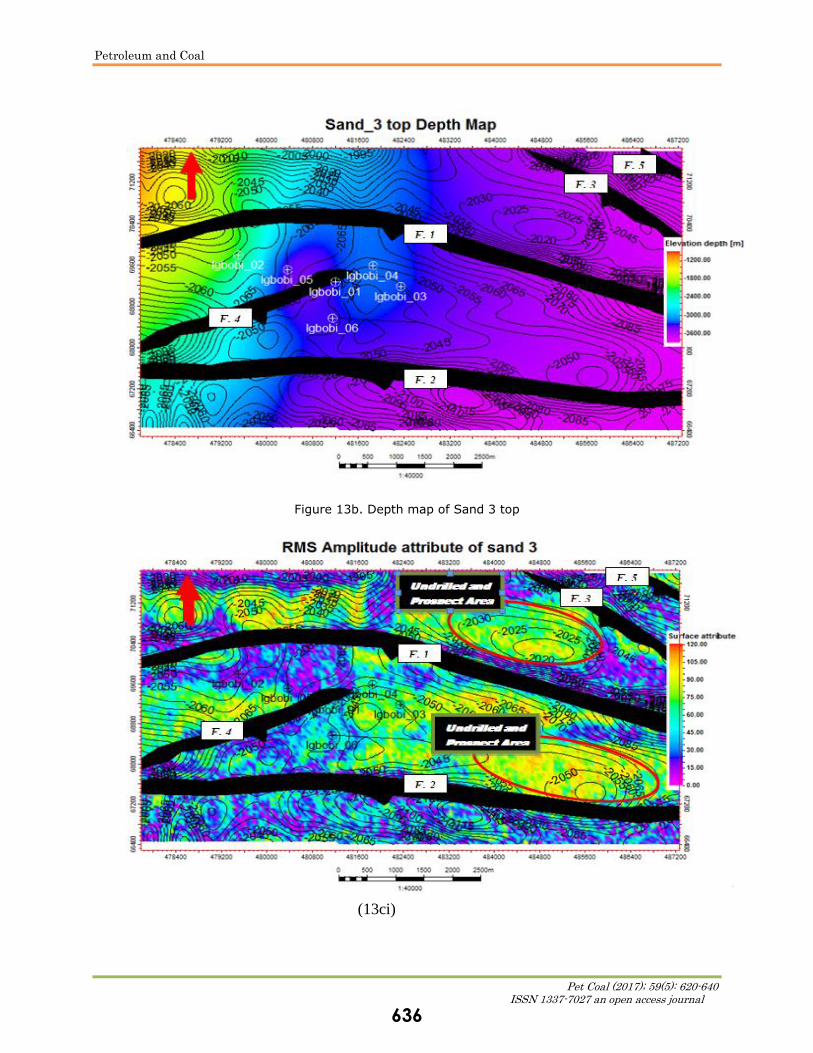
Figure 13b. Depth map of Sand 3 top
(13ci)
636
Petroleum and Coal
Pet Coal (2017); 59(5): 620-640 ISSN 1337-7027 an open access journal
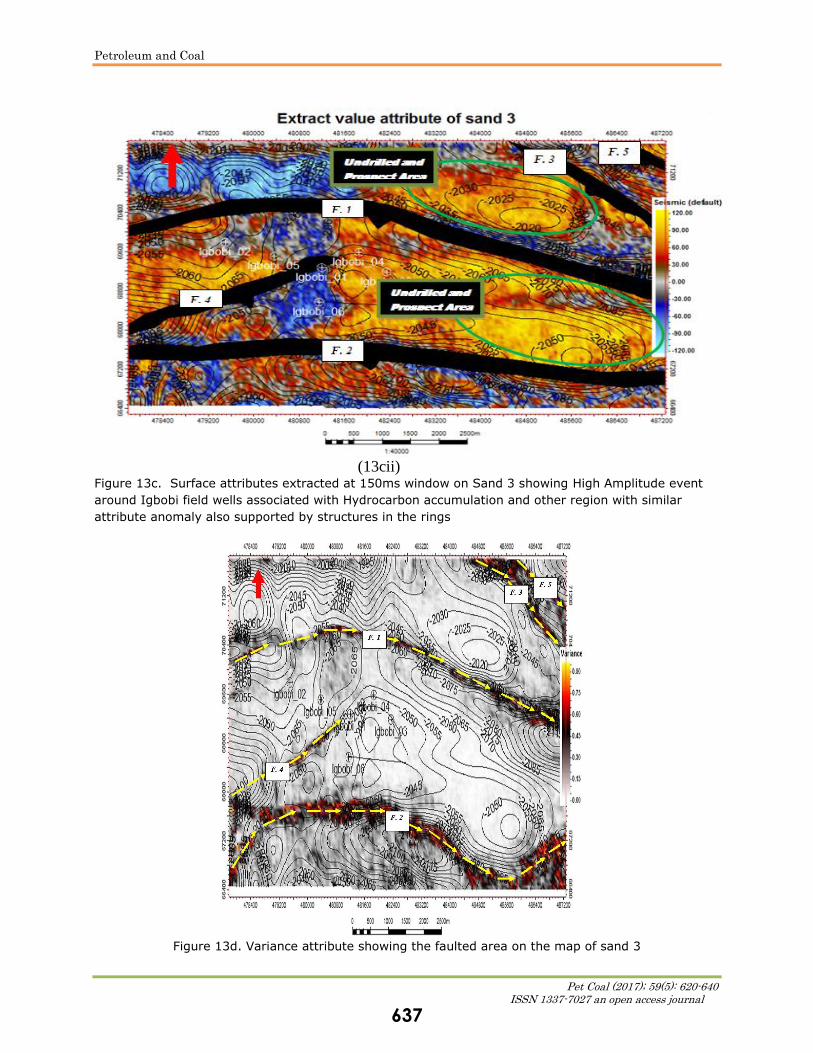
(13cii) Figure 13c. Surface attributes extracted at 150ms window on Sand 3 showing High Amplitude event
around Igbobi field wells associated with Hydrocarbon accumulation and other region with similar
attribute anomaly also supported by structures in the rings
Figure 13d. Variance attribute showing the faulted area on the map of sand 3
637
Petroleum and Coal
Pet Coal (2017); 59(5): 620-640 ISSN 1337-7027 an open access journal
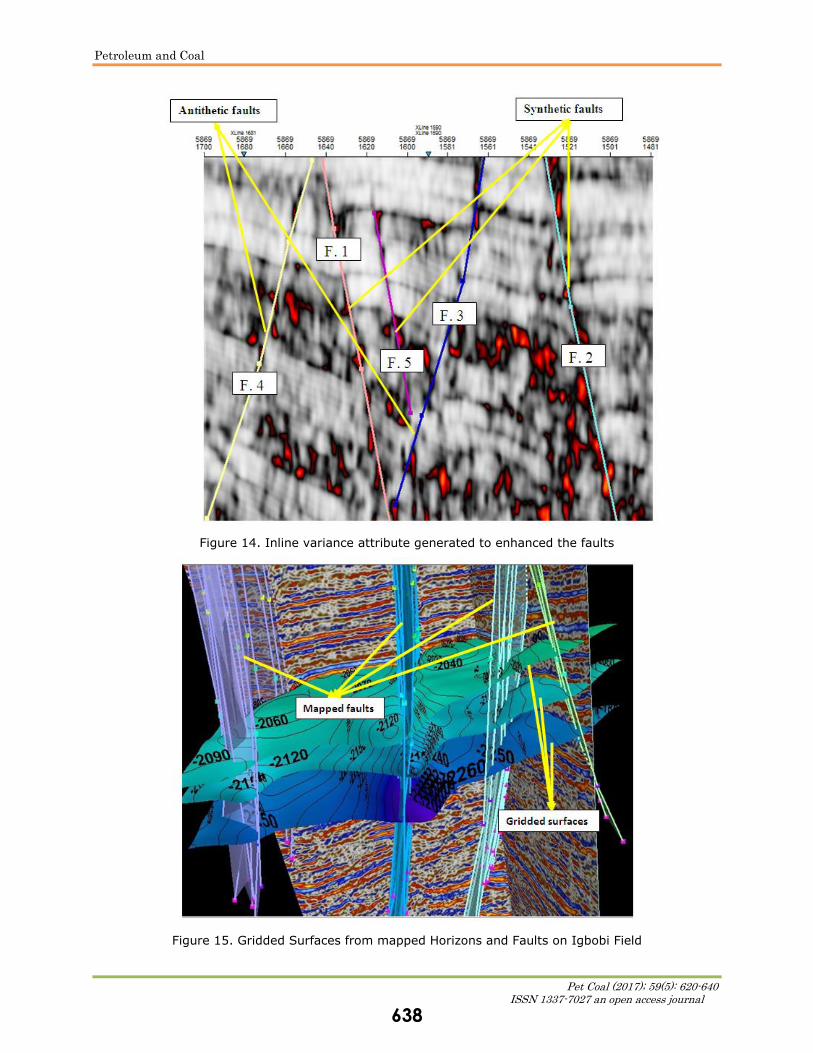
Figure 14. Inline variance attribute generated to enhanced the faults
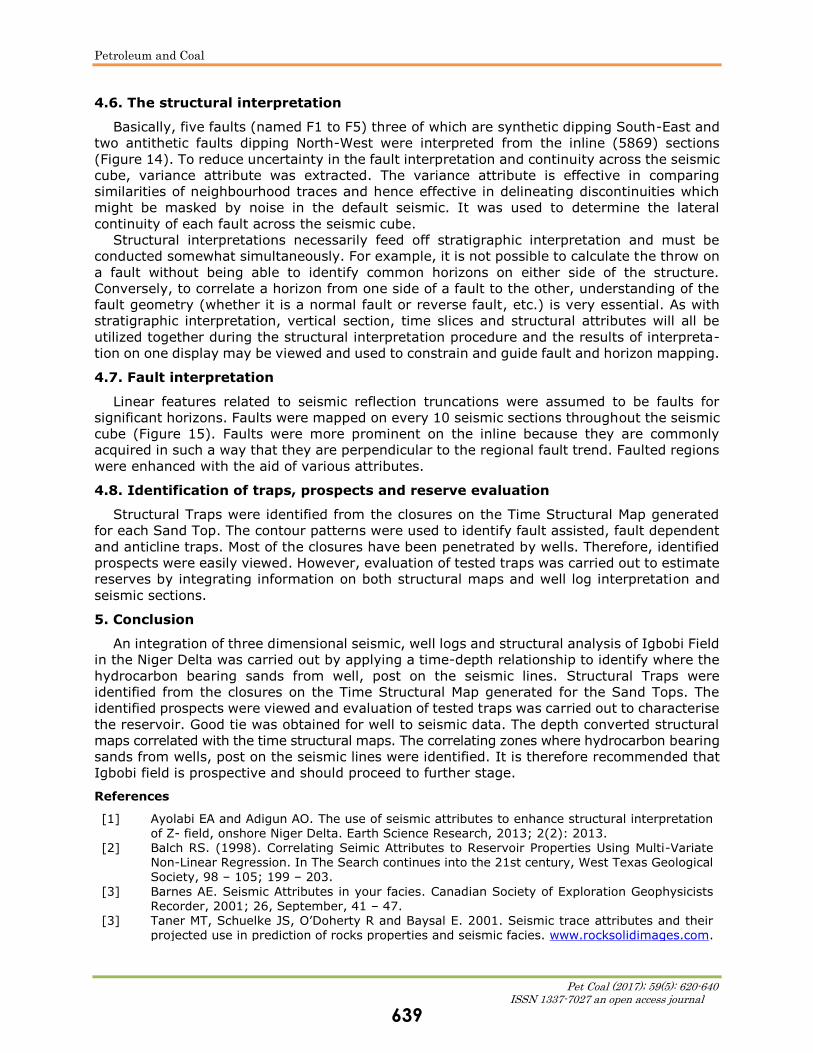
Figure 15. Gridded Surfaces from mapped Horizons and Faults on Igbobi Field
638
Petroleum and Coal
Pet Coal (2017); 59(5): 620-640 ISSN 1337-7027 an open access journal
4.6. The structural interpretation
Basically, five faults (named F1 to F5) three of which are synthetic dipping South-East and
two antithetic faults dipping North-West were interpreted from the inline (5869) sections
(Figure 14). To reduce uncertainty in the fault interpretation and continuity across the seismic
cube, variance attribute was extracted. The variance attribute is effective in comparing
similarities of neighbourhood traces and hence effective in delineating discontinuities which
might be masked by noise in the default seismic. It was used to determine the lateral
continuity of each fault across the seismic cube.
Structural interpretations necessarily feed off stratigraphic interpretation and must be
conducted somewhat simultaneously. For example, it is not possible to calculate the throw on
a fault without being able to identify common horizons on either side of the structure.
Conversely, to correlate a horizon from one side of a fault to the other, understanding of the
fault geometry (whether it is a normal fault or reverse fault, etc.) is very essential. As with
stratigraphic interpretation, vertical section, time slices and structural attributes will all be
utilized together during the structural interpretation procedure and the results of interpreta-
tion on one display may be viewed and used to constrain and guide fault and horizon mapping.
4.7. Fault interpretation
Linear features related to seismic reflection truncations were assumed to be faults for
significant horizons. Faults were mapped on every 10 seismic sections throughout the seismic
cube (Figure 15). Faults were more prominent on the inline because they are commonly
acquired in such a way that they are perpendicular to the regional fault trend. Faulted regions
were enhanced with the aid of various attributes.
4.8. Identification of traps, prospects and reserve evaluation
Structural Traps were identified from the closures on the Time Structural Map generated
for each Sand Top. The contour patterns were used to identify fault assisted, fault dependent
and anticline traps. Most of the closures have been penetrated by wells. Therefore, identified
prospects were easily viewed. However, evaluation of tested traps was carried out to estimate
reserves by integrating information on both structural maps and well log interpretation and
seismic sections.
5. Conclusion
An integration of three dimensional seismic, well logs and structural analysis of Igbobi Field
in the Niger Delta was carried out by applying a time-depth relationship to identify where the
hydrocarbon bearing sands from well, post on the seismic lines. Structural Traps were
identified from the closures on the Time Structural Map generated for the Sand Tops. The
identified prospects were viewed and evaluation of tested traps was carried out to characterise
the reservoir. Good tie was obtained for well to seismic data. The depth converted structural
maps correlated with the time structural maps. The correlating zones where hydrocarbon bearing
sands from wells, post on the seismic lines were identified. It is therefore recommended that
Igbobi field is prospective and should proceed to further stage.
References
[1] Ayolabi EA and Adigun AO. The use of seismic attributes to enhance structural interpretation
of Z- field, onshore Niger Delta. Earth Science Research, 2013; 2(2): 2013. [2] Balch RS. (1998). Correlating Seimic Attributes to Reservoir Properties Using Multi-Variate
Non-Linear Regression. In The Search continues into the 21st century, West Texas Geological Society, 98 – 105; 199 – 203.
[3] Barnes AE. Seismic Attributes in your facies. Canadian Society of Exploration Geophysicists Recorder, 2001; 26, September, 41 – 47.
[3] Taner MT, Schuelke JS, O’Doherty R and Baysal E. 2001. Seismic trace attributes and their projected use in prediction of rocks properties and seismic facies. www.rocksolidimages.com.
639
Petroleum and Coal
Pet Coal (2017); 59(5): 620-640 ISSN 1337-7027 an open access journal
[4] Cooper R. 2008, The Future of Seismic Attributes. Online Webinar.
http://www.rocksolidimages.com/pdf/The_Future_of_Seismic_Attributes.pdf [5] Chopra S and Marfurt KJ. Seismic attributes – A historical perspective. Geophysics, 2005;
70(5): 3SO - 28SO. [6] Strecker MR, Carrapa B, Hulley GE, Scoenbohm L & Sobe, ER. Erosional control of Plateau
evolution in the Central Andes. Geological Society of America, 2004; 36(5). [7] Gauthier DM & Lake LW. (1993). Prediction of sub-seismic faults and fractures. pp. 35-48. [8] Doust H & Omatsola E. Niger Delta. In J. D. Edwards, & P. A. Santogrossi (Eds.), Divergent
andbPassive Margin Basins. American Association of Petroleum Geologists Memoir, 1990; 48: 201-238.
[9] Evamy BD. Hydrocarbon habitat of Tertiary Niger Delta: American Association of Petroleum Geologists Bulletin, 1978; 62: 277- 298.
[10] Short S and Stauble G. Outline of Geology of Niger Delta, American Association of Petroleum Geologists Bulletin, 1967: 761-768.
[11] Ekweozor CM, Daukoru EM. Niger Delta Depobelt Portion of the Akata-Agbada Petroleum Sys-tem, AAPG Memoir 60: American Association of Petroleum Geologist, Tulsa, 1994: 599-604.
[12] Kulke SJ. Niger Delta Geology. Journal of Petroleum, 1995; 24: 30-35 & 209-221. [13] Opara AI. 2010: 3-D seismic interpretation and reserve estimation of Ossu Field in OML 124,
Onshore Niger Delta Basin, Nigeria. [14] Hammed OS, Awoyemi MO, Igboama WN, Fatoba JO and Ebun DO. Hydrocarbon Reservoir
Characterization Of “Igbobi Field’', Offshore Niger Delta Using Petrophysical Analysis And Well Log Interpretation. Pet Coal, 2017; 59(3): 288-301.
[15] Stacher P. 1995, Present understanding of the Niger Delta hydrocarbon habitat, In: Oti MN and Postma G., eds., Geology of Deltas: Rotterdam, A.A. Balkema, p. 257-267. Thomas, 1995, Niger Delta il production, reserves, field sizes assessed: Oil & Gas Journal, November 13,
1995, p. 101-103. [16] Tuttle MLW, Charpentier RR and Brownfield ME. 1999. The Niger Delta petroleum system:
Niger Delta province Nigeria, Cameroon and Equatorial Guinea, Africa, Africa, U.S. Geological Survey. Open File Report 99-50H, P. 1-13.
To whom correspondence should be addressed: Dr. O. S. Hammed, Department of Physics, Federal University, Oye-Ekiti, Nigeria
640