analysis of coal-and petroleum-derived samples by size exclu-sion chromatography and laser...
TRANSCRIPT

Analysis of Coal- and Petroleum-Derived Samples by Size Exclu-
sion Chromatography and Laser Desorption Mass Spectrometry
B.Apicella1, M.Alfè
1, M.Millan
2, E.Lorente
2, C.Berrueco
2, A.Amoresano
3,
E.Galano3
1. Institute of Research on Combustion - C.N.R., Napoli - ITALY
2. Chemical Engineering Department- Imperial College- London, UK
3. Chemical Organic Department- Università Federico II, Napoli – ITALY
1. Introduction
Heavy hydrocarbon liquids derived from coal and petroleum are complex mixtures and their
physical and chemical composition and properties vary depending on the type and origin.
Detailed definitions of their molecular structures and mass distribution are relevant for the
processing of these materials and their behaviour in refinery plant but they are very difficult
to be obtained by conventional chromatographic and mass spectrometric techniques.
In the present paper coal- and petroleum-derived samples have been fractionated by solvent
extraction to provide more tractable samples in terms of narrower molecular weight
distribution and higher homogeneity in chemical behaviour. Fractions have been further
characterized by Size Exclusion Chromatography and Laser Desorption Mass Spectrometry.
The aim of the work is to obtain a more complete picture of molecular mass and structure of
complex samples, very important in fuel processing industry, matching and interpreting the
results from the two techniques.
2. Experimental
2.1. Samples
A pitch from the high-temperature coking of coal has been separated by solvent solubility into
heptane-solubles (pitch HS), heptane-insoluble but toluene-solubles (pitch TS), and toluene-
insolubles (pitch TI) fractions [1]. The fractionation used two aliquots of heptane, 300 mL,
followed by two aliquots of toluene, 300 mL. The fractions were recovered by drying the
solvents and it was found that the asphaltene fraction (pitch TS fraction) is 44,4% by weight
of the pitch whereas the non-asphaltenic fraction is composed by 14,4% of pitch HS and
41,2% of pitch TI.
Maya heavy crude oil, whose main properties are reported in literature [2], was also
fractionated and analysed in this study. Maya crude oil is firstly separated in heptane soluble
(Maya HS) and heptane insoluble but toluene soluble fraction (Maya asphaltenes, Maya A).
No fraction insoluble in toluene is present. Maya asphalthene is further separated on the basis
of its solubility in N-methyl pyrrolidone (NMP) in NMP soluble (Maya A NS) and NMP
insoluble (Maya A NI).
2.2. Size Exclusion Chromatography (SEC)
The SEC analysis of sample fractions was carried out by elution with NMP on a PL-gel
polystyrene-polydivinylbenzene individual pore column (Polymer Laboratories, Ltd, UK)
with a column particle size of 5 m diameter and a pore dimension of 50 nm. This column is
1

Processes and Technologies for a Sustainable Energy
able to separate polystyrene standards in the molecular mass range from 100 to 1E5 u The
relation between molecular mass of polystyrenes and PAH, shown to hold for PAH standards
[3], is used for the MW evaluation of samples. The injection volume was 250 Land the
analyses were performed at a temperature of 80 °C with a flow rate of 0.5 mL/min. The on-
line detection of species eluted from the SEC column used an HP1050 UV–visible diode array
detector measuring the absorbance signal at a wavelength of 350 nm.
2.3. Laser Desorption / Ionisation Mass Spectrometry (LDI-MS)
LDI-TOF-MS. Positive Linear Laser Desorption Ionisation-Time-of-Flight Mass
Spectrometry spectra were recorded on a Voyager DE STR Pro instrument (Applied
Biosystems, Framingham, MA). The target was prepared by depositing a volume variable
from 1 and 10 ul of a solution of the sample, dissolved in DCM, on the metallic sample plate.
Acceleration and linear voltages set up were: target voltage 25 kV, first grid at 96% of target
voltage, delayed extraction at 250 ns. More details are given in a previous paper [4].
AP-LDI-ITMS. The Atmospheric Pressure Laser desorption mass spectra were obtained with
an Agilent 1100 Series MSD Trap (Agilent Technologies, Palo Alto, CA, USA).
More details are given in a previous paper [5].
3. Results and discussion
The fractionation of complex samples like heavy hydrocarbon liquids from coal and
petroleum can largely improve the resolution of chemical characterization methods [1] as it
allows to separate smaller molecular mass, and usually less polar, fractions from the larger
mass (and more polar) samples. This reduces polydispersity, improving detection of less
absorbing species in SEC analysis and allows the use of higher laser fluences for LDI-MS, for
better desorbing and ionizing larger molecules, thereby avoiding the formation of ionized
molecular clusters.
Are
a n
orm
ali
ze
da
bso
rba
nce
MW, u
1.0x10⁵ 1.0x10⁴ 1.0x10³ 1.0x10²
0
0.1
0.2
0.3
0.4
0.5
0.6
0.7
1.00E+021.00E+031.00E+041.00E+050
0.1
0.2
0.3
0.4
0.5
0.6
0.7 NPTINPITCHNPTSNPHS
0
0.05
0.1
0.15
0.2
0.25
0.3
1.00E+021.00E+031.00E+041.00E+050
0.05
0.1
0.15
0.2
0.25
0.3
NMAYANSNMAYAHS
1.0x10⁵ 1.0x10⁴ 1.0x10³ 1.0x10²
MW, u
Pitch TI
Pitch TS
Pitch
Pitch HS
Maya A NS
Maya HS
Fig. 1 SEC chromatograms of pitch and its fractions (a); SEC chromatograms of Maya
fractions soluble in NMP (b).
2

Ischia, June, 27-30 - 2010
In fig. 1 SEC chromatograms of pitch and Maya fractions have been reported as a function of
the MW, obtained by polystyrene calibration. In the case of pitch, the starting material and all
its fractions are reported, as all of them are easily dissolved in NMP for SEC elution, whereas
in the case of Maya crude oil, both the starting material and one of the two asphaltenes
fractions, named Maya A NI, are insoluble in NMP and therefore not analyzable by SEC.
For both the samples, the heptane solubles (pitch HS and Maya HS) showed the smallest
molecular distribution, with a maximum around 400 u for pitch HS and with 2 peaks for
Maya HS, one around 400u and the second around 1000 u. It is evident from the comparison
between not fractioned pitch and pitch HS that pitch HS constitutes the lighter fraction of
pitch.
An early eluting peak was observed in pitch TI, in Maya HS and in Maya A NS, more evident
in the last one, which corresponds to material of molecular size unable to penetrate the
porosity of the column packing (around and above 20,000 u), and referred to as “excluded”
from the column porosity. In a previous work [6] it was hypothesized that these materials may
be adopting three-dimensional conformations, corresponding to large hydrodynamic volumes
and very large apparent molecular masses, whereas the real MW can be much smaller.
In order to check the SEC MW attribution and to have more chemical information on the
samples, LDI-MS has been applied by using two different source configuration and mass
analyzers: LDI-TOF-MS, with high vacuum ionization source and time of flight analyzer and
AP-LDI-ITMS, with atmospheric pressure source and ion trap analyzer.
m/z
0.0
0.2
0.4
0.6
0.8
1.0
1.2
1.4
1.6
1.8
2.0
200 250 300 350 400 450 500-100
-50
0
50
100
NpitchhsA950.txtpitchhs
pitch HS
a
b
Inte
nsit
y,
arb
itra
ry u
nit
s
0.0
0.2
0.4
0.6
0.8
1.0
1.2
1.4
1.6
1.8
2.0
200 250 300 350 400 450 500-100
-50
0
50
100
NpitchTIa3a.asciipitchhi
pitch TI
0.0
0.2
0.4
0.6
0.8
1.0
1.2
1.4
1.6
1.8
2.0
200 250 300 350 400 450 500-100
-50
0
50
100
Npitcha1a.asciipitch
pitch
0.0
0.2
0.4
0.6
0.8
1.0
1.2
1.4
1.6
1.8
2.0
200 250 300 350 400 450 500-100
-50
0
50
100
NpitchTSa5b.asciipitchts
pitch TS
m/z
Inte
nsit
y,
arb
itra
ry u
nit
s
a
b
a
b
a
b
Fig. 2 LDI-MS spectra of pitch and its fractions by LDI-TOF-MS (a) and AP-LDI-ITMS (b).
3
Processes and Technologies for a Sustainable Energy
In fig. 2 the spectra of pitch and its fraction are reported with both the techniques. It is
possible to observe a very good agreement between the two mass spectrometric systems, in
terms of mass range detected and peak sequences, even if in the case of AP-LDI-IT the
ionization is performed in softer conditions that can reduce fragmentation but increase
aggregation into the plume.
In the case of pitch and pitch HS, the MW range detected (m/z 200-500) confirms the SEC
MW attribution and the presence of a sequence of major ion peaks with a spacing of 24-26 u
superimposed on a sequence of minor ion peaks which present the same spacing of 24-26 u
typical of PAH [7] have been found. For pitch TS the MW range detected is slightly shifted
toward higher masses, in agreement with SEC. On the basis of SEC, the last pitch fraction,
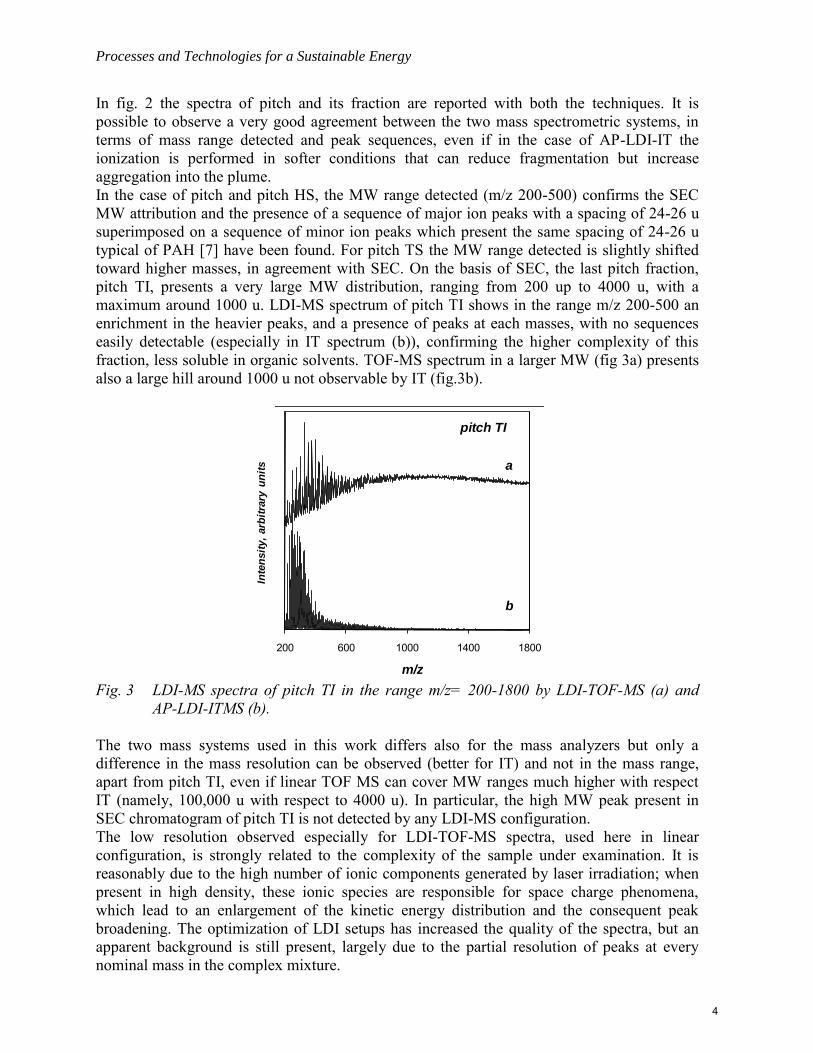
pitch TI, presents a very large MW distribution, ranging from 200 up to 4000 u, with a
maximum around 1000 u. LDI-MS spectrum of pitch TI shows in the range m/z 200-500 an
enrichment in the heavier peaks, and a presence of peaks at each masses, with no sequences
easily detectable (especially in IT spectrum (b)), confirming the higher complexity of this
fraction, less soluble in organic solvents. TOF-MS spectrum in a larger MW (fig 3a) presents
also a large hill around 1000 u not observable by IT (fig.3b).
-100
-50
0
50
100
0.0
0.2
0.4
0.6
0.8
1.0
1.2
1.4
1.6
1.8
2.0
200 600 1000 1400 1800
NpitchTIa3a.ascii
#RIF!
m/z
Inte
nsit
y,
arb
itra
ryu
nit
s
pitch TI
a
b
Fig. 3 LDI-MS spectra of pitch TI in the range m/z= 200-1800 by LDI-TOF-MS (a) and
AP-LDI-ITMS (b).
The two mass systems used in this work differs also for the mass analyzers but only a
difference in the mass resolution can be observed (better for IT) and not in the mass range,
apart from pitch TI, even if linear TOF MS can cover MW ranges much higher with respect
IT (namely, 100,000 u with respect to 4000 u). In particular, the high MW peak present in
SEC chromatogram of pitch TI is not detected by any LDI-MS configuration.
The low resolution observed especially for LDI-TOF-MS spectra, used here in linear
configuration, is strongly related to the complexity of the sample under examination. It is
reasonably due to the high number of ionic components generated by laser irradiation; when
present in high density, these ionic species are responsible for space charge phenomena,
which lead to an enlargement of the kinetic energy distribution and the consequent peak
broadening. The optimization of LDI setups has increased the quality of the spectra, but an
apparent background is still present, largely due to the partial resolution of peaks at every
nominal mass in the complex mixture.
4
Ischia, June, 27-30 - 2010
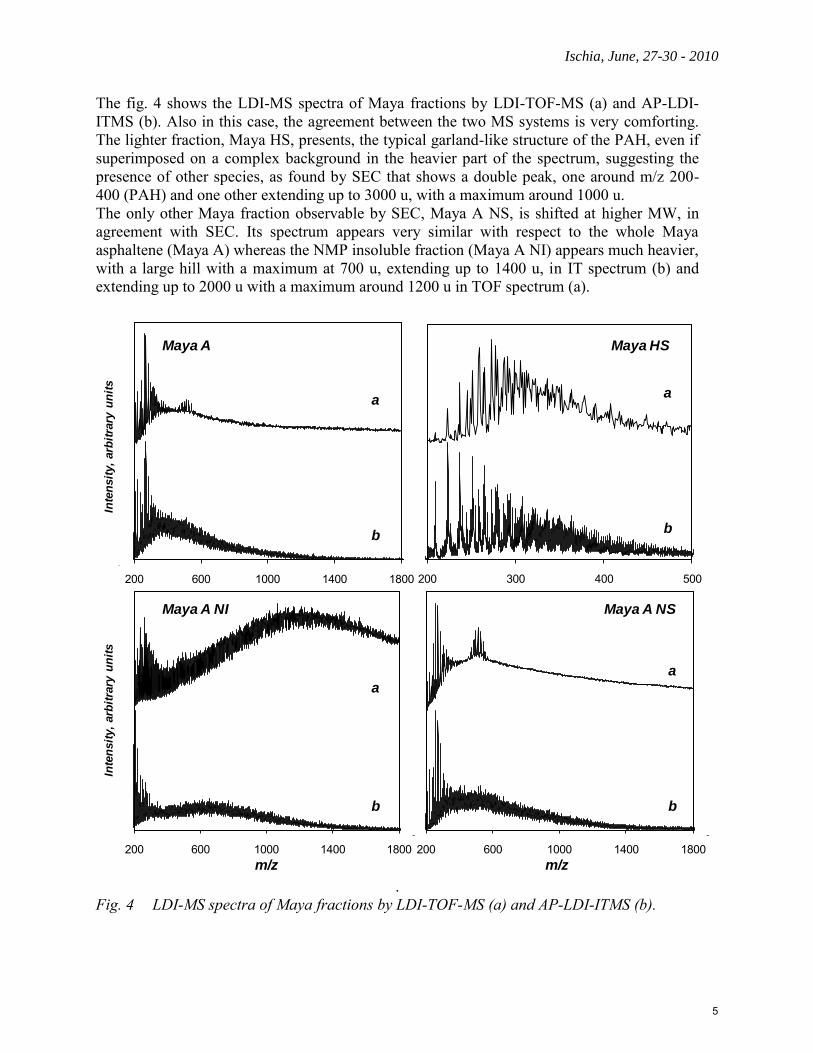
The fig. 4 shows the LDI-MS spectra of Maya fractions by LDI-TOF-MS (a) and AP-LDI-
ITMS (b). Also in this case, the agreement between the two MS systems is very comforting.
The lighter fraction, Maya HS, presents, the typical garland-like structure of the PAH, even if
superimposed on a complex background in the heavier part of the spectrum, suggesting the
presence of other species, as found by SEC that shows a double peak, one around m/z 200-
400 (PAH) and one other extending up to 3000 u, with a maximum around 1000 u.
The only other Maya fraction observable by SEC, Maya A NS, is shifted at higher MW, in
agreement with SEC. Its spectrum appears very similar with respect to the whole Maya
asphaltene (Maya A) whereas the NMP insoluble fraction (Maya A NI) appears much heavier,
with a large hill with a maximum at 700 u, extending up to 1400 u, in IT spectrum (b) and
extending up to 2000 u with a maximum around 1200 u in TOF spectrum (a).
0.00E+00
2.00E-01
4.00E-01
6.00E-01
8.00E-01
1.00E+00
1.20E+00
1.40E+00
1.60E+00
1.80E+00
2.00E+00
-100.0
-50.0
0.0
50.0
100.0
200 600 1000 1400 1800
MAYA
NmayaAa1l60.ascii.txt
Maya A
Inte
nsit
y,
arb
itra
ry u
nit
s
-28
-18
-8
2
12
22
0.0
0.2
0.4
0.6
0.8
1.0
1.2
1.4
1.6
1.8
2.0
200 300 400 500
NmayahsA5l90.ascii
Maya HS
0.00E+00
2.00E-01
4.00E-01
6.00E-01
8.00E-01
1.00E+00
1.20E+00
1.40E+00
1.60E+00
1.80E+00
2.00E+00
-100.0
-50.0
0.0
50.0
100.0
200 600 1000 1400 1800
MAYANI
NmayaANIA3l80.ascii
0.00E+00
2.00E-01
4.00E-01
6.00E-01
8.00E-01
1.00E+00
1.20E+00
1.40E+00
1.60E+00
1.80E+00
2.00E+00
-100.0
-50.0
0.0
50.0
100.0
200 600 1000 1400 1800
MAYANSD
NmayaNsA7l80.ascii
Inte
nsit
y,
arb
itra
ry u
nit
s
m/z m/z
a
b
a
b
a
b
a
b
Maya A NI Maya A NS
.
Fig. 4 LDI-MS spectra of Maya fractions by LDI-TOF-MS (a) and AP-LDI-ITMS (b).
5

Processes and Technologies for a Sustainable Energy
The present study confirms that for very complex hydrocarbon samples of interest for fuel
industry, separation in classes by different organic solvent allows to obtain fractions more
homogeneous in terms of MW distribution and chemical structure, therefore much easily
analysable by characterization techniques.
The good agreement by SEC and LDI-MS validates the use of SEC technique as rapid screen
of MW distribution of complex samples.
The correspondence found between two different LDI-MS systems demonstrates that within
the parameters range here used no artefacts (as fragmentation, agglomeration, reaction in
plume) are created.
Moreover, it states that it is possible to use the two techniques matching their advantages, as
for example the higher resolution of IT-MS with the higher detection sensitivity toward
higher masses for TOF-MS.
More work should be performed in the future in order to have more information about the
early eluting peak showed by SEC analysis, not detected by LDI-MS techniques.
4. Acknowledgments
The authors want to thank the MSE-CNR project on “Carbone Pulito” for the financial
support.
5. References
1. Karaka, F., Morgan, T.J., George, A., Bull, I.D., Herod, A.A., Millan, M., Kandiyoti, R.,
RCM, 23:2087 (2009).
2. Ancheyta, J., Centeno, G., Trejo, F., Speight, J.G.: Catalysis Today, 109: 162 (2005).
3. Apicella, B, Barbella R, Ciajolo, A, Tregrossi, A.: Chemosphere, 51:1063 (2003).
4. Apicella, B., Carpentieri, A., Alfè, M., Barbella, R., Tregrossi, A., Pucci, P., Ciajolo, A.:
Proceedings of The Combustion Institute, 31:547 (2007).
5. Alfè, M., Apicella, B., Tregrossi, A., Ciajolo, A.: Carbon, 46: 2059 (2008).
6. Herod, AA, Bartle, K.D., Kandiyoti, R.: Energy Fuels, 21: 2176 (2007).
7. Apicella, B., Alfè, M., Ciajolo, A., Combust. Sci. Technol., 182(4):640 (2010).
6