petroleum and coal
TRANSCRIPT

Petroleum and Coal
Pet Coal (2018); 60(6): 1228-1240 ISSN 1337-7027 an open access journal
Article Open Access
EVALUATION OF SOURCE ROCKS OF THE CAMPANO-MAASTRICHTIAN NKPORO
GROUP OF ANAMBRA BASIN, SOUTHEASTERN NIGERIA K. C. Chiadikobi and O. I. Chiaghanam
Department of Geology, Faculty of Physical Sciences, Chukwuemeka Odumegwu Ojukwu University, Uli, Anambra State, Nigeria
Received August 16, 2018; Accepted October 19, 2018
Abstract
The Nkporo Group of the Anambra Basin consists mostly of dark-grey to black shales, mudstones,
sandstone and siltstone. The aim of this study is to evaluate the source rocks and paleoenviron-ments of the Nkporo Group in the Anambra Basin. The objectives are to: determine the organic
richness of the source rock and the type of organic matter (kerogen type), determine their thermal
maturity and evaluate the hydrocarbon generation potentials of the source rocks of the Nkporo Group (Nkporo Formation and Enugu Shale). The study was undertaken in three stages: desk
work, field and laboratory studies. Twenty-five samples from the Nkporo Formation and Enugu
Shale were analyzed using Leco CS 125 and HAWK pyrolyser for the organic geochemical param-eters. This parameter was used to assess the source rock quantity and quality, type of organic
matter, maturity and generating potential of the source rocks (shales). From the results of the
geochemical analysis, the Total Organic Carbon (TOC) contents of the Nkporo Formation and Enugu Shale varied from 0.41 to 2.42wt.% and 0.53 to 3.15 wt.% respectively. This shows that
Nkporo Formation and Enugu Shale has fair to very good organic matter contents. The organic
matter richness varies from 0.08 to 4.40mgHC/g for the Nkporo Formation and 0.36 to 3.97mgHC/g for the Enugu Shale. Hydrogen Index versus Oxygen Index plots and visual kerogen
shows that the Nkporo Formation was of Type III/IV while Enugu Shale was of Type II/III kerogen.
The Thermal maturity index (Tmax) of the Nkporo Formation and Enugu Shale varies from 418 to 443°C and 430 to 443°C respectively. These suggest that the Nkporo Formation is marginally
mature to mature while Enugu Shale is mature. The results of this study has shown that the source
rocks of the Nkporo Formation is immature and has not generated hydrocarbon while that of the Enugu Shale is mature and has generated hydrocarbon.
Keywords: Nkporo Formation; HAWK Pyrolysis; Kerogen; Organic Matter; Hydrocarbon.
1. Introduction
Anambra Basin has a total sediment thickness of about 9km and presents an economically viable hydrocarbon Province [1]. It is characterized by enormous lithologic heterogeneity in both lateral and vertical extension [1]. The search for commercial deposit of hydrocarbon in the Anambra Basin has been on the drawing board especially to oil companies and research groups. Initial efforts were unrewarding, and this leads to the neglect of this basin in favour
of the Niger Delta Basin [2-3]. The increasing global energy demand, the advent of improved exploration tools, integrated basin analytical methods, the need to circumvent the pending energy crises, and ultimately the allocation of concession blocks in Anambra Basin, oil/gas exploration and prospecting activit ies have provided the impetus for sustained exploration in the basin. It is against this background that this research focuses on providing necessary infor-
mation to optimize development in exploration and exploitation of petroleum in the Anambra
1228

Petroleum and Coal
Pet Coal (2018); 60(6): 1228-1240 ISSN 1337-7027 an open access journal
Basin. The maturity of organic matters is one of the most important processes in the evalua-tion of sources rock [4] (Fig. 1). Rock-eval pyrolysis and vitrinite reflectance are the most commonly used methods in the assessment of the maturity of organic matter.
Unomah [5] evaluated the quality of organic matter in the Cretaceous shales of the Lower Benue Trough as the basis of the reconstruction of the factors influencing organic sedimenta-
tion. He deduced that the organic matter and shales were deposited under a low rate of dep-osition. Specific reference to the organic richness, quality and thermal maturity in the Mamu Formation and Nkporo Shale has been reported by Unomah and Ekweozor [6. Akaegbobi and Schmitt [7], Obaje et al. [8], Akaegbobi [1] and Ekweozor [9] reported that the sediments are organic rich but of immature status.
Anozie et al. [10] carried out research on thermal maturation of the rock of Campanian Enugu Shale in Anambra Basin, and concluded that the hydrogen index (HI) and generation potential (GP) of the shale attained values required for a quality source rock, suggesting that the shale has to gas generative potential and belong to type III kerogen with few records of type IV kerogen. The degree of thermal maturation obtained from the Rock-Eval data suggests that the shale sediments are thermally immature to generate petroleum. The objectives of this
study sought to determine the organic richness of the source rock, determine the thermal maturity and the type of organic matter and evaluate the hydrocarbon generation and expul-sion potentials of the source rock.
Fig. 1. Geologic Map showing the study area
2. Geologic setting
The oldest succession in the Anambra Basin is Nkporo Group [11]. It was deposited in Late Campanian [12-13]. The Nkporo Group comprises of Nkporo Formation, Enugu Shale and Owelli
Sandstone which is lateral equivalent to each other. Nkporo Group is overlain by Mamu For-mation (Fig 2). It was deposited in Early Maastrichtian [14-15]. It comprises a succession of siltstone, shale coal seam and sandstone [14]. The Ajali Sandstone (Maastrichtian) overlies the Mamu Formation [11-12], which consists mainly of unconsolidated coarse-fine grained poorly cemented sand stone and siltstone [14]. The Ajali Sandstone is overlain by dichronous Nsukka
Formation (Maastrichtian - Danian) which is also known as upper coal measure [15] (Fig. 2).
2.1. Nkporo Formation
The Formation has its type locality at the Nkporo Town in Ohafia Local Government Area of Abia State. The Nkporo Shale is the basal sedimentary unit that was deposited following the Santonian folding in Southeastern Nigeria and indicates a Late Campanian, based on the pres-
1229

Petroleum and Coal
Pet Coal (2018); 60(6): 1228-1240 ISSN 1337-7027 an open access journal
ence of Afrobolivina afra [12]. The Nkporo Formation encountered in the study area is subdivi-sible into two lithostratigraphic units, namely, a lower sandstone and an overlying carbona-ceous mud rock and shale unit. The basal sandstone unit is composed of ferruginized, poorly-sorted, coarse-medium grained and pebbly sandstone that rests unconformably on the tilted Coniacian- Turonian Formations. In boreholes at the proximal Alade and Nzam localities the
unit is up to 150 m thick, while in the more basinal Ogbaku and Leru sections where the unit oversteps the Pre-Campanian Formations, the thickness decreases to less than 10 m. The overlying carbonaceous mud rock unit is better developed in the more basinal area south of Awgu, where it begins with grey, bioturbated mudstone that is characterized by concretionary pyritic layers 5-10 cm in thickness. The interval passes upward into nodular, fossiliferous black
carbonaceous, fissile shale inter-bedded with grey, to milky-white, sharp-based beds of lime-stone and very fine grained sandstone/siltstone [15-18. The best exposure of the Nkporo Shale is at Leru, along the Enugu – Port Harcourt express road. It is also exposed in Abia and Akanu in Arochukwu LGA; Nkporo, Item, Amaiyi in Ohafia LGA all in Abia State; Owutu, Nguzu-Edda, Ekoji and Ebunwana in Afikpo South LGA of Ebonyi State.
2.2. Enugu Shale
The Enugu Shale, a lateral equivalent of the Nkporo Formation, consists of grey, blue or dark shale, occasional white sandstones and striped sandy shale beds [19]. The Formation has its type locality at the Enugu Municipality, with an area coverage that stretches north to Ikem- Ihandiagu area, and southwards to Awgu area [19]. It underlies the Cross-River Plains east of the Enugu Cuesta and largely overlies the Awgu Shale. The formation consists mainly of
shales, with two distinguishable sandstone bodies- the Otobi and the Okpaya Sandstones- which are regarded as members of the Formation [19]. Most of the territory underlain by the formation is low ground except for a few laterites- capped mounds or ridges considered to be erosional resistors left behind as the Cuesta scarp retreated westwards. Relatively consoli-dated siltstones and/or fine sandstones underlie some of these isolated topographic promi-
nences [19]. The best exposure of the Enugu Shale is along the Enugu – Port Harcourt express road, Enugu- Onitsha express road and River Emene all at Enugu State [19].
Fig. 2. Stratigraphic succession of Southeastern Nigeria showing the study area [20]
1230
Petroleum and Coal
Pet Coal (2018); 60(6): 1228-1240 ISSN 1337-7027 an open access journal
3. Methodology
3.1. Total Organic Carbon (TOC) analysis
The total organic carbon (TOC) analysis was performed by means of the LECO CS 125 carbon analyzer according to the following procedure. About 200mg of the pre-clean shale was crushed and accurately weighed into dean LECO crucibles. The rocks were de-mineralised
by hot 10% HCl and afterwards washed repeatedly with distilled water. After drying at 600C, the crucibles were automatically introduced into the furnace for combustion and measurement of the organic carbon content.
3.2. HAWK pyrolysis
An advanced pyrolysis instrument was used to identify the type and maturity of organic
matter and to detect petroleum potential in sediments. This instrument is known as Hydro-carbon Analyzer with Kinetics (HAWK). HAWK pyrolysis is done using the Wildcat Technologies, HAWK™ Plus TOC module at Geomark Research Laboratories, Humble, TX. USA. The HAWK instrument measures all the classical pyrolysis parameters (S1, S2, S3, and Tmax) and TOC (Total Organic Carbon) using only about 100 milligrams of 60 mesh size ground rock sample. In addition, HAWK pyrolysis measures inorganic carbon and therefore gives you the carbonate
carbon content of your rock samples. Acid preparation of samples for TOC analysis on the HAWK is not required. Utilizing the HAWK-eye software, interpretive results such as Oil Satu-ration, Hydrogen Index and Maturity can be obtained in near real-time to facilitate geosteering.
HAWK is ideal for analysis of not only conventional samples but also unconventional ones for which, the rock formation’s generative and non-generative organic carbon contents can be
determined while any generated, expelled or retained hydrocarbons can be quantified. The HAWK’s maximum oven temperature is 850°C which insures complete pyrolysis of difficult to break-down Type III kerogen and also assures you that the complete decomposition of car-bonates such as calcite and dolomite will occur. The HAWK also provides the capability for processing kinetics data using software such as GeoIsochem’s Kinetics05. HAWK’s kinetics
data output can be configured to suit your needs. Whenever desired, analyses on the HAWK can continue overnight with no operator attention because it has a fully electronic, high pre-cision autoloader with removable and interchangeable trays holding up to 126 samples. HAWK's PyroSmart panel displays real-time instrument status without the need of an external PC. All the critical parameters including gas flows are stored within the sample file so when
you review your data, you can go into the data base and look into both the instrument and sample run parameters. HAWK’s data file captures all real-time data associated with individual runs. In addition, HAWK can be used for designation of formation tops and geosteering while drilling. The HAWK instrument was designed with laboratory and well-site in mind. Samples chosen to be measured on the HAWK instrument are usually subsampled from the freeze-
dried material previously crushed for analyses on the coulometer and CNS. The HAWK pyrolysis method consists of a programmed temperature heating (in a pyrolysis
oven) in an inert atmosphere (helium) of a small sample (~100 mg) to quantitatively and selectively determine (1) the free hydrocarbons contained in the sample and (2) the hydro-carbon- and oxygen-containing compounds (CO2) that are volatilized during the cracking of the unextractable organic matter in the sample (kerogen).The analysis process involved the
transfer of each sample into the furnace where it was heated initially at 3000C for three minutes in an atmosphere of helium to release the free hydrocarbons (S1). Pyrolysis of the bound hydrocarbons to give the S2 peak followed immediacy as the oven t emperature was ramped up rapidly to 5500C at the rate of 250C/min. both the S1 and S2 hydrocarbon peaks were measured using a flame ionization detector (FID). A splitting arrangement permitted the
measurement of the S3 peak (carbon dioxide) by means of a thermal conductivity detector (TCD). The instrument automatically recorded the temperature corresponding to the maxi-mum of the S2 peak. i.e. Tmax. An in-built computer processed the raw data afford the values corresponding to the respective rock-Eval indices.
1231

Petroleum and Coal
Pet Coal (2018); 60(6): 1228-1240 ISSN 1337-7027 an open access journal
In summary, the four basic parameters obtained by pyrolysis (Table 1) are as follows:
Table 1. Rock-Eval parameters [21]
Sample Formula Description
S1 (mgHC/g sample) -
S1 (mgHC/g sample) -
S1 (mgHC/g sample) - S1 (mgHC/g sample) -
Tmax(oC) -
PI S1/S1+S2 Production index PC(%) 0.1[0.83(S1+S2)+0.273S3
+0.429(S3CO+0.53S3CO)] Pyrolysable organic carbon
TOC(%) PC+RC Total organic carbon BI (mg HC/g TOC) 100S1/TOC Bitumen index
HI (mg HC/g TOC) 100S2/TOC Hydrogen index
OI (mg CO2/g TOC) 100S3/TOC Oxygen index RC (%) RC CO+ RC CO2 Residual organic carbon
4. Results and discussion
In order to evaluate the organic carbon content and source rock maturity different factors
including organic matter richness, generating potentialities, type of organic matter and ther-mal maturation. Twenty-five (25) shale samples of part of the Nkporo Group (Nkporo For-mation and Enugu Shale) were discussed based on Hydrocarbon Analyzer with Kinetics (HAWK) pyrolysis data and Total organic carbon (Toc) (Table 2a and 2b).
4.1. Organic matter richness
The quantity of organic matter expressed as total organic carbon is a measure of the organic
richness of sedimentary rocks [22] i.e quantity of organic matter presented in rock and ex-pressed as TOC in weight percent of the dry rock. The organic carbon richness of the rock samples (TOC %), is important in the evaluation of source rock for hydrocarbon. Tissot and Welte [4], Peters and Cassa, [23] and Peters [24] presented a scale for the assessment of source rocks potentiality, based on the TOC% and HAWK pyrolysis data (Table 2a and b).
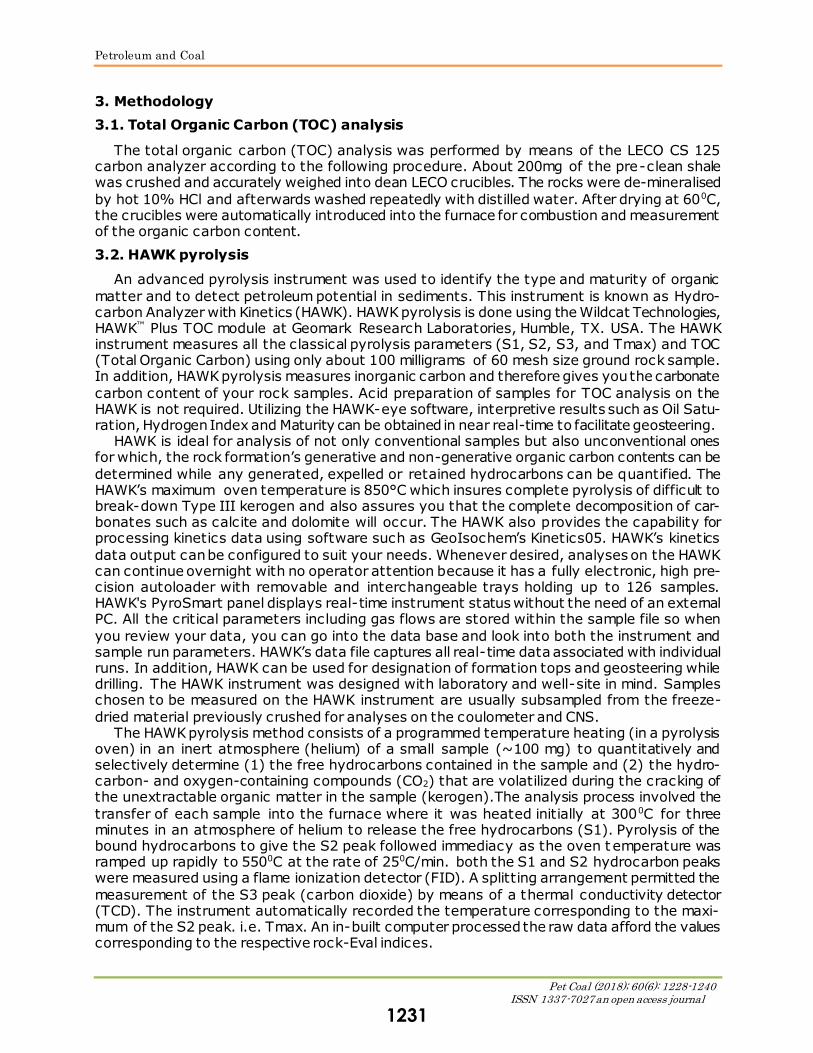
The Total organic carbon (TOC) of the shale samples of the Nkporo Formation ranges from 0.41-3.54 wt% with an average of 1.53 wt% which indicates a good source rock. The Enugu Shale samples range from 0.53-3.39 wt%, with an average of 2.03 wt% (Table 2a and b). This average value indicates a very good source rock [23,25-27]. Total organic carbon (TOC) value of 0.5wt% is the threshold value required for a potential sources rock to generate hy-
drocarbon. The number of free hydrocarbons (gas and oil) in the sample, S1 and the number of hydrocarbons generated through thermal cracking of nonvolatile organic matter, S2 for Nkporo Formation is poor which has an average of 0.07 and 0.05 respectively (Table 2a). The average value of S1, and S2 of Enugu Shale samples, are 0.09 and 1.92 respectively. These values indicate that Enugu Shale is a poor quality source rock for generation of hydrocarbon
(Table 2b). This conclusion is confirmed by the result of the plot of S2 versus TOC (wt %) (Fig. 3) [27-28].
4.2. Generation potential
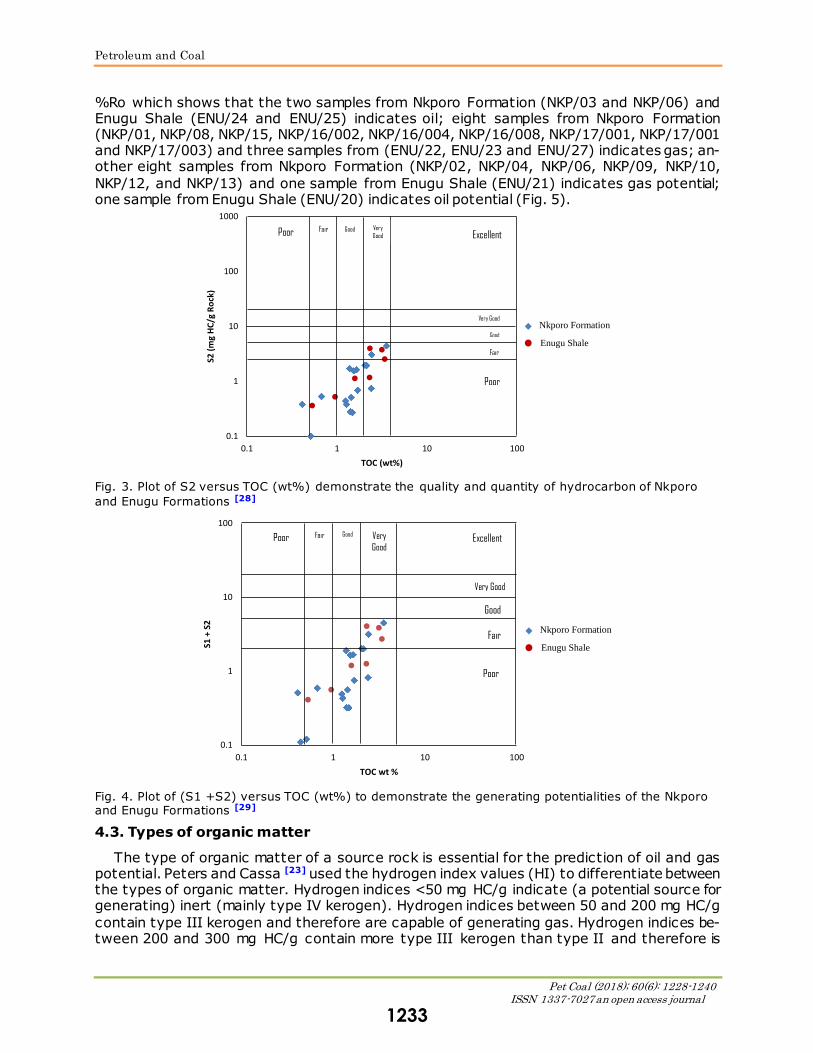
The generation potential (GP) is the sum of the values S1 and S2. According to Hunt [26], source rocks with a GP < 2, from 2 to 5, from 5 to 10 and >10 are considered poor, fair, good
and very good generation potential, respectively. The relationship between (S1+ S2) and TOC (wt%) [27,29] shows that the Nkporo Formation and the Enugu Shale samples are considered as poor to fair source potential (Fig. 4). The average generation potential for Nkporo Formation is 1.22mg/g which indicates a poor source potential, while that of Enugu Shale has an average generation potential of 2.01mg/g which indicates a fair source potential. The hydrocarbon yield is derived from the plot of genetic potential, GP against calculated vitrinite reflectance,
1232
Petroleum and Coal
Pet Coal (2018); 60(6): 1228-1240 ISSN 1337-7027 an open access journal
%Ro which shows that the two samples from Nkporo Formation (NKP/03 and NKP/06) and Enugu Shale (ENU/24 and ENU/25) indicates oil; eight samples from Nkporo Formation (NKP/01, NKP/08, NKP/15, NKP/16/002, NKP/16/004, NKP/16/008, NKP/17/001, NKP/17/001 and NKP/17/003) and three samples from (ENU/22, ENU/23 and ENU/27) indicates gas; an-other eight samples from Nkporo Formation (NKP/02, NKP/04, NKP/06, NKP/09, NKP/10,
NKP/12, and NKP/13) and one sample from Enugu Shale (ENU/21) indicates gas potential; one sample from Enugu Shale (ENU/20) indicates oil potential (Fig. 5).
Fig. 3. Plot of S2 versus TOC (wt%) demonstrate the quality and quantity of hydrocarbon of Nkporo
and Enugu Formations [28]
Fig. 4. Plot of (S1 +S2) versus TOC (wt%) to demonstrate the generating potentialities of the Nkporo and Enugu Formations [29]
4.3. Types of organic matter
The type of organic matter of a source rock is essential for the prediction of oil and gas potential. Peters and Cassa [23] used the hydrogen index values (HI) to differentiate between the types of organic matter. Hydrogen indices <50 mg HC/g indicate (a potential source for generating) inert (mainly type IV kerogen). Hydrogen indices between 50 and 200 mg HC/g
contain type III kerogen and therefore are capable of generating gas. Hydrogen indices be-tween 200 and 300 mg HC/g contain more type III kerogen than type II and therefore is
0.1
1
10
100
1000
0.1 1 10 100
S2 (
mg
HC
/g R
ock
)
TOC (wt%)
Excellent
Very Good
Good
Fair
Poor
Poor Fair Good Very
Good
Nkporo Formation
Enugu Shale
0.1
1
10
100
0.1 1 10 100
S1 +
S2
TOC wt %
Poor
Poor
Fair
Fair Good Very
Good
Good
Very Good
Excellent
Nkporo Formation
Enugu Shale
1233

Petroleum and Coal
Pet Coal (2018); 60(6): 1228-1240 ISSN 1337-7027 an open access journal
capable of generating mixed gas and oil. Hydrogen indices between 300 and 600 mg HC/g contain a substantial amount of type II kerogen and thus are considered to have good source potential for generating oil in the marine environment. Hydrogen indices >600 mg/g usually consist of type I kerogen and thus have excellent potential to generate oil in the lacustrine environment.
In this study, Langford and Blanc-Valleron kerogen type diagram were used to represents the plot of S2 versus TOC (Fig. 6).This diagram shows that the studied samples for Nkporo Formation are characterized by kerogen of type III and type IV having mostly an atomic H/C of <0.7, while that of Enugu Shale is characterized mostly by type III which have an atomic H/C between 0.7 and 1.0.
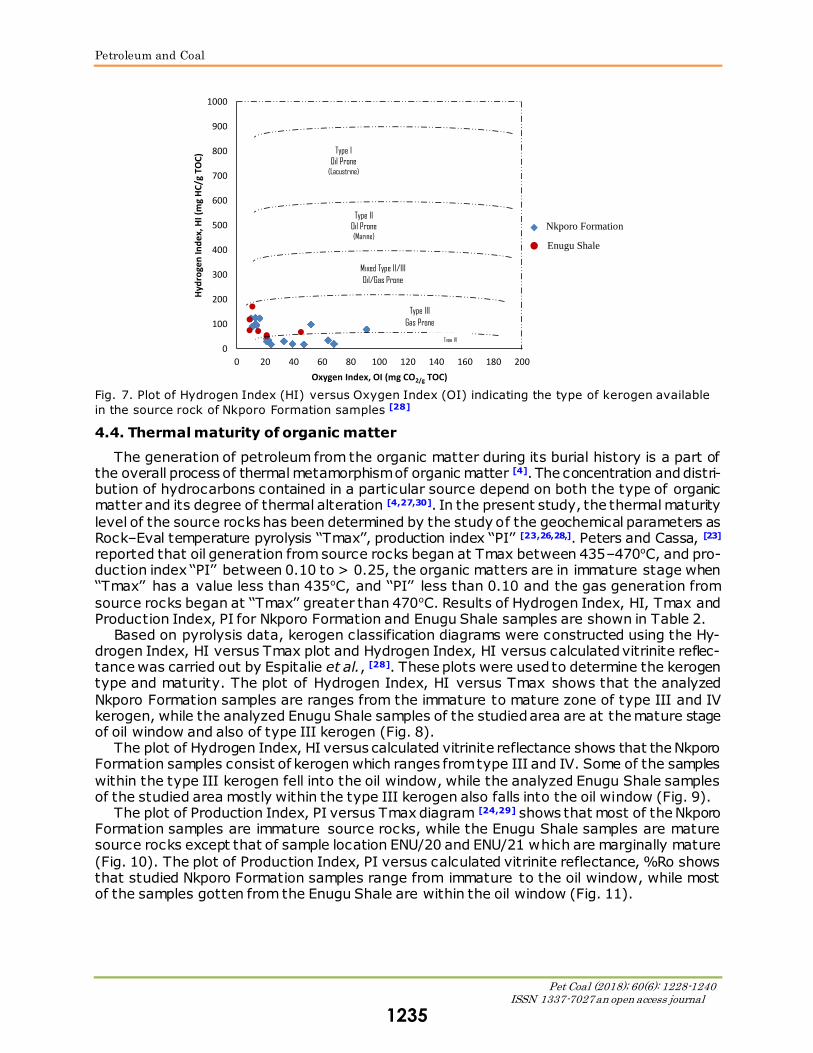
Based on pyrolysis data, kerogen classification diagrams were constructed using the Hy-drogen Index (HI) versus Oxygen Index (OI), which is used to determine the kerogen type (Fig. 7). The results show that the analyzed Nkporo Formation samples are of type III and IV kerogen which is predominantly inert, while the analyzed Nkporo Shale samples are of type III kerogen which is gas prone. Hydrogen Index, HI for Nkporo Formation and Enugu Shale have an average value of 65.72mg HC/g TOC and 87.2972mg HC/g TOC respectively which
indicates gas prone.
Fig. 5. Plot of GP (S1 + S2) versus Calc. %Ro of the Nkporo and Enugu Formations
Fig. 6. Plot of S2 versus TOC (wt%) to identify the kerogen quality/ type of hydrocarbon produced from the source rock of theNkporo Formation [30]
0
5
10
15
20
25
30
0 0.5 1 1.5 2 2.5 3 3.5
S1 +
S2
(m
g H
C/g
Ro
ck)
Calculated Vitrinite Reflectance (%Ro)
Immature O
Imma. G
Oil Wet Gas Thermal Methane
Gas
Nkporo Formation
Enugu Shale
0
10
20
30
40
50
60
0 2 4 6 8 10 12 14 16
Re
mai
nin
g H
ydro
carb
on
Po
ten
tial
, S2
(m
g H
C/g
Ro
ck)
Total Organic Carbon, TOC (wt %)
Type I: Oil Prone
Usually Lacustrine Type I: Oil Prone
Usually Marine
Mixed Type II/III: Oil/Gas Prone
Usually Marine
Type III: Gas Prone
Type IV: Dry Gas Prone
Nkporo Formation
Enugu Shale
1234
Petroleum and Coal
Pet Coal (2018); 60(6): 1228-1240 ISSN 1337-7027 an open access journal
Fig. 7. Plot of Hydrogen Index (HI) versus Oxygen Index (OI) indicating the type of kerogen available
in the source rock of Nkporo Formation samples [28]
4.4. Thermal maturity of organic matter
The generation of petroleum from the organic matter during its burial history is a part of the overall process of thermal metamorphism of organic matter [4]. The concentration and distri-bution of hydrocarbons contained in a particular source depend on both the type of organic matter and its degree of thermal alteration [4,27,30]. In the present study, the thermal maturity
level of the source rocks has been determined by the study of the geochemical parameters as Rock–Eval temperature pyrolysis ‘‘Tmax’’, production index ‘‘PI’’ [23,26,28,]. Peters and Cassa, [23] reported that oil generation from source rocks began at Tmax between 435–470oC, and pro-duction index ‘‘PI’’ between 0.10 to > 0.25, the organic matters are in immature stage when ‘‘Tmax’’ has a value less than 435oC, and ‘‘PI’’ less than 0.10 and the gas generation from
source rocks began at ‘‘Tmax’’ greater than 470oC. Results of Hydrogen Index, HI, Tmax and Production Index, PI for Nkporo Formation and Enugu Shale samples are shown in Table 2.
Based on pyrolysis data, kerogen classification diagrams were constructed using the Hy-drogen Index, HI versus Tmax plot and Hydrogen Index, HI versus calculated vitrinite reflec-tance was carried out by Espitalie et al., [28]. These plots were used to determine the kerogen type and maturity. The plot of Hydrogen Index, HI versus Tmax shows that the analyzed
Nkporo Formation samples are ranges from the immature to mature zone of type III and IV kerogen, while the analyzed Enugu Shale samples of the studied area are at the mature stage of oil window and also of type III kerogen (Fig. 8).
The plot of Hydrogen Index, HI versus calculated vitrinite reflectance shows that the Nkporo Formation samples consist of kerogen which ranges from type III and IV. Some of the samples
within the type III kerogen fell into the oil window, while the analyzed Enugu Shale samples of the studied area mostly within the type III kerogen also falls into the oil window (Fig. 9).
The plot of Production Index, PI versus Tmax diagram [24,29] shows that most of the Nkporo Formation samples are immature source rocks, while the Enugu Shale samples are mature source rocks except that of sample location ENU/20 and ENU/21 which are marginally mature
(Fig. 10). The plot of Production Index, PI versus calculated vitrinite reflectance, %Ro shows that studied Nkporo Formation samples range from immature to the oil window, while most of the samples gotten from the Enugu Shale are within the oil window (Fig. 11).
0
100
200
300
400
500
600
700
800
900
1000
0 20 40 60 80 100 120 140 160 180 200
Hyd
roge
n In
de
x, H
I (m
g H
C/g
TO
C)
Oxygen Index, OI (mg CO2/g TOC)
Type I
Oil Prone (Lacustrine)
Type II
Oil Prone (Marine)
Mixed Type II/III
Oil/Gas Prone
Type III
Gas Prone
Type IV
Nkporo Formation
Enugu Shale
1235

Petroleum and Coal
Pet Coal (2018); 60(6): 1228-1240 ISSN 1337-7027 an open access journal
Fig. 8. Plot of Hydrogen Index (HI) versus Tmax showing the type and maturity of the Nkporo For-mation samples [28]
Fig. 9. Plot of Hydrogen Index (HI) versus Calculated Vitrinite Reflectance (%Ro) showing the type and maturity of the Nkporo Formation samples [28]
Fig. 10. Plot of Hydrogen Index (HI) versus Calculated Vitrinite Reflectance (%Ro) showing the type
and maturity of the Enugu Shale samples [28]
0
100
200
300
400
500
600
700
800
900
1000
330 380 430 480 530 580
Hyd
roge
n In
de
x, H
I (m
g H
C/g
TO
C)
Tmax ºC
Immature Mature Post-mature
Type I
Oil Prone
(Lacustrine)
Type II
Oil Prone (Marine)
Mixed Type II/III Oil/Gas Prone
Type III Gas Prone
Type IV
Nkporo Formation
Enugu Shale
0
100
200
300
400
500
600
700
800
900
1000
0.2 0.4 0.6 0.8 1 1.2 1.4 1.6 1.8 2 2.2
Hyd
roge
n In
de
x, H
I (m
g H
C/g
TO
C)
Calculated Vitrinite Reflectance (%Ro)
Type I Oil Prone
(Lacustrine)
Type II
Oil Prone (Marine)
Mixed Type
III Oil/Gas Prone
Type III
Gas Prone
Nkporo Formation
Enugu Shale
0
0.1
0.2
0.3
0.4
0.5
0.6
0.7
0.8
0.9
1
380 430 480 530 580
Pro
du
ctio
n In
de
x (P
I)
Tmax (ºC)
Immature Oil
Zone
WG
Z
Dry Gas Zone
Stains or
Shows
High Level Conversion × Expulsion
Nkporo Formation
Enugu Shale
1236
Petroleum and Coal
Pet Coal (2018); 60(6): 1228-1240 ISSN 1337-7027 an open access journal
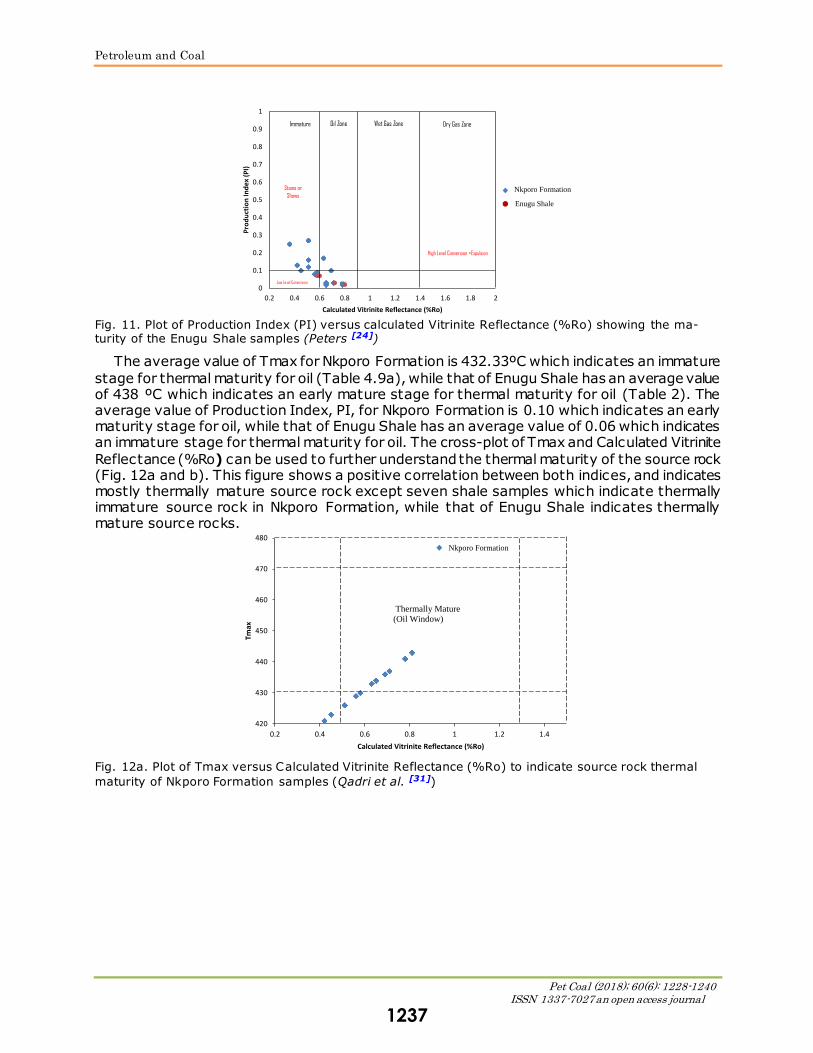
Fig. 11. Plot of Production Index (PI) versus calculated Vitrinite Reflectance (%Ro) showing the ma-turity of the Enugu Shale samples (Peters [24])
The average value of Tmax for Nkporo Formation is 432.33ºC which indicates an immature
stage for thermal maturity for oil (Table 4.9a), while that of Enugu Shale has an average value of 438 ºC which indicates an early mature stage for thermal maturity for oil (Table 2). The average value of Production Index, PI, for Nkporo Formation is 0.10 which indicates an early maturity stage for oil, while that of Enugu Shale has an average value of 0.06 which indicates an immature stage for thermal maturity for oil. The cross-plot of Tmax and Calculated Vitrinite
Reflectance (%Ro) can be used to further understand the thermal maturity of the source rock (Fig. 12a and b). This figure shows a positive correlation between both indices, and indicates mostly thermally mature source rock except seven shale samples which indicate thermally immature source rock in Nkporo Formation, while that of Enugu Shale indicates thermally mature source rocks.
Fig. 12a. Plot of Tmax versus Calculated Vitrinite Reflectance (%Ro) to indicate source rock thermal
maturity of Nkporo Formation samples (Qadri et al. [31])
0
0.1
0.2
0.3
0.4
0.5
0.6
0.7
0.8
0.9
1
0.2 0.4 0.6 0.8 1 1.2 1.4 1.6 1.8 2
Pro
du
ctio
n In
de
x (P
I)
Calculated Vitrinite Reflectance (%Ro)
Immature Oil Zone Wet Gas Zone Dry Gas Zone
Stains or
Shows
High Level Conversion ×Expulsion
Low Level Conversion
Nkporo Formation
Enugu Shale
420
430
440
450
460
470
480
0.2 0.4 0.6 0.8 1 1.2 1.4
Tmax
Calculated Vitrinite Reflectance (%Ro)
Thermally Mature
(Oil Window)
Nkporo Formation
1237

Petroleum and Coal
Pet Coal (2018); 60(6): 1228-1240 ISSN 1337-7027 an open access journal
Fig. 12b. Plot of Tmax versus Calculated Vitrinite Reflectance (%Ro) to indicate source rock thermal
maturity of Enugu Shale samples (Qadri et al. [31])
The summary of the interpreted result of HAWK pyrolysis on shale samples of the Campa-
nian Nkporo Group shows that the Total Organic Carbon (TOC) content of Nkporo Shale ranges from poor to very good source rock which is mostly thermally immature and the percent of maturity is about 33.33%. The Total Organic Carbon (TOC) content of Enugu Shale ranges
from fair to very good source rock which is mostly thermally mature and can yield mostly gas and little oil. The percentage maturity of Enugu Shale is about 71.47 (Table 3).
The correlation of various maturation indices and zone of petroleum generation and de-struction shows that the vitrinite reflectance of Nporo Formation ranges from 0.36 to 0.81 %Ro while that of Enugu Shale ranges from 0.60 to 0.81% (Fig. 13). The Tmax of Nkporo
Shale ranges from 418 to 441ºC while that of Enugu Shale ranges from 430 to 443ºC. You may recall that the Vitrinite Reflectance and Tmax are indicators in the maturity of organic matter and has a benchmark of 0.60%Ro and 435ºC respectively which reflects the early maturity stage in the generation of hydrocarbon.
Fig. 13. Correlation of various maturation indices and zone of petroleum generation and destruction of
the Nkporo and Enugu Formations (Jarvie [21])
420
430
440
450
460
470
480
0.2 0.4 0.6 0.8 1 1.2 1.4
Tmax
Calculated Vitrinite Reflectance (%Ro)
Thermally Mature
(Oil Window)
Enugu Shale
Bitu
men
Nkporo Formation
Enugu Shale
1238
Petroleum and Coal
Pet Coal (2018); 60(6): 1228-1240 ISSN 1337-7027 an open access journal
5. Conclusion
From the results of the geochemical analysis, The Total Organic Carbon (TOC) contents of
the Nkporo Formation and Enugu Shale varied from 0.41 to 2.42wt.% and 0.53 to 3.15 wt.% respectively. This showed that Nkporo Formation and Enugu Shale had fair to very good or-ganic matter contents. The organic matter richness varied from 0.08 to 4.40mgHC/g for the Nkporo Formation and 0.36 to 3.97mgHC/g for the Enugu Shale. Hydrogen Index versus Oxygen Index plots and visual kerogen showed that the Nkporo Formation was of Type III/IV while Enugu Shale was of Type III kerogen. The Thermal maturity index (Tmax) of the Nkporo
Formation and Enugu Shale varied from 418 to 443°C and 430 to 443°C respectively. These suggested that the Nkporo Formation was marginally mature to mature while Enugu Shale was mature. The results of this study has shown that the source rocks of the Nkporo Formation is immature and has not generated hydrocarbon while that of the Enugu Shale is mature and has generated hydrocarbon.
References
[1] Akaegbobi MI. Sequence Stratigraphy of Anambra Basin. Journal of African Eath Sciences,
2005; 42: 394-406.
[2] Reijers TJA. Selected Chapters in Geology, Sedimentary Geology and Sequence Stratigraphy in Nigeria and Three Case Studies and a Field Guide. SPDC of Nig. Corporate Reprographic
Services, Warri, 1996; 197.
[3] Nexant I. National oil and gas policy: A draft report prepared for the Bureau of Public Enter-prises (Nigeria) by Nexant, Griffin House, In: Obaje, Wehner H, Scheeder G, Abubakar MB,
Jauro A Hydrocarbon prospectivity of Nigeria’s inland basins: From the viewpoint of organic
geochemistry and organic petrology. Am. Assoc. Petrol. Geol. Bull., 2003; 88 (3): 326-327. [4] Tissot BP, and Welte DH. Petroleum Formation and Occurrence: New York, Springer-Verlag,
1984; 699.
[5] Unomah GI. Petroleum evaluation of Upper Cretaceous Shales in Lower Benue Trough, Nige-ria, Unpublished Ph. D. Thesis, Univ. of Ibadan, Ibadan Nigeria, 1989; 164
[6] Unomah GI, and Ekweozor CM. Petroleum Source Rock Assessment of the Campanian Nkporo
Shale, Lower Benue Trough, Nigeria. Nigeria Association of Petroleum Explorationist Bulletin. 1993; 8: 172-186.
[7] Akaegbobi MI, and Schmitt M. Organic facies, Hydrocarbon Source Potential and the Recon-
struction of the Depositional Paleoenvironment of the Campano- Maastrichtian Nkporo Shale in the Cretaceous Anambra Basin, Nigerian. Nigeria Association of petroleum explorationist,
1998; 19: 1-19.
[8] Obaje NG, Wehner H, Scheeder O, Abubakar MB, Jauro H. Hydrocarbon prospectivity of Nige-ria`s inland basins: from the view point of organic geochemistry and organic petrology. AAPG
Bull. 2004; 87: 325-353.
[9] Ekweozor CM. Investigation of Geohistory of Anambra Basin, part 5 case history 3,” in Basic Geochemistry, Lecture Presented at the Oil and Gas Academy, Port Harcourt, 2006; 210-215.
[10] Anozie HC, Chiaghanam OI, and Chiadikobi KC Source Rock and Thermal Maturation of Cam-
panian Enugu Shale in Anambra Basin, Southeastern Nigerian. Intl. Journal of Geol., Earth and Environmental science, 2014; 4 (3): 296-307.
[11] Nwajide CS. Cretaceous Sedimentation and Paleogeography of the Central Benue Trough. In
Ofoegbu, C.O; (Ed.), The Benue Structure and Evolution. International monograph series,
Branuschweig, 1990; 19-38. [12] Reyment RA. Aspects of the geology of Nigeria: The stratigraphy of the Cretaceous and Ce-
nozoic Deposits. University of Ibadan press, Nigeria, 1965; 145.
[13] Obi GC. Okogbue CO, and Nwajide CS. Evolution of the Enugu cuesta: A tectonically driven erosion process: Global journal of pure and Applied science, 2001; 7: 321-330.
[14] Kogbe CA. The Cretaceous and Polygene Sediments of southern Nigeria: In: Kogbe C.A. (Ed.)
Geology of Nigeria. Elizabeth publ., Lagos, Nigeria, 1989; 273-286. [15] Obi GC. Depositional model for the Campanian-Maastrichtian succession, Anambra Basin,
Southeastern Nigeria. Unpublished Ph.D thesis, University of Nigeria, Nsukka, Nigeria, 2000; 291.
[16] Arua I. Borings and shell damage in Eocene Gastropoda: Southeastern Nigeria, Paleoclimatol-ogy and Paleoecology, 1988; 13: 120126.
1239
Petroleum and Coal
Pet Coal (2018); 60(6): 1228-1240 ISSN 1337-7027 an open access journal
[17] Okoro AU. Depositional History of the Sandstone Facies of the Nkporo Formation (Campanian-Maastrichtian) in Leru Area, Southeastern Nigeria, Journal of Mining Geology, 1995; 31 (2):
105-586.
[18] Zaborski P. Stratigraphy and Structure of the Cretaceous Gongola Basin, Northeast Nigeria. Bulletin du Centre de Recherches elf Exploration Production, 1983, 21 (1): 153-185.
[19] Nwajide CS. Geology of Nigeria’s sedimentary Basin.CSS Bookshops, 2013; 277-518.
[20] Ekwenye OC, and Nichols G. Depositional Facies and Ichnology of a Tidally Influenced Coastal Plain Deposit: The Ogwashi Formation, Niger Delta Basin. Arabian Journal of Geosciences,
2016; 9: 1-27.
[21] Jarvie DM. Shale Resource Systems for Oil and Gas: In: Breyer, J. A., Shale Reservoirs Giant Resources for the 21st Century: AAPG Memoir, 2012; 97: 69 – 87.
[22] Jarvie DM. Total Organic Carbon (TOC) analysis. In: Merril, R.K., (ed.), Treatise of petroleum
geology. Handbook of Petroleum geology, source and migration processes and evolution tech-niques. AAPG Bulletin, 1991; 113-118.
[23] Peters KE, and Cassa MR. Applied source rock Geochemistry. In: the petroleum system from
source to trap. Magoon, L.B. and Dow, W.G. (editors). AAPG memoir, 1994; 60: 93-117. [24] Peters KE. Guidelines for Evaluating Petroleum Source Rocks using programmed Analysis.
AAPG Bulletin, 1986; 70: 318-329.
[25] Hedberg DM, and Moody JO. Petroleum Prospects of Deep Offshore. AAPG Bulletin, 1979; 63: 286-300.
[26] Hunt JM. 1996. Petroleum Geochemistry and Geology: Freeman, W.H., San Francisco, 617.
[27] El Nady MM, Ramadan FS, Hammad MM and Lotfy NM. Evaluation of organic matters, hydro-carbon potential and thermal maturity of source rocks based on geochemical and statistical
methods: Case study of source rocks in Ras Gharib oilfield, central Gulf of Suez, Egypt. Egypt.
J. Pet., 2015; 24 (2): 203-211. [28] Espitalie J. Deroo G, and Marquis F. Rock–Eval Pyrolysis and its Application, Inst. Fr. Petrol.,
1985; 72.
[29] Waples DW. Geochemistry in Petroleum Exploration. Inter. Human Resources and Develop. Co., Boston, 1985; 232.
[30] Longford FF, and Blanc-Valleron MM. Interpreting Rock–Eval Pyrolysis Data using Graphs of
Pyrolyzable Hydrocarbons vs. Total Organic Carbon, AAPG Bull., 1990; 74: 799–804. [31] Qadri ST, Shalaby MR, Islam MA, and Hoon LL. Source rock characterization and hydrocarbon
generation modeling of the Middle to Late Eocene Mangahewa Formation in Taranaki Basin,
New Zealand. Arabian J. Geosci. 2016; 9 (10): 8-9.
To whom correspondence should be addressed: K. C. Chiadikobi, Department of Geology, Faculty of Physical
Sciences, Chukwuemeka Odumegwu Ojukwu University, Uli, Anambra State, Nigeria, [email protected]
1240