shelf petroleum system of the columbus basin, offshore trinidad, west indies. ii. field geochemistry...
TRANSCRIPT
Shelf petroleum system of the Columbus basin, offshore Trinidad,
West Indies. II. Field geochemistry and petroleum migration model
Richard G. Gibson*, Leon I.P. Dzou
BP North American Exploration, 501 Westlake Park Blvd, Houston, TX 77079, USA
Received 14 October 2002; received in revised form 28 October 2002; accepted 3 November 2003
Abstract
Petroleum migration patterns in the present-day shelf area of the Columbus basin reflect a complex interaction of structural evolution,
stratigraphic architecture, and fault-seal behavior. Thermogenic charge access is ultimately controlled by the geographic distribution of sand-
prone carrier beds and how these vertically stacked stratigraphic units relate spatially to one another along their basinal limits. Migration in
this system consists of two components, cross-stratal migration through mud-dominated, deep-water (slope and basin floor) sediments
followed by horizon-parallel flow along laterally extensive, sand-prone, shelf carrier beds. Thermogenic charge access to any individual sand
occurs only in a linear geographic area where that sand is not shielded from vertical migration by stratigraphically older sands.
The geochemical characteristics of the trapped petroleum in this system are primarily a reflection of migration distance, with the earliest-
expelled (lowest maturity) products having progressed farthest along the migration pathway. Because of the stratigraphic architecture and
structural geometry involved, a pattern of increasing thermogenic content and maturity with depth at any location is created, despite the fact
that a significant portion of the migration is horizon-parallel. In parts of the basin, this simple pattern has been overprinted by complex
mixing of maturity fractions in single accumulations as a result of late-stage differential source-rock uplift. The observations are inconsistent
with previously proposed models for this basin that emphasize petroleum fractionation accompanying vertical migration through the shelf
stratigraphic section.
q 2003 Elsevier Ltd. All rights reserved.
Keywords: Trinidad; Petroleum geology; Geochemistry
1. Introduction
In Part I of this paper (Gibson, Dzou, & Greeley,
2004), we presented a petroleum source-rock evaluation
of the Columbus basin, offshore Trinidad, based on the
distribution of petroleum type, thermal modeling con-
siderations, and general geochemical characteristics of the
trapped petroleum. This work showed that a geographic
variation in source-rock quality due to depositional
environment is the primary control on product distribution
in the basin. In addition, we showed that biogenic gas is a
ubiquitous component of the petroleum in the area and
constitutes a significant fraction of the trapped
accumulations.
In this paper, we focus on post-expulsion aspects of the
petroleum system, including migration pathways from
source to trap and how these control the detailed distribution
of petroleum within individual fields and at the basin scale.
In order to do this, we interpret the geochemical patterns in
two representative fields in the context of the stratigraphic
and structural framework of these areas. The resulting
models are then generalized and adapted to the basin scale.
Finally, we discuss the exploration implications of these
models.
2. Description of the Columbus basin
2.1. Stratigraphy
The regional setting, framework, and Cretaceous through
early Oligocene evolution of the Columbus basin were
described by Gibson et al. (2004) and are not repeated here.
During late Oligocene to middle Miocene time, the
Southern basin of Trinidad and the offshore Columbus
0264-8172/$ - see front matter q 2003 Elsevier Ltd. All rights reserved.
doi:10.1016/j.marpetgeo.2003.11.002
Marine and Petroleum Geology 21 (2004) 109–129
www.elsevier.com/locate/marpetgeo
* Corresponding author.
E-mail address: [email protected] (R.G. Gibson).

basin comprised a foreland basin associated with southeast
vergent thrusting to the north (Algar, 1998; DiCroce, Bally,
& Vail, 1999). Since late Miocene time, when the paleo-
Orinoco river drainage was diverted eastward by the rising
Serrania del Interior Oriental (Hoorn, Guerrero, Sarmiento,
& Lorente, 1995), southern Trinidad and the Columbus
basin have been the loci of deposition of siliciclastic
sediments that locally exceed 30,000 ft (9150 m) in
thickness.
On seismic lines in the southwestern part of the
Columbus basin, a thick wedge observed between lower
Tertiary and basal Pliocene is inferred to be of upper-
Oligocene through Miocene age. Only the top of this
succession has been penetrated by a couple of deep wells in
the far southwestern part of the basin and, thus, its lithologic
character is not known for certain. The section is thickest in
the north (,10,000 ft, 3050 m) and thins gradually south-
ward while onlapping the underlying passive margin
(DiCroce et al., 1999). Well data from the Amacuro shelf
in Venezuela indicate that this section consists largely of
outer shelf to slope shales (DiCroce et al., 1999), whereas
the correlative units to the north in Trinidad’s Southern
Range (Cipero Fm.) are deep-water marls (Stainforth,
1948). Thus, this interval within the Columbus basin is
interpreted to be dominantly deep-water mudstones. In the
main petroleum-productive part of the Columbus basin,
much of this section has been tectonically removed due to
large-magnitude extension (see below).
Overlying the pre-Pliocene wedge is the Plio-Pleistocene
progradational sequence of the Orinoco delta. This section,
the principal one penetrated by offshore wells, consists of
interbedded mudstone and poorly consolidated sandstone
deposited during eastward progradation of the Orinoco
system (DiCroce et al., 1999; Wood, 2000). Since middle
Miocene time, the depositional system has prograded
towards the NE, with the shelf edge migrating ,400 km
from a position in eastern Venezuela to its current position
,100 km east of the Trinidad coast (DiCroce et al., 1999).
Shelf edge positions within the Columbus basin at various
times are shown in Fig. 1a. All of the shelfal deposition
within the study area occurred since approximately 5 Ma
(Wood, 2000).
The Plio-Pleistocene stratigraphic framework used for
this study is based on that of Wood (2000) with some
modifications based on seismic mapping. Within any
chronostratigraphic interval of this progradational section,
depositional environments change from coastal plain
through shallow marine to slope and basinal settings toward
the northeast. In the southwestern part of the basin (south of
Trinidad), the Plio-Pleistocene succession is approximately
15,000 ft (4600 m) thick. Farther toward the northeast, the
section is progressively expanded across a series of down-
to-NE growth faults, with the section locally exceeding
30,000 ft (9150 m) thick. The Plio-Pleistocene shelf depos-
its in the expanded area define a series of eastward-
thickening sedimentary wedges that reflect syn-kinematic
deposition on the downthrown side of a system of SW-
dipping (counter-regional) normal faults just outboard of the
present-day shelf edge. Accommodation space for the
deposition of these thick sediment packages was structurally
generated by extension and partial to complete removal of
Miocene through lower Tertiary strata.
As discussed in detail by Heppard, Cander, and
Eggertson (1998), the deep stratigraphy in most of the
discovered fields is overpressured, with fluid pressures
locally approaching the fracture condition for the shales.
The top of the abnormally pressured section is not
regionally at a constant stratigraphic level, but occurs in
younger strata toward the northeast (Heppard et al., 1998;
Wood, 2000). The transition from normal to abnormal
pressure typically occurs close to the shelf to slope
transition (see Wood, 2000), where sand content within
the stratigraphic section decreases from .50% in the shelf
to ,25% on the slope.
2.2. Structural geology
The Plio-Pleistocene section in the Columbus basin is
affected by two sets of structural elements (Leonard, 1983):
(1) a syn- to post-depositional, NW–SE striking extensional
fault system and (2) a series of NE – SW trending
contractional folds. The principal structural detachment
for both sets of structures occurs near top Cretaceous,
probably within lower Tertiary or uppermost Cretaceous
shales.
The extensional fault system within the basin is bounded
on the northeast by a family of large-displacement, counter-
regional (SW-dipping), listric normal faults situated near the
present-day shelf edge (Fig. 1b and c). Movement on these
counter-regional faults accounted for much of the extension
within the basin and, as the depositional system prograded,
the shelf edge generally tracked along the hanging wall side
of the active counter-regional system (Wood, 2000). Major
NE-dipping normal faults dominate the extensional system
in the hanging wall of the counter-regional system and
typically cross-cut it, progressively translating the upper-
most counter-regional fault segments out into the basin
toward the NE. Broad, asymmetric rollover anticlines are
created by a combination of slip on the counter-regional and
NE-dipping normal faults. Secondary normal faults structu-
rally segment these rollover anticlines.
Structures related to crustal shortening include a series of
NE–SW trending ridges that generally decrease in ampli-
tude from NW to SE across the basin. The flanks of Galeota
Ridge, located in the NW, locally have limb dips up to 458,
whereas the ridges further south have limb dips of ,108. In
some areas, superposition relationships between faults and
folds indicate that shortening began after and/or outlasted
the extensional deformation phase at any given location.
As discussed by Gibson et al. (2004), the Cretaceous
source beds occur below the structural detachment and have
a much simpler geometry that is discordant to the overlying
R.G. Gibson, L.I.P. Dzou / Marine and Petroleum Geology 21 (2004) 109–129110
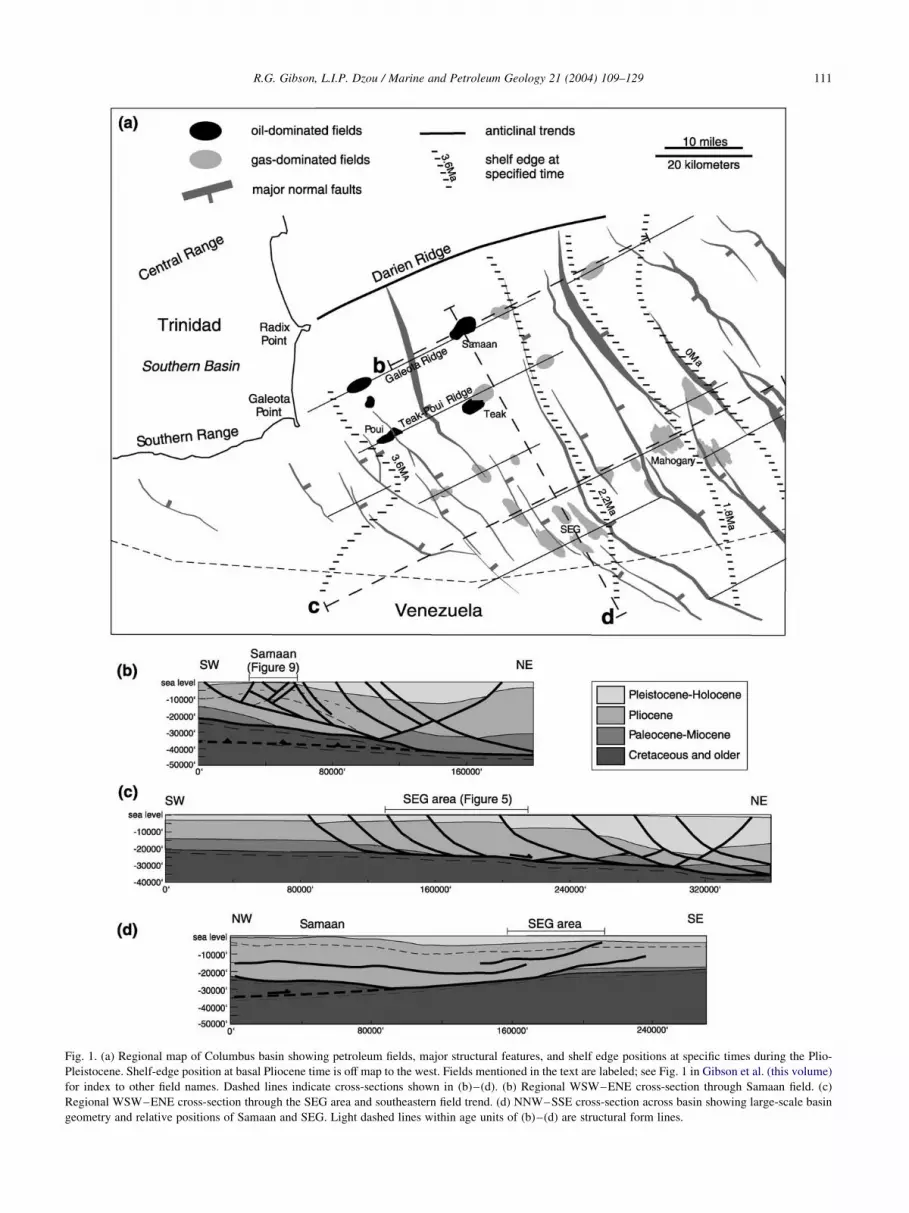
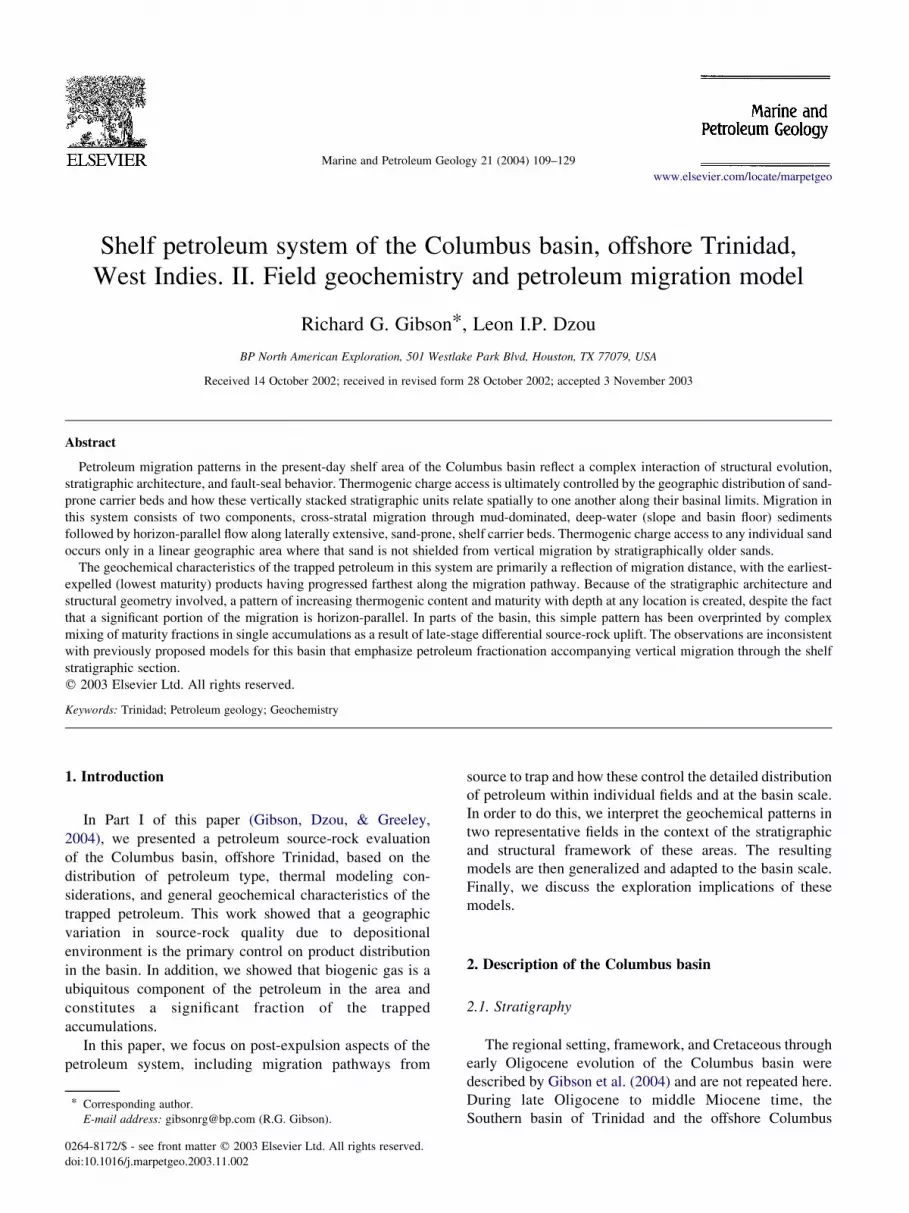
Fig. 1. (a) Regional map of Columbus basin showing petroleum fields, major structural features, and shelf edge positions at specific times during the Plio-
Pleistocene. Shelf-edge position at basal Pliocene time is off map to the west. Fields mentioned in the text are labeled; see Fig. 1 in Gibson et al. (this volume)
for index to other field names. Dashed lines indicate cross-sections shown in (b)–(d). (b) Regional WSW–ENE cross-section through Samaan field. (c)
Regional WSW–ENE cross-section through the SEG area and southeastern field trend. (d) NNW–SSE cross-section across basin showing large-scale basin
geometry and relative positions of Samaan and SEG. Light dashed lines within age units of (b)–(d) are structural form lines.
R.G. Gibson, L.I.P. Dzou / Marine and Petroleum Geology 21 (2004) 109–129 111
Plio-Pleistocene units. The large-magnitude extension
within the overlying section thinned or removed much of
the Miocene through lower Tertiary section within the
growth-faulted domain. This typically results in close
juxtaposition of the Cretaceous source with part of the
Plio-Pleistocene section.
3. Previous petroleum migration models
Previous work in the Columbus basin has led to conflicting
ideas about petroleum migration processes. Early ideas
presented by Leonard (1983) were developed using an
upper-Miocene source-rock and involved migration of
petroleum along major growth faults into traps within the
Plio-Pleistocene section. Leonard (1983) concluded that
trapped petroleum phase (oil versus gas) is related to the
degree of source-rock maturity at the time that faults cut
through the section, connecting the source and reservoir
(Fig. 2a). This model was used to explain the observed lateral
segregation of oil (west) and gas (east) in Teak field (Fig. 1a).
In work focused on understanding fault seals in Teak and Poui
fields (Fig. 1), Gibson (1994) questioned the fault-conduit
interpretation and suggested that the phase distribution in
these fields could have resulted from preferential migration of
gas across the major faults that subdivide the fields.
Geochemical-based analyses (Heppard, Ames, & Ross,
1990; Persad et al., 1993; Ross & Ames, 1988) defined
Fig. 2. Previously proposed petroleum migration models for the Columbus basin: (a) fault migration into Teak field to explain lateral segregation of oil and gas
(after Leonard, 1983); (b) tortuous vertical migration out of overpressured section into Samaan field (based on Heppard et al., 1990, 1998); (c) combined lateral
and vertical migration into Mahogany field controlled by geometry of shelf sand terminations (after Gibson & Bentham, 2003). Arrows indicate petroleum flow
pathways; dark gray in (b) and (c) is overpressured section; light gray in (c) shows extent of shelf sands.
R.G. Gibson, L.I.P. Dzou / Marine and Petroleum Geology 21 (2004) 109–129112
vertical compositional changes of oils in several fields
(Samaan, Teak, Poui—Fig. 1a) and led to the development
of more vertical-directed migration models (Fig. 2b). These
authors interpreted that the presence of progressively lighter
petroleum at shallower depths was produced by migration-
fractionation (‘evaporative fractionation’ of Persad et al.,
1993). Migration pathways from the deep source were
postulated to be either along faults (Heppard et al., 1990;
Persad et al., 1993) or through zones of pervasive hydraulic
fracturing within the overpressured section (Heppard et al.,
1998). Final petroleum migration into the structural traps
was interpreted to have been driven by pressure-induced
fracturing during Pleistocene uplift and deformation
(Heppard et al., 1998).
Most recently, Gibson and Bentham (2003) developed a
migration model based on a study of fault seals in Mahogany
field (Fig. 1a) that emphasizes the role of lateral migration
within sheet-like, shelf sand horizons (Fig. 2c). In this
model, vertical migration from the deep source through
deep-water mudstones is laterally displaced from the
present-day accumulations, and the distribution of pet-
roleum within the fields is largely controlled by lateral
migration pathways within sand carrier beds. Charge access
into the shelf sands is controlled by the basinward-stepping
geometry of successive shelf edges. Faults set up the trap
geometries and serve as barriers/baffles to migration, but do
not act as migration pathways.
In the following sections, we attempt to reconcile these
contrasting models by interpreting a geochemical data set in
the context of the stratigraphic and structural evolution
described in Section 2.
4. Analytical methods and interpretation approach
Selected oil and condensate samples collected over the
last 30 years from the study area were prepared and
analyzed at Baseline-DGSI in The Woodlands, TX. The
samples were topped under a stream of nitrogen at 40 8C for
1 h and excess pentane was added to precipitate asphaltenes.
The polar fraction was removed using a Waters Sep-Pak
Plus CN cartridge with pentane solvent. The saturated
hydrocarbon fraction was separated by medium-pressure
liquid chromatography using deactivated silica and acti-
vated silica columns. Whole oils were spiked with trans-2-
heptene as an internal standard and analyzed on a Hewlett
Packard 5890 Series II gas chromatograph. The data were
processed using EZ Chrom software from Scientific Soft-
ware Inc. An aliquot of the saturate fraction for GC-MS
analysis was diluted with cyclohexane and spiked with 5b-
cholane as an internal standard. Ortho-biphenyl was used as
the internal standard during analysis of the aromatic
fraction. GC-MS analysis was performed on a Hewlett
Packard 5890 Series II gas chromatograph coupled to a
Hewlett Packard 5970 Series mass selective detector.
Analytical conditions used for oil and condensate analyses
are documented by Dzou, Holba, Ramon, Moldowan, and
Zinniker (1999). Carbon isotopic analyses of natural gas
samples were performed at Isotech Laboratories in Cham-
pagne, IL.
The principle aim of the geochemical work was to
characterize variations in thermogenic–biogenic petroleum
ratio and maturity to be used as indicators of the migration
pathways responsible for charging of the Columbus basin
fields. Interpretation of the relative contributions of
thermogenic and biogenic petroleum to a sample is based
on gas carbon isotope data, assuming that the biogenic
fraction is methane-dominated and isotopically light
(Clayton, 1991). Thus, plots of d 13C for methane through
butane (C1 –C4) are expected to exhibit the greatest
depression of d 13C C1 for samples with the largest biogenic
contribution.
Biogenic gas can exist either on its own or as mixtures
with thermogenic products. The phase behavior during
mixing will depend on the degree of saturation of the
interacting phases. For instance, oil interacting with pure
biogenic gas (.99% C1) is likely to initially go into solution
until the gas contains enough heavy components to be in
thermodynamic equilibrium with the oil. At the other end of
the spectrum, an undersaturated oil will dissolve biogenic
gas until it becomes gas saturated.
Maturity evaluation of the oil and condensate samples
was done using a variety of molecular and biomarker ratios
that reflect thermal stress-dependent (time and temperature)
transformation reactions. Key ratios used in this study,
selected for their overall insensitivity to fractionation
processes (Dzou & Hughes, 1993), include nC17/pristane,
nC18/phytane, C29 20S/(20S þ 20R), and methylphenan-
threne index (MPI ¼ 3 þ 2/9 þ 1). For all of the maturity
indices used in this paper, greater values imply higher
maturity. Normal-alkane/isoprenoid ratios, such as nC17/
pristine and nC18/phytane, are well-established maturity
indicators that have been used to assess maturity of both
source rocks and oils (Connan & Cassou, 1980; Tissot,
Califet-Debyser, Deroo, & Oudin, 1971); these have
dynamic ranges that correspond to the early to main stages
of petroleum generation. Since organic matter type and
depositional environment can affect these ratios, we have
limited their use to comparative analysis within small areas
where we can assume a high degree of average source-rock
homogeneity. In addition, we have restricted our analyses to
non- or mildly biodegraded samples where these ratios are
unlikely to be affected.
Mackenzie (1984) and Peters and Moldowan (1993) have
reviewed the use of biomarkers for maturity assessment.
Specific biomarker ratios undergo their greatest change in
value over narrow ranges of thermal stress (8C) or %Ro, and
the effective range varies from one biomarker to another.
For instance, TR23/H30 is sensitive to maturity changes
over the 120 – 150 8C thermal stress (0.6 – 1.0% Ro)
range (Peters & Moldowan, 1993). Other biomarkers that
are sensitive over narrow ranges include C20/C28R
R.G. Gibson, L.I.P. Dzou / Marine and Petroleum Geology 21 (2004) 109–129 113

(120–150 8C, 0.6–1.0% Ro) and C29 S/S þ R (90–120 8C,
0.5 – 0.7% Ro). The methylphenanthrene index
(MPI ¼ 3 þ 2/9 þ 1) is particularly suited for maturity
assessment at elevated maturity levels (%Ro . 1.0, 150–
200 8C; Cassani, Gallango, Talukdar, Vallejos, & Ehrmann,
1988; Radke, 1988). Therefore, we use MPI as an indication
of the degree to which the high-maturity portion of the
charge was captured into an accumulation.
Since the generation and expulsion of petroleum from a
source-rock occurs over a range of depth and thermal stress,
a petroleum reservoir should receive progressively more
mature petroleum as it is filled from a source-rock
undergoing continuous burial, assuming that the reservoir
remains in communication with the source-rock. Thus, if a
field is filled uni-directionally in a sequential manner, the
most mature petroleum in the reservoir should be located
nearest to the point of charge influx from the expelling
kitchen (England & Mackenzie, 1989). If migration
continues throughout the entire petroleum generation
process, a reservoir at the margin of a source kitchen
could sequentially receive early, early þ main, early þ
main þ late, early þ main þ late þ over mature products
expelled from the source-rock. However, if a reservoir is
isolated from the petroleum source at some stage during the
expulsion history, it will lack geochemical indicators of
the maturity reached after the time of isolation. Ultimately,
the type and geochemical characteristics of petroleum in a
reservoir depends not only on the thermal stress state and
characteristics of the source-rock, but also on the avai-
lability of migration pathways and traps relative to the
moving locus of expelled petroleum.
5. Representative field examples
In this section, we present detailed analyses of two areas
selected as representative examples from the southeast and
northwest field trends (see Gibson et al., 2004). The Southeast
Galeota (SEG) complex and Samaan field (Fig. 1a) were
chosen for detailed work because of both their similarity to
each other and their differences. In addition, parts of both
areas have been discussed in the literature (Heppard et al.,
1990, 1998; Persad et al., 1993) and used in the development
of previous petroleum migration models.
Both the SEG and Samaan areas are located within the
same general depositional trend of the growth-faulted part
of the basin. They contain petroleum trapped primarily in
coastal-plain to marginal marine, upper-Pliocene (2–3 Ma)
reservoir sands. In both cases, sand units comprise
approximately 50% of the gross stratigraphic section.
Most of the sand units are sheet-like deposits that can be
correlated over areas of 500 þ km2 in the immediate
vicinity of the fields, although individual sand units cannot
be correlated between the SEG and Samaan areas. The
reservoir sands in both areas change facies into slope
mudstones toward the NE from the fields. Because of
the overall progradational nature of the stratigraphic
section, the position of this facies change shifts basinward
(toward the NE) with decreasing reservoir age.
Structurally, the two areas show both similarities and
some significant differences. When viewed along NE–SW
cross-sections (Fig. 1b and c), both the Samaan and SEG
structures appear to be rollover anticlines associated with
major normal faults. Both structures are bounded on the SW
by substantial NE-dipping faults, and strata on the NE flank
of the structures dip and thicken northeastward toward a large
counter-regional fault system. In addition, both areas
straddle regional anticlines formed during NW–SE short-
ening, although the vertical relief on the Samaan ridge is
greater than that in SEG (Fig. 1d). Angular truncation of beds
at the seafloor on the crest of Samaan and elevation of
stratigraphic units above their ‘regional’ elevation, indicate
that the Samaan structure underwent substantially more post-
extensional uplift than the SEG area. The absence of
Pleistocene units at Samaan and their dramatic thickening
toward the northeast (Fig. 1d) implies that this uplift occurred
during the Pleistocene. In addition, Samaan overlies an area
of apparent uplift at Cretaceous level that is not observed at
SEG (see Gibson et al., 2004). Thus, although both the SEG
and Samaan structures had similar origins as extensional
structures, Samaan experienced a more intense overprint
during Pleistocene NW–SE shortening which also uplifted
the underlying Cretaceous section. As a result, Samaan is a
more intensely faulted, higher-relief culmination than the
lower-relief, less complex SEG structure.
5.1. Southeast Galeota area
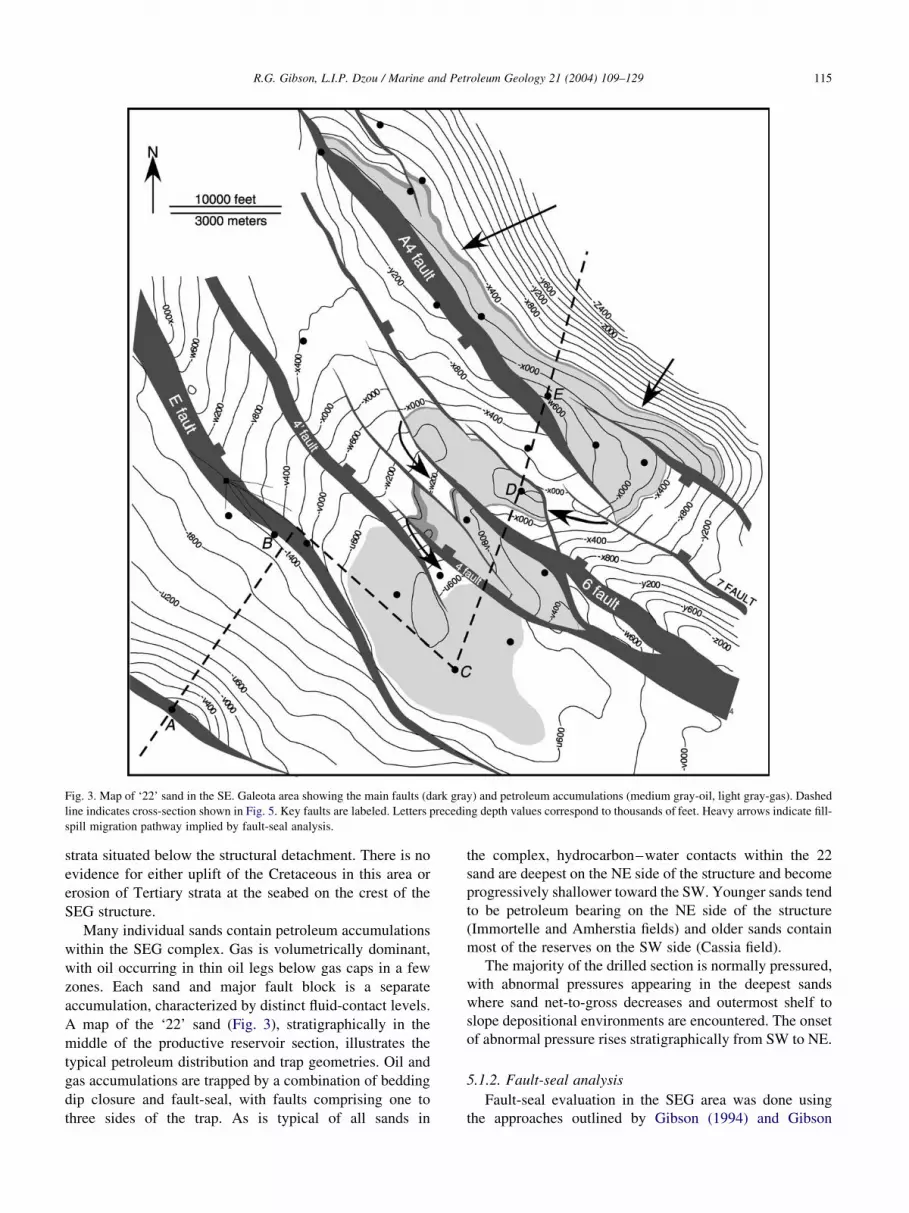
5.1.1. Field description
The Southeast Galeota (SEG) area consists of a complex
of several fields that are either currently producing
(Immortelle, Amherstia, Cassia) or under development
(Parang, Kapok). The area is situated in the southeastern
field trend, approximately 60 km southeast of Galeota Point,
Trinidad, and just north of the Venezuela border (Fig. 1a).
Structurally, the complex is a low-relief, NE–SW trending
anticline dissected into several major fault blocks by NW–
SE striking normal faults that generally dip basinward
(Fig. 3). The NE flank of the structure is characterized by
relatively steep basinward bedding dips and a series of
moderately to gently dipping, counter-regional (SW-dip-
ping) fault segments (Fig. 1c). The upper-Pliocene reservoir
section thickens toward the northeast due to deposition
during movement on these counter-regional faults. On the
NE side of the structure, a younger, large-displacement, NE-
dipping growth fault truncates the updip end of the counter-
regional fault segments and juxtaposes the SEG complex
against an expanded section of latest Pliocene and
Pleistocene strata (Fig. 1c). The NE-dipping normal faults
within the SEG complex also offset the older counter-
regional fault system. The SEG area is underlain at depths
.20,000 ft (6100 m) by gently NNW-dipping Cretaceous
R.G. Gibson, L.I.P. Dzou / Marine and Petroleum Geology 21 (2004) 109–129114
strata situated below the structural detachment. There is no
evidence for either uplift of the Cretaceous in this area or
erosion of Tertiary strata at the seabed on the crest of the
SEG structure.
Many individual sands contain petroleum accumulations
within the SEG complex. Gas is volumetrically dominant,
with oil occurring in thin oil legs below gas caps in a few
zones. Each sand and major fault block is a separate
accumulation, characterized by distinct fluid-contact levels.
A map of the ‘22’ sand (Fig. 3), stratigraphically in the
middle of the productive reservoir section, illustrates the
typical petroleum distribution and trap geometries. Oil and
gas accumulations are trapped by a combination of bedding
dip closure and fault-seal, with faults comprising one to
three sides of the trap. As is typical of all sands in
the complex, hydrocarbon–water contacts within the 22
sand are deepest on the NE side of the structure and become
progressively shallower toward the SW. Younger sands tend
to be petroleum bearing on the NE side of the structure
(Immortelle and Amherstia fields) and older sands contain
most of the reserves on the SW side (Cassia field).
The majority of the drilled section is normally pressured,
with abnormal pressures appearing in the deepest sands
where sand net-to-gross decreases and outermost shelf to
slope depositional environments are encountered. The onset
of abnormal pressure rises stratigraphically from SW to NE.
5.1.2. Fault-seal analysis
Fault-seal evaluation in the SEG area was done using
the approaches outlined by Gibson (1994) and Gibson
Fig. 3. Map of ‘22’ sand in the SE. Galeota area showing the main faults (dark gray) and petroleum accumulations (medium gray-oil, light gray-gas). Dashed
line indicates cross-section shown in Fig. 5. Key faults are labeled. Letters preceding depth values correspond to thousands of feet. Heavy arrows indicate fill-
spill migration pathway implied by fault-seal analysis.
R.G. Gibson, L.I.P. Dzou / Marine and Petroleum Geology 21 (2004) 109–129 115
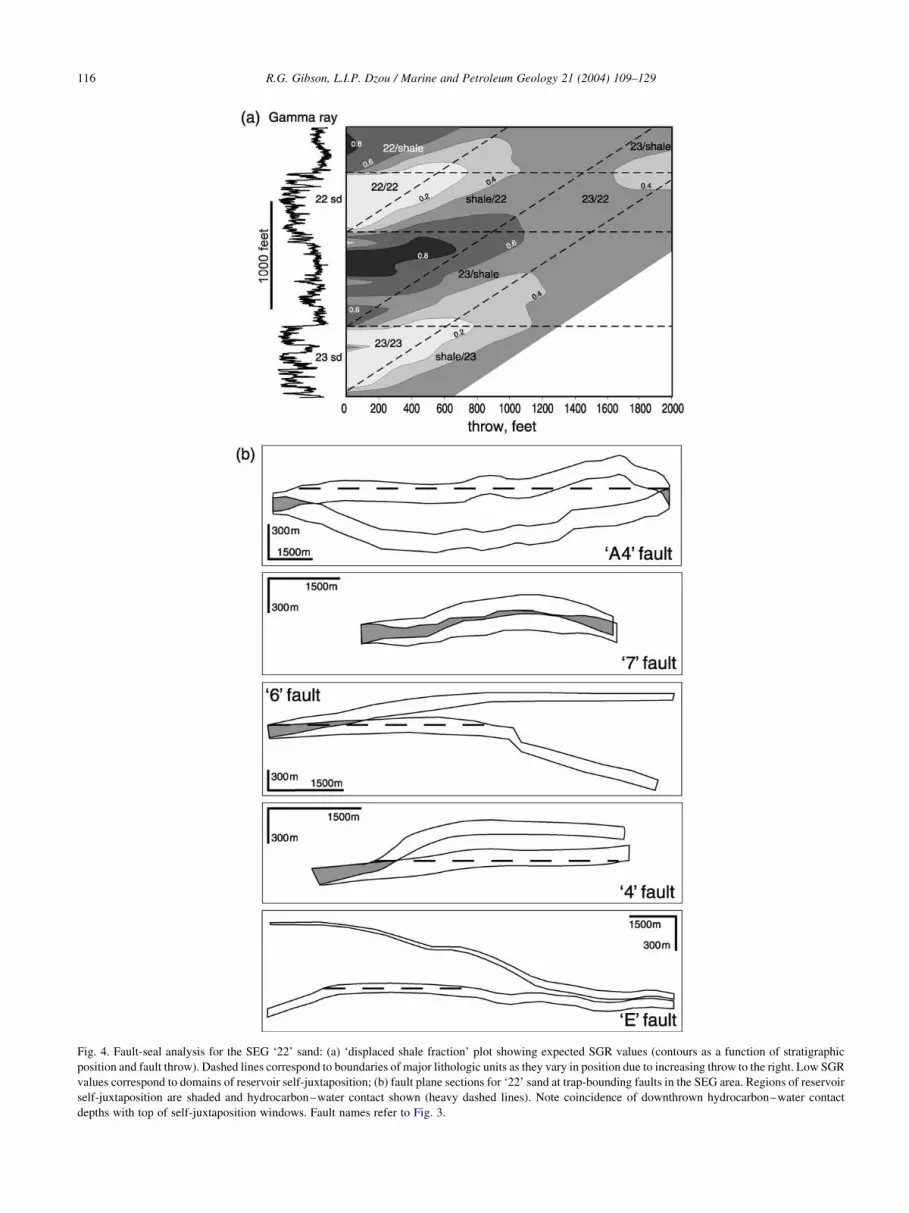
Fig. 4. Fault-seal analysis for the SEG ‘22’ sand: (a) ‘displaced shale fraction’ plot showing expected SGR values (contours as a function of stratigraphic
position and fault throw). Dashed lines correspond to boundaries of major lithologic units as they vary in position due to increasing throw to the right. Low SGR
values correspond to domains of reservoir self-juxtaposition; (b) fault plane sections for ‘22’ sand at trap-bounding faults in the SEG area. Regions of reservoir
self-juxtaposition are shaded and hydrocarbon–water contact shown (heavy dashed lines). Note coincidence of downthrown hydrocarbon–water contact
depths with top of self-juxtaposition windows. Fault names refer to Fig. 3.
R.G. Gibson, L.I.P. Dzou / Marine and Petroleum Geology 21 (2004) 109–129116

and Bentham (2003). These studies show that faults in the
Columbus basin seal significant petroleum columns only
where the SGR (shale gouge ratio, Yielding, Freeman, &
Needham, 1997) is .0.25. Most cases of reservoir self-
juxtaposition do not fit this criterion and are inferred to be
potential ‘windows’ that can allow cross-fault petroleum
migration. A ‘displaced-shale-fraction’ plot (Fig. 4a),
similar to the ‘juxtaposition’ plots of Knipe (1997),
illustrates the expected SGR values for a range of fault
displacements of the ‘22’–‘23’ reservoir interval in the SEG
area. Low SGR (,0.2) windows correspond to areas where
the sands are self-juxtaposed (Fig. 4a). SGR values for all
other juxtaposition geometries meet the SGR . 0.25
criteria for sealing. Thus, we expect that cross-fault
petroleum flow could occur where reservoirs are self-
juxtaposed, but would be unlikely where different sands are
in contact across faults.
Direct evidence in support of this in the SEG area can be
seen in a series of fault-plane sections showing juxtaposition
relationships of the 22 sand (Fig. 4b). In four of the five
examples, the hydrocarbon–water contact for an accumu-
lation corresponds in depth with the shallowest depth of 22
sand self-juxtaposition across the fault. Only the western-
most (‘E’) fault does not show this behavior. Instead, the
trap on the downthrown side of the E fault is not filled down
to the depth of cross-fault self-juxtaposition, and no
accumulation exists in the upthrown block (Cassia field).
5.1.3. Geochemistry
Figs. 5 and 6 summarize the available oil, condensate and
gas geochemical data from reservoirs within the SEG
complex. Stable isotope data from gas accumulations show
variable degrees of d 13C C1 depression (Fig. 6a), implying a
range of thermogenic–biogenic ratios within the complex.
In addition, the presence of gases with no thermogenic
contribution is implied by the lack of C2þ in gas shows from
the upper part of the wells in the area (Fig. 5).
Oil and condensate maturity indicators show that
petroleum with a wide range of maturity is trapped within
the SEG complex. Maturity indices based on biomarkers
(e.g. MPI, C29 S/S þ R) and n-alkane/isoprenoid ratios
(nC17/pristine, nC18/phytane) are positively correlated with
one another (Fig. 6b). We interpret this to indicate that
individual accumulations within the SEG complex received
different fractions of the total petroleum charge.
Both the variation of thermogenic–biogenic ratio and
maturity within this data set can be related to stratigraphic
and geographic position. In general, there is a trend toward
increasing maturity and thermogenic fraction with depth
(increasing reservoir age) at most geographic locations
Fig. 5. Cross-section through key wells in the SEG area (section line in Fig. 3) showing location of most samples used in this study. GC traces,
methylphenanthrene patterns, and a summary of important geochemical ratios are shown for each sample. Gray shading on well sticks indicates depths over
which only C1 gas shows are observed. Well identification letters correspond with Fig. 3. Geochemical samples posted at well E are projected from several
different wells located in similar structural positions along strike (NW–SE) within this fault block. See text for discussion.
R.G. Gibson, L.I.P. Dzou / Marine and Petroleum Geology 21 (2004) 109–129 117

Fig. 6. Summary of SEG geochemical data: (a) gas isotope plot for all samples showing variable depression of d 13C C1; (b) plot showing positive correlation
between various maturity indicators; (c) geochemical variation with distance along horizons from the counter-regional fault.
R.G. Gibson, L.I.P. Dzou / Marine and Petroleum Geology 21 (2004) 109–129118
within the complex (Fig. 5). Lateral variations are less easy
to define because of the paucity of samples from a single
stratigraphic horizon at various locations. However, several
samples from the 22 sand show a substantial decrease of
maturity and thermogenic–biogenic ratio from NE (Immor-
telle–Amherstia) to SW (Kapok) (Fig. 5). In addition, the
stratigraphically deeper appearance of C2þ gas shows
toward the NW (Fig. 5) is consistent with a trend of
decreasing thermogenic–biogenic ratio laterally along a
horizon from NE to SW.
The lateral variations can be better illustrated by plotting
compositional parameters versus the distance to the
intersection of the reservoir with the counter-regional fault
that bounds the east side of the SEG complex (Fig. 6c).
Since the counter-regional fault trend developed close to the
shelf edge and probably marks the approximate eastern limit
of shelf sands at any stratigraphic level, Fig. 6b shows that
both maturity (nC17/pristine, MPI, C29 S/S þ R) and
thermogenic–biogenic ratio decrease with distance from
the northeastern limit of the reservoir they are trapped in.
5.1.4. Migration model
The fault-seal observations imply a relatively simple
model for filling of the traps within the SEG complex by fill-
and-spill around/across faults within individual sand carrier
beds from the NE toward SW. The model, similar to that
proposed by Gibson and Bentham (2003) for Mahogany
field (Fig. 1a), is illustrated in map form (Fig. 3) by a series
of arrows showing the migration pathways along the 22 sand
horizon. Column heights within individual fault traps are
limited by cross-fault spill points at depths of reservoir self-
juxtaposition on the SW side of each fault block. As
discussed in detail by Gibson and Bentham (2003), each
sand horizon acts as a separate migration system, with little
to no communication between different sands because of the
high-quality fault seals developed along fault segments with
high SGR values.
The geochemical patterns in the SEG complex can be
interpreted as a direct result of this migration process, with
the largest fractions of the most mature thermogenic
petroleum captured on the NE (proximal) side of the
structure. Fig. 7 shows a petroleum migration model that
integrates both the fault-seal and geochemical data. During
the early stages of structural development, biogenic gas was
sourced from within the Tertiary section and accumulated in
the crestal portion of the structure (Fig. 7a). The earliest-
expelled, lowest maturity, thermogenic petroleum from the
Cretaceous source migrated along the sand carrier beds and
interacted with the biogenic accumulations (Fig. 7b). Since
the biogenic accumulation would have been initially
undersaturated with respect to liquid, the low-maturity oil
charge dissolved in the gas, forming low maturity gas
condensates (e.g. shallow samples in wells B and C, Fig. 5).
As slip increased on faults within the complex, the initial
accumulation was fault-segmented, and the eastern seg-
ments continued to receive progressively more mature
thermogenic charge (Fig. 7c and d). In this way, the
observed pattern of increasing contribution of high-maturity
thermogenic charge towards the NE along any individual
sand was developed. In the case of the 22 sand in the SEG
area, the westernmost fault block (Cassia field) did not
receive any thermogenic charge (C1 gas shows only, Fig. 5)
since the accumulation in the next block towards the NE did
not fill to the cross-fault spill level defined by reservoir self-
juxtaposition (Fig. 4b).
In this model, the observed vertical geochemical
trends are not a product of vertical petroleum migration.
Instead, they are a secondary trend that reflects the
proximity of a given trap to the northeastern sand extents
of the horizons within that trap. Since the depositional
system was progradational throughout the accumulation
of the reservoir section, shallow sands at a specific
location are more distal from the corresponding shelf
edge than deeper sands. Thus, laterally migrating
petroleum in the deepest sands had to travel the shortest
distance, through the least number of intermediate traps,
from the point of entry into the carrier bed (Fig. 7).
Numerous occurrences of residual gas have been
observed below gas accumulations within the SE trend
fields (Rosen, 1997; BP unpublished data). Rosen (1997)
interpreted such occurrences in Kiskadee field as evidence
for breaching of traps, probably during recent fault move-
ments. An alternative interpretation, consistent with the
charging model presented above, is that residual gas zones
below gas accumulations are formed by shrinkage of early
trapped biogenic accumulations as they undergo subsequent
burial and pressure increase.
5.2. Samaan field
5.2.1. Field description
Samaan field is situated in the northwestern field
trend, approximately 35 km (22 miles) due east of Radix
Point on the eastern Trinidad coast. The field was
discovered in 1971 and started oil production in October
1972. Since that time, it has yielded in excess of 210
MMBO and 650 BCFG. The field occupies the crest of a
high-relief (,1500 m), NE–SW trending anticline cut by a
myriad of NW-striking, NE- and SW-dipping normal faults
that interact in the center of the field (Fig. 8a). On the SW
side of the field, beds dip toward the SW into a large-
displacement normal fault that separates the Samaan
structure from the remainder of the Galeota Ridge to the
SW (Fig. 1b). This fault was active during deposition of the
Pliocene reservoir section and rollover into it probably
helped form the initial Samaan structure. On the NE flank of
the structure, beds dip northeastward into the Columbus
basin and, as in the SEG area, this eastward-dipping panel is
bounded on the NE by a large, syn-depositional, counter-
regional fault system located near the present-day shelf edge
(Fig. 1b). Angular truncation of beds at the seafloor above
Samaan (Fig. 8a) and eastward thickening of the Pliestocene
R.G. Gibson, L.I.P. Dzou / Marine and Petroleum Geology 21 (2004) 109–129 119

Fig. 7. Petroleum migration model for the SEG area integrating fault-seal and geochemical observations. Filling sequence discussed in text is illustrated by the
progressive evolution of the solid horizon. Heavy black lines-faults; thin lines-horizons; heavy dashed gray lines-approximate eastern sand limit. Vertical
ruling in petroleum accumulations represents the degree of thermogenic contribution, ranging from entirely biogenic (white) to thermogenic-dominated
(black).
R.G. Gibson, L.I.P. Dzou / Marine and Petroleum Geology 21 (2004) 109–129120

Fig. 8. Samaan field geochemical observations: (a) cross-section of Samaan field (after Heppard et al., 1998) with locations of five key samples discussed
in text shown (black dots); (b) GC traces, API gravities, and n-alkane/isoprenoid ratios; (c) GC-MS data (m=z 191) with TR23/H30 values highlighted; (d)
GC-MS data (m=z 231) with C20/C28R values indicated; (e) GC-MS data (m=z 192) with MPI values shown. Arrangement of samples in (b)–(e)
corresponds to relative sample position as shown in (a). Arrows in (b)–(e) indicate directions of increasing maturity based on the specified parameter
shown.
R.G. Gibson, L.I.P. Dzou / Marine and Petroleum Geology 21 (2004) 109–129 121
section away from the structure (Fig. 1b) reflect substantial
Pleistocene contractional modification of the initial Samaan
structure. This event was probably also responsible for the
intense internal faulting observed within the field.
At least 15 individual sands contain oil and/or gas within
the field, generally in footwall fault traps within the larger
anticlinal culmination. With a few exceptions where
displacement on the bounding fault(s) is less than the
reservoir thickness, each sand and major fault block is a
separate accumulation, characterized by distinct fluid-
contact levels (Fig. 8a). Although some individual fault
blocks appear to be filled down to local cross-fault spill
level, the Samaan structure as a whole is markedly under-
filled (,250 m columns in 1500 m of closure). Sands down
to ,6000 ft (1830 m) TVDSS contain only gas, whereas the
deeper sands are oil-dominated (Fig. 8a). Several sands,
including the ‘2’, ‘4’, and ‘9’ reservoirs have primary gas
caps, and the size of these gas accumulations relative to the
underlying oil legs is larger on the east side of the field than
the west.
The stratigraphic section within Samaan is normally
pressured above 9000–10,000 ft (2740–3050 m) TVDSS
and becomes overpressured below the ‘7A’ sand (Fig. 8a).
Pressure gradients as high as 0.987 psi/ft (22.3 kPa/m),
close to the hydraulic fracture condition for the shales, are
encountered in the deepest drilled section (Heppard et al.,
1998). This highly overpressured section is devoid of
petroleum accumulations, possibly due to failure of shale
top seals by hydraulic fracturing (Heppard et al., 1998).
Beyond the NE limit of the field, the top of overpressure
climbs stratigraphically toward the NE as the continuous
shelf sands pinch out into deeper water mudstones.
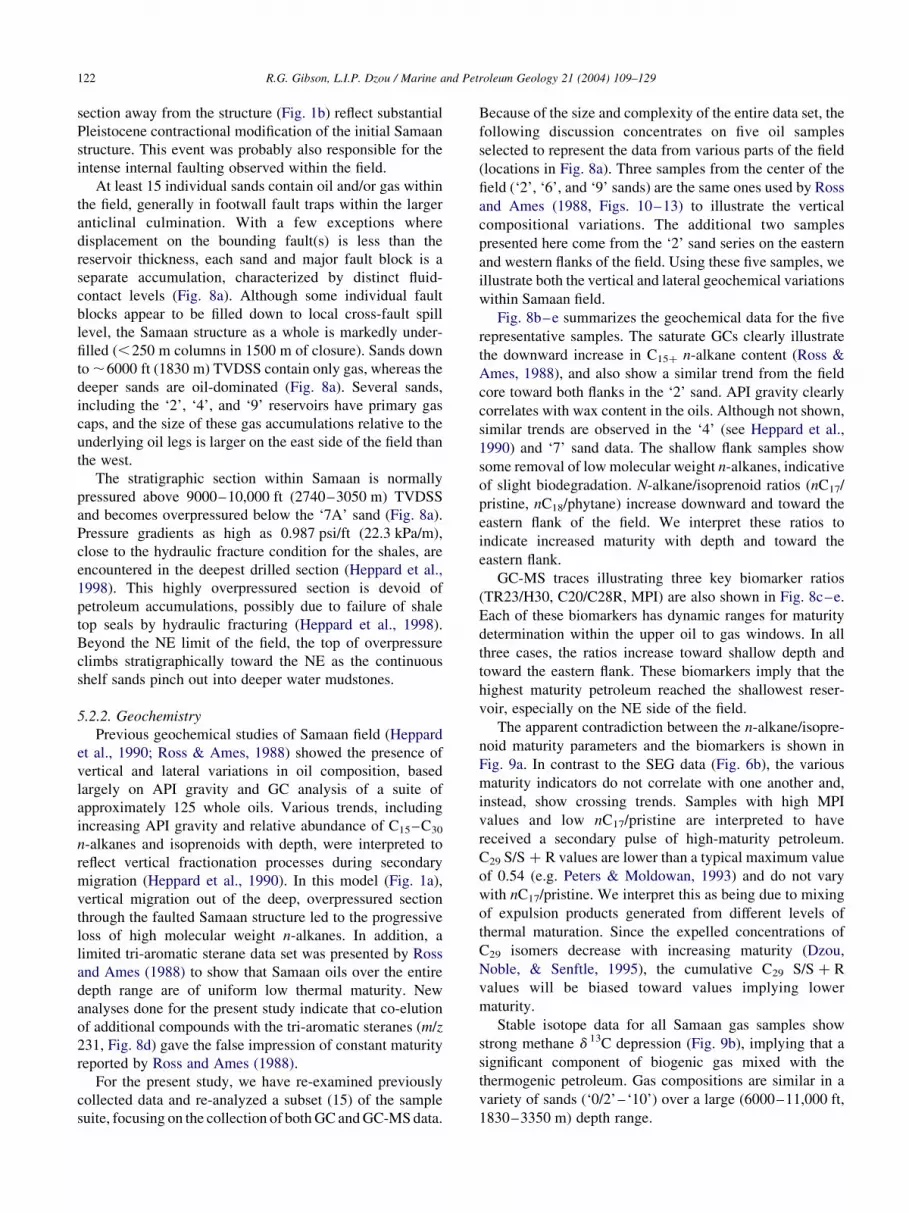
5.2.2. Geochemistry
Previous geochemical studies of Samaan field (Heppard
et al., 1990; Ross & Ames, 1988) showed the presence of
vertical and lateral variations in oil composition, based
largely on API gravity and GC analysis of a suite of
approximately 125 whole oils. Various trends, including
increasing API gravity and relative abundance of C15–C30
n-alkanes and isoprenoids with depth, were interpreted to
reflect vertical fractionation processes during secondary
migration (Heppard et al., 1990). In this model (Fig. 1a),
vertical migration out of the deep, overpressured section
through the faulted Samaan structure led to the progressive
loss of high molecular weight n-alkanes. In addition, a
limited tri-aromatic sterane data set was presented by Ross
and Ames (1988) to show that Samaan oils over the entire
depth range are of uniform low thermal maturity. New
analyses done for the present study indicate that co-elution
of additional compounds with the tri-aromatic steranes (m=z
231, Fig. 8d) gave the false impression of constant maturity
reported by Ross and Ames (1988).
For the present study, we have re-examined previously
collected data and re-analyzed a subset (15) of the sample
suite, focusing on the collection of both GC and GC-MS data.
Because of the size and complexity of the entire data set, the
following discussion concentrates on five oil samples
selected to represent the data from various parts of the field
(locations in Fig. 8a). Three samples from the center of the
field (‘2’, ‘6’, and ‘9’ sands) are the same ones used by Ross
and Ames (1988, Figs. 10–13) to illustrate the vertical
compositional variations. The additional two samples
presented here come from the ‘2’ sand series on the eastern
and western flanks of the field. Using these five samples, we
illustrate both the vertical and lateral geochemical variations
within Samaan field.
Fig. 8b–e summarizes the geochemical data for the five
representative samples. The saturate GCs clearly illustrate
the downward increase in C15þ n-alkane content (Ross &
Ames, 1988), and also show a similar trend from the field
core toward both flanks in the ‘2’ sand. API gravity clearly
correlates with wax content in the oils. Although not shown,
similar trends are observed in the ‘4’ (see Heppard et al.,
1990) and ‘7’ sand data. The shallow flank samples show
some removal of low molecular weight n-alkanes, indicative
of slight biodegradation. N-alkane/isoprenoid ratios (nC17/
pristine, nC18/phytane) increase downward and toward the
eastern flank of the field. We interpret these ratios to
indicate increased maturity with depth and toward the
eastern flank.
GC-MS traces illustrating three key biomarker ratios
(TR23/H30, C20/C28R, MPI) are also shown in Fig. 8c–e.
Each of these biomarkers has dynamic ranges for maturity
determination within the upper oil to gas windows. In all
three cases, the ratios increase toward shallow depth and
toward the eastern flank. These biomarkers imply that the
highest maturity petroleum reached the shallowest reser-
voir, especially on the NE side of the field.
The apparent contradiction between the n-alkane/isopre-
noid maturity parameters and the biomarkers is shown in
Fig. 9a. In contrast to the SEG data (Fig. 6b), the various
maturity indicators do not correlate with one another and,
instead, show crossing trends. Samples with high MPI
values and low nC17/pristine are interpreted to have
received a secondary pulse of high-maturity petroleum.
C29 S/S þ R values are lower than a typical maximum value
of 0.54 (e.g. Peters & Moldowan, 1993) and do not vary
with nC17/pristine. We interpret this as being due to mixing
of expulsion products generated from different levels of
thermal maturation. Since the expelled concentrations of
C29 isomers decrease with increasing maturity (Dzou,
Noble, & Senftle, 1995), the cumulative C29 S/S þ R
values will be biased toward values implying lower
maturity.
Stable isotope data for all Samaan gas samples show
strong methane d 13C depression (Fig. 9b), implying that a
significant component of biogenic gas mixed with the
thermogenic petroleum. Gas compositions are similar in a
variety of sands (‘0/2’–‘10’) over a large (6000–11,000 ft,
1830–3350 m) depth range.
R.G. Gibson, L.I.P. Dzou / Marine and Petroleum Geology 21 (2004) 109–129122

5.2.3. Migration model
The complexity of the Samaan geochemical data implies
that mixing of various petroleum maturity fractions occurred
in different parts of the field. As indicated by n-alkane/
isoprenoid ratios, the deep sands and those on the NE flank
apparently received more mature oil than the shallow sands
in the center of the field. However, biomarkers, especially
those sensitive to maturity changes within the late oil to gas
windows, imply that the same deep sands did not capture the
highest maturity fraction to as great a degree as the
shallowest oil-bearing sands. Furthermore, these biomarkers
indicate that the NE flank of the field consistently received
more mature charge than the SW side.
We find it difficult to reconcile these complex patterns
with the previously proposed vertical migration-fraction-
ation model (Heppard et al., 1990; Ross & Ames, 1988) for
several reasons. Firstly, the variable nature of the n-alkane
profiles is a reflection of oil maturity (waxy oils are more
mature) and does not need to be explained by fractionation
of an oil of consistent low maturity. Secondly, a vertical
migration scenario cannot explain the indications of higher
maturity in shallow sands than in the deeper sands.
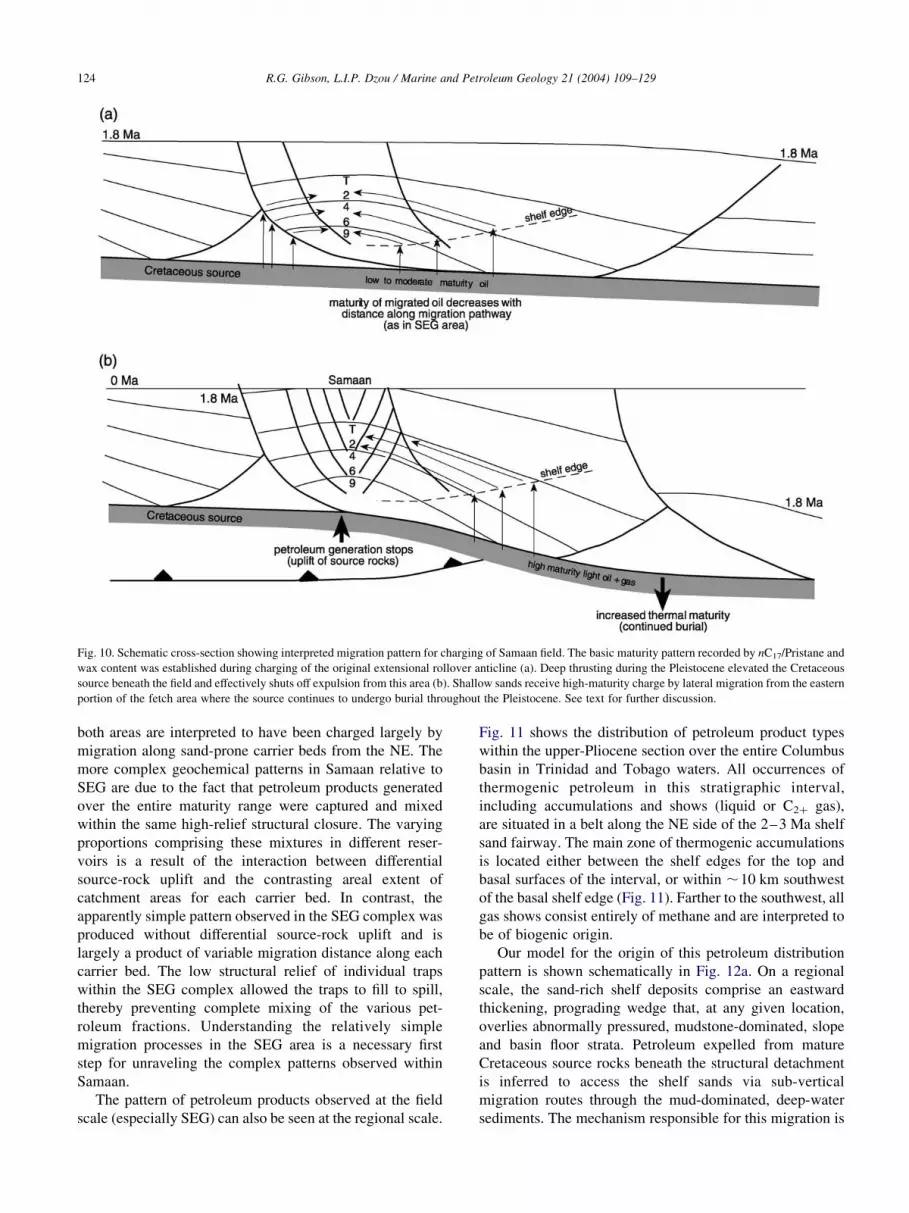
Fig. 10 shows our preferred model for petroleum
migration into Samaan field. Because of the overall
similarities between the SEG and Samaan areas, we have
used our understanding of the SEG charging history as a
guide for developing this model. The filling history is
evaluated in terms of two distinct phases, one corre-
sponding to the extensional origin of the Samaan
structure and the second occurring during contractional
modification of the structure. Based on the source-rock
thermal history (Gibson et al., 2004), charging of the
field probably began in the Pliocene, not long after
deposition of the reservoir sands. At this time, the
structure was solely of extensional origin and probably of
relatively low-relief, similar to the SEG complex today.
Prior to the input of thermogenic petroleum, the structure
is inferred to have contained accumulations of biogenic
gas. As oil entered the structure from the NE by lateral
migration along carrier beds, it mixed with the biogenic
gas, which went partially or entirely into solution within
the oil. The maturity trends in the field at this time were
likely to be similar to those observed in the SEG
complex today, increasing downward due to closer
proximity of the traps in the deep sands to the point of
petroleum input (shelf edges) to the carrier beds. This
would have established the maturity trends currently
preserved by variations in API gravity, n-alkane profiles,
and n-alkane/isoprenoid ratios.
Several lines of evidence, including anomalously deep
hydrocarbon–water contacts and C15þ enriched oils on
the west side of the Samaan structure (Heppard et al.,
1990), imply that some fraction of the Samaan oil
migrated in from the west, rather than from the east.
These observations can be explained by the fact that the
growth fault located immediately west of Samaan has
extremely large displacement (.10,000 ft, 3050 m) and
growth. Thus, it locally juxtaposes west-dipping shelf
sands against older, mud-dominated strata in the foot-
wall, creating a small area where charge can access
southwest-dipping Samaan reservoirs (Fig. 10).
The second phase of migration into Samaan coincided
with NW–SE shortening during the Pleistocene. During this
time, uplift of the Cretaceous source rocks immediately
beneath the field caused petroleum generation in this area to
slow or completely shut off (Gibson et al., 2004). However,
the Cretaceous source in the area northeast of the field
continued to be buried and to supply petroleum into the
Samaan structure. The greater basinal extent of the shallow
sands relative to the deep sands permitted more input of the
high-maturity petroleum fraction into the shallow sands.
This second phase of migration was responsible for creating
the inverted biomarker maturity trends and the higher gas
fraction in sands on the east side of the field.
6. Regional migration model
The SEG (Fig. 7) and Samaan (Fig. 10) charging models
are essentially variations on the same general theme in that
Fig. 9. Summary of Samaan geochemical data: (a) plot showing complex
interrelationships between various maturity parameters (compare with Fig.
6b); (b) gas isotope plot for all available samples showing similar
depression of d 13C C1.
R.G. Gibson, L.I.P. Dzou / Marine and Petroleum Geology 21 (2004) 109–129 123
both areas are interpreted to have been charged largely by
migration along sand-prone carrier beds from the NE. The
more complex geochemical patterns in Samaan relative to
SEG are due to the fact that petroleum products generated
over the entire maturity range were captured and mixed
within the same high-relief structural closure. The varying
proportions comprising these mixtures in different reser-
voirs is a result of the interaction between differential
source-rock uplift and the contrasting areal extent of
catchment areas for each carrier bed. In contrast, the
apparently simple pattern observed in the SEG complex was
produced without differential source-rock uplift and is
largely a product of variable migration distance along each
carrier bed. The low structural relief of individual traps
within the SEG complex allowed the traps to fill to spill,
thereby preventing complete mixing of the various pet-
roleum fractions. Understanding the relatively simple
migration processes in the SEG area is a necessary first
step for unraveling the complex patterns observed within
Samaan.
The pattern of petroleum products observed at the field
scale (especially SEG) can also be seen at the regional scale.
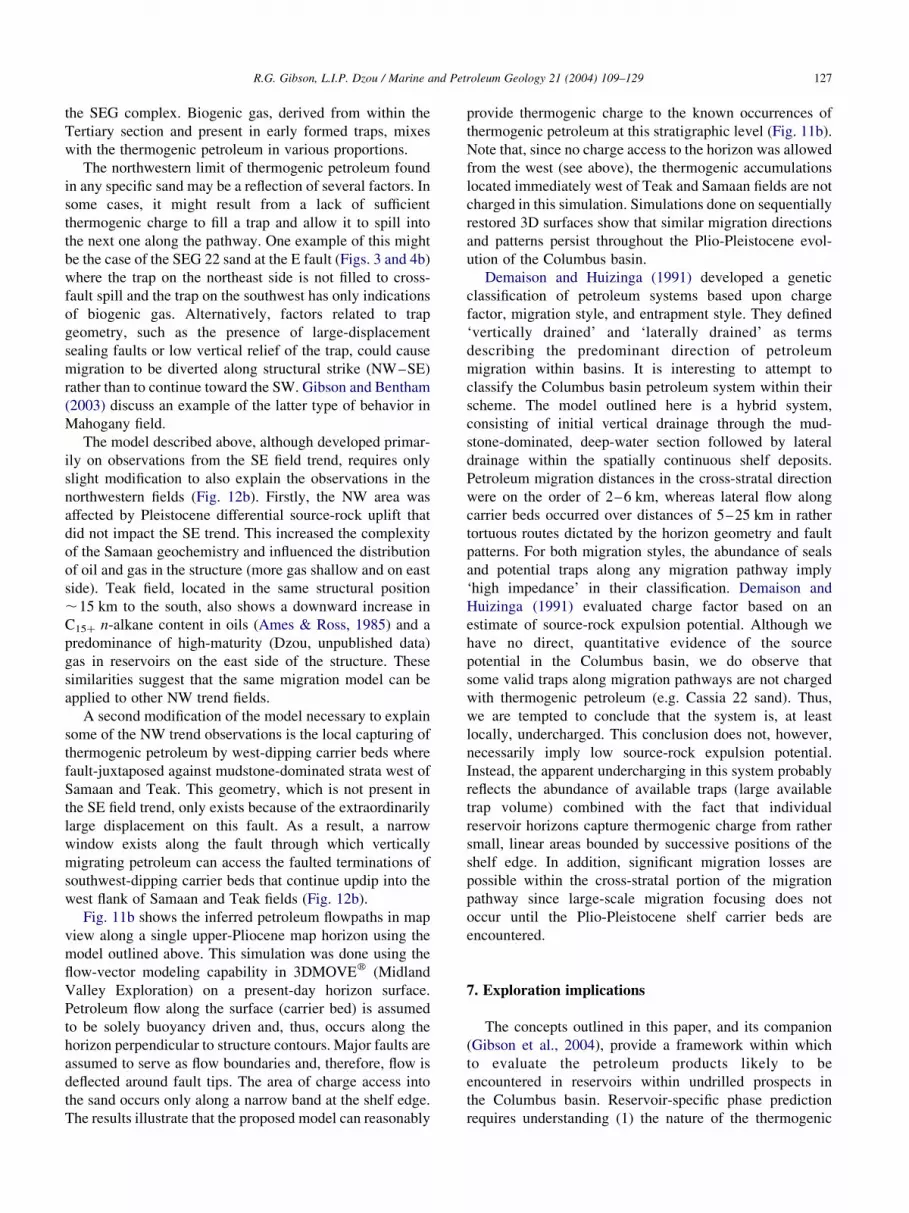
Fig. 11 shows the distribution of petroleum product types
within the upper-Pliocene section over the entire Columbus
basin in Trinidad and Tobago waters. All occurrences of
thermogenic petroleum in this stratigraphic interval,
including accumulations and shows (liquid or C2þ gas),
are situated in a belt along the NE side of the 2–3 Ma shelf
sand fairway. The main zone of thermogenic accumulations
is located either between the shelf edges for the top and
basal surfaces of the interval, or within ,10 km southwest
of the basal shelf edge (Fig. 11). Farther to the southwest, all
gas shows consist entirely of methane and are interpreted to
be of biogenic origin.
Our model for the origin of this petroleum distribution
pattern is shown schematically in Fig. 12a. On a regional
scale, the sand-rich shelf deposits comprise an eastward
thickening, prograding wedge that, at any given location,
overlies abnormally pressured, mudstone-dominated, slope
and basin floor strata. Petroleum expelled from mature
Cretaceous source rocks beneath the structural detachment
is inferred to access the shelf sands via sub-vertical
migration routes through the mud-dominated, deep-water
sediments. The mechanism responsible for this migration is
Fig. 10. Schematic cross-section showing interpreted migration pattern for charging of Samaan field. The basic maturity pattern recorded by nC17/Pristane and
wax content was established during charging of the original extensional rollover anticline (a). Deep thrusting during the Pleistocene elevated the Cretaceous
source beneath the field and effectively shuts off expulsion from this area (b). Shallow sands receive high-maturity charge by lateral migration from the eastern
portion of the fetch area where the source continues to undergo burial throughout the Pleistocene. See text for further discussion.
R.G. Gibson, L.I.P. Dzou / Marine and Petroleum Geology 21 (2004) 109–129124

unknown, but possibilities include percolation through the
pore network controlled by capillary phenomenon (e.g.
Berg, 1975; Hirsch & Thompson, 1995) and migration
through hydraulic fracture systems (e.g. Cosgrove, 2001;
Heppard et al., 1998). In detail, the migration pathways
within this section are unlikely to be strictly vertical, but are
undoubtedly more tortuous, consisting of more vertical
segments within mudstones and horizon-parallel segments
Fig. 11. (a) Map showing characteristics of petroleum accumulations and shows within the 2–3 Ma reservoir interval, superimposed with the geographic area
bounded by the shelf-edge position at approximately 2 and 3 Ma (diagonal ruled). Nearly all of the thermogenic petroleum within this stratigraphic interval occurs
within 25 km west of the inferred thermogenic charge area bounded by these shelf edges. Field locations are indicated for reference (P, Poui; T, Teak; Sa, Samaan;
SEG, SE Galeota area; F, Flamboyant; M, Mahogany). (b) Results of horizon-based flowpath modeling for a horizon approximating the SEG area ‘22’ sand. Charge
access area is a linear band at the shelf-edge position and major faults are assumed to be no-flow boundaries except at low-displacement tips. The only fields shown
are those containing thermogenic charge at this stratigraphic level. Eastern limit of the map surface is the approximate intersection of the horizon with the counter-
regional fault system. Flow vectors indicate thermogenic charge access into major fields (Samaan, Teak, SEG area) located updip and west of the charge access area.
R.G. Gibson, L.I.P. Dzou / Marine and Petroleum Geology 21 (2004) 109–129 125

within isolated, deep-water sand/silt layers. It is likely that
vertical and lateral fluid pressure gradients exert significant
control on the detailed geometry of the migration pathways
within this section (Heppard et al., 1998). We do not invoke
faults as migration conduits because all direct evidence
within the drilled section of the basin implies that faults
either serve as non-seals or barriers to flow, rather than
migration conduits (Gibson, 1994; Gibson & Bentham,
2003).
The vertically migrating petroleum initially encounters
the sheet-like shelf sands along a generally southwest-
dipping surface that represents the loci of successive shelf
edges (Fig. 12a). Each individual sand is charged within a
linear geographic area bounded by the shelf edge of that
sand and the shelf edge of the immediately underlying shelf
sand. Areas located southwest of the shelf edge for the
underlying sand are shielded from capturing the vertically
migrating petroleum. The relative quantity of charge
available to any sand should reflect the distance of
progradation that occurred between the deposition of
successive sands. In the case of back-stepping sand units,
migrating petroleum is captured by deeper sands, and
the younger ones are shielded from thermogenic charge.
This appears to be the stratigraphic geometry in the upper-
Pleistocene (post-1.3 Ma) of the Columbus basin (Wood,
2000) and, thus far, no thermogenic petroleum has been
discovered in this stratigraphic interval.
Once the petroleum enters the high-permeability, low
capillary-entry pressure sand units, horizon-based pet-
roleum migration becomes the favored process. Because
of the consistent northeastward dip of beds toward the
counter-regional fault system at the shelf-edge position,
the petroleum migrates updip toward the southwest under
the influence of buoyancy. However, since the onset of
overpressure climbs stratigraphically toward the NE (Wood,
2000) and generally coincides with the stratigraphic
transition from shelf to slope paleo-environments, a
hydrodynamic drive probably also assists in efficiently
transferring the migrating petroleum from slope deposits
into the shelf carrier beds. This drive acts in the same
direction as buoyancy, encouraging migration towards the
SW. Structural traps encountered during updip flow are
filled, progressively spilling into traps farther updip and
producing maturity patterns such as those preserved in
Fig. 12. Schematic cross-section view illustrating petroleum migration model, including cross-stratal migration through overpressured slope shales to access
distal edges of progradational shelf sands, westward migration along shelf sands into structural traps, and westward decrease of thermogenic petroleum
fraction: (a) basic model developed for SE trend; (b) model with minor adaptations to explain specific observations in the NW trend.
R.G. Gibson, L.I.P. Dzou / Marine and Petroleum Geology 21 (2004) 109–129126
the SEG complex. Biogenic gas, derived from within the
Tertiary section and present in early formed traps, mixes
with the thermogenic petroleum in various proportions.
The northwestern limit of thermogenic petroleum found
in any specific sand may be a reflection of several factors. In
some cases, it might result from a lack of sufficient
thermogenic charge to fill a trap and allow it to spill into
the next one along the pathway. One example of this might
be the case of the SEG 22 sand at the E fault (Figs. 3 and 4b)
where the trap on the northeast side is not filled to cross-
fault spill and the trap on the southwest has only indications
of biogenic gas. Alternatively, factors related to trap
geometry, such as the presence of large-displacement
sealing faults or low vertical relief of the trap, could cause
migration to be diverted along structural strike (NW–SE)
rather than to continue toward the SW. Gibson and Bentham
(2003) discuss an example of the latter type of behavior in
Mahogany field.
The model described above, although developed primar-
ily on observations from the SE field trend, requires only
slight modification to also explain the observations in the
northwestern fields (Fig. 12b). Firstly, the NW area was
affected by Pleistocene differential source-rock uplift that
did not impact the SE trend. This increased the complexity
of the Samaan geochemistry and influenced the distribution
of oil and gas in the structure (more gas shallow and on east
side). Teak field, located in the same structural position
,15 km to the south, also shows a downward increase in
C15þ n-alkane content in oils (Ames & Ross, 1985) and a
predominance of high-maturity (Dzou, unpublished data)
gas in reservoirs on the east side of the structure. These
similarities suggest that the same migration model can be
applied to other NW trend fields.
A second modification of the model necessary to explain
some of the NW trend observations is the local capturing of
thermogenic petroleum by west-dipping carrier beds where
fault-juxtaposed against mudstone-dominated strata west of
Samaan and Teak. This geometry, which is not present in
the SE field trend, only exists because of the extraordinarily
large displacement on this fault. As a result, a narrow
window exists along the fault through which vertically
migrating petroleum can access the faulted terminations of
southwest-dipping carrier beds that continue updip into the
west flank of Samaan and Teak fields (Fig. 12b).
Fig. 11b shows the inferred petroleum flowpaths in map
view along a single upper-Pliocene map horizon using the
model outlined above. This simulation was done using the
flow-vector modeling capability in 3DMOVEw (Midland
Valley Exploration) on a present-day horizon surface.
Petroleum flow along the surface (carrier bed) is assumed
to be solely buoyancy driven and, thus, occurs along the
horizon perpendicular to structure contours. Major faults are
assumed to serve as flow boundaries and, therefore, flow is
deflected around fault tips. The area of charge access into
the sand occurs only along a narrow band at the shelf edge.
The results illustrate that the proposed model can reasonably
provide thermogenic charge to the known occurrences of
thermogenic petroleum at this stratigraphic level (Fig. 11b).
Note that, since no charge access to the horizon was allowed
from the west (see above), the thermogenic accumulations
located immediately west of Teak and Samaan fields are not
charged in this simulation. Simulations done on sequentially
restored 3D surfaces show that similar migration directions
and patterns persist throughout the Plio-Pleistocene evol-
ution of the Columbus basin.
Demaison and Huizinga (1991) developed a genetic
classification of petroleum systems based upon charge
factor, migration style, and entrapment style. They defined
‘vertically drained’ and ‘laterally drained’ as terms
describing the predominant direction of petroleum
migration within basins. It is interesting to attempt to
classify the Columbus basin petroleum system within their
scheme. The model outlined here is a hybrid system,
consisting of initial vertical drainage through the mud-
stone-dominated, deep-water section followed by lateral
drainage within the spatially continuous shelf deposits.
Petroleum migration distances in the cross-stratal direction
were on the order of 2–6 km, whereas lateral flow along
carrier beds occurred over distances of 5–25 km in rather
tortuous routes dictated by the horizon geometry and fault
patterns. For both migration styles, the abundance of seals
and potential traps along any migration pathway imply
‘high impedance’ in their classification. Demaison and
Huizinga (1991) evaluated charge factor based on an
estimate of source-rock expulsion potential. Although we
have no direct, quantitative evidence of the source
potential in the Columbus basin, we do observe that
some valid traps along migration pathways are not charged
with thermogenic petroleum (e.g. Cassia 22 sand). Thus,
we are tempted to conclude that the system is, at least
locally, undercharged. This conclusion does not, however,
necessarily imply low source-rock expulsion potential.
Instead, the apparent undercharging in this system probably
reflects the abundance of available traps (large available
trap volume) combined with the fact that individual
reservoir horizons capture thermogenic charge from rather
small, linear areas bounded by successive positions of the
shelf edge. In addition, significant migration losses are
possible within the cross-stratal portion of the migration
pathway since large-scale migration focusing does not
occur until the Plio-Pleistocene shelf carrier beds are
encountered.
7. Exploration implications
The concepts outlined in this paper, and its companion
(Gibson et al., 2004), provide a framework within which
to evaluate the petroleum products likely to be
encountered in reservoirs within undrilled prospects in
the Columbus basin. Reservoir-specific phase prediction
requires understanding (1) the nature of the thermogenic
R.G. Gibson, L.I.P. Dzou / Marine and Petroleum Geology 21 (2004) 109–129 127

charge expelled within the fetch area of the prospect and
(2) the factors likely to control the relative abundances of
thermogenic and biogenic petroleum reaching the trap.
The primary control on thermogenic product type in the
basin is the position of the Cretaceous shelf edge
(Gibson et al., 2004). The southward decrease in
source-rock hydrogen index across this shelf margin
makes the thermogenic fraction in prospects located in
the northwest part of the basin more likely to be oil than
those to the southeast.
Biogenic gas is a ubiquitous component in all of the
petroleum so far discovered in the Columbus basin. For any
potential accumulation, the relative contributions of the
thermogenic and biogenic fractions are controlled by post-
expulsion migration pathways, especially the position of
any trapped reservoir relative to the point of thermogenic
charge input into that sand. Reservoirs in traps situated close
to or outboard of the shelf edge at the time of sand
deposition are expected to contain thermogenic-dominated
products of high-maturity. Moving landward (SW) along a
reservoir horizon from the shelf edge increases the
likelihood that trapped accumulations will become more
biogenic gas dominated. The extent to which a thermogenic
component is incorporated within an accumulation depends
on the amount of thermogenic charge available to the sand
and the geometry of the migration pathway between the trap
of interest and the shelf edge.
Since the thermogenic fraction in the northwestern part
of the basin is dominantly oil, undiscovered accumulations
in this area are likely to be either oil- or biogenic gas-
dominated, with thermogenic-dominated gas accumulations
expected to be subordinate. In contrast, undiscovered
accumulations in the southeastern areas are likely to consist
of biogenic and thermogenic gas mixed in various
proportions. Oil in this area may or may not accompany
larger gas accumulations, but is unlikely to exist as the only
phase in a trap. We expect that oil legs below gas caps are
most likely to be found in volumetrically large traps with
low initial biogenic gas quantities, most probably in
proximal positions along migration pathways. Late trap
formation, after substantial burial, is a likely mechanism to
minimize the accumulation of biogenic gas. In these traps,
the early migrating oil fraction of the thermogenic charge
will not have been able to go completely into solution in a
pre-existing biogenic accumulation.
Using a model of fractionation during vertical migration,
Persad et al. (1993) concluded that oil accumulations are
likely to exist beneath the offshore gas-condensate (SE
trend) fields. Based on the models presented here, we expect
to see an overall increase in the maturity of trapped products
with depth. However, because we believe that the oil
fraction is controlled by source-rock characteristics (Gibson
et al., 2004), not secondary migration, we see no reason that
oil-dominated accumulations should exist at great depths
below these fields.
8. Conclusions
In this paper, we have developed a regional petroleum
migration model for the Columbus basin by integrating a
geochemical data set with an understanding of fault-seal
behavior, abnormal pressures, basin structure, and strati-
graphic architecture. The result is a simple, unified
petroleum migration model for the Columbus basin shelf
in which thermogenic charge access is ultimately con-
trolled by the geographic distribution of sand carrier beds
and how these vertically stacked stratigraphic units relate
spatially to one another along their basinal limits.
Migration in this system consists of two components,
vertical migration through mud-dominated, deep-water
sediments followed by horizon-parallel flow along laterally
extensive carrier beds. Thermogenic charge access to any
individual sand occurs only in a linear geographic area
where that sand is not shielded from vertical migration by
stratigraphically older sands.
The geochemical characteristics of the trapped petroleum
in this system are primarily a reflection of migration distance,
with the earliest-expelled (lowest maturity) products having
progressed farthest along the migration pathway. Because of
the stratigraphic and structural geometries involved, this
creates a pattern of increasing thermogenic content and
maturity with depth at any location, despite the fact that much
of the migration is horizon-parallel. In parts of the basin, this
simple pattern has been overprinted by complex mixing of
maturity fractions in single accumulations as a result of late-
stage differential source-rock uplift. We are unable to
reconcile the observations in this basin with previously
proposed models that emphasize petroleum fractionation
accompanying vertical migration (Heppard et al., 1990;
Persad et al., 1993).
Although this study is specific to the Columbus basin,
many complex aspects of the geology of this basin are
similar to other offshore Tertiary basins. Specifically, the
structural style, stratigraphic architecture, and presence
of a petroleum source-rock stratigraphically separated
from the reservoir-bearing section are not unique. We
have shown how these aspects interact with one another
in the Columbus basin petroleum system and hope that
these ideas may stimulate a re-evaluation of petroleum
systems in other geographic areas with similar
complexities.
Acknowledgements
The work presented here would not have been possible
without the large body of work done by BP (Amoco) Energy
Company of Trinidad and Tobago personnel over the past
30 þ years. Numerous members of the extended 1997–
2000 Trinidad Exploration team contributed to the evolution
of our ideas, including J. Sydow, R. Marksteiner,
W. Phillips, P. Bentham, and A. Pepper. Serena Jones
R.G. Gibson, L.I.P. Dzou / Marine and Petroleum Geology 21 (2004) 109–129128

from Midland Valley Exploration assisted with use of
3DMOVEw for map-based petroleum flow simulation. A
thorough review by K. Meisling substantially improved the
manuscript. BP Energy Company of Trinidad and Tobago is
thanked for permission to publish this paper.
References
Algar, S. (1998). Tectonostratigraphic development of the Trinidad region.
SEPM Special Publication, 58, 87–109.
Ames, R. L., & Ross, L. M. (1985). Petroleum geochemistry applied to
oilfield development, offshore Trinidad. First Geological Conference of
the Geological Society of Trinidad and Tobago, 227–236.
Berg, R. R. (1975). Capillary pressure in stratigraphic traps. American
Association of Petroleum Geologists Bulletin, 59, 939–956.
Cassani, F., Gallango, O., Talukdar, S., Vallejos, C., & Ehrmann, U. (1988).
Methylphenanthrene maturity index of marine source rock extracts and
crude oils from the Maracaibo Basin. Organic Geochemistry, 13,
73–80.
Clayton, C. (1991). Carbon isotope fractionation during natural gas
generation from kerogen. Marine and Petroleum Geology, 8, 2–34.
Connan, J., & Cassou, A. M. (1980). Properties of gases and petroleum
liquids derived from terrestrial kerogen at various maturation levels.
Geochimica Cosmochimica Acta, 44, 1–23.
Cosgrove, J. W. (2001). Hydraulic fracturing during the formation and
deformation of a basin: A factor in the dewatering of low-permeability
sediments. American Association of Petroleum Geologists Bulletin, 5,
737–748.
Demaison, G., & Huizinga, B. J. (1991). Genetic classification of petroleum
systems. American Association of Petroleum Geologists Bulletin, 75,
1626–1643.
DiCroce, J., Bally, A. W., & Vail, P. (1999). Sequence stratigraphy of the
Eastern Venezuela basin In P. Mann (series editor K.J. Hsu), (Vol. 4)
(pp. 419–476). Sedimentary basins of the world.
Dzou, L. I., Holba, A. G., Ramon, J. C., Moldowan, J. M., & Zinniker, D.
(1999). Application of new diterpane biomarkers to source, biode-
gradation and mixing effects on Central Llanos Basin oils, Colombia.
Organic Geochemistry, 30, 515–534.
Dzou, L. I. P., & Hughes, W. B. (1993). Geochemistry of oils and
condensates, K Field, offshore Taiwan: A case study in migration
fractionation. Organic Geochemistry, 20, 437–462.
Dzou, L. I. P., Noble, R. A., & Senftle, J. T. (1995). Maturation effects on
absolute biomarker concentration in a suite of coals and associated
vitrinite concentrates. Organic Geochemistry, 23, 681–697.
England, W. A., & Mackenzie, A. S. (1989). Geochemistry of petroleum
reservoirs. Geologische Rundschau, 78, 214–237.
Gibson, R. G. (1994). Fault-zone seals in siliciclastic strata of the Columbus
basin, offshore Trinidad. American Association of Petroleum Geologists
Bulletin, 78, 1372–1385.
Gibson, R. G., & Bentham, P. A. (2003). Use of fault-seal analysis in
understanding petroleum migration in a complexly faulted anticlinal
trap, Columbus basin, offshore Trinidad. American Association of
Petroleum Geologists Bulletin, 87, 465–478.
Gibson, R. G., Dzou, L. I. P., Greeley, D. F (this volume). Shelf Petroleum
System of the Columbus Basin, offshore Trinidad, West Indies. I. Source
rock, thermal history, and controls on product distribution. Marine and
Petroleum Geology in press. (doi:10.1016/j.marpetgeo.2003.11.003).
Heppard, P. D., Ames, R. L., & Ross, L. M. (1990). Migration of oils into
Samaan field, offshore Trinidad, West Indies. In K. A. Gillezeau (Ed.),
Transactions of the Second Geological Conference of the Geological
Society of Trinidad and Tobago (pp. 157–168).
Heppard, P. D., Cander, H. S., & Eggertson, E. B. (1998). Abnormal
pressure and the occurrence of hydrocarbons off the east coast of
Trinidad, West Indies. In B. E. Law, G. F. Ulimshek, & V. I. Slavin
(Eds.), Abnormal Pressures in Hydrocarbon Environments (Vol. 70)
(pp. 215–246). American Association of Petroleum Geologists Memoir.
Hirsch, L. M., & Thompson, A. H. (1995). Minimum saturations and
buoyancy in secondary migration. American Association of Petroleum
Geologists Bulletin, 79, 696–710.
Hoorn, C., Guerrero, J., Sarmiento, G. A., & Lorente, M. A. (1995). Andean
tectonics as a cause for changing drainage patterns in Miocene northern
South America. Geology, 23, 237–240.
Knipe, R. (1997). Juxtaposition and seal diagrams to help analyze fault
seals in hydrocarbon reservoirs. American Association of Petroleum
Geologists Bulletin, 81, 187–195.
Leonard, R. (1983). Geology and hydrocarbon accumulations, Columbus
basin, offshore Trinidad. American Association of Petroleum Geologists
Bulletin, 67, 1081–1093.
Mackenzie, A. S. (1984). Applications of biological markers in petroleum
geochemistry In J. Brooks, & D. Welte (Eds.), (Vol. 1) (pp. 115–214).
Advances in Organic Geochemistry.
Persad, K. M., Talukdar, S. C., & Dow, W. G. (1993). Tectonic control in
source rock maturation and oil migration in Trinidad and implications
for petroleum exploration. GCSSEPM Foundation 13th Annual
Research Conference Proceedings, 237–249.
Peters, K. E., & Moldowan, J. M. (1993). The biomarker guide. Englewood
Cliffs, NJ: Prentice-Hall.
Radke, M. (1988). Application of aromatic compounds as maturity
indicators in source rocks and crude oils. Marine and Petroleum
Geology, 5, 224–236.
Rosen, M. A. (1997). Geology and development of Kiskadee field, offshore
Trinidad. Offshore Technology Conference Proceedings, Houston, TX,
445–456.
Ross, L. M., & Ames, R. L. (1988). Stratification of oils in Columbus basin
off Trinidad. Oil and Gas Journal, 86, 72–76.
Stainforth, R. M. (1948). Description, correlation, and paleoecology of
Tertiary Cipero marl formation, Trinidad, B.W.I. American Association
of Petroleum Geologists Bulletin, 32, 1292–1330.
Tissot, B., Califet-Debyser, Y., Deroo, G., & Oudin, J. L. (1971). Origin
and evolution of hydrocarbon in early Toarcian shales, Paris Basin,
France. American Association of Petroleum Geologists Bulletin, 55,
2177–2193.
Wood, L. J. (2000). Chronostratigraphy and tectonostratigraphy of the
Columbus basin, eastern offshore Trinidad. American Association of
Petroleum Geologists Bulletin, 84, 1905–1928.
Yielding, G., Freeman, B., & Needham, D. T. (1997). Quantitative fault
seal prediction. American Association of Petroleum Geologists Bulletin,
81, 897–917.
R.G. Gibson, L.I.P. Dzou / Marine and Petroleum Geology 21 (2004) 109–129 129