the authorities' reaction: the philippines - imf elibrary
TRANSCRIPT
©International Monetary Fund. Not for Redistribution
Crisis in the Fmancial Sector and the Authorities' Reaction:
The Philippines jean-Claude Nascimento
Between 1981 and the middle of 1987, the Philippine economy faced a major crisis in the financial sector. Three commercial banks, 128 rural banks, and 32 thrift institutions failed, and 2 other private banks were under intervention. In addition, the biggest commercial bank, the Philippines National Bank, and the Oevdopment Bank of the Philippines, both government owned, became de facto insolvent and, in 1986, were bailed out by a transfer of their nonperforming assets (about :P 108 billion, equivalent to 80 percent of their combined assets) to the Asset Privatization Trust (APT), specially constituted to administer problem assets. The crisis began on a limited scale during 1980 and 1981 and intensified thereafter, culminating by the end of September 1986 in a significant contraction of the financial system (excluding the Central Bank of the Philippines-CBP). For the purpose of analysis, three distinct phases of the crisis have been identified.
The first phase, which spanned ali of 198 1 , featured a crisis of confidence triggered by fraud in the commercial paper market. 1 Although the crisis initially affected only a small part of the system outside the commer-
1 This e'·enr was known as the Dewey Dee Affair. In January 1981, Dewey Dee, an industrial magnare who had borrowed heavily in the commercial paper market, fied the country, leaving behind an estimated ,P 500--800 million of debt. The news sent a wa,·e of panic rhrough moncy market investors and small depositors. The former did not renew their funding, causing commercial paper borrowers to defauJt on a large scale. The small depositors shifted their deposits to large commercial banks, perceived as sounder financial institutions.
175
©International Monetary Fund. Not for Redistribution
176 • JEAN-CLAUDE NASCIME 1TO
cial and development banks, whose combined assets accounted for 16.5 percent of total assets of the finaneial system in 1980, the crisis had a lasting impact on confidence. The commercial paper market collapsed and many nonbank money market institutions went out of business. The two largest invcstment bouses belonging to two major holding companies went bankrupt, provoking the failure of the holding companies themselves and leading to the bankruptcy or takeover of their nu merous corporate subsidiaries. Wealth holders shifted funds to the highest-quality paper and to more stable and conservative banks.
The loss of confidence spread to the thrift banking system. Also, failures of rural banks, which had sharply increased in 1980, continued to rise in 1981. However, the assets of failed rural and th rift banks accountcd for onl y 1 . 6 percent of the total assets of the banking system in 1981, and the failurcs among them did not pose a threat w stability but sen·ed to weaken confidence further.
In the second phase, which spanned 1982(1)-1983(111), the Government intensified its assistance to nonfinancial and financial institutions, which served to alleviate the growing distress among nonfinancial corporations but widened the budget deficit. The Government increased its emergency lending and equity contributions to public corporations, arranged for the takeover of trou bled priva te banks by government financial institutions2 in order to facilitate their restructuring and eventual disposition, and supported the takeover by the government financial institutions of numerous nonfinancial firms in distress. The Government was attempting to prevent widespread private corporate failures and banking problems, while stepping up public investment to offset the slump in private sector im·estment. During this phase, political uncertainty became widespread and foreign exchange difficulties grew, although the problem was initially masked by swap and forward co,·er operations by the CBP as weil as by irregular banking operations. 1
When the third phase, whieh spanned 1983(IV)-1986(1V), began, there was widespread uncertainty in the economy, stem ming from the unstable political environment of the first half of 1983 and the balance of paymcnts crisis of October 1983. The cffects spilled o,·er to the banking system. Indeed, in October 1983, the authorities' announcement of a moratorium on external debt payments to foreign commercial banks provoked financial panic; a series of runs on the banks ensued, and this ti me commercial banks
1 Governmenr financial institutions include the Devclopment Bank of the Philippines (DBP), the Philippines National Bank (PNB), rhe Land Bank of the Philippines (LBP), the Government Service ln surance System (GSIS), and the Social Security System (SSS).
' Sorne of these deficiencies are discussed in Central Bank of the Philippines (1988, p. 6; and 1989, p. 15).
©International Monetary Fund. Not for Redistribution
Crisis in the Philippine Financia/ Sector • 177
were included. Large-scale flight co currency and outflo\\'s of capital occurred. The capital outflows thar were recorded during this period may have occurred even earlier and been obscured by the banking irregularities. The disclosure or sudden Joss of reserves in mid-Octobcr undermined confidence and cxacerbared the crisis.
By the end of this phase the hardest hir financial institutions werc the two largest governmenc-owned banks-the DBP and the PNB. The depth of the crisis du ring this phase is illustra red by three e\·encs:
• A staggering decline in commercial bank credit to the privatc scctor, which feil by 53 percent in real ter ms bctween the end of September 1983 and the end of September 1986.
• A massive restructuring of the DBP and the PNB, which led in November 1986 to a transfer of :P 108 billion of nonperforming assets (representing nearly 30 percent of total bank assets) to a go,·ernment agency-the APT.• Included in the transfer were =P 23.4 billion of nonperforming assets from the PNB, which contributed to a decline of 20.5 percent, in real terms, in commercial bank credit to the priva te sector during the lasr quarter of 1986.
• Continued government intervention in weak private banks and the closing of three priva te commercial banks. 5
Against this background, this chapter examines rhe causes and manifestations of the crisis in the Philippine financial sector and the reaction of the authorities to thar crisis. Attention here is on the behavior of the financial system before and du ring the cri sis; the aim is to clarify the linkages among financial reform, financial crisis, and macroeconomie performance.
The main conclusion of the chapter is thar factors within the financial system caused and exacerbated the crisis. Although the political and economie climatc of the lare 1970s and carly 1980s increased the fragiliry of the financial sector, weaknesses of the regulatory frame\\'ork and loose banking practices triggered and exacerbated the crisis. In the end, the interYentions by the authorities prcvcnted the banking sector from collapsing, but ar a high financial cost to taxpayers.
Section 1 discusses the background to the crisis and the role of the macroeconomie and regulatory environment. Section Il discusses the manifestations of the crisis, with emphasis on money and credit developments. Section I l l describes the measures taken ro deal with the crisis. Section IV highlighrs the main findings.
• This agency was set up in December 1986 to take over the nonperforming asscts of state banks and to resell them to private investOrs. ln 1986, the value of thcse assets was cstimated at :P 20 biUion (i.e., 19 percenr of their book value).
' The fate of one insolvent commercial bank remained undecided as of the end of 1987 because of litigation contcsting the liquidation.
©International Monetary Fund. Not for Redistribution
178 • JEAN-CLAUDE NASCIMENTO
1. Setting of the Crisis
Three factors within and outside the financial system are examined here in order to differentiate their effects on the crisis: (1) the macroeconomie setting and political climate before and during the crisis; (2) the structure of the financial sector and its liberalization initiated in 1972 and completed in 1981; and (3) prudential regulation and supervision of financial institutions and related institutional practices.
Macroeconomie Setting
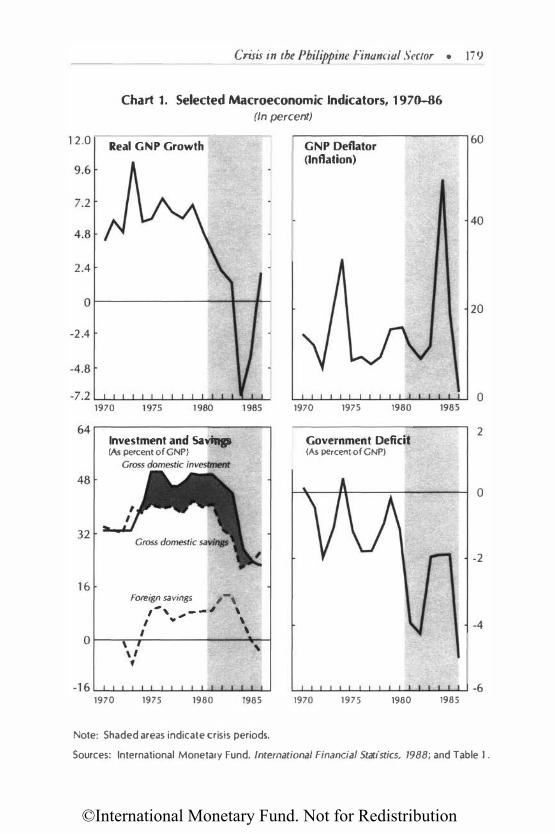
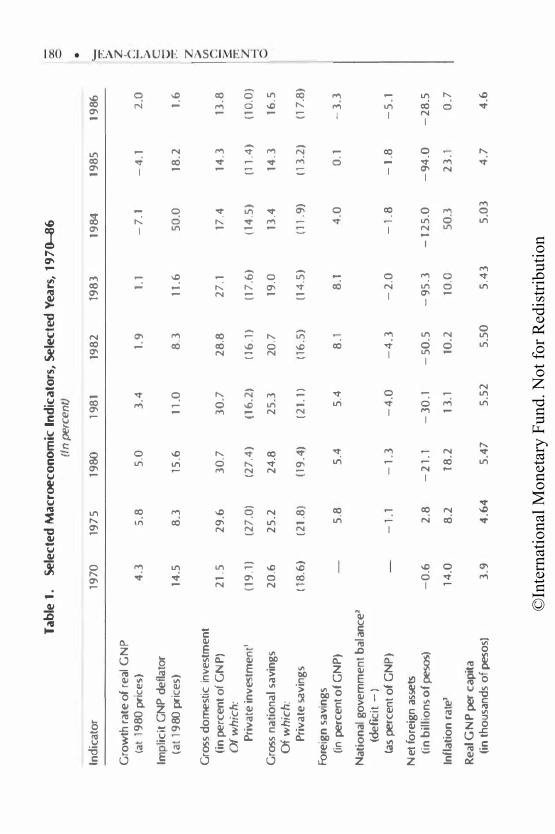
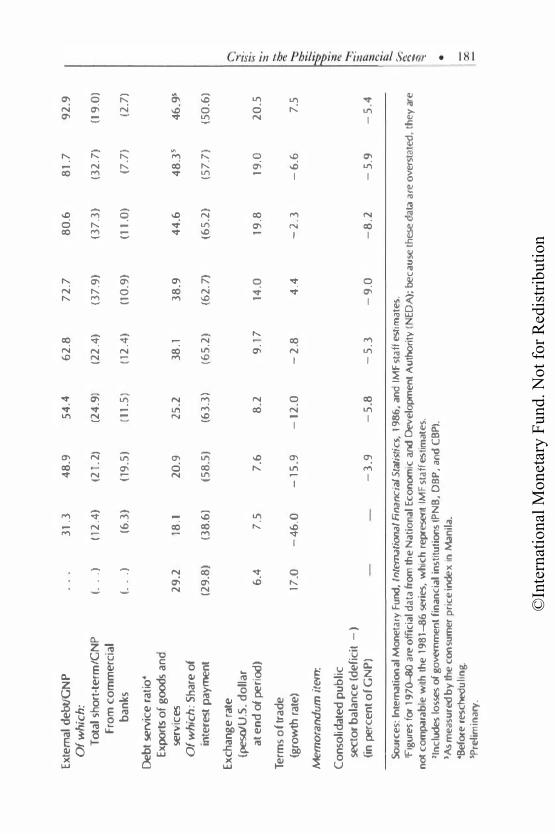
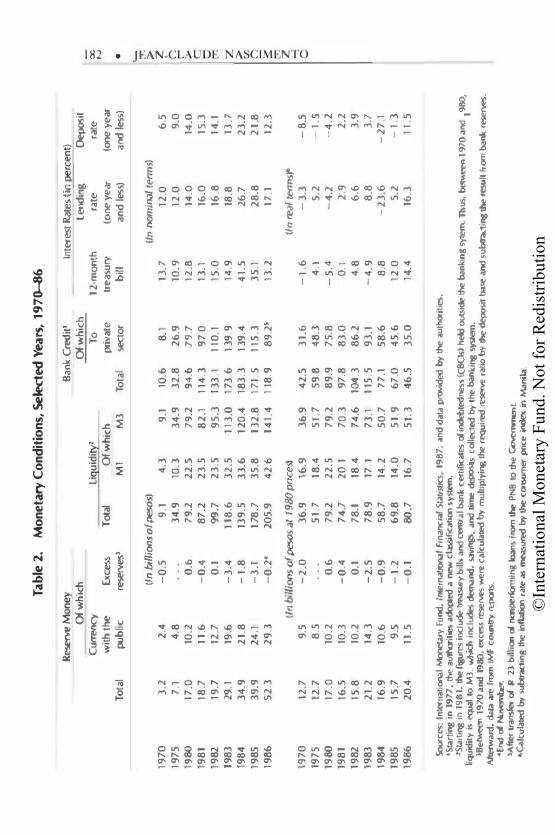
During the 1970s the economy experienced strong growth in real GNP, despite the low productivity of investment (see Table 1 and Chart 1). The unprecedented, demand-driven economie boom reflected the authorities' development strategy based on intensive investment growth.6 The financing of the investment boom resulted in a widening of external imbalances and a sharp rise in foreign savings (in percent of nominal GNP) (Table 1). Also, the growth of domestic bank credit accelerated, particularly to the private sector (see Table 2). PNB and DBP accounted for a substantial portion of credit to the private sector, which often was granted on the basis of political, rather than economie, considerations.
During the lace 1970s and carly 1980s, a deterioration in world economie conditions further weakened the external position, wh ile the limited crisis of confidence in 1981 seemed to dampen investors' expectations regarding growth projections; these developments affected private im·estments adversely in the 1980s.7 By the second half of 1983, the effects of rapid expansion in earlier years, the growing uncertainty in the political climate, and unfavorable external conditions combined to cause a balance of payments crisis, which led to the announcement of a remporary moratorium on external debt repayments in October. This event triggered a run on banks, a eut-off of external financing, and sorne capital flight, ali of which had significant feedback effects on the macroeconomy, particularly the balance of payments. ln lare 1983, CBP reacted by injecting reserve money to meer the increase in currency demand (see Table 2). The sharp increase in reserve money during 1983 also reflected large !osses on swap
' ln line with this strategy, the authorities carried out inward-looking and expansionary macroeconomie policies during the 1970s, namely, protectionist trade polieies, widespread tax incentives, and preferential lending by government finaneial institutions to priority sectors (i.e., construction, manufaeturing, and energy).
1 The sharp decline of private investrnent (in percent of GNP) in 1980/8 1 is overstated because the investrnent data during the 197�80 period are unreliable. However, the magnitude of the decline and the downturn in economie growth point to more sluggish investrnent in the 1980s than in the 1970s.
©International Monetary Fund. Not for Redistribution
1 2.0
Crisis in the Philippine Financial Sector • 179
Chart 1. Selected Macroeconomie lndicators, 1 970-86
(ln percent)
Real GNP Growth .-------------------� 60 GNP Deflator (Inflation)
o r-------------�-+�� 20
-2.4
1970
64 .-------------------�
48
32
1 6
lnvestment and Savinp (As percent of GNP)
Foreign s,wings ,-, , .. , _ _ , \
'" " \ \
-1 6 '--'-...L...I.-'-J....L.....I....1-L-..L......I.-'-.................... -'-' 1970 1975 1980 1985
Note: Shaded areas indicate cri sis periods.
1970 1975 1980
Government Deficit (As percent of GNP)
1970 1975 1980
0 1985
2
0
-2
-4
1985
Sources: International Monetary Fund, International Financial Statistics, 1988; and Table 1 .
©In
tern
atio
nal M
onet
ary
Fund
. Not
for R
edis
tribu
tion
Ta
ble
1.
Sele
cte
d .M
acroe
co
no
mie
ln
dic
ato
rs,
Select
ed Y
ears
, 19
70-
-.86
6
(ln pe
rcent)
•
lnd
icat
or
1970
19
75
19
80
19
81
198
2
198
3
1984
19
85
19
86
'- �
>
G
row
th r
ate
of
real
GN
P
z
lat
198
0 pr
iees
) 4
.3
5.8
5
.0
3.4
1 .
9
1.1
-7
.1
-4
.1
2.0
b
>
lm
plic
it G
NP
de
flato
r c
(at
1980
prie
es)
14.5
8
.3
15.6
1
1.0
8
.3
11.
6
50
.0
18.2
1.
6
�
'Z
Gros
s d
ome
stic
inv
est
me
nt
>
Cil
(in
perc
en
t o
f G
N P
) 2
1.5
2
9.6
3
0.7
3
0.7
2
8.8
2
7.1
17
.4
14.3
13
.8
n
3:::
Ofw
hich
: rr:
Pri
va
te in
ves
tme
nt'
(19
.1)
(27
.0)
(27
.4)
(16
.2)
06
.1)
(17
.6)
( 14
.5)
(11
.4)
(1 0
.0)
2;
"""
Gros
s n
ati
ona
l sa
vin
gs
20
.6
25
.2
24
.8
25
.3
20
.7
19.0
13
.4
14.3
16
.5
'-'
Of w
hich
: P
riv
ate
sav
ing
s (1
8.6
) (2
1.8
) (1
9.4
) (2
1.1)
(1
6.5
) (1
4.5
) (1
1 . 9
) (1
3.2
) (1
7.8
)
Fore
ign
sa
vin
gs
(in pe
rce
nt o
f G
NP
) 5
.8
5.4
5
.4
8.1
8
.1
4.0
0
.1
-3
.3
Nat
ion
al g
ove
rnm
ent
ba
lan
cel
(defic
it-
) tas
perc
ent
of
GN
P)
-1
.1
-1
.3
-4
.0
-4
.3
-2
.0
-1
.8
-1
.8
-5
.1
Net
fore
ign
asse
ts
(in
bil
lion
s o
f pesos)
-0
.6
2.8
-
21.
1 -
30
.1
-5
0.5
-
95
.3
-1
25
.0
-9
4.0
-
28
.5
Infl
ati
on
rat
e'
14.0
8
.2
18
.2
13
.1
10.2
10
.0
50
.3
23
.1
0.7
Re
al G
NP
per
ca
pit
a (i
n t
hous
a.nd
s o
f peso
s)
3.9
4
.64
5
.47
5
.52
5
.50
5
.43
5
.03
4
.7
4.6
©In
tern
atio
nal M
onet
ary
Fund
. Not
for R
edis
tribu
tion
Exte
ma
l d
ebU
GN
P
31
.3
48
.9
54
.4
62
.8
72
.7
80
.6
81
.7
92
.9
Ofw
hic
h:
To
tal s
hort
-te
rm/G
NP
( .
.. )
(1
2.4
) (2
1.2)
(2
4.9
) (2
2.4
) (3
7.9
) (3
7.3
) (3
2.7
) (1
9.0
) Fr
om
co
mm
erc
ial
ba
nks
(.
..
) (6
.3)
(19
.5)
(11.
5)
(12
.4)
(1 O
. 9)
(11
.0)
(7.7
) (2
.7)
Deb
t se
rvic
e r
atio
• Ex
ports
of
goods
an
d
serv
ices
2
9. 2
18
.1
20.9
25
.2
38.1
3
8.9
4
4.6
4
8.3
5 4
6.9
5 O
f w
hic
h:
Shar
e o
f in
teres
t p
ayme
nl
(29
.8)
(38
.6)
(58
.5)
(63
.3)
(65
.2)
(62.
7)
(65
.2)
(57
.7)
(50
.6)
Exc
han
ge
rat
e
Q
(peso/U
.S. d
olla
r i!:;
·· at
en
d o
f pe
riod
) 6
.4
7.5
7
.6
8.2
9
.17
14
.0
19.8
19
.0
20
.5
;:::·
::;·
T e
rms
of t
rad
e
- �
(gJo
wth r
ate
) 17
.0
-4
6.0
-
15.9
-
12.0
-
2.8
4
.4
-2
. 3
-6
.6
7.5
�
Me
morandu
m i
tem:
�
-·
Co
nso
lidat
ed
pu
blic
::
:: "'
secto
r b
ala
nce
(de
ficit
-)
...,_
��
(in
perc
en
t of G
NP
) -
3.9
-
5.8
-
5. 3
-
9.0
-
8.2
-
5.9
-
5.4
�
::
:: ..
...
Sour
ce
s: In
terna
tion
al M
one
tary
Fu
nd,
Internationa
l fina
nci
aiS
tati
stics
, 19
86
, an
d IM
F s
taff
estim
ates
. �
*
'F
igures
for 1
970-80
are
off
iCia
l dat
a from
lhe
Nat
iona
l Eco
nomie
and Dev
elo
pme
nt
Aut
horit
y (
EDA)
; beca
use
these
data
are
overs
tated
, th
ey a
re
�
not c
om
para
ble
with
the
198
1-36
series
, w
hic
h re
presen
t IM
F s
taff
estim
ate
s.
<:>
�
'ln
cludes
!osses
of g
ovem
me
nt
fin
anci
al in
stitu
tion
s (P
NB
, D
BP, a
nd C
BP
J. lAs
me
asu
red b
y lh
e c
onsu
mer
pri
ee inde
x in
Man
ila.
•
•Bef
ore
res
chedu
ling.
oc
5P
relim
i nary
.
©In
tern
atio
nal M
onet
ary
Fund
. Not
for R
edis
tribu
tion
Tab
le 2
. M
one
tary
Co
nd
itio
ns,
Select
ed Y
ears
, 19
7().
...86
Resenre
Money
Ban
k C
redit'
ln
teres
t Rates
tin �
rcen
l)
Ofw
hic
h Of
wh
ich
len
din
g
Deposit
..
...
Curreocy
lig
uid
ityl
To
12
-mon
th
rate
ra
te
00
....,
w
ith
tne
Ex ces
s T
otal
Of
wh
ich
p�
ivat
e
tre
asury
�o
ne y
ea
r (o
ne y
ear
To
tal
pub
lic
reserves
' M
l M
3
Tota
l sec
tor
bill
an
d les
s)
and les
s)
•
'--
(ln b
iffion
s of peso
s)
(ln no
mina
l term
s)
tr:
>
19
70
3
.2
2.4
-
0.5
9
.1
4.3
9
.1
10.6
8
.1
13
.7
12
.0
6.5
z
.
19
75
7
.1
4.8
3
4.9
10
.3
34
.9
32
.8
26
.9
10
.9
12
.0
9.0
p
1
980
1
7.0
10
.2
0.6
7
9.2
2
2.5
7
9.2
9
4.6
79
.7
12.8
14
.0
14.0
>
1
98
1
18
.7
11
.6
-0
.4
87
.2
23
.5
82
.1
114
.3
97
.0
13
.1
16.0
1
5.3
c
;:
:; 1
98
2
l9
.7
12
.7
0.1
99
.7
23
.5
95
.3
13
3.1
1
10
.1
15
.0
16
.8
14
.1
("'":
1�9
83
2
9.1
19
.6
-3
.4
11
8.6
3
2.5
1
13
.0
17
3.6
1
39
.9
14
.9
18.8
1
3.7
z
19
84
3
4.9
2
1.8
-
1.8
1
39
.5
33
.6
12
0.4
1
83
.3
13
9.4
4
1.5
2
6.7
2
3.2
>
:r.
1
98
5
39
.9
24
.1
-3
.1
17
8.7
3
5.8
1
32
.8
17
1.5
1
15
.3
35
.1
28
.8
21
.8
�
19
86
5
2.3
2
9.3
-
0.2
4 2
05
.9
42
.6
14
1.4
1
18.9
8
9.2
' 1
3.2
1
7.1
1
2.3
s:
: �
C ln
billi
ons o
f pesos a
t J 9
80 pri
ees)
(in
real terms-,.
z
-l
1,9
70
\2
.7
9.5
-
2.0
3
6.9
1
6.9
3
6.9
4
2.5
3
1.6
-
1.6
-
3.3
-
6.5
0
19
75
1
2.7
8
.5
51
.7
18
.4
51
.7
59
.8
48
.3
4.11
5
.2
-1
. 5
19
80
17
.0
10.2
0.
6
79
.2
22
.5
79
.2
89
.9
75
.8
-5
.4
-4.
2
-4
.2
196
1
16.5
10
.3
-0
.4
74
.7
20
.1
70
.3
97
.8
83
.0
0.1'
2.9
2
.2
19
82
1
5.8
10
.2
0.1
7
8.1
1
8.4
7
4.6
1
04.3
8
6.2
4
.8
6.6
3
.9
19
83
2
1.2
1
4.3
-
2.5
7
8.9
1
7. l
7
3.1
1
15
.5
93
.1
-4
. 9
8.8
3
.7
19
84
1
6.9
10
.6
-0
.9
58
.7
14
.2
50
.7
77
.1
58
.6
6.8
-
23
.6
-2
7.1
19
85
1
5.7
9
.5
-1
.2
69
.8
14
.0
51
.9
67
.0
45
.6
12
.0
5.2
-
1. 3
19
86
2
0.4
1
1.5
-
0.1
80
.7
16
.7
51
.3
46
.5
35
.0
14
.4
16
.3
11
.5
Sourc
es:
Inter
nationa
l Mone!aly
Fund
. tnrern
aûonal
Fina
ncia
l St
atislic
s, 19
87; a
nd d
ata p
ro»ided
by the
aut
horit
ies.
•Sta
rting
in
1977
. the
aulhori
lies a
dopced
a new
classification
sy
stem.
2SI.a.
rting
in
198
1. the
frgures
indude
treasury b
ills
and œnti
al ba
ni< c
ertif
ocal
es ol
indebtednes
s !CBCl
s) held
outs
ide the
ban
kin
g sytem"
Thu
s. betwe
en 197
0 and
t 980
. liqu
idit
y is
equa'
l lo
M3
, wh
ich in
cl udes clema
nd. sav
ings.
and lime
deposi
ls col
lected by
lhe
banki
ng system
. 38
etwe
en 197
0 and
1980
. exœs
s resen.oes
were c
alcu
lated by
mul
tiply
ing lhe
required
reserve r
atio
by
the deposil
base and
subtract
ing the
resull
from ba
nk rese
rves.
Aherward. data
are
from
IMF
country
reportS •
.. End
ol NcM!mber
. SA
fter lra
nsfe< ol
li! 2
3 b
iltion
ol no
operform
fng
loans
from lhe
PN
B 10
tbe Go:Nemrn
erot. �Ca
lcvlated
by subtracl
ïng
the in
ftaaion r
ate as
measured
by lhe
consu
mer
prie
e index
io Ma
nila
.
©International Monetary Fund. Not for Redistribution
Crisis in the Philippine Finaflcial Sector • 1 8 3
operations. 8 As a result, inflation and depreciation of the peso acceleratcd during 1983/84.
The subsequent tightening of monctary policy, the soaring interest rates during 1984/85, and the continucd devaluations of the peso ali contributed to the spread of distress among financial and nonfinancial corporations. lndeed, the high real interest rate and the peso devaluation aggra\"ated the debt-servicing problems of firms with foreign currency debt. 9
With very high interest rates, growing uncertainty, and weakening of confidence, aggregate demand dropped, leading to a deep recession. Bank credit, especially to the priva te sector, feil sharply in real terms.
Structure of Financial Sector and Jts Liberalization
To finance the development strategy based on intensi\"e investment growth, CBP introduced numerous reforms between 1972 and 1981. Institutional reforms included the liberalization of controls on foreign capital. Regulatory reforms included the progressive liberalization of interest rates and the introduction of "uni versai banks. "10 Prudential reforms included the elimination of restrictions on the entry of foreign banks and on their equity participation in domestic banks, and higher barriers to entry for domestic banks (e.g., higher minimum capital requirements).
Liberalization of Controls on Foreign Capital
Evidence shows that the liberalization of controls on foreign capital, together with lending practices largely influenced by political considerations, increased the financial fragility of nongo\"ernment entities. ln the subsections that follow, the specifie polie y measures are presented and their impact on the externat debt burden and the financial structure of nongovernment entities is discussed.
Measures. During the 1970s, CBP introduced the foreign currency deposit (FCD) system, created offshore banking unies, and eased controls on direct foreign investment. These measures were aimed at attracting foreign capital and permitting wider portfolio selection for domestic investors.
Under the foreign currency deposit system, resident and nonresident
8 These )osses amounted ro about ,P 5 billion in the last quarter represenring half of the yearly increase in reserve moncy from end-1982 to end-1983.
• The share of foreign currency debt in the total debt of the nongO\·emment sector rose from an average of 44 percent between 1980 and 1982 to 60 percent berween 1983 and 1985.
10 Commercial banks with a capital of ,P 500 million or more can apply to become a uni versai bank or "uni bank" and, upon approval, are authorized to expand their activities to include investmcnt banking services, securities transactions, credit guarantees, leasing, and equity investments in allied and nonallied undertakings.
©International Monetary Fund. Not for Redistribution
184 • JEAN-CLAUDE NASCIMENTO
nationals could hold foreign currency deposits with eligible banks.11 Jn turn, CBP allowed foreign currency deposit banks to make foreign currency loans to domestic residents subject to prior CBP approval, or peso loans after these banks had converted their foreign currency into pesos under a swap arrangement with CBP. 12 Secrecy laws protected investors' deposits. Depositors were also free to withdraw their funds or transfer them abroad. Interest rates on these foreign currency deposits were unregulated. Beginning in 1978, these banks' foreign exchange operations were subject to open position limits.u
Under the offshore banking unit system, both domestic banks and nonresidents were allowed to hold foreign currency deposits with offshore banking units. Banks' lending operations required prior CBP approval. ln addition, banks were not allowed to make loans with a maturity exceeding 360 days.14
The relaxation of foreign capital controls included the following measures:
(1) Foreign direct cash investment made after 1973 became freely repatriable;
(2) Foreign-owned companies were granted authorization to raise loans in domestic currency;
(3) Foreign banks were allowed to take equity participation, with minority or majority ownership, in domestic banks. Although significant capital controls remained, the removal or relaxation of restrictions stimulated capital inflows.
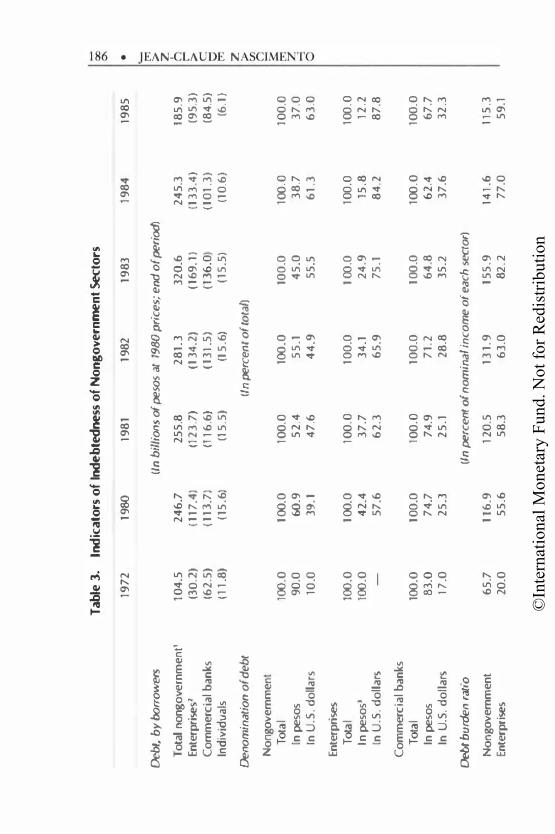
Overindebtedness and Unsound Debt Structure. As a result of these de,·elopments and of the foreign financing of the investment boom, the externat debt burden rose sharply white the maturity of this debt shortened (see Table l). These developments disputed the contention that liberaJization of capital controls would reduce foreign borrowing.15 Rather, these devel-
11 Eligibility criteria included competence in the conducr of foreign exchange operations as weil as the minimum unimpaired capital requirement. Liability restrictions consisted of holding a minimum foreign currency reserve ratio with CBP. Furthermore, foreign exchaoge receipts from exports and most invisible transactions could not be deposited in these FCD accounrs.
11 Banks were prohibited from converting foreign currency inro pesos, except under swap arrangements with CBP.
11 Under Circular No. 547, issued in 1978, banks were required to cover at (east 70 percent of the foreign currency liabilities with eligible assets in the same currency. This foreign currency cover included deposits with the CBP and other Philippioe-based commercial banks, deposits with foreign banks and offshore banking units, foreign curreocy loans or securities, foreign currency notes and coins, and foreign currency swapped with the CBP.
" This restriction applied also to domestic banks operating under the FCD system. 11 According to McKinnon (1973), freer capital flows would deter capital flight and boost
the national saving rate, thereby reducing extemal borrowing.
©International Monetary Fund. Not for Redistribution
Crisis Ùl the Philippine Financial Sector • 185
opments suggested that liberalization of the foreign capital flow contributed to excessive externat borrowing, which permitted domestic investment to accelerate before the crisis. 16
lncomplete financial reforms, combined with the political climate, encouraged such borrowing. lndeed, the authorities cased capital controls white maintaining controls in other areas, such as credit allocation and trade transactions. 17 Excessive foreign borrowing and domestic protection contributed to weakening the financial position of nongovernment entities.
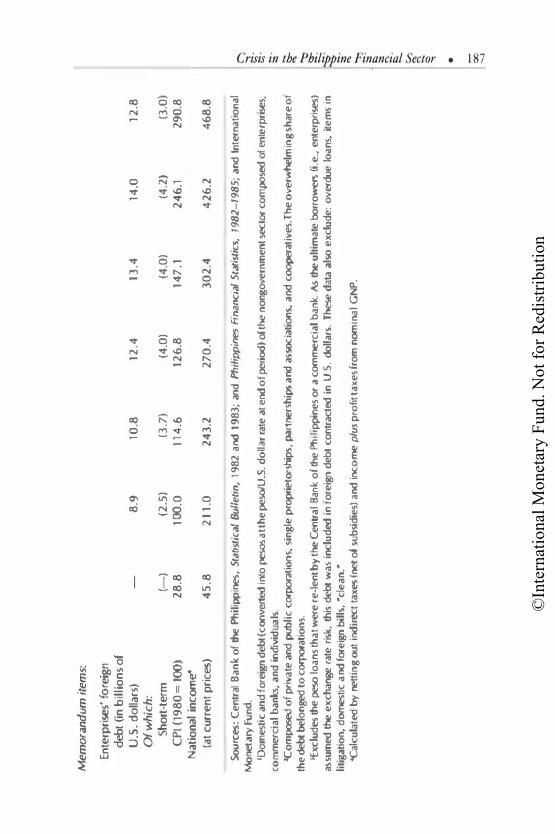
As large foreign capital inflows exerted strong inflationary pressures during the second half of the decade, real lending rates became negative by 1980 (see Table 2). Along with high trade barriers, these negative rates created widespread misallocation of resources and encouraged debt finance. Tndeed, during the 1970s enterprises and banks had relied heavily on debt finance, especially foreign, to expand their activities.18 Consequently, the total outstanding debt of the nongovernment sector (both in real terms and in percent of national income) doubled beN,een 1972 and 1980; the share of this debt denominated in foreign currency quadrupled to 40 percent in 1980 (see Table 3). For enterprises, the changes in the levet and structure of indebtedness were even more dramatic. As a result of these changes, the quality of banks' portfolios (especially of the DBP and PNB) and the soundness of their liability structure had deteriorated by 1980.
Un til 1983, the rise in the debt burden and the weakening of the liability structure of nongovernment entities accelerated, reflecting the end of the economie boom and deterioration in the political and economie climate during tbat period. Thereafter, a massive liquidation of debt took place, as domestic and foreign creditors curtailed sharply the supply of funds (see Tables 1 and 3).
lnterest Rate Liberalizatùm
The statistical analysis in the subsections that follow suggests that despite a fairly open capital account, domestic monetary conditions played a significant rote in explaining the behavior of interest rates after the
16 As Fry (1988) notes: "Foreign capital flow liberalization can stimulate invesrment more than domestic savings, causing excess indebtedness" (p. 345).
17 For instance, banks were required to aUocate 1 5 percent of their total deposit base for credit to the rural sector. This was known as the agrilagra requirement. Other portfolio restrictions included banks' minimum holdings of govemment securities. Furthermore, selective credit policies designed to allocate credit to priority sectors (e.g. , exports of tradirional products) were maintained. DBP was a main conduit for channeling these funds to the priority sectors.
" lndividuals also resorted to domestic debt to finance their rapidly rising consumption.
©In
tern
atio
nal M
onet
ary
Fund
. Not
for R
edis
tribu
tion
Tab
le 3
. lnd
ica
to.rs
of
lnde
bted
ness
of
No
ng
ove
rnme
nt
Secto
rs
00
o..
19
72
1
980
19
81
19
82
1
98
3
19
84
19
85
•
'--
Debt, b
y bo
rro
wers
(ln b
illio
ns o
f pe
sos a
t 19
80 p
riees
; en
d o
f pe
riod)
cri
>
z
T
ota
l no
ng
ov
ern
me
nt'
1
04
.5
24
6.7
2
55
.8
28
1.3
3
20
.6
24
5.3
1
85
.9
. n
Ente
rpri
ses2
(3
0.2
) (
11
7.4
) (1
23
. 7)
(13
4.2
) (1
69
. 1)
(13
3.4
) (9
5.3
) r
>
C
om
me
rcia
l ban
ks
{62
.5)
(1
13
.7)
(11
6.6
) (
13
1.5
) (1
36
.0)
(1 0
1.3
) (8
4.5
) c
v
In
divi
du ai
s (1
1.8
) (1
5.6
) (1
5.5
) (1
5.6
) ( 1
5.5
) (1
0.6
) (6
.1}
rr.
Deno
min
ati
on
of d
eb
t (ln
percent o
f lo
ta{)
z
>
Vl
N
ongov
em
me
nt
Q
3:::
Tota
l 100
.0
100
.0
100
.0
100.0
10
0.0
1 0
0.0
10
0.0
rr.
ln pe
sos
90
.0
60.9
5
2.4
5
5.1
4
5.0
3
8.7
3
7.0
2;
ln
U.S
. do
llars
1
0.0
3
9·.1
4
7.6
4
4.9
5
5.5
6
1.3
6
3. 0
a
Ente
rpri.ses
To
tal
100.0
1
00.0
10
0.0
1
00
.0
10
0.0
1
00
.0
10
0.0
ln pe
sos'
100
.0
42
.4
37
.7
34
.1
24
.9
15
.8
12
.2
ln U
.S. d
oll
ars
5
7.6
6
2.3
6
5.9
7
5.1
8
4.2
8
7.8
Co
mm
erc
ial b
anks
T
ota
l 100
.0
10
0.0
10
0.0
1
00
.0
10
0.0
10
0.0
10
0.0
ln
peso
s 8
3.0
7
4.7
7
4.9
7
1.2
6
4.8
6
2.4
6
7.7
ln U
.S. d
oll
ars
1
7.0
2
5.3
2
5.1
2
8.8
3
5.2
3
7.6
3
2.3
Debt b
urde
n r
atio
(ln
percen
t of n
omin
al i
nc
om
e o
f ea
ch
secto
r)
No
ngov
em
me
nt
65
.7
11
6.9
1
20
.5
13
1.9
1
55
.9
141
.6
11
5.3
Ente
rpr:i
ses
20
.0
55
.6
58
.3
63
.0
82
.2
77
.0
59
.1
©In
tern
atio
nal M
onet
ary
Fund
. Not
for R
edis
tribu
tion
Mem
oran
dum
item
s:
Ente
rpri
ses'
fo
reig
n d
�b
t (i
n b
illi
on
s o
f U
.S.
do
llars
) 8
.9
10
.8
12
.4
13
.4
14
.0
12
.8
Ofw
hic
h:
Sho
rt-t
erm
(-
) (2
.5)
(3.7
) (4
.0)
(4.0
) (4
.2)
(3.0
)
CPI (
198
0 =
100
) 2
8.8
1
00.0
1
14
.6
126
.8
14
7.1
2
46
.1
29
0.8
Nat
ion
al i
ncom
�
(at
curr
ent
pri
ees)
45
.8
21
1.0
2
43
.2
27
0.4
3
02
.4
42
6.2
4
68
.8
Sources
: C
en
iJal
Ba
nk
of
the Ph
ilipp
ines,
Stat
istic
al B
ull
eti
n,
198
2 a
nd 1
98
3;
and
Phifippines
Financia
l Sta
ti5lics,
1982
-1 9
85;
an
d In
terna
tiona
l Mo
netary
ftmd
. 1 Domesti
c a
nd
fo
reig
n debt
{cooverted
i nto
pesos a
t th
e pesoiU
.S. d
olla
r ra
te a
t end
of pe
riod)
of t
he n
ong
ove
rnm
en
t !ieelor
co
mpo
sed o
f en
terp
rise
s,
com
mer
cial
ban
ks,
an
d i
nd
ivid
ua
ls.
>co
mposed
of
pri
va
te a
nd
publi
c c
orporati
on
s, s
ing
le p
mprie
tors
hip
s, pa
rtne
rsh
ips a
nd a
ssocia
tion
s, a
nd c
oopera
tiv
es.
Th
e o
ve
rwhelm
i ng
sh
are
of
the
debt be
lon
ged t
o c
orporat
ion
s.
}Exclu
des
the peso
loa
ns
tha
t we
re r
e-l
en
t by
the
Ce
niJ
al
Ban
k o
f th
e Ph
ilippi
ne
s or
a c
omme
rcia
l b
an
k. As
the u
ltim
ate
borr
owers
(i.e
., e
nte
rpri
ses)
assu
med
the e
xch
an
ge r
ate
ris
k, th
is debt
was i
nclu
ded in
fo
reig
n d
eb
t co
niJacted
in
U.S
. dolla
rs.
These
data
also
ex
clu
de
: o
verd
ue
lo
ans,
ite
ms
in
liti
gat
ion
, d
ornestic
and
fore
ign
bill
s, M
cle
an
. M
'Cak
ula
ted by
net
tin
g o
ut i
ndir
ect
taxes
{net of
sub
sid
ies)
a.nd
inc
ome
plu
s p
rofit
ta
xe
s fr
om
nom
inal
GN
P.
•
©International Monetary Fund. Not for Redistribution
188 • JEAN-CLAUDE NASCIMENTO
liberalization. Between 1984 and 1986 these conditions, reflected in indicators of excess demand for real money (M3), 19 were influenced largely by the uncertain environmem and by CBP policy efforts to bring clown inflation. The main reforms are presemed first and the behavior of interest rates following the reforms is discussed.
Rejom1s. Du ring the 1970s CBP administered the lev cl and structure of imerest rates. I t tried to maintain positive rates in real terms and to keep nominal interest rates aligned with foreign imerest rates. In 1976 the usury law was abolished, and CBP introduced ceilings on money market rates applied to deposit substitutes. 20
In 198 1 , CBP deregulated ali bank rates except short-term lending rates. Ceilings on ali deposit rates were lifted in July; those on medium- and long-term lending were lifted in October. The ceiling on short-term lending rates was eliminated at the end of 1982. Meanwhile, in March 1982, to enhance transparency in the credit and deposit markets, both a Prime Rate and a Manila Reference Rate (MRR) began to be compiled and announced. 21
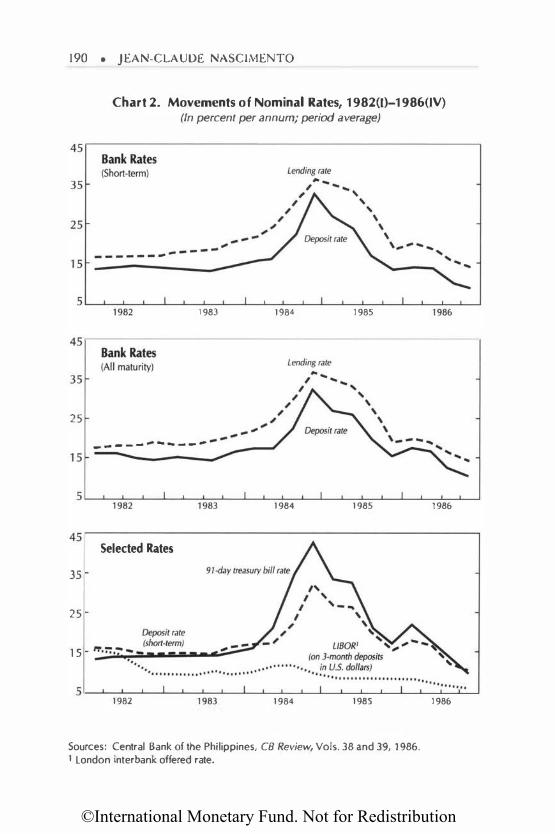
Determinants of lnterest Rate Leve/s. Following the liberalizatîon, nominal interest rates first rose graduai! y, th en shot up between 1984 and 1985, before declining in 1986 (see Chart 2). Despite a fairly open capital accoum, foreign factors (e.g., foreign interest rates and expected exchange rate changes) were not the only determinants of nominal imerest rates after the liberalization.
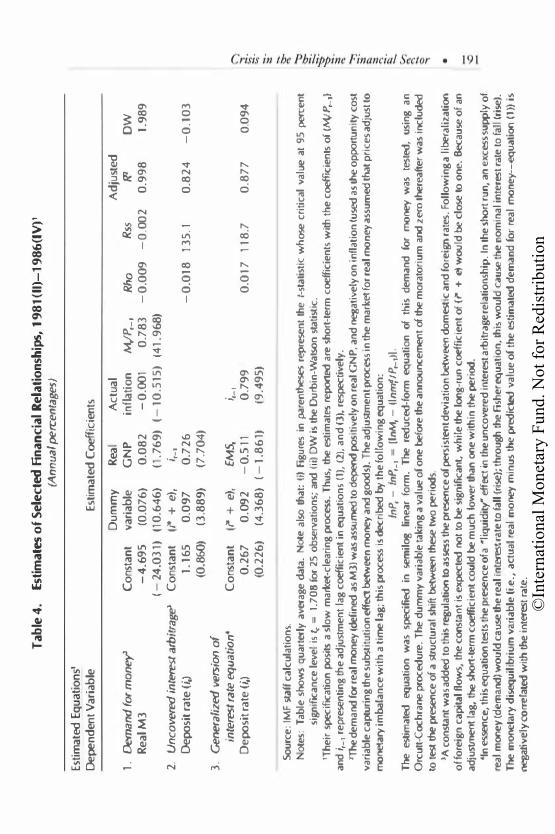
Jndeed, the uncovered interest arbitrage relation explained only part of the imerest rate fluctuation from 1981(I) ro 1986(IV). Empirical equations for domcstic interest rates (nominal) indicated that the estimated shortand long-run coefficients of the foreign interest rate (adjusted for ex post devaluations) were 0 . 1 and 0.5, respective! y (see Table 4). 22 The estimated
19 M3 consists of M2 (currency, demand deposits, ti me and savings deposits} plus deposit substitutes (interest-bearing securities issued by banks to their customers}.
20 This measure was aimed at curbing the flow of financial savings from bank deposits into deposit substitutes whose yield wa.s unregulated. The ceiling on short-term deposit substitutes was set at 17 percent in 1976 and then lowered to 16 percent in 1978. Both ceilings were higher than the rates on savings and short-term ti me deposits.
11 Under the Prime Rate system, a sample of ten commercial banks regularly publicized the rate that they charged to their best customers on a 90-day Joan. Under the MRR system, CBP compiled an average cost of bank funds--of 30-day, 60-day, and 90-day maturities-from a sample of ten commercial banks. These costs of funds were market determined and known as the Mani la Reference Rates or MRRs.
11 A simple equation for uncovered interest arbitrage was estimated for the 1981(11) to 1986(1V) period. Because the financial market was assumed to adjust with a lag, a lagged
dependent variable was introduced in the tested equation. A du mm y ,·aria ble ( 1 from 1981(11) to 1983(111) and 0 for the remaining quarters) was added to detect the presence of a structural
©International Monetary Fund. Not for Redistribution
Crisis in the Philippine Financial Sector • 1 89
coefficient of the dummy variable was statistically insignificam-a fact that points to a stable interest arbitrage relationship before and after the announcement of the moratorium. To test the significance of domestic factors affecting nominal interest rates, a more general relationship was estimated by including a variable measuring monetary disequilibrium. 23 The statistical significance of this variable (defined as the difference between actual M 3 and the estimated \'a lue of the demand for moncy, both in real terms) was evidence of the strong presence of the "liquidity" effect on nominal interest rates (see Table 4).
This liquidity effect was govemed by both the CBP's policy stance and the banks' behavior. ln 1982 and 1983 expansionary policies created an excess supply of real balances, which, in rum, put downward pressure on imerest rates (see Chart 2). Although the expansionary stance was maintained in the first half of 1984, a shortage of real balances subsequently emerged because of the sharp decline in the money multiplier, which put strong upward pressure on imerest rates; the fall in the money multiplier resulted from banks' cautious lending policies in the presence of widespread economie uncertaimy. The upward pressure on imerest rates persisted in 1985 and 1986, as the monetary policy stance became tight (see Section I I below).
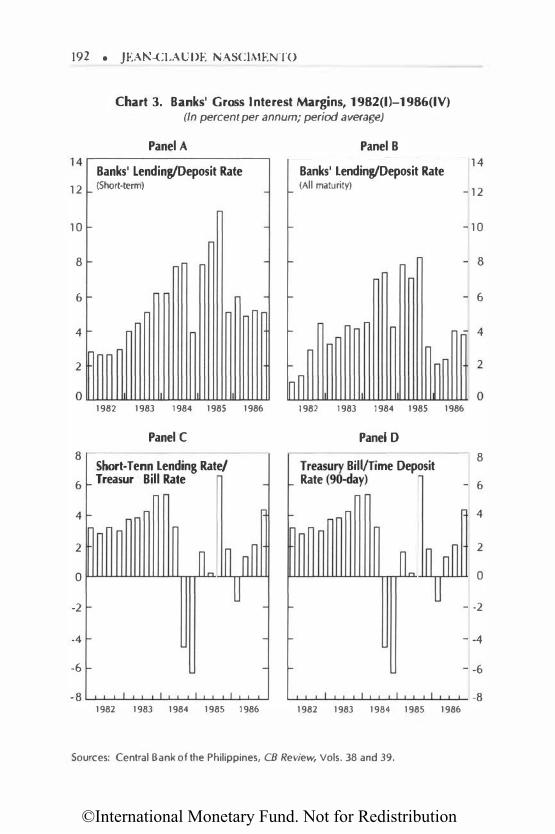
Determinants of lnterest Rate Structure. The gross margin between Jending and deposit rate flucruated by an average of about 4 percemage points annually between 1980 and 1984, and rose sharply between 1985 and 1986 (see Table 5). 24 But quarter! y data show that this margin was often larger and that it flucruated sharply, particularly for short-term rates (see Chart 3). The larger margin for short-term rates was caused by the inverted term structure of bank lending rates which reflected the increase of inflationary
shift in the equation after the announcement of the debt moratorium. The Orcutt-Cochrane estimation procedure was used. The results reported in Table 4 were qui te satisfactory. The coefficients for the foreign interest rate (adjusted for ex post devaluation) and the lagged dependent variable were significant at a 5 percent significance leve!.
" The empirical specification builds on Edwards and Khan (1985). Domestic interest rate is related to a weighted average of the foreign interest rate adjusted for expected exchange rate changes and of domestic factors, namely, monetary disequilibrium. expected inflation, and the long-term equilibrium rate of interest in real terms-a constant. Equations were estimated by the Orcutt-Cochrane procedure and two types of tests were performed. first, the interest rate equation was estimated in both an unrestricted form and a restricted form that posited that the liquidity effect was absent (i.e., monetary disequilibrium has no short-term effect on the real interest rate); a Chow test was applied to test the statistical significance of this restriction. Second, a dummy variable was used to test the stability of the slope coefficients during the two periods 1981(1) to 1983(1Jl) and 1983(1V) to 1986(1V).
24 Using a weighted average interest rate on secured loans (lending rate) and MRRs (banks' costs of funds) for a sample of ten commercial banks.
©International Monetary Fund. Not for Redistribution
190 • JEAN-CLAUD£ NASCIMENTO
Chart 2. Movements of Nominal Rates, 1982(1)-1986(1V) (In percent per annum; period average)
1983 1984 1985 1986
25
--- - --------
5 L-��-L--L-��-L--���-L�--��-L�--L-��� 1982 1983 1984 1985 1986
45.------------------------------------------------, Selected Rates
35
25
15
1982 1983 1984 1985
Sources: Central Bank of the Philippines, CB Review, Vols. 38 and 39, 1986. 1 London interbank offered rate.
1986
©In
tern
atio
nal M
onet
ary
Fund
. Not
for R
edis
tribu
tion
Tab
le 4
. Es
tim
ates
of
Sele
cted
Fin
an
cia
l Rel
atio
nsh
ips,
19
81
(II)
-19
86
(1V
) 1
(Ann
ual pe
rcentages)
Esti
mat
ed E
gua
tions
1 De
per�d
ent V
aria
ble
1 0
Demand
for m
oney>
C
on�
tan
t Re
aiM
3
-4
.6
95
(-
24
.03
1)
2.
Unc
overed in
terest ar
bitra
ge'
Co
nsta
nt
Depo
sit r
ate
(i,)
1.1
65
(0
.860
)
3.
Generaliz
ed ve
rsion
of
interes
t rate
equa
tion•
C
on�
tan
t D
epo
sit r
ate
(i,)
0.2
67
(0
.22
6)
Sou
rce:
IMF
staff
cal
cula
tio
ns..
Estim
ated
Coef
ficie
nts
Dum
my
R
eal
Act
ual
var
iab
le
GN
P
infl
atio
n
(0.0
76
) 0
.08
2
-0
.001
(10
.64
6)
(1.7
69
) ( -
10
.515
)
(i* +
e),
i,_.
0.0
97
0
.72
6
(3.8
89
) (7
.70
4)
(i* +
e),
EM
S,
;,_I
0.0
92
-
0.5
11
0.7
99
(4
.36
8)
(-1
.86
1)
(9.4
95
)
M,fP,_
, 0
.78
3
(41
.96
8)
Rho
R
ss
-0
.00
9
-0
.00
2
-0
.018
1
35
.1
0.0
17
1
18
.7
Ad
just
ed
f?2
0.9
98
0.8
24
0.8
77
ow
1.
98
9
-0
.10
3
0.0
94
otes
: T
abl.e
soo
ws q
uar
terly
aver
age
dat
a. N
ote a
lso th
at:
(i) Fi
gure
s in
pare
nlheses
rep
resen
t th
e /-
sta
tist
ic w
hose
cri
tica
l v
alue
at
95 percen
t si
gnif
tean
ce l
evel
is(.
=
1.7
08
for
25 o
bse
rvat
ion
s; a
nd (
ii) D
W i
s the
Durb
in-W
atson
sta
tist
ic.
'Th
eir
specif
icat
ion
posi
ts a
slo
w m
arket
-cle
arin
g proc
ess. T
hu
s, the
esti
mat
es reported
are �
ho
rt-l
erm
coe
ffici
ents
with
th
e coef
frcients
of
IM,IP,
_,)
an
d i
,_,
rep
rese
nti
ng th
e a
dju
stm
ent
lag
coef
fici
ent
in eq
uat
ion
s (1
), (
2),
and
(3),
res
pecti
vely
. 2'fhe
dem
and for
real
mon
ey (de
fine
d as
MJ
) was a
ssumed
to depend
posi
tive
ly o
n re
al G
NP
, an
d neg
ativ
ely
on
infl
atio
n (u
sed a
s the
op
port
un
ity
cost
v
aria
ble
captu
ring
the
su
bstit
utio
n ef
fect betwee
n mo
ney a
nd g
oods)
. Th
e ad
justm
ent proces
s in
the
marl
ce<t
for
real
mon
ey a
ssu
med
that
pri
ces
adju
st to
mo
netary
imba
lan
ce w
ith
a t
ime la
s; th
is pr
ocess
is dec
ribed
by
the
folt
ow
ing
equ
atio
n:
lnP,
-ln
P,_,
= !
lnM
,-(ln
mftP
..... ll
. The
estim
ated
eq
uat
ion
was
spec
ified
in
se
mil
og
lin
ear
form
. The
red
uc.ed
-fo
rm eq
uat
ion
of
this
d
eman
d
for
money
was
tes
ted,
usi
ng
an
Orc
utt
-Coc
hra
ne pr
oced
ure
. T
he
du
mm
y v
aria
ble
tak
ing
a va
lue o
f o
ne
befor
e th
e an
nounc
ement
of the
mor
ato
riu
m and
zero
!here
after
was
ioc
luded
to
test
the pr
esence
of
a str
uct
ura
l sh
ift betwe
en these tw
o pe
riod
s.
'A c
on
stan
t w
as a
dd
ed t
o th
is. reg
uta
tion
to a
s� the
presen
ce o
f �is
tent d
evia
tio
n betw
een d
omest
ic a
nd
fo.re
ign r
ates
. Fo
llo
win
g a
libe
rali
zati
oo
of f
ore
ign
cap
ital R
ow
s, t
he
const
ant
is e
xpected
nol
to be
�ig
nifi
cant
. w
hit
e the
long
-ru
n c
oeffi
Cien
t of
(i"
+ e1
wou
ld be
clo
se to
on
e. Bec
ause
of
an
adju
stment la
g, t
he sho
rt-te
rm c
oeffici
ent
cou
ld be
mu
ch l
ow
er th
an on
e w
ilh
in t
he pe
riod
. •r
n es
sence,
this
equ
atio
n tes
ts th
e p
resen
ce o
f a •
fiq
uid
ity"
effect
in th
e u
nco
vere
d in
teres
t arb
itra
ge re
lati
on
ship
. In
the
soort
run,
an
exc
ess s
upp
ly o
f re
al m
oney
(de
ma
nd) wo
uld
cause
the
real
interest
rate
to fa
ll {
rise
); th
rou
gh th
e Fi
sher
equ
atio
n. t
his
wou
ld ca
use
the
no
min
al in
teres
t rat
e to
fall
(rise
).
The m
ooeta
ry d
isequ
ilibr
ium
var
iab
le (
i.e.,
act
ual
rea
l m
oney
min
us
the pred
icted v
alu
e o
f th
e es
tim
ated
de
ma
nd
fO
T rea
l mo
ne
y-e
qu
ati
on (
1)) i
s negati
vel
y co
rrelated
with
the in
terest
rate
.
•
©International Monetary Fund. Not for Redistribution
192 • JEA -CLAUDE NASCIJ\>tENTO
Chart 3. Banks' Gross Interest Margins, 1982(1)-1986(1V) (In percent per annum; period average)
Panel A 14r---------------------�
Banks' lending/Deposit Rate 1 2 (Short-term)
10
8
6
4
2
Panel B
Banks' lending/Deposit Rate (All maturity)
1982 1983 1984 1985 1986 1982 1983 1984 1985 1986
Panel C Panel D 8
Short-T enn lending Rate/ Treasury Bill Rate 6
Treasury Bill/Time Deposit Rate (90-day)
4
�M � n� u
2
0 �M � n� u
-2
-4 - -
-6 - -
-8 I I I I I I I I 1982 1983 1984 1985 1986 1982 1983 1984 1985 1986
Sources: Central Bank of the Philippines, CB Review, Vols. 38 and 39.
14
12
10
8
6
4
8
6
4
2
0
-2
-4
-6
-8
©International Monetary Fund. Not for Redistribution
Crisis in the Philippine Financial Sector • 193
Table 5. Banks' Interest Margins, Selected Years, 1970-86 (In percent; period average)
Gross Margins Net unitary income (i.) per peso lent
i, - id r i, .. It i,.r i.a(1 -r )
( 1 ) (2) (3) (4) (5) (6)
1970 6.8 20.0 3.0 8.88 0.60 0.00 1975 7.4 20.0 3.0 7.94 0.60 1 .31 1 980 4.5 20.0 3.0 8.72 0.60 1 .54 1981 3.6 20.0 3.0 9.82 0.60 1 .58 1 982 3.0 18.0 3.0 12.05 0.54 1 .85 1 983 4.3 23.0 1 .0 1 2.00 0.23 1.72 1 984 4.5 24.0 4.0 1 6.38 0.96 4.73 1 985 7.1 24.0 4.0 17.31 0.96 4.00 1 986 6.4 22.0 4.0 1 1 .40 0.88 1.54
Sources: Buhat (1987); and IMF staff calculations. Definitions:
Net Margins
i. (i. - id)
(7) (8)
9.48 5.18 9.85 4.95
10.86 1 .86 12.00 0.40
14.44 -0.76 13.95 -1.05 22.07 -0.13 22.27 1 . 1 7 13.82 2.12
i , - id = difference between lending (i,) and deposit rate (id), as defined i n footnote 21,
page 188.
r = Required reserve ratio. i, = Interest rate on required reserves deposited at the CBP. i� = Net interest income per peso lent.
i� = i(1 - t)(1 - a)( 1 - r)
t = Gross tax receipts on lending operations; t = 5 percent on each unit income from lending.
a = Agri/agra required ratio; a = 15 percent of banks' loan portfolio. i. = Interest rate on treasury bill that banks can hold to meet other agri/agra required ratio.
Thus, the net income per peso lent is derived by adding interest earnings on treasury bills held to meet the agri/agra requirement and on required reserves:
i. = i� + i, .r + i • . a(1 - r).
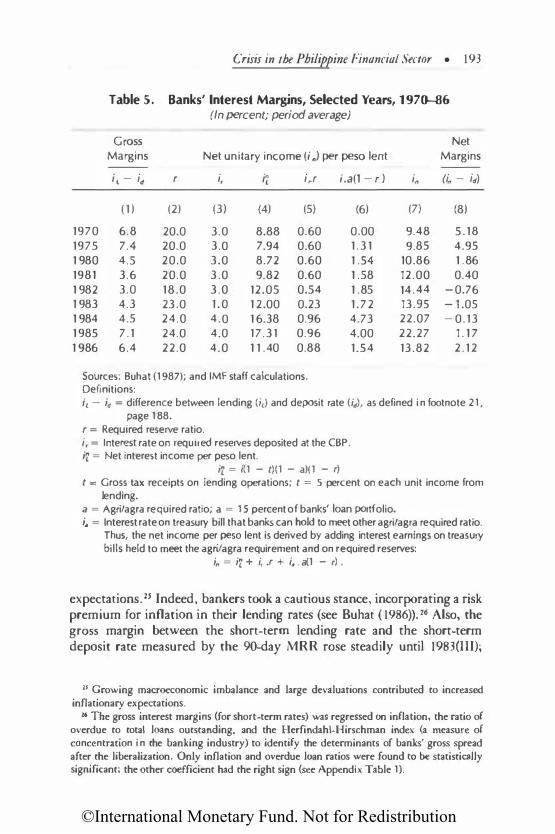
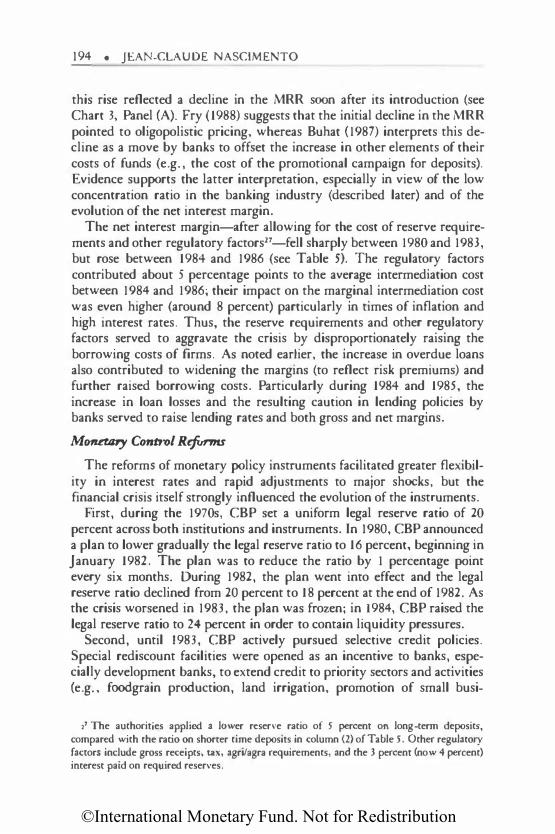
expectations. 25 Indeed, bankers took a cautious stance, incorporating a risk premium for inflation in their lending rates (see Buhat ( 1986)). 26 Also, the gross margin between the short-term lending rate and the short-term deposit rate measured by the 90-day MRR rose steadily until 1983(III);
21 Growing macroeconomic imbalance and large devaluations contributed to increased inflationary expectations.
26 The gross interest margins (for short-term rates) was regressed on inflation, the ratio of overdue to total loans outstanding, and the Herfindahl-Hirschman index (a measure of concentration i n the banking industry) to identify the determinants of banks' gross spread after the liberalization. Only inflation and overdue loan ratios were found to be statistically significant; the other coefficient had the right sign (see Appendix Table 1).
©International Monetary Fund. Not for Redistribution
194 • JEAN-CLAUDE NASCIMENTO
this rise reflected a decline in the MRR soon after its introduction (see Chart 3, Panel (A). Fry (1988) suggests that the initial decline in the MRR pointed to oligopolistic pricing, whereas Buhat (I 987) interprets this decline as a move by banks to offset the increase in other elements of their costs of funds (e.g., the cost of the promotional campaign for deposits). Evidence supports the latter interpretation, especially in view of the low concentration ratio in the banking industry (described later) and of the evolution of the net interest margin.
The net interest margin-after allowing for the cost of reserve requirements and other regulatory factors27-fell sharply between 1980 and 1983, but rose between 1984 and 1986 (see Table 5). The regulatory factors contributed about 5 percentage points to the average intermediation cost between 1984 and 1986; their impact on the marginal intermediation cost was even higher (around 8 percent) particularly in times of inflation and high interest rates. Thus, the reserve requirements and other regulatory factors served to aggravate the crisis by disproportionately raising the borrowing costs of firms. As noted earlier, the increase in overdue loans also contributed to widening the margins (to reflect risk premiums) and further raised borrowing costs. Particularly during 1984 and 1985, the increase in loan losses and the resulting caution in lending policies by banks served to raise lending rates and both gross and net margins.
Monetary Control Reforms
The reforms of monetary policy instruments facilitated greater flexibility in interest rates and rapid adjustments to major shocks, but the financial crisis itself strongly influenced the evolution of the instruments.
First, during the 1970s, CBP set a uniform legal reserve ratio of 20 percent across both institutions and instruments. In 1980, CBP announced a plan to lower gradually the legal reserve ratio to 16 percent, beginning in January 1982. The plan was to reduce the ratio by 1 percentage point every six months. During 1982, the plan went into effect and the legal reserve ratio declined from 20 percent to 18 percent at the end of 1982. As the crisis worsened in 1983, the plan was frozen; in 1984, CBP raised the legal reserve ratio to 24 percent in order to contain liquidity pressures.
Second, until 1983, CBP actively pursued selective credit policies. Special rediscount facilities were opened as an incentive to banks, especially development banks, to extend credit to priority sectors and activities (e.g., foodgrain production, land irrigation, promotion of small busi-
17 The authorities applied a lower reserve ratio of 5 percent on long-term deposits, compared with the ratio on shorter time deposits in column (2) of Table 5. Other regulatory factors include gross receipts, tax, agri/agra requirements, and the 3 percent (now 4 percent) interest paid on required reserves.
©International Monetary Fund. Not for Redistribution
Crisis in the Philippine Financial Sector • 195
nesses). Following the crisis of confidence in 1981, CBP also opened a special rediscount window for medium- and long-term loans and equity investment to help government financial institutions finance the takeover and acquisition of troubled entities hit by the crisis. In November 1983, CBP also opened a liquidity window to counter the increasing pressures on the banking system. During 1984 and 1985, however, CBP drastically modified the rediscounting policy. It set access limits on the refinance facilities, raised the rediscount rates to market-related levels, unified the terms of access of these facilities, and, in November 1985, reduced the number of regular rediscount windows from five to one.
Third, beginning in the mid-1970s, CBP relied increasingly on open market operations, based on its own securities, to regulate the domestic liquidity of the banking system. Indeed, until 1981, CBP used central bank certificates of indebtedness (CBCis) with maturities longer than 180 days. 28 In 1983, however, CBP stopped issuing CBCis by auction and sold them on tap at a fixed yield.29 In 1984, CBP introduced central bank bills with maturities of less than 180 days; during 1985 and 1986, auctions of central bank bills would become the main instrument for the dramatic tightening of monetary policy.
Finally, CBP introduced swap operations in 1982. This instrument, which became more important as the 1980s progressed, aimed at improving CBP's foreign exchange position and providing liquidity to deposit money banks so as to smooth out short-term interest rates. Because of the fall in the value of the peso, CBP incurred huge foreign exchange losses on these swap operations.
On the whole, these reforms had positive effects, because they allowed CBP to react promptly to the numerous monetary shocks (e.g., bank runs, portfolio shifts, increased domestic financing of budgetary deficits) that buffeted the economy between 1983 and 1986, and to transmit its policy actions to the banking system swiftly via interest rates. Through high interest rates, CBP was able to meet its reserve money targets and to bring down inflation by 48 percentage points within two years; in 1986, inflation stood at 1 . 8 percent. JO The adaptations of discount window policies served to prevent a collapse of the banking system.
The timing and sequencing of some measures, however, seemed to
21 Owing to their unattractive features and low budgetary pressures, treasury bills played no role in the conduct of open market operations. After an unsuccessful attempt to restore the primacy of treasury bill issues in 1981, CBP pursued the conduct of open market operations using primarily its own securities until 1986.
19 Treasury bill issues were also being sold on tap ar that time. 10 The management and impact of monetary policy at the height of the crisis (i.e., between
1984 and 1986) are discussed in greater detail in Section II.
©International Monetary Fund. Not for Redistribution
196 • JEAN-CLAUDE NASCIMENTO
exacerbate instability. In view of expectation of further devaluation of the peso against the U.S. dollar as a result of the persistent weakening of the external position and accelerating rate of devaluation of the peso between 1979 and 1982, the introduction of swap operations with foreign exchange guarantees seemed ill-timed; CBP was able to finance unsustainable balance of payments deficits, but it risked large exchange losses if the trend in the peso depreciation continued. Jl Furthermore, the opening of numerous special rediscount facilities, in addition to the emergency facility, between 1981 and 1983 was inconsistent with interest rate deregulation, insofar as access to these facilities by financial institutions weakened the effectiveness of open market operations. (Banks could obtain refinancing from CBP at below-market rates and at their own initiative.) As expected, these measures had inflationary effects between 1981 and 1983. The appropriate sequencing of the regulatory reforms should have been to modify the rediscount mechanism while interest rates were deregulated, not after.
Banking Structure
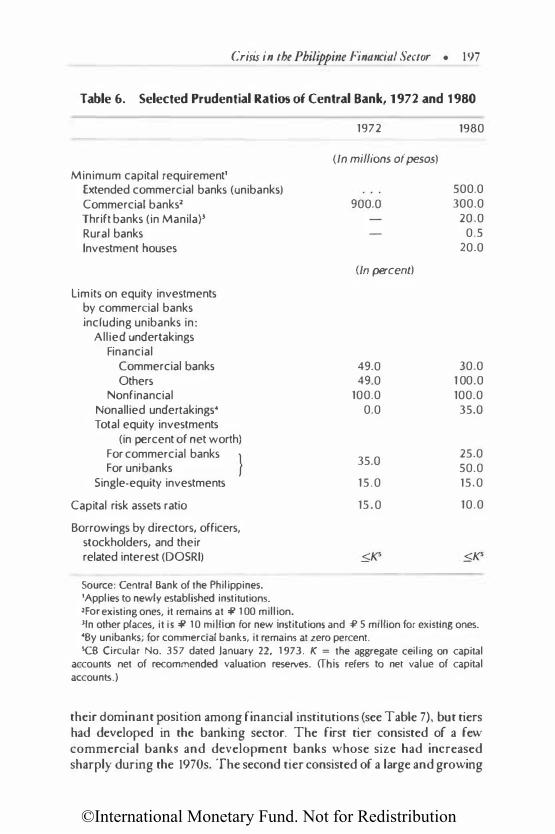
Measures. Between 1971 and 1981 CBP attempted to consolidate the domestic banking system while promoting greater competition by allowing foreign banks to enter. In 1972, CBP substantially raised the minimum capital requirement for all banks (see Table 6). After 1975, banks that could not comply with this requirement were permitted to merge with other domestic and foreign banks. However, CBP also actively encouraged banks to open branches, particularly in rural areas.
In 1980, CBP enacted legislation permitting the establishment of "universal" banks.12 They also raised the minimum capital requirement again. The previous functional classification of thrift banks into savings banks, private development banks, and savings and loan associations was eliminated. Thrift banks were allowed to carry on all operations performed by commercial banks except foreign exchange operations. The fact that they were also subject to lower reserve requirements gave them a cost advantage. Entry requirements for rural banks, which lend to farmers and rural entrepreneurs, were very liberal; capital requirements were low and limited management experience was accepted. n
Impact of the Crisis. The crisis significandy altered the banking structure. First, in terms of the volume of assets, by 1980 banks had increased
11 Actually, in 1983, CBP had abandoned irs earlier stance and indicated that the outstanding amount of swap operations at end-1982 would not be increased.
11 Nine commercial banks converted to unibanks, one of which (Manila Bank) was recently liquidated and another (Philippine National Bank) was subject to major restructuring. Unibanks did not actively pursue the opportunities in near-banking activities permitted to them because of the unstable environment and the preoccupation with survival.
11 The banking experience of management often consisted of only a few weeks of training.
©International Monetary Fund. Not for Redistribution
Crisis in the Philippine Financial Sector • 197
Table 6. Selected Prudential Ratios of Central Bank, 1972 and 1980
Minimum capital requirement' Extended commercial banks (unibanks) Commercial banks2 Thrift banks (in Manila)l Rural banks Investment houses
limits on equity investments by commercial banks including unibanks in:
Allied undertakings Financial
Commercial banks Others
Nonfinancial Nonallied undertakings• Total equity investments
(in percent of net worth) For commercial banks } For unibanks
Single-equity investments
Capital risk assets ratio
Borrowings by directors, officers, stockholders, and their related interest (DOSRI)
Source: Central Bank of the Philippines. 'Applies to newly established institutions. 2For existing ones, it remains at :f/1 00 million.
1972
(In millions of pesos)
900.0
(In percent)
49.0 49.0
100.0 0.0
35.0
15.0
15.0
1980
500.0 300.0
20.0 0.5
20.0
30.0 1 00.0 100.0
35.0
25.0 50.0 15.0
10.0
1ln other places, it is :f/1 0 million for new institutions and 4? 5 million for existing ones. •By unibanks; for commercial banks, it remains at zero percent. SCB Circular No. 357 dated January 22, 1973. K = the aggregate ceil ing on capital
accounts net of recommended valuation reserves. (This refers to net value of capital accounts.)
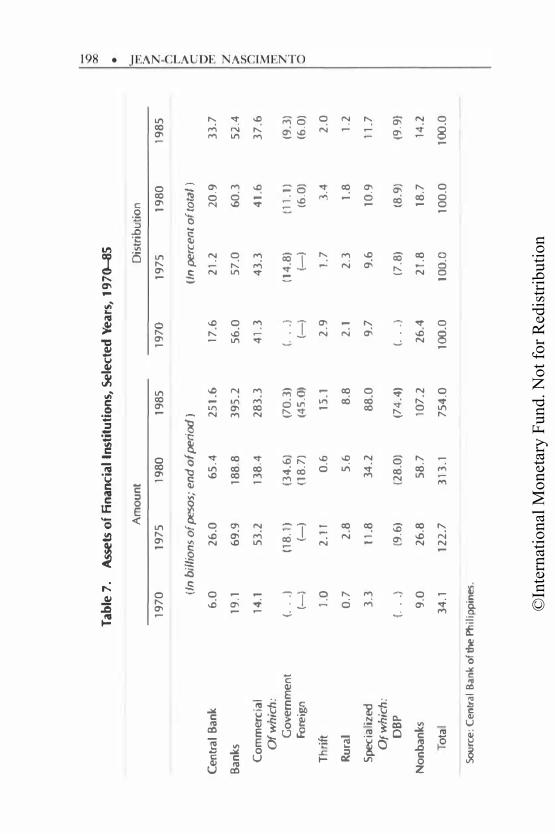
their dominant position among financial institutions (see Table 7), but tiers had developed in the banking sector. The first tier consisted of a few commercial banks and development banks whose size had increased sharply during the 1970s. The second tier consisted of a large and growing
©In
tern
atio
nal M
onet
ary
Fund
. Not
for R
edis
tribu
tion
"'
00
Tab
le 7
. As
sets o
f Fi
nan
cia
l In
stit
uti
ons,
Sele
cted
Ye
ars
, 19
70--85
•
Am
ou
nt
Dis
trib
uti
on
·-
rr:
>
19
70
1
97
5
19
80
1
98
5
19
70
1
97
5
19
80
1
98
5
z
n
r
(fn
bill
ions
of pesos;
en
d o
f peri
od )
(In
percent o
f tota
l )
>
c
Ce
ntr
al
Ba
nk
6
.0
26
.0
65
. 4
25
1.6
l7
.6
21
.2
20
.9
33
.7
v
rr:
Ba
nk
s
19
.1
69
.9
18
8.8
3
95
.2
56
.0
57
.0
60
.3
52
.4
z
>
Cl
l C
om
me
rcia
l 1
4.1
5
3.2
13
8.4
2
83
.3
41
.3
4
3.3
4
1.6
3
7.6
(")
3:
: Of
wh
ich
: rr:
Go
ve
rnm
en
t (.
..
) (1
8.1
) (3
4.6
) (7
0.3
) ( .
.. )
(1
4.8
) (1
1.1
) (9
.3)
�
Fore
ign
(-)
(-)
(18
.7)
(45
.0)
(-)
(-)
(6.0
) (6
.0)
2
Thr
ift
l.O
2
.11
0
.6
15
.1
2.9
L
7
3.4
2
.0
Ru
ral
0.7
2
.8
5.
6 8
.8
2.1
2
.3
1.8
1
.2
Specia
lizeO
3
.3
11.8
3
4.2
8
8.0
9
.7
9.6
1
0.9
1
1.7
Of
wh
ich
:
DB
P
( ..
. }
(9.6
) (2
8.0
) (7
4.4
) (.
..
) (7
.8)
(8.9
) (9
.9)
No
nb
an
ks
9.0
2
6.8
5
8.7
1
07
.2
26
.4
21
.8
18
.7
14
.2
Total
3
4.1
1
22
.7
313
.1
75
4.0
1
00.0
10
0.0
1
00
.0
100
.0
Soorce
: Cen
tral
Ban
k o
f lhe Ph
ilipp
ines
.
©International Monetary Fund. Not for Redistribution
Crisis in the Philippine Financial Sector • 199
number of rural and thrift banks, mostly small ones (see Table 8). A disproportionate number of institutions in this segment of the banking system were hit hard by the crisis, partly as a result of the weaknesses in entry regulations and the limited subsequent supervision. At the end of 1986, a total of 30 commercial banks in the Philippines (9 unibanks, 1 7 domestic commercial banks, and 4 foreign banks) accounted for 41 percent of the gross assets of the financial system (60 percent in 1980). In addition, there were 3 specialized government banks ( 1 6 percent),34 1 14 thrift banks (2. 7 percent), and 877 rural banks (I percent). Between 1981 and 1986, the relative position of banks was eroded somewhat by the growing role of the CBP in financing government budget deficits and in supporting troubled financial institutions because of the crisis itself. H
Second, government-owned banks played a central role within the banking system, and the concentration of risks in some of them was a critical factor in the crisis. J6 Their share of total bank assets, which averaged about 33 percent between 1970 and 1980, rose to 36 percent by the end of 1985. DBP alone accounted for 29 percent of total bank assets. Their troubles threatened the stability of the banking system and culminated in the major restructuring and rehabilitation of two of the largest state-owned institutions that became insolvent.
Third, significant parts of the banking system were characterized by a bank-holding-company structure. Twelve holding companies had interrelated ownership and interests in private banks and nonfinancial corporations. They controlled commercial or savings banks, investment houses, and insurance companies. Such was the case with the Herd is Group, l7
which, between 1979 and 1980, controlled Summa Savings and Mortgage Banks, the Summa Insurance Corporation, the Equipment Credit Corporation, and Interbank and Commercia] Bank of Manila. Js Furthermore,
,. The specialized government banks are DBP, LBP, and the Amanah Bank. ll As the crisis worsened after 1981, CBP granted massive indirect financial assistance to
public corporations through some government financial institutions. This aid allowed these financial institutions to finance their acquisition of troubled nonfinancial entities between 1982 and 1985. Furthermore, CBP accumulated huge losses on foreign exchange swap operations linked to successive and massive devaluations during the first half of the 1980s.
16 Government-owned banks included the DBP, LBP, PNB, the Amanah Bank, and the Philippines Veterans' Bank.
17 This group effectively went out of business after the 1981 crisis, and many of its companies and subsidiaries were bought out by the Government.
" Similar cases included the Ayala Group, which controlled 37.0 percent of the paid-up capital of the Bank of Philippine Islands (the second-largest commercial bank after PNB), the Bancom Group, the Cojuango Group (United Coconut Planters Bank, the SC\'enth-largest commercial bank in 1981); the Fim Philippine Holding Group (Philippine Commercial and International Bank, the fifth-largest bank in 1981).
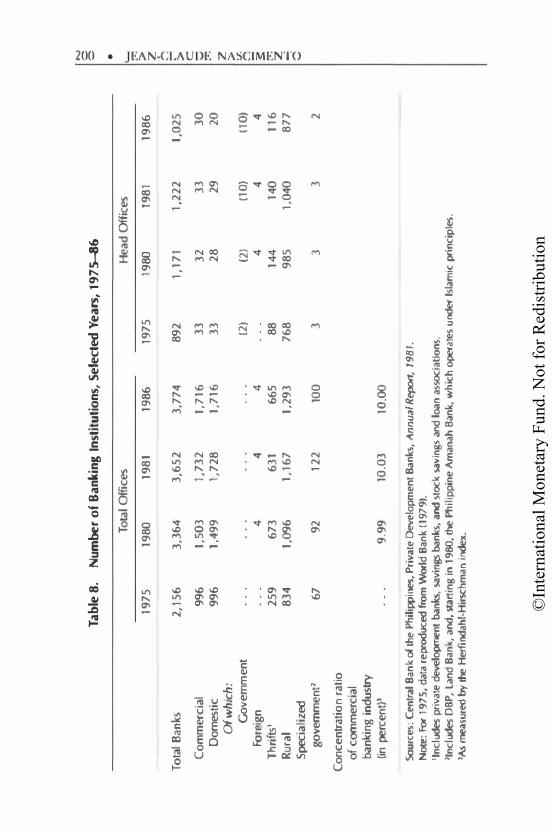
©In
tern
atio
nal M
onet
ary
Fund
. Not
for R
edis
tribu
tion
""'
Tab
le 8
. N
umbe
r o
f B
anki
ng
Inst
itu
tio
ns,
Sele
cted
Ye
ars, 1
97
5--8&
0
0
•
Tota
l O
ffices
H
ead
Offic
es
..._
�
1975
1
980
198
1 1
986
1
975
19
80
1981
1
98
6
>
z
n
Tota
l Ban
ks
2,1
56
3,
364
3
,65
2
3,77
4 89
2
1,1
71
1,2
22
1,
025
r
>
c
C
om
mer
cial
99
6 1,
503
1,
73
2
1,7
16
33
32
33
3
0
c:i
Dom
esti
c 9
96
1,
49
9
1,7
28
1,
71
6
33
28
2
9
20
�
z
Of w
hic
h:
>
Gov
ern
me
nt
(2)
(2)
(10
) (1
0)
V'l
('"':
Fore
ign
4
4
4
4
4
4 �
Th
rifts'
25
9 6
73
631
665
88
144
1
40
116
rr:
z
R
ural
8
34
1,09
6
1,1
67
1,2
93
76
8
985
1,0
40
87
7
..J
Speci
ali
zed
0
gove
rnm
ent
> 67
92
1
22
10
0
3 3
3 2
Co
nce
ntrat
ion
ratio
of
com
mer
cial
ba
nkin
g in
du
slly
(in pe
rcen
t)1
9.9
9
10.0
3 1
0.00
Sou
rces
: C
entral
Ban
k of
lhe
Phil
ippilles
, Pri
vate
Deve
lop
me
nt
Ba
nks
, A
nn
uaf
Report, 1
98
I.
Note
:� 1
97
5,
dat
a r
ep
roduc
ed fro
m Wor
ld B
an
k (
197
9).
'I
nc
ludes p
riva
te d
evel
opme
nt
ban
ks,
sav
ings
ban
ks, and
stoc
k sa
vin
gs
and
loan
assoc
iati
on
s.
11n
dudes
DBP
, La
nd
Ba
nk
, a
nd,
start
ing
in 1
980
, the
l'tti
lip
pin
e A
ma
nah
Ba
nk,
Wh
ich
opera
tes
under
Isl
am
ic pl"
inci
p'le
s.
1As mea
sured
by lh
e H
erfind
ahi-
Hirsc
hm
an inde
x.
©International Monetary Fund. Not for Redistribution
Crisis in the Philippine Financial Sector • 20 I
most groups had many interlocking directorships within the corporate business sector (see Doherty (1983)).
The number and size distribution of banks-the Herfindahl-Hirschman index showed a ratio of only 0.10 as of December 3 1 , 1986--suggest that the degree of concentration was not a problem.39 The previously noted fall in net interest margins between 1980 and 1983 following the deregulation of interest rates also suggests a competitive banking system. The rise in net interest margins between 1984 and 1986 was attributable to tighter monetary policies, high reserve requirements, and an increase in loan losses. Thus, oligopolistic pricing does not seem to have been a factor in interest rate developments. However, the bank-holding-company structure, together with the supervisory weaknesses discussed in the next section, permitted excessive risk raking following deregulation, and this risk taking seems to have helped cause and aggravate the crisis.
Prudential Regulation and Super vision and Related Institutional Practices
Supervisory weaknesses were conducive to loose banking practices, which later led to numerous bank failures. Also, the existence of a deposit insurance scheme did little to prevent or contain the crisis. In the following subsections, the supervisory system that regulates and oversees the conduct of banks' operations is described, and the role of this system in ensuring the soundness and stability of the financial sector is discussed.
Supervisory Authority
Although CBP exercises supervisory authority over the banking institutions, the ultimate supervisory authority is the Monetary Board (MB), the policy making body of CBP. 40
The Department of Bank Supervision and Examination is the operational arm of CBP for supervision. Supervisory procedures in the Philippines, which include reporting requirements and examination, are regular, comprehensive, and thorough. 41 Officers of the Department of Bank
19 The number of banking institutions, including branches, is shown in Table 8. 40 The MB is composed of the Governor acting as chief executive, the Minister of �inance,
the Director General of the National Economic Development Authority, the Chairman of the Board of Investments, the Minister of the Budget, and two part-time members of the prh•ate sector.
41 For instance, the reporting system covers e1·ery item of banks' balance sheets, and information such as credit to directors, officers, and shareholders and their related interest (DOSRI credit) is el'en reported daily. On-site examinations and inspections, patterned after the U.S. system, focus on the quality of banks' assets, which are classified accordingly. A rating system, CAMEL (Capital Asset, Management, Earning, and Liquidity), is used to assess quantitatively a bank's soundness, along with a questionnaire for a qualitative assessment.
©International Monetary Fund. Not for Redistribution
202 • JEA -CLAUDE NASCIM£ TO
Supervision and Examination are responsible for bank examination to assess the soundness of operations and the solvency and liquidity of the bank. Reports of these bank examinations are then transmitted to the M B, which decides what action to take when a bank is found to be in trouble.
When a bank faces protracted liquidity or solvency problems, the MB may appoint a conservator to take charge of the assets, liabilities, and management of the bank in order to protect depositors and other creditors. If the conservator is unable to restore the viability of the bank, the bank is declared insolvent. 42 The MB then appoints a receiver to take charge of all assets and liabiJities of the bank, and forbids the bank from doing business. Within 60 days, the MB decides whether to liquidate the bank or to reorganize it to permit the resumption of business. In the former case, CBP appoints a liquidator to carry out the decision, provided no court challenges the decision.
The ultimate enforcement resides with the MB, and the closing of a troubled bank is subject to due process, which may take a long time, especially when litigation is brought by owners.
Supervisory Rules
Between 1972 and 1982, CBP also modified the main prudential regulations on commercial banks. Capital requirements, defined as a ratio of net worth to risk assets, were lowered from 1 5 percent in 1972 to 10 percent in 1973 (see Table 6). After 1980, ratios as low as 6 percent became permissible with the prior approval of the MB. The authorities sought to provide banks with greater leverage to expand their asset portfolios.
CBP relaxed its rules regarding credit accommodation to directors, officers, stockholders, and related interests (DOSRI). In 1973, DOSRI credit had an upper limit equal to a bank's total capital account, net of valuation reserves. •J By 1980, this limit had become less restrictive for commercial banks, because the authorities had somewhat relaxed the provisions designed to limit conflicts of interest between a bank and another financial or nonfinancial institution that were linked by interlocking directorate. 44 In addition, regulations governing relations between a bank and its subsidiaries were eliminated.
To restrict banks' risk exposure, the authorities established a single-
•• Insolvency is defined in the law as the inability of a bank to pay its liabilides as they fall due in the usual and ordinary course of business. One important limitation of this definition is that it does nor apply to insolvency stemming from extraordinary deposit withdrawals caused by a financial panic.
•• See CB Circular No. 357 dated january 22, 1973. " See CB Circular No. 596 dated March I, 1978, whereby the Central Bank amended CB
Circular No. 357 to exclude from the maximum credit accommodation to DOSRI, among
©International Monetary Fund. Not for Redistribution
Crisis in the Philippine Financial Sector • 203
borrower limit of 1 5 percent (including loans and equity investment) of the bank's net worth; the rule had been in force during the 1970s and is still valid, although exceptions have been made. For example, in 1983, the Government's takeover of the Construction and Development Corporation of the Philippines (CDCP) through the PNB violated this limit. After the takeover, PNB's total exposure (in equity alone) in CDCP went to 60 percent of its net worth.
In contrast to the trend toward relaxation of prudential regulations, CBP expanded the institutional coverage of bank supervision after 1972 in order to include the nonbank quasi-banks (NBQB). CBP also monitored the nonbank quasi-banks' issues of commercial paper "with recourse" and regulated its terms, conditions of roUover, physical delivery, and the like.
Loose Lending Practices
As a result of the political climate both before and during the crisis, CBP failed to enforce supervisory rules regarding DO SRI credit, supervision of nonbank quasi-bank activities, and, most important, the treatment of past due loans and their provisioning.
DOSRI Credit. Failure by the MB to enforce the rules reportedly led to substantial bank lending to DOSRJ, to the detriment of other legitimate borrowers.•s Inappropriate loans to DOSRI are cited as a major contributor to bank failures over the past decade. In reaction to the 1981 crisis, CBP tightened the regulations on DOSRI credit. 46 Bank credit to firms with interlocking directorship/officership was tightened again (reversing the earlier stance), but the restrictions regarding institutional relationships between holding companies and subsidiaries were loosened.
Supervision of Money Market Operations. 47 Prior to 1980, regulations governing the functioning of the money market were differentiated by type of participant and type of operation, each type falling under the purview of a different supervisory authority. CBP supervised only banks and nonbank quasi-banks and monitored only transactions on a "with
others, "the credit accommodations to a corporation in whose board of direcmrs, a director or officer or stockholder of the lending bank seats as a representative of the bank. However, the bank representative's equity interest in the borrower corporation shall only be the minimum shares required by law, rules and regulations, or the by-laws of the corporations to qualify a person as director to the corporation." (Sycip and others (1978), p. 15.)
41 Central Bank of the Philippines (1980).
46 The CBP adopted new ceilings on unsecured DOSRI credit of 30 percent of total credit accommodations for ea.ch DOSRl. Total DOSRI credit was subsequently limited to 15
percent of a bank's loan portfolio or its entire capital account, whichever was lower. Also, new accounting and reporting standards for DOSRl loans have been adopted.
41 The money market in the Philippines is characterized by a variety of participants, including all financial institutions; the Treasury and nonfinancial corporations; and a wide
©International Monetary Fund. Not for Redistribution
ASCI MENTO
recourse" basis. The Securities and Exchange Commission supervised other participants, while monitoring transactions on a "without recourse" basis. Subsequently, CBP imposed regulations on nonbank quasi-banks. These regulations included the requirement that nonbank quasi-banks hold 20 percent of their liabilities-deposit substitutes-in the form of deposits with the CBP; a ceiling on interest rates of these institutions (the maximum rate paid for borrowing was 17 percent; the rate charged for lending was 18 percent); and a minimum trading lot. Because nonbank financial institutions were not subject to such regulations by the Securities and Exchange Commission, nonbank quasi-banks lost their competitiveness. In response, nonbank quasi-banks started to deal in paper on a "without recourse" basis; this paper was issued mostly by subsidiaries or affiliates of "groups" to which the nonbank quasi-banks belonged. This practice allowed nonbank quasi-banks not only to circumvent CBP regulations and monitoring of their money market activities, but also to help businesses of their "group" to mobilize short-term funds by issuing lessthan-prime commercial paper. These unsound lending practices contributed to the collapse of the commercial paper market in 1981.48
Accounting Rules. The 1980 reforms did not cover CBP rules governing the treatment of overdue loans, the provisioning for bad debt, and scrutiny of deposit transactions by CBP examiners. The inadequacies of these rules, which remained unchanged until 1986, played a significant role in the worsening of the financial crisis.
CBP used the following rules for its own assessment of bank conditions: demand loans were considered past due if payment was not received within six months of a written demand. For loans payable in installments, the determining factor was the number of payments in arrears, a number that varied with the repayment schedule of the loan (monthly, quarterly, semiannuaJiy, or annually). The threshold for monthly installment loans was ten missed installments. For other loans, the period varied between one and two years. Whenever 20 percent of the outstanding balance of a
range of instruments such as promissory notes issued by banks and nonbank quasi-banks, government securities, central bank bills, certificates of participation/assignments, and commercial paper issued by corporations. Commercial paper can be issued "with or without recourse." Deposit substitutes issued by nonbank quasi-banks arc also referred to as commercial paper issued by these institutions. See Lontoc (1981), p.S.
41 In reaction, the authorities modified the regulations governing money market operations. Among other things. the new regulations limited the issuance of commercial paper to prime companies; required that issuers have at their disposal a bank credit line covering 35 percent of their money market issues; and required that all commercial papers be registered with the Securities and Exchange Commission and be printed serially on security paper, by the Central Bank Printing Plant.
©International Monetary Fund. Not for Redistribution
Crisis in the Philippine Financial Sector • 205
loan was in arrears, the entire loan was to be considered overdue; once a loan was classified as overdue, interest could no longer be accrued. In practice, however, banks differed considerably in their treatment of overdue loans. Conservatively managed banks generally placed loans on a nonaccrual status more promptly than did the schedule used by CBP, in order to avoid the tax on gross revenues; other banks followed loose practices, especially as they began facing financial distress.
Regarding provisions for bad debt, CBP is empowered by law to establish rules, either generally or in individual cases. CBP has not enforced the rules, however, leaving reserve or provisioning policies to bank managements. 49 In the supervisory process, the CBP does compare the reserves established by a bank with those it believes are required on the basis of its own assessment of asset quality. Under the law, banks are allowed to write off bad loans up to :P 100,000, but they must have CBP approval before writing off loans above that amount. Requests for writeoff approval concerning DOSRI loans are passed on to the MB; other requests are handled by CBP staff.
Examiners are not allowed to investigate deposit transactions that are protected by strict secrecy rules, unless they are duly authorized by the MB. The MB may permit scrutiny of deposit transactions only if it is satisfied that a bank fraud or serious irregularity has been committed and that it is necessary to look at deposit transactions to determine the facts.
Negligible Role of Philippines Deposit Insurance Company (PDIC). Because of its severe staffing constraints and low capital base, PDIC played no significant role in improving depositors' confidence in the banking system during the crisis period of the 1980s.50 Despite the capital increase from :P 20 million to :P 2 billion in 1985, PDIC's resources, human and financial, were insufficient. 51 As a result, PDIC faced major difficulties in settling the growing claims of insured depositors of failed banks (see Table 9). 52 Thus, CBP was compelled to tie up most of its supervisory staff in helping PDIC settle these claims.
Summary
The absence of significant reforms in prudential supervision aggravated the banking crisis. First, the existing rules were not enforced in practice,
49 The policy was formalized in 1987, when the MB passed a resolution requiring all banks to set up a system for reviewing loans and other assets for the purpose of establishing appropriate and adequate reserves.
10 Deposit insurance limit was ,P 10,000.
11 Annual premium contribution by financial institutions amounted to ,P 100 million. 11 However, in the case of the largest failed bank, PDIC quickly settled the claims of
insured deposits.
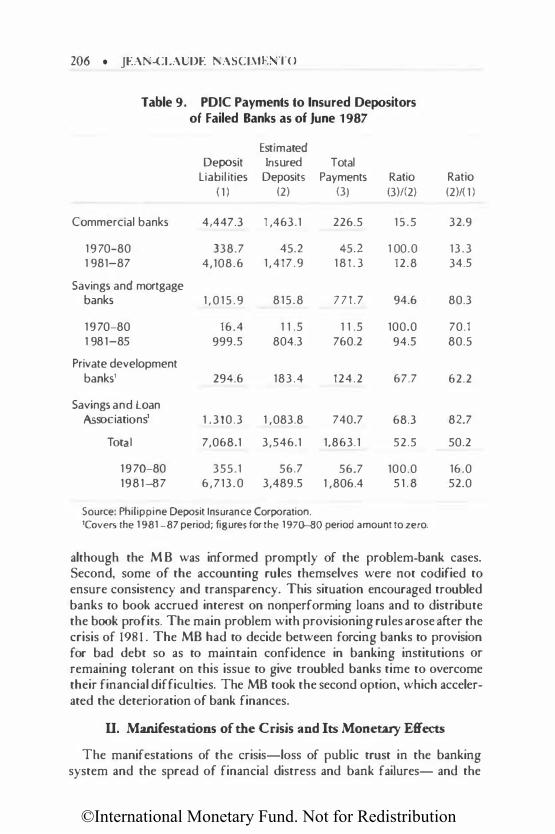
©International Monetary Fund. Not for Redistribution
206 • JEAN-CLAUDE NASCIME TO
Table 9. PDIC Payments to Insured Depositors of Failed Banks as of june 1987
Estimated Deposit Insured Total
Liabilities Deposits Payments Ratio Ratio ( 1 ) (2) (3) (3)1(2) (2)/( 1 )
Commercial banks 4,447.3 1 ,463.1 226.5 15.5 32.9
1970-80 338.7 45.2 45.2 1 00.0 13.3 1 981-87 4,108.6 1,417.9 1 8 1 . 3 12.8 34.5
Savings and mortgage banks 1 ,015.9 815.8 771.7 94.6 80.3
1970-80 16.4 1 1 .5 1 1 .5 100.0 70.1 1 981-85 999.5 804.3 760.2 94.5 80.5
Private development banks' 294.6 183.4 124.2 67.7 62.2
Savings and Loan Associations' 1 , 310.3 1 ,083.8 740.7 68.3 82.7
Total 7,068.1 3,546.1 1,863.1 52.5 50.2
1970-80 355.1 56.7 56.7 100.0 16.0 1981-87 6,713.0 3,489.5 1 ,806.4 5 1 . 8 52.0
Source: Philippine Deposit Insurance Corporation. 'Covers the 1981-87 period; figures for the 197�0 period amount to zero.
although the M B was informed promptly of the problem-bank cases. Second, some of the accounting rules themselves were not codified to ensure consistency and transparency. This situation encouraged troubled banks to book accrued interest on nonperforming loans and to distribute the book profits. The main problem with provisioning rules arose after the crisis of 198 1 . The MB had to decide between forcing banks to provision for bad debt so as to maintain confidence in banking institutions or remaining tolerant on this issue to give troubled banks time to overcome their financial difficulties. The MB took the second option, which accelerated the deterioration of bank finances.
ll. Manifestations of the Crisis and Its Monetary Effects
The manifestations of the crisis-loss of public trust in the banking system and the spread of financial distress and bank failures- and the
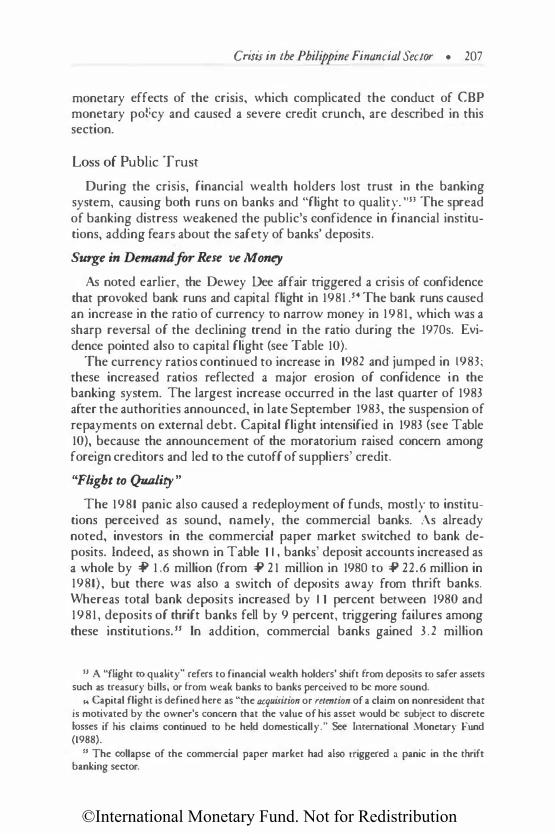
©International Monetary Fund. Not for Redistribution
Crisis in the Philippine Financial Sector • 207
monetary effects of the crisis, which complicated the conduct of CBP monetary pol;cy and caused a severe credit crunch, are described in this section.
Loss of Public Trust
During the crisis, financial wealth holders lost trust in the banking system, causing both runs on banks and "flight to quality. "53 The spread of banking distress weakened the public's confidence in financial institutions, adding fears about the safety of banks' deposits.
Surge in Demand for Reserve Money
As noted earlier, the Dewey Dee affair triggered a crisis of confidence that provoked bank runs and capital flight in 1981 .54 The bank runs caused an increase in the ratio of currency to narrow money in 1981, which was a sharp reversal of the declining trend in the ratio during the 1970s. Evidence pointed also to capital flight (see Table 10).
The currency ratios continued to increase in 1982 and jumped in 1983; these increased ratios reflected a major erosion of confidence in the banking system. The largest increase occurred in the last quarter of 1983 after the authorities announced, in late September 1983, the suspension of repayments on external debt. Capital flight intensified in 1983 (see Table 10), because the announcement of the moratorium raised concern among foreign creditors and led to the cutoff of suppliers' credit.
"Flight to Qumity"
The 1981 panic also caused a redeployment of funds, mostly to institutions perceived as sound, namely, the commercial banks. As already noted, investors in the commercial paper market switched to bank deposits. Indeed, as shown in Table I I , banks' deposit accounts increased as a whole by ::P 1 .6 million (from ::P 2 1 million in 1980 to ::P 22.6 million in 1981), but there was also a switch of deposits away from thrift banks. Whereas total bank deposits increased by I I percent between 1980 and 1981, deposits of thrift banks fell by 9 percent, triggering failures among these institutions. ss In addition, commercial banks gained 3.2 million
u A "flight to quality" refers to financial wealth holders' shift from deposits tO safer assets such as treasury bills, or from weak banks to banks perceived to be more sound.
14 Capital flight is defined here as "the acquisiticn or rtltnticn of a claim on nonresident that is motivated by the owner's concern that the value of his asset would be subject to discrete losses if his claims continued to be held domestically." See International Monetary Fund (1988).
" The collapse of the commercial paper market had also triggered a panic in the thrift banking sector.
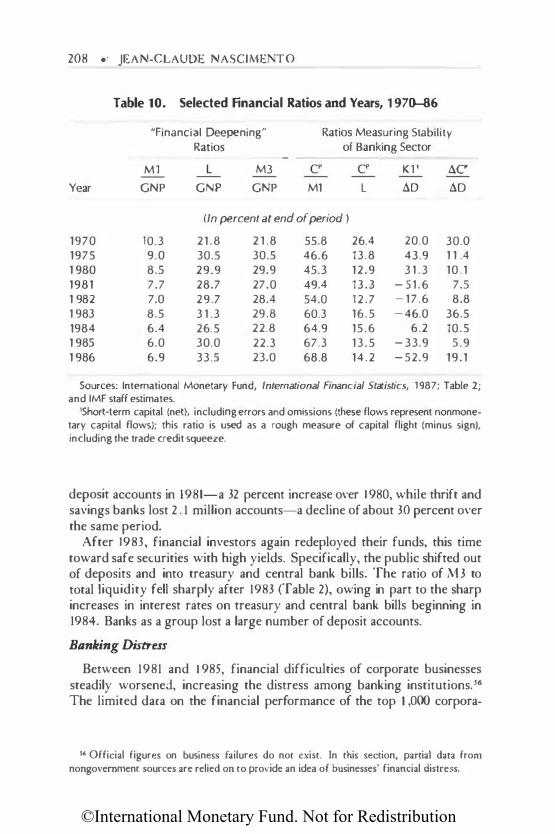
©International Monetary Fund. Not for Redistribution
208 •· JEAN-CLAUDE NASCIME TO
Table 10. Selected Financial Ratios and Years, 1 970-86
"Financial Deepening" Ratios Measuring Stability
Ratios of Banking Sector
Ml L M3 C" C' K l ' 6.(' --Year GNP GNP GNP M1 L 6.0 6.0
{In percent at end of period )
1970 10.3 21.8 2 1 .8 55.8 26.4 20.0 30.0 1975 9.0 30.5 30.5 46.6 13.8 43.9 1 1 .4 1 980 8.5 29.9 29.9 45.3 12.9 3 1 .3 10.1 1981 7.7 28.7 27.0 49.4 13.3 -51 .6 7.5 1 982 7.0 29.7 28.4 54.0 12.7 -17.6 8.8 1 983 8.5 3 1 .3 29.8 60.3 16.5 -46.0 36.5 1984 6.4 26.5 22.8 64.9 15.6 6.2 10.5 1 985 6.0 30.0 22.3 67.3 13.5 -33.9 5.9 1 986 6.9 33.5 23.0 68.8 14.2 -52.9 19.1
Sources: International Monetary Fund, International Financial Statistics, 1987; Table 2; and IMF staff estimates.
'Short-term capital (net), including errors and omissions (these flows represent nonmonetary capital flows); this ratio is used as a rough measure of capital flight (minus sign), including the trade credit squeeze.
deposit accounts in 1981-a 32 percent increase over I 980, while thrift and savings banks lost 2 . 1 million accounts-a decline of about 30 percent over the same period.
After I983, financial investors again redeployed their funds, thjs time toward safe securities with high yields. Specifically, the public shifted out of deposits and into treasury and central bank bills. The ratio of M3 to total liquidity fell sharply after I983 (Table 2), owing in part to the sharp increases in interest rates on treasury and central bank bills beginning in 1984. Banks as a group lost a large number of deposit accounts.
Banking Distress
Between 1981 and I 985, financial difficulties of corporate businesses steadily worsened, increasing the distress among banking institutions. 56 The limited daca on the financial performance of the top I ,000 corpora-
" Official figures on business failures do not exist. In this section, partial data from nongovernment sources are relied on to provide an idea of businesses' financial distress.
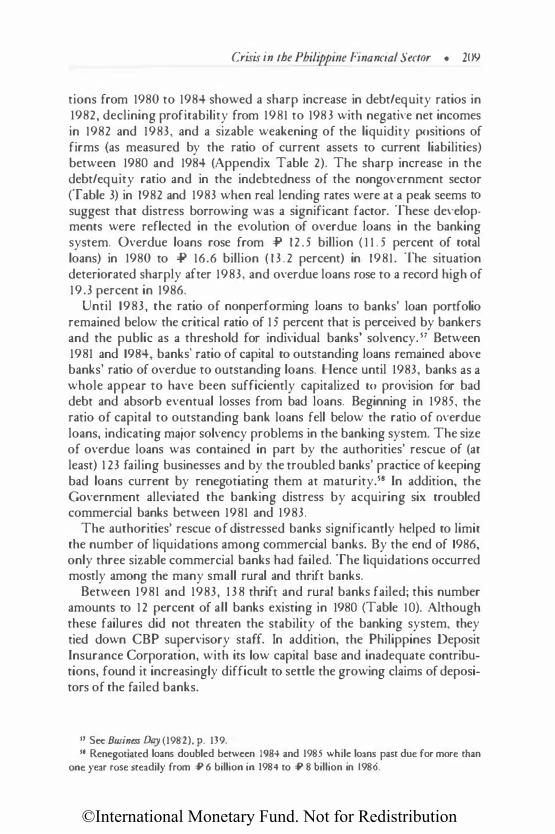
©International Monetary Fund. Not for Redistribution
Crisis in the Philippine Financial Sector • 209
tions from 1980 to 1984 showed a sharp increase in debt/equity ratios in 1982, declining profitability from 1981 to 198 3 with negati\'e net incomes in 1982 and 1983, and a sizable weakening of the liquidity positions of firms (as measured by the ratio of current assets to current liabilities) between 1980 and 1984 (Appendix Table 2). The sharp increase in the debt/equity ratio and in the indebtedness of the nongovernment sector (Table 3) in 1982 and 1983 when real lending rates were at a peak seems to suggest that distress borrowing was a significant factor. These de\'elopments were reflected in the evolution of overdue loans in the banking system. Overdue loans rose from :P 12.5 billion ( 1 1 . 5 percent of total loans) in 1980 to =P 16.6 billion ( 1 3 .2 percent) in 1981. The situation deteriorated sharply after 1983, and overdue loans rose to a record high of 19.3 percent in 1986.
Until 1983, the ratio of nonperforming loans to banks' loan portfolio remained below the critical ratio of 15 percent that is perceived by bankers and the public as a threshold for individual banks' solvency. s7 Between 1981 and 1984, banks' ratio of capital to outstanding loans remained above banks' ratio of overdue to outstanding loans. Hence until 1983, banks as a whole appear to have been sufficiently capitalized to provision for bad debt and absorb eventual losses from bad loans. Beginning in 1985, the ratio of capital to outstanding bank loans fell below the ratio of O\'erdue loans, indicating major solvency problems in the banking system. The size of overdue loans was contained in part by the authorities' rescue of (at least) 1 2 3 failing businesses and by the troubled banks' practice of keeping bad loans current by renegotiating them at maturity.ss In addition, the Government alleviated the banking distress by acquiring six troubled commercial banks between 1981 and 1983.
The authorities' rescue of distressed banks significantly helped to limit the number of liquidations among commercial banks. By the end of 1986, only three sizable commercial banks had failed. The liquidations occurred mostly among the many small rural and thrift banks.
Between 1981 and 1983, 1 3 8 thrift and rural banks failed; this number amounts to 12 percent of all banks existing in 1980 (Table I 0). Although these failures did not threaten the stability of the banking system, they tied down CBP supervisory staff. In addition, the Philippines Deposit Insurance Corporation, with its low capital base and inadequate contributions, found it increasingly difficult to settle the growing claims of depositors of the failed banks.
'7 See Businas Day (1982), p. 139. 11 Renegotiated loans doubled between 1984 and 1985 while loans past due for more than
one year rose steadily from ,P 6 billion in 1984 to ,P 8 billion in 1986.
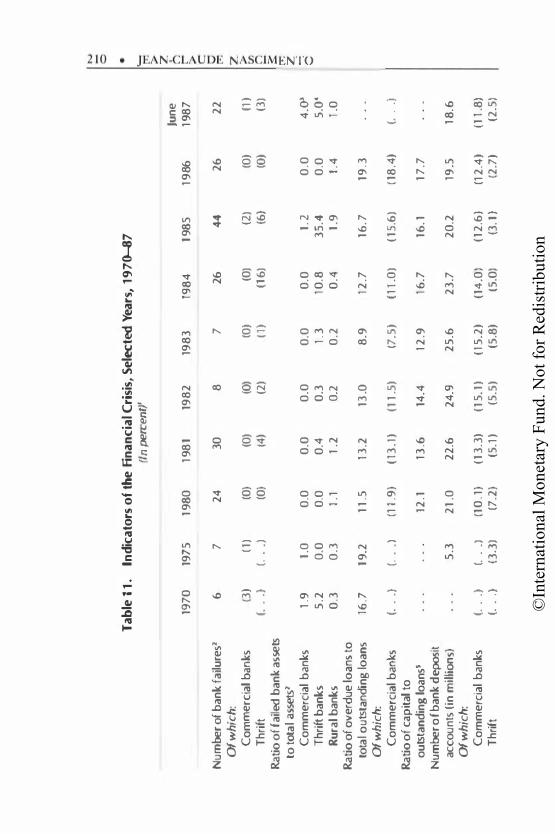
©In
tern
atio
nal M
onet
ary
Fund
. Not
for R
edis
tribu
tion
tv
'0
Tab
le 1
1.
Ind
icat
ors
of
the
Fin
an
cia
l Cri
sis,
Sel
ected
Yea
rs,
197
0-87
•
(In
percent)'
'- £"
": :>
Jun
e
z
h
197
0
197
5
196
0
198
1 19
82
19
83
19
84
19
65
19
86
19
87
r
:>
c
Nu
mbe
r of b
ank
fai
lure
s>
6
7
24
30
8
7
2
6
44
26
2
2
v
C"':
Of w
hich
: z
C
om
merc
ial
ban
ks
(3)
(1)
(0)
(0)
(0)
(0)
(0)
(2)
(0)
(1)
>
u:
Th
rift
( .
..
) ( .
..
) (0
) (4
) (2
) (1
) (1
6)
(6)
(0)
(3)
Q
Ratio
of
failed
ban
k as
sets
::
::: tTl
to
tota
l assets2
z
Co
mm
erc
ial
ba
nks
1.9
1.
0
0.0
0
.0
0.0
0
.0
0.0
1.
2
0.0
4
.<Y
..J
0
Th
rift
ban
ks
5.2
0
.0
0.0
0
.4
0.3
1
.3
10.8
3
5.4
0
.0
5.0
'
Ru
ral b
ank
s 0
.3
0.3
1
.1
1.2
0
.2
0.2
0
.4
1.9
1
.4
1.0
Ra
tio o
f o
ve
rdue
loa
ns to
to
tal o
utsta
ndin
g lo
ans
16.7
19
.2
11
.5
13
.2
13.0
8
.9
12.7
16
.7
19.3
Of
whi
ch:
Co
mm
erc
ial b
an
ks
( ..
. )
( ..
. )
(11
.9)
(13
.1)
(11
.5)
l7.5
) (1
1.0
) (1
5.6
) (1
8.4
) ( .
..
) Ra
tio o
f ca
pit
al t
o
ou
tsta
nd
ing
loan
s•
12.1
13
.6
14.4
12
.9
16.7
16
.1
17
.7
Nu
mbe
r of b
ank
depos
it
acc
ou
nts
(in
mill
ions)
5
.3
21
.0
22
.6
24
.9
25
.6
23
.7
20
.2
19.5
1
8.6
Of
whi
ch:
Co
mm
erc
ial
ba
nks
(. .
. )
(. .
. )
(1 0
.1)
(13
.3)
(15
. 1)
(15
.2)
(14
.0)
(12
.6)
(1 2
.4)
{11
.8)
Th
rift
( ..
. )
(3.3
) (7
.2)
(5.1
) (5
.5)
(5.8
) (5
.0)
(3. 1
)
(2.7
) (2
.5)
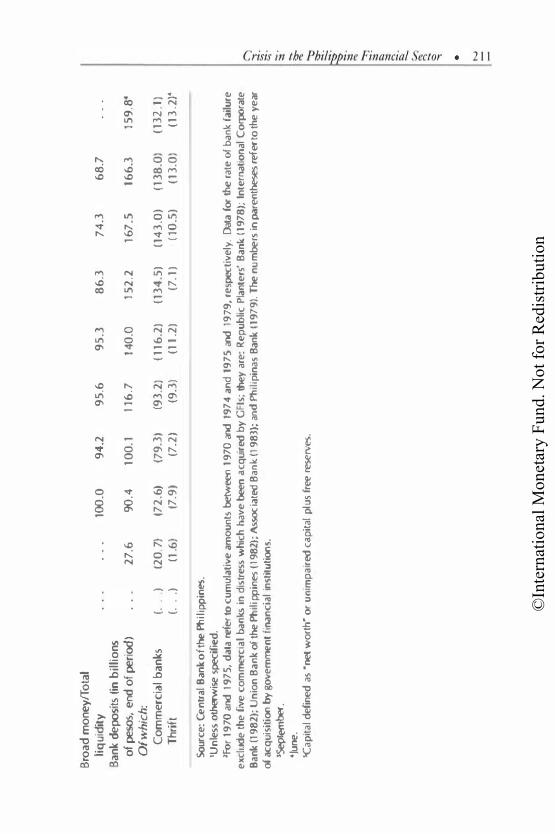
©In
tern
atio
nal M
onet
ary
Fund
. Not
for R
edis
tribu
tion
Bro
ad
mo
ney
/To
tal
liq
uid
ity
B
ank
de
posi
ts (
in b
illi
on
s o
f pe
sos,
end
of
peri
od}
Of w
hich
: C
om
me
rcia
l b
an
ks
( ..
. )
Th
rift
( .
.. )
Sour
ce
: C
en
iJa
l B
an
k o
f the I'l
l iIi pp
ines
.
'Un
less
otherwise
spec
ifie
d.
100.0
9
4.2
27
.6
90.4
10
0.1
(20
.7)
(72
.6)
(79
.3)
(1.6
) (7
.9)
(7.2
)
95
.6
95
.3
86
.3
74
.3
68
.7
116
.7
140
.0
15
2.2
1
67
.5
166
.3
159
.8•
(93
.2)
(116
.2)
{13
4.5
) (1
43
.0)
{13
8.0
) (1
32
.1)
(9.3
) (1
1.2
) (7
.1)
(1 0
.5)
(13
.0)
(13
.2}.
>for
1970
aoo
19
75
, d
ata
refer
to c
um
ula
tiv
e a
mo
un
ts betwe
en 19
70
aoo
19
74
an
d 1
97
5 a
oo
197
9,
respec
tiv
ely
. D
ata
for
lhe r
ate
of
ban
k fa
ilure
e
xcli.
Jde
th
e f
ive
co
mmer
rial
banks
in d
istr
ess
wh
ich
hav
e be
en a
cq
uir
ed b
y G
Fis;
they
are
: R
ep
ub
lic P
lant
ers
' B
an
k (
197
8};
In
terna
tion
al C
orpo
rate
B
ank
(19
81
); U
nio
n B
an
k o
f the Pl
lilip
pin
es (
198
1);
Associa
ted B
ank
(19
83)
; an
d Ph
ilip
inas
Ba
nk
(19
79
). The
nu
mbe
rs in
paren
theses ref
er to
tfle
ye
ar
of ac
qu
isit
ion by
go
ve
mme
nt
fina
nc
ial
inst
itu
tion
s.
'September
. •J
une.
'Cap
ital
de
fine
d a
s "net
wo
rth"
or
un
imp
air
ed c
ap
ital
plu
s fr
ee rese
l"\\eS.
--
:::
•

©International Monetary Fund. Not for Redistribution
2 1 2 • JEAN-CLAUDE NASCIMENTO
Monetary Management During the Crisis
Actions on Supply of Banks' Reserves
Between 1981 and 1986, CBP had increasing difficulty in achieving its often conflicting objectives of monetary stability, confidence in the banking system, and credit allocation to priority sectors, as both the financial crisis and the recession deepened.
Between 1981 and 1983, CBP gave priority to containing the spread of financial distress and stepping up selective credit policies. As a lender of last resort, CBP intervened appropriately by providing emergency credit during 1981 and by absorbing excess liquidity as the crisis abated in 1982 (see Table 12). Meanwhile, CBP increased concessional rediscount credit to financial institutions. In the aftermath of the banking panics of 1983 CBP also replenjshed the banks' loss of deposits and began to realize exchange losses on swap operations; as a result of these developments, reserve money jumped 48 percent between the end of 1982 and the end of 1983.
Between 1984 and 1986, to offset the expansionary effects on reserve money of the earlier policies and to restore monetary stability, the CBP absorbed huge amounts of liquidity from financial institutions through massive sales of its own securities and tighter access to rediscount facilities. 59 However, the effect of these actions was mitigated by the huge financing of the public sector deficit in 1984, following the drastic cutback in foreign financing of these deficits. 60 This policy stance caused inflation to jump from 12 percent in 1983 to 50 percent in 1984, and led to a crowding out of the private sector. Between 1985 and 1986, CBP finally brought inflation under control by maintaining a tight policy.
CBP continued to provide extensive emergency assistance between 1984 and 1985, reacting essentially to financial distress rather than to panics as in earlier years. To prevent failures of financially distressed firms, CBP, through the decisions of the MB, adopted a remedial rather than punitive approach. This approach, however, led to a trade-off between short-run stability and long-run cost effectiveness of rescue operations.
The long negotiations over corrective actions to rehabilitate troubled institutions may have prolonged the public's perception of uncertainty and raised the ultimate cost of rescue operations. Also, CBP's attempt to seek additional capital and merger partners for troubled banks proved difficult
s• After 1983, CBP closed a number of special rediscount facilities and set the discount rate on the remaining ones at market-related levels.
60 Despite the reduction in the public sector deficit (in percent of GNP) after 1983, CBP stepped up its financing to this sector in order to offset the sharp decline in foreign financing of the public sector budgetary deficit.
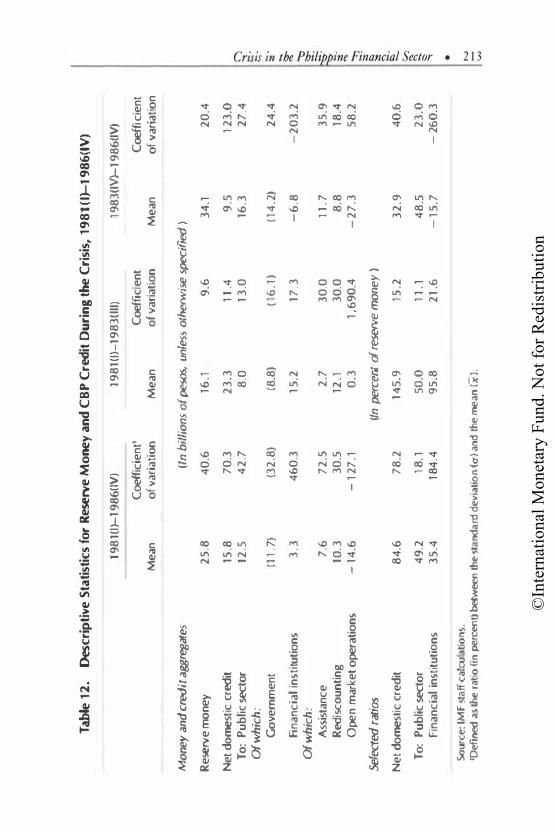
©In
tern
atio
nal M
onet
ary
Fund
. Not
for R
edis
tribu
tion
Table
12.
Descr
ipti
ve S
tati
stic
s fo
r R
eserv
e M
one
y an
d C
BP
Cred
it O
uri
ng
the C
risi
s, 1
98
1 (I
)-1
98
6(1
V)
198
1nH
98
6!1
VJ
198
1 (I )
-19
83
(111
) 19
83
(1�
19
86
(1V
)
Coef
ficie
nt'
Coe
ffic
ien
t C
oeff
icie
nt
Me
an
of v
ari
ati
on
Me
an
o
f var
iati
on
M
ean
o
f v
aria
tio
n
Mo
ne
y a
nd
credit
aggrega
tes
(In
bil
lio
ns
of
pesos,
unl
ess
otherwise
specif
red )
Re
serv
e m
one
y 2
5.8
4
0.6
16
.1
9.6
3
4.1
2
0.4
Ne
t d
ome
stic
cred
it
15.8
7
0.3
2
3.3
1
1.4
9
.5
12
3.0
T
o:
Pu
blic
secto
r 12
.5
42
.7
8.0
1
3.0
16
.3
27
.4
Of wh
ich:
G
ove
rnm
ent
(1
1.7
) (3
2.8
) (8
.8)
(1 6
.1)
(14
.2)
24
.4
Fin
anc
ial
inst
ituti
on
s 3
. 3
46
0.3
1
5.2
1
7.3
-
6.8
-
20
3.2
Of
whi
ch:
Ass
ista
nce
7
.6
72
.5
2.7
3
0.0
1
1.7
3
5.9
R
edisc
ou
nti
ng
10
.3
30
.5
12.1
3
0.0
8
.8
18.4
O
pen
mar
ket o
pera
tio
ns
-14
.6
-1
27
.1
0.3
1
,69
0.4
-
27
.3
58
.2
Select
ed ra
tio5
(In pe
rceni
of
reserve mon
ey
}
Ne
t d
ome
stic
cre
dit
8
4.6
7
8.2
14
5.9
15
.2
32
.9
40
.6
To
: P
ub
lic sec
tor
49
.2
18.1
50
.0
11
.1
48
.5
23
.0
Fin
an
cia
l in
stitu
tio
ns
35
.4
184
.4
95
.8
21
.6
-1
5.7
-
260
.3
Sourc
e:
IMF
sta
ff c
alcu
lati
on
s.
'Defined
as the
ra
tio
(in
percenO
between
the
sla
llda
rd d
ev
iati
on
(u) a
lld
th
e me
an
(x )
.
Q
::;·
l:;·
�-
- �
�
�
--
--
;:
"' �
§ .... �
�
�
c
....,
•
......
.......
©International Monetary Fund. Not for Redistribution
ASCI MENTO
between 1983 and 1986, when all domestic banks faced financial difficulties. As the .'viB was deliberating the appropriate disposition of problem institutions, CBP continued to extend emergency loans, m·erdrafts, and equity lending to prevent a collapse of the banking system. This policy, combined with the Government's massive issuance of treasury bills to finance its budget deficit, had expansionary effects on total liquidity after 1983 despite the decline in the money multiplier (see Charts 4 and 5).
Complications from Portfolio Shifts
Empirical results showed that the estimated demand for real M3 shifted downward in 1983(III) because investors shifted from deposit substitutes into treasury and central bank bills; as a result, M 3 became an unreliable indicator of monetary policy.6' CBP's overestimation of actual M3 contributed to the loose monetary policy and skyrocketing inflation observed until late 1984.
CBP then re,·ersed its stance to bring inflation under control and began targeting reserve money. CBP tightened the supply of bank reserves through massive sales of central bank bills, but the surge in the demand for reserve money (partly reflecting the currency flight) probably led to excessive tightening and thereby caused the steep increases in nominal interest rates from late 1985 to the middle of 1986. Large increases in domestic government borrowing added upward pressure on nominal interest rates, and contributed to crowding out the private sector. Such increases, which occurred despite the tightening of fiscal policy, stemmed from the drying up of foreign financing after the announcement of the moratorium.
Credit Crunch
After 1981, declining economic growth compounded the negati\'e effect of rising interest rates on the demand for real credit, particularly in the private sector. The increase in overdue loans, many of which were renegotiated between 1984 and 1986, mitigated the sharp decline in this demand. Indeed, with private investment (in percent of GNP) plummeting in 1981 and debts being liquidated, demand for new investment loans by the private sector nearly came to a halt.
Nonetheless, banks apparently curtailed the supply of real credit to the private sector by more than the drop in demand, thereby resorting to
61 When the economic and financial environment became very uncertain in late 1983,
invesrors moved interest-bearing securities issued by banks to their customers into safer assets (sec Section I of this chapter). A rt:eent study (Goldsborough and Zaidi ( 1989)) also provides evidence of instability in the demand for ;\II I, an instability consistent with the currency night taking place during the 1983(1V)-1986(1V) period of the crisis.
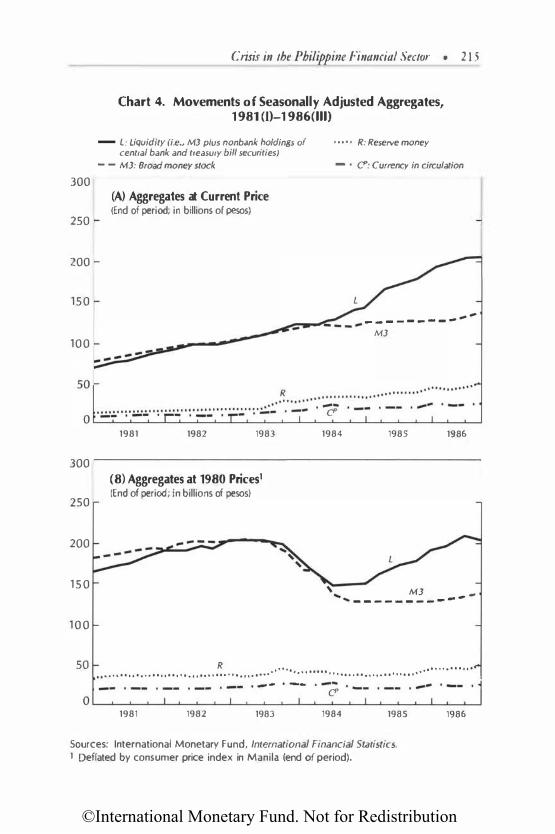
©International Monetary Fund. Not for Redistribution
300
250
200
150
100
300
250
200
1 5 0
1 0 0
Crisis in the Philippine Financial Sector • 2 1 5
Chart 4. Movements o f Seasonally Adjusted Aggregates, 1981 (1}-1 986(111)
- L: Liquidity (i.e., MJ plus nonbank holdings of central bank and treasury bill securities)
- - MJ: Broad money stock
(A) Aggregates at Current Price (End of period; in billions of pesos)
1981 1982 1983
(8) Aggregates at 1980 Prices1 (End of period; in billions of pesos)
• • • • • R: ReseNe money
- • C': Currency in circulation
1984
, , - - - - - - - - --MJ
1985 1986
MJ ... ..... _ _ _ _ _ _ _ _ _ _ ...
50 R · · · · · · · · · · · · · · · · · · · · · · · · · · · · · · · · · · · · · · · · · · · · · · · · · · · · · · · · · · · · · · · · · · · · · · · · · · · · · · · · · · · · · · · · · · · · · · · ·
. .- - · --
1981 1982 1983 1984 1985
Sources: International Monetary Fund, International Financial Statistics. 1 Deflated by consumer price index in Manila (end of period).
1986
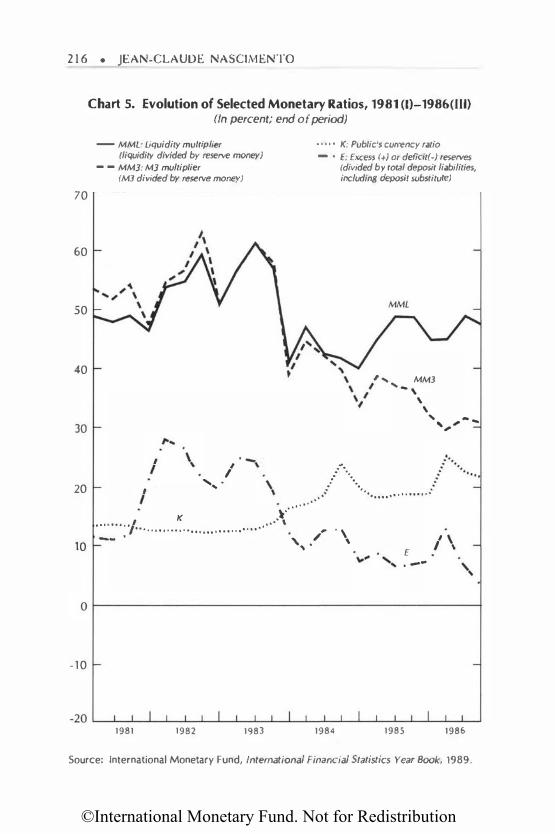
©International Monetary Fund. Not for Redistribution
2 1 6 • JEAN-CLAUDE NASCIMENTO
70
60
50
40
30
20
Chart 5. Evolution of Selected Monetary Ratios, 1981 (1)-1986(111) (In percent; end of period)
- MML: Liquidity multiplier (liquidity divided by reserve money)
- - MMJ: MJ multiplier IMJ divided by reserve money)
,. .. I
I I
I
\ · -1 \ I , . .. \ \''
. . . . . . . . , I K • • • • • \
• • • • • K: Public's currency ratio - • E: Excess (+) or deficit{-) reserves
{divided by total deposit liabilities, including deposit substitute)
·· · ·····
, . .
......... ··· ...
' ' , MMJ ... , ' ' '
,,, ... ...
.. ··· ....... . . . ... . . :·
,... . . . . . . .. . . .. . . ... . . . . . . .. . . . . #' 10 -- •
,, ./ . , \
E I \
I ' . --
o r---------------------------------------------�
- 10
1981 1982 1983 1984 1985 1986
Source: International Monetary Fund, International Financial Statistics Year Book, 1989.
©International Monetary Fund. Not for Redistribution
Crisis in the Philippine Financial Sector • 2 1 7
credit rationing as the crisis deepened. Between 1983 and the end of September 1986, real credit to the private sector fell a staggering 53 percent, and cumulative output fell by 9 percent. Consistent with their prudent lending policy, the uncertain economic outlook, and the chronic shortage of reserves, banks may have preferred to stop lending rather than to charge higher interest rates. Furthermore, banks found investing their liquidity in public securities (of treasury bills and central bank bills) more attractive than lending, for safety reasons. Banks' holdings of public securities rose sharply during the crisis, particularly between 1984 and 1986.62 Banks' shift of funds to the public sector crowded out the pri,·ate sector. Therefore, the banks' actions seem to have exacerbated the shortage of funds in the credit market and worsened the recession.
m. Measures to Deal with the Crisis
Measures to deal with the crisis included, in addition to emergency assistance and some liquidations, recapitalization through government funds, financial assistance to nonfinancial corporations, takeover of weak financial and nonfinancial firms by government financial institutions, and eventually a massive restructuring of some of the government financial institutions themselves.
Financial Assistance to Troubled Entities
During the 198 1-86 crisis period, CBP and the Government provided massive financial assistance to troubled entities under various schemes.
Schemes
When the 1981 crisis broke out, the CBP lender-of-last-resort facility did not cover quasi-banks. To enable these quasi-banks to meet the demand for withdrawal of funds, CBP provided emergency loans through a special rediscount facility.6J However, the primary issuers of commercial papers, mostly corporate businesses, continued to face liquidity problems and failed to honor their obligations as they came due. At that point, quasi-banks were the major holders of this paper.
CBP then set up the Industrial Fund with resources from CBP and the
62 Between 1984 and 1985, banks (commercial, thrift, and savings) were the heaviest subscribers of government securities. These banks' holdings of government securities nearly doubled. See Paulino (1986), p. 29.
61 Before 198 1, the CBP law required the Central Bank to provide unlimited financial assistance during a crisis, but only to banks. This situation was corrected in 1982, when non banks became eligible for emergency assistance.
©International Monetary Fund. Not for Redistribution
218 • JEAN-CLAUDE NASCIMENTO
national government budget. Through the GFis and unibanks, the Industrial Fund, in turn, lent these funds to troubled corporations, which then settled their obligations to the quasi-banks.6-4 The latter, in turn, repaid the CBP emergency loans. This scheme amounted to a conversion of short-term emergency loans extended through the special rediscount window into long-term CBP lending through the Industrial Fund.
In early 1982, the Industrial Fund was replaced by a CBP special rediscount window, through which CBP extended medium- and longterm loans to universal banks, including PNB and DBP, to allow them to finance their acquisition of and merger with troubled entities (see Lamberte (1985)). That same year, CBP began to provide emergency loans and overdrafts to financial institutions facing unexpected liquidity shortages.
Similarly, the Government provided emergency lending and equity contributions to nonfinancial public corporations (mostly from 1981 to the middle of 1983) and to the government financial institutions (mostly from 1983 tO 1985). The Government channeled its financial assistance directly through the capital budget, which recorded large deficits. Direct financial assistance to distressed public sector firms in 1981 and 1982 was aimed both at financing their operating deficits and at stepping up public investment to offset the decline in private investment after 1981. Assistance to government financial institutions, beginning in 1983, was aimed mostly at financing their acquisition and merger of distressed entities, and facilitated the conversion of debt owed to government financial institutions into equity. The Government provided both loans and equity funds to go\'ernment financial institutions, thus allowing these institutions to absorb the loan losses and to assist distressed corporations by com·erting the bad loans provided to these corporations into equity. Because no dividends were expected from these corporations for a long time, this operation amounted to forgoing interest payments. In fact, the PNB lost an estimated :P 400 million in annual interest payments from the Construction Development Corporation of the Philippines as a result of such debt/equity con\'ersion.
Government financial institutions took over large businesses that were virtually bankrupt, including the largest conglomerates that had been hit severely by the 1981 crisis. To illustrate, the National Industrial Development Corporation-a government financial institution and subsidiary of PNB-took over 9 corporations of the Construction and Development Corporation of the Philippines (CDCP) and 15 corporations of the Herd is Group; DBP and PNB took over 87 other CDCP corporations and 14
" Most of the universal banks involved in the scheme were major creditors of the troubled corporations (see Laya (1982)).
©International Monetary Fund. Not for Redistribution
Crisis in the Philippine Financial Sector • 2 19
Herdis corporations.65 The Social Security System (SSS), which had put 24 percent of its investment portfolio into the hotel sector during the 1970s, took over 9 hotels.
Volume
Between 1981 and 1985, the volume of financial assistance that the authorities granted to troubled entities mirrored the intensity of the crisis over its three phases. This volume more than doubled during the 1981 episode, continued to rise in 1982, and doubled again between 1983 and 1984 (Table 13). In addition, the role played by CBP and the Government, as well as the destination of their financial assistance, differed over these phases. During 1981 and in the period from late 1983 to 1985, both the CBP and the Government provided massive financial assistance to financial corporations. In 1982 and 1983, however, the Government prO\·ided the bulk of financial assistance, mostly tO public corporations (financial and nonfinancial).
As the crisis progressed, the main recipients of government financial assistance shifted gradually from nonfinancial to financial public corporations. Until 1982, the Government provided assistance to troubled nonfinancial firms in part tO maintain overall domestic investment, and in part to finance takeovers and acquisition of distressed and bankrupt corporations by government financial institutions. Beginning in 1983, the Government curtailed public in\'estment to reduce budget deficits. As a result, financial assistance to nonfinancial corporations declined somewhat; but assistance to financial corporations accelerated.
Over the whole crisis period, the Government's financial assistance to troubled entities, which rose from 1 3 .6 percent of all gO\·ernmcnt expenditure in 1980 to 20.1 percent in 1985, aggra,·ated the Government's own position.
Terms of CBP Financial Assistance
The terms of the CBP financial assistance rapidly shifted from penalty rates to subsidized rates. In 1981, for emergency loans and overdrafts of 60 days, CBP applied a rate of interest of 24 percent, plus 2 percent for each rollover of outstanding amount. Compared with the market rate of 1 6 percent charged by banks on short-term borrowing, this amounted to a heavy penalty rate. Moreover, CBP extended emergency loans against any collateral that troubled institutions could submit, e\'en collateral previously unacceptable tO CBP. With the establishment of the Industrial
6l These figures are quoted from 8usi11ess Day (1982), the publication of the Securities and Exchange Commission. This issue also reported (p. 294) that o(rhe 20 biggest corporations 8
had substantial government investments in 1981.
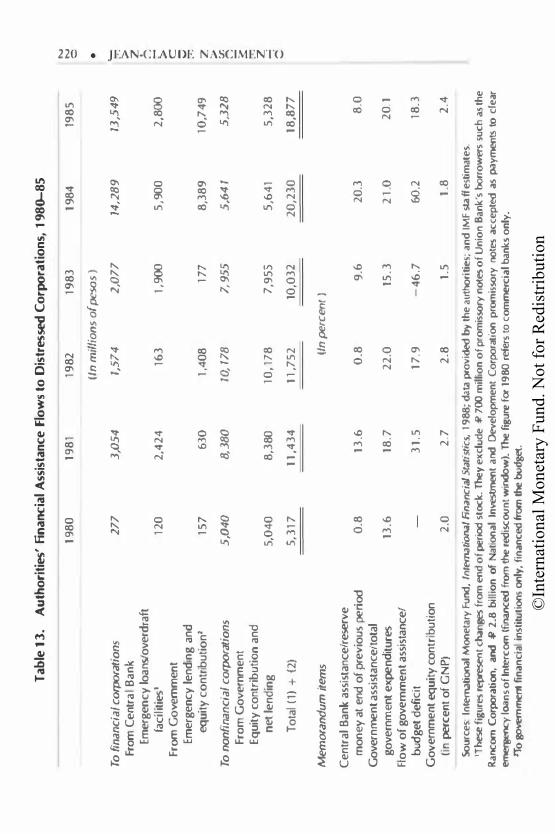
©In
tern
atio
nal M
onet
ary
Fund
. Not
for R
edis
tribu
tion
Tab
le 1
3.
Au
tho
riti
es'
Fin
ancia
l Ass
ista
nce
Flo
ws
to D
istr
essed
Co
rpora
tio
ns,
19
80-
85
"'
19
80
19
81
198
2 19
83
19
84
19
85
"'
0
(In m
iflion
s of
pesos
) •
To f
ina
nc
ial
corporatio
ns
277
3,0
54
1,5
74
2,07
7 14
,28
9
13,5
49
'- :-:-:
Fr
om C
ent
ral B
an
k >
z
Em
erg
en
cy lo
ans/
ove
rdra
ft
n
fac
iliti
es'
120
2
.42
4
163
1,
900
5,9
00
2
,800
'
>
Fr
om G
overn
men
t c
Eme
rge
ncy
le
ndin
g a
nd
v
rr:
equ
ity
co
ntr
ibu
tio
n2
157
6
30
1,4
08
1
77
8
,38
9
10,7
49
z
>
To
non
fin
an
cia
l corpora
tions
5
,04
0
8,3
80
10
,17
8
7,95
5
5,6
41
5,3
28
Ul
n
Fr
om G
ov
ern
me
nt
�
Equ
ity
co
ntri
but
ion
and
rr:
z
net
lend
ing
5
,04
0
8,3
80
10
,17
8
7,9
55
5
,64
1 5
,32
8
--1
0
To
tal
(1)
+ (
2)
5,3
17
1
1,4
34
1
1 ,7
52
10
,03
2
20
,23
0
18,8
77
Memorandum
item
s (In
perc
ent )
Ce
ntra
l B
ank
assi
stan
ce
lre
serv
e
mo
ney
at
end
of
pre
vio
us pe
riod
0
.8
13
.6
0.8
9
.6
20
.3
8.0
Go
vern
men
t ass
ista
nce
/to
tal
go
vern
me
nt e
xpen
ditu
res
13.6
18
.7
22
.0
15.3
2
1.0
2
0.1
Flo
w o
f go
vern
me
nt a
ssis
tan
ce}
bud
get
de
fic
it
31.
5
17
.9
-4
6.7
60
.2
18.3
Go
ve
rnm
en
t equ
ity
co
ntri
but
ion
(in
perce
nt o
f G
NP
) 2
.0
2.7
2
.8
1.5
1
.8
2.4
Sou
rce
s: I
nterna
tiona
l M
one
tary
Fund
, In
ternationa
l Fin
an
cia
l Sta
tis
tics
, 19
88
; d
ata
pmvided
by t
he
aut
horiti
es;
an
d IM
F sta
ff es
tim
ate
s.
'These
fig
llres
represent c
han
ges f
rom
end o
f pe
riod s
tock
. The
y e
xc
lud
e �
700
mill
ion
of
pro
mis
sory
notes
of
Un
ion
Ba
nk
's bo
rro
wers
su
ch
as th
e
Ra
ncom
Co
rpora
tion
, and
� 2
.8 bi
llio
n of
a
tiona
l ln
vestmerlt
and
Deve
lopm
en
t C
orpo
rati
on p
romis
sory
notes
ac
cep
ted a
s pa
ymer1
ts to
de
ar
ernerseocy loa
ns
of
Inte
rcom
(finana!d
from
the red
iscou
nt w
indow
). The
figu
re f
or
1980
refe
rs t
o c
om
merc
ial
ba
nk
s o
nly
. rr
o govern
ment fi
na
nc
ial i
nst
ituti
ons
only
, fi
na
nc
ed from
the bu
dget.
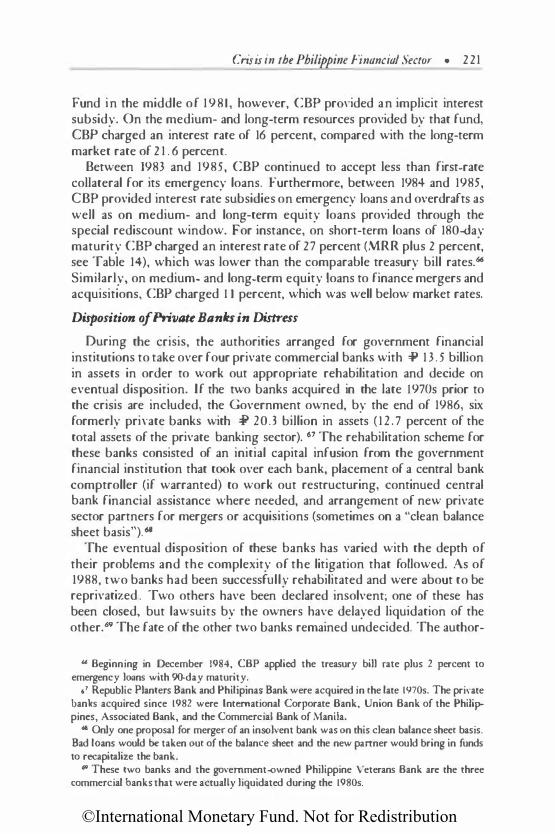
©International Monetary Fund. Not for Redistribution
Crisis in the Philippine Financial Sector • 221
Fund in the middle of 1981, however, CBP prO\·ided an implicit interest subsidy. On the medium- and long-term resources provided by that fund, CBP charged an interest rate of 16 percent, compared with the long-term market rate of 2 1 . 6 percent.
Between 1983 and 1985, CBP continued to accept less than first-rate collateral for its emergency loans. Furthermore, between 1984 and 1985, CBP provided interest rate subsidies on emergency loans and overdrafts as well as on medium- and long-term equity loans provided through the special rediscount window. For instance, on short-term loans of 180-day maturity CBP charged an interest rate of 27 percent (MRR plus 2 percent, see Table 14), which was lower than the comparable treasury bill rates.66 Similarly, on medium- and long-term equity loans to finance mergers and acquisitions, CBP charged I I percent, which was well below market rates.
Disposition of Private Banks in Distress
During the crisis, the authorities arranged for government financial institutions to take over four private commercial banks with =P 13 .5 billion in assets in order to work out appropriate rehabilitation and decide on eventual disposition. If the two banks acquired in the late J 970s prior to the crisis are included, the Government owned, by the end of 1986, six formerly private banks with =P 20.3 billion in assets ( 12 . 7 percent of the total assets of the private banking sector). 67 The rehabilitation scheme for these banks consisted of an initial capital infusion from the government financial institution that took over each bank, placement of a central bank comptroller (if warranted) to work out restructuring, continued central bank financial assistance where needed, and arrangement of new private sector partners for mergers or acquisitions (sometimes on a "clean balance sheet basis"). 68
The eventual disposition of these banks has varied with the depth of their problems and the complexity of the litigation that followed. As of 1988, two banks had been successfully rehabilitated and were about to be reprivatized. Two others have been declared insolvent; one of these has been closed, but lawsuits by the owners have delayed liquidation of the other.69 The fate of the other two banks remained undecided. The author-
'" Beginning in December 1984, CBP applied the treasury bill rate plus 2 percent to emergency loans with 90-day maturity.
61 Republic Planters Bank and Philipinas Bank were acquired in rhe late 1970s. The pri\'ate banks acquired since 1982 were International Corporate Bank, Union Bank of the Philippines, Associated Bank, and the Commercial Bank of Manila.
• Only one proposal for merger of an insolvent bank was on this clean balance sheer basis. Bad loans would be taken our of the balance sheet and the new partner would bring in funds to recapitalize the bank.
69 These two banks and the government-owned Philippine Veterans Bank are the three commercial banks that were actually liquidated during the 1980s.
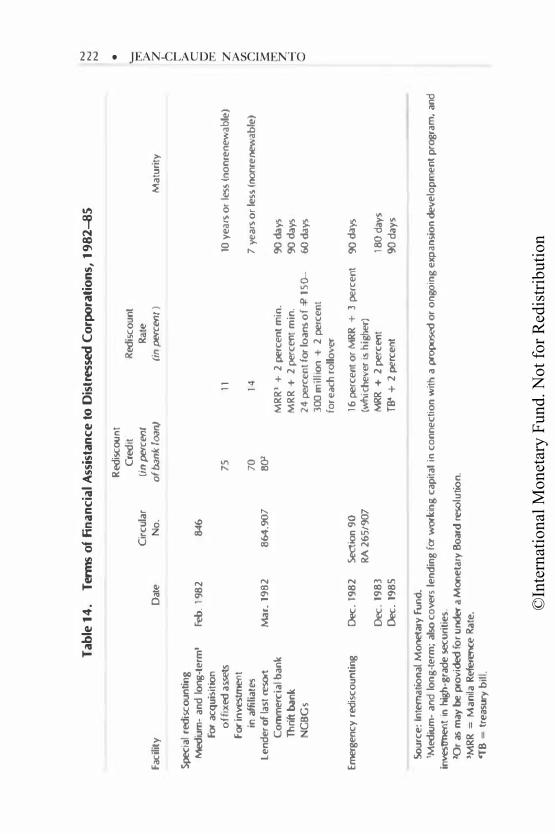
©In
tern
atio
nal M
onet
ary
Fund
. Not
for R
edis
tribu
tion
Tab
le 1
4.
Tenn
s of
Fin
an
cia
l Ass
ista
nce
to D
istres
sed C
orpo
rati
on
s, 1
98
2-8
5
Cir
cul
ar
Fac
ility
D
ate
o
.
Specia
l red
isco
unti
ng
Med
ium
-a
nd
lon
g-te
rm'
Feb.
198
2
846
For
acq
ui�
itio
n
of f
ixed
a�
F
or in
vestment
in a
ffilia
tes
len
de
r of la
st resort
Ma
r. 1
98
2
864.90
7 C
om
me
rcia
l ban
k Th
rift ba
nk
G
BG
s
Emerg
en
cy r
edis
co
unti
ng
Dec.
198
2
Section
90
R
A2
65/
90
7 Dec
. 19
83
Dec.
198
5
Sour
ce
: In
ternat
ion
al M
onet
ary
ftJn
d.
Red
is.coo
nt
Cred
it (in
percent
of ba
nk loa
n)
75
70
ao>
11
14
Red
is.co
unt
Rat
e
{in percen
t )
MR
R'
+ 2
perc
en
t m
in.
MR
R +
2 pe
rcen
t m
in.
24 percen
t fo
r lo
an�
of
� 1
50-
300 m
illio
n +
2 pe
rce
nt
for e
ach
rollo
ver-
16 pe
rce
nt o
r M
RR
+ 3
perc
ent
(whic
hev
er
is h
igilef
) M
RR
+ 2
perc
ent
TB ..
+ 2
perc
ent
Mat
url
ty
10 y
ea�
or
less (
non
ren
ewa
ble
)
7 y
ea�
or
les�
(no
nre
newab
le)
90d
ays
90d
ays
60d
ays
90d
ays
180
days
90 d
ays
'Med
ium
-an
d l
on
g-t
erm
; al
� c
over-
s le
nd
ing
for
work
ing
cap
ital
in c
on
nec
tion
with
a pmposed
or
on
goin
g e
xpa
nsi
on
�e
lop
me
nt
prog
ram
, an
d in
vestment i
n h
igh-g
rad
e �
un
tie
s.
l'Qr
as m
ay be
pfOv
ided fo
r u
nder a
Mon
eta
ry B
oar
d �
lutio
n.
1MR
R =
M
an
ila R
eference
Rate
. -T
B =
tr
easu
ry b
ill.
N
N
N
•
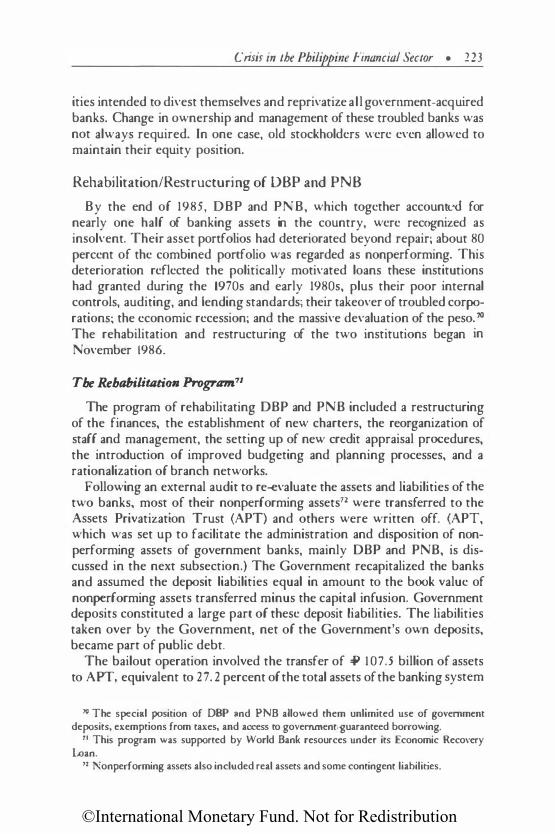
©International Monetary Fund. Not for Redistribution
Crisis in the Philippine Financial Sector • 223
ities intended to divest themselves and reprivatize all government-acquired banks. Change in ownership and management of these troubled banks was not always required. In one case, old stockholders were even allowed to maintain their equity position.
Rehabilitation/Restructuring of DBP and PNB
By the end of 1985, DBP and PNB, which together accounted for nearly one half of banking assets in the country, were recognized as insolvent. Their asset portfolios had deteriorated beyond repair; about 80 percent of the combined portfolio was regarded as nonperforming. This deterioration reflected the politically motivated loans these institutions had granted during the 1970s and early 1980s, plus their poor internal controls, auditing, and lending standards; their takeover of troubled corporations; the economic recession; and the massive devaluation of the peso. 70
The rehabilitation and restructuring of the two institutions began in November 1986.
The Rehabilitation Program71
The program of rehabilitating DBP and PNB included a restructuring of the finances, the establishment of new charters, the reorganization of staff and management, the setting up of new credit appraisal procedures, the introduction of improved budgeting and planning processes, and a rationalization of branch networks.
Following an external audit to re-evaluate the assets and liabilities of the two banks, most of their nonperforming assets72 were transferred to the Assets Privatization Trust (APT) and others were written off. (APT, which was set up to facilitate the administration and disposition of nonperforming assets of government banks, mainly DBP and PNB, is discussed in the next subsection.) The Government recapitalized the banks and assumed the deposit liabilities equal in amount to the book value of nonperforming assets transferred minus the capital infusion. Government deposits constituted a large part of these deposit liabilities. The liabilities taken over by the Government, net of the Government's own deposits, became part of public debt.
The bailout operation involved the transfer of :P I 07.5 billion of assets to APT, equivalent to 2 7. 2 percent of the total assets of the banking system
"' The special position of DBP and PNB allowed them unlimited use of government deposits, exemptions from taxes, and access to government-guaranteed borrowing.
71 This program was supported by World Bank resources under its Economic Recovery Loan.
72 Non performing assets also included real assets and some contingent liabilities.
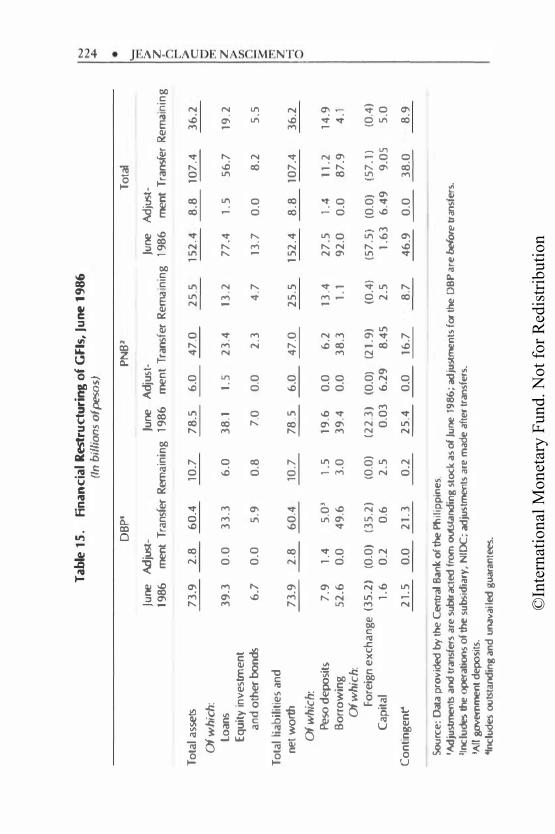
©In
tern
atio
nal M
onet
ary
Fund
. Not
for R
edis
tribu
tion
Tab
le 1
5.
fina
nc
ial Rest
ruct
uri
ng o
f G
fls,
June
19
86
On
bil
lions of peso
s)
DB
P'
PN
B'
To
tal
june
Ad
just-
June
A
dju
!;t-
June
Ad
ju:st-
198
6
ment
Tra
nsfer
Rem
ain
ing
19
86
men
t T
ran
sfer
Re
ma
inin
g
198
6
ment T
ransfe
r R
em
ain
ing
To
tal a
ssets
7
3.9
2
.8
60
.4
10.7
7
8.5
6
.0
47
.0
25
.5
152
.4
8.8
10
7.4
--
----
----
----
Of w
hic
h:
Loan
s 3
9.3
0
.0
33
.3
6.0
3
8.1
1.
5
23
.4
13.2
7
7.4
1
.5
56
.7
Equ
ity
inv
estm
en
t a
nd o
ther
bon
ds
6.7
0
.0
5.9
0
.8
7.0
0
.0
2.3
4
.7
13.7
0
.0
8.2
To
tal
liab
ilit
ies
and
n
et wo
rth
73
.9
2.8
6
0.4
10
.7
78
.5
6.0
4
7.0
2
5.5
1
52
.4
8.8
10
7.4
--
----
----
Of w
hich
:
Peso
de
posi
t!;
7.9
1
.4
5.0
' 1
.5
19.6
0
.0
6.2
13
.4
27
.5
1.4
1
1.2
B
orr
ow
ing
5
2.6
0
.0
49
.6
3.0
3
9.4
0
.0
38
.3
1.1
9
2.0
0
.0
87
.9
Of w
hic
h:
Fore
ign
ex
cha
nge
{3
5.2
) (0
.0)
(35
.2)
(0.0
) (2
2.3
) {0
.0)
(21.
9)
{0.4
) (5
7.5
) (0
.0)
{57
.1)
Ca
pit
al
1.6
0
.2
0.6
2
.5
0.0
3
6.2
9
8.4
5
2.5
1
.63
6
.49
9
.05
Co
ntin
ge
nt'
2
1.5
0
.0
21.
3
0.2
2
5.4
0
.0
16.7
8
.7
46
.9
0.0
3
8.0
--
----
----
Sourc
e:
Oal
a p
rov
ided by
the C
entra
l Ba
nk
of tne
Phil
ipp
ine
s.
'Adju
stments
and
tra
nsie
rs a
re s
ubtra
cted
from
outstand
ing
stoc
k a
s ol
June
19
86;
adju
stmen
ts fo
r the
DB
P a
re before
tran
sfe
rs.
'·Inclu
des th
e ope
rati
ons
of the
su
bsid
iary
, N
IDC; ad
just
ments
a.-e
mad
e a
fte
r tr
ansf
ers
. 'A
ll govem
.-n.en
t d
epo
sits
. •i
ncludes
oots
tandin
g a
nd
un.a
va.i l
ed gu<�
.-antees
.
36
.2
19.2
5.5
36
.2
14.9
4
.1
(0.4
) 5
.0
8.9
.....
.....
""'"
•
'--
r.:
>
z
. ('l
r
>
c
0
[rl
z
>
C.fl
n
s:
[rl
z
-l
0
©International Monetary Fund. Not for Redistribution
Crisis in the Philippine Financial Sector • 22 5
at the end of 1985 (see Table 1 5).'l PNB accounted for =P 47 billion, of which :P 6 billion worth of non performing assets came from its subsidiary, the National Investment Development Corporation, which was also heavily involved in the rescue of failing businesses. DBP accounted for the remaining =P 60. 5 billion. As a result, the balance sheets of these two government financial institutions were scaled down sharply. Total assets of PNB declined from =P 79 billion in 1985 to =P 26 billion in 1986, while total assets of DBP went from =P 74 billion to =P I I billion.
Second, new management was introduced into both banks, and staffs were reorganized. The size of each staff was reduced over time. DBP staff was reduced from 4,147 employees in july 1985 tO 1,981 employees by the end of OctOber 1987; PNB staff was reduced from 6,500 to 4,700. The number of branches and the size of each head office also were reduced.
The rehabilitation plan established new charters for the two banks. DBP was given the status of a thrift bank and hence will be subject to normal central bank regulations governing thrift banks. 74 At first it will concentrate on lending for agriculture, small- and medium-scale industry, and housing. Expanded lending in other areas-including wholesale rather than retail lending-was to be permitted only after a three-year rehabilitation period ( 1987-89). PNB will continue to operate as a universal bank, but without access to special privileges or funds, and it will continue to serve as the principal banker for the Government and public enterprises, but within the rules prescribed for public deposits. After a two-year period of successful operations, PNB will be privatized through public offering of stock.
The Handling ofNonpnforming Assets Through APT
As already mentioned, APT is a government entity set up to administer and dispose of the nonperforming assets and government corporations transferred to it. ?s It has a paid-up capital of =P 100 million, a five-man Board of Trustees appointed by the President of the Phjlippines, and an expected life span of five years. 76 The Government contributed the entire capital of APT.
" Bank credit to the private sector, in nominal terms, went from ,P I 53 billion at the end of 1983 to ,P 96 billion (after transfer) at the end of 1986, compared with ,P 114 billion before transfer at the end of 1986.
•• These regulations include limits on equity investments, limits on exposure 10 any one borrower, and the use of guarantees. However, the gearing ratio for the DBP will not exceed 5:1 during the rehabilitation period although a 10: 1 ratio is permitted for thrifts.
" In theory, APT could also receive public corporations that the Go\'emment wished to privatize.
76 APT is supen·ised by the Committee on Privatization (COP), which is the firsnier of the asset disposition mechanism. COP is a five-man interministerial body chaired by the
©International Monetary Fund. Not for Redistribution
226 • JEAN-CLAUDE NASCIMENTO
Banks were allowed to transfer any nonperforming account with a value in excess of :P 10 million as well as smaller loans they had made with a government guarantee. Transfers were effected at book value. In accordance with these criteria, legal titles on some 400 nonperforming accounts were transferred to APT in 1986 and 1987; about 75 percent of these are financial claims requiring foreclosure procedures that are expected to be long and costly. The remaining assets over which APT has physical control were being disposed of expeditiously.
APT was to dispose of transferred assets according to a given set of principles and disposition mechanisms, including the following:
• Sales were to be open to qualified buyers through competitive bidding or auction arrangements.
• Rehabilitation prior to disposal was to be undertaken only in exceptional cases, when it would lead to a justifiable increase in the assets' salability and price.
• As a general rule, nonperforming accounts were not to be returned to their original owners.
• ln the case of deferred payment, terms were to be consistent among the various individual transactions.
APT could sell the transferred assets either directly or indirectly through the use of agents or brokers. The price and terms of settlement of the sale were to be decided on a case-by-case basis, upon approval by the Board of Trustees. Revenues from APT sales of nonperforming assets were to be transferred to the government budget as capital revenues.
Both DBP and PNB selected members of their staff to participate on loan-workout task forces and charged them with managing the nonperforming assets transferred to APT: preparing the assets for sale/recovery, preparing legal documentation preliminary to the sale or seizure of collateral, and so on.77 A management contract was signed under which APT reimburses all expenses related to handling of these nonperforming assets by the task forces, including salaries of task force staff. This effective transfer of staff was done to ensure that the bank was protected from political influence during the recovery process. For nonperforming accounts retained in DBP and PNB (i.e., less than :P lO million in value per account), additional task forces went to work to manage loan recovery, and loan recovery rates are reported to be satisfactory.
Minister of 1-inance. It is empowered to issue guidelines governing the disposition process, approve or disapprove individual disposition proposals on terms and purchasers, approve organizational and financial requirements of APT, and monitor the overall disinvestment program.
71 The names of borrowers have become public and a number of them have now acted tO settle their obligations.
©International Monetary Fund. Not for Redistribution
Crisis in the Philippine Financial Sector • 227
IV. Main Ftndings
The paper has analyzed the causes of the Philippine financial crisis and the authorities' reactions to the crisis. The Philippine crisis followed a boom-bust phenomenon typical of those analyzed in crisis literature. After experiencing tremendous growth in the 1970s, both the real sector of the economy and the financial sector experienced a major contraction in the 1980s. The main conclusion of this paper is that factors within the financial system were instrumental in provoking and exacerbating the crisis, and thus, a key transmission mechanism of the crisis ran from the financial sector to the real sector of the economy. This feedback from the financial to the real sector constituted the main focus of the paper.
Although the deteriorating economy, the political climate, and the balance of payments crisis increased the financial fragility of corporate and noncorporate institutions, three phenomena originating inside the financial system provoked the crisis and exacerbated its impact on the real sector. First, improper sequencing of financial sector reforms in a period of macroeconomic and political shocks led to widespread loose lending practices, fraud, and mismanagement by numerous banks. In particular, the financial reforms neglected w tighten bank supervision as regulatory restrictions were dismantled in some areas (activity regulations, interest rate setting) and even kept in other areas (e.g., selective credit).
Second, the limited competition in loan markets (reflecting in part the domination by bank holding companies) played a key role, although competition in deposit markets (reflecting low concentration in the banking industry as a whole) was strong. Before the crisis, the bank holding company structure allowed banks that belonged to these holding companies to engage in excessive risk taking with newly created and inexperienced subsidiaries. Many of these subsidiaries would be hit by the limited crisis of 1981, causing the entire holding group to collapse. During the crisis, this structure contributed to the upward pressure on nominal lending rates. Statistical evidence suggests that, faced with mounting overdue loans, banks passed along to customers the cost of carrying overdue loans. Thus poor quality of the banks' own portfolios contributed to higher interest rates and exacerbated the effects of tight monetary policies.
Third, sharp portfolio shifts in the banking and nonbanking sectors appear to have complicated monetary and fiscal management, and contributed to crowding out the private sector. After 1983, monetary management based on indirect instruments not only became vulnerable to prediction errors and M 3 was no longer a reliable intermediate target, but also faced conflicting objectives during a crisis-namely, maintaining monetary stability while preventing the collapse of the banking system. Also,
©International Monetary Fund. Not for Redistribution
228 • JEAN-CLAUD£ NASCIMENTO
despite a tighter stance and a reduction of the budgetary deficit (in percent of GNP) after 1983, the fiscal authorities had to step up domestic borrowing because foreign financing had dried up. These demand management policies, in turn, caused interest rates to skyrocket and reduced sharply domestic funds available to the private sector, thereby worsening the recession.
Banks' behavior also contributed to the recession as widespread uncertainty in the economic outlook and attractive rates on central bank and government securities led banks to ration private sector credit during the crisis and to allocate investible funds into safe outlets. However, this issue requires further empirical scrutiny.
In reaction, CBP and the Government took financial assistance measures to contain the crisis and long-term restructuring measures to restore the soundness of the financial system. The various support measures to deal with problem banks helped to contain the crisis during the difficult macroeconomic environment which existed between 1983 and 1986, and the Government eventually had to assume the large accumulated losses. The institutional solutions in this regard-the specific recapitalization and restructuring of the banking system and the method of disposition of problem assets-seem comprehensive and well conceived; their effectiveness in terms of minimizing future problems remains to be assessed.
Bibliography
Buhat, V., "Trends in Peso Deposits and Secured Loans of Commercial Banks (1981-1985)," CB Review, Vol. 38, No. 6 (June 1986).
--- · "Movements in the Manila Reference Rates and Lending Rates of Commercial Banks (1982-1986)," CB Review, Vol. 39, No. 2 (February 1987).
Business Day. "I ,000 Top Corporations in the Philippines" (in cooperation with the Securities and Exchange Commission), Vol. 1 5 (1982); and Vol. 17 (1984).
Capie, F., and E.G. Woods, eds., Financial Crisis and the World Bonking System (New York: St. Martin's Press, 1986).
Central Bank of the Philippines, Statistical Bulletin, 1982. ---· Bonking Lows(Manila: Central Bank of the Philippines, 1983). ---· "Governor's Report," CB Review, Vol. 40 (February 1988). ___ , "The Philippines External Debt Monitoring System," CB Review, Vol.
4 1 (January 1989). ___ , Philippines Financ ial Statist ics, 1982-85. ---· "Rationale and Expanded Dimensions of Universal Banking in the
Philippines," Bondline (April-June 1980) (Manila: Central Bank of the Philippines).
De Dios, Emmanuel S., An Analysis of the Philippine Economic Crisis (Manila: University of the Philippines Press, 1984).
Doherty, John F., "Who Controls the Philippine Economy: Some Need Not Try
©International Monetary Fund. Not for Redistribution
Crisis in the Philippine Financial Sector • 229
as Hard as Others," in Cronies and Enemies: The Currmt Philippine Scene, ed. by Belinda A. Aquino, Philippine Studies Occasional Paper No. 5 (Honolulu: Center for Asian and Pacific Studies, University of Hawaii, August 1983), pp. 7-35.
Edwards, S., and M. Khan, "Interest Rate Determination in Developing Countries," Staff Papers, International Monetary Fund, Vol. 32 (September 1985).
Fry, M., Money, Interest and Banking in Economic Developmmt (Baltimore: Johns Hopkins University Press, 1988).
Goldsborough, D., and I. Zaidi, "Monetary Policy in the Philippines During the Period of the Financial Crisis and Changes in the Exchange Rate Regime," IMF Working Paper, WP/89/98 (December 1989).
International Monetary Fund, lntemational Financial Statist ics Yearbook, 1988. Lamberte, Mario B., "Financial Liberaliz.ation: What Have We Learned?" joumal
of Philippine Developme11f, Vol. 12, No. 2 (1985). Laya, Jaime C., A Crisis of Confidence (Manila: Central Bank of the Philippines,
1982). ___ , Gearing Toward Recovery (Manila: Central Bank of the Philippines, 1983). Licaros, G.S., "Regulations in the Financial System," Bondline, Vol. 23, No. 3
(Manila: Central Bank of the Philippines, 1979). Lirio, Ricardo P., "The Philippine Banking Industry: A Historical Perspective,"
Bondline, Vol. 24 (April-June 1985) (Manila: Central Bank of the Philippines), pp. 4-13.
Lontoc, Francisco L., "A lime of Crisis and Reform," Bondline, Vol. 20 (November 1981) (Manila: Central Bank of the Philippines), pp. 7-13.
Mcl(jnnon, R.I., Mot�ey at1d Capital in Economic Developmmt (Washington: The Brookings Institution, 1973).
Paulino, H., "Government Securities: A Review of 1985 Performance," CB Review, Vol. 38 Qanuary 1986).
Robledo, Catalina T., "Deficit Financing of Government Corporations, 197 3-83," Cmtrai Bank Review (May 1984) (Manila: Central Bank of rhe Philippines), pp. 12-15.
Saldana, Cesar G., "The Philippine Commercial Banking System: Structure, Performance, and the Impact of the Capital Buildup Program of 1972," Philippine Review of Economics and Busit1ess, Vols. 3 and 4 ( 1984), pp. 145-64.
Shaw, E., Fit�anciai Deepming in Economic Development (London: Oxford University Press, 1973).
Sicat, Gerardo P., "A Historical and Current Perspective of the Philippine Economic Problems," PhilippineEconomicjoumal, Vol. 24, No. I (1985).
Sycip, Gorres, Velayo, and Co., "A Study of Commercial Banks in the Philippines" (Manila: Sycip and Others Publication Unit, various issues: December 1972, 1978, 1983, and 1986).
Teodoro, Procesa L. , "Non-Bank Financial Intermediaries-A Decade of Performance," Cmtrai Bank Review (September 1985) (Manila: Central Bank of the Philippines). pp. 16-20.
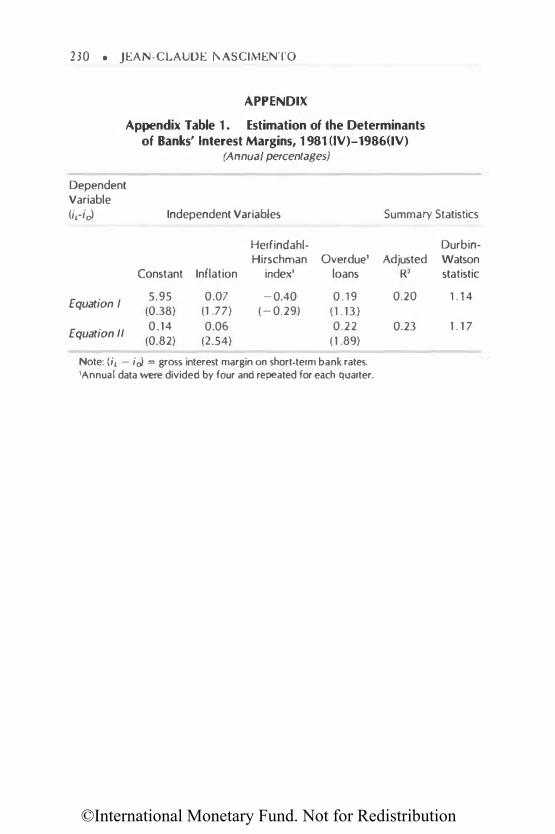
©International Monetary Fund. Not for Redistribution
230 • JEAN-CLAUDE ASCIMENTO
APPENDIX
Appendix Table 1 . Estimation of the Determinants of Banks' Interest Margins, 1 981 (IV)-1986(1V)
(Annual percentages)
Dependent Variable
(it-iol Independent Variables Summary Statistics
Herfindahl- Durbin-Hirschman Overdue' Adjusted Watson
Constant Inflation index' loans R' statistic
Equation I
Equation II
5.95 (0.38) 0.14
(0.82)
0.07 (1 .77)
0.06 (2.54)
-0.40 ( -0.29)
0 . 19 (1 .13) 0.22
(1 .89)
Note: (it - ic) = gross interest margin on short-term bank rates. 'Annual data were divided by four and repeated for each quarter.
0.20 1 .14
0.23 1 . 1 7
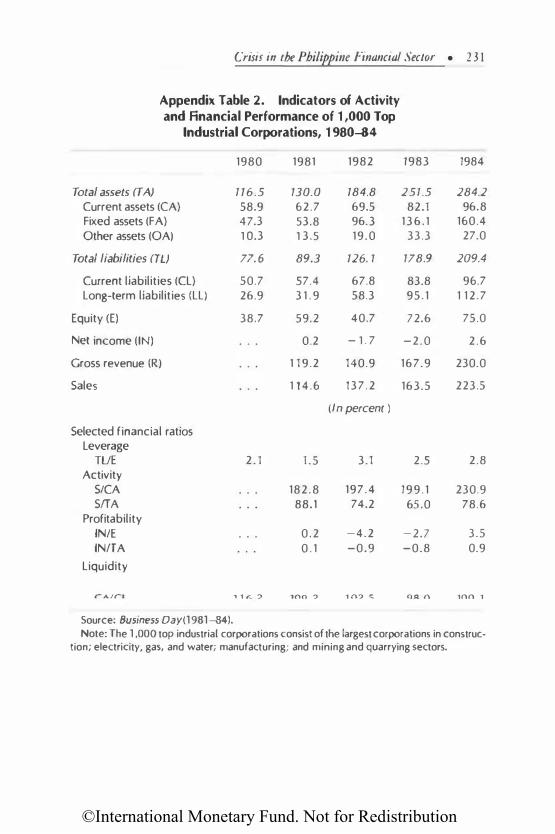
©International Monetary Fund. Not for Redistribution
Crisis i11 the Philippine Financial Sector • 2 3 1
Appendix Table 2. Indicators of Activity and Financial Performance of 1 ,000 Top
Industrial Corporations, 1 980-84
1980 1981 1982 1983 1984
Total assets (TA) 176.5 130.0 184.8 251.5 284.2
Current assets ((A) 58.9 62.7 69.5 82.1 96.8 Fixed assets (FA) 47.3 53.8 96.3 136.1 160.4 Other assets (OA) 10.3 13.5 19.0 33.3 27.0
Total liabilities (TL) 77. 6 89.3 126. 1 178.9 209.4
Current liabilities (CL) 50.7 57.4 67.8 83.8 96.7 Long-term liabilities (LL) 26.9 3 1 . 9 58.3 95.1 1 1 2.7
Equity (E) 38.7 59.2 40.7 72.6 75.0
Net income (IN) 0.2 - 1. 7 -2.0 2.6
Gross revenue (R) 1 1 9.2 140.9 167.9 230.0
Sales 1 1 4.6 137.2 163.5 223.5
(In percent )
Selected financial ratios Leverage
TUE 2.1 1.5 3.1 2.5 2.8 Activity
SICA 182.8 197.4 199.1 230.9 S!fA 88.1 74.2 65 .0 78.6
Profitability IN/E 0.2 -4.2 -2.7 3.5 INfrA 0 . 1 -0.9 -0.8 0.9
Liquidity
rAJt-1 ., 1 r- :> 1('\0 � 1 0? c:: OA () 100 1
Source: Business Oay(1981-84). Note: The 1 ,000 top industrial corporations consist of the largest corporations in construe-
tion; electricity, gas, and water; manufacturing; and mining and quarrying sectors.
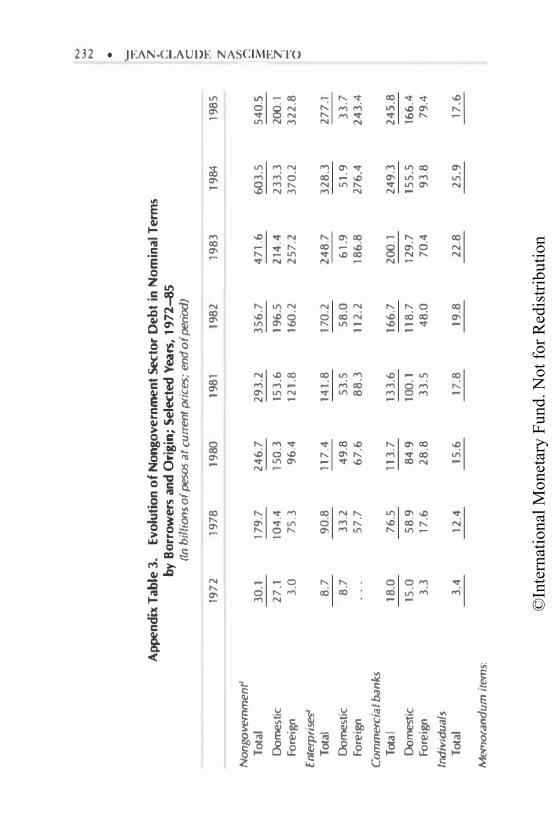
©In
tern
atio
nal M
onet
ary
Fund
. Not
for R
edis
tribu
tion
N
.....
N
•
'- ;::-:
>
Appe
nd
ix T
able
3.
Evo
luti
on
of
No
ng
ov
ern
men
t Sec
tor
De
bt
in N
om
ina
l Te
rms
z
by
Bo
rro
we
rs a
nd O
rig
in;
Se
lected
Yea
.rs,
19
72-8
5 n
r
(In
bill
ions
of pe
sos a
t c
urr
ent prices;
end
of pe
riod)
>
c
c:;
T97
2
19
78
1
98
0
19
81
19
82
1
98
3
19
84
1
98
5
tr.
z
>
Non
govern
men
t' Ul
�
T
ola
l 3
0.1
1
79
.7
24
6.7
2
93
.2
35
6.7
4
71
.6
603
.5
54
0.5
3:
: Dome
stic
2
7.1
1
04
.4
15
0.3
15
3.6
1
96
.5
214
.4
23
3.3
2
00.1
tr.
z
Fo
reign
3
.0
75
.3
96
.4
12
1.8
1
60
.2
15
7.1
3
70
.2
32
2.8
..
...: ,.
..: ._,
Enle
rpri
ses2
To
lal
8.7
9
0.8
1
17
.4
14
1.8
1
70
.2
14
8.7
3
28
.3
27
7.1
--
----
Domest
ic
8.7
3
3.2
4
9.8
5
3.5
5
8.0
6
1.9
5
1.9
3
3.7
Fore
ign
57
.7
67
.6
88
.3
11
2.2
1
86
.8
27
6.4
2
43
.4
Commercial ba
nks
To
lal
18
.0
76
.5
11
3.7
1
33
.6
16
6.7
1
00.1
2
49
.3
24
5.8
Domestic
15
.0
58
.9
84
.9
10
0.
1 1
18
.7
12
9.7
1
55
.5
16
6.4
Fore
ign
3.3
1
7.6
2
8.8
3
3.5
4
8.0
7
0.4
9
3.8
7
9.4
Ind
ivid
ua
ls
To
lal
3.4
1
2.4
1
5.6
1
7.8
1
9.8
2
2.8
2
5.9
1
7.6
Memoran
du
m i
tems:
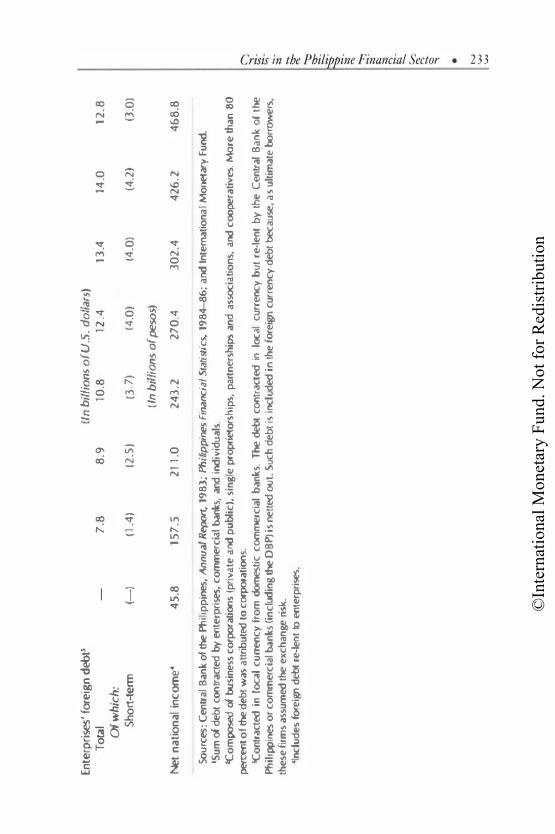
©In
tern
atio
nal M
onet
ary
Fund
. Not
for R
edis
tribu
tion
Ente
rpri
ses' f
ore
ign
debt
) (In
bill
ions o
( U
.S.
do
llars
)
To
tal
7.8
8
.9
10.8
12
.4
13
.4
14.0
1
2.8
Of w
hic
h:
Sho
rt-te
rm
(-)
(1.4
) (2
.5)
(3.7
) (4
.0)
(4.0
) (4
.2)
(3.0
)
(In b
illi
on
s o(
peso
s)
Net
na
tio
na
l in
com
e•
45
.8
157
.5
21
1.0
2
43
.2
27
0.4
3
02
.4
42
6.2
4
68
.8
Sources
: Ce
nlr
al
Ba
nk
of the
Pflil
ipp
ines,
An
nu
<JI
Report, 1
98
3;
Phil
ipp
ine
s F
in<Jnc
ial
Sta
tist
ics,
19
84-8
6;
and
In
terna
tion
al M
ollef
ary
Fund
. 'S
um
of d
eb
t con
trac
ted
by
ente
rpri
ses,
co
mm
erc
ial
bank
s, a
nd' i
ndiv
idu
als.
'C
om
posed o(
busi
ne
ss c
orpo
rati
oos
(priv
ate
and
pu
blic
), s
ing
le pr
opr
ieto
rsh
ips,
par
tne
rsh
ips a
nd
assoc
iati
on
s, a
nd c
oope
rati
ves
. More
lha
n 8
0
percent o
f the
de
bt w
as a
ttri
bu
ted t
o c
orpora
tions.
JC
ont
rac
ted i
n l
ocal
cu
aenc
y f
rom
domes
tic
com
merc
ial
ba
nks.
Th€ debt
con
trac
ted i
n
local
cu
rrenc
y b
ut
re-le
nt
by
th
e C
entr
al B
an
k o
r the
Ph
ilipp
ines o
r c
om
me
rcia
l ban
ks
(in
clud
ing
lhe D
BP)
is n
ett
ed oo
t. S
uch
de
bt
is inc
lud
ed i
n th
e f
ore
ign c
urre
nc
y d
eb
t bec
au
se, a
s u
ltim
ate
borrowe
rs,
the
se f
irms
ass
umed
the
exc
han
ge ri
�k-'l
nclu
de
s fore
ign d
ebt r
e-l
ent
to en
terp
rises
.
-.
:::: •