subliminal vibro-tactile based notification of co 2 economy while driving
TRANSCRIPT

Subliminal vibro-tactile based notificationof CO2 economy while driving
A. Riener and A. Ferscha and P. Frech and M. Hackl and M. KaltenbergerJohannes Kepler University Linz, Institute for Pervasive Computing
Altenberger Strasse 69, 4040 Linz, AustriaE-Mail: [email protected], Tel. +43(0)732-2468-1432
ABSTRACTA general reduction of carbon dioxide emissions is an impor-tant topic currently discussed by both society and govern-ment – lower allowed emission values would strongly affectautomotive manufacturers as road transport produces, forexample, about one fifth of the CO2 emissions in the Euro-pean Union. But that’s not all, also the individual drivercould be affected from regulatory mechanisms as it is feasi-ble, not least due to the broad availability of wireless andinformation technology in cars, to demand the assembly of a“personal carbon dioxide profile” including all the emissionsaccumulating from operating vehicles, traveling by plane,and even from using public transport, and in succession tocharge a person based on its effective CO2 consumption.One problem arising in this field is that an individual usu-ally is not aware about his/her CO2 consumption, neitherabout which means of transportation produces what amountof carbon dioxide (what is the personal fraction of CO2 fora large plane with 250 passengers traveling 5, 000km?), norhow exactly to drive a vehicle economic or wasting with re-spect to CO2 emission or what the difference between thesetwo extreme values (in terms of cost) is. To counteract theissue of driving economy, which is the only the driver candirectly control, we propose a inattentive operating vibro-tactile notification system integrated into the car (safety beltor seating), helping the driver in his/her (i) subjective CO2
valuation and (ii) reduction of CO2 emissions while driving.Results from real driving experiments have shown that
drivers tend to drive more economic with regard to car-bon dioxide emission when perceiving tactile feedback abouttheir current driving efficiency compared to baseline testswithout technology assistance.
Categories and Subject DescriptorsH [Information Systems]: H.5 Information Interfaces andPresentation—H.5.2 User Interfaces; H [Information Sys-tems]: H.1 Models and Principles—H.1.2 User-MachineSystems; B [Hardware]: B.4 Input/Output and Data Com-munications—B.4.2 Input/Output Devices
Copyright held by author(s)Automotive UI’10, November 11–12, 2010, Pittsburgh, PennsylvaniaACM 978-1-4503-0437-5.
KeywordsSubliminal driver notification, Ambient intelligence, CO2 ef-ficient driving, Vibro-tactile information, Safety belt inter-face, Tactile driver seat, Assistive technology
1. INTRODUCTIONThe trend for fuel-saving vehicles, and with that the meet
of lower exhaust emission standards, can be observed in au-tomotive exhibitions all over the world. The new releasesof almost all big car manufacturers, presented for instanceat the Frankfurt trade fair (IAA) in 2009, revealed thatthe central focus of interest was directed – for trade visi-tors, policy makers, press, and normal guests – to the dis-play stands of midget and small cars with low fuel con-sumption. The market launch of this new generation ofso-called “green cars” is not only running costs driven, butto a greater extent determined by societal and governmen-tal demand for fuel efficiency, which directly translates intolower CO2 emissions. The European Commission, for in-stance, has enacted a regulation for new cars sold in theEU-27 to reach the 120g CO2/km target on average emis-sions by 2012 (IP/07/155, February 7, 2007), a reduction ofaround 25% from 2007 levels. The main reason for this reg-ulation is that the improvements in vehicle technology overrecent years have not been enough to neutralize the effectof increases in traffic and car size (while the EU-25 reducedoverall emissions of greenhouse gases by almost 5% between1990 and 2004, CO2 emissions from road transport rose by26%) [10].
Fuel efficient driving would also save carbon dioxide out-put (direct correlation of measures), thus supporting the re-quested goal (Saito [29] has already shown that driving eco-nomically is a feasible approach to reduce CO2 emissions).A stronger personal constraint to submit to this attemptcould be demanded when compiling and charging the indi-vidual based on his/her aggregated CO2 wastage. A systemdetermining the CO2 emissions from the personal car use isimaginable similar to a system proposed by Coroama [6] asthe “Smart Tachograph” and calculating a personal insur-ance rate on a driven kilometer basis. Nevertheless, almostno driver is aware about the carbon dioxide emissions pro-duced by his/her car (this ignorance has also been reinforcedin the post-experiment questionnaire completed by each sub-ject) while most of them can assess the fuel consumption inliters per 100 kilometer. This is somehow surprising as it ismandatory for car manufacturers in Europe since more than10 years to release both vehicle fuel consumption and CO2
emission information for new cars [12].
Proceedings of the Second International Conference on Automotive User Interfaces and Interactive Vehicular Applications (AutomotiveUI 2010), November 11-12, 2010, Pittsburgh, Pennsylvania, USA
92

Displays Supporting Economic DrivingThe current generation of cars provide some indication offuel consumption, either as (i) green (efficient driving) orred (wasting fuel/energy) lamp, (ii) analog fuel consump-tion meter like a common speed indicator, (iii) digital valuerepresenting the mean fuel consumption per 100km or sincelast refill or (iv) as an arrow guiding the driver to changeup or down in order to reduce fuel consumption [17]. Ingeneral, these notification types provide not a very detailedindication of CO2 efficiency. The greater problem, however,is, that the driving process is highly visual [25] and fuel con-sumption indication systems also are highly visual and it isevidenced that too much (visual) information at the sametime can lead to distractions by overstraining a driver’s cog-nitive capabilities. There is a considerable body of scientificevidence that driver distraction is a major problem in termsof road safety [36, p. 20]. From an evaluation of more than250,000 crash records, Wierwille and Tijerina [38] reportedthat driver distraction based on problems with visual allo-cation and/or workload accounts for a significant proportionof road accidents.
Unemployed Information Reception CapacityFor drivers operating a vehicle today it is common to carryout multiple tasks and activities, and to interact with severaldevices and/or applications simultaneously, and all in addi-tion to the main activity of driving. For the automotive do-main it is agreed [18], [27, p. 9] to classify the entirety of ac-tivities into the three task classes (i) primary tasks (drivingrelated, e. g. braking, changing gears, checking the distanceto cars ahead), (ii) secondary tasks (car status functions,e. g. adjusting the navigation system, using safety systems),and (iii) tertiary tasks (comfort and communication, e. g.infotainment and entertainment functions such as operatingcar stereo, checking E-mails, web browsing).
Independent from a later assignment to one of these threecategories, a successful transmission of additional informa-tion, followed by correct user perception of the same, couldonly be guaranteed on utilizing unused capacity. Thereby,the modalities vision, hearing, touch, or other channels couldbe employed; as the former three accounts for almost 99% ofhuman’s information processing capacity [41], others will beleft out in our further considerations. Additionally, it has tobe revealed that the amount of “free space” is dynamicallychanging and dependent from the current driving situation– there is no guarantee for free capacity at all. Since thereis no guarantee, the potential need of a certain capacity fordelivering information on CO2 efficiency without cognitiveoverload must be ensured in another way, e. g. by usingsubliminal/subconscious information transmission.
Sensory modality selection criteria. In principle, any ofthe (three) available sensory modalities could be used for de-livering information, for example on CO2 efficiency, to thedriver. Supplementary to the information on visual displaysprovided above, it has to be taken into account that withthe emergence of head-up displays (HUD) a viable alterna-tive for information delivery was created [39], [4]. It is evi-denced that information presentation via a head-up displayresults in reduced workload and decreased response times[23]. (Since drivers can receive information without takingtheir eyes off the road, distraction is estimated to decrease asthe driver is still primarily focused on the traffic scene, not,e. g., the dashboard instruments.) Unfortunately, the opti-
cal system that projects the information is complicated andits light efficiency is currently low (usage of HUD projectorsin clear sun light is therefore a big issue) [1].
The adaptation of the audio channel in the car is supposedto be sophisticated, e. g. due to several sound sources ap-pearing at the same time (environmental noise, motor sound,voice instructions from navigation systems, “beeps” from apark distance control system, etc.). Furthermore, soundbased feedback can quickly become annoying when disturb-ing other auditory activities like music or conversations [32,p. 131]. Past experience has also shown that drivers do notlike to receive driving instructions from a voice commandsystem [40] and that speech modalities in native or knownlanguages have very high saliency – the latter might dis-tract a driver’s attention from the traffic in situations whereattention to the traffic has top priority [2].
To overcome shortcomings associated with the use of thevisual and auditory interfaces, vibro-tactile interfaces in carshave recently been introduced [30], [27, p. 62], [19], and areaccredited to affect a driver’s cognitive workload to a lesserdegree compared to traditional channels of feedback [35].[5] experimented with tactile signals for blind spot warn-ing to compensate for sensory overload during driving –their results showed that the vibro-tactile feedback improveddrivers’ performance (e. g. for secondary tasks) over that at-tained by using the rear view mirror alone. The CAR2CARconsortium also suggested to apply haptic feedback for colli-sion warnings, traffic optimization, access control, etc. [14].
In some vehicles such systems are already in productionfor several years; automobile manufacturer Citroen has beenintegrating a lane departure warning (LDW) system basedon vibro-tactile notifications via the car seat since 2004 [21],[24, p. 34], Audi’s recent collision warning system providedin the premium class informs the driver in case of collisionrisks with a warning jolt produced by the brake system1,and BMW’s LDW system alerts the driver to potential lanedeparture by providing tactile warnings through (binary)vibrations in the steering wheel2.
Our research interest reported in this work is inferred fromthe before mentioned restrictions on the one, and follows lat-est achievements in vehicular technology on the other hand.
Outline. The rest of this paper is structured as follows. Thenext section discusses the general problem of indicating fuelconsumption to the driver, defines some of the terms as usedin this work, and declares in detail the research hypothesesfollowed in this work. Section 3 describes the setup of theexperiment including the agreements made for the differentcontrol parameters and closes with a detailed insight intothe execution of the field study. Section 4 evaluates recordeddata and discusses the results. Furthermore, it includes anevaluation and interpretation of the post-experimental in-terview conducted on all test participants. Finally, section5 concludes and summarizes the paper.
2. RESEARCH HYPOTHESESDespite many cars (e. g. the Toyota Prius3) have a built-
in feature showing current fuel consumption (which is is di-
1http://www.audiworld.com/news/05/frankfurt/q7/content4.shtml, retrieved Sept. 5, 2010.2http://mobileye.com/sites/mobileye.com/files/SVDO.ME.LDW.pdf, retrieved Sept. 5, 2010.3http://www.toyota.com/prius-hybrid, retrieved August27, 2010.
Proceedings of the Second International Conference on Automotive User Interfaces and Interactive Vehicular Applications (AutomotiveUI 2010), November 11-12, 2010, Pittsburgh, Pennsylvania, USA
93

rectly correlated to C02 emission) on a visual display, andthere are also add-on devices showing fuel economy in real-time (e. g. ScanGauge II [20] or HKS’ CAMP2 engine mon-itoring system [15]), drivers are in general not aware abouttheir actual manner (efficiency) of driving. The reason forthat is that these displays cannot be read due to (i) moreimportant driving related information to be tracked, and (ii)the information carrier (green or red light bulbs, small-sizedLCD displays, etc.) often prevents inattentive perception.
On this account, we propose a vibro-tactile feedback sys-tem integrated into the car seat (either in the safety belt orthe seating), and notifying the driver in a subtle, subliminalway about his/her current CO2 efficiency.
Definition of TermsThe aim pursued in this work was to deliver these notifi-cations without demanding a driver’s attention or “activeawareness”, thus ensuring a full information perception evenin the case that there is no capacity left for transmittingaccessorily information in a traditional way. Following ear-lier considerations by Egermann [8](“..characterized by per-ception without awareness”), Rosen [28] (“..tendency to beinfluenced by stimuli presented below the level of consciousawareness”) or Merikle [22] (“..situations in which unno-ticed stimuli are perceived”) the term “subliminal percep-tion” would be the best for describing this approach. Ingeneral, subliminal perception can be understood as stimulithat might be (i) inaudible to the conscious mind but hear-able and interpretable to the subconscious mind, (ii) imagestransmitted so quick that they are perceived only subcon-sciously, or (iii) pressures or vibration patterns not sensi-ble by our conscious psyche, but noticeable subconsciously.More precise, we have focused our experiments presentedand discussed in this work on the latter option – subliminalnotification using vibration patterns. (The somatic senses,in particular the sense of touch, operate all-over the body atall times, and integrating our experience of the outer worldwith that of ourselves [7].)
Though the terms “subliminal” and “subconscious” havea different meaning in cognition science (subliminal refersto a communication that is not intended to be understoodconsciously, but to influence thoughts, feelings, and/or be-havior at the subconscious level and subconscious refers toprocesses that take place in the human mind of which we arenot totally aware) they are used within this work in a inter-changeable way, as both are, for the purpose of this work,similar enough, referring to the same basic effect namely per-ception beneath the level of perception or not strong enoughto be recognized explicitly.
In this respect, we hypothesize that
(H.i) Subconscious (subliminal) notification of actualCO2 efficiency using a vibro-tactile display installedinto the car would help the driver to improve his/hersubjective valuation of CO2 (or fuel) efficiency, and insuccession, to drive more economic.
(H.ii) The achieved result is independent from theselected setting (tactors either in the safety belt orthe seating) when using two similar designed systems(Figure 1).
(H.iii) Different road segments or driving situations,such as driving intra-urban or on a motorway, or stuck-ing in a traffic jam, can be derived from the run ofthe CO2 emission curve as indicated in Figure 3.
USB/Bluetoothconnection to thetactor controller
Strip/bank of eight tactor elementsTactors selected for noti�cation
Figure 1: Sketch of the two applied settings (i)vibro-tactile seat and (ii) tactile safety belt.
At least (H.i) could be attributed good prospects, as it wasreported, e. g. in [29], that decreasing CO2 emissions can beachieved when accelerating the vehicle more moderate, thusrequiring less “driving energy”. Furthermore, they analyzedthe history of engine rpm and load on the engine map whiledriving economical (defined by shifting-up at lower enginespeeds and using higher load) and found out, that the en-gine operated more often in the range with highest thermalefficiency, which resulted in CO2 emissions reduction. Thesefindings were confirmed by the US Federal government, asthey stated that the way you drive (aggressive vs. sensible)can affect fuel economy by up to 33%4.
3. EXPERIMENTAL DESIGNTo prove our hypotheses we have developed a vibro-tactile
stimulation system subtle notifying the driver about his/hercurrent CO2 emission compared to the mean value as spec-ified in the cars’ registration certificate.
USB dataControl signalsPower
DC-AC converter
Vibro-tactile actuators- Bank of four in the safety belt- Four in the seat (white circles)
OBD-II (CAN-bus) GPS CR4 2x Tactor controller ATC2.0
Figure 2: Overview of the hardware setting as uti-lized for the experimental studies. Both tactile in-terfaces kept installed all the time and independentfrom the setting actually activated in a test run.
The system is built up from (i) a sensing part for gather-ing vehicle specific data from the CAN-bus (ElmScan5 USBELM327 OBD-II interface) as well as vehicle position data(CR4 GPS receiver), (ii) the developed processing software
4http://www.fueleconomy.gov/feg/driveHabits.shtml,retrieved August 25, 2010.
Proceedings of the Second International Conference on Automotive User Interfaces and Interactive Vehicular Applications (AutomotiveUI 2010), November 11-12, 2010, Pittsburgh, Pennsylvania, USA
94

HS
HL
DL
DH
CO
2 em
issi
on [g
/km
](fu
el c
onsu
mpt
ion
[l/10
0km
])
leve
l of t
actil
e no
tific
atio
n
Time t
CO2 efficiency while driving on different road segments
intra-urbancongestionmotorway
signalsmoothing
Figure 3: CO2 emission (fuel consumption) while driving through different road segments (intra-urban withlots of gear shifting, congestion with stop-and-go traffic, motorway driven at rather constant speed).
(C#) running on a standard notebook computer, and (iii)the actuator subsystem for providing vibro-tactile feedbackto the driver (two similar 8-channel tactor controller unitsATC2.0 from EAI with connected C-2 actuators).
Missing standards. Unfortunately, todays application oftactile feedback in vehicles is adversely affected by the cir-cumstance of still missing standards; contrariwise, a stan-dardization of requirements for tactile signals for other do-mains has been passed years ago, e. g. EN 61310-1[11]. (Thisnorm specifies requirements for visual, acoustic and tac-tile methods of indicating safety-related information at thehuman-machine interface. It specifies (i) warning signals in-tended for use in the indication of hazardous situations and(ii) ways of coding visual, acoustic and tactile signals for in-dicators and actuators to facilitate the safe use and monitor-ing of the machinery.) Standards defining general conditionsof vibro-tactile driver stimulation would definitely lead to abroader application of tactile notification systems in cars,and the availability of (cheaper) components and assembliesto experience with new fields of utilization.
For this reason we determined the tactile patterns exper-imentally and based on our previous knowledge on tactileinterfaces.
3.1 Estimation of CO2 EmissionVehicle specific data are obtained in real-time from the
CAN-bus using a OBD-II interface. Unfortunately, the uti-lized device does not provide a variable for determining theCO2 emission directly. But as carbon dioxide (CO2) is di-rectly related to the fuel consumption it could be easily cal-culated. As CO2 emission and fuel consumption are asso-ciated linearly one to the other, we use these two terms inthe remainder of the paper in a interchangeable way whenspeaking from the effect of economically efficient driving.
In elaborate preparatory driving studies we have testedand optimized the algorithm finally used for tactile feedback,trimming the calculation function along the parameters (i)engine rpm (shown as x-axis in Figure 4) and (ii) pressurevalues obtained from (a) the mass air flow (MAF) sensor aswell as with (b) the much more stable values from the throt-tle pedal position (range 0–100%) – as the latter is regardedas a coarse approximation of the former (y-axis). The ex-perimentally determined static regions of different fuel con-
sumption levels as indicated in the fuel consumption map(Figure 4) and used for selecting the different tactile stimu-lation patterns, can be described using quadratic regressionsparametrized according to equations (1) to (3).
QR1: 2.0153× 10⁻⁵ · x2 − 0.0822 · x+ 114.5 (1)
QR2: 4.5222× 10⁻⁵ · x2 − 0.1703 · x+ 214.0 (2)
QR3: 8.8356× 10⁻⁵ · x2 − 0.3016 · x+ 350.1 (3)
To increase system stability, particularly against outliers andduring gear switching operations, the mean of the last threeobtained fuel consumption values was used for feedback cal-culation. Although a low level of effective pressure (or athrottle pedal floored only to a small degree) corresponds tohigh fuel consumption, the region below a pressure of 2bar(or 20% of throttle pedal position) has been left out fromvibro-tactile stimulation in order to avoid negative feedback,punishment or even driver confusion when driving at walk-ing speed or on waiting times at traffic lights.
3.2 Human FactorsA important predetermination fixed before assembling the
two variants of the feedback system was to use a similarsetting with regard to (i) the number of tactors and (ii)their activation in order to ensure comparability.
Tactor Placement: Discrimination ThresholdThe placement or distance of the vibro-tactile elements fol-lows the values derived from the Weinstein Enhanced Sen-sory Test (WEST) conducted in 1968 [37], [16, p. 315]). Af-ter Weinstein, the minimal separation between two pointsneeded to perceive them as separate (=two-point threshold)is 32–34mm on the chest (belly) and 41–43mm on the back.According to a recent study published by van Nes et al. [34]and conducted on a large scale, there is a significant age-dependent increase in the two point discrimination valueswhile no significant gender difference was found. The lattercorresponds to the measures of Weinstein [37] whereuponthe two point touch threshold is almost the same for malesand females. Following this result, the proposed tactile feed-back systems could be used universally across males and fe-males of all age groups when considering threshold distancesclearly distinguishable also by the older.
Proceedings of the Second International Conference on Automotive User Interfaces and Interactive Vehicular Applications (AutomotiveUI 2010), November 11-12, 2010, Pittsburgh, Pennsylvania, USA
95

effe
ctiv
e pr
essu
re [b
ar]
Quadratic regressions, superimposed to fuel consumption map
motor rpm [min-1]1,000
0
16
14
12
10
8
6
4
2
1,500 4,5004,0003,000 3,5002,5002,000
specific diesel consumption [g/kWh]
disharmonic, light (DL)
disharmonic, strong (DS)
harmonic, strong (HS)
harmonic, light (HL)
(QR1) (QR2)(QR3)
Figure 4: Quadratic regressions to distinguish be-tween regions of different fuel (CO2) consumption.The underlying fuel consumption map correspondsto the car engine used in the experimental studies.
Considering the two point touch thresholds applicable forthe seating (43mm), up to eleven tactor elements (4) couldbe embedded per dimension for optimal, non-redundant in-formation transmission. On the other hand, the safety beltwith its small width of about 50mm together with the dis-crimination threshold of 34mm would only allow a bank oftactile elements to be integrated (5). The contact lengthof the safety belt on the chest (from shoulder over chest tobelly) is person dependent and in the area of 500–600mm;therefore a maximum number of about 500mm/34mm ≈ 14tactors could be integrated (and discriminated). However,in preliminary studies we identified that the integration ofa large number of tactors into the safety belt was felt un-pleasant by most of our subjects and furthermore makes thesame rather inflexible.
Following the predeterminations that tactile feedbackshould be perceived subconsciously, we found in an edu-cated guess that the system to be integrated into the safetybelt should be build up from not more than 8 actuators.Ensuring ease of installation we only used four tactors (inboth seat and safety belt) in the applied setting – this lownumber poses no problems as all tactors are activated simul-taneously and showing exactly the same information all thetime (see Figure 1).
500mm [seat width]
43mm [threshold distance]= 11.63 [tactors] (4)
50mm [safety belt width]
34mm [threshold distance]= 1.47 [tactors] (5)
Mechanoreceptors and Stimulation FrequencyHumans can detect vibrations over a rather wide frequencyrange, from about 1Hz to 1, 000Hz [27, p. 91], but they arenot equally sensitive to frequencies over the whole range [16,
p. 314]. Tactile perception in the human skin results fromthe added perception values of four types of mechanorecep-tors, overlapping in their perception range [13], [27, p. 51].Each of the mechanoreceptive systems consists of a receptorand an afferent neuron determining characteristics such asfrequency range or adaptation rate.
For the application of vibration feedback in the here pro-jected aim we suppose a vibro-tactile display to innervatethat type of mechanoreceptor that (in order of importance)(i) adapt very quickly as it used in a real-time setting, (ii)is highly sensitive to vibrations as it is embedded in theseat cushion and has to override both attenuation from thefoam material and vibrations induced from the vehicle mo-tor or the roadbed, (iii) allows for point-like stimulation(high spatial resolution) as vibration elements are only, ac-cording to the two-point touch threshold, a few centimetersapart, and (iv) facilitates both stimulation with comfort-able (harmonic) and annoying (disharmonic) vibrations toimplement gratification and punishment strategies.
From (i) follows the application of Meissner or Paciniancorpuscles, requirement (ii) ranks Pacinian corpuscles first(highest vibration sensitivity in the range 50–220Hz), ac-cording to (iii) Merkel discs should be used, followed byMeissner and Pacinian corpuscles, the last requirement (iv)would only be fulfilled with Pacinian corpuscles as they me-diate threshold for vibrations above 50Hz (vibrations atabout 50Hz are used for releasing spasm of muscles andmassage5, and thus should be felt comfortable by any per-son; below around 15Hz vibrations are very light and canoften be not detected and (unfeasible) slowly adapting re-sponsiveness was revealed for such stimuli [33]). Paciniancorpuscles are the most suitable type of mechanoreceptor tofulfill the needs of the present experimental setting.
Tactile notification patterns. The current CO2 emissionlevel is, as described before, derived from the vehicle-specificmeasurements (OBD interface), the underlying fuel consump-tion map, and the quadratic regression functions. Vibro-tactile output for innervating Pacinian corpuscles is given,based on the determined level of CO2 emission, as one ofthe patterns (6)–(9). The frequency of 50Hz for the har-monic feedback follows the thoughts above, the frequencyattitude for disharmonic driver stimulation was determinedexperimentally where it turned out that a superimpositionof the frequencies 137 and 145Hz (these values correspondsto basic data packets to be sent to the tactor controller)creates uncomfortable vibrations in a intensity like the har-monic ones). All the patterns were designed with respectto similar vibration strength to avoid “active adaptation” ofa person’s driving behavior to get, for example, the gentleharmonic feedback instead of a strong disharmonic one.
HS: 50Hz, 500ms (on), 7, 500ms (pause) (6)
HL: 50Hz, 500ms (on), 5, 000ms (pause) (7)
DL: 137 + 145Hz, 500ms (on), 5, 000ms (pause) (8)
DS: 137 + 145Hz, 500ms (on), 2, 500ms (pause) (9)
3.3 Field TestTo prove our hypotheses of different CO2 emissions while
driving with and without assistive technology, real drivingtests were conducted. The field study was carried out in
5http://www.energeta.ch/produkte/produkt_vibration_plate.htm, retrieved June 12, 2010.
Proceedings of the Second International Conference on Automotive User Interfaces and Interactive Vehicular Applications (AutomotiveUI 2010), November 11-12, 2010, Pittsburgh, Pennsylvania, USA
96

Figure 5: Hardware setting as used for the experimental studies. The vibro-tactile seat and safety beltinterface with protective covers partly opened (1) and all closed (2), test person sitting in the car with bothtypes of interfaces attached (3), tactile controller and data processing notebook in the back seat (4).
May/June 2010 with 13 participants, all men with a validdriving license in the age range 22 to 29 years with on aver-age 5, 000 to 15, 000 kilometers traveled per year (one persongenerally uses public transportation, and thus drives a carfor less than 5, 000km/year, another one uses his car formore than 15, 000km/year). As it was already expected inan early stage of experiment design that tests will be con-ducted in real traffic, with other road users maybe affectingtest participants in different ways, it was very importantto ensure similar traffic conditions (volume of traffic, etc.)as good as possible. Taken this into account, we agreed toprocess the experiments on two consecutive Saturdays from9AM to 6PM each.
route sections 1, 3
route sections 2, 4UPHILL
DOWNHILL
URBAN
URBAN MOTORWAY
URBAN
Figure 6: Circuit driven in the experiments withannotated regions. Colored, overlayed curves repre-sent GPS tracks for several test persons.
Test persons were selected in order to exclude (i) age de-pendency for the perception of vibration stimuli (as statedabove), and (ii) gender dependency for evidenced reactiontime differences between female and male [27, pp. 228] aswell as to ensure similar tactile perception of all actuatorsembedded into the safety belt. (The latter could be guar-anteed if the safety belt lies flat on chest and belly, whichactually would not be the case when having female drivers.)All test persons were students – not a single one was withour department – and received a 10 Euro petrol voucher as
compensation for their effort of about 1 1/2 hours (net driv-ing time of 43m:52s±02m:33s). Each test participant hadto drive two rounds on a circuit course under real condi-tions and without a break in-between. The short briefingbefore departure addressed the following issues (i) the routeto be driven (by help of a Google map printout; a navigationsystem has not been used), (ii) the possible appearance ofvibrations via one of the two interfaces (no additional infor-mation was given, neither to the purpose of the interface norto the meaning of vibrations), and (iii) the instruction todrive as natural as possible. Giving this information, driverswere not aware of the addressed research question.
Data evaluation later revealed to remove data sets fromthree attendees due to missing (recording of two data setswas interrupted for a while) or noisy (GPS trace for one testrun was useless due to a covered GPS receiver) data so thatthe final analysis was conducted using records from ten testpersons (five for the seat, five for the safety belt interface).
Route SpecificationThe route (see Figure 6) with a length of 24km was se-lected in order to cover as many as possible different roadand driving conditions (rural road as well as urban area with50km/h and 70km/h limits, highway with a maximum speedof 100km/h, and motorway section with 130km/h speedlimit) and segments to be driven with varying motor load(higher revolution speed and motor power uphill, constantmotor load in urban and even sections, higher revolutionplus motor brake downhill). The circuit, driven twice pertest person, was further divided into two almost equal sub-sections, thus yielding in a total of four subsections. Eachof these sections was driven once with, and the second timewithout technology assistance (=baseline) while the type ofinterface, seat or safety belt, was retained unchanged pertest driver. The assignment of variation was made, accord-ing to Table 2, quasi-random before departure to ensure sim-ilar distribution over the small number of test persons.
For further improvement of the comparability of test re-sults the following restriction has been taken into accountat the time of experiment conduction. Both vibro-tactilefeedback systems were installed in the car all the time; how-ever, in order to reduce environmental factors to a minimum,vibro-tactile notifications were given – without test partici-pants knowledge – only using one interface per day (vibra-tion seat on the first, tactile safety belt on the second).
Proceedings of the Second International Conference on Automotive User Interfaces and Interactive Vehicular Applications (AutomotiveUI 2010), November 11-12, 2010, Pittsburgh, Pennsylvania, USA
97

INPUT (OBD-II, GPS) OUTPUT (ATC2)Engine Vehicle Air Flow Throttle Timestamp GPS Fuel Tactilerpm Speed Rate Position Position Consumption Pattern[r/min] [km/h] [g/s] [0..100%] date/time NMEA (WGS84) [calculated] see Fig.32,666 118 44.10 16.5 Sat Jun 05 2010 11:26:35 $GPRMC,092635.. 19.23 DS2,645 117 26.50 15.3 Sat Jun 05 2010 11:26:36 $GPRMC,092636.. 19.30 DS2,629 116 30.20 18.4 Sat Jun 05 2010 11:26:37 $GPRMC,092637.. 19.26 DS... ... ... ... ... ... ... ...... ... ... ... ... ... ... ...1,025 52 17.98 32.9 Sat Jun 05 2010 11:44:22 $GPRMC,094422.. 4.03 HL
Table 1: Vehicle specific characteristics as scanned and processed in real time to generate tactile outputcorresponding to the current fuel consumption level.
Table 1 gives an overview of recorded and processed ve-hicle specific parameters (scanned in real time using a Elm-Scan5 USB ELM327 OBD-II interface and a CR4 GPS re-ceiver) as well as the calculated fuel consumption rate andthe generated tactile output (four tactile elements per sys-tem, each driven by a EAI ATC2.0 controller).
Tactile Setting S1 S2 S3(=S1) S4(=S2)Seat Interface VTS VTS – –Seat Interface VTS – – VTSSeat Interface – VTS VTS –Seat Interface – – VTS VTSSafety Belt VTS VTS – –Safety Belt VTS – – VTSSafety Belt – VTS VTS –Safety Belt – – VTS VTS
Table 2: All possible variation patterns for tworounds of driving and tactor activation in the twotactile settings (VTS. . . vibro-tactile stimulation).
4. EVALUATION AND DISCUSSIONThe vehicle actually used for all of the experiments was an
Audi A6 Avant, 1.9TDi with a engine performance of 81kW .According to the car type certificate, the fuel consumptionis on average (for mixed traffic) 6.5l/100km. The actualconsumption calculated for the conducted studies is given,for the entire experiment without preparatory studies (fullrefill before and after the experiments), in equation (10). Averification of the fuel consumption rate as derived from thescanned CAN bus data resulted in a quite similar value.
29.71l · 100km
464.20km= 6.401l/100km (10)
Compared to the mean value of 6.401l/100km, the av-erage fuel consumption for the different sub-experimentsis 6.31l/100km for the baseline fraction and 6.22l/100km(98.6%) for vibro-tactile notification on fuel economy us-ing the seat interface (day one), and 6.81l/100km for thebaseline segment with 6.26l/100km (91.9%) when using thetactor elements in the safety belt (day two)(Figure 7, leftimage). The entire experiment was, as stated above, con-ducted on two Saturdays to ensure similar volume of traffic.All experiments using the seat interface were processed onthe first day while experiments with the safety belt interfacewere conducted on the second day. This should guaranteecomparability of segments driven with and without applica-tion of ambient technology, at least per interface type.
The large difference in the mean fuel consumption for thetwo baseline segments (which was expected to be constant)
most likely results from changed environmental conditions.On the first day it was dry with scattered showers and out-side temperatures in the range of 18 ◦C, while it was sunnyand hot with temperatures near 30 ◦C on the second day.The air conditioning system of the car was turned off mostthe time on the first day but was heavily used on the secondday (at least in the afternoon), and causing additional fuelconsumption of up to 0.45–0.62l/100km [31], [3, p. 64]. Itcannot be substantiated whether or not a deactivated ACCwould have caused an additional reduction of fuel consump-tion in case of stimulation via the safety belt on day two.
Fuel efficiency for the vibro-tactile seat interface. As-suming a normal distributed population and, for the gen-eral case, an unknown standard deviation sd, we can ap-ply bivariate, inductive data analysis using the (two-sided)Student’s t-test [26] for verifying data sets against the nullhypothesis H0: “the mean of the two control samples X, Yis equal” (alternative hypothesis H1: “the mean of the twocontrol samples is different”). Sample X (n=5) correspondsto the aggregated CO2 emission values for the vibro-tactileseat interface (system active); sample Y (n=5) correspondsto CO2 values for the deactivated seat interface (baseline).
According to the result gained in equation (12) (d = −0.09,sd = 0.472, t = −0.4263), the null hypothesis (assistive tech-nology is without any effect) cannot be declined (5% levelof significance). The unidirectional alternative hypothesisthat subliminal vibro-tactile feedback reduces the amountof CO2 emission is also not significant (at least not due tothe small sample size of n = 5).
t(1−α;n−1) = t(0.95;4) = 2.776 (11)
|t| < t0.95;4 ⇒ 0.426 < 2.776 (12)
Efficient driving initiated by the vibrating safety belt.The results for subliminal notification via the safety beltare quite different. X and Y samples as well as the statednull and alternative hypotheses are similar to the formercase (seat interface), but now tested for the tactile interfaceembedded into the safety belt. The mean deviation of mea-surement values calculates to d = −0.55, standard deviationfollows to sd = 0.47, and finally t = −4.841.
t(1−α;n−1) = t(0.99;4) = 4.604 (13)
|t| > t0.99;4 ⇒ 4.841 > 4.604 (14)
From (14) follows that H0 (“expected values of CO2 emis-sion with and without vibro-tactile feedback in the safetybelt are equal”) can be declined to a level of significance of
Proceedings of the Second International Conference on Automotive User Interfaces and Interactive Vehicular Applications (AutomotiveUI 2010), November 11-12, 2010, Pittsburgh, Pennsylvania, USA
98

0
25
30
15
20
5
10
mas
s air
�ow
(MAF
) [g
x 10 3 ]
driven distance [km]0.0 10.8510.08.06.04.02.0
noti�cation system onnoti�cation system o�
5.6
7.2
6.6
6.8
7.0
6.2
6.4
5.8
6.0fuel
con
sum
ptio
n [l/
100k
m]
Assistive technology acti-vated right from the start
Assistive technology acti-vated from second section
6.30
6.79
noti�cation system onnoti�cation system o�
6.186.33
6.00
6.25
6.50
6.75
7.00fu
el c
onsu
mpt
ion
[l/10
0km
]
seat safety belt
6.225(98.6%)
6.259(91.9%)
mean fuel consumption
disabled
assistive technologyenabled
6.313
6.807
interface type
Figure 7: Differences in fuel consumption with and without assistive technology (left). Mass air flow (MAF)as an indicator for fuel consumption in relation to the driven distance (one driver, section one, safety beltinterface) (center). Both lower variance and fuel consumption can be observed for early tactile feedbackcompared to an initially drive without assistive technology (right).
α = 0.01. Furthermore, it follows that the unidirectionalalternative H1 (“subliminal notification reduces CO2 emis-sion”) is significant.
Influence on Feedback Patterns and Placement OptionsHarmonic versus disharmonic feedback. The two typesof feedback patterns (gratification, punishment) have beenestablished according to findings from related work and ourown preparatory studies, and modified to met our require-ments. Test drivers were not affected by the tactile feedback(neither by harmonic nor by disharmonic vibrations) as allof them assured in the post-experiment interview, thereforeit can be assumed that they did not (actively) tried to altertheir driving behavior e. g. to get the harmonic feedback oravoid punishment. Furthermore, we have found no evidencethat a behavior change would have been caused due to thefact that the disharmonic feedback was stronger (accordingto the knowledge that people will drive slower if their carstarts to rattle strongly, e. g. on increasing speed).
So far we have also no experience what the described tac-tile feedback (if any) would cause on longer runs. Questionslike “is the harmonic pattern still pleasant when experiencedfor several hours?” or “is disharmonic feedback ignored aftersome time of experience, e.g. due to a decreased perceptionthreshold” have still to be answered in further studies.
Different perception for seat and safety belt interface.According to the results as presented above the seat inter-face has less impact on CO2 emission savings compared tothe safety belt interface. Several reasons can be envisagedto account for this. From our own experience gained in thepreparatory studies as well as from statements given by thetest participants we discovered that vibrations delivered viathe tactile interface in the seating tend to wear out ratherquickly, while the tactors in the safety belt were clearly no-ticeable all time long. One reason for that could be theintegration of tactors into the foam mat placed on top ofthe seat (see Figure 5) which attenuates vibrations so thatthey were felt not very strong even with maximum vibrationamplitude. Another reason is the high susceptibility to othervibrations coming up from roadbed or the engine, and po-tentially having much higher vibration maxima. This effectis anticipated on the second interface mounted on the safetybelt as this is placed orthogonal to the emerging vibrations.
Influence on the driving sequence. Figure 7 (right image)shows that the fuel consumption is lower for route sectionsdriven with assistive technology compared to that drivenwithout (dark gray against light gray). But the driving se-quence also posed, different than expected, a distinction inthe fuel consumption on route segment basis. It is lowerwhen the technology was activated in the first segment (sec-tion 1, 3) compared to the tests were the tactile feedbacksystem was activated in the second segments (sections 2, 4).Both trial groups were equal-sized; however, no empiricalevidence has been achieved for this result.
Post-experiment QuestionnaireAfter each experiment test drivers were asked in open discus-sions about their assessment on driving economy as well ason their thoughts about fuel conserving driving. None of thetest persons indicated the experimental setting as annoyingor distracting and 100% stated that they were not impairedfrom the modified safety belt or the foam mat placed ontothe seat pan. Two persons perceived no vibrations at all(consciously), another five explicitly stated that they havenoticed vibration patterns (two persons on the seat, the restvia the safety belt) but without having any idea about theirmeaning. Of particular interest are the results obtained fromthe evaluation of the following questions.
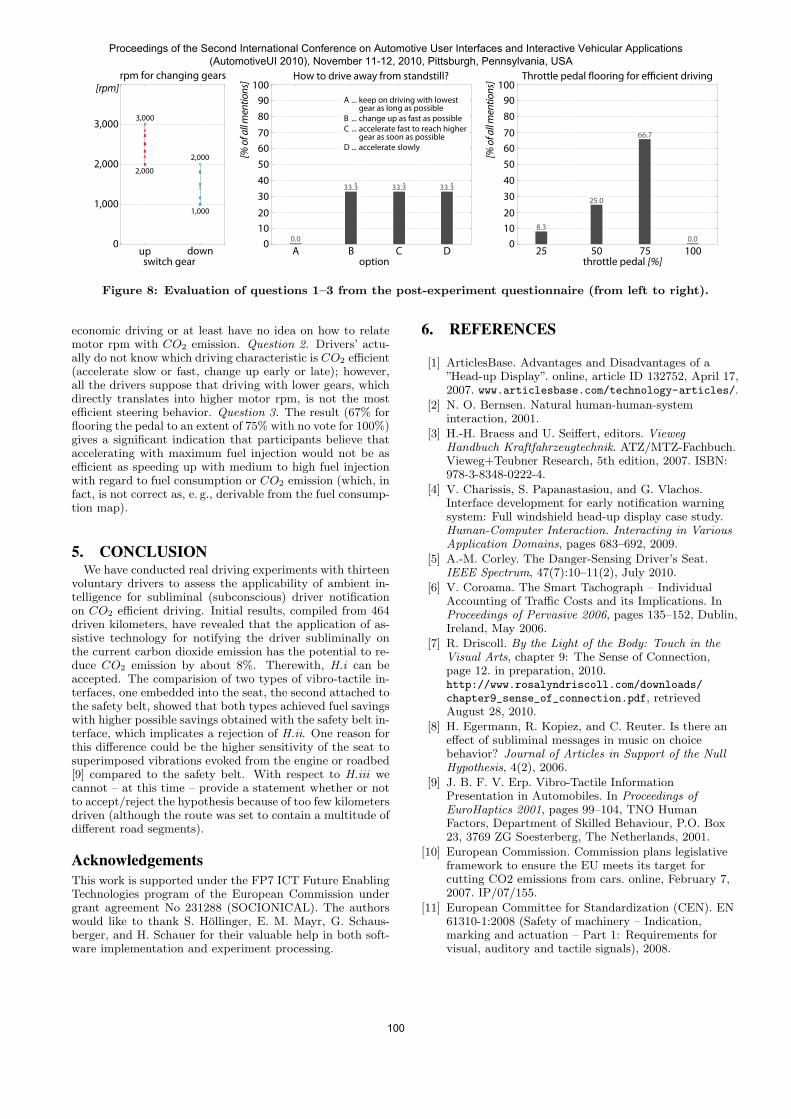
Question 1: “In order to drive CO2 emission efficient, atwhich engine rpm’s would you change up/down?” (giventhe motor rotation speed (1, 900rpm) for maximum enginetorque of the car used in the experiments)(Answers: two values, one for changing up, the second forchanging down)
Question 2: “Which driving behavior is the most efficientto drive away from standstill (e. g. on a traffic light con-trolled crossing)?”(Answers: One or more cross marks at option A, B, C, orD as detailed in Figure 8)
Question 3: “To what extent would you floor the throttlepedal in order to accelerate fuel or CO2 efficient?”(Answer: Cross mark either at 25%, 50%, 75%, or 100%)
The evaluation of the questionnaires (see Figure 8) producedthe following results. Question 1. The variation for bothchanging up and down is with 1, 000rpm rather high, allow-ing for the conclusion that test drivers’ are not aware about
Proceedings of the Second International Conference on Automotive User Interfaces and Interactive Vehicular Applications (AutomotiveUI 2010), November 11-12, 2010, Pittsburgh, Pennsylvania, USA
99
0
1,000
2,000
3,000
[rpm]
up
rpm for changing gears
down
2,000
1,000
3,000
2,000xx
xxx
xx
xxx
xx
xx
xxx
xxxxxxx
switch gear
0
8090
100
506070
3040
1020
[% o
f all m
entio
ns] How to drive away from standstill?
A B C D0.0
33.3.
33.3.
33.3.
A ... keep on driving with lowest gear as long as possibleB ... change up as fast as possibleC ... accelerate fast to reach higher gear as soon as possibleD ... accelerate slowly
option
0
8090
100
506070
3040
1020
[% o
f all m
entio
ns]
throttle pedal [%]
Throttle pedal �ooring for e�cient driving
25 50 75 100
25.0
8.3
66.7
0.0
Figure 8: Evaluation of questions 1–3 from the post-experiment questionnaire (from left to right).
economic driving or at least have no idea on how to relatemotor rpm with CO2 emission. Question 2. Drivers’ actu-ally do not know which driving characteristic is CO2 efficient(accelerate slow or fast, change up early or late); however,all the drivers suppose that driving with lower gears, whichdirectly translates into higher motor rpm, is not the mostefficient steering behavior. Question 3. The result (67% forflooring the pedal to an extent of 75% with no vote for 100%)gives a significant indication that participants believe thataccelerating with maximum fuel injection would not be asefficient as speeding up with medium to high fuel injectionwith regard to fuel consumption or CO2 emission (which, infact, is not correct as, e. g., derivable from the fuel consump-tion map).
5. CONCLUSIONWe have conducted real driving experiments with thirteen
voluntary drivers to assess the applicability of ambient in-telligence for subliminal (subconscious) driver notificationon CO2 efficient driving. Initial results, compiled from 464driven kilometers, have revealed that the application of as-sistive technology for notifying the driver subliminally onthe current carbon dioxide emission has the potential to re-duce CO2 emission by about 8%. Therewith, H.i can beaccepted. The comparision of two types of vibro-tactile in-terfaces, one embedded into the seat, the second attached tothe safety belt, showed that both types achieved fuel savingswith higher possible savings obtained with the safety belt in-terface, which implicates a rejection of H.ii. One reason forthis difference could be the higher sensitivity of the seat tosuperimposed vibrations evoked from the engine or roadbed[9] compared to the safety belt. With respect to H.iii wecannot – at this time – provide a statement whether or notto accept/reject the hypothesis because of too few kilometersdriven (although the route was set to contain a multitude ofdifferent road segments).
AcknowledgementsThis work is supported under the FP7 ICT Future EnablingTechnologies program of the European Commission undergrant agreement No 231288 (SOCIONICAL). The authorswould like to thank S. Hollinger, E. M. Mayr, G. Schaus-berger, and H. Schauer for their valuable help in both soft-ware implementation and experiment processing.
6. REFERENCES
[1] ArticlesBase. Advantages and Disadvantages of a”Head-up Display”. online, article ID 132752, April 17,2007. www.articlesbase.com/technology-articles/.
[2] N. O. Bernsen. Natural human-human-systeminteraction, 2001.
[3] H.-H. Braess and U. Seiffert, editors. ViewegHandbuch Kraftfahrzeugtechnik. ATZ/MTZ-Fachbuch.Vieweg+Teubner Research, 5th edition, 2007. ISBN:978-3-8348-0222-4.
[4] V. Charissis, S. Papanastasiou, and G. Vlachos.Interface development for early notification warningsystem: Full windshield head-up display case study.Human-Computer Interaction. Interacting in VariousApplication Domains, pages 683–692, 2009.
[5] A.-M. Corley. The Danger-Sensing Driver’s Seat.IEEE Spectrum, 47(7):10–11(2), July 2010.
[6] V. Coroama. The Smart Tachograph – IndividualAccounting of Traffic Costs and its Implications. InProceedings of Pervasive 2006, pages 135–152, Dublin,Ireland, May 2006.
[7] R. Driscoll. By the Light of the Body: Touch in theVisual Arts, chapter 9: The Sense of Connection,page 12. in preparation, 2010.http://www.rosalyndriscoll.com/downloads/chapter9_sense_of_connection.pdf, retrievedAugust 28, 2010.
[8] H. Egermann, R. Kopiez, and C. Reuter. Is there aneffect of subliminal messages in music on choicebehavior? Journal of Articles in Support of the NullHypothesis, 4(2), 2006.
[9] J. B. F. V. Erp. Vibro-Tactile InformationPresentation in Automobiles. In Proceedings ofEuroHaptics 2001, pages 99–104, TNO HumanFactors, Department of Skilled Behaviour, P.O. Box23, 3769 ZG Soesterberg, The Netherlands, 2001.
[10] European Commission. Commission plans legislativeframework to ensure the EU meets its target forcutting CO2 emissions from cars. online, February 7,2007. IP/07/155.
[11] European Committee for Standardization (CEN). EN61310-1:2008 (Safety of machinery – Indication,marking and actuation – Part 1: Requirements forvisual, auditory and tactile signals), 2008.
Proceedings of the Second International Conference on Automotive User Interfaces and Interactive Vehicular Applications (AutomotiveUI 2010), November 11-12, 2010, Pittsburgh, Pennsylvania, USA
100

[12] European Communities. Directive 1999/94/ECrelating to the availability of consumer information onfuel economy and CO2 emissions in respect of themarketing of new passenger cars. Official Journal ofthe European Community L 12/16, January 18, 2000.http://eur-lex.europa.eu/LexUriServ/site/en/oj/2000/l_012/l_01220000118en00160023.pdf,retrieved June 17, 2010.
[13] G. Fryer. Distinguishing Characteristics of ThoracicMedial Paraspinal Structures Determined as Abnormalby Palpation. PhD thesis, Victoria University, SchoolOf Health Science, Faculty of Health, Engineering andScience, February 2007.
[14] Heyms et al. CAR 2 CAR Communication ConsortiumManifesto: Overview of the C2C-CC System, Version1.1. Technical report, August 28, 2007.
[15] HKS. Computerized Automobile Multi Player(CAMP2). online, retrieved August 25, 2010.http://www.hksusa.com/info/?id=3474.
[16] Jeremy M. Wolfe et al. Sensation and Perception.Sinauer Associates, Inc., 2nd edition, October 17 2008.ISBN: 978-0-87893-953-4.
[17] D. Kern, P. Holleis, and A. Schmidt. Reducing fuelconsumption by providing in-situ feedback on theimpact of current driving. In Adjunct Proceedings ofUbicomp 2008, Seoul, Korea, pages 18–19, 2008.
[18] D. Kern and A. Schmidt. Design space fordriver-based automotive user interfaces. In Proceedingsof the 1st International Conference on AutomotiveUser Interfaces and Interactive Vehicular Applications(AutomotiveUI ’09), pages 3–10. ACM, 2009.
[19] J. Lee, H. Kim, Ryu, J., and J. Woo. Preliminary UserStudies on Tactile Interface for Telematics Services.IEEE Intelligent Transportation Systems Conference(ITSC 2007), pages 929–933, September 30 – October3, 2007. ISBN: 978-1-4244-1396-6.
[20] Linear Logic LLC. ScanGauge II AutomotiveComputer. online, retrieved August 25, 2010.http://www.scangauge.com/.
[21] J. McCormick. Crash Avoidance Goes High-Tech.Automotive Industries, 184(11):36–39, November 2004.
[22] P. Merikle. Encyclopedia of Psychology, volume 7,chapter Subliminal Perception, pages 497–499. Ox,2000.
[23] K. Nakamura, J. Inada, M. Kakizaki, T. Fujikawa,S. Kasiwada, H. Ando, and N. Kawahara. WindshieldDisplay for Safe and Comfortable Driving. SAE WorldCongress on Intelligent Vehicle Initiative (IVI)Technology 2005, Advanced Controls and NavigationSystems, 2005.
[24] J. Noren. Warning systems design in a glass cockpitenvironment. Liu-iei-tek-a–08/00335–se, Departmentfor Management and Engineering, University ofLinkoping, January 2008.
[25] B. Peacock and W. Karwowski, editors. Automotiveergnomics. Taylor and Francis, London, 1993. ISBN:0748400052.
[26] G. Reiter and W. G. Matthaus. Marktforschung undDatenanalyse mit EXCEL. OldenbourgWissenschaftsverlag GmbH, 2000. ISBN:3-486-25394-8.
[27] A. Riener. Sensor-Actuator Supported ImplicitInteraction in Driver Assistance Systems.
Vieweg+Teubner Research, Wiesbaden, Germany, 1st(January 14, 2010) edition, January 2010. ISBN-13:978-3-8348-0963-6.
[28] D. L. Rosen and S. N. Singh. An investigation ofsubliminal embed effect on multiple measures ofadvertising effectiveness. Psychology and Marketing,9(2):157–173, 1992.
[29] A. Saito, S. Ueki, Y. Nagatomi, N. Sawazu, andY. Takada. Analysis of CO2 Reduction Mechanism byEco-Driving with Light Duty Diesel Freight Vehicle inReal Traffic Conditions. In Proceedings of SAE WorldCongress & Exhibition, Detroit, MI, USA, April 2008.
[30] C. Tan, F. Delbressine, and M. Rauterberg. Vehicleseat design: state of the art and recent development.In In Proceedings of World Engineering Congress(WEC07), Penang, Malaysia, page 10, August 2007.
[31] Technik und Umwelt, Emmen. Klimaanlage im Auto –Luxus oder Sicherheit. Technical Report 3124, TouringClub Suisse, July 2005. pp. 3.
[32] M. Toennis, V. Broy, and G. Klinker. A Survey ofChallenges Related to the Design of 3D UserInterfaces for Car Drivers. In Proceedings of the 3DUser Interfaces (3DUI’06), pages 127–134,Washington, DC, USA, 2006. IEEE Computer Society.
[33] S. Toma and Y. Nakajima. Response characteristics ofcutaneous mechanoreceptors to vibratory stimuli inhuman glabrous skin. Neuroscience Letters,195(1):61–63, 1995.
[34] S. van Nes, C. Faber, R. Hamers, O. Harschnitz,M. Bakkers, M. Hermans, R. Meijer, P. van Doorn,and I. Merkies. Revising two-point discriminationassessment in normal aging and in patients withpolyneuropathies. Journal of Neurology, Neurosurgery& Psychiatry, 79(7):832–834, 2008.
[35] A. Varhelyi. Speed management via in-car devices:effects, implications, perspectives. Transportation,29(3):237–252, August 2002.
[36] B. Wallace. External-to-Vehicle Driver Distraction.Research report, Scottish Executive, Human FactorsAnalysts Ltd. (HFAL), August 1993. last modifiedMarch 31, 2006.
[37] S. Weinstein. Intensive and extensive aspects of tactilesensitivity as a function of body part, sex, andlaterality. In D. Kenshalo, editor, The skin senses,pages 195–218, Springfield, IL, 1968.
[38] W. W. Wierwille and L. Tijerina. Vision in Vehicles,volume V, chapter An analysis of driving accidentnarratives as a means of determining problems causedby in-vehicle visual allocation and visual workload,pages 79–86. Elsevier Science B.V., 1996.
[39] M. Wittmann, M. Kiss, P. Gugg, A. Steffen, M. Fink,E. Poppel, and H. Kamiya. Effects of display positionof a visual in-vehicle task on simulated driving.Applied Ergonomics, 37(2):187–199, 2006.
[40] M. Wolf, A. Weimerskirch, and T. Wollinger. State ofthe art: Embedding security in vehicles. EURASIPJournal on Embedded Systems, 2007:16, 2007. ArticleID 74706.
[41] M. Zimmermann. Human physiology, chapter Thenervous system in the context of information theory,pages 166–173. Springer-Verlag Berlin, Germany, 2ndedition, 1989.
Proceedings of the Second International Conference on Automotive User Interfaces and Interactive Vehicular Applications (AutomotiveUI 2010), November 11-12, 2010, Pittsburgh, Pennsylvania, USA
101