tactile suppression of displacement
TRANSCRIPT
Exp Brain Res (2010) 206:299–310
DOI 10.1007/s00221-010-2407-zRESEARCH ARTICLE
Tactile suppression of displacement
Mounia Ziat · Vincent Hayward · C. Elaine Chapman · Marc O. Ernst · Charles Lenay
Received: 4 March 2010 / Accepted: 27 August 2010 / Published online: 15 September 2010© Springer-Verlag 2010
Abstract In vision, the discovery of the phenomenon ofsaccadic suppression of displacement has made importantcontributions to the understanding of the stable world prob-lem. Here, we report a similar phenomenon in the tactilemodality. When scanning a single Braille dot with twoWngers of the same hand, participants were asked to decidewhether the dot was stationary or whether it was displacedfrom one location to another. The stimulus was producedby refreshable Braille devices that have dots that can beswiftly raised and recessed. In some conditions, the dot wasstationary. In others, a displacement was created by moni-toring the participant’s Wnger position and by switching thedot activation when it was not touched by either Wnger. Thedot displacement was of either 2.5 mm or 5 mm. We foundthat in certain cases, displaced dots were felt to be stationary.If the displacement was orthogonal to the Wnger movements,
tactile suppression occurred eVectively when it was of2.5 mm, but when the displacement was of 5 mm, the par-ticipants easily detected it. If the displacement was medial–lateral, the suppression eVect occurred as well, but lessoften when the apparent movement of the dot opposed themovement of the Wnger. In such cases, the stimulusappeared sooner than when the brain could predict it fromWnger movement, supporting a predictive rather than a post-dictive diVerential processing hypothesis.
Keywords Tactile suppression eVects · Stable world problem · Suppression of displacement · Tactile perception
Introduction
In all sensing modalities, individuals have the ability toexperience a continuous and stable world in spite of the factthat stimulation changes constantly. The problem faced bythe haptic system in order to provide perceptual stability isanalogous to the problem faced by the visual system. In thetwo cases, the primary sensory input arises from sensitivesurfaces that can be displaced motorically with respect tothe outside world. As Poincaré pointed out (1908), self-generated movement has the beneWt of enlarging the por-tion of the world that is accessible to the senses, but has thedownside that it introduces a fundamental ambiguity: It iseasy to construct stimuli that are identical when generatedby one own movements or due to the movement of anexternal agent. This problem has intrigued many scientists:Descartes, Purkinje, Helmholtz, Von Holtz and Mittelstaedt,Sperry, and others; see (Bays and Husain 2007) for a briefreview. More recently, Wertheim (1994) and O’Regan andNoë (2001) discussed the analogy between vision and touch
M. Ziat (&)Psychology Department, Wilfrid Laurier University, Waterloo, Canadae-mail: [email protected]
V. HaywardInstitut des Systèmes Intelligents et de Robotique, UPMC Univ Paris 06, UMR 7222, Paris, France
C. E. ChapmanGroupe de recherche sur le système nerveux central, École de réadaptation et de Physiologie, Université de Montréal, Montréal, Canada
M. O. ErnstMax-Planck-Institut für biologische Kybernetik, Tübingen, Germany
C. LenayTechnologie et Sciences de l’Homme, Université de Technologie de Compiègne, EA 2223 Costech, Compiègne, France
123
300 Exp Brain Res (2010) 206:299–310
from the viewpoint of perceptual stability. The general ideais that an organism needs to be aware of its own movementsto resolve ambiguity and that assumptions must be madeabout the world, such as rigidity and immobility, to succeedin perceiving a stable world (Wexler et al. 2001). Someauthors investigated other aspects of the somatosensory sta-bility problem; one of them is object size perception instatic contact with the skin for diVerent body regions(Taylor-Clarke et al. 2004). Other studies contributed toidentifying elements of stable tactile representations in thesomatosensory cortex in the case of a passive hand(Fitzgerald et al. 2006; Haggard 2006).
While surveying a scene, a speciWc instance of the stabil-ity problem is to decide that particular features of the exter-nal world remain at Wxed locations, or conversely, that theymove. This question is illustrated when considering the actof reading Braille. The Braille code is made of patterns ofsix closely packed raised dots. It is read by scanning linesof characters, often with two or more Wngertips scanningover the same characters (Millar 1997). Suppose that theleading Wnger reads the single dot of the letter “a”. The ner-vous system must then decide, despite noise in the sensingand the motor systems, that it is the same dot that is read bythe trailing Wnger. Of course, there should be a strong priorassumption that the dot is immobile while being intangiblebetween the two Wngers, but the nervous system must nev-ertheless make a decision despite sensing and motor uncer-tainty. A similar problem arises when actively touching afeature with one Wnger and then returning to it with thesame Wnger, but this case, the sensorimotor task is presum-ably subject to uncertainty to a lesser extent than in the two-Wnger case.
In vision, a well-known eVect is the phenomenon ofsaccadic suppression of displacement (SSD), where a smallchange in the location of a target occurring during a sac-cade or during a blink is not consciously experienced(Bridgeman et al. 1975; Deubel et al. 2004). We thereforewondered whether a parallel eVect occurs in touch since,like in vision, a small, Wxed object in the world gives riseduring scanning to a trajectory of sensory inputs distributedin time and space across the receptor surface. Haptic behav-ior may be compared to that of an eye Wxating a target, los-ing the target due to a blink or a saccade to another locationand then returning to it. In the single-digit case, the analogyis appealing, yet cannot be very strict since there is no“peripheral touch”, and since touch normally operates byscanning, not by Wxating. In the two-digit case, the analogycould still be drawn, but the return to the same target iseVected by a diVerent Wnger. It would be like having multi-ple fovea (Hatwell 1986). Multi-digit haptic behavior couldhave points of comparison with peripheral vision.
In two experiments, we investigated what could becalled tactile suppression of displacement, where a change
in location of a stimulus scanned under two diVerent Wnger-tips (the index and the middle Wngers in the present study)is not perceived during the gap between the two Wngers; thestimulus, instead, is felt to be stationary. To evaluate thiseVect, we constructed an apparatus able to displace a tactiledot, that is, a small, yet easily detectable tactile feature, dur-ing the time interval beginning when the dot leaves the con-tact with one Wnger and ending when it makes contact againwith the same or another Wnger.
As reported by Bridgeman et al. (1975), saccadic sup-pression of displacement yields a strong reduction in sensi-tivity (by three to four log units) in the detection of target’sdisplacement during saccades when the displacementoccurs shortly before or during a saccade. That a similarsuppression of sensitivity occurs also around an eyeblink,not only during a saccade, suggests that similar processesmight at play (Volkmann et al. 1980; Stevenson et al. 1986;Deubel et al. 2004). The interruption of sight during a blinkis similar to the interruption of touch when a feature is inthe gap between the two Wngers during scanning.
Related eVects
To our knowledge, tactile suppression of displacementhas not been described before, although several authorsreported related eVects. These eVects are generally betterdescribed by stimulus suppression rather than relocation. Invision, Xash suppression is an eVect where a Xash of lightdelivered during a saccade is not seen (Dodge 1900; Wal-lach and Lewis 1966; Matin 1974). Tactile suppression hasbeen reported to occur at diVerent sites of the body when aweak electrical stimulus is applied. Results showed that thedegree of inability to detect the presence of the stimuli dur-ing movement depends on its location (Williams et al.1998)and on intensity (Williams and Chapman 2000) andoccurs during passive or active touch (Williams andChapman 2002; Chapman and Beauchamp 2006). Tactilesuppression was also found for tactile stimuli moving laterallyon the index for active and passive conditions (Vitello et al.2006). In the active condition, participants were asked tomove their arm in a given direction while a tactile stimuluswas applied to the Wngertip. Results showed that there is areduction of sensitivity during the active condition. Thisis in accordance with several other results that showedthat tactile sensitivity decreases during movement (Dyhre-Poulson 1978; Ghez and Lenzi 1971; Chapman 1994).
Saccadic or Xash suppression is quite distinct from avariety of other eVects that can be classiWed under the col-lective name of change blindness (or change deafness, oreven change numbness), whereby a change in a scene is notseen (or heard or felt) if that change occurs during a disrup-tion (Rensink et al. 1997; Vitevitch 2003; Gallace et al.
123
Exp Brain Res (2010) 206:299–310 301
2006). In “change x-ness”, the conditions are such thatmassive changes in the stimulation are blocked from reach-ing the conscious experience as the result of an attentionaleVect, eliciting considerable surprise once the participantsare subsequently made aware of them. In contrast, with dis-placement suppression studied here, the change in the stim-ulation is limited to a small change of location of thestimulus in external coordinates, and the attentional mecha-nisms are left operating undisturbed. The perceptual eVectis in essence a spatial and temporal relocation of the stimu-lus, not a block and could be explained by a spatial remap-ping strategy analogous to what is described in vision (Baysand Husain 2007).
Overview of the present study
We wondered whether touch exhibits suppression of dis-placement, presumably to facilitate the merging of periphe-ral inputs into a uniWed, stable percept. To test thishypothesis, we designed two experiments where partici-pants scanned a Braille dot that changed its location duringthe brief moment when not in contact with a Wnger duringshifting from one Wnger to another, or during the momentneeded for a single Wnger to return to the same target. In thetwo-Wnger trials, the Braille dot was scanned by the indexand the middle Wngertips (D2 and D3) of participants, butits position depended on whether D2 or D3 touched it. Inthe single-Wnger trials, the index digit (D2) scanned the dotand then returned to it. The stimuli were produced using asensor sensitive to the Wngers’ position and connected to acomputer that commanded the activation or the deactiva-tion of the dots of a refreshable Braille cell. The setupensured that the activation and deactivation of the dotsoccurred during the time interval beginning when the dotleaves contact with a Wnger and ending when it makes con-tact again. Because the dots of a refreshable Braille cell are2.5 mm apart, this apparatus made it possible to programchanges in the location of 2.5 mm or 5 mm.
The dot spacing of Braille cells is so designed that dotsare easily discriminated under static or dynamic touch. Toestablish that it was indeed the case, we asked 10 partici-pants in a preliminary experiment under static touch to dis-criminate a displaced dot from a stationary using the Brailledisplay used for the main experiments. The cell was pro-grammed to activate and deactivate a single dot that some-times reappeared at a diVerent location (2.5 mm or 5 mmaway in all four cardinal directions). All participants easilydetected those changes, or lack thereof, and no signiWcanteVect nor any interactions due to direction or Wnger couldbe measured.
Throughout the main Experiment 1, using two Wngersand active touch, the participants were asked to determine
if they felt whether or not a dot was felt to be at the samelocation on the device. There were cases when the dotremained Wxed at various positions, cases when it was dis-placed upward by one space (distal displacement relative tothe long axis of the Wnger), and cases when it was displaceddownward (proximal) by one space. In other cases, the dotwas displaced upward or downward by two spaces. In yetother cases, it was displaced laterally, left or right, by oneor two spaces. We also performed a control experiment,Experiment 2, with the same materials, method and task,but instead of scanning the same target with two Wngers, theparticipants scanned the target with one single Wnger andthen scanned the target in the opposite direction immedi-ately after. Experiment 2 enabled us to verify that tactilesuppression of displacement is not due to Wnger motion butto the brief interruption of sensory input when a feature isin the gap between two Wngers.
General materials and methods
Experiment 1
Participants
Thirty McGill University students (12 males and 18females) took part in Experiment 1. Twenty-six of themdeclared that they were right handed, and four that theywere left handed. The participants’ mean age was 25 (range20–30). All reported a normal sense of touch and were notaware of any motor or cutaneous sensation deWcits. Theywere naive as to the purpose of the experiments, and theywere paid for their participation. The institutional ethicscommittee approved the experimental protocol, and partici-pants gave their informed consent before participating.
Apparatus
The apparatus employed commercially available refresh-able Braille cells (Model B11, Metec-AG, Stuttgart, Ger-many), see Fig. 1, embedded in a jig designed to establish arepeatable relationship between the Wngers and the targetregion. A refreshable Braille cell is a computer-controlleddevice with two columns of four dots (they have an extrarow compared to paper Braille) that are actuated to recessrapidly inside cavities, or to protrude out of the surface.This jig guided the participants’ Wngers to scan the targetsurface in straight line, lateral sweeps.
Referring to Fig. 1, the apparatus comprised two refresh-able Braille-cells with eight nearly hemispherical dots each(radius, 0.7 mm; height, 0.7 mm) permitting a great varietyof tactile patterns to be displayed and a two-Wnger cradle sup-ported by a sliding potentiometer that could be adjusted on a
123

302 Exp Brain Res (2010) 206:299–310
Velcro surface to accommodate the participants’ anatomicaldiVerences. The cells were recessed in a slightly inclined sur-face and positioned so as to stimulate participants’ Wngertipsand to make sure that both Wngertips were in contact with thetactile display. Each cell measured 6.42 £ 17.8 mm with adot spacing of 2.5 mm. A computer controlled the activationof the dots according to the potentiometers readings (slider60 mm, Phidgets, Inc., Calgary, Canada).
The apparatus was hidden from the view of the partici-pants by a screen. They slid their hands through an openingto reach the target surface, guided initially by the experi-menter. A computer monitor was used to give instructionsand feedback regarding the Wnger position. The index andthe middle Wngers do not have the same length. Because ofthis diVerence, the Wngers grazed the target surface atslightly diVerent regions on each Wngerpad. The cradle posi-tion was adjusted to ensure that both Wngerpads were in con-tact with the cells in a relaxed position, taking into accountthe diVerent lengths of the Wngers. A relaxed position wasachieved when adopting a slightly bent Wnger posture.
Stimuli
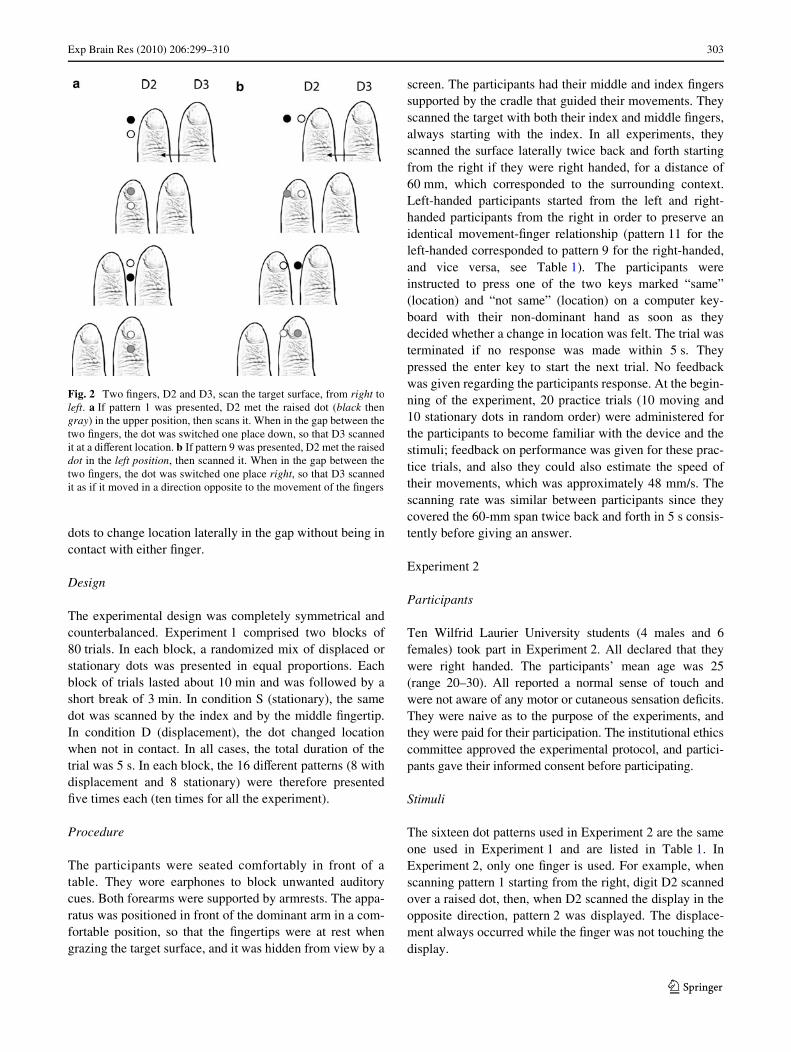
The sixteen dot patterns used in the Experiment 1 are listedin Table 1. Each pattern in the displacement condition (D)has an equivalent in the stationary condition (S). The pat-terns were created systematically by causing the dot tochange location in the four cardinal directions by one or bytwo spaces. These directions are termed proximal, distal,medial, and lateral when discussed in relation with anatom-ical coordinates; and down, up, left, and right, respectively,when describing the position of the dots on the display. Forpurposes of illustration, Fig. 2 shows two examples of howtwo digits, D2 and D3, can experience a dot change. Whenscanning pattern 1 (Fig. 2a) starting from the right, digit D2Wrst scans over a raised dot (black circle, gray whenhidden), then, while in the gap, the dot is recessed (white
circle) and another is raised. For pattern 9 (Fig. 2b), the dotis displaced to the right by recessing it and raising it atanother location, while in the gap. When scanning occurs inthe opposite direction, the sequence of events is reversed.The Wgure is not to scale for clarity. In practice, the dotswere much smaller, so there was suYcient room for the
Fig. 1 Apparatus. Refreshable Braille cells are embedded in aninclined surface (left). A sliding potentiometer supports two semicy-lindrical cradles forming a guide that can be relocated on a Velcro sur-face to accommodate the participants’ anatomical diVerences. TwoWngers (D2 and D3), seen from the top, scan laterally the target surfacecomprising an array of Braille dots [2 £ (2 £ 4)]. The dots could beswiftly lifted or recessed into the surface, under computer control
Table 1 The participants were tested with sixteen combinations of dotpositions tabulated below
A Wlled circle represents a raised dot, and a empty circle represents arecessed dot. Patterns corresponding to a dot apparent displacedare collected in the left column (Condition D). In the right column(Condition S), the counterpart patterns where the dot remained at aWxed location are shown
Condition D Condition S
Pattern number
D2 D3 Pattern number
D2 D3
1 ���� ���� 2 ���� ����
���� ���� ���� ����
���� ���� ���� ����
���� ���� ���� ����
3 ���� ���� 4 ���� ����
���� ���� ���� ����
���� ���� ���� ����
���� ���� ���� ����
5 ���� ���� 6 ���� ����
���� ���� ���� ����
���� ���� ���� ����
���� ���� ���� ����
7 ���� ���� 8 ���� ����
���� ���� ���� ����
���� ���� ���� ����
���� ���� ���� ����
9 ���� ���� 10 ���� ����
���� ���� ���� ����
���� ���� ���� ����
���� ���� ���� ����
11 ���� ���� 12 ���� ����
���� ���� ���� ����
���� ���� ���� ����
���� ���� ���� ����
13 ���� ���� 14 ���� ����
���� ���� ���� ����
���� ���� ���� ����
���� ���� ���� ����
15 ���� ���� 16 ���� ����
���� ���� ���� ����
���� ���� ���� ����
���� ���� ���� ����
123
Exp Brain Res (2010) 206:299–310 303
dots to change location laterally in the gap without being incontact with either Wnger.
Design
The experimental design was completely symmetrical andcounterbalanced. Experiment 1 comprised two blocks of80 trials. In each block, a randomized mix of displaced orstationary dots was presented in equal proportions. Eachblock of trials lasted about 10 min and was followed by ashort break of 3 min. In condition S (stationary), the samedot was scanned by the index and by the middle Wngertip.In condition D (displacement), the dot changed locationwhen not in contact. In all cases, the total duration of thetrial was 5 s. In each block, the 16 diVerent patterns (8 withdisplacement and 8 stationary) were therefore presentedWve times each (ten times for all the experiment).
Procedure
The participants were seated comfortably in front of atable. They wore earphones to block unwanted auditorycues. Both forearms were supported by armrests. The appa-ratus was positioned in front of the dominant arm in a com-fortable position, so that the Wngertips were at rest whengrazing the target surface, and it was hidden from view by a
screen. The participants had their middle and index Wngerssupported by the cradle that guided their movements. Theyscanned the target with both their index and middle Wngers,always starting with the index. In all experiments, theyscanned the surface laterally twice back and forth startingfrom the right if they were right handed, for a distance of60 mm, which corresponded to the surrounding context.Left-handed participants started from the left and right-handed participants from the right in order to preserve anidentical movement-Wnger relationship (pattern 11 for theleft-handed corresponded to pattern 9 for the right-handed,and vice versa, see Table 1). The participants wereinstructed to press one of the two keys marked “same”(location) and “not same” (location) on a computer key-board with their non-dominant hand as soon as theydecided whether a change in location was felt. The trial wasterminated if no response was made within 5 s. Theypressed the enter key to start the next trial. No feedbackwas given regarding the participants response. At the begin-ning of the experiment, 20 practice trials (10 moving and10 stationary dots in random order) were administered forthe participants to become familiar with the device and thestimuli; feedback on performance was given for these prac-tice trials, and also they could also estimate the speed oftheir movements, which was approximately 48 mm/s. Thescanning rate was similar between participants since theycovered the 60-mm span twice back and forth in 5 s consis-tently before giving an answer.
Experiment 2
Participants
Ten Wilfrid Laurier University students (4 males and 6females) took part in Experiment 2. All declared that theywere right handed. The participants’ mean age was 25(range 20–30). All reported a normal sense of touch andwere not aware of any motor or cutaneous sensation deWcits.They were naive as to the purpose of the experiments, andthey were paid for their participation. The institutional ethicscommittee approved the experimental protocol, and partici-pants gave their informed consent before participating.
Stimuli
The sixteen dot patterns used in Experiment 2 are the sameone used in Experiment 1 and are listed in Table 1. InExperiment 2, only one Wnger is used. For example, whenscanning pattern 1 starting from the right, digit D2 scannedover a raised dot, then, when D2 scanned the display in theopposite direction, pattern 2 was displayed. The displace-ment always occurred while the Wnger was not touching thedisplay.
Fig. 2 Two Wngers, D2 and D3, scan the target surface, from right toleft. a If pattern 1 was presented, D2 met the raised dot (black thengray) in the upper position, then scans it. When in the gap between thetwo Wngers, the dot was switched one place down, so that D3 scannedit at a diVerent location. b If pattern 9 was presented, D2 met the raiseddot in the left position, then scanned it. When in the gap between thetwo Wngers, the dot was switched one place right, so that D3 scannedit as if it moved in a direction opposite to the movement of the Wngers
123
304 Exp Brain Res (2010) 206:299–310
Design
The experimental design was completely symmetrical andcounterbalanced. Experiment 2 consisted of 40 trials perblock. In each block, a randomized mix of moving or station-ary dots was presented in equal proportions. Each block oftrials lasted about 5 min and was followed by a short break of3 min. In condition S, the same dot was scanned by the indexWnger. In condition D, the dot changed location when not incontact. In all cases, the total duration of the trial was 5 s. Inall the experiment, the 16 diVerent patterns (8 moving and 8stationary) were therefore presented Wve times each.
Procedure
The same apparatus as in Experiment 1 was used, and thesame procedure was followed. The participants were seatedin front of a table and the apparatus, hidden by a screen andpositioned in front of the right hand. The participants hadtheir middle and index Wngers supported by the cradle thatguided their movements, but they scanned the target withtheir index Wnger only. The participants had to press one ofthe two keys (similarly marked “same” and “not same”) on acomputer keyboard as soon as they decided whether a changein location on the device was felt. The trial was terminated ifno response was made within 5 s. At the beginning of theexperiment, 20 practice trials (10 displaced and 10 stationarydots in random order) were administered for the participantsto become familiar with the device and the stimuli.
Measures
A three-way repeated measures ANOVA was used toassess the eVects of conditions (stationary, displacement),amplitude (2.5 mm, 5 mm), and direction (up, down, left,right) on participants’ performances. According to whetherinteraction eVects were signiWcant or not, we conductedmarginal pairwise or simple eVect tests. Simple eVects wereanalyzed using the one-way repeated measures ANOVA oneach subset of the data. Pairwise comparisons were con-ducted using dependent samples t-test. Finally, the Fisher’sExact Test was used to examine the signiWcance of theassociations between the two experiments for each stimu-lus, because it is well suited for small sample sizes andcompares the associations between two variables.
Results
Experiment 1
The hypothesis was that under certain conditions (type andamplitude of displacement), participants would fail to
detect that dots changed location between their Wngers, thussuppressing tactile stimulus displacement. A preliminaryexperiment demonstrated that these displacements werewell above detection threshold. We expected that the dis-tance between the dots and the direction of motion relativeto the Wngers would be important factors. A displacementof 2.5 mm should be more suppressed than one of 5 mm,and we also tested whether the direction of motion played arole in tactile suppression of displacement.
Among the thirty participants, the results of one individ-ual were dropped from all analyses because he could notperform the task. In the remaining 2,320 trials, 46 trialswere removed from the analysis on the basis that no move-ment was detected. We veriWed that the scanning rate val-ues for the remaining trials were close to 48 mm/s.
Correct rate for stationary dots and incorrect rate for moving dots
We performed a three-way ANOVA repeated measureswithin the three factors: amplitude, direction, and condi-tion. We were primarily interested in the incorrect rate forthe change condition that was when a dot displacedbetween the Wngers, but was judged to be stationary. Forcomparison purpose, we also determined the incorrect ratefor the stationary condition, which was a stationary dot thatwas judged to have displaced. The displacement suppres-sion occurred when the subjects were not able to discrimi-nate a stationary dot from a displaced dot. All eVects arereported to be signiWcant for P < 0.05.
There was a signiWcant eVect of the condition,F(1,28) = 13.66. Contrasts revealed that the incorrect ratefor displaced dots was higher than for the stationary dots,r = 0.57. There was also a signiWcant main eVect of theamplitude, F(1,28) = 39.31. Contrasts showed that theincorrect rate for the 2.5-mm amplitude was higher than forthe 5-mm amplitude, r = 0.76. There was a signiWcant eVectof the direction, F(3,84) = 4.32. Contrasts showed that theincorrect rate for the right direction was higher than for thedown direction, F(1,28) = 8.22, r = 0.48 and for the leftdirection, F(1,28) = 8.96, r = 0.49 directions.
There was a signiWcant interaction between the condi-tion and the amplitude factors, F(1,28) = 18.29. Contrastsrevealed that the incorrect rates were higher when the dotwas displaced with a small amplitude than when the dotwas stationary, r = 0.63. The incorrect rates were similarfor both conditions for the 5-mm amplitude.
There was a signiWcant interaction between the conditionand the direction factors, F(3,84) = 4.55. Contrasts wereused to compare the eVect of condition across the fourdirections levels. The results showed that for the stationarycondition, the incorrect rate for the right direction washigher than for the up direction, F(1,28) = 11.37, r = 0.54,
123

Exp Brain Res (2010) 206:299–310 305
for the down direction, F(1,28) = 5.60, r = 0.41, and for theleft direction, F(1,28) = 6.20, r = 0.43.
There was a signiWcant interaction between the ampli-tude and the direction factors, F(1,28) = 5.88. Contrastsrevealed that for the stationary condition, the incorrect ratefor the right direction was higher than for the up directionF(1,28) = 9.20, r = 0.50, the down direction, F(1,28) = 7.19,r = 0.45, and the left direction, F(1,28) = 11.44, r = 0.54.
Finally, the condition £ amplitude £ direction interac-tion was signiWcant, F(3,84) = 3.97. This Wnding indicatesthat the amplitude £ direction interaction described previ-ously was diVerent in the displacement and stationaryconditions. Again, contrasts were used to break up theinteraction; they compared incorrect rates for the two con-ditions for each level of amplitude across each level ofdirection. The Wrst two contrasts looked at diVerencesbetween conditions, comparing amplitudes for the up ver-sus right directions, and for left versus right directions.The contrasts were signiWcant for up versus right direc-tions, F(1,28) = 4.65, r = 0.38, and for left versus rightdirections, F(1,28) = 7.89, r = 0.47. For the stationarycondition, regardless of amplitude, the incorrect rate forthe right direction was higher than for the up and leftdirections.
For the displacement condition, while the incorrectrate is the same for the two amplitudes in the right direction,the incorrect rate decreased for the 5-mm amplitude andincreased for the 2.5-mm amplitude, both for the up and leftdirections. A contrast compared the down direction to theleft direction when the 2.5-mm amplitude was comparedwith the 5-mm amplitude, and when the displacement con-dition was compared with the stationary condition. Thiscontrast was signiWcant, F(1,28) = 5.94, r = 0.42 andrevealed that for the two amplitudes, the incorrect rate washigher for the displacement condition than for the station-ary condition, except for the left direction with a 5-mmamplitude.
To verify the interpretation of the interaction eVects andthese contrasts, we conducted simple eVect tests usingone-way repeated measures ANOVA on each subset of thedata. For clarity, Table 2 summarized the correspondencebetween and each of each pair of factors and stimulus num-ber. Pairwise comparisons were conducted using the depen-dent samples t-test on each pair of factors. The results arecollected in Table 3 for each factor.
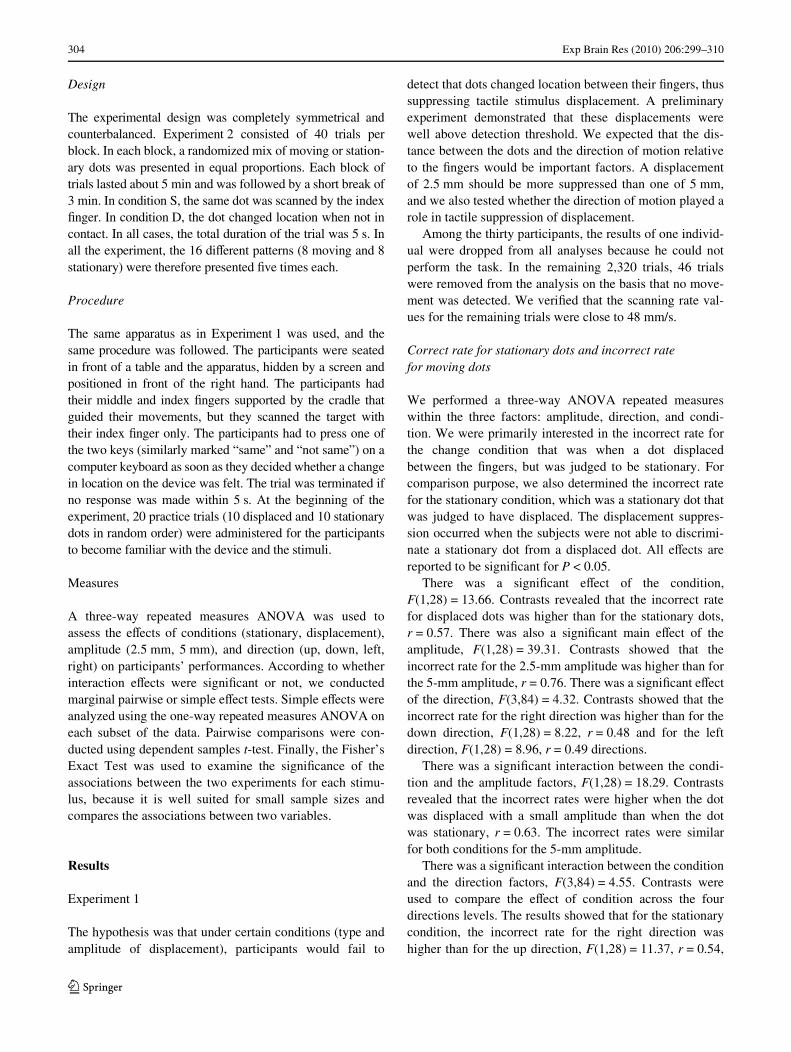
The t-tests for the direction factor indicated that theincorrect rates associated with patterns 1 and 3 (2.5-mmchanges) were signiWcantly diVerent (P < 0.01) from eachother, and from the other patterns (5, 7, and 11). In contrast,the incorrect rates associated with patterns 5 and 7 (5-mmchanges) were similar, and lower than for the smaller dis-placements. The t-tests for the rightward-leftward displace-ments also indicated that the incorrect rates associated withpatterns 9 and 13 (rightward changes) were signiWcantlydiVerent (P < 0.01) from each other, and the other patterns(11, 15). In contrast, the incorrect rates associated withpatterns 11 and 15 (leftward displacements) were similar,and lower than for the rightward displacements (see Fig. 3).Incorrect rates depended on the distance and the directionof the dot displacement; they were high for patterns 1, 3,and 9 when the distance between dots is small, and forpatterns 11 and 15 when dots were displaced from right toleft.
In addition to the contrasts tests performed above, t-testsalso indicated that the incorrect rates associated withpatterns 12 and 16 (stationary condition corresponding tothe leftward displacements) were signiWcantly diVerent(Table 4) from the other patterns (2, 4, 10, and 14) and (6,8, 10, and 14), respectively, which means that participantsanswered more often “not same” for the static pattern corre-sponding to the leftward displacements.
Table 2 Summary of each pair of factors (condition, amplitude, and direction)
Cond. Displacement Stationary
Amp. 2.5 mm 5 mm 2.5 mm 5 mm
Dir. Up Dwn Left Right Up Dwn Left Right Up Dwn Left Right Up Dwn Left Right
Pat. 1 3 9 11 5 7 13 15 2 4 10 12 6 8 14 16
Table 3 Summary of the results of Experiment 1 from 29 subjects,giving one-way ANOVA F and P values for the condition, and ampli-tude factors
Factor Pattern pairs (F, d) P
Condition 1 vs. 2 (20.96, 28) 0.0001*
3 vs. 4 (9.16, 28) 0.005*
5 vs. 6 (0.72, 28) 0.40
7 vs. 8 (2.92, 28) 0.10
9 vs. 10 (36.57, 28) 0.0001*
11 vs. 12 (0.001, 28) 0.97
13 vs. 14 (0.20, 28) 0.66
15 vs. 16 (0.1, 28) 0.76
Amplitude 1 vs. 5 (30.89, 28) 0.0001*
3 vs. 7 (8.45, 28) 0.007*
4 vs. 8 (6.48, 28) 0.017*
9 vs. 13 (37.83, 28) 0.0001*
123
306 Exp Brain Res (2010) 206:299–310
Finally, for the condition factor, as shown in Table 3, theone-way ANOVA revealed a signiWcant eVect for patterns1 vs. 2, 3 vs. 4, and 9 vs. 10, which corresponded to 2.5-mmdisplacements downward, upward, and rightward where theincorrect rates were signiWcantly higher for the displaceddots than for stationary ones. All the other patterns, 5 vs. 6,7 vs. 8, 11 vs. 12, 13 vs. 14, and 15 vs. 16, correspondingto a proximal–distal 5-mm downward, a 5-mm upward, a2.5-mm leftward, a 5-mm leftward, and a 5-mm rightwarddisplacements, respectively, had the same incorrect ratesfor stationary dots. The rate of incorrect judgments for dis-placed dots increased for 2.5-mm changes in medial–lateraland rightward directions, but not for leftward direction. Theone-way ANOVA for the amplitude factor conWrmed thisprediction since a signiWcant eVect was noticed for the pat-terns 1 vs. 5, 3 vs. 7, and 9 vs. 13, which correspond to 2.5-and 5-mm changes in location downward, upward, andrightward, respectively. We also noticed a signiWcant eVectfor the pattern 4 vs. 8 that are stationary. It also conWrmscontrast tests that showed that the higher incorrect rateswere obtained for the right direction for both stationary anddisplaced dots.
Subjects did not perceive the smallest displacements,regardless of the direction proximal–distal (patterns 1 and 3);medial–lateral (patterns 9 and 11), but also did not perceivestationary dots for leftward direction (patterns 12 and 16).In contrast, the larger 5-mm displacements in the proximal–distal direction (patterns 5 and 7) were perceived. The resultswere less clear-cut for the medial–lateral 5-mm changes:leftward changes in location (pattern 13) were perceived,while rightward changes (pattern 15) were not.
Experiment 2
Here, we expected that the participants were able to detectwithout any diYculty the diVerence between the two condi-tions D and S.
A three-way repeated measures ANOVA with the threefactors condition (D or S), amplitude (2.5 mm, 5 mm), anddirection (left, right, up, and down) was used to assess theparticipants’ incorrect rate. Interactions of combinations offactors taken two by two were not signiWcant. The inter-action of the three factors was not signiWcant. There werealso no signiWcant eVects for the factors amplitude,F(1,9) = 3.72, P = 0.09, direction, F(3,27) = 0.12, P = 0.96,and condition, F(1,9) =0.22, P = 0.65.
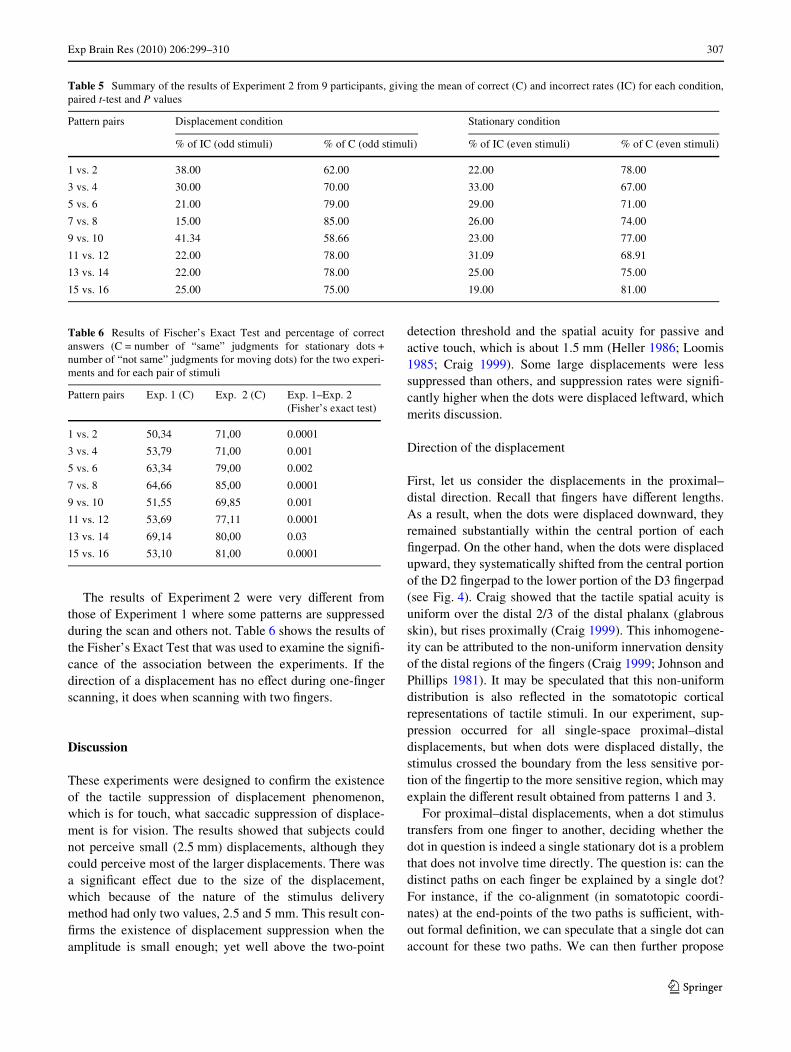
Table 5 displays the participants’ correct and incorrectrates for each stimulus. As expected, participants were ableto make the diVerence between a dot that was stationaryand a dot that was moving while scanning Braille cells withone single Wnger.
Fig. 3 Participants’ responses for (§SD) for proximal–distal andmedial–lateral patterns for Experiment 1. The results are sorted by pat-tern types (proximal–distal: left column; medial–lateral: right column;displacement condition top row; stationary condition bottom row)
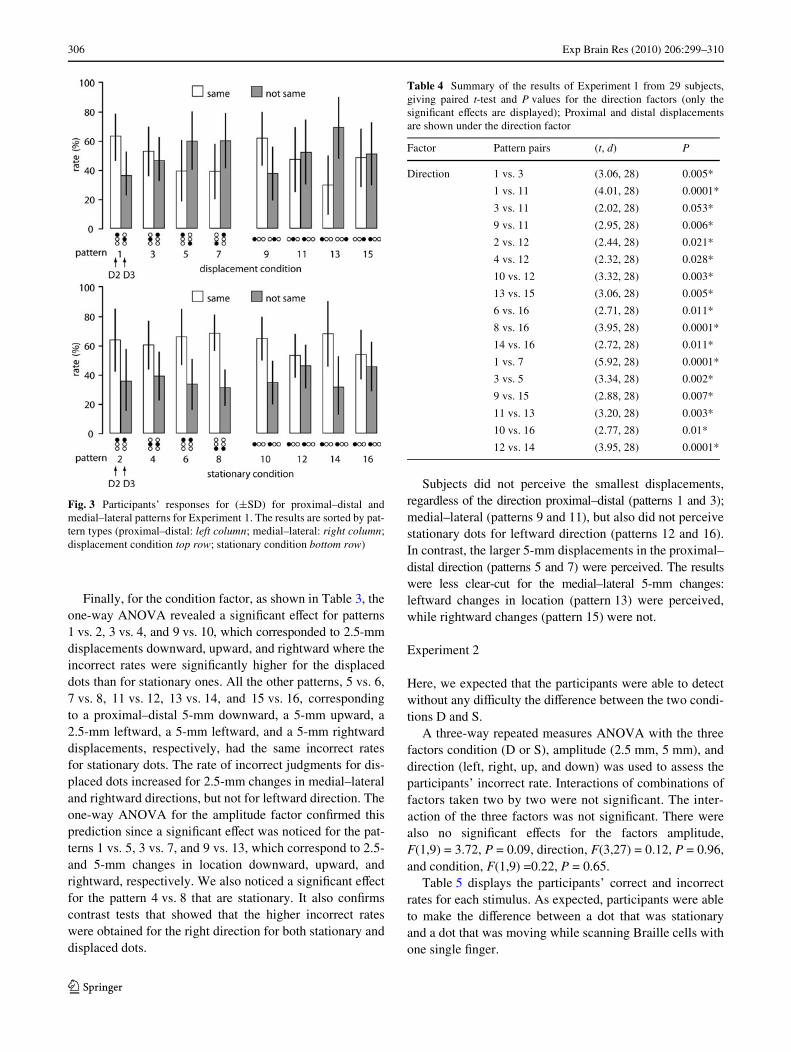
Table 4 Summary of the results of Experiment 1 from 29 subjects,giving paired t-test and P values for the direction factors (only thesigniWcant eVects are displayed); Proximal and distal displacementsare shown under the direction factor
Factor Pattern pairs (t, d) P
Direction 1 vs. 3 (3.06, 28) 0.005*
1 vs. 11 (4.01, 28) 0.0001*
3 vs. 11 (2.02, 28) 0.053*
9 vs. 11 (2.95, 28) 0.006*
2 vs. 12 (2.44, 28) 0.021*
4 vs. 12 (2.32, 28) 0.028*
10 vs. 12 (3.32, 28) 0.003*
13 vs. 15 (3.06, 28) 0.005*
6 vs. 16 (2.71, 28) 0.011*
8 vs. 16 (3.95, 28) 0.0001*
14 vs. 16 (2.72, 28) 0.011*
1 vs. 7 (5.92, 28) 0.0001*
3 vs. 5 (3.34, 28) 0.002*
9 vs. 15 (2.88, 28) 0.007*
11 vs. 13 (3.20, 28) 0.003*
10 vs. 16 (2.77, 28) 0.01*
12 vs. 14 (3.95, 28) 0.0001*
123
Exp Brain Res (2010) 206:299–310 307
The results of Experiment 2 were very diVerent fromthose of Experiment 1 where some patterns are suppressedduring the scan and others not. Table 6 shows the results ofthe Fisher’s Exact Test that was used to examine the signiW-cance of the association between the experiments. If thedirection of a displacement has no eVect during one-Wngerscanning, it does when scanning with two Wngers.
Discussion
These experiments were designed to conWrm the existenceof the tactile suppression of displacement phenomenon,which is for touch, what saccadic suppression of displace-ment is for vision. The results showed that subjects couldnot perceive small (2.5 mm) displacements, although theycould perceive most of the larger displacements. There wasa signiWcant eVect due to the size of the displacement,which because of the nature of the stimulus deliverymethod had only two values, 2.5 and 5 mm. This result con-Wrms the existence of displacement suppression when theamplitude is small enough; yet well above the two-point
detection threshold and the spatial acuity for passive andactive touch, which is about 1.5 mm (Heller 1986; Loomis1985; Craig 1999). Some large displacements were lesssuppressed than others, and suppression rates were signiW-cantly higher when the dots were displaced leftward, whichmerits discussion.
Direction of the displacement
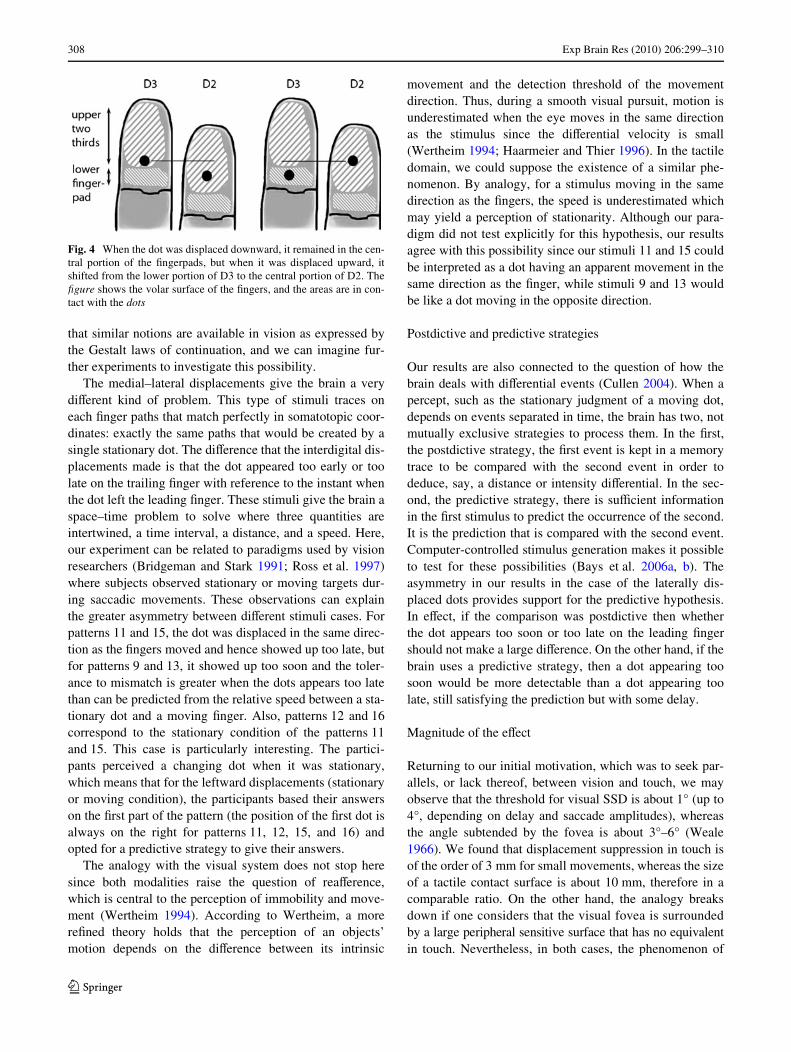
First, let us consider the displacements in the proximal–distal direction. Recall that Wngers have diVerent lengths.As a result, when the dots were displaced downward, theyremained substantially within the central portion of eachWngerpad. On the other hand, when the dots were displacedupward, they systematically shifted from the central portionof the D2 Wngerpad to the lower portion of the D3 Wngerpad(see Fig. 4). Craig showed that the tactile spatial acuity isuniform over the distal 2/3 of the distal phalanx (glabrousskin), but rises proximally (Craig 1999). This inhomogene-ity can be attributed to the non-uniform innervation densityof the distal regions of the Wngers (Craig 1999; Johnson andPhillips 1981). It may be speculated that this non-uniformdistribution is also reXected in the somatotopic corticalrepresentations of tactile stimuli. In our experiment, sup-pression occurred for all single-space proximal–distaldisplacements, but when dots were displaced distally, thestimulus crossed the boundary from the less sensitive por-tion of the Wngertip to the more sensitive region, which mayexplain the diVerent result obtained from patterns 1 and 3.
For proximal–distal displacements, when a dot stimulustransfers from one Wnger to another, deciding whether thedot in question is indeed a single stationary dot is a problemthat does not involve time directly. The question is: can thedistinct paths on each Wnger be explained by a single dot?For instance, if the co-alignment (in somatotopic coordi-nates) at the end-points of the two paths is suYcient, with-out formal deWnition, we can speculate that a single dot canaccount for these two paths. We can then further propose
Table 5 Summary of the results of Experiment 2 from 9 participants, giving the mean of correct (C) and incorrect rates (IC) for each condition,paired t-test and P values
Pattern pairs Displacement condition Stationary condition
% of IC (odd stimuli) % of C (odd stimuli) % of IC (even stimuli) % of C (even stimuli)
1 vs. 2 38.00 62.00 22.00 78.00
3 vs. 4 30.00 70.00 33.00 67.00
5 vs. 6 21.00 79.00 29.00 71.00
7 vs. 8 15.00 85.00 26.00 74.00
9 vs. 10 41.34 58.66 23.00 77.00
11 vs. 12 22.00 78.00 31.09 68.91
13 vs. 14 22.00 78.00 25.00 75.00
15 vs. 16 25.00 75.00 19.00 81.00
Table 6 Results of Fischer’s Exact Test and percentage of correctanswers (C = number of “same” judgments for stationary dots +number of “not same” judgments for moving dots) for the two experi-ments and for each pair of stimuli
Pattern pairs Exp. 1 (C) Exp. 2 (C) Exp. 1–Exp. 2 (Fisher’s exact test)
1 vs. 2 50,34 71,00 0.0001
3 vs. 4 53,79 71,00 0.001
5 vs. 6 63,34 79,00 0.002
7 vs. 8 64,66 85,00 0.0001
9 vs. 10 51,55 69,85 0.001
11 vs. 12 53,69 77,11 0.0001
13 vs. 14 69,14 80,00 0.03
15 vs. 16 53,10 81,00 0.0001
123
308 Exp Brain Res (2010) 206:299–310
that similar notions are available in vision as expressed bythe Gestalt laws of continuation, and we can imagine fur-ther experiments to investigate this possibility.
The medial–lateral displacements give the brain a verydiVerent kind of problem. This type of stimuli traces oneach Wnger paths that match perfectly in somatotopic coor-dinates: exactly the same paths that would be created by asingle stationary dot. The diVerence that the interdigital dis-placements made is that the dot appeared too early or toolate on the trailing Wnger with reference to the instant whenthe dot left the leading Wnger. These stimuli give the brain aspace–time problem to solve where three quantities areintertwined, a time interval, a distance, and a speed. Here,our experiment can be related to paradigms used by visionresearchers (Bridgeman and Stark 1991; Ross et al. 1997)where subjects observed stationary or moving targets dur-ing saccadic movements. These observations can explainthe greater asymmetry between diVerent stimuli cases. Forpatterns 11 and 15, the dot was displaced in the same direc-tion as the Wngers moved and hence showed up too late, butfor patterns 9 and 13, it showed up too soon and the toler-ance to mismatch is greater when the dots appears too latethan can be predicted from the relative speed between a sta-tionary dot and a moving Wnger. Also, patterns 12 and 16correspond to the stationary condition of the patterns 11and 15. This case is particularly interesting. The partici-pants perceived a changing dot when it was stationary,which means that for the leftward displacements (stationaryor moving condition), the participants based their answerson the Wrst part of the pattern (the position of the Wrst dot isalways on the right for patterns 11, 12, 15, and 16) andopted for a predictive strategy to give their answers.
The analogy with the visual system does not stop heresince both modalities raise the question of reaVerence,which is central to the perception of immobility and move-ment (Wertheim 1994). According to Wertheim, a morereWned theory holds that the perception of an objects’motion depends on the diVerence between its intrinsic
movement and the detection threshold of the movementdirection. Thus, during a smooth visual pursuit, motion isunderestimated when the eye moves in the same directionas the stimulus since the diVerential velocity is small(Wertheim 1994; Haarmeier and Thier 1996). In the tactiledomain, we could suppose the existence of a similar phe-nomenon. By analogy, for a stimulus moving in the samedirection as the Wngers, the speed is underestimated whichmay yield a perception of stationarity. Although our para-digm did not test explicitly for this hypothesis, our resultsagree with this possibility since our stimuli 11 and 15 couldbe interpreted as a dot having an apparent movement in thesame direction as the Wnger, while stimuli 9 and 13 wouldbe like a dot moving in the opposite direction.
Postdictive and predictive strategies
Our results are also connected to the question of how thebrain deals with diVerential events (Cullen 2004). When apercept, such as the stationary judgment of a moving dot,depends on events separated in time, the brain has two, notmutually exclusive strategies to process them. In the Wrst,the postdictive strategy, the Wrst event is kept in a memorytrace to be compared with the second event in order todeduce, say, a distance or intensity diVerential. In the sec-ond, the predictive strategy, there is suYcient informationin the Wrst stimulus to predict the occurrence of the second.It is the prediction that is compared with the second event.Computer-controlled stimulus generation makes it possibleto test for these possibilities (Bays et al. 2006a, b). Theasymmetry in our results in the case of the laterally dis-placed dots provides support for the predictive hypothesis.In eVect, if the comparison was postdictive then whetherthe dot appears too soon or too late on the leading Wngershould not make a large diVerence. On the other hand, if thebrain uses a predictive strategy, then a dot appearing toosoon would be more detectable than a dot appearing toolate, still satisfying the prediction but with some delay.
Magnitude of the eVect
Returning to our initial motivation, which was to seek par-allels, or lack thereof, between vision and touch, we mayobserve that the threshold for visual SSD is about 1° (up to4°, depending on delay and saccade amplitudes), whereasthe angle subtended by the fovea is about 3°–6° (Weale1966). We found that displacement suppression in touch isof the order of 3 mm for small movements, whereas the sizeof a tactile contact surface is about 10 mm, therefore in acomparable ratio. On the other hand, the analogy breaksdown if one considers that the visual fovea is surroundedby a large peripheral sensitive surface that has no equivalentin touch. Nevertheless, in both cases, the phenomenon of
Fig. 4 When the dot was displaced downward, it remained in the cen-tral portion of the Wngerpads, but when it was displaced upward, itshifted from the lower portion of D3 to the central portion of D2. TheWgure shows the volar surface of the Wngers, and the areas are in con-tact with the dots
123
Exp Brain Res (2010) 206:299–310 309
displacement suppression may be thought to be a mecha-nism contributing to the perception of a stable world. Byanalogy, engineers often design small amounts of hysteresisin systems in order to stabilize noisy or drifting signals,making them appear more stable than they really are. Dis-placement suppression is a form of hysteresis, since theoutput (the percept) depends on the history of the inputs(self-generated movement plus stimulus external location),and not just on the inputs at one instant in time. Here, achange due to self-generated movement, call it “extra-cuta-neous signals” by analogy with extra-retinal signals, sup-presses the conscious awareness of a small change in thestimulus location.
In sum, the results of the experiment reported hereprovide the Wrst evidence of a tactile suppression of dis-placement eVect in the somatosensory modality, which iscomparable to saccadic suppression of image displacementin the visual modality. In summary, we conclude that theeVect actually yields two distinct interpretations. For proxi-mal–distal displacements, corresponding to a geometricalGestalt-like eVect, asymmetrical results appear to be theresult from the inhomogeneous tactile sensitivity of theWngertip. For the lateral–medial displacements, asymmetri-cal results can be interpreted in terms of a time–space prob-lem connected to reaVerence and diVerential processingstrategies.
Acknowledgments Special thanks to Dominique Aubert for helpwith the software. This research was supported by a Special ResearchOpportunity Grant from the Natural Sciences and EngineeringResearch Council of Canada (NSERC).
References
Bays PM, Husain M (2007) Spatial remapping of the visual worldacross saccades. Neuroreport 18(12):1207–1213
Bays PM, Wolpert DM, Flanagan JR (2006a) Perception of the conse-quences of self-action is temporally tuned and event driven. CurrBiol 15:1125–1128
Bays PM, Flanagan JR, Wolpert DM (2006b) Attenuation of self-gen-erated tactile sensations is predictive, not postdictive. PLoS Biol4(2):e28
Bridgeman B, Stark L (1991) Ocular proprioception and eVerencecopy in registering visual direction. Vis Res 31:1903–1913
Bridgeman B, Hendry D, Stark L (1975) Failure to detect displacementof visual world during saccadic eye movements. Vis Res 15:719–722
Chapman CE (1994) Active versus passive touch: factors inXuencingthe transmission of somatosensory signals to primary somatosen-sory cortex. Can J Physiol Pharmacol 72:558–570
Chapman CE, Beauchamp E (2006) DiVerential controls over tactiledetection in humans by motor commands and peripheral reaVer-ence. J Neurophysiol 96:1664–1675
Craig JC (1999) Grating orientation as a measure of tactile spatialacuity. Somatosens Mot Res 16:197–206
Cullen KE (2004) Sensory signals during active versus passive move-ment. Curr Opin Neurobiol 14:698–706
Deubel H, Schneider WX, Bridgeman B (2004) DiVerent eVects ofeyelid blinking and target blanking on saccadic suppression ofdisplacement. Perception & Psychophysics 66:772–778
Dodge R (1900) Visual perception during eye movement. Psychol Rev7:454–465
Dyhre-Poulson P (1978) Perception of tactile stimuli before ballisticand during tracking movements. In: Gordon G (ed) Active touch.Pergamon Press, Oxford, pp 171–176
Fitzgerald PJ, Lane JW, Thakur PH, Hsiao SS (2006) Receptive Weldproperties of the macaque second somatosensory cortex: repre-sentation of orientation on diVerent Wnger pads. J Neurosci26:6473–6484
Gallace A, Auvray M, Tan HZ, Spence C (2006) When visual tran-sients impair tactile change detection: a novel case of crossmodalchange blindness? Neurosci Lett 398:280–285
Ghez C, Lenzi GL (1971) Modulation of sensory transmission in catlemniscal system during voluntary movements. PXügers ArchivEuropean Journal of Physiology 323:273–278
Haarmeier T, Thier P (1996) ModiWcation of the Filehne illusion byconditioning visual stimuli. Vis Res 36:741–750
Haggard P (2006) Sensory neuroscience: from skin to object in thesomatosensory cortex. Curr Biol 16:884–886
Hatwell Y (1986) Toucher l’espace. La main et la perception tactile del’espace. Presses Universitaires de Lille, Lille
Heller MA (1986) Active and passive tactile braille recognition.Bulletin of the Psychonomic Society 24:201–202
Johnson KO, Phillips JR (1981) Tactile spatial resolution. I. Two-pointdiscrimination, gap detection, grating resolution, and letter recog-nition. J Neurophysiol 46:1177–1191
Loomis JM (1985) Tactile recognition of raised characters: A paramet-ric study. Bulletin of the Psychonomic Society 23:18–20
Matin E (1974) Saccadic suppression: A review and an analysis. Psy-chol Bull 81:899–917
Millar S (1997) Reading by Touch. Routledge, LondonO’Regan JK, Noë A (2001) A sensorimotor account of vision and
visual consciousness. Behavioral and Brain Sciences 24:883–917Poincaré H (1908) Science et Méthode. Flammarion, ParisRensink RA, O’Regan JK, Clark JJ (1997) To see or not to see: the
need for attention to perceive changes in scenes. PsychologicalScience 8(5):368–373
Ross J, Morrone MC, Burr DC (1997) Compression of visual spacebefore saccades. Nature 386:587–601
Stevenson SB, Volkmann FC, Kelly JP, Riggs LA (1986) Dependenceof visual suppression on the amplitudes of saccades and blinks.Vis Res 26:1815–1824
Taylor-Clarke M, Jacobsen P, Haggard P (2004) Keeping the world aconstant size: object constancy in human touch. Nat Neurosci7:219–220
Vitello MP, Ernst MO, Fritschi, M (2006) An instance of tactilesuppression: Active exploration impairs tactile sensitivity for thedirection of lateral movement. Proceedings of EuroHaptics 2006,pp 351–355
Vitevitch MS (2003) Change deafness: the inability to detect changesbetween two voices. Journal of Experimental Psychology: HumanPerception Performance 29:333–342
Volkmann FC, Riggs LA, Moore RK (1980) Eyeblinks and visual sup-pression. Science 207:900–902
Wallach H, Lewis C (1966) The eVect of abnormal displacement of theretinal image during eye movements. Perception & Psychophys-ics 1:25–29
Weale RA (1966) Why does the human retina possess a fovea? Nature212:255–256
Wertheim AH (1994) Motion perception during self-motion: Thedirect versus inferential controversy revisited. Behavioral andBrain Sciences: 17:293–355
123

310 Exp Brain Res (2010) 206:299–310
Wexler M, Panerai F, Lamouret I, Droulez J (2001) Self-motion andthe perception of stationary objects. Nature 409:85–88
Williams SR, Chapman CE (2000) time course and magnitude ofmovement-related gating of tactile detection in humans. II. EVecteVects of stimulus intensity. J Neurophysiol 84:863–875
Williams SR, Chapman CE (2002) Time course and magnitude ofmovement-related gating of tactile detection in humans. III. EVectof motor tasks. J Neurophysiol 88:1968–1979
Williams SR, Shenesa J, Chapman CE (1998) Time course andmagnitude of movement-related gating of tactile detection inhumans. I. Importance of stimulus location. J Neurophysiol79:947–963
123