strain-specific functional and numerical responses are required to evaluate impacts on...
TRANSCRIPT
ORIGINAL ARTICLE
Strain-specific functional and numerical responsesare required to evaluate impacts on predator–preydynamics
Zhou Yang1,2, Chris D Lowe2, Will Crowther2, Andy Fenton2, Phillip C Watts2 andDavid JS Montagnes2
1Jiangsu Province Key Laboratory for Biodiversity and Biotechnology, School of Biological Sciences,Nanjing Normal University, Nanjing, Jiangsu, China and 2Department of Evolution, Ecology, and Behaviour,Institute of Integrative Biology, BioSciences Building, University of Liverpool, Liverpool, UK
We used strains recently collected from the field to establish cultures; then, through laboratory studieswe investigated how among strain variation in protozoan ingestion and growth rates influencespopulation dynamics and intraspecific competition. We focused on the impact of changing temperaturebecause of its well-established effects on protozoan rates and its ecological relevance, from dailyfluctuations to climate change. We showed, first, that there was considerable inter-strain variability inthermal sensitivity of maximum growth rate, revealing distinct differences among multiple strains ofour model species Oxyrrhis marina. We then intensively examined two representative strains thatexhibited distinctly different thermal responses and parameterised the influence of temperature ontheir functional and numerical responses. Finally, we assessed how these responses alter predator–prey population dynamics. We did this first considering a standard approach, which assumes thatfunctional and numerical responses are directly coupled, and then compared these results with a novelframework that incorporates both functional and numerical responses in a fully parameterisedmodel. We conclude that: (i) including functional diversity of protozoa at the sub-species levelalters model predictions and (ii) including directly measured, independent functional and numericalresponses in a model provides a more realistic account of predator–prey dynamics.The ISME Journal (2013) 7, 405–416; doi:10.1038/ismej.2012.117; published online 15 November 2012Subject Category: microbial ecology and functional diversity of natural habitatsKeywords: functional response; numerical response; model protozoa; Oxyrrhis marina; temperature
Introduction
Protozoa (phagotrophic microbial eukaryotes) arekey components of terrestrial and aquatic ecosys-tems (Bonkowski, 2004; Calbet, 2008). Both innatural and experimental systems, protozoa respondrapidly to increases in prey abundance, with short-term increases in numbers composed of one or a fewsimilar species that potentially drive predator–preycycles (Montagnes, 1996; Begun et al., 2004).Furthermore, ambient temperature interacts withprey abundance to alter protozoan rate processes (forexample, ingestion, growth, gross growth efficiency,predator–prey dynamics; see Weisse et al., 2002;
Atkinson et al., 2003; Montagnes et al., 2003, 2008;Kimmance et al., 2006). This interaction will alsoalter predator–prey bloom dynamics. Finally, not onlydo protozoa exhibit species-specific responses, thereare good indications that strain-specific responsesoccur and will significantly alter population dynamics.Thus, there is a need to assess the effects of prey,temperature and predator strain on protozoan popu-lation dynamics. Here we use the model protozoaOxyrrhis marina (Montagnes et al., 2011) to addresstwo fundamental, and we suggest inexorably linked,issues associated with improving protozoan popula-tion models: (i) the influence of temperature onstrain-specific responses and its impact on populationdynamics and (ii) the structure of population modelsthat examine protozoan-based predator–prey dynamics.Both of these topics are expanded on below.
Intraspecific variationIntraspecific variation has, to date, received insuffi-cient attention with regards to community ecology,including predator–prey dynamics (Violle et al.,2012). Predicting natural population dynamics can
Correspondence: DJS Montagnes, Institute of Integrative Biology,BioSciences Building, University of Liverpool, Liverpool, L697ZB, UK.E-mail: [email protected] Z Yang, School of Biological Sciences, Nanjing Normal University,Nanjing, China.E-mail: [email protected] 14 May 2012; revised 30 July 2012; accepted 16 August2012; published online 15 November 2012
The ISME Journal (2013) 7, 405–416& 2013 International Society for Microbial Ecology All rights reserved 1751-7362/13
www.nature.com/ismej

be complicated by the presence of competingstrains, each with a distinct phenotype (for example,growth rates, competitive abilities and thermaloptima). Thus, model predictions based on theresponses of single strains are likely to have limitedrelevance to many natural, multi-strain systems.However, despite the growing recognition of geneticand phenotypic variation between protozoan popu-lations (for example, Weisse and Montagnes, 1998;Lowe et al., 2005, 2010; Gachter and Weisse, 2006),we are unaware of any explorations of howenvironmental perturbations, such as temperatureshifts, alter population dynamics of phenotypicallydistinct strains of the same species or the outcome ofcompetition between them.
Trait-based models are now beginning to provide ameans to incorporate variation into natural dynamics(for example, Le Quere et al., 2005; Bruggeman andKooijman, 2007; Follows et al., 2007; Violle et al.,2012). This direction offers an assessment of taxo-nomic variation that may alter population structure, asone strain replaces another (for example, Parmesan,2006; Carroll, 2007). To date, however, the explorationof models using multiple functional groups (repre-sented by taxa) has primarily focused on autotrophicprotist (that is, prey) responses, although there hasbeen some exploration of variable predator responses(for example, Tirok et al., 2011). Here, we indicatethat multiple strain responses naturally exist forour model predator species and then examine howthey might alter population dynamics, both inisolation and under competition, by comparingtwo strains in detail. We do this using an approachthat simultaneously evaluates both the functionaland numerical responses of the predator and howthey are affected by a single environmental variable(that is, temperature).
Functional and numerical responsesTypically, many modern day population and eco-system models, although highly sophisticated, areultimately based on the original Lotka–Volterra (LV)models developed nearly 100 years ago. In particu-lar, these models (both the original versions andtheir modern day counterparts) make the assump-tion that the numerical response (predator growthrate vs prey abundance) is directly proportional toits functional response (ingestion rate vs preyabundance). Specifically, these models rely on anexperimentally parameterised functional responseand derive the numerical response by imposing aconstant conversion efficiency on the functionalresponse (see Turchin, 2003). Rarely is it recognisedthat functional and numerical responses can quali-tatively differ in shape, reflecting a variable conver-sion efficiency with food concentration (for adetailed microbial-based review and analysis of thissee Fenton et al., 2010). Further complicating thesituation, models rarely appreciate that both func-tional and numerical responses can be uniquely
altered by external factors (for example, tempera-ture: Kimmance et al., 2006; Montagnes et al., 2008).
To illustrate the problems associated with thestandard approach described above, consider thecase where two predator populations (for example,strains of the same species) exhibited similar func-tional responses but have different numericalresponses. Logic dictated by the LV-based approach(that is, directly basing the numerical response on theobserved functional response, with a constant con-version efficiency) would suggest that the two strainsrespond similarly (that is, typically, in the absence ofdata, a single conversion efficiency would be appliedto all strains of a single species); there is no scope inthis framework to recognise and include the differentnumerical responses (which could result from vari-able conversion efficiency). In reality, as these twostrains exhibit different numerical responses, follow-ing logic outlined by Tilman (1982), the strain withthe lowest growth requirement for a limiting resource(that is, the one able to maintain positive growth atthe lowest resource concentration) will have thecompetitive advantage. Here, we present a casewhere, under some conditions (that is, varyingtemperature), the functional responses of differentstrains are not significantly distinguishable, andfollowing the above logic, this would imply nodifference between the strains response to preyabundance. We then reveal how combining indepen-dently derived functional and numerical responsesleads to a very different conclusion (that is, one straindrives the other to extinction).
Summary of directionInitially, and critically, we illustrate the importanceof this issue of strain variation by revealing thatseveral naturally occurring strains of our modelspecies differ in thermal sensitivities; temperaturewas chosen as an environmental treatment becauseof its well-established effect on microbial rates andits ecological relevance, from daily fluctuations toclimate change. We then intensively focus on twostrains that exhibit distinctly different thermalresponses. For these two strains, we examine theinfluence of temperature on their functional andnumerical responses. Finally, we consider howthese responses alter predicted predator–prey popu-lation dynamics under two simulated scenarios:first, by exploring the standard LV-based approachof deriving the numerical response directly from thefunctional response, and second by applying a moreflexible framework that explicitly incorporatesindependent functional and numerical responsesin a fully parameterised model.
Materials and methods
Study organismsThe autotrophic flagellate Dunaliella primolecta,Butcher (CCAP, Dunstaffnage, Scotland) was
Revising microbial predator–prey modelsZ Yang et al
406
The ISME Journal
maintained in 32 PSU (practical salinity units)artificial seawater (Ultramarine synthetic sea salt,UK) enriched with F/2 marine water enrichmentsolution (Sigma-Aldrich, Dorset, UK) and exposedto 24-h irradiance at B50 mmol photons m�2 s� 1.We collected 10 strains of O. marina Dujardin(following methods outlined in Lowe et al., 2011b)that were maintained on D. primolecta (Table 1).Note although that two of these may, in fact, bea different species of Oxyrrhis; following recentwork by Lowe et al., (2011a) strains 356_Mal01 and30_Pos01 may be Oxyrrhis maritima.
Temperature responses across strainsBoth O. marina and D. primolecta were maintainedat 10 1C, 20 1C, 26 1C and 30±1 1C, in batch culturesunder the conditions outlined above; for eachtemperature n¼ 3. Before estimating O. marinagrowth rate, D. primolecta was acclimated (5 days)to the experimental conditions; O. marina was theninoculated into prey cultures and acclimated underthe same constant conditions (3 days). Cultures(50 ml plastic tubes) were gently mixed to maintaincells in suspension, and D. primolecta abundancewas maintained at levels that would result inmaximum growth rates (that is, exponentially grow-ing prey 45� 105 ml� 1; see Kimmance et al., 2006and our Results section) by adding an excess of prey.Growth rate was calculated, over the exponentialgrowth phase, as the slope of ln abundance vs timeover 48 h (measured at 0, 24 and 48 h).
To test the hypothesis that variation betweenstrains occurred in their temperature responses,two-way analysis of variance (a¼ 0.05) was per-formed to test for strain–temperature interactions.Further post hoc tests to examine where differencesoccurred were not performed, as the purpose of thisbroad analysis was to indicate that variation exists;that is, to contextualise the need for further focusedwork, rather than to examine specific pairwisecomparisons. The only exception to this was at-test on two strains that are the focus of theremainder of this study (see Results section).
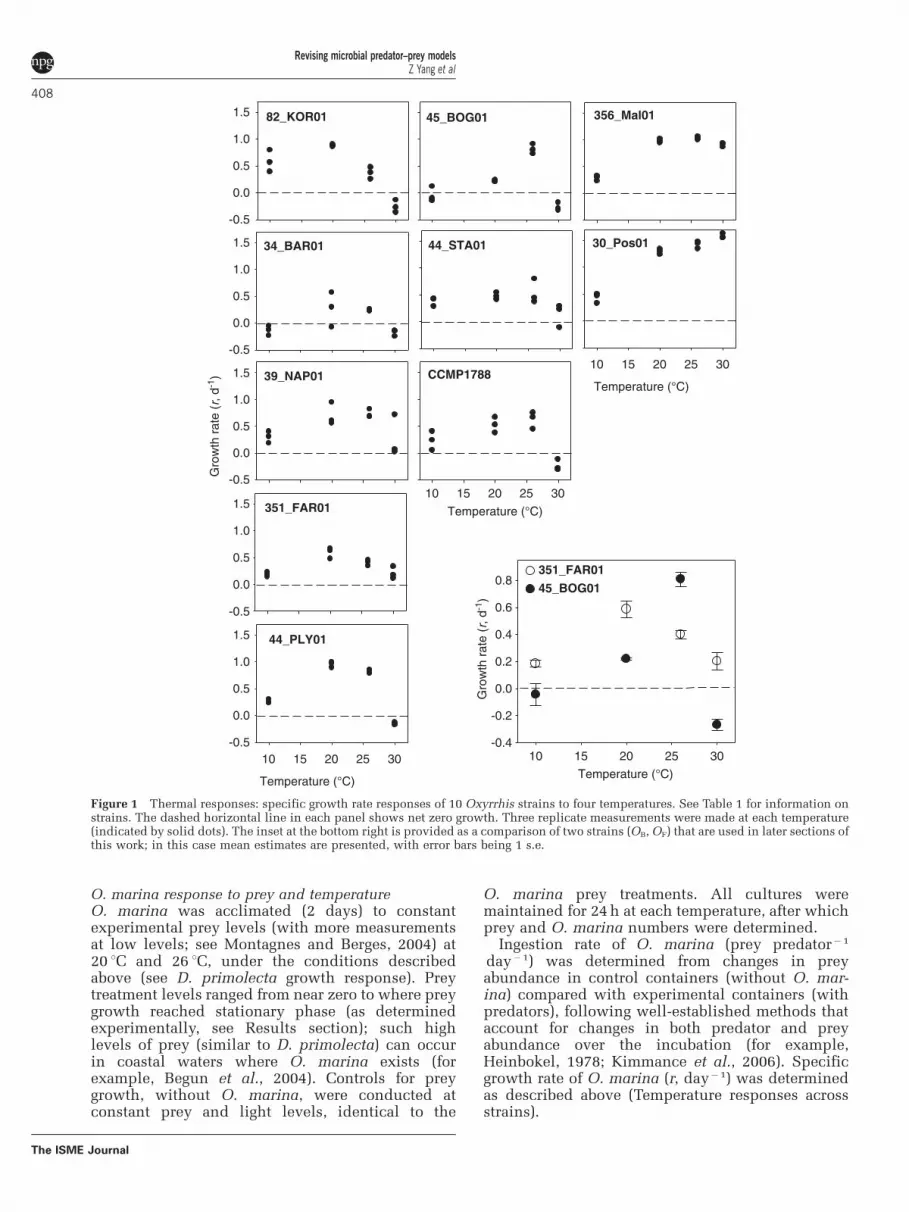
Temperature responses of two strainsThe temperature response data (Figure 1) were usedto select two strains that exhibited differentresponses at 20 1C and 26 1C (351_FAR01 and45_BOG01, Figure 1, Table 1, henceforth abbreviatedto OF and OB, respectively); these strains werechosen based on their unique attributes, rather thanconsidering the wider geographical location theywere isolated from, as it is likely that many protists(and specifically O. marina) are widely dispersedand the local environment will act as a selectiveforce (for example, see Watts et al., 2011). They werestudied in detail in batch cultures to: (1) evaluate ifmaximum growth rates or the functional responsealone would be appropriate predictors of straindifferences and (2) obtain parameterise responsesto be incorporated into a predator–prey populationmodel to further assess strain responses.
D. primolecta growth responseTo fully parameterise the predator–prey model,logistic growth parameters for D. primolecta (thatis, P, the prey) were determined at 20 1C and 26 1C.Triplicate cultures were maintained under theconstant conditions described above, at 20 1C and26 1C. Before experiments, cultures were acclimated(5 days); then change in population abundance wasmeasured over 15 days. Theta-logistic growth curves(Equations 1 and 2; Sibly et al., 2005) were fit to thedata, at each temperature, to determine the carryingcapacity (K, prey ml�1), shape parameter (y) andmaximum growth rate (m, day� 1). Specifically, thesolution of Equation (1) (that is, Equation 2) was fitto the responses of prey abundance (Pt) vs time (t),using the Marquardt–Levenberg algorithm (Sigma-Plot, V 11, Systat Software Inc., San Jose, CA, USA)to obtain estimates of K, m and y (see Table 2).
dP
dt¼ mP 1� P
K
� �y !
ð1Þ
Pt ¼K
1þ KP0
� �y� 1
� �e�myt
� �1y
ð2Þ
Table 1 Strain designation and locations of isolation of O. marina
Strain Location Country Lat Long
45_BOG01 (OB) Bogense Denmark 551 340 14.1600 101 50 2.7600
39_NAP01 Naples Italy 401 470 49.9400 141 110 53.8800
30_POS01 Posithonia Greece 371 400 39.9500 241 03008.7900
CCMP1788a St Maarten Caribbean 181 10 40.8000 �631 30 10.8000
44_PLY01 Plymouth UK 501 210 47.5200 �41 80 20.7600
34_BAR01 Barcelona Spain 41123044.9700 2112034.9700
351_FAR01 (OF) Algarve Portugal 371 10 1.100 �71 590 35.500
82_KOR01b Kunsan Korea 351 580 48.0000 1261 410 60.0000
44_STA01 Scotland (E) UK 561 200 31.5600 �21 470 20.0400
356_Mal01 Bahar ic Caghaq Malta 351 560 24.3600 141 270 23.4000
aFrom the Provasoli–Guillard National Centre for Culture of Marine Phytoplankton, West Boothbay Harbour, ME, USA; Table 1.bKindly provided by Hae Jin Jeong, School of Earth and Environmental Science College of Natural Sciences, Seoul National University, Korea.
Revising microbial predator–prey modelsZ Yang et al
407
The ISME Journal
O. marina response to prey and temperatureO. marina was acclimated (2 days) to constantexperimental prey levels (with more measurementsat low levels; see Montagnes and Berges, 2004) at20 1C and 26 1C, under the conditions describedabove (see D. primolecta growth response). Preytreatment levels ranged from near zero to where preygrowth reached stationary phase (as determinedexperimentally, see Results section); such highlevels of prey (similar to D. primolecta) can occurin coastal waters where O. marina exists (forexample, Begun et al., 2004). Controls for preygrowth, without O. marina, were conducted atconstant prey and light levels, identical to the
O. marina prey treatments. All cultures weremaintained for 24 h at each temperature, after whichprey and O. marina numbers were determined.
Ingestion rate of O. marina (prey predator� 1
day�1) was determined from changes in preyabundance in control containers (without O. mar-ina) compared with experimental containers (withpredators), following well-established methods thataccount for changes in both predator and preyabundance over the incubation (for example,Heinbokel, 1978; Kimmance et al., 2006). Specificgrowth rate of O. marina (r, day�1) was determinedas described above (Temperature responses acrossstrains).
39_NAP01
-0.5
0.0
0.5
1.0
1.5 CCMP1788
10 15 20 25 30
82_KOR01
Gro
wth
rat
e (r
, d-1
)-0.5
0.0
0.5
1.0
1.5
351_FAR01
-0.5
0.0
0.5
1.0
1.5
34_BAR01
Temperature (°C)
-0.5
0.0
0.5
1.0
1.5
44_PLY01
10 15 20 25 30-0.5
0.0
0.5
1.0
1.5
30_Pos01
10 15 20 25 30
45_BOG01
Temperature (°C)
356_Mal01
Temperature (°C)
44_STA01
Temperature (°C)
10 15 20 25 30
Gro
wth
rat
e (r
, d-1
)
-0.4
-0.2
0.0
0.2
0.4
0.6
0.8351_FAR01
45_BOG01
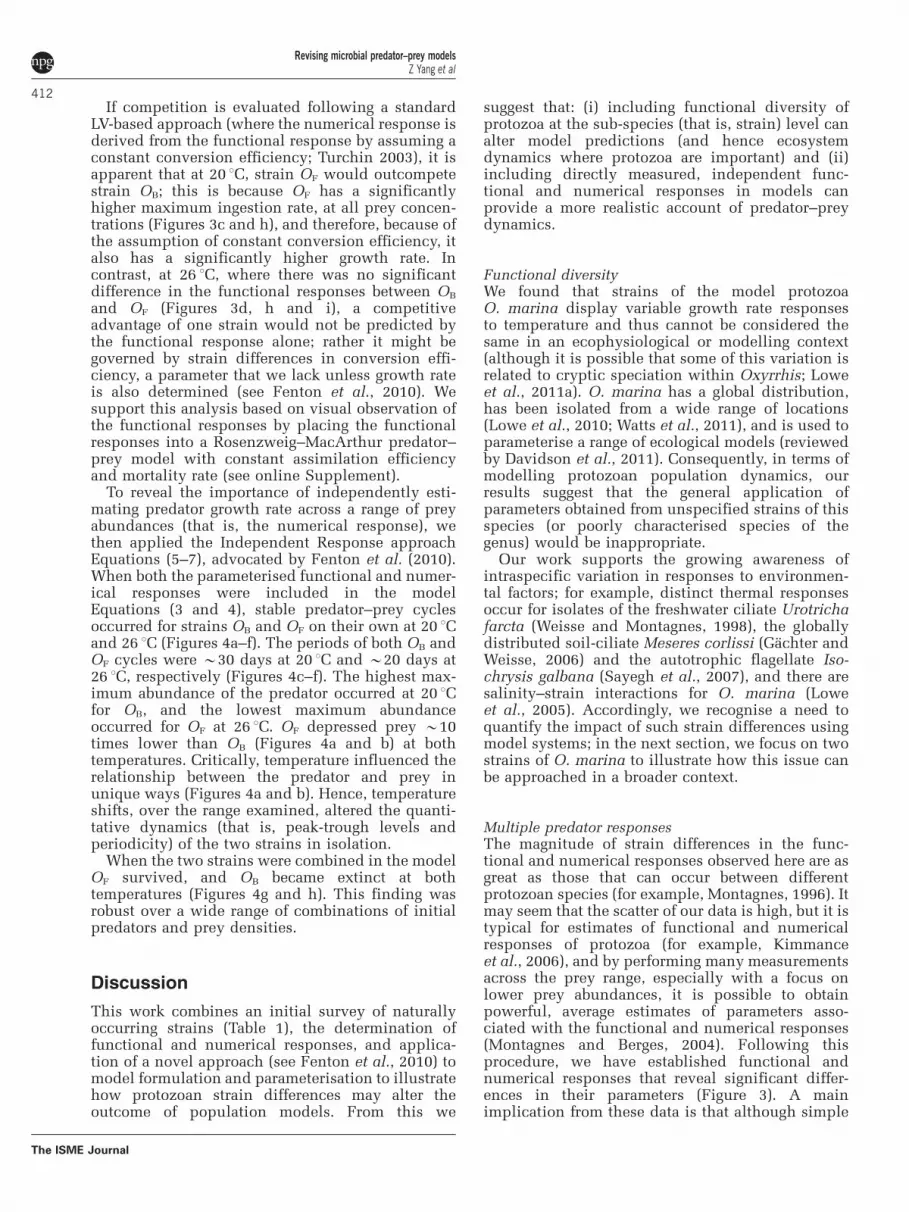
Figure 1 Thermal responses: specific growth rate responses of 10 Oxyrrhis strains to four temperatures. See Table 1 for information onstrains. The dashed horizontal line in each panel shows net zero growth. Three replicate measurements were made at each temperature(indicated by solid dots). The inset at the bottom right is provided as a comparison of two strains (OB, OF) that are used in later sections ofthis work; in this case mean estimates are presented, with error bars being 1 s.e.
Revising microbial predator–prey modelsZ Yang et al
408
The ISME Journal
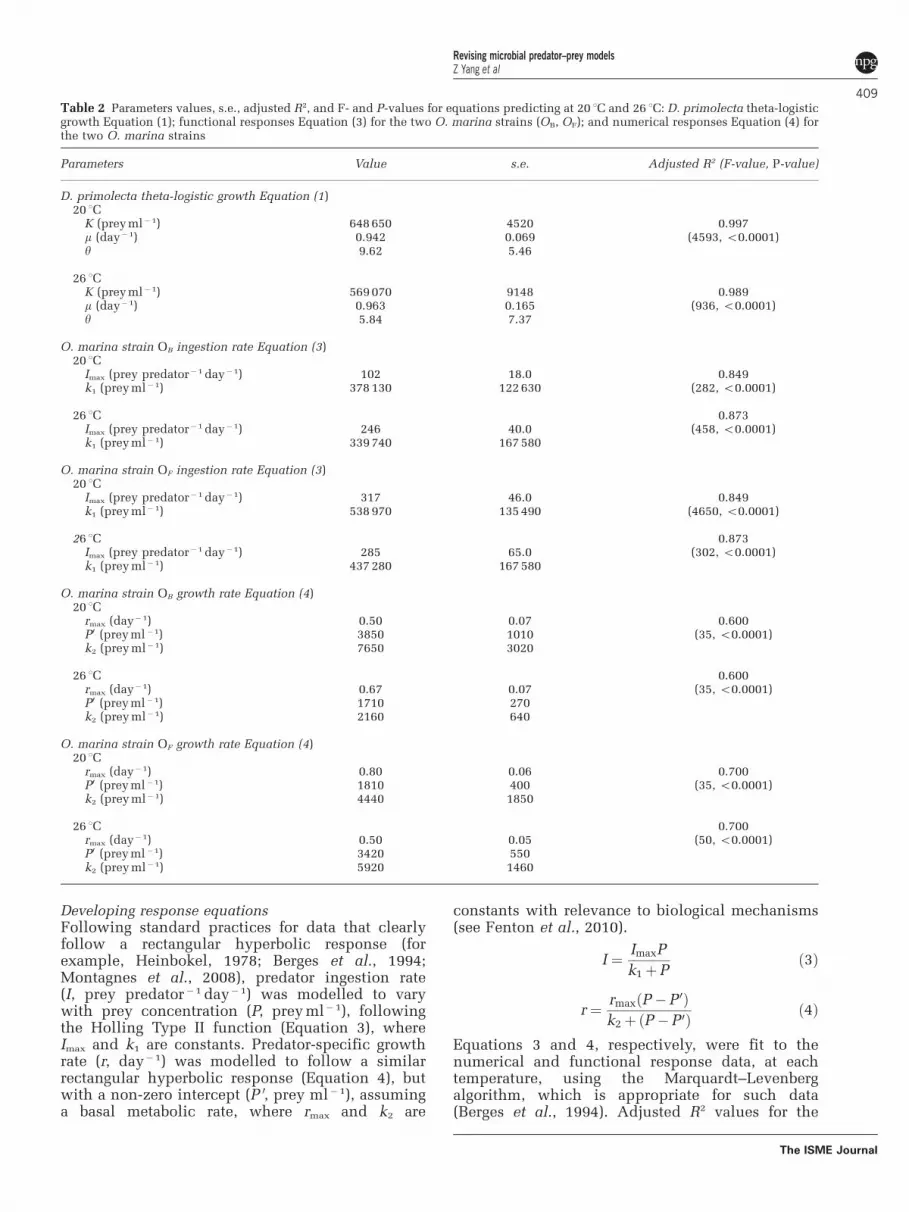
Developing response equationsFollowing standard practices for data that clearlyfollow a rectangular hyperbolic response (forexample, Heinbokel, 1978; Berges et al., 1994;Montagnes et al., 2008), predator ingestion rate(I, prey predator�1 day�1) was modelled to varywith prey concentration (P, prey ml�1), followingthe Holling Type II function (Equation 3), whereImax and k1 are constants. Predator-specific growthrate (r, day�1) was modelled to follow a similarrectangular hyperbolic response (Equation 4), butwith a non-zero intercept (P 0, prey ml� 1), assuminga basal metabolic rate, where rmax and k2 are
constants with relevance to biological mechanisms(see Fenton et al., 2010).
I ¼ ImaxP
k1þPð3Þ
r¼ rmaxðP�P 0Þk2þðP�P0Þ ð4Þ
Equations 3 and 4, respectively, were fit to thenumerical and functional response data, at eachtemperature, using the Marquardt–Levenbergalgorithm, which is appropriate for such data(Berges et al., 1994). Adjusted R2 values for the
Table 2 Parameters values, s.e., adjusted R2, and F- and P-values for equations predicting at 20 1C and 26 1C: D. primolecta theta-logisticgrowth Equation (1); functional responses Equation (3) for the two O. marina strains (OB, OF); and numerical responses Equation (4) forthe two O. marina strains
Parameters Value s.e. Adjusted R2 (F-value, P-value)
D. primolecta theta-logistic growth Equation (1)20 1C
K (prey ml�1) 648 650 4520 0.997m (day�1) 0.942 0.069 (4593, o0.0001)y 9.62 5.46
26 1CK (prey ml�1) 569 070 9148 0.989m (day�1) 0.963 0.165 (936, o0.0001)y 5.84 7.37
O. marina strain OB ingestion rate Equation (3)20 1C
Imax (prey predator�1 day�1) 102 18.0 0.849k1 (prey ml�1) 378 130 122 630 (282, o0.0001)
26 1C 0.873Imax (prey predator�1 day�1) 246 40.0 (458, o0.0001)k1 (prey ml�1) 339 740 167 580
O. marina strain OF ingestion rate Equation (3)20 1C
Imax (prey predator�1 day�1) 317 46.0 0.849k1 (prey ml�1) 538 970 135 490 (4650, o0.0001)
26 1C 0.873Imax (prey predator�1 day�1) 285 65.0 (302, o0.0001)k1 (prey ml�1) 437 280 167 580
O. marina strain OB growth rate Equation (4)20 1C
rmax (day�1) 0.50 0.07 0.600P0 (prey ml�1) 3850 1010 (35, o0.0001)k2 (prey ml�1) 7650 3020
26 1C 0.600rmax (day�1) 0.67 0.07 (35, o0.0001)P0 (prey ml�1) 1710 270k2 (prey ml�1) 2160 640
O. marina strain OF growth rate Equation (4)20 1C
rmax (day�1) 0.80 0.06 0.700P0 (prey ml�1) 1810 400 (35, o0.0001)k2 (prey ml�1) 4440 1850
26 1C 0.700rmax (day�1) 0.50 0.05 (50, o0.0001)P0 (prey ml�1) 3420 550k2 (prey ml�1) 5920 1460
Revising microbial predator–prey modelsZ Yang et al
409
The ISME Journal
responses, P- and F-statistics for the regression, andstandard errors of the estimates are presented asindications of their goodness of fit. Comparisons ofresponses were performed using Bonferroni-cor-rected t-tests (Sokal and Rohlf, 1995) on responseparameters. This was conducted by applying pooledstandard errors obtained from the non-linear curvefitting (Table 2) and for determining the degrees offreedom the sample size was equal to the lowestvalues used in any comparison. For all tests a¼ 0.05.
The influence of temperature on strain populationdynamicsTo explore the extent to which temperature-inducedstrain differences alter (i) population dynamics and(ii) competition between two O. marina strains, amodel was constructed. Here we used the indepen-dent responses at each temperature (20 1C and 26 1C)for D. primolecta (P) and the two O. marina strainsOF and OB (Table 1): D. primolecta grew followingEquation 1 and was preyed upon by populations ofthe two strains of O. marina (OB, OF), based on theirfunctional responses (Equation 3); O. marina (OB,OF) growth rates were prey dependent and werenegative, because of starvation, below thresholdlevels (Equation 4). We applied an additive modelof exploitative competition, such that eachpredator strain acted independently of the other,and the only interaction between predators wasindirect, via the limiting prey resource. This is thesimplest model of two consumers competing for anexplicitly modelled resource and the most appro-priate starting point in the absence of data to informmore sophisticated relationships. Equations (5–7)describe the model:
dOF
dt¼ rFOF ð5Þ
dOB
dt¼ rBOB ð6Þ
dP
dt¼ m 1� P
K
� �y !P� IFOF� IBOB ð7Þ
where OF and OB are the abundance of the twostrains; rF and rB are the prey-dependent growthrates of the two strains Equation (4); IF and IB are theprey-dependent ingestion rates of the two strainsEquation (3); P is prey abundance; m is the specificgrowth rate of the prey; K is the prey carryingcapacity; and y is the shape parameter of the logisticgrowth curve Equation (1).
Results
Temperature responses across strainsGrowth rates of O. marina strains ranged between� 0.37 and 1.63 day�1, generally increasing withtemperatures between 10 1C and 20 1C; at 10 1C and30 1C growth was low or negative (Figure 1). There
was significant variation between strains in theirtemperature responses (that is, significant interac-tions between temperature and strain; two-wayanalysis of variance, a¼ 0.05), both quantitatively,in terms of maximum and minimum growth ratesand temperatures of peak growth and qualitatively,in terms of the overall shapes of the growthresponses with temperature (Figure 1). These dataindicate substantial variation in the thermal growthresponses of O. marina, sampled from a range oflocations (Table 1). Recognising these differences inthermal responses, the remainder of this studyfocused on two example strains, 45_BOG01 and351_FAR01 (OB and OF, respectively), which exhib-ited significantly different responses at 20 1C and26 1C (t-test, a¼ 0.05; inset, Figure 1).
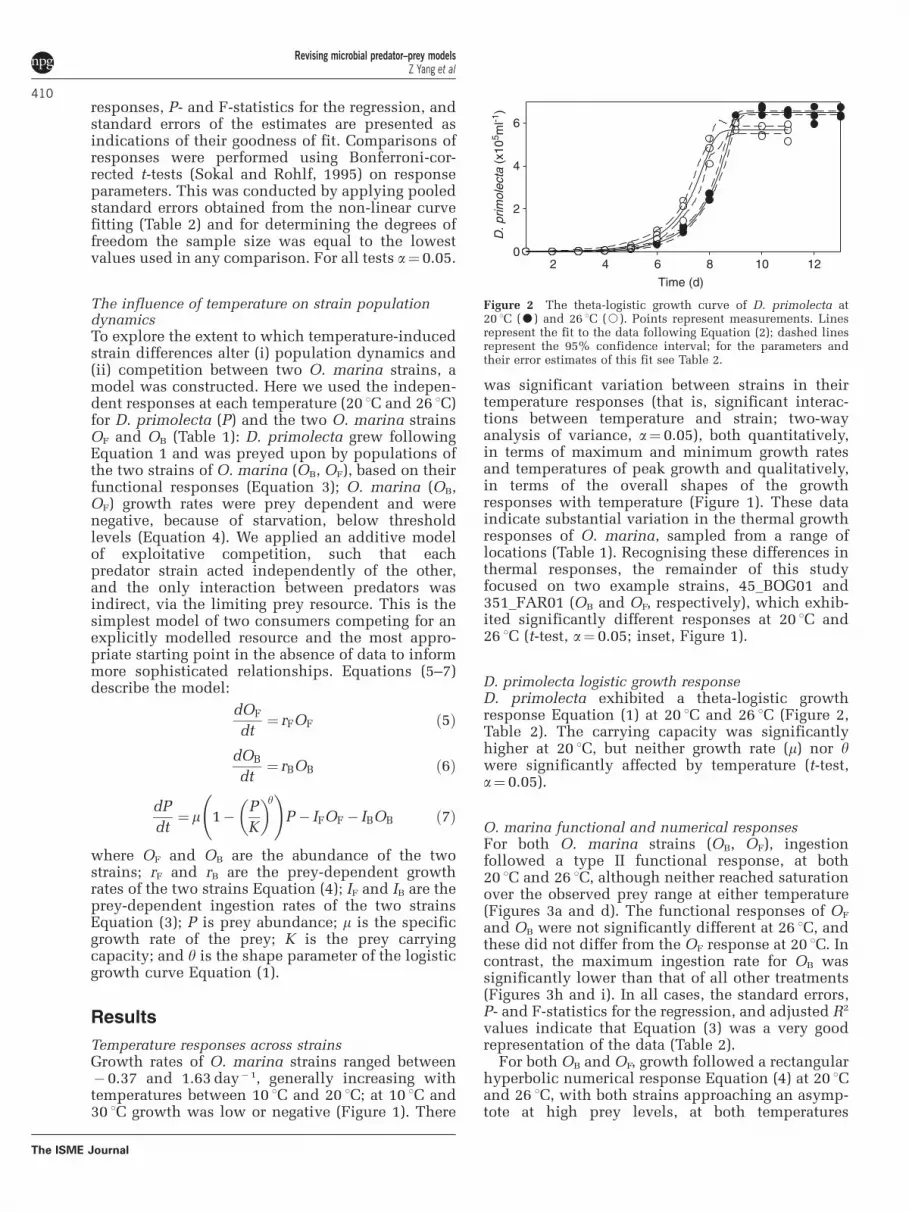
D. primolecta logistic growth responseD. primolecta exhibited a theta-logistic growthresponse Equation (1) at 20 1C and 26 1C (Figure 2,Table 2). The carrying capacity was significantlyhigher at 20 1C, but neither growth rate (m) nor ywere significantly affected by temperature (t-test,a¼ 0.05).
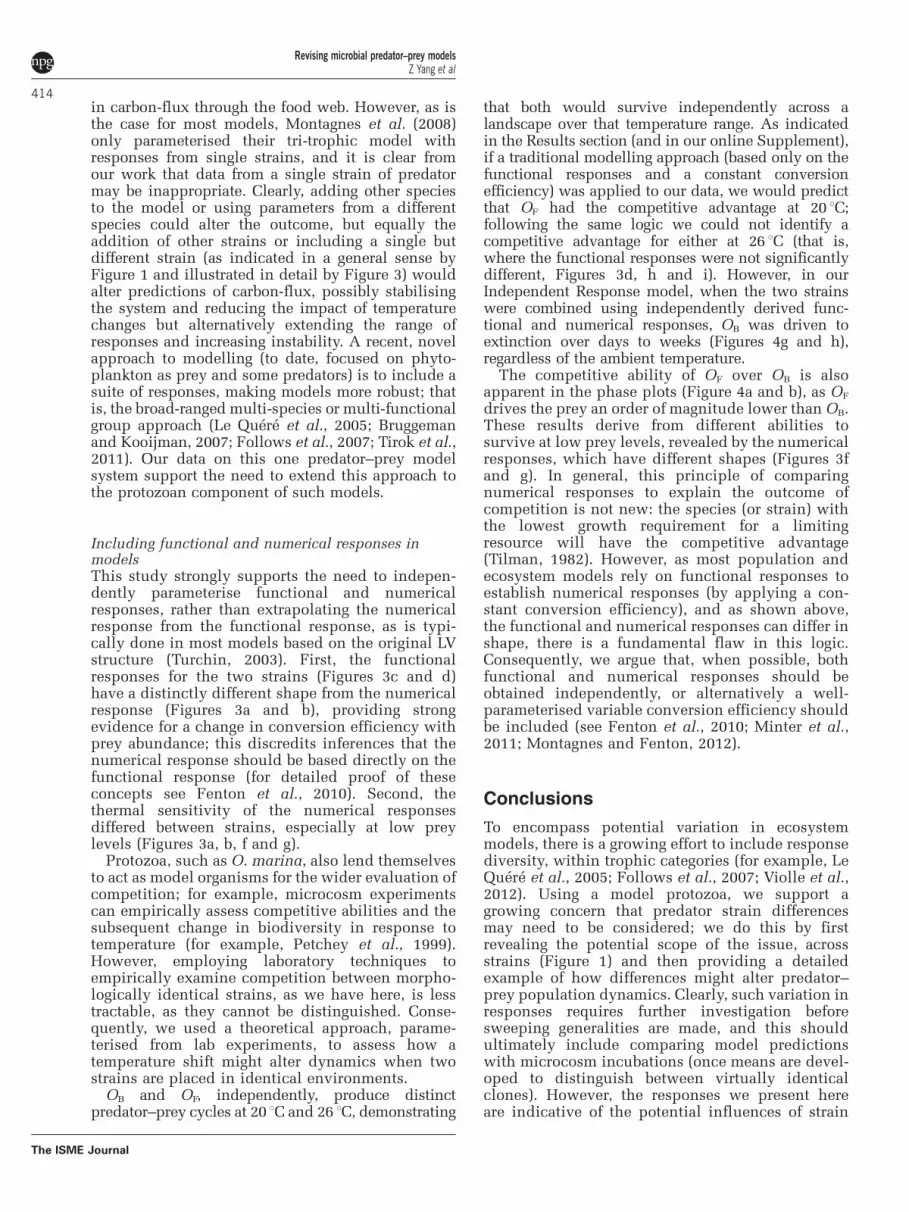
O. marina functional and numerical responsesFor both O. marina strains (OB, OF), ingestionfollowed a type II functional response, at both20 1C and 26 1C, although neither reached saturationover the observed prey range at either temperature(Figures 3a and d). The functional responses of OF
and OB were not significantly different at 26 1C, andthese did not differ from the OF response at 20 1C. Incontrast, the maximum ingestion rate for OB wassignificantly lower than that of all other treatments(Figures 3h and i). In all cases, the standard errors,P- and F-statistics for the regression, and adjusted R2
values indicate that Equation (3) was a very goodrepresentation of the data (Table 2).
For both OB and OF, growth followed a rectangularhyperbolic numerical response Equation (4) at 20 1Cand 26 1C, with both strains approaching an asymp-tote at high prey levels, at both temperatures
Time (d)
2 4 6 8 10 12
D. p
rimol
ecta
(x1
05 ml-1
)
0
2
4
6
Figure 2 The theta-logistic growth curve of D. primolecta at20 1C (K) and 26 1C (J). Points represent measurements. Linesrepresent the fit to the data following Equation (2); dashed linesrepresent the 95% confidence interval; for the parameters andtheir error estimates of this fit see Table 2.
Revising microbial predator–prey modelsZ Yang et al
410
The ISME Journal

(Figures 3a and b). There were significant differ-ences between the numerical response parametersfor the two strains, at the two temperatures (Figures3e–g). In terms of maximum growth rate and thethreshold prey concentration, the two strains hadvirtually reversed responses at the two temperatures(Figures 3a–f). However, the k2-value Equation (4),reflecting the initial curvature of the response, didnot follow this pattern (Figure 3g); the significantchanges in k2 values imposed subtle (but as will beseen below important) changes to survival at lowprey concentrations. The standard errors and
adjusted R2 values indicate that Equation (4) was agood representation of the data (Table 2).
Model resultsAs indicated in the Introduction and Materials andmethods Equations (5–7), we explored whetherpredator–prey dynamics would differ betweenstains. However, we first assessed how sensitiveour predictions were to the modelling frameworkused, as the outcome of this analysis impacted ourevaluation of strain differences.
0 5000 10000 15000 20000 25000 30000 35000 40000 45000 300000 600000
Gro
wth
rat
e (r
, d-1
)G
row
th r
ate
(r, d
-1)
-1.0
-0.5
0.0
0.5
1.0
Prey concentration (ml-1)
0 5000 10000 15000 20000 25000 30000 35000 40000 45000 300000 600000-1.0
-0.5
0.0
0.5
1.0
0 200000 400000 600000
Inge
stio
n (h
-1)
Inge
stio
n (h
-1)
0
2
4
6
8
10
OF
OB
0 200000 400000 6000000
2
4
6
8
10
20 26
r max
(d-1
)
0.4
0.5
0.6
0.7
0.8
0.9
Temperature (°C)
20 26
P' (
x103 p
rey
ml-1
)
1
2
3
4
5
20 26
k 2' (
x103 p
rey
ml-1
)
0
2
4
6
8
10
12
20 26
I max
' (pr
ey h
1 )
2468
1012141618
20 26
k 1' (
x105 p
rey
ml-1
)
2
3
4
5
6
7
a
a
b b
aa
b b
a
a
b
b
a
aaa
b
a
aa
a
Prey concentration (ml-1) Prey concentration (ml-1)
20 °C
20 °C
26 °C
26 °C
Figure 3 Numerical (a, b) and functional (c, d) responses of strains OF (3) and OB (�) of O. marina. Points represent measurements.Solid and dashed lines on a–d represent the fit of Equation (3) (c, d) or Equation (4) (a, b) to the data. Coloured lines represent95% confidence intervals of the fit line. For details of significance of the fit of the response and the parameters and their error estimates seeTable 2. (e–i): parameter estimates (error bars¼1 s.e.) for Equation (3) (h, i) and Equation (4) (e–g). Lines on e–i link measurements on the samestrain. Symbols with the same letters (‘a’, ‘b’) indicate parameters that were not significantly different (see Materials and methods section).
Revising microbial predator–prey modelsZ Yang et al
411
The ISME Journal
If competition is evaluated following a standardLV-based approach (where the numerical response isderived from the functional response by assuming aconstant conversion efficiency; Turchin 2003), it isapparent that at 20 1C, strain OF would outcompetestrain OB; this is because OF has a significantlyhigher maximum ingestion rate, at all prey concen-trations (Figures 3c and h), and therefore, because ofthe assumption of constant conversion efficiency, italso has a significantly higher growth rate. Incontrast, at 26 1C, where there was no significantdifference in the functional responses between OB
and OF (Figures 3d, h and i), a competitiveadvantage of one strain would not be predicted bythe functional response alone; rather it might begoverned by strain differences in conversion effi-ciency, a parameter that we lack unless growth rateis also determined (see Fenton et al., 2010). Wesupport this analysis based on visual observation ofthe functional responses by placing the functionalresponses into a Rosenzweig–MacArthur predator–prey model with constant assimilation efficiencyand mortality rate (see online Supplement).
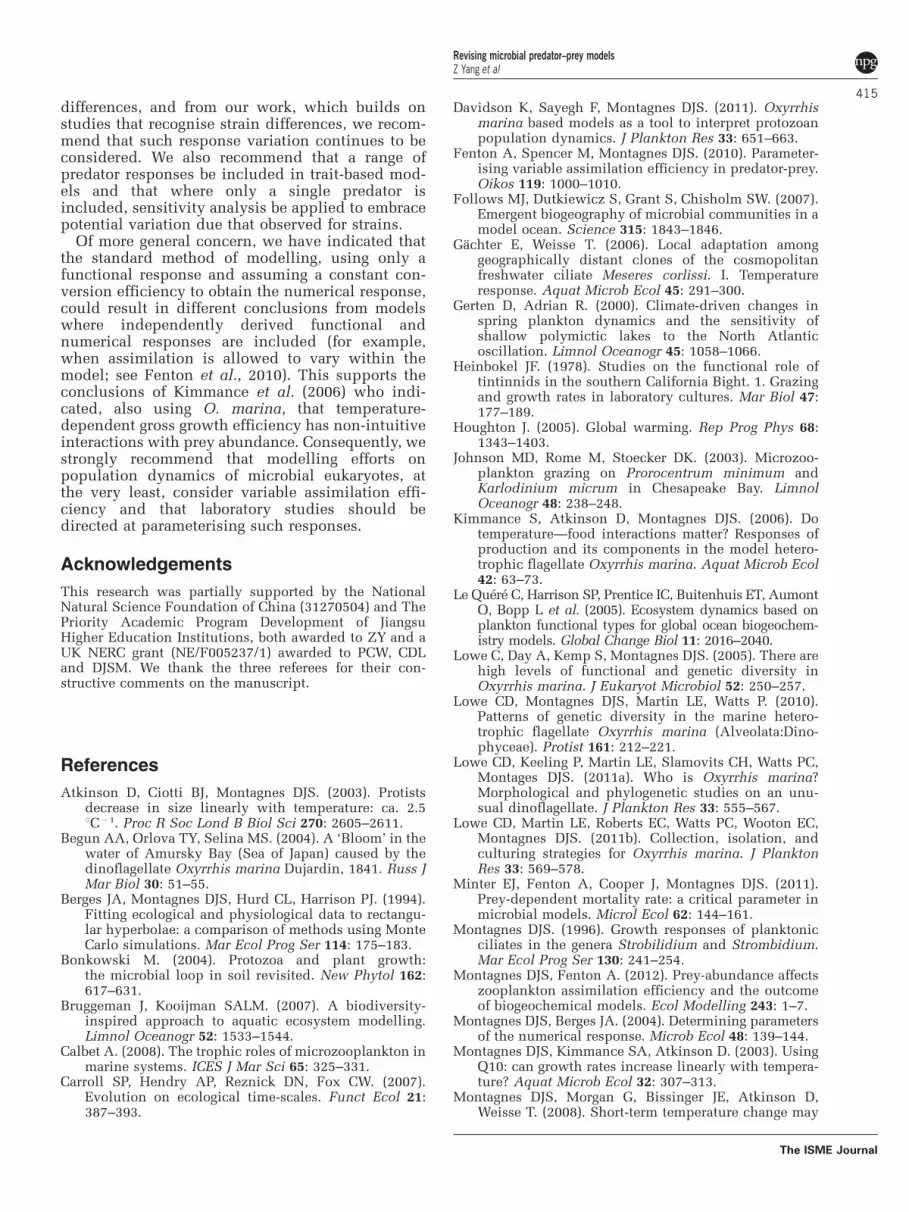
To reveal the importance of independently esti-mating predator growth rate across a range of preyabundances (that is, the numerical response), wethen applied the Independent Response approachEquations (5–7), advocated by Fenton et al. (2010).When both the parameterised functional and numer-ical responses were included in the modelEquations (3 and 4), stable predator–prey cyclesoccurred for strains OB and OF on their own at 20 1Cand 26 1C (Figures 4a–f). The periods of both OB andOF cycles were B30 days at 20 1C and B20 days at26 1C, respectively (Figures 4c–f). The highest max-imum abundance of the predator occurred at 20 1Cfor OB, and the lowest maximum abundanceoccurred for OF at 26 1C. OF depressed prey B10times lower than OB (Figures 4a and b) at bothtemperatures. Critically, temperature influenced therelationship between the predator and prey inunique ways (Figures 4a and b). Hence, temperatureshifts, over the range examined, altered the quanti-tative dynamics (that is, peak-trough levels andperiodicity) of the two strains in isolation.
When the two strains were combined in the modelOF survived, and OB became extinct at bothtemperatures (Figures 4g and h). This finding wasrobust over a wide range of combinations of initialpredators and prey densities.
Discussion
This work combines an initial survey of naturallyoccurring strains (Table 1), the determination offunctional and numerical responses, and applica-tion of a novel approach (see Fenton et al., 2010) tomodel formulation and parameterisation to illustratehow protozoan strain differences may alter theoutcome of population models. From this we
suggest that: (i) including functional diversity ofprotozoa at the sub-species (that is, strain) level canalter model predictions (and hence ecosystemdynamics where protozoa are important) and (ii)including directly measured, independent func-tional and numerical responses in models canprovide a more realistic account of predator–preydynamics.
Functional diversityWe found that strains of the model protozoaO. marina display variable growth rate responsesto temperature and thus cannot be considered thesame in an ecophysiological or modelling context(although it is possible that some of this variation isrelated to cryptic speciation within Oxyrrhis; Loweet al., 2011a). O. marina has a global distribution,has been isolated from a wide range of locations(Lowe et al., 2010; Watts et al., 2011), and is used toparameterise a range of ecological models (reviewedby Davidson et al., 2011). Consequently, in terms ofmodelling protozoan population dynamics, ourresults suggest that the general application ofparameters obtained from unspecified strains of thisspecies (or poorly characterised species of thegenus) would be inappropriate.
Our work supports the growing awareness ofintraspecific variation in responses to environmen-tal factors; for example, distinct thermal responsesoccur for isolates of the freshwater ciliate Urotrichafarcta (Weisse and Montagnes, 1998), the globallydistributed soil-ciliate Meseres corlissi (Gachter andWeisse, 2006) and the autotrophic flagellate Iso-chrysis galbana (Sayegh et al., 2007), and there aresalinity–strain interactions for O. marina (Loweet al., 2005). Accordingly, we recognise a need toquantify the impact of such strain differences usingmodel systems; in the next section, we focus on twostrains of O. marina to illustrate how this issue canbe approached in a broader context.
Multiple predator responsesThe magnitude of strain differences in the func-tional and numerical responses observed here are asgreat as those that can occur between differentprotozoan species (for example, Montagnes, 1996). Itmay seem that the scatter of our data is high, but it istypical for estimates of functional and numericalresponses of protozoa (for example, Kimmanceet al., 2006), and by performing many measurementsacross the prey range, especially with a focus onlower prey abundances, it is possible to obtainpowerful, average estimates of parameters asso-ciated with the functional and numerical responses(Montagnes and Berges, 2004). Following thisprocedure, we have established functional andnumerical responses that reveal significant differ-ences in their parameters (Figure 3). A mainimplication from these data is that although simple
Revising microbial predator–prey modelsZ Yang et al
412
The ISME Journal

parameters such as maximal growth rate may beuseful and appropriate criteria for recognising straindiversity (Figure 1), they are unlikely to distinguishdifferences in a more dynamic, ecological context.Given the importance of temperature as a keyenvironmental driver of ecological dynamics, wespecifically explored its influence on straindynamics.
Following predicted long-term increases (3–6 1Cover the next century; Houghton, 2005), temperatureof small water bodies, such as ponds and shallowestuaries will rise; specifically, the latter is whereprey that are suitable food for O. marina occur atlevels up to 106–107 ml�1, and O. marina can beabundant (4100 ml� 1), occasionally reaching105 ml�1 (Johnson et al., 2003; Begun et al., 2004).Furthermore, the intensity and frequency of short-term temperature variations because of global
warming will increase (Houghton, 2005), andshort-term warming events caused by other environ-mental processes, ranging from the North AtlanticOscillation to seasonal effects, will alter the tem-perature of isolated water bodies (for example,Gerten and Adrian, 2000). Consequently, environ-ments where taxa, such as our model protozoa, areabundant will be affected by temperature change. Ina tri-trophic model (flagellate-ciliate-Daphnia),Montagnes et al. (2008) proposed that short-termtemperature fluctuations would impact carbon fluxin small fresh water bodies; in fact, they suggestedthat small temperature shifts could virtually blocktrophic coupling. Similarly, in our system, for bothO. marina strains there were temperature-induceddifferences in the predator–prey dynamics (that is,changes in amplitude and frequency of cycles,Figure 3) that would manifest themselves in changes
log Duneliella primolecta (ml-1)
0 2 4 6
log
Oxy
rrhi
s m
arin
aOF (
ml-1
)
0
1
2
3
4
log
Oxy
rrhi
s m
arin
aOB (
ml-1
)
0
1
2
3
4
0
2
4
6
0510152025
0
2
4
6
0510152025OB 26 °C
OB 20 °C
0
2
4
6
0510152025
Dun
elie
lla p
rimol
ecta
(x
105
ml-1
)
0
2
4
6
0510152025OF 26 °C
OF 20 °C
Oxy
rrhi
s m
arin
a (x
103
ml-1
)
Time (d)0 20 40 60 80 100 120
0
2
4
6105
101
26 °C
D. primolecta OB OF
0
2
4
6105
101
26 °C
20 °C
20 °C
Oxy
rrhi
s m
arin
a (m
l-1)
Figure 4 Model results for simulations with strains of O. marina (OF or OB, Table 1) and D. primolecta. (a, b) Phase plots for OB and OF,respectively. (c–f) Time-series for the two strains on their own with prey, at the two temperatures to illustrate period lengths andamplitudes. (g, h) Time-series for the two strains combined, at the two temperatures, to illustrate period lengths and amplitudes, thepersistence of OF, and the rapid extinction of strain OB. Simulations for preyþ one predator strain were initiated at a range of D.primolecta and O. marina abundances, all of which converged on single cycles (a, b). Simulations with preyþOBþOF also all convergedon single predator–prey cycles, as OB became extinct; to illustrate this, time-series were presented that were initiated at 103 ml�1 D.primolecta and 103 ml�1 O. marina (g, h).
Revising microbial predator–prey modelsZ Yang et al
413
The ISME Journal
in carbon-flux through the food web. However, as isthe case for most models, Montagnes et al. (2008)only parameterised their tri-trophic model withresponses from single strains, and it is clear fromour work that data from a single strain of predatormay be inappropriate. Clearly, adding other speciesto the model or using parameters from a differentspecies could alter the outcome, but equally theaddition of other strains or including a single butdifferent strain (as indicated in a general sense byFigure 1 and illustrated in detail by Figure 3) wouldalter predictions of carbon-flux, possibly stabilisingthe system and reducing the impact of temperaturechanges but alternatively extending the range ofresponses and increasing instability. A recent, novelapproach to modelling (to date, focused on phyto-plankton as prey and some predators) is to include asuite of responses, making models more robust; thatis, the broad-ranged multi-species or multi-functionalgroup approach (Le Quere et al., 2005; Bruggemanand Kooijman, 2007; Follows et al., 2007; Tirok et al.,2011). Our data on this one predator–prey modelsystem support the need to extend this approach tothe protozoan component of such models.
Including functional and numerical responses inmodelsThis study strongly supports the need to indepen-dently parameterise functional and numericalresponses, rather than extrapolating the numericalresponse from the functional response, as is typi-cally done in most models based on the original LVstructure (Turchin, 2003). First, the functionalresponses for the two strains (Figures 3c and d)have a distinctly different shape from the numericalresponse (Figures 3a and b), providing strongevidence for a change in conversion efficiency withprey abundance; this discredits inferences that thenumerical response should be based directly on thefunctional response (for detailed proof of theseconcepts see Fenton et al., 2010). Second, thethermal sensitivity of the numerical responsesdiffered between strains, especially at low preylevels (Figures 3a, b, f and g).
Protozoa, such as O. marina, also lend themselvesto act as model organisms for the wider evaluation ofcompetition; for example, microcosm experimentscan empirically assess competitive abilities and thesubsequent change in biodiversity in response totemperature (for example, Petchey et al., 1999).However, employing laboratory techniques toempirically examine competition between morpho-logically identical strains, as we have here, is lesstractable, as they cannot be distinguished. Conse-quently, we used a theoretical approach, parame-terised from lab experiments, to assess how atemperature shift might alter dynamics when twostrains are placed in identical environments.
OB and OF, independently, produce distinctpredator–prey cycles at 20 1C and 26 1C, demonstrating
that both would survive independently across alandscape over that temperature range. As indicatedin the Results section (and in our online Supplement),if a traditional modelling approach (based only on thefunctional responses and a constant conversionefficiency) was applied to our data, we would predictthat OF had the competitive advantage at 20 1C;following the same logic we could not identify acompetitive advantage for either at 26 1C (that is,where the functional responses were not significantlydifferent, Figures 3d, h and i). However, in ourIndependent Response model, when the two strainswere combined using independently derived func-tional and numerical responses, OB was driven toextinction over days to weeks (Figures 4g and h),regardless of the ambient temperature.
The competitive ability of OF over OB is alsoapparent in the phase plots (Figure 4a and b), as OF
drives the prey an order of magnitude lower than OB.These results derive from different abilities tosurvive at low prey levels, revealed by the numericalresponses, which have different shapes (Figures 3fand g). In general, this principle of comparingnumerical responses to explain the outcome ofcompetition is not new: the species (or strain) withthe lowest growth requirement for a limitingresource will have the competitive advantage(Tilman, 1982). However, as most population andecosystem models rely on functional responses toestablish numerical responses (by applying a con-stant conversion efficiency), and as shown above,the functional and numerical responses can differ inshape, there is a fundamental flaw in this logic.Consequently, we argue that, when possible, bothfunctional and numerical responses should beobtained independently, or alternatively a well-parameterised variable conversion efficiency shouldbe included (see Fenton et al., 2010; Minter et al.,2011; Montagnes and Fenton, 2012).
Conclusions
To encompass potential variation in ecosystemmodels, there is a growing effort to include responsediversity, within trophic categories (for example, LeQuere et al., 2005; Follows et al., 2007; Violle et al.,2012). Using a model protozoa, we support agrowing concern that predator strain differencesmay need to be considered; we do this by firstrevealing the potential scope of the issue, acrossstrains (Figure 1) and then providing a detailedexample of how differences might alter predator–prey population dynamics. Clearly, such variation inresponses requires further investigation beforesweeping generalities are made, and this shouldultimately include comparing model predictionswith microcosm incubations (once means are devel-oped to distinguish between virtually identicalclones). However, the responses we present hereare indicative of the potential influences of strain
Revising microbial predator–prey modelsZ Yang et al
414
The ISME Journal
differences, and from our work, which builds onstudies that recognise strain differences, we recom-mend that such response variation continues to beconsidered. We also recommend that a range ofpredator responses be included in trait-based mod-els and that where only a single predator isincluded, sensitivity analysis be applied to embracepotential variation due that observed for strains.
Of more general concern, we have indicated thatthe standard method of modelling, using only afunctional response and assuming a constant con-version efficiency to obtain the numerical response,could result in different conclusions from modelswhere independently derived functional andnumerical responses are included (for example,when assimilation is allowed to vary within themodel; see Fenton et al., 2010). This supports theconclusions of Kimmance et al. (2006) who indi-cated, also using O. marina, that temperature-dependent gross growth efficiency has non-intuitiveinteractions with prey abundance. Consequently, westrongly recommend that modelling efforts onpopulation dynamics of microbial eukaryotes, atthe very least, consider variable assimilation effi-ciency and that laboratory studies should bedirected at parameterising such responses.
Acknowledgements
This research was partially supported by the NationalNatural Science Foundation of China (31270504) and ThePriority Academic Program Development of JiangsuHigher Education Institutions, both awarded to ZY and aUK NERC grant (NE/F005237/1) awarded to PCW, CDLand DJSM. We thank the three referees for their con-structive comments on the manuscript.
References
Atkinson D, Ciotti BJ, Montagnes DJS. (2003). Protistsdecrease in size linearly with temperature: ca. 2.51C�1. Proc R Soc Lond B Biol Sci 270: 2605–2611.
Begun AA, Orlova TY, Selina MS. (2004). A ‘Bloom’ in thewater of Amursky Bay (Sea of Japan) caused by thedinoflagellate Oxyrrhis marina Dujardin, 1841. Russ JMar Biol 30: 51–55.
Berges JA, Montagnes DJS, Hurd CL, Harrison PJ. (1994).Fitting ecological and physiological data to rectangu-lar hyperbolae: a comparison of methods using MonteCarlo simulations. Mar Ecol Prog Ser 114: 175–183.
Bonkowski M. (2004). Protozoa and plant growth:the microbial loop in soil revisited. New Phytol 162:617–631.
Bruggeman J, Kooijman SALM. (2007). A biodiversity-inspired approach to aquatic ecosystem modelling.Limnol Oceanogr 52: 1533–1544.
Calbet A. (2008). The trophic roles of microzooplankton inmarine systems. ICES J Mar Sci 65: 325–331.
Carroll SP, Hendry AP, Reznick DN, Fox CW. (2007).Evolution on ecological time-scales. Funct Ecol 21:387–393.
Davidson K, Sayegh F, Montagnes DJS. (2011). Oxyrrhismarina based models as a tool to interpret protozoanpopulation dynamics. J Plankton Res 33: 651–663.
Fenton A, Spencer M, Montagnes DJS. (2010). Parameter-ising variable assimilation efficiency in predator-prey.Oikos 119: 1000–1010.
Follows MJ, Dutkiewicz S, Grant S, Chisholm SW. (2007).Emergent biogeography of microbial communities in amodel ocean. Science 315: 1843–1846.
Gachter E, Weisse T. (2006). Local adaptation amonggeographically distant clones of the cosmopolitanfreshwater ciliate Meseres corlissi. I. Temperatureresponse. Aquat Microb Ecol 45: 291–300.
Gerten D, Adrian R. (2000). Climate-driven changes inspring plankton dynamics and the sensitivity ofshallow polymictic lakes to the North Atlanticoscillation. Limnol Oceanogr 45: 1058–1066.
Heinbokel JF. (1978). Studies on the functional role oftintinnids in the southern California Bight. 1. Grazingand growth rates in laboratory cultures. Mar Biol 47:177–189.
Houghton J. (2005). Global warming. Rep Prog Phys 68:1343–1403.
Johnson MD, Rome M, Stoecker DK. (2003). Microzoo-plankton grazing on Prorocentrum minimum andKarlodinium micrum in Chesapeake Bay. LimnolOceanogr 48: 238–248.
Kimmance S, Atkinson D, Montagnes DJS. (2006). Dotemperature—food interactions matter? Responses ofproduction and its components in the model hetero-trophic flagellate Oxyrrhis marina. Aquat Microb Ecol42: 63–73.
Le Quere C, Harrison SP, Prentice IC, Buitenhuis ET, AumontO, Bopp L et al. (2005). Ecosystem dynamics based onplankton functional types for global ocean biogeochem-istry models. Global Change Biol 11: 2016–2040.
Lowe C, Day A, Kemp S, Montagnes DJS. (2005). There arehigh levels of functional and genetic diversity inOxyrrhis marina. J Eukaryot Microbiol 52: 250–257.
Lowe CD, Montagnes DJS, Martin LE, Watts P. (2010).Patterns of genetic diversity in the marine hetero-trophic flagellate Oxyrrhis marina (Alveolata:Dino-phyceae). Protist 161: 212–221.
Lowe CD, Keeling P, Martin LE, Slamovits CH, Watts PC,Montages DJS. (2011a). Who is Oxyrrhis marina?Morphological and phylogenetic studies on an unu-sual dinoflagellate. J Plankton Res 33: 555–567.
Lowe CD, Martin LE, Roberts EC, Watts PC, Wooton EC,Montagnes DJS. (2011b). Collection, isolation, andculturing strategies for Oxyrrhis marina. J PlanktonRes 33: 569–578.
Minter EJ, Fenton A, Cooper J, Montagnes DJS. (2011).Prey-dependent mortality rate: a critical parameter inmicrobial models. Microl Ecol 62: 144–161.
Montagnes DJS. (1996). Growth responses of planktonicciliates in the genera Strobilidium and Strombidium.Mar Ecol Prog Ser 130: 241–254.
Montagnes DJS, Fenton A. (2012). Prey-abundance affectszooplankton assimilation efficiency and the outcomeof biogeochemical models. Ecol Modelling 243: 1–7.
Montagnes DJS, Berges JA. (2004). Determining parametersof the numerical response. Microb Ecol 48: 139–144.
Montagnes DJS, Kimmance SA, Atkinson D. (2003). UsingQ10: can growth rates increase linearly with tempera-ture? Aquat Microb Ecol 32: 307–313.
Montagnes DJS, Morgan G, Bissinger JE, Atkinson D,Weisse T. (2008). Short-term temperature change may
Revising microbial predator–prey modelsZ Yang et al
415
The ISME Journal
impact freshwater carbon flux: a microbial perspec-tive. Global Change Biol 14: 2810–2822.
Montagnes DJS, Lowe CD, Roberts EC, Breckels MN,Boakes DE, Davidson K et al. (2011). An introductionto the special issue: Oxyrrhis marina, a modelorganism? J Plankton Res 33: 549–567.
Parmesan C. (2006). Ecological and evolutionary responses torecent climate change. Ann Rev Ecol Syst 37: 637–669.
Petchey OL, Phearson PT, Casey TM, Morin PJ. (1999).Environmental warming alters food-web structure andecosystem function. Nature 402: 69–72.
Sayegh FAQ, Radi N, Montagnes DJS. (2007). Do straindifferences in microalgae alter their relative quality asa food for the rotifer Brachionus plicatilis? Aquacul-ture 273: 665–678.
Sibly RM, Barker D, Denham MC, Hone J, Pagel M. (2005).On the regulation of populations of mammals, birds,fish and insects. Science 309: 607–610.
Sokal RR, Rohlf FJ. (1995). Biometry, 3rd edn. Freeman:New York, USA, pp 887.
Tilman D. (1982). Resource Competition and CommunityStructure. Princeton University Press: Princeton, pp 296.
Tirok K, Bauer B, Wirtz K, Gaedke U. (2011). Predator-preydynamics driven by feedback between functionallydiverse trophic levels. PLoS ONE 6: e27357.
Turchin P. (2003). Complex Population Dynamics: ATheoretical/Empirical Synthesis. Princeton UniversityPress: Princeton NJ.
Violle C, Enquist BJ, McGill BJ, Jiang L, Albert CH,Hulshof C et al. (2012). The return of the variance:intraspecific variability in community ecology. TrendsEcol Evol 27: 244–252.
Watts PC, Martin LE, Kimmance SE, Montagnes DJS, LoweCD. (2011). The distribution of Oxyrrhis marina—aglobal wanderer or poorly characterised endemic?J Plankton Res 33: 579–589.
Weisse T, Montagnes DJS. (1998). Effect of temperature oninter and intraspecific isolates of Urotricha (Prosto-matida, Ciliophora). Aquat Microb Ecol 15: 285–291.
Weisse T, Stadler P, Lindstrom ES, Kimmance SA,Montagnes DJS. (2002). Interactive effect of tempera-ture and food concentration on growth rate: a test caseusing the small freshwater ciliate Urotricha farcta.Limnol Oceanogr 47: 1447–1455.
Supplementary Information accompanies the paper on The ISME Journal website (http://www.nature.com/ismej)
Revising microbial predator–prey modelsZ Yang et al
416
The ISME Journal