models of a predator-prey relationship in a closed habitat
TRANSCRIPT

MODELS OF A PREDATOR-PREY RELATIONSHIP IN A CLOSED HABITAT
Charles E. Knadler, Jr.
1438 Box Elder Drive Alpine, UT 84004, USA
ABSTRACT
The ecological study of the wolf and moose populations of Isle Royale National Park (USA) is the longest running large mammal predator/prey study in the world. A discrete event simulation of the park’s wolf and moose populations is used together with the study’s data to evaluate four can-didate ordinary differential models of predator/prey sys-tems. Using a least squares technique, the parameters of the four ordinary differential equation systems are determined for the park’s and the simulation data, then the models are compared using both objective and subjective criteria.
1 INTRODUCTION
As part of the world’s longest running large mammal pre-dator/prey ecological study, the Isle Royale National Park’s wolf and moose populations have been reported yearly since 1959 (Peterson and Vucetich 2002), Figure 1.
0
500
1000
1500
2000
2500
1959
1964
1969
1974
1979
1984
1989
1994
1999
2004
0
10
20
30
40
50
60
Moose Wolves
Figure 1: Isle Royale National Park yearly moose and wolf populations. The left axis is for the moose values and the right is for the wolf values. Mathematical ecology may be said to have originated with Lotka and Volterra’s independent publication of their predator-prey models in 1925 and 1931, respectively, (Clark 2005, Davis 1962). Since that time, this and other differential equation systems have been used to model competing populations.
Using a technique originally developed to determine the parameters of aeronautical differential equation models (Knadler 1968), the Lotka-Volterra differential equations and those of three other candidate models were fit to Isle Royale’s moose and wolf population data. Neither the Lotka-Volterra equations, nor the three other candidate models provided a good fit to the Park’s reported popula-tion data over the entire study period. Possible causes of the bad fit are
• Nonstationary process—at least one of the models is valid, but environmental events have occurred which have changed parameter values during the study,
• The small wolf population’s nonparametric statis-tics, or
• The models are poor representations of this preda-tor-prey relationship.
The Isle Royale wolf-moose assemblage was modeled by a discrete event simulation to generate multiple trials of 51 years in length in order to obtain additional data to bet-ter evaluate the effectiveness of the four candidate models. (An assemblage is a subset of the species’ populations in a community.) Lotka and Volterra’s and three other candidate models were selected to determine which if any were applicable to the Isle Royale wolf and moose predator-prey relationship.
1.1 Lotka-Volterra Equations
The Lotka-Volterra equations are the classical model of predator-prey relationships and provide useful insights into population dynamics and stability (Davis 1962, Strogatz 1994, Mazumdar 1999). These results are of interest to ecologists who desire to know if there are population levels at which the two species will coexist. Still Mazumdar (1999) writes that the model is limited, “Although the Lotka-Volterra differential equations … have long been used by ecologists, relatively few realistic models can be obtained using the various terms in the equations.” Let m(t) and w(t) be the moose and wolf populations, respectively at time t, then equations (1) are the Lotka-Volterra model of the moose-wolf predator/prey relation-
2861 978-1-4244-2708-6/08/$25.00 ©2008 IEEE
Proceedings of the 2008 Winter Simulation ConferenceS. J. Mason, R. R. Hill, L. Mönch, O. Rose, T. Jefferson, J. W. Fowler eds.
Knadler
ship. The aj are positive, real parameters: a1 is the moose net reproduction rate, a2 is the rate of moose deaths per moose × wolf, a3 is the wolf death rate, a4 is the rate of wolf growth per moose × wolf.
dm/dt = a1m - a2mw (1)
dw/dt = - a3w + a4mw
1.2 Gause’s Model
As above m(t) and w(t) are the moose and wolf populations at time t. Equations (2) are the Gause model of the moose-wolf interspecies competition. Gause’s model is not spe-cific to predator/prey relationships. The aj are positive, real parameters: a1 is the moose reproduction rate, a2 is the ha-bitat’s carrying capacity for moose, a3 is the effect of wolves on moose, a4 is the wolf reproduction rate, a5 is the habitat’s carrying capacity for wolves, a6 is the effect of moose on wolves.
dm/dt = a1m(1 - m /a2) - a1 a3mw/a2 (2)
dw/dt = a4w(1 – w /a5) – a4 a6 mw/a5
As originally formulated Gause’s model (Haefner 2005) assumes that the two populations are competing for a shared resource and each population has a net deleterious impact on the other. At first examination this does not ap-pear to be applicable to the wolf/moose system, since the wolves eat the moose rather than competing for a limited resource in Gause’s sense. However, if the model is slightly generalized by allowing a6 to be negative, the mod-el may be applicable with the habitat’s spatial extent being considered the shared resource.
1.3 Haefner-Holling Model of Predation in Simple
Communities
Let m(t) and w(t) be the moose and wolf populations at time t, then equations (3) are the Haefner-Holling model (Haefner 2005) of the moose-wolf interspecific competi-tion. Where a1 is the moose reproduction rate, a2 is the ha-bitat’s carrying capacity for moose, a3 is the moose-wolf encounter rate, a4 is the total time available for a moose to forage, a5 is the time required for a wolf to "harvest" a moose, a6 is the conversion rate of victims to new predators and a7 is the per capita wolf death rate.
dm/dt = a1m(1- m /a2) – a3 a4m w/(1 +a3 a5m) (3)
dw/dt = a6 a3 a4 mw/(1 + a3 a5m) – a7 w
1.4 Enhanced May Model
The May models are a general class of models of two in-teracting populations (Mazumdar 1999). Using the previ-ous definitions of w(t) and m(t), the model’s form is
dm/dt = λ m (1.0 - m /κ) –wf(m,w) dw/dt = wg(m,w),
where f(m,w) and g(m,w) are functions of m and w, which are chosen to match the specific ecological system being studied; λ and κ are positive, real parameters. If we let f(m,w) = 0 then the moose equation reduces to the logistic equation, dm/dt = λ m (1.0 - m /κ), which has the solution, m(t) = κ/(1.0+βe-λt), where β = (κ–m(0))/m(0). This logistic term, which also appears in the Gause and Haefner-Hollings models, causes the moose population to be limited to the habitat carrying capacity. This hard limit is not always seen in nature. The Isle Royale annual reports show that the moose population has overshot the habitat’s carrying capacity at least twice and then crashed as a result of starvation in later years. Another problem is that the logistic term signifi-cantly reduces the population growth rate even when the population is well below the habitat carrying capacity; e.g. when m(t) = 0.5 κ, the growth rate is reduced to 0.5 λ. In order to address these shortcomings, the model was enhanced by an engineering correction. The m /κ term is raised to the 8th power, as well as the similar term in the wolf equation. Thus when m(t) = 0.5 κ, the growth rate is only reduced to 0.9960937 λ. (The choice of eight as the exponent is somewhat arbitrary; any exponent may be cho-sen which gives a sufficiently sharp cutoff to the logistic term.) Returning to the ai notation, f(m,w) is set equal to a2 w and g(m,w) is set equal to -a4 + a5 m (1 – (w/a6)8) yielding the enhanced May model, equations (4). Where a1 is the moose reproduction rate, a2 is the rate of moose deaths per moose × wolf, a3 is the habitat’s carrying capacity for moose, a4 is the wolf death rate, a5 is the rate of wolf growth per moose × wolf, and a6 is the habitat’s carrying capacity for wolves. All aj are positive, real numbers. The enhanced logistic term was added to the wolf equ-ation to address the possibility that carrying capacity for wolves, with abundant food, might be limited by intraspe-cies competition for territory. Wolves are very territorial and frequently kill other wolves trespassing in their terri-tory (Mech and Boitani 2003).
dm/dt = a1m(1 – (m /a3)8) – a2mw (4)
dw/dt = -a4w + a5mw (1 – (w/a6)8)
2 APPROACH
Knadler (1968) developed DIFRED, a numerical analysis technique, to determine a differential equation system’s pa-rameters by performing a least squares fit of ordinary dif-ferential equations to experimental data.
This technique requires that given a system of n first order, ordinary differential equations, dyi/dt = fi(x,y1 …yn,a1 …am) with m parameters, the fi (x, y1 …yn,a1 …am)
2862
Knadler
possess continuous, bounded derivatives with respect to both the yi and the parameters, aj, and satisfy a Lipschitz condition, whose constant is independent of the value of the parameters. (A Lipschitz condition, on a function, is a stronger condition than continuity and limits the rate at which the function can change. It is a basic assumption re-quired by proofs of the existence and uniqueness of solu-tions of the initial value problem; e.g., Coddington (1961).) Using DIFRED, each model was fit to the reported park data (Vucetich and Peterson 2007), with the resulting the root mean square errors shown in Table 1. Table 1: Best Fit Model Population Root Mean Square er-rors fitting Park Data between 1959 and 2007
Model Wolf RMS error
Moose RMS error
Lotka-Volterra 8.72 431 Gause 9.03 324
Haefner-Holling 8.72 339 Enhanced May 8.72 320
During the (1959-2007) observation period, reported wolf populations varied between 11 and 50 animals with a mean of 23 and the moose population ranged from 385 to 2390 animals with a mean of 1036. (For some years the population data was only available as graphical data. It is estimated that the graphical moose data was read with an uncertainty of +/- 50 and wolf data was read with an uncer-tainty of +/- 1.) The best of the models is a poor fit to the reported data with a mean error in the model moose population equal to 31% of the mean observed value and the error in the mod-el’s wolf population equal to 39% of the mean observed value. Examination of the yearly reports suggests several possible reasons for the poor fit. A canine parvovirus was introduced into the park by visiting tourists, with an in-fected pet dog, in July 1981 and the number of wolves was reduced from 30 to 14 (Peterson and Vucetich 2002). Global warming has been linked to winter tick infestations, which have increased moose mortality rate and reduced the moose reproductive rate (Peterson and Vucetich 2003). These factors introduce a nonstationary process into the population statistics. Other potential sources of error are (1) the normally small wolf population levels suggest that the wolf statistics might be nonparametric and (2) none of the candidate models are a good representation of this small population predator-prey relationship in closed, limited geographic area. The Isle Royale wolf-moose assemblage was modeled by a discrete event simulation to generate multiple trials of 51 years in length to obtain additional data to better evalu-ate the effectiveness of the four candidate models.
Using DIFRED, each candidate model was fit to mul-tiple trials and its quality of fit determined.
3 SIMULATION
The Isle Royale wolf/moose assemblage was simulated as three subsystems: the habitat, the moose population, and the wolf population.
3.1 Purpose
The purpose of this simulation is to model the Isle Royale moose-wolf assemblage sufficiently accurately that the year end moose and wolf population statistics for multiple model runs may be used to evaluate the suitability of ana-lytical, differential equation based models of predator-prey relationships in habitats similar to Isle Royale.
3.2 Design
The simulation (Knadler 2008) is an event advance, object oriented model, programmed in a Delphi (Kerman 2002) implementation of smpl (MacDougall 1987). The basic simulation time unit is a day, wolf and moose states are updated the first day of each week and population data are recorded yearly on January 1.
3.3 Habitat
The park’s habitat is characterized by its small size (210 square miles) and by it’s closure. There has been no ob-served migration by wolves or moose onto or off the island over the study period (1959 to present). These character-istics have impacted the behavior and viability of the wolf population (Peterson and Vucetich 2002). In the simulation, the habitat is parameterized by its carrying capacity for moose (i.e., the maximum number of moose that can be supported by the Isle Royale vegeta-tion).
3.3.1 Moose
Three moose related objects are explicitly simulated: moose population, moose herd and individual moose. There is one moose herd on the island.
Moose are characterized by gender, gestation period, breeding period, vulnerability to wolves as a function of age, probability of becoming pregnant, litter size probabil-ity distribution and their probability of death as a function of age.
A moose may be born, be eaten by a wolf, die of other causes, breed and give birth.
2863
Knadler
3.3.2 Wolves
Three wolf related objects are explicitly simulated: wolf population, wolf pack and individual wolves. Three wolf packs are simulated on the island.
Wolves are characterized by gender, gestation period, breeding period, probability of becoming pregnant, litter size probability distribution, their probability of death as a function of age and the number of moose eaten per wolf per year.
A wolf may be born, die, breed and give birth.
3.4 Simulation Results
Knadler (2008) introduces a root mean square distance me-tric to compare the yearly simulation run populations to observed Isle Royale wolf and moose populations. Using this metric the distance between each pair of simulation runs and between each simulation run and the Isle Royale yearly wolf and moose populations was calculated. The results of these comparisons are given in Table 2. This Table should be read as follows: simulation run 751’s year-ly moose population statistics are closer to the park’s year-ly moose population than it is to 7 of the 9 other simulation runs. Run 751’s wolf population statistics are closer to the park’s yearly wolf population than it is to 2 of the 9 other simulation runs. Run 751’s wolf and moose populations are simultaneously closer to the park data than to 2 of the other 9 simulation runs.
Table 2: Number of other simulation run populations at a greater RMS distance than the Isle Royale park popula-tions. Data after (Knadler 2008)
Run Number Moose Wolves Moose and
Wolves 751 7 2 2 752 6 5 2 753 7 5 5 754 2 3 0 755 2 5 0 756 3 6 2 757 4 2 1 758 3 3 1 759 7 4 3 760 0 5 0
Due to space limitations, only results from runs 751
and 759 are used in the following sections. These runs were chosen, because they illustrate different population dynamics over the simulated time period.
4 RESULTS
4.1 Park Data (1959-2007)
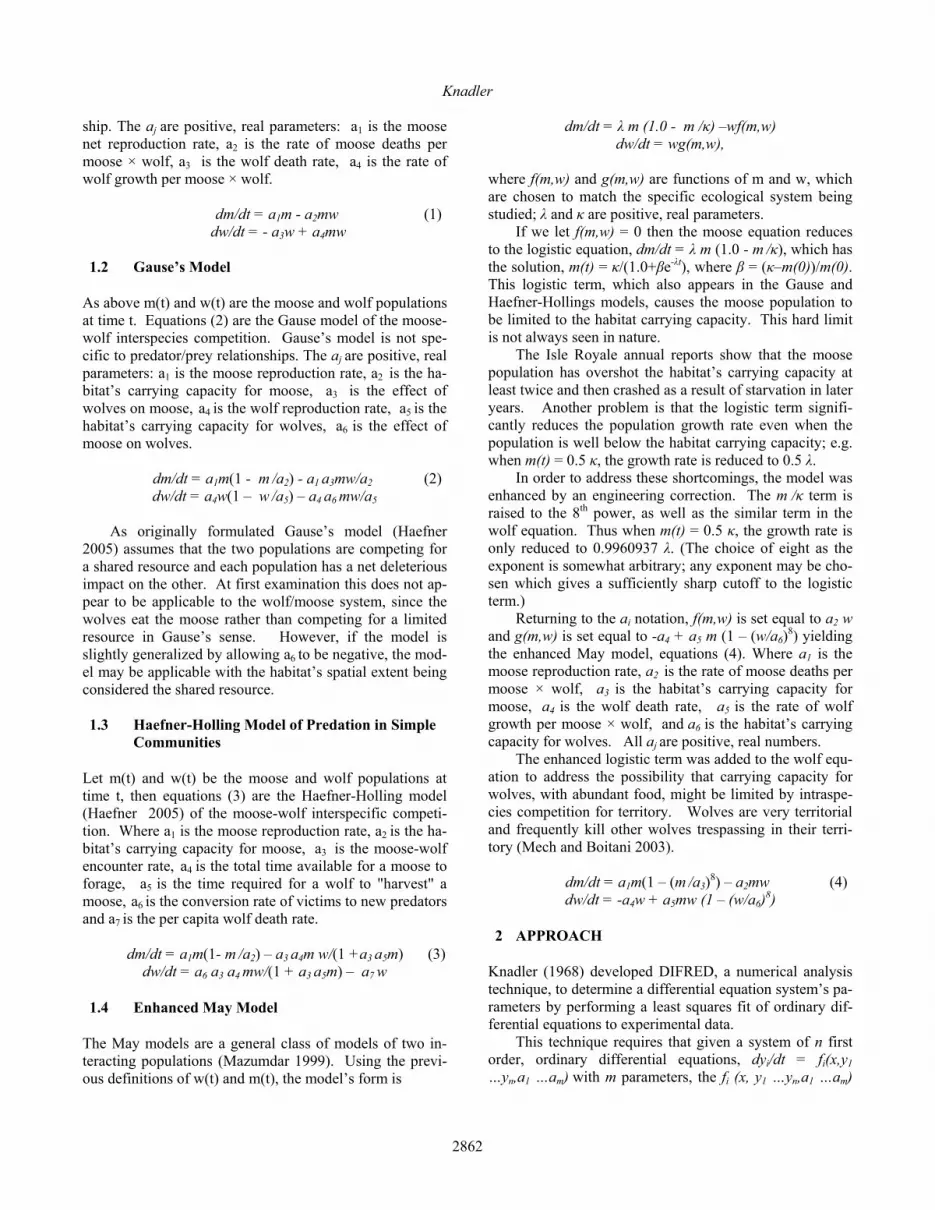
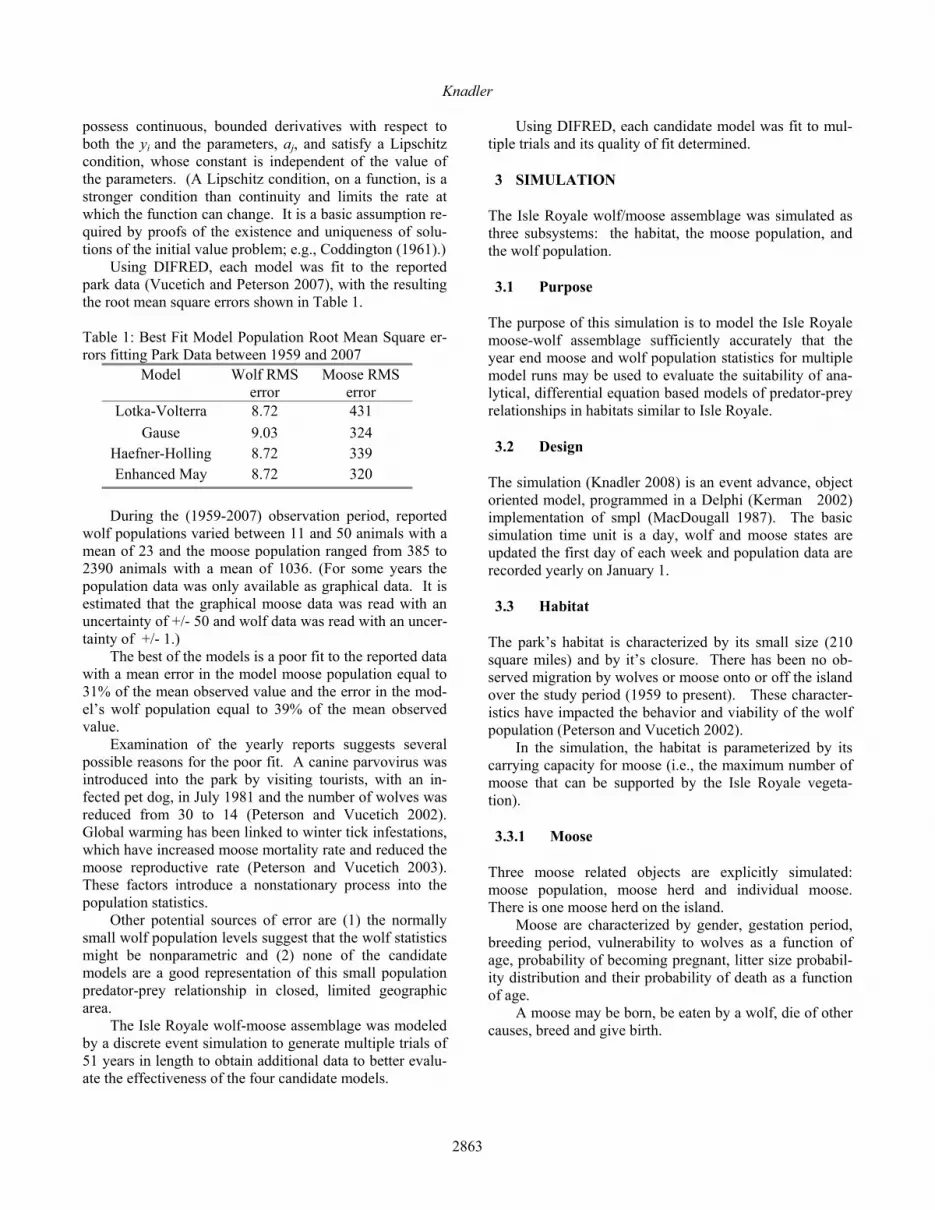
As seen in Table 1, none of the models provided a good fit to the park data. The Lotka-Volterra model provided the worst match to the moose population dynamics (Figure 2) and the enhanced May model (Figure 3) provided the best. The Lotka-Volterra moose equation parameters were not physically reasonable. The net moose reproductive rate was negative as was the rate of moose deaths, thus the moose population is predicted to shrink in the absence of wolves and grow in the presence of wolves.
The other three models all produced physically rea-sonable moose equation parameters, but the impact of the winter tick infestation on the moose death and reproductive rates violated the assumptions of all the models and re-sulted in a poor fit.
0
500
1000
1500
2000
2500
1959
1964
1969
1974
1979
1984
1989
1994
1999
2004
Park Data Lotka-Volterra
Figure 2: Best fit of Lotka-Volterra model moose equation to Isle Royale reported data
0
500
1000
1500
2000
2500
1959
1964
1969
1974
1979
1984
1989
1994
1999
2004
Park Data Enhanced May
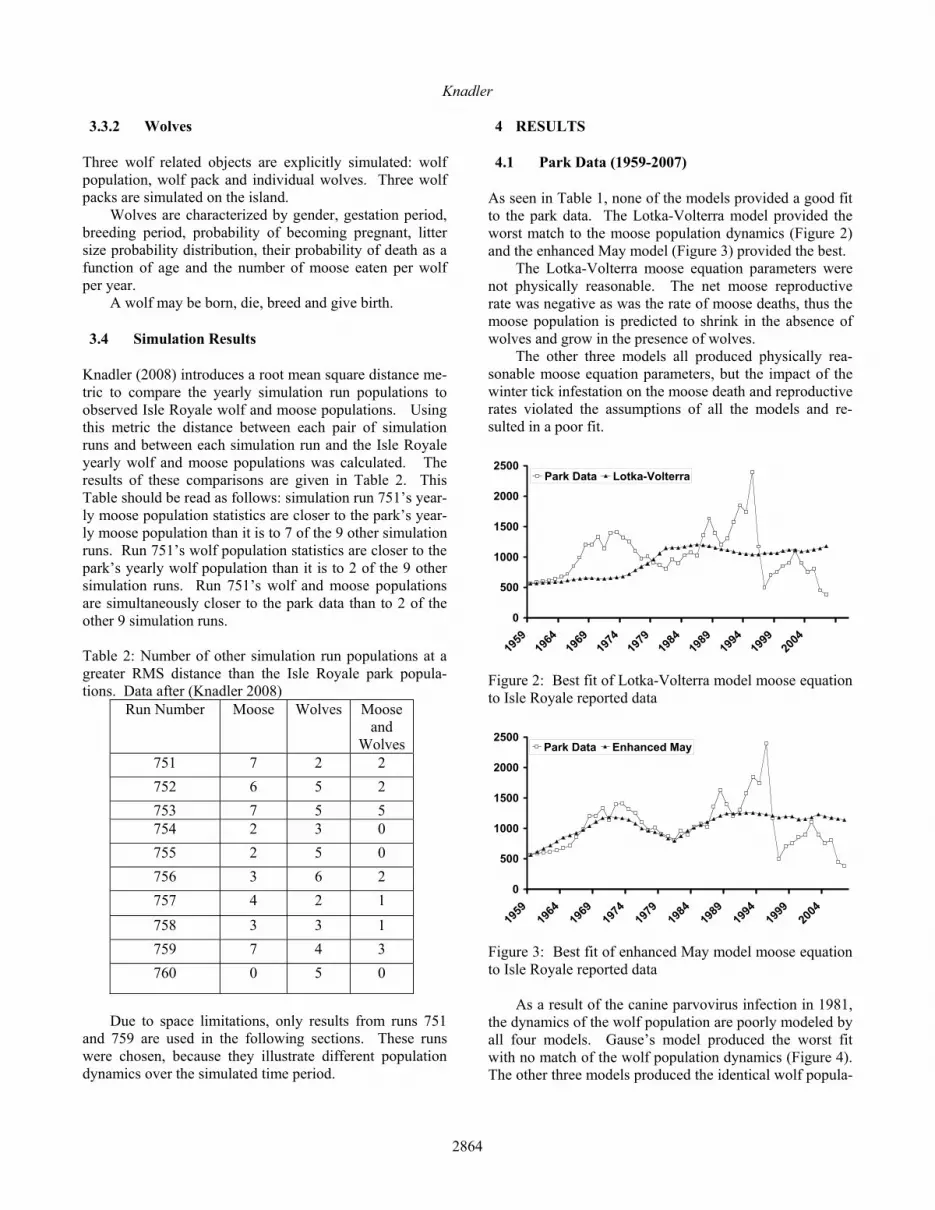
Figure 3: Best fit of enhanced May model moose equation to Isle Royale reported data As a result of the canine parvovirus infection in 1981, the dynamics of the wolf population are poorly modeled by all four models. Gause’s model produced the worst fit with no match of the wolf population dynamics (Figure 4). The other three models produced the identical wolf popula-
2864
Knadler
tion predictions. The three models are parameterized dif-ferently, but all have the net wolf death rate negative (birth rate exceeds death rate) and have wolf population increas-ing as moose population decreases. This is counter to ob-servation. The Isle Royale wolf population requires the moose to sustain their historic population levels, because there are no other large herbivores for their diet.
0
10
20
30
40
50
60
1959
1964
1969
1974
1979
1984
1989
1994
1999
2004
Park Data Gause
Figure 4: Best fit of Gause’s model wolf equation to Isle Royale reported data 4.2 Park Data (1959-1980)
In order to eliminate the impact of known events (the ca-nine parvovirus and the winter tick infestations) which would change the model parameters over time, DIFRED was used to fit each model to the park’s data for 1959 to 1980 (22 data points). The results are shown in Table 3. During the (1959-1980) observation period, reported wolf populations varied between 14 and 50 animals with a mean of 28 and the moose population ranged from 560 to 1410 animals with a mean of 970. (For this period the pop-ulation data was only available as graphical data. It is es-timated that the graphical moose data was read with an un-certainty of +/- 50 and wolf data was read with an uncertainty of +/- 1.) The quality of fit is improved for all four models. The best of the models (enhanced May model) has a mean error in the model moose population equal to 12% of the mean observed value, while the worst of the models had an error of 16% of the mean observed value. Table 3: Best Fit Model Population Root Mean Square er-rors fitting Park Data between 1959 and 1980
Model Wolf RMS error
Moose RMS error
Lotka-Volterra 4.84 114 Gause 5.70 125
Haefner-Holling 4.84 154 Enhanced May 4.84 113
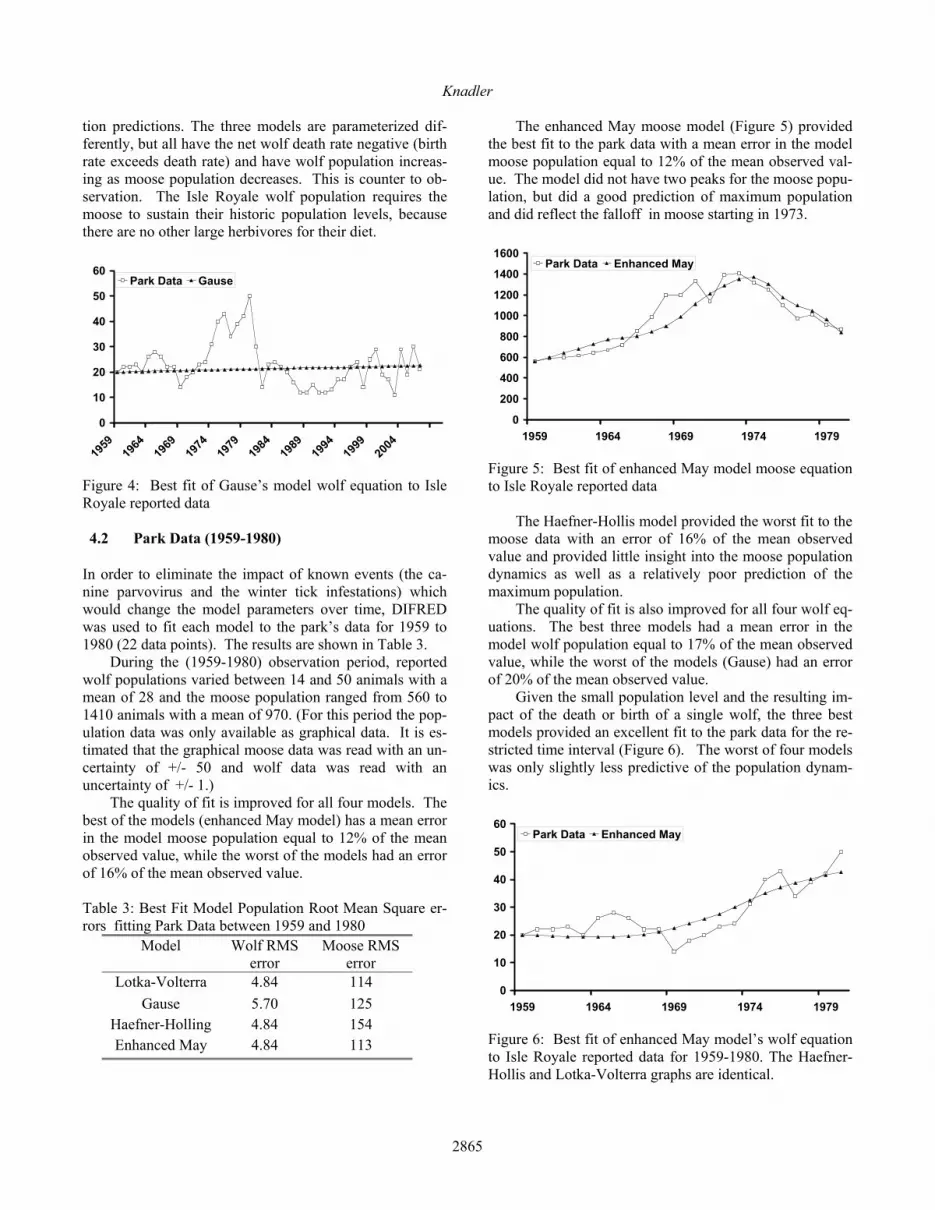
The enhanced May moose model (Figure 5) provided the best fit to the park data with a mean error in the model moose population equal to 12% of the mean observed val-ue. The model did not have two peaks for the moose popu-lation, but did a good prediction of maximum population and did reflect the falloff in moose starting in 1973.
0
200
400
600
800
1000
1200
1400
1600
1959 1964 1969 1974 1979
Park Data Enhanced May
Figure 5: Best fit of enhanced May model moose equation to Isle Royale reported data
The Haefner-Hollis model provided the worst fit to the moose data with an error of 16% of the mean observed value and provided little insight into the moose population dynamics as well as a relatively poor prediction of the maximum population. The quality of fit is also improved for all four wolf eq-uations. The best three models had a mean error in the model wolf population equal to 17% of the mean observed value, while the worst of the models (Gause) had an error of 20% of the mean observed value. Given the small population level and the resulting im-pact of the death or birth of a single wolf, the three best models provided an excellent fit to the park data for the re-stricted time interval (Figure 6). The worst of four models was only slightly less predictive of the population dynam-ics.
0
10
20
30
40
50
60
1959 1964 1969 1974 1979
Park Data Enhanced May
Figure 6: Best fit of enhanced May model’s wolf equation to Isle Royale reported data for 1959-1980. The Haefner-Hollis and Lotka-Volterra graphs are identical.
2865

Knadler
This improvement, over fitting the models to the full observation period, suggests that the process is nonstation-ary. However the enhanced May model has 4 independent parameters for each differential equation (initial condition plus 3 ai’s) and the reduced interval only has 22 data points. Thus it is also possible that the quality of fit im-proved, because the ratio of data points to the model’s number of degrees of freedom is reduced by a factor of 2.32.
4.3 Simulation Run 751
During the 51 simulated years, wolf population varied be-tween 18 and 58 animals with a mean of 23 and the moose population ranged from 560 to 2267 animals with a mean of 1147. The wolf and moose yearly populations are shown in Figure 7. The quality of fit to this simulation run, Table 4, im-proved for all four models compared to their fit to the park moose data (1959-2007). The Lotka-Volterra moose equa-tion had the best fit to the park data with a mean error in the model moose population equal to 21% of the mean si-mulated moose population value, Figure 8. The worst (Haefner-Holling) has a RMS moose error equal to 24% of the mean simulation value.
0
500
1000
1500
2000
2500
1959
1964
1969
1974
1979
1984
1989
1994
1999
2004
2009
0
10
20
30
40
50
60
70Moose Wolves
Figure 7: Simulation run 751 yearly moose and wolf popu-lations Table 4: Model Quality of Fit (Simulation Run 751) Root Mean Square population errors.
Model Wolf RMS error
Moose RMS error
Lotka-Volterra 7.30 241 Gause 3.90 273
Haefner-Holling 7.42 280 Enhanced May 3.52 248
None of the models predict the moose population dy-namics well and all substantially underestimate the maxi-mum moose population level.
There is greater variation in the quality of the wolf eq-uations, than is the case for the moose equations. The en-hanced May and Gause models are superior to the Haefner-Holling and Lotka-Volterra models. The error in the best fit enhanced May model’s wolf population is equal to 9% of the mean simulation value. As shown in Figure 9, it al-so models the population dynamics well.
0
500
1000
1500
2000
2500
1959
1964
1969
1974
1979
1984
1989
1994
1999
2004
2009
Simulation Lotka-Volterra
Figure 8: Best fit of enhanced Lotka-Volterra model moose equation to simulation run 751 data
0
10
20
30
40
50
60
70
1959
1964
1969
1974
1979
1984
1989
1994
1999
2004
2009
Simulation Enhanced May
Figure 9: Best fit of enhanced May model wolf equation to simulation run 751 data The best fit Haefner-Holling model (Figure 10) has a RMS wolf error of 33.7% of the mean simulated wolf pop-ulation and provides very poor modeling of the wolf popu-lation dynamics.
2866
Knadler
0
10
20
30
40
50
60
70
1959
1964
1969
1974
1979
1984
1989
1994
1999
2004
2009
Simulation Haefner-Holling
Figure 10: Best fit of enhanced Haefner-Holling model wolf equation to simulation run 751 data
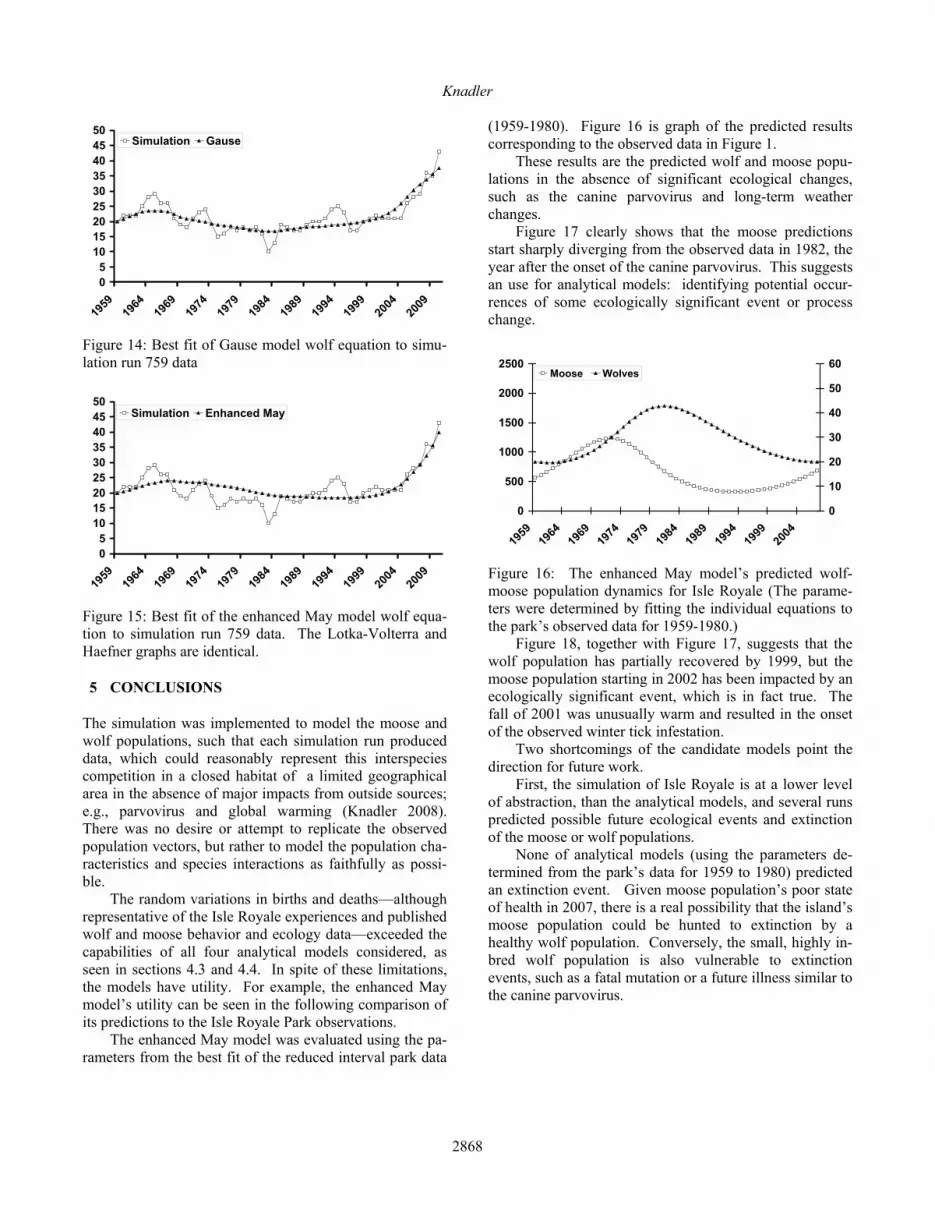
4.4 Simulation Run 759
During the 51 simulated years, wolf population varied be-tween 10 and 43 animals with a mean of 22 and the moose population ranged from 349 to 1000 animals with a mean of 530. The wolf and moose yearly populations are shown in Figure 11.
0
200
400
600
800
1000
1200
19591964
19691974
19791984
19891994
19992004
20090
10
20
30
40
50
60
70Moose Wolves
Figure 11: Simulation run 759 yearly moose and wolf pop-ulations As indicated by the reduced error values in Table 5, the quality of fit to this simulation run improved for all four models compared to both their fit of the park data and to their fit of simulation 751’s data. The best fit to the moose data has a mean error in the model moose popula-tion equal to 31% of the mean simulation value. Table 5: Model Quality of Fit (Simulation Run 759)
Model Wolf RMS error
Moose RMS error
Lotka-Volterra 3.46 163 Gause 2.69 164
Haefner-Holling 3.47 164 Enhanced May 3.46 163
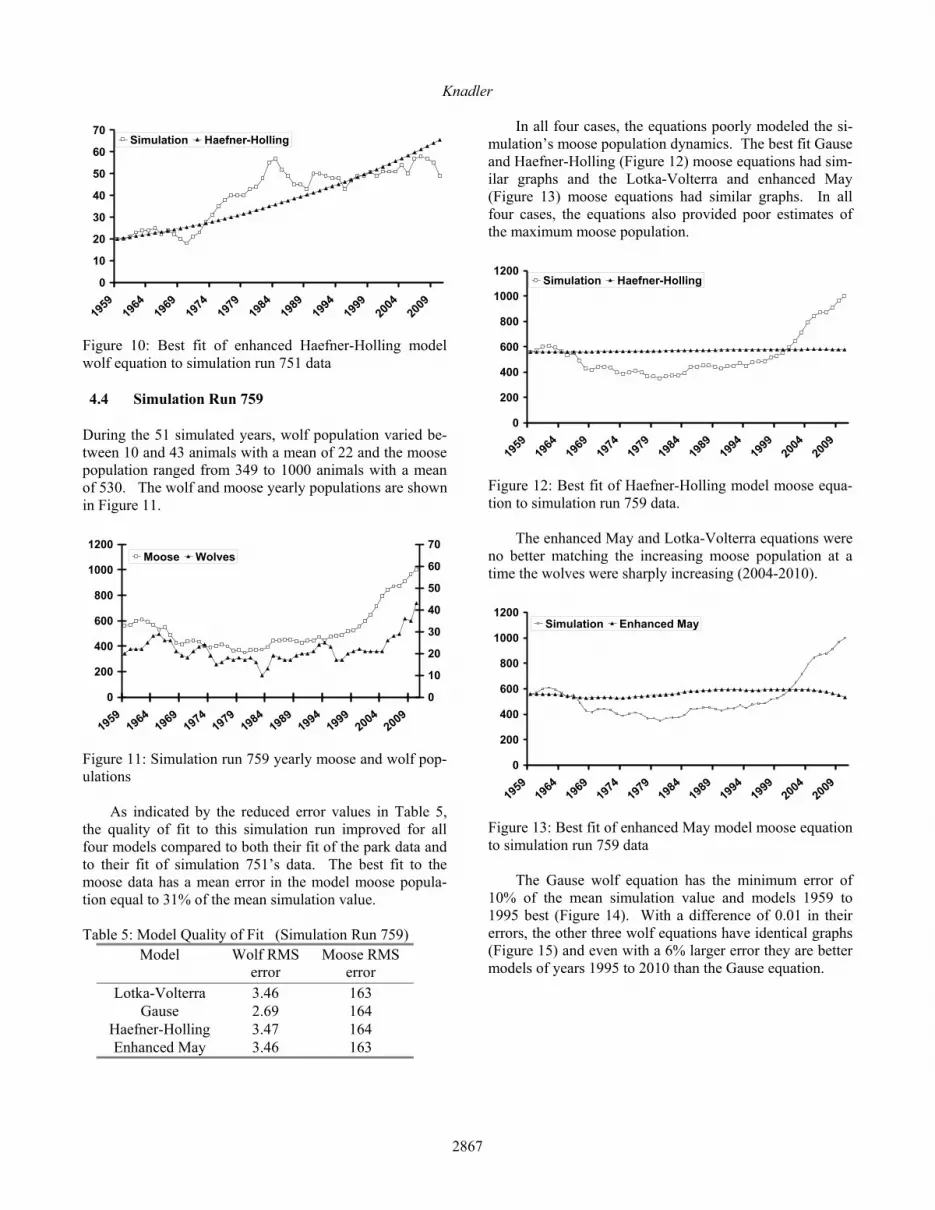
In all four cases, the equations poorly modeled the si-mulation’s moose population dynamics. The best fit Gause and Haefner-Holling (Figure 12) moose equations had sim-ilar graphs and the Lotka-Volterra and enhanced May (Figure 13) moose equations had similar graphs. In all four cases, the equations also provided poor estimates of the maximum moose population.
0
200
400
600
800
1000
1200
1959
1964
1969
1974
1979
1984
1989
1994
1999
2004
2009
Simulation Haefner-Holling
Figure 12: Best fit of Haefner-Holling model moose equa-tion to simulation run 759 data. The enhanced May and Lotka-Volterra equations were no better matching the increasing moose population at a time the wolves were sharply increasing (2004-2010).
0
200
400
600
800
1000
1200
1959
1964
1969
1974
1979
1984
1989
1994
1999
2004
2009
Simulation Enhanced May
Figure 13: Best fit of enhanced May model moose equation to simulation run 759 data The Gause wolf equation has the minimum error of 10% of the mean simulation value and models 1959 to 1995 best (Figure 14). With a difference of 0.01 in their errors, the other three wolf equations have identical graphs (Figure 15) and even with a 6% larger error they are better models of years 1995 to 2010 than the Gause equation.
2867
Knadler
05
101520253035404550
1959
1964
1969
1974
1979
1984
1989
1994
1999
2004
2009
Simulation Gause
Figure 14: Best fit of Gause model wolf equation to simu-lation run 759 data
05
101520253035404550
1959
1964
1969
1974
1979
1984
1989
1994
1999
2004
2009
Simulation Enhanced May
Figure 15: Best fit of the enhanced May model wolf equa-tion to simulation run 759 data. The Lotka-Volterra and Haefner graphs are identical.
5 CONCLUSIONS
The simulation was implemented to model the moose and wolf populations, such that each simulation run produced data, which could reasonably represent this interspecies competition in a closed habitat of a limited geographical area in the absence of major impacts from outside sources; e.g., parvovirus and global warming (Knadler 2008). There was no desire or attempt to replicate the observed population vectors, but rather to model the population cha-racteristics and species interactions as faithfully as possi-ble. The random variations in births and deaths—although representative of the Isle Royale experiences and published wolf and moose behavior and ecology data—exceeded the capabilities of all four analytical models considered, as seen in sections 4.3 and 4.4. In spite of these limitations, the models have utility. For example, the enhanced May model’s utility can be seen in the following comparison of its predictions to the Isle Royale Park observations. The enhanced May model was evaluated using the pa-rameters from the best fit of the reduced interval park data
(1959-1980). Figure 16 is graph of the predicted results corresponding to the observed data in Figure 1. These results are the predicted wolf and moose popu-lations in the absence of significant ecological changes, such as the canine parvovirus and long-term weather changes. Figure 17 clearly shows that the moose predictions start sharply diverging from the observed data in 1982, the year after the onset of the canine parvovirus. This suggests an use for analytical models: identifying potential occur-rences of some ecologically significant event or process change.
0
500
1000
1500
2000
2500
1959
1964
1969
1974
1979
1984
1989
1994
1999
2004
0
10
20
30
40
50
60
Moose Wolves
Figure 16: The enhanced May model’s predicted wolf-moose population dynamics for Isle Royale (The parame-ters were determined by fitting the individual equations to the park’s observed data for 1959-1980.) Figure 18, together with Figure 17, suggests that the wolf population has partially recovered by 1999, but the moose population starting in 2002 has been impacted by an ecologically significant event, which is in fact true. The fall of 2001 was unusually warm and resulted in the onset of the observed winter tick infestation. Two shortcomings of the candidate models point the direction for future work. First, the simulation of Isle Royale is at a lower level of abstraction, than the analytical models, and several runs predicted possible future ecological events and extinction of the moose or wolf populations. None of analytical models (using the parameters de-termined from the park’s data for 1959 to 1980) predicted an extinction event. Given moose population’s poor state of health in 2007, there is a real possibility that the island’s moose population could be hunted to extinction by a healthy wolf population. Conversely, the small, highly in-bred wolf population is also vulnerable to extinction events, such as a fatal mutation or a future illness similar to the canine parvovirus.
2868

Knadler
0
500
1000
1500
2000
2500
1959
1964
1969
1974
1979
1984
1989
1994
1999
2004
Park Data Enhanced May Predicted
Figure 17: The enhanced May model’s predicted yearly moose population compared to the reported Isle Royale da-ta. A Monte Carlo approach using the Isle Royale wolf-moose simulation, might be better at predicting possible future outcomes than the analytical models.
0
10
20
30
40
50
60
1959
1964
1969
1974
1979
1984
1989
1994
1999
2004
Park Data Enhanced May Predicted
Figure 18: The enhanced May model’s predicted yearly wolf population compared to the reported Isle Royale data. Secondly, even if we assume that the enhanced May equations are a good model of the wolf-moose dynamics, it is obvious that the parameters for the Isle Royale assem-blage changed with time. The canine parvovirus changed the wolf death rate. Warm winters increased the success of wolf predation. Global warming and the subsequent infestation of winter ticks weakened the moose and reduced their birthrate. The weakened moose are also more vulnerable to predation. A hybrid technique combining DIFRED with inverse simula-tion methods (Murray-Smith et al. 2008) might be used to determine the parameters as a function of time. The result-ing variable parameter differential equation models might be a better model of the wolf-moose relationship.
ACKNOWLEDGMENT
The author would like to acknowledge the contributions made by the U. S. Park Service, its staff and by the other referenced naturalists without whose research and publica-tions this work would not have been possible.
REFERENCES
Clark, C. W. 2005. Mathematical Bioeconomics, Optimal Management of Renewable Resources, 2nd ed. John Wiley & Sons, Inc. New York, Hoboken, New Jersey.
Coddington, E. A. 1961. An Introduction to Ordinary Dif-ferential Equations. New York, New York: Dover Publications, Inc.
Davis, H. T. 1962. Introduction to Nonlinear Differential and Integral Equations. Dover Publications, Inc. New York, New York.
Haefner, J. W. 2005. Modeling Biological Systems: Prin-ciples and Applications, 2nd ed. Springer. New York, New York.
Kerman, M. C. 2002. Programming & Problem Solving with Delphi. Addison Wesley Longman. Boston, Massachusetts.
Knadler, C. E, 1968. A Method for Determining the Pa-rameters of Ordinary Differential Equations. NOLTR 68-192. U.S. Naval Ordnance Laboratory, White Oak, Maryland. Defense Technical Information Center. Accession Number: AD0847877
Knadler, C. E. 2008. Simulating a Predator/Prey Relation-ship. Proceedings of the 2008 International Simulation Multiconference. The Society for Modeling and Simulation International, Edinburgh, Scotland.
MacDougall, M. H. 1987. Simulating Computer Systems: Techniques and Tools. The MIT Press. Cambridge, Massachusetts.
Mazumdar, J. 1999. An Introduction to Mathematical Physiology & Biology, 2nd ed. Cambridge University Press, New York, New York.
Mech, L. D. and L. Boitani (editors). 2003. Wolves, Behav-ior, Ecology, and Conservation. The University of Chicago Press. Chicago, Illinois.
Murray-Smith, D. et al. 2008. Applications of Inverse Si-mulation Methods to a Nonlinear Model of an Under-water Vehicle. Proceedings of the 2008 International Simulation Multiconference. The Society for Model-ing and Simulation International, Edinburgh, Scotland.
Newswise 2004. Global Warming Could B Affecting Wolf-Moose Balance. Available via <http://newswise.com/articles/view/503581/> [ac-cessed March 20, 2008].
Peterson, R. O. and J. A. Vucetich. 2002. Ecological Stud-ies of Wolves on Isle Royale, Annual Report 2001- 2002. School of Forestry and Wood Products, Michi-gan Technological University. Houghton, Michigan.
2869
Knadler
Peterson, R. O. and J. A. Vucetich. 2003. Ecological Stud-ies of Wolves on Isle Royale, Annual Report 2002- 2003. School of Forestry and Wood Products, Michi-gan Technological University, Houghton. Michigan.
Strogatz, S. H. 1994. Nonlinear Dynamics and Chaos, With Applications to Physics, Biology, Chemistry, and Engineering. West View Press. Cambridge, Massa-chusetts.
Vucetich, J. A. and R. O. Peterson. 2007. Ecological Stud-ies of Wolves on Isle Royale, Annual Report 2006-2007. School of Forestry and Wood Products, Michi-gan Technological University. Houghton, Michigan.
AUTHOR BIOGRAPHY
CHARLES E. KNADLER, JR is an independent consult-ant and researcher. He was formerly a senior engineer and senior manager for IBM, an executive in AOL’s Member Services Division and Associate Professorial Lecturer in Engineering at The George Washington University. He received his B.E.S. degree in mechanics from The Johns Hopkins University and his M.S. and D.Sc. degrees in computer science from The George Washington Univer-sity. His research interests include mathematical biology, development and deployment of large-scale software sys-tems, and naïve agent support systems. He is a member of ACM, IEEE, and SCS.
2870