strain hardening of polypropylene microfiber reinforced
TRANSCRIPT
�����������������
Citation: Smirnova, O.M.; Menendez
Pidal, I.; Alekseev, A.V.; Petrov, D.N.;
Popov, M.G. Strain Hardening of
Polypropylene Microfiber Reinforced
Composite Based on Alkali-Activated
Slag Matrix. Materials 2022, 15, 1607.
https://doi.org/10.3390/
ma15041607
Academic Editors: Roman Fediuk
and Mujahid Ali
Received: 24 January 2022
Accepted: 17 February 2022
Published: 21 February 2022
Publisher’s Note: MDPI stays neutral
with regard to jurisdictional claims in
published maps and institutional affil-
iations.
Copyright: © 2022 by the authors.
Licensee MDPI, Basel, Switzerland.
This article is an open access article
distributed under the terms and
conditions of the Creative Commons
Attribution (CC BY) license (https://
creativecommons.org/licenses/by/
4.0/).
materials
Article
Strain Hardening of Polypropylene Microfiber ReinforcedComposite Based on Alkali-Activated Slag MatrixOlga M. Smirnova 1,* , Ignacio Menendez Pidal 2 , Aleksandr V. Alekseev 1 , Dmitry N. Petrov 1
and Mikhail G. Popov 1
1 Department of Constructing Mining Enterprises and Underground Structures, Saint-Petersburg MiningUniversity, 21-st Line V.O., 2, 199106 Saint-Petersburg, Russia; [email protected] (A.V.A.);[email protected] (D.N.P.); [email protected] (M.G.P.)
2 Laboratorio de Geología, Departamento de Ingeniería y Morfología del Terreno, Universidad Politécnica de Madrid,28040 Madrid, Spain; [email protected]
* Correspondence: [email protected]
Abstract: A comparative study of the fracture features, strength and deformation properties ofpseudo strain-hardening composites based on alkali-activated slag and Portland cement matriceswith polypropylene microfiber was carried out. Correlations between their compositions and char-acteristics of stress–strain diagrams under tension in bending with an additional determination ofacoustic emission parameters were determined. An average strength alkali-activated slag matrixwith compressive strength of 40 MPa and a high-strength Portland cement matrix with compressivestrength of 70 MPa were used. The matrix compositions were selected for high filling the compositeswith polypropylene microfiber in the amount of 5%-vol. and 3.5%-vol. ensuring the workability atthe low water-to-binder ratios of 0.22 and 0.3 for Portland cement and alkali-activated slag matrices,respectively. Deformation diagrams were obtained for all studied compositions. Peaks in the numberof acoustic signals in alkali-activated slag composites were observed only in the strain-softening zone.Graphs of dependence of the rate of acoustic events occurrence in samples from the start of the testexperimentally prove that this method of non-destructive testing can be used to monitor structuresbased on strain-hardening composites.
Keywords: sustainability; rheologically active inorganic filler; stress–strain deformation curve; acous-tic emission technique; acoustic event; monitoring of structures
1. Introduction
Recently attention is paid to the development of new compositions of cement matricesand the use of modified multicomponent fibers in strain-hardening cement compositessubjected to static and dynamic loads [1–4] since construction practice shows a high demandfor mineral composites with special deformation characteristics [5–8].
The important advantages of such composites are the significant increase (up to 40%or more) of the value of tensile stresses corresponding to the sample destruction comparedwith the value of tensile stresses corresponding to the first microcrack and sufficientlylarge relative deformations of cement composite under uniaxial tension (up to valuesof several percent) due to a significant increase of the volume of microcracking beforedestruction [9–11].
A high relative deformation of up to 5% is the result of the sequential formationof multiple, densely spaced microcracks under increasing uniaxial tensile loading [12].This behavior of the material under tension is achieved by fulfilling a number of mi-cromechanical conditions for the formation of microcracks, their propagation and overlapwith fibers [13–15]. This cement composite can be used not only as the main material instructures but also as thin reinforcing layers for repairing and strengthening the existing
Materials 2022, 15, 1607. https://doi.org/10.3390/ma15041607 https://www.mdpi.com/journal/materials

Materials 2022, 15, 1607 2 of 22
structures taking into consideration its high deformation ability [16–19]. Another advan-tage of these composites is the use of secondary mineral resources, such as microsilica, slag,fly ash, ground rocks, or stone dust [20–24]. The application scope of a strain-hardeningcement composite (SHCC) depends on its strength and deformation characteristics [25–30].The values of these characteristics are determined by properties of the cement matrix, mi-crofiber, as well as by properties of the contact zone between matrix and microfiber [29,30].Microcracking, namely the number and width of cracks determines the pseudoplasticity ofcomposites and affects their durability that depends on the composite permeability [31,32].
In this paper, the high-strength cement matrix with a compressive strength of 70 MPabased on Portland cement and an average strength matrix with compressive strength of40 MPa based on ground granulated blast furnace slag with alkaline activation were used.Polypropylene microfiber was used as reinforcement. Polypropylene microfiber (PP) is awidespread and affordable material since there is an overproduction of polypropylene in theworld [33]. Studies on the use of PP fibers in the amount of 0.1–0.5% in cement compositesare continuing, for example, reduction of shrinkage of concrete based on seawater and seasand is shown in [34]. The strain-hardening behavior of composites based on inorganicbinders with PP microfiber has not been sufficiently studied.
Cement composites with 2%-vol. of PP microfiber have shown a tensile strain capacityin the range of 3–6%, with a first cracking strength of 1.6–2.1 MPa, an ultimate tensilestrength of 2.2–2.8 MPa and compressive strength of 15–45 MPa. These new composites aresignificantly more ductile with higher tensile strain capacity at least 300 times more thanthe tensile strain of reference composite without PP microfibers [35]. The addition of low-modulus hydrophobic PP microfiber has improved the ductility and the strain-hardeningbehavior of the cement composites containing polyvinyl-alcohol (PVA) microfiber [36].
The use of industrial by-products gives economic and environmental benefits [37–39].The mechanical properties of alkali-activated ladle slag mortars reinforced by multifilament-PP fiber (PP-MF) or split-film-PP fiber (PP-SF) in the amount of 2%-vol. reveals that theeffect of PP microfibers is evident with an increase of up to 300%, 80%, 7.6 times and150 times of flexural strength, tensile strength, fracture toughness and fracture energy,respectively. Furthermore, the PP-SF microfiber offers a better mechanical response thanthe PP-MF microfiber in post peak load carrying capacity of the reinforcement at uniaxialtension. Pseudo strain-hardening behavior was observed along with multiple microcracksunder the uniaxial tensile test [40].
The mechanical properties of composite based on ladle slag and gypsum (LSG) weresignificantly improved by using the PP microfiber as reinforcement. The LSG compositeswith the 2%-vol. of PP microfiber had pseudo strain-hardening behavior and high ductility.Multiple microcracks along with pseudo strain-hardening behavior were observed bythe DIC technique under uniaxial loading. The mechanical properties of 2%-PP-LSGmortars have increased up to 130%, 40%, 5.30 times and 124.8 times for flexural strength,compressive strength, fracture toughness and fracture energy, respectively, after 28 days ofcuring in a water bath [41].
The partial replacement of PVA microfiber with PP microfiber in cement compos-ites with 1.2%, 1.5% and 2% of PVA microfiber was studied in [42]. The PP microfiberswith different cross-sectional shapes were used in the amount of 25 and 40 vol.% of thePVA microfiber. It was found that PP microfiber with non-round cross-sectional shapes(i.e., triangular and trilobal) considerably improved the deformability of composites underthe bending load but reasonably decreased the flexural strength of composites. The maineffect of low modulus PP fibers was the improvement of composite deformability whichincreased the energy absorption capacity up to 75%. The results indicated that cementitiouscomposites with moderate strength, high deformability and lower cost can be obtainedusing the replacement of PVA fiber with non-round low modulus PP fiber [42].
From the analysis of the published results, it can be concluded that the use of PPmicrofiber contributes to the enhancement of ductility, but the results vary significantly.The difference in the mechanical properties of PP microfiber may be one of the reasons.
Materials 2022, 15, 1607 3 of 22
The microfiber manufacturers can add fillers and other modifying additives that lead to achange of properties of PP microfiber. PP microfibers properties of the above-cited papersare presented in Table 1.
Table 1. Characteristics of PP microfibers of cited papers.
Microfiber TensileStrength, MPa
FiberDiameter, µm
FiberLength, mm
Young’sModulus, GPa
Elongationat Break, %
Density,g/cm3 Reference
PP fiber 850 12 10 6 21 0.91 [35]
PP-MFMulti-fiber >220 20 12 1 100–200 0.91
[40]PP-SF
Split-film fiber >340 38 20 4 11 0.91
PP-MFMulti-fiber 910 12 10 9 22 0.91 [41]
PP-Circular 326 25 12 2.74 - -
[42]PP-Triangular 247–300 32 12 2.39 - -
PP-Trilobal 141–234 38 12 1.25 - -
PVA 1600 38 8 42.8 - -
A method is needed to assess the strength and deformation properties of the materialin the structure under operating conditions [43–45]. The analysis of deformation curvesand acoustic emission parameters can be used to evaluate the destruction of composites.Acoustic emission (AE) testing is a technique to detect the formation and growth of cracksboth on the surface and inside the material. Crack formation and propagation in brittlematerials are combined with a local rapid release of stored strain energy. The resultingelastic waves propagate through the material and can be detected by piezoelectric sensorson the surface. The characteristics of the elastic waves and hence the electric signals fromthe sensors depend on the crack type and the acoustic properties of the material [46].Analysis of the signal parameters (e.g., amplitude and average frequency) makes it possibleto classify the cracks, e.g., as described in papers [47–49]. In combination with the stress–strain curves one can draw conclusions about the destruction mechanism of SHCCs [46,50].
The aim of the paper is to study the strain-hardening behavior under tension inbending of composites based on inorganic binders with polypropylene microfiber with theadditional determination of acoustic emission parameters.
2. Materials and Methods2.1. Materials and Mixture Composition
Ordinary Portland cement (CEM I 42.5) was used for the study. The microfillerswere obtained by grinding quartz sand and marking it as A1.5 (D50 = 1.5 µm) and A4(D50 = 4 µm). The ground quartz sands with different fineness were marked as A1.5; A4;A15. The properties of polypropylene (PP) microfiber are presented in Table 2. Mixproportions are presented in Tables 3 and 4.
The compositions based on Portland cement differed in the microfiber amount. Thecompositions based on alkali-activated slag binder differed in the water-to-binder ratio.
2.2. Manufacturing Procedure
The workability of the fresh mixture decreases with an increase in the microfiberquantity. Summarizing the experience of other scientists and own experience it is advisableto develop new compositions of strain-hardening of inorganic composite according to thescheme in Figure 1. Development of new strain-hardening inorganic composite can be inmixture composition and in manufacturing technology. In study of mixture compositionsthe following results were obtained: the use of microfiber in the amount of 2% by volume
Materials 2022, 15, 1607 4 of 22
or more [51–55]; the use of rheologically active mineral additives in cement matriceswith a superplasticizer to ensure workability at low W/C ratio and at high microfiberamount [56,57]; the use of mineral additives that improve workability and setting time inalkali-activated slag matrices [58–61]; the use of quartz sand with a low fineness modulusas a fine aggregate to obtain a homogeneous matrix and ensure a dense and uniform contactof matrix with the microfiber surface [62–68]. Manufacturing technology takes into account:the sequence of addition of components into a mixture [69–73]; mixing modes [62,74–77].
It is shown in papers [1–3,62] that it is necessary to increase the matrix density toachieve strain-hardening in composites with hydrophobic microfiber. An increase indensity can be achieved by reducing the water-to-cement ratio using a superplasticizerand rheologically active mineral additives. High filling with microfiber can be achievedby justifying the choice of the type of concrete mixer [68–71], the sequence of addition ofcomponents [72–74], and the speed and duration of mixing [62,75–77].
A laboratory automatic mixer for mortars from Tinius Olsen was used to prepare themixtures (Figure 2). It has three mixing modes with different speeds.
At first, the fresh mixture was made without fiber. In both cases at preparing thecement matrix or the slag-alkali matrix, the fresh mixtures were obtained with high fluiditydespite the low values of the water-to-cement ratio. This was achieved by taking intoaccount the recommendations from Figure 1. Then the PP microfiber was added and themixer was started at the second speed for 180 s. Composition of matrices with maximummicrofiber quantity (5.5 and 3.5%) was selected taking into account the mixture workability.The spread diameter of mixtures on the shaking table was 160 mm after 15 shakes.
Table 2. PP microfiber characteristics.
Average diameter 20 µm
Length 6 mm
Shape round
Density 0.91 g/cm3
Tensile strength 350 MPa
Tensile modulus 5.7 GPa
Elongation at break 250%
Softening temperature 150 ◦C
Ignition temperature >320 ◦C
Water wettability of fiber surface hydrophobic
Table 3. Mix proportions of PP microfiber reinforced Portland cement composite (kg/m3).
Mix 2 Mix 6
Cement CEM I 42.5 1418 1392
Ground quartz sand A1.5 282 282
Quartz sand 0.06–2 mm 145 145
Polycarboxylate-based superplasticizer 35 35
PP microfiber 40 50
Water 312 310
W/C 0.22 0.22
Density after mixing, kg/m3 2232 2213
Density at the age of 28 days, kg/m3 2120 2070
PP microfiber % by vol. 4.4% 5.5%
Materials 2022, 15, 1607 5 of 22
Table 4. Mix proportions of PP microfiber reinforced alkali-activated slag composite (kg/m3).
Mix 3 Mix 4
Ground granulated blast furnace slag 1133 1275
Ground quartz sand A4 224 232
Quartz sand 0.06–2 mm 113 120
PP microfiber 32 32
Liquid glass with the density of 1.3 g/cm3 and with the silicate module equal to 1.5 120 122
NaOH 38 41
Water 338 280
Water-to-slag ratio 0.3 0.22
Density after mixing, kg/m3 1998 2102
Density at the age of 28 days, kg/m3 1961 2025
PP microfiber % by vol. 3.5% 3.5%
Materials 2022, 15, x FOR PEER REVIEW 5 of 23
volume or more [51–55]; the use of rheologically active mineral additives in cement ma-trices with a superplasticizer to ensure workability at low W/C ratio and at high microfiber amount [56,57]; the use of mineral additives that improve workability and setting time in alkali-activated slag matrices [58–61]; the use of quartz sand with a low fineness modulus as a fine aggregate to obtain a homogeneous matrix and ensure a dense and uniform con-tact of matrix with the microfiber surface [62–68]. Manufacturing technology takes into account: the sequence of addition of components into a mixture [69–73]; mixing modes [62,74–77].
It is shown in papers [1–3,62] that it is necessary to increase the matrix density to achieve strain-hardening in composites with hydrophobic microfiber. An increase in den-sity can be achieved by reducing the water-to-cement ratio using a superplasticizer and rheologically active mineral additives. High filling with microfiber can be achieved by justifying the choice of the type of concrete mixer [68–71], the sequence of addition of components [72–74], and the speed and duration of mixing [62,75–77].
Figure 1. Scheme for the development of new compositions of SHCCs.
A laboratory automatic mixer for mortars from Tinius Olsen was used to prepare the mixtures (Figure 2). It has three mixing modes with different speeds.
Figure 2. Tinius Olsen laboratory automatic mixer.
Figure 1. Scheme for the development of new compositions of SHCCs.
Materials 2022, 15, x FOR PEER REVIEW 5 of 23
volume or more [51–55]; the use of rheologically active mineral additives in cement ma‐
trices with a superplasticizer to ensure workability at low W/C ratio and at high microfiber
amount [56,57]; the use of mineral additives that improve workability and setting time in
alkali‐activated slag matrices [58–61]; the use of quartz sand with a low fineness modulus
as a fine aggregate to obtain a homogeneous matrix and ensure a dense and uniform con‐
tact of matrix with the microfiber surface [62–68]. Manufacturing technology takes into
account: the sequence of addition of components into a mixture [69–73]; mixing modes
[62,74–77].
It is shown in papers [1–3,62] that it is necessary to increase the matrix density to
achieve strain‐hardening in composites with hydrophobic microfiber. An increase in den‐
sity can be achieved by reducing the water‐to‐cement ratio using a superplasticizer and
rheologically active mineral additives. High filling with microfiber can be achieved by
justifying the choice of the type of concrete mixer [68–71], the sequence of addition of
components [72–74], and the speed and duration of mixing [62,75–77].
Figure 1. Scheme for the development of new compositions of SHCCs.
A laboratory automatic mixer for mortars from Tinius Olsen was used to prepare the
mixtures (Figure 2). It has three mixing modes with different speeds.
Figure 2. Tinius Olsen laboratory automatic mixer. Figure 2. Tinius Olsen laboratory automatic mixer.
Materials 2022, 15, 1607 6 of 22
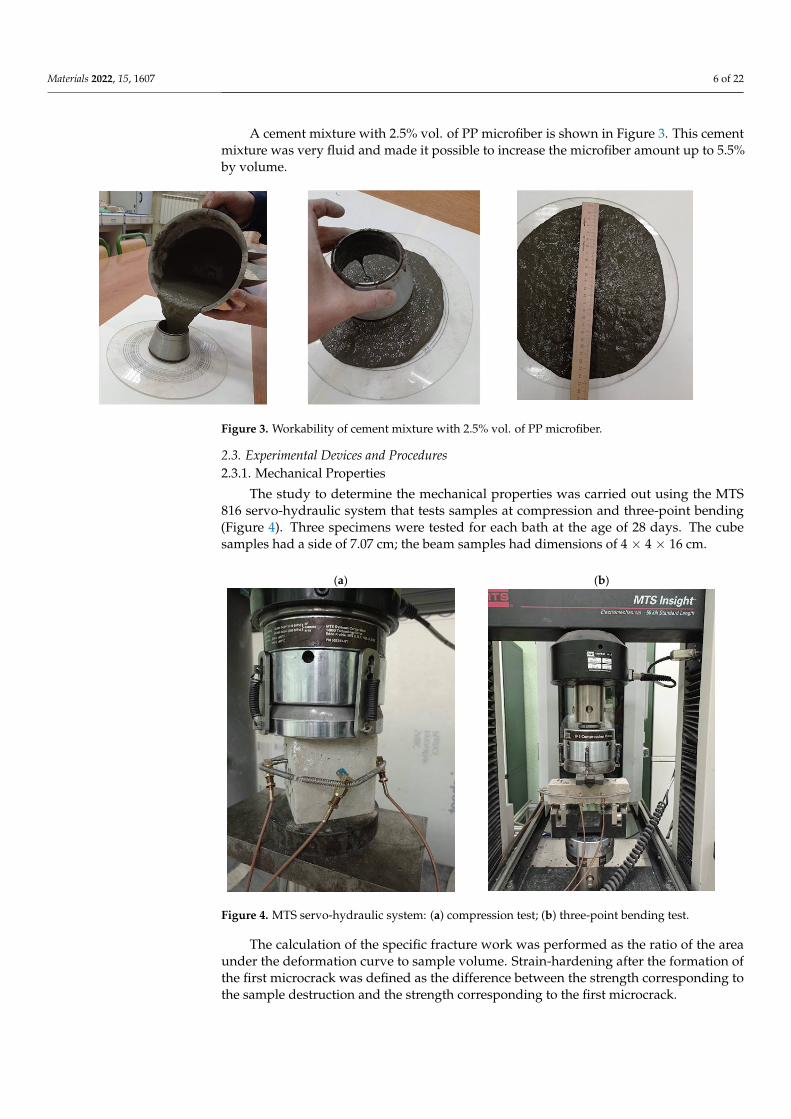
A cement mixture with 2.5% vol. of PP microfiber is shown in Figure 3. This cementmixture was very fluid and made it possible to increase the microfiber amount up to 5.5%by volume.
Materials 2022, 15, x FOR PEER REVIEW 6 of 23
At first, the fresh mixture was made without fiber. In both cases at preparing the cement matrix or the slag-alkali matrix, the fresh mixtures were obtained with high fluid-ity despite the low values of the water-to-cement ratio. This was achieved by taking into account the recommendations from Figure 1. Then the PP microfiber was added and the mixer was started at the second speed for 180 s. Composition of matrices with maximum microfiber quantity (5.5 and 3.5%) was selected taking into account the mixture workabil-ity. The spread diameter of mixtures on the shaking table was 160 mm after 15 shakes.
A cement mixture with 2.5% vol. of PP microfiber is shown in Figure 3. This cement mixture was very fluid and made it possible to increase the microfiber amount up to 5.5% by volume.
Figure 3. Workability of cement mixture with 2.5% vol. of PP microfiber.
2.3. Experimental Devices and Procedures 2.3.1. Mechanical Properties
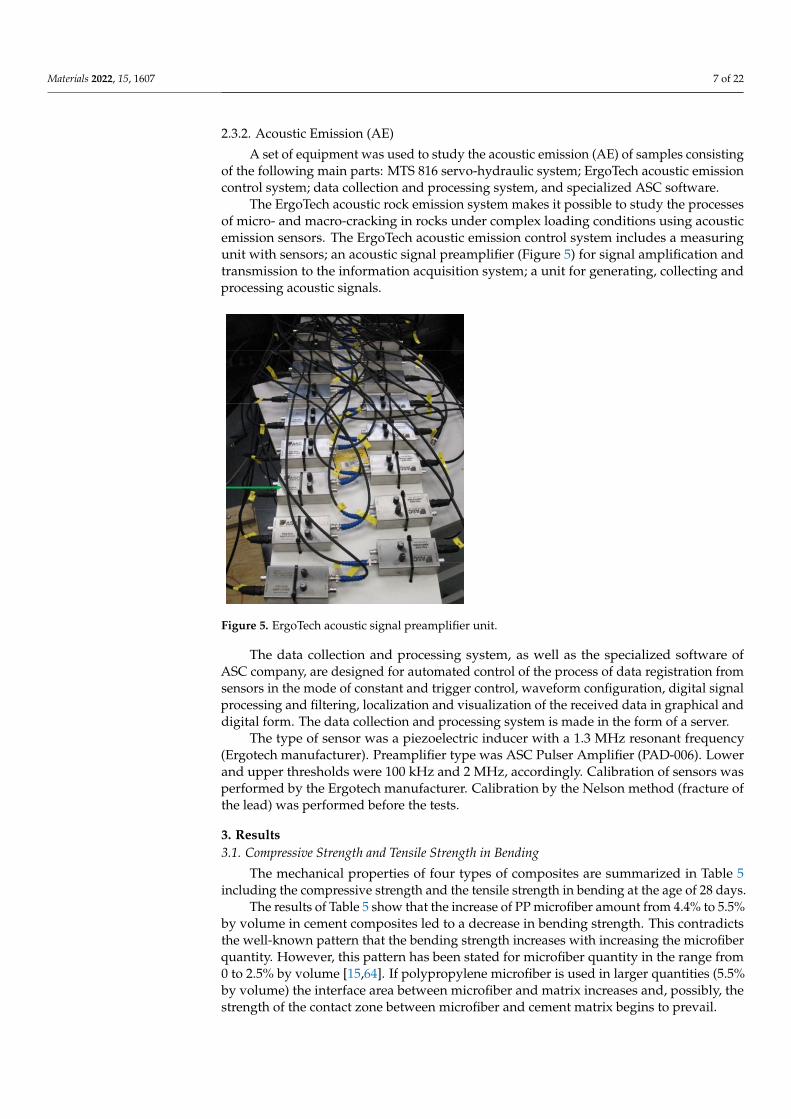
The study to determine the mechanical properties was carried out using the MTS 816 servo-hydraulic system that tests samples at compression and three-point bending (Figure 4). Three specimens were tested for each bath at the age of 28 days. The cube samples had a side of 7.07 cm; the beam samples had dimensions of 4 × 4 × 16 cm.
(a) (b)
Figure 4. MTS servo-hydraulic system: (a) compression test; (b) three-point bending test.
Figure 3. Workability of cement mixture with 2.5% vol. of PP microfiber.
2.3. Experimental Devices and Procedures2.3.1. Mechanical Properties
The study to determine the mechanical properties was carried out using the MTS816 servo-hydraulic system that tests samples at compression and three-point bending(Figure 4). Three specimens were tested for each bath at the age of 28 days. The cubesamples had a side of 7.07 cm; the beam samples had dimensions of 4 × 4 × 16 cm.
Materials 2022, 15, x FOR PEER REVIEW 6 of 23
At first, the fresh mixture was made without fiber. In both cases at preparing the cement matrix or the slag-alkali matrix, the fresh mixtures were obtained with high fluid-ity despite the low values of the water-to-cement ratio. This was achieved by taking into account the recommendations from Figure 1. Then the PP microfiber was added and the mixer was started at the second speed for 180 s. Composition of matrices with maximum microfiber quantity (5.5 and 3.5%) was selected taking into account the mixture workabil-ity. The spread diameter of mixtures on the shaking table was 160 mm after 15 shakes.
A cement mixture with 2.5% vol. of PP microfiber is shown in Figure 3. This cement mixture was very fluid and made it possible to increase the microfiber amount up to 5.5% by volume.
Figure 3. Workability of cement mixture with 2.5% vol. of PP microfiber.
2.3. Experimental Devices and Procedures 2.3.1. Mechanical Properties
The study to determine the mechanical properties was carried out using the MTS 816 servo-hydraulic system that tests samples at compression and three-point bending (Figure 4). Three specimens were tested for each bath at the age of 28 days. The cube samples had a side of 7.07 cm; the beam samples had dimensions of 4 × 4 × 16 cm.
(a) (b)
Figure 4. MTS servo-hydraulic system: (a) compression test; (b) three-point bending test. Figure 4. MTS servo-hydraulic system: (a) compression test; (b) three-point bending test.
The calculation of the specific fracture work was performed as the ratio of the areaunder the deformation curve to sample volume. Strain-hardening after the formation ofthe first microcrack was defined as the difference between the strength corresponding tothe sample destruction and the strength corresponding to the first microcrack.
Materials 2022, 15, 1607 7 of 22
2.3.2. Acoustic Emission (AE)
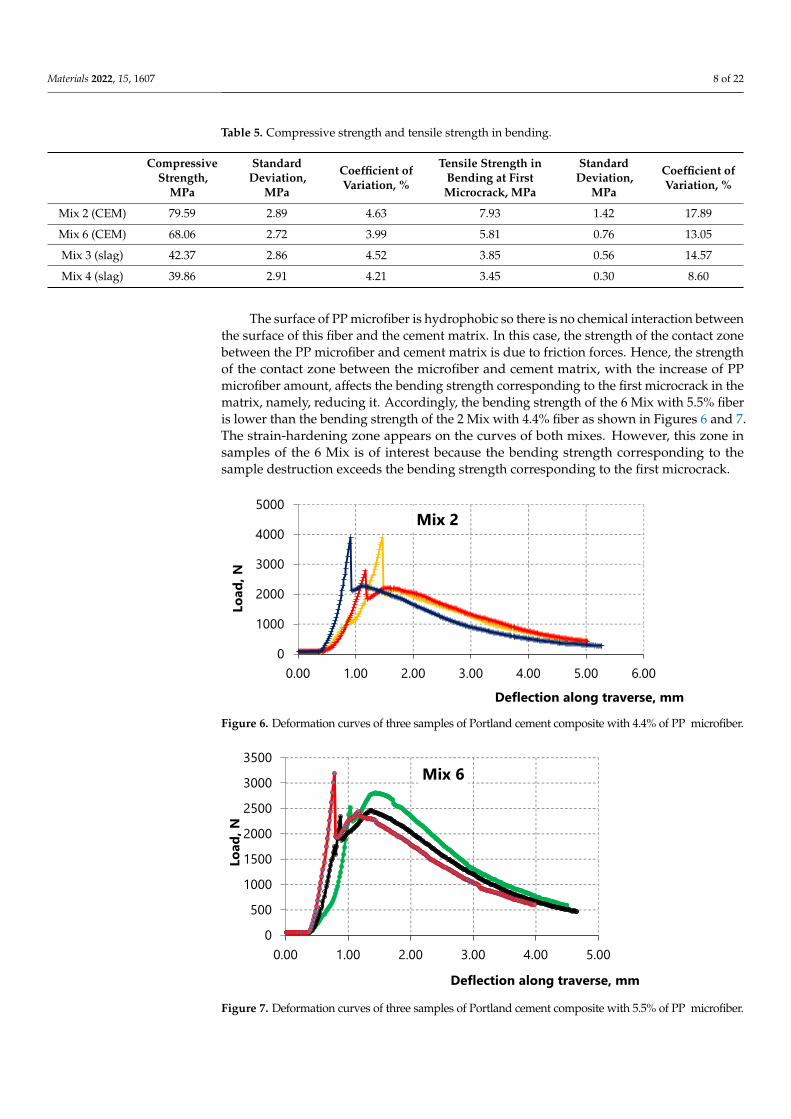
A set of equipment was used to study the acoustic emission (AE) of samples consistingof the following main parts: MTS 816 servo-hydraulic system; ErgoTech acoustic emissioncontrol system; data collection and processing system, and specialized ASC software.
The ErgoTech acoustic rock emission system makes it possible to study the processesof micro- and macro-cracking in rocks under complex loading conditions using acousticemission sensors. The ErgoTech acoustic emission control system includes a measuringunit with sensors; an acoustic signal preamplifier (Figure 5) for signal amplification andtransmission to the information acquisition system; a unit for generating, collecting andprocessing acoustic signals.
Materials 2022, 15, x FOR PEER REVIEW 7 of 23
The calculation of the specific fracture work was performed as the ratio of the area
under the deformation curve to sample volume. Strain‐hardening after the formation of
the first microcrack was defined as the difference between the strength corresponding to
the sample destruction and the strength corresponding to the first microcrack.
2.3.2. Acoustic Emission (AE)
A set of equipment was used to study the acoustic emission (AE) of samples consist‐
ing of the following main parts: MTS 816 servo‐hydraulic system; ErgoTech acoustic emis‐
sion control system; data collection and processing system, and specialized ASC software.
The ErgoTech acoustic rock emission system makes it possible to study the processes
of micro‐ and macro‐cracking in rocks under complex loading conditions using acoustic
emission sensors. The ErgoTech acoustic emission control system includes a measuring
unit with sensors; an acoustic signal preamplifier (Figure 5) for signal amplification and
transmission to the information acquisition system; a unit for generating, collecting and
processing acoustic signals.
The data collection and processing system, as well as the specialized software of ASC
company, are designed for automated control of the process of data registration from sen‐
sors in the mode of constant and trigger control, waveform configuration, digital signal
processing and filtering, localization and visualization of the received data in graphical
and digital form. The data collection and processing system is made in the form of a
server.
The type of sensor was a piezoelectric inducer with a 1.3 MHz resonant frequency
(Ergotech manufacturer). Preamplifier type was ASC Pulser Amplifier (PAD‐006). Lower
and upper thresholds were 100 kHz and 2 MHz, accordingly. Calibration of sensors was
performed by the Ergotech manufacturer. Calibration by the Nelson method (fracture of
the lead) was performed before the tests.
Figure 5. ErgoTech acoustic signal preamplifier unit.
3. Results
3.1. Compressive Strength and Tensile Strength in Bending
The mechanical properties of four types of composites are summarized in Table 5
including the compressive strength and the tensile strength in bending at the age of 28
days.
Figure 5. ErgoTech acoustic signal preamplifier unit.
The data collection and processing system, as well as the specialized software ofASC company, are designed for automated control of the process of data registration fromsensors in the mode of constant and trigger control, waveform configuration, digital signalprocessing and filtering, localization and visualization of the received data in graphical anddigital form. The data collection and processing system is made in the form of a server.
The type of sensor was a piezoelectric inducer with a 1.3 MHz resonant frequency(Ergotech manufacturer). Preamplifier type was ASC Pulser Amplifier (PAD-006). Lowerand upper thresholds were 100 kHz and 2 MHz, accordingly. Calibration of sensors wasperformed by the Ergotech manufacturer. Calibration by the Nelson method (fracture ofthe lead) was performed before the tests.
3. Results3.1. Compressive Strength and Tensile Strength in Bending
The mechanical properties of four types of composites are summarized in Table 5including the compressive strength and the tensile strength in bending at the age of 28 days.
The results of Table 5 show that the increase of PP microfiber amount from 4.4% to 5.5%by volume in cement composites led to a decrease in bending strength. This contradictsthe well-known pattern that the bending strength increases with increasing the microfiberquantity. However, this pattern has been stated for microfiber quantity in the range from0 to 2.5% by volume [15,64]. If polypropylene microfiber is used in larger quantities (5.5%by volume) the interface area between microfiber and matrix increases and, possibly, thestrength of the contact zone between microfiber and cement matrix begins to prevail.
Materials 2022, 15, 1607 8 of 22
Table 5. Compressive strength and tensile strength in bending.
CompressiveStrength,
MPa
StandardDeviation,
MPa
Coefficient ofVariation, %
Tensile Strength inBending at FirstMicrocrack, MPa
StandardDeviation,
MPa
Coefficient ofVariation, %
Mix 2 (CEM) 79.59 2.89 4.63 7.93 1.42 17.89
Mix 6 (CEM) 68.06 2.72 3.99 5.81 0.76 13.05
Mix 3 (slag) 42.37 2.86 4.52 3.85 0.56 14.57
Mix 4 (slag) 39.86 2.91 4.21 3.45 0.30 8.60
The surface of PP microfiber is hydrophobic so there is no chemical interaction betweenthe surface of this fiber and the cement matrix. In this case, the strength of the contact zonebetween the PP microfiber and cement matrix is due to friction forces. Hence, the strengthof the contact zone between the microfiber and cement matrix, with the increase of PPmicrofiber amount, affects the bending strength corresponding to the first microcrack in thematrix, namely, reducing it. Accordingly, the bending strength of the 6 Mix with 5.5% fiberis lower than the bending strength of the 2 Mix with 4.4% fiber as shown in Figures 6 and 7.The strain-hardening zone appears on the curves of both mixes. However, this zone insamples of the 6 Mix is of interest because the bending strength corresponding to thesample destruction exceeds the bending strength corresponding to the first microcrack.
Materials 2022, 15, x FOR PEER REVIEW 8 of 23
Table 5. Compressive strength and tensile strength in bending.
Compressive
Strength, MPa
Standard Deviation,
MPa
Coefficient of Variation, %
Tensile Strength in Bending at First Microcrack,
MPa
Standard Deviation,
MPa
Coefficient of
Variation, % Mix 2 (CEM) 79.59 2.89 4.63 7.93 1.42 17.89 Mix 6 (CEM) 68.06 2.72 3.99 5.81 0.76 13.05 Mix 3 (slag) 42.37 2.86 4.52 3.85 0.56 14.57 Mix 4 (slag) 39.86 2.91 4.21 3.45 0.30 8.60
The results of Table 5 show that the increase of PP microfiber amount from 4.4% to 5.5% by volume in cement composites led to a decrease in bending strength. This contra-dicts the well-known pattern that the bending strength increases with increasing the mi-crofiber quantity. However, this pattern has been stated for microfiber quantity in the range from 0 to 2.5% by volume [15,64]. If polypropylene microfiber is used in larger quantities (5.5% by volume) the interface area between microfiber and matrix increases and, possibly, the strength of the contact zone between microfiber and cement matrix be-gins to prevail.
The surface of PP microfiber is hydrophobic so there is no chemical interaction be-tween the surface of this fiber and the cement matrix. In this case, the strength of the con-tact zone between the PP microfiber and cement matrix is due to friction forces. Hence, the strength of the contact zone between the microfiber and cement matrix, with the in-crease of PP microfiber amount, affects the bending strength corresponding to the first microcrack in the matrix, namely, reducing it. Accordingly, the bending strength of the 6 Mix with 5.5% fiber is lower than the bending strength of the 2 Mix with 4.4% fiber as shown in Figures 6 and 7. The strain-hardening zone appears on the curves of both mixes. However, this zone in samples of the 6 Mix is of interest because the bending strength corresponding to the sample destruction exceeds the bending strength corresponding to the first microcrack.
Figure 6. Deformation curves of three samples of Portland cement composite with 4.4% of PP mi-crofiber.
0
1000
2000
3000
4000
5000
0.00 1.00 2.00 3.00 4.00 5.00 6.00
Load
, N
Deflection along traverse, mm
Mix 2
Figure 6. Deformation curves of three samples of Portland cement composite with 4.4% of PP microfiber.
Materials 2022, 15, x FOR PEER REVIEW 9 of 23
Figure 7. Deformation curves of three samples of Portland cement composite with 5.5% of PP mi-crofiber.
The results show a contradictory pattern in the case of composites with alkali-acti-vated slag matrix (compositions 3 and 4). The bending strength decreases with the de-crease of the water-to-binder ratio at a constant microfiber amount according to Table 5 and Figures 8 and 9. However, the strain-hardening zone appears in composition 4 with W/B = 0.22, which is more pronounced compared to the zone on the deformation curve of composition 3 with W/B = 0.3, namely, the bending strength corresponding to sample de-struction exceeds the bending strength corresponding to the first microcrack. Thus, strain-hardening behavior in which the strength value corresponding to sample destruction ex-ceeds the strength value corresponding to the first crack appears in the studied alkali-activated slag matrix of medium strength with the decrease of the water-to-binder ratio up to 0.22.
Thus, the effect of the PP microfiber amount and the water-to-binder ratio is studied in this paper. Analysis of sample destruction showed that the characteristics of defor-mation curves significantly depend on the compositions. In general, the low-strain hard-ening composites and the high-strain hardening composites can be distinguished depend-ing on the nature of deformation [78].
When operating construction structures made on the basis of strain-hardening com-posites reliable methods of monitoring changes in mechanical and deformation properties are needed, for example, the acoustic emission method.
0
500
1000
1500
2000
2500
3000
3500
0.00 1.00 2.00 3.00 4.00 5.00
Load
, N
Deflection along traverse, mm
Mix 6
0
500
1000
1500
2000
2500
0.00 1.00 2.00 3.00 4.00 5.00 6.00
Load
, N
Deflection along traverse, mm
Mix 3
Figure 7. Deformation curves of three samples of Portland cement composite with 5.5% of PP microfiber.
Materials 2022, 15, 1607 9 of 22
The results show a contradictory pattern in the case of composites with alkali-activatedslag matrix (compositions 3 and 4). The bending strength decreases with the decrease of thewater-to-binder ratio at a constant microfiber amount according to Table 5 and Figures 8 and 9.However, the strain-hardening zone appears in composition 4 with W/B = 0.22, which ismore pronounced compared to the zone on the deformation curve of composition 3 withW/B = 0.3, namely, the bending strength corresponding to sample destruction exceeds thebending strength corresponding to the first microcrack. Thus, strain-hardening behaviorin which the strength value corresponding to sample destruction exceeds the strengthvalue corresponding to the first crack appears in the studied alkali-activated slag matrix ofmedium strength with the decrease of the water-to-binder ratio up to 0.22.
Materials 2022, 15, x FOR PEER REVIEW 9 of 23
Figure 7. Deformation curves of three samples of Portland cement composite with 5.5% of PP mi-crofiber.
The results show a contradictory pattern in the case of composites with alkali-acti-vated slag matrix (compositions 3 and 4). The bending strength decreases with the de-crease of the water-to-binder ratio at a constant microfiber amount according to Table 5 and Figures 8 and 9. However, the strain-hardening zone appears in composition 4 with W/B = 0.22, which is more pronounced compared to the zone on the deformation curve of composition 3 with W/B = 0.3, namely, the bending strength corresponding to sample de-struction exceeds the bending strength corresponding to the first microcrack. Thus, strain-hardening behavior in which the strength value corresponding to sample destruction ex-ceeds the strength value corresponding to the first crack appears in the studied alkali-activated slag matrix of medium strength with the decrease of the water-to-binder ratio up to 0.22.
Thus, the effect of the PP microfiber amount and the water-to-binder ratio is studied in this paper. Analysis of sample destruction showed that the characteristics of defor-mation curves significantly depend on the compositions. In general, the low-strain hard-ening composites and the high-strain hardening composites can be distinguished depend-ing on the nature of deformation [78].
When operating construction structures made on the basis of strain-hardening com-posites reliable methods of monitoring changes in mechanical and deformation properties are needed, for example, the acoustic emission method.
0
500
1000
1500
2000
2500
3000
3500
0.00 1.00 2.00 3.00 4.00 5.00
Load
, N
Deflection along traverse, mm
Mix 6
0
500
1000
1500
2000
2500
0.00 1.00 2.00 3.00 4.00 5.00 6.00
Load
, N
Deflection along traverse, mm
Mix 3
Figure 8. Deformation curves of three samples of alkali-activated slag composite with 3.5% vol. ofPP microfiber and W/B = 0.3.
Materials 2022, 15, x FOR PEER REVIEW 10 of 23
Figure 8. Deformation curves of three samples of alkali-activated slag composite with 3.5% vol. of PP microfiber and W/B = 0.3.
Figure 9. Deformation curves of three samples of alkali-activated slag composite with 3.5% vol. of PP microfiber and W/B = 0.22.
3.2. AE Measurements Flow characteristics, such as the number of signals and activity are used to describe
the patterns of AE behavior during sample loading [79,80]. The signal number of AE is registered for a certain time interval that counts from the beginning of observation. The activity is a derivative of the number of signals in time. Activity shows an increase in the number of AE signals registered per unit of time.
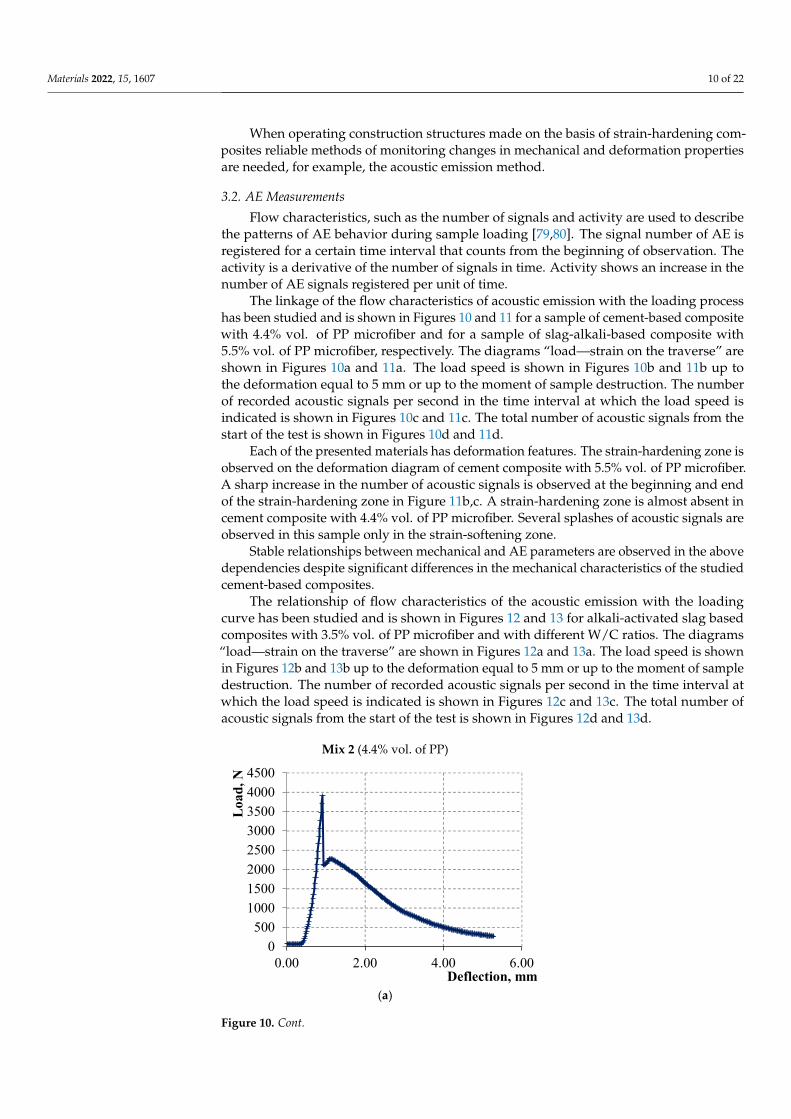
The linkage of the flow characteristics of acoustic emission with the loading process has been studied and is shown in Figures 10 and 11 for a sample of cement-based compo-site with 4.4% vol. of PP microfiber and for a sample of slag-alkali-based composite with 5.5% vol. of PP microfiber, respectively. The diagrams “load—strain on the traverse” are shown in Figures 10a and 11a. The load speed is shown in Figures 10b and 11b up to the deformation equal to 5 mm or up to the moment of sample destruction. The number of recorded acoustic signals per second in the time interval at which the load speed is indi-cated is shown in Figures 10c and 11c. The total number of acoustic signals from the start of the test is shown in Figures 10d and 11d.
Mix 2 (4.4% vol. of PP)
(a)
0200400600800100012001400160018002000
0.00 1.00 2.00 3.00 4.00 5.00 6.00
Load
, N
Deflection along traverse, mm
Mix 4
0500
10001500200025003000350040004500
0.00 2.00 4.00 6.00
Loa
d, N
Deflection, mm
Figure 9. Deformation curves of three samples of alkali-activated slag composite with 3.5% vol. ofPP microfiber and W/B = 0.22.
Thus, the effect of the PP microfiber amount and the water-to-binder ratio is studied inthis paper. Analysis of sample destruction showed that the characteristics of deformationcurves significantly depend on the compositions. In general, the low-strain hardeningcomposites and the high-strain hardening composites can be distinguished depending onthe nature of deformation [78].
Materials 2022, 15, 1607 10 of 22
When operating construction structures made on the basis of strain-hardening com-posites reliable methods of monitoring changes in mechanical and deformation propertiesare needed, for example, the acoustic emission method.
3.2. AE Measurements
Flow characteristics, such as the number of signals and activity are used to describethe patterns of AE behavior during sample loading [79,80]. The signal number of AE isregistered for a certain time interval that counts from the beginning of observation. Theactivity is a derivative of the number of signals in time. Activity shows an increase in thenumber of AE signals registered per unit of time.
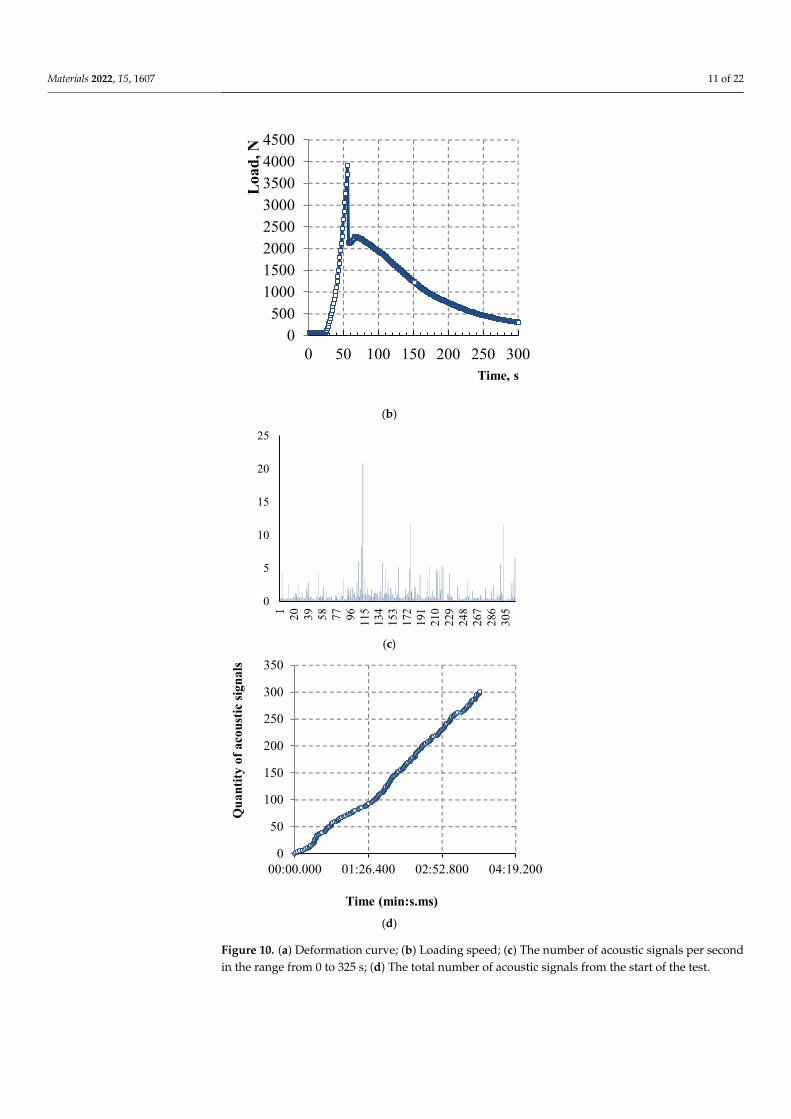
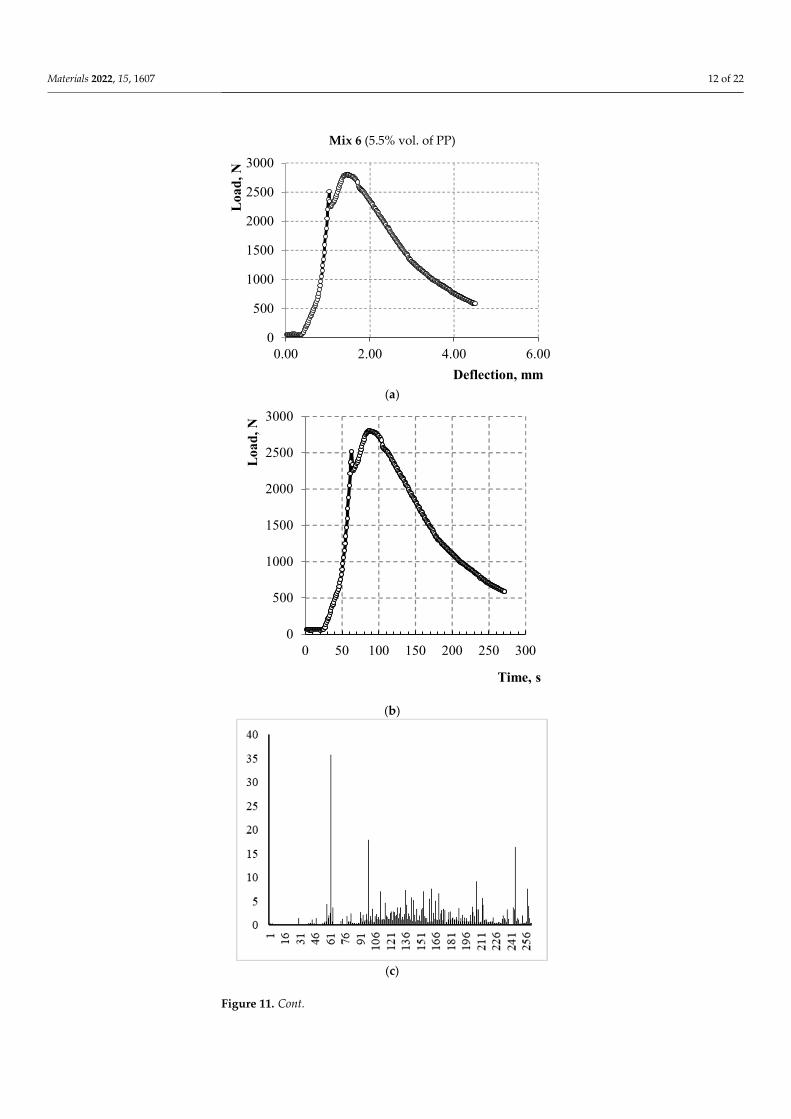
The linkage of the flow characteristics of acoustic emission with the loading processhas been studied and is shown in Figures 10 and 11 for a sample of cement-based compositewith 4.4% vol. of PP microfiber and for a sample of slag-alkali-based composite with5.5% vol. of PP microfiber, respectively. The diagrams “load—strain on the traverse” areshown in Figures 10a and 11a. The load speed is shown in Figures 10b and 11b up tothe deformation equal to 5 mm or up to the moment of sample destruction. The numberof recorded acoustic signals per second in the time interval at which the load speed isindicated is shown in Figures 10c and 11c. The total number of acoustic signals from thestart of the test is shown in Figures 10d and 11d.
Each of the presented materials has deformation features. The strain-hardening zone isobserved on the deformation diagram of cement composite with 5.5% vol. of PP microfiber.A sharp increase in the number of acoustic signals is observed at the beginning and endof the strain-hardening zone in Figure 11b,c. A strain-hardening zone is almost absent incement composite with 4.4% vol. of PP microfiber. Several splashes of acoustic signals areobserved in this sample only in the strain-softening zone.
Stable relationships between mechanical and AE parameters are observed in the abovedependencies despite significant differences in the mechanical characteristics of the studiedcement-based composites.
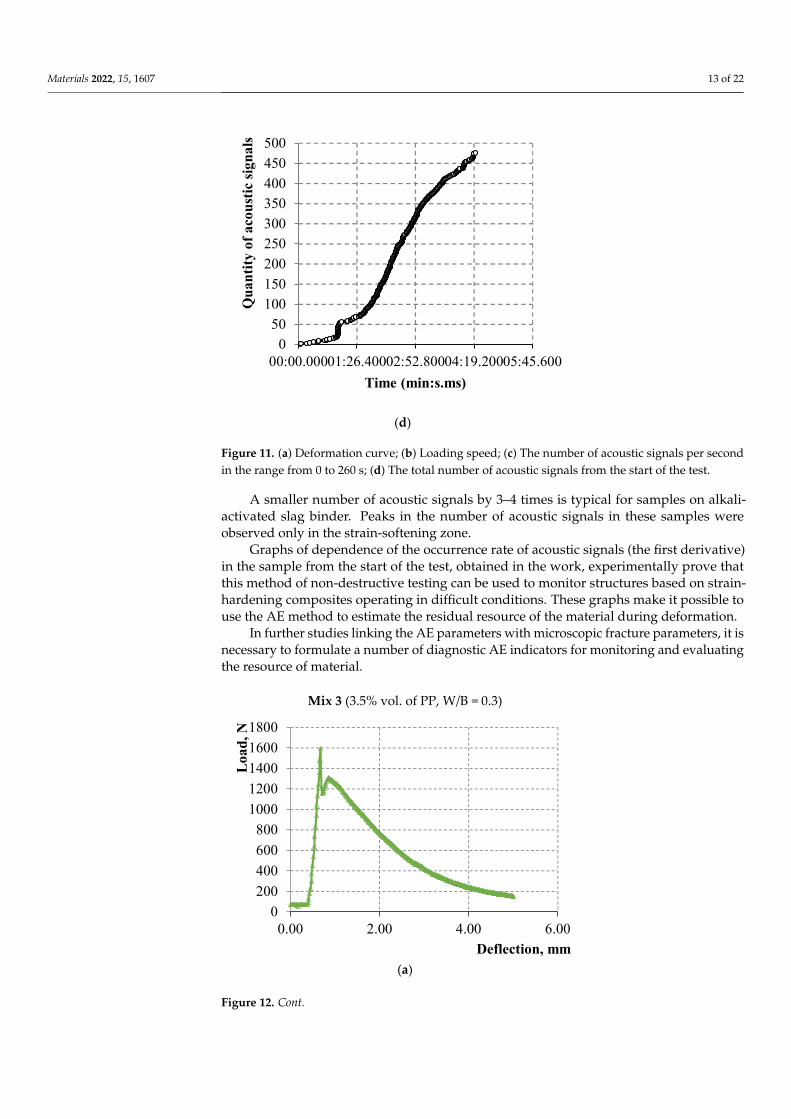
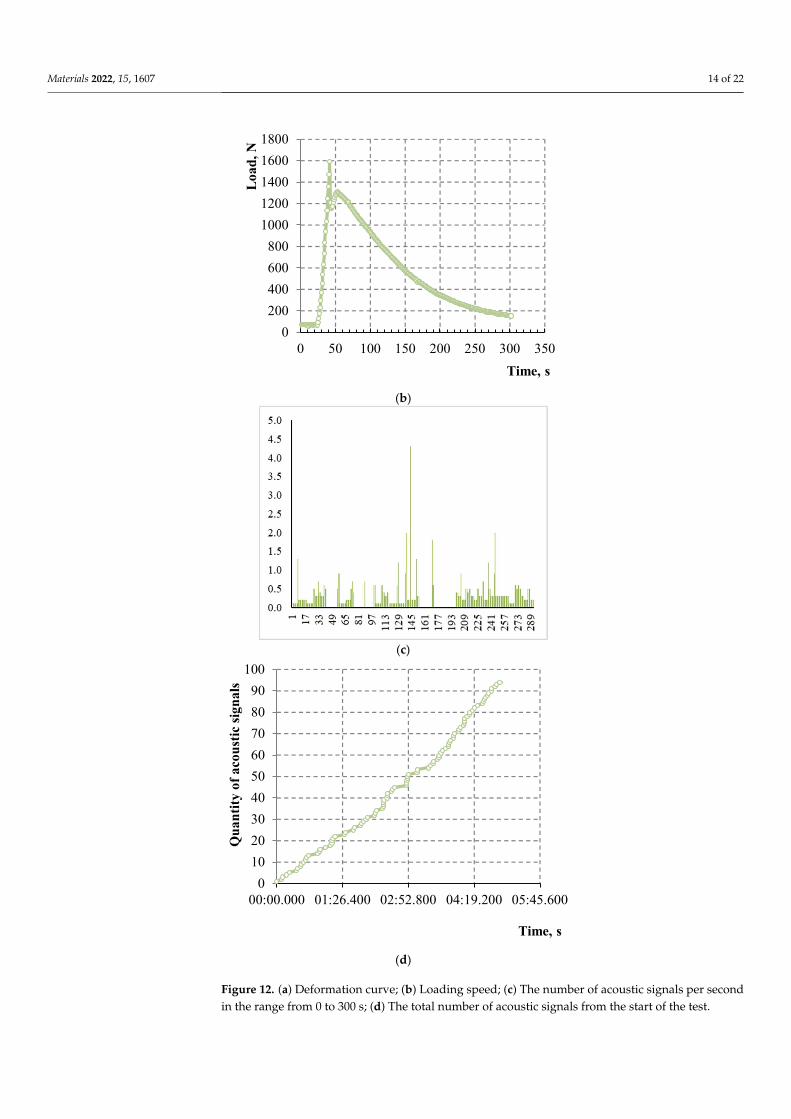
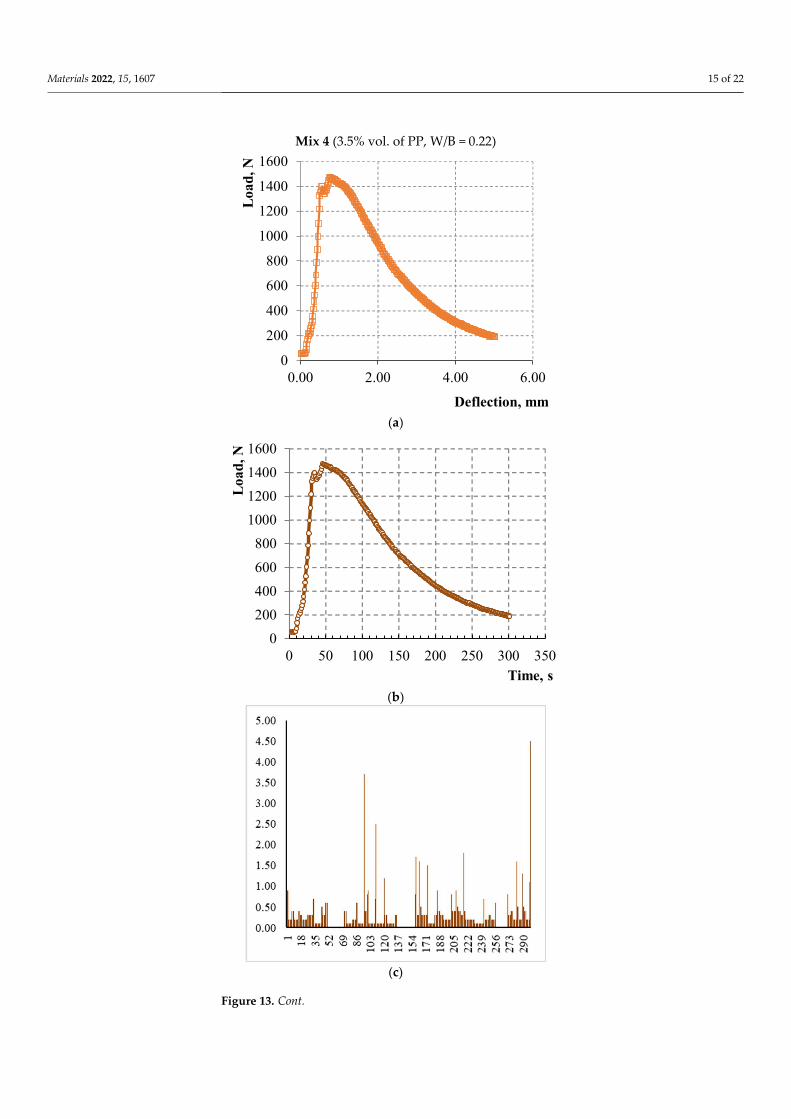
The relationship of flow characteristics of the acoustic emission with the loadingcurve has been studied and is shown in Figures 12 and 13 for alkali-activated slag basedcomposites with 3.5% vol. of PP microfiber and with different W/C ratios. The diagrams“load—strain on the traverse” are shown in Figures 12a and 13a. The load speed is shownin Figures 12b and 13b up to the deformation equal to 5 mm or up to the moment of sampledestruction. The number of recorded acoustic signals per second in the time interval atwhich the load speed is indicated is shown in Figures 12c and 13c. The total number ofacoustic signals from the start of the test is shown in Figures 12d and 13d.
Materials 2022, 15, x FOR PEER REVIEW 10 of 23
Figure 8. Deformation curves of three samples of alkali-activated slag composite with 3.5% vol. of PP microfiber and W/B = 0.3.
Figure 9. Deformation curves of three samples of alkali-activated slag composite with 3.5% vol. of PP microfiber and W/B = 0.22.
3.2. AE Measurements Flow characteristics, such as the number of signals and activity are used to describe
the patterns of AE behavior during sample loading [79,80]. The signal number of AE is registered for a certain time interval that counts from the beginning of observation. The activity is a derivative of the number of signals in time. Activity shows an increase in the number of AE signals registered per unit of time.
The linkage of the flow characteristics of acoustic emission with the loading process has been studied and is shown in Figures 10 and 11 for a sample of cement-based compo-site with 4.4% vol. of PP microfiber and for a sample of slag-alkali-based composite with 5.5% vol. of PP microfiber, respectively. The diagrams “load—strain on the traverse” are shown in Figures 10a and 11a. The load speed is shown in Figures 10b and 11b up to the deformation equal to 5 mm or up to the moment of sample destruction. The number of recorded acoustic signals per second in the time interval at which the load speed is indi-cated is shown in Figures 10c and 11c. The total number of acoustic signals from the start of the test is shown in Figures 10d and 11d.
Mix 2 (4.4% vol. of PP)
(a)
0200400600800100012001400160018002000
0.00 1.00 2.00 3.00 4.00 5.00 6.00
Load
, N
Deflection along traverse, mm
Mix 4
0500
10001500200025003000350040004500
0.00 2.00 4.00 6.00
Loa
d, N
Deflection, mm
Figure 10. Cont.
Materials 2022, 15, 1607 11 of 22Materials 2022, 15, x FOR PEER REVIEW 11 of 23
(b)
(c)
(d)
Figure 10. (a) Deformation curve; (b) Loading speed; (c) The number of acoustic signals per second in the range from 0 to 325 s; (d) The total number of acoustic signals from the start of the test.
0500
10001500200025003000350040004500
0 50 100 150 200 250 300
Loa
d, N
Time, s
0
5
10
15
20
25
1 20 39 58 77 96 115
134
153
172
191
210
229
248
267
286
305
0
50
100
150
200
250
300
350
00:00.000 01:26.400 02:52.800 04:19.200
Qua
ntity
of a
cous
tic si
gnal
s
Time (min:s.ms)
Figure 10. (a) Deformation curve; (b) Loading speed; (c) The number of acoustic signals per secondin the range from 0 to 325 s; (d) The total number of acoustic signals from the start of the test.
Materials 2022, 15, 1607 12 of 22Materials 2022, 15, x FOR PEER REVIEW 12 of 23
Mix 6 (5.5% vol. of PP)
(a)
(b)
(c)
0
500
1000
1500
2000
2500
3000
0.00 2.00 4.00 6.00
Loa
d, N
Deflection, mm
0
500
1000
1500
2000
2500
3000
0 50 100 150 200 250 300
Loa
d, N
Time, s
Figure 11. Cont.
Materials 2022, 15, 1607 13 of 22Materials 2022, 15, x FOR PEER REVIEW 13 of 23
(d)
Figure 11. (a) Deformation curve; (b) Loading speed; (c) The number of acoustic signals per second in the range from 0 to 260 s; (d) The total number of acoustic signals from the start of the test.
Each of the presented materials has deformation features. The strain-hardening zone is observed on the deformation diagram of cement composite with 5.5% vol. of PP micro-fiber. A sharp increase in the number of acoustic signals is observed at the beginning and end of the strain-hardening zone in Figure 11b,c. A strain-hardening zone is almost absent in cement composite with 4.4% vol. of PP microfiber. Several splashes of acoustic signals are observed in this sample only in the strain-softening zone.
Stable relationships between mechanical and AE parameters are observed in the above dependencies despite significant differences in the mechanical characteristics of the studied cement-based composites.
The relationship of flow characteristics of the acoustic emission with the loading curve has been studied and is shown in Figures 12 and 13 for alkali-activated slag based composites with 3.5% vol. of PP microfiber and with different W/C ratios. The diagrams “load—strain on the traverse” are shown in Figures 12a and 13a. The load speed is shown in Figures 12b and 13b up to the deformation equal to 5 mm or up to the moment of sample destruction. The number of recorded acoustic signals per second in the time interval at which the load speed is indicated is shown in Figures 12c and 13c. The total number of acoustic signals from the start of the test is shown in Figures 12d and 13d.
Mix 3 (3.5% vol. of PP, W/B = 0.3)
(a)
050
100150200250300350400450500
00:00.00001:26.40002:52.80004:19.20005:45.600
Qua
ntity
of a
cous
tic si
gnal
s
Time (min:s.ms)
0200400600800
10001200140016001800
0.00 2.00 4.00 6.00
Loa
d, N
Deflection, mm
Figure 11. (a) Deformation curve; (b) Loading speed; (c) The number of acoustic signals per secondin the range from 0 to 260 s; (d) The total number of acoustic signals from the start of the test.
A smaller number of acoustic signals by 3–4 times is typical for samples on alkali-activated slag binder. Peaks in the number of acoustic signals in these samples wereobserved only in the strain-softening zone.
Graphs of dependence of the occurrence rate of acoustic signals (the first derivative)in the sample from the start of the test, obtained in the work, experimentally prove thatthis method of non-destructive testing can be used to monitor structures based on strain-hardening composites operating in difficult conditions. These graphs make it possible touse the AE method to estimate the residual resource of the material during deformation.
In further studies linking the AE parameters with microscopic fracture parameters, it isnecessary to formulate a number of diagnostic AE indicators for monitoring and evaluatingthe resource of material.
Materials 2022, 15, x FOR PEER REVIEW 13 of 23
(d)
Figure 11. (a) Deformation curve; (b) Loading speed; (c) The number of acoustic signals per second in the range from 0 to 260 s; (d) The total number of acoustic signals from the start of the test.
Each of the presented materials has deformation features. The strain-hardening zone is observed on the deformation diagram of cement composite with 5.5% vol. of PP micro-fiber. A sharp increase in the number of acoustic signals is observed at the beginning and end of the strain-hardening zone in Figure 11b,c. A strain-hardening zone is almost absent in cement composite with 4.4% vol. of PP microfiber. Several splashes of acoustic signals are observed in this sample only in the strain-softening zone.
Stable relationships between mechanical and AE parameters are observed in the above dependencies despite significant differences in the mechanical characteristics of the studied cement-based composites.
The relationship of flow characteristics of the acoustic emission with the loading curve has been studied and is shown in Figures 12 and 13 for alkali-activated slag based composites with 3.5% vol. of PP microfiber and with different W/C ratios. The diagrams “load—strain on the traverse” are shown in Figures 12a and 13a. The load speed is shown in Figures 12b and 13b up to the deformation equal to 5 mm or up to the moment of sample destruction. The number of recorded acoustic signals per second in the time interval at which the load speed is indicated is shown in Figures 12c and 13c. The total number of acoustic signals from the start of the test is shown in Figures 12d and 13d.
Mix 3 (3.5% vol. of PP, W/B = 0.3)
(a)
050
100150200250300350400450500
00:00.00001:26.40002:52.80004:19.20005:45.600Q
uant
ity o
f aco
ustic
sign
als
Time (min:s.ms)
0200400600800
10001200140016001800
0.00 2.00 4.00 6.00
Loa
d, N
Deflection, mm
Figure 12. Cont.
Materials 2022, 15, 1607 14 of 22Materials 2022, 15, x FOR PEER REVIEW 14 of 23
(b)
(c)
(d)
Figure 12. (a) Deformation curve; (b) Loading speed; (c) The number of acoustic signals per second in the range from 0 to 300 s; (d) The total number of acoustic signals from the start of the test.
0200400600800
10001200140016001800
0 50 100 150 200 250 300 350
Loa
d, N
Time, s
0102030405060708090
100
00:00.000 01:26.400 02:52.800 04:19.200 05:45.600
Qua
ntity
of a
cous
tic si
gnal
s
Time, s
Figure 12. (a) Deformation curve; (b) Loading speed; (c) The number of acoustic signals per secondin the range from 0 to 300 s; (d) The total number of acoustic signals from the start of the test.
Materials 2022, 15, 1607 15 of 22Materials 2022, 15, x FOR PEER REVIEW 15 of 23
Mix 4 (3.5% vol. of PP, W/B = 0.22)
(a)
(b)
(c)
0
200
400
600
800
1000
1200
1400
1600
0.00 2.00 4.00 6.00
Loa
d, N
Deflection, mm
0200400600800
1000120014001600
0 50 100 150 200 250 300 350
Loa
d, N
Time, s
Figure 13. Cont.
Materials 2022, 15, 1607 16 of 22Materials 2022, 15, x FOR PEER REVIEW 16 of 23
(d)
Figure 13. (a) Deformation curve; (b) Loading speed; (c) The number of acoustic signals per second in the range from 0 to 300 s; (d) The total number of acoustic signals from the start of the test.
A smaller number of acoustic signals by 3–4 times is typical for samples on alkali-activated slag binder. Peaks in the number of acoustic signals in these samples were ob-served only in the strain-softening zone.
Graphs of dependence of the occurrence rate of acoustic signals (the first derivative) in the sample from the start of the test, obtained in the work, experimentally prove that this method of non-destructive testing can be used to monitor structures based on strain-hardening composites operating in difficult conditions. These graphs make it possible to use the AE method to estimate the residual resource of the material during deformation.
In further studies linking the AE parameters with microscopic fracture parameters, it is necessary to formulate a number of diagnostic AE indicators for monitoring and eval-uating the resource of material.
4. Discussion The characteristics of the studied materials obtained from deformation curves are
presented in Table 6.
Table 6. Specific fracture work.
Composition. Mix 2 Mix 6 Mix 3 Mix 4 Compressive strength, MPa 79.59 68.06 42.37 39.86
Tensile strength in bending, MPa (at the first microcrack)
7.93 5.81 3.85 3.45
Specific fracture work, J/m3 22,200.4 23,176.9 10,351.5 13,281.2 Strain-hardening after the formation
of the first microcrack, MPa 0 0.64 0 0.23
Deflection value, mm 1.15 1.17 1.04 1.08
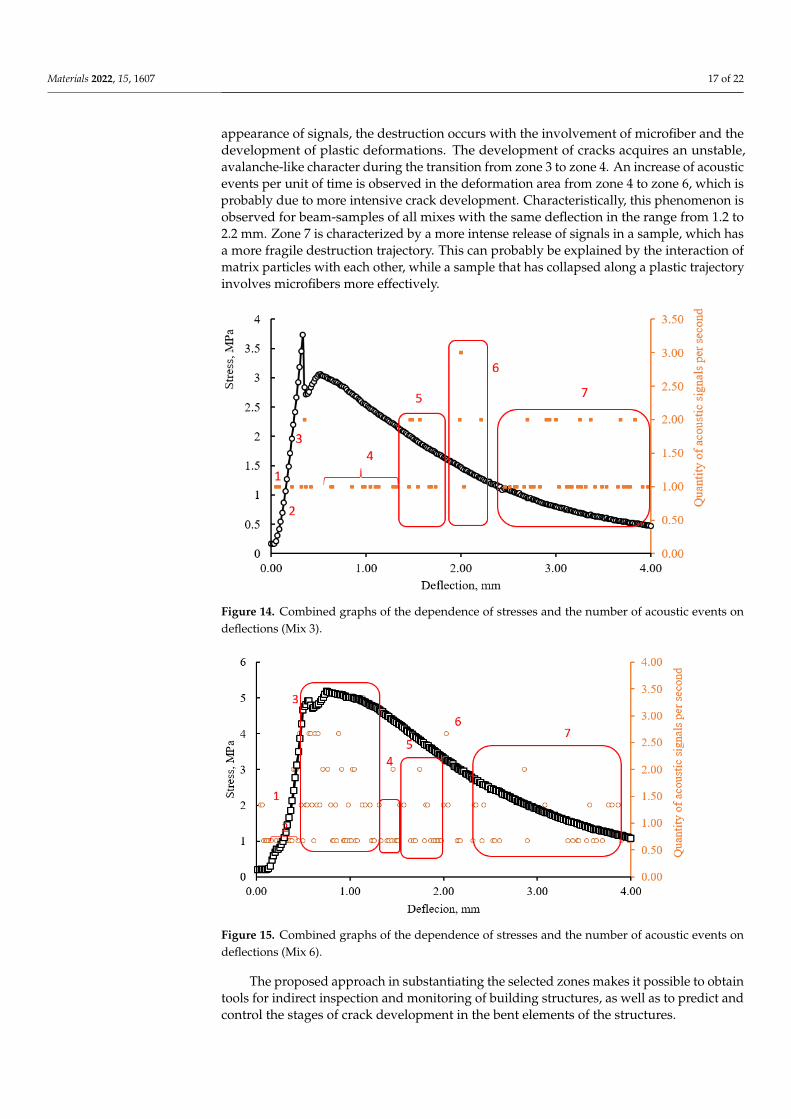
According to the study of beam samples in three-point bending with controlled de-formations, it was found that the frequency of occurrence of acoustic events is associated with the deformation curve. The recorded acoustic signals can be combined into seven groups depending on the stage of sample deformation as shown in Figures 14 and 15. These seven groups are outlined with red lines that limit the areas where the values of the number of acoustic signals per second are grouped. At the initial stage of loading, as the traverse displacement increases, the accumulation of stresses occurs in the stretched and compressed zone of a beam-sample. The periodic appearance of signals is typical for this
0
20
40
60
80
100
120
00:00.000 01:26.400 02:52.800 04:19.200 05:45.600
Qua
ntity
of a
cous
tic si
gnal
s
Time, s
Figure 13. (a) Deformation curve; (b) Loading speed; (c) The number of acoustic signals per secondin the range from 0 to 300 s; (d) The total number of acoustic signals from the start of the test.
4. Discussion
The characteristics of the studied materials obtained from deformation curves arepresented in Table 6.
Table 6. Specific fracture work.
Composition. Mix 2 Mix 6 Mix 3 Mix 4
Compressive strength, MPa 79.59 68.06 42.37 39.86
Tensile strength in bending, MPa(at the first microcrack) 7.93 5.81 3.85 3.45
Specific fracture work, J/m3 22,200.4 23,176.9 10,351.5 13,281.2
Strain-hardening after theformation of the first microcrack,
MPa0 0.64 0 0.23
Deflection value, mm 1.15 1.17 1.04 1.08
According to the study of beam samples in three-point bending with controlleddeformations, it was found that the frequency of occurrence of acoustic events is associatedwith the deformation curve. The recorded acoustic signals can be combined into sevengroups depending on the stage of sample deformation as shown in Figures 14 and 15.These seven groups are outlined with red lines that limit the areas where the values ofthe number of acoustic signals per second are grouped. At the initial stage of loading, asthe traverse displacement increases, the accumulation of stresses occurs in the stretchedand compressed zone of a beam-sample. The periodic appearance of signals is typical forthis zone (1). Zones 1 and 2 have a very conditional separation and are determined bythe nature of deformation of a beam-sample at the initial stage during compression andstretching deformations in a matrix. The duration of signal registration is determined bythe fracture work and the elasticity modulus of the material. A drastic increase of acousticevents per second is observed in zone (3), while the size of this zone is associated with thepotential for strain-hardening. The formation of microcracks begins and for this reason thedependence of “stress–strain” becomes nonlinear. The frequency of signals per unit of timein this zone indicates the trajectory of destruction: with an instantaneous burst of a seriesof signals the destruction occurs according to a fragile scenario, with a periodic, prolonged
Materials 2022, 15, 1607 17 of 22
appearance of signals, the destruction occurs with the involvement of microfiber and thedevelopment of plastic deformations. The development of cracks acquires an unstable,avalanche-like character during the transition from zone 3 to zone 4. An increase of acousticevents per unit of time is observed in the deformation area from zone 4 to zone 6, which isprobably due to more intensive crack development. Characteristically, this phenomenon isobserved for beam-samples of all mixes with the same deflection in the range from 1.2 to2.2 mm. Zone 7 is characterized by a more intense release of signals in a sample, which hasa more fragile destruction trajectory. This can probably be explained by the interaction ofmatrix particles with each other, while a sample that has collapsed along a plastic trajectoryinvolves microfibers more effectively.
Materials 2022, 15, x FOR PEER REVIEW 17 of 23
zone (1). Zones 1 and 2 have a very conditional separation and are determined by the
nature of deformation of a beam‐sample at the initial stage during compression and
stretching deformations in a matrix. The duration of signal registration is determined by
the fracture work and the elasticity modulus of the material. A drastic increase of acoustic
events per second is observed in zone (3), while the size of this zone is associated with the
potential for strain‐hardening. The formation of microcracks begins and for this reason
the dependence of “stress–strain” becomes nonlinear. The frequency of signals per unit of
time in this zone indicates the trajectory of destruction: with an instantaneous burst of a
series of signals the destruction occurs according to a fragile scenario, with a periodic,
prolonged appearance of signals, the destruction occurs with the involvement of microfi‐
ber and the development of plastic deformations. The development of cracks acquires an
unstable, avalanche‐like character during the transition from zone 3 to zone 4. An increase
of acoustic events per unit of time is observed in the deformation area from zone 4 to zone
6, which is probably due to more intensive crack development. Characteristically, this
phenomenon is observed for beam‐samples of all mixes with the same deflection in the
range from 1.2 to 2.2 mm. Zone 7 is characterized by a more intense release of signals in a
sample, which has a more fragile destruction trajectory. This can probably be explained
by the interaction of matrix particles with each other, while a sample that has collapsed
along a plastic trajectory involves microfibers more effectively.
Figure 14. Combined graphs of the dependence of stresses and the number of acoustic events on
deflections (Mix 3). Figure 14. Combined graphs of the dependence of stresses and the number of acoustic events ondeflections (Mix 3).
Materials 2022, 15, x FOR PEER REVIEW 18 of 23
Figure 15. Combined graphs of the dependence of stresses and the number of acoustic events on
deflections (Mix 6).
The proposed approach in substantiating the selected zones makes it possible to ob‐
tain tools for indirect inspection and monitoring of building structures, as well as to pre‐
dict and control the stages of crack development in the bent elements of the structures.
The use of strain‐hardening composites based on inorganic binders is actually in
structures for which the presence of a strain‐hardening zone on the deformation curve of
material is of priority importance compared to the value of compressive or bending
strength. Walling of mine workings can be one of the areas of application. Often, sprayed
concrete with steel mesh reinforcement is used to fasten support. The sprayed concrete
support repeats the shape of the mine surface. Dispersed reinforcement with metal or syn‐
thetic fiber is performed to improve the mechanical properties of the sprayed concrete
support. The main requirement for the mechanical behavior of fiber‐reinforced sprayed
concrete for walling mine workings is imposed on the post peak zone. The value at which
the structure completely loses its ability to resist the load and its destruction occurs are
taken as the value of the maximum bearing capacity of the support. Multiple cracking of
concrete requires the development of non‐destructive methods of structural control in dif‐
ficult operating conditions [81,82].
The main advantages when using the fiber‐reinforced spray concrete for walling the
mine workings are as follows [83–88]:
- fibers in a large amount contribute to the appearance of strain‐hardening of material
after the formation of microcracks under external loading;
- mechanical properties of lining increase under complex loading since reinforcement
is carried out in all directions of walling;
- residual strength of fiber‐reinforced spray concrete is higher than the strength of or‐
dinary concrete;
- connectivity of sprayed concrete with the rock contour increases since there are no
voids that can form between the rock contour and the sprayed concrete in the case of
mesh reinforcement;
- ensuring the strength properties of concrete under elevated temperature [89,90].
It should be noted that the cost of fiber‐reinforced concrete increases significantly
with the increase of microfiber amount. The use of ground slags and affordable polypro‐
pylene microfiber can solve this problem. Further research should be carried out in order
to develop new compositions of strain‐hardening composites with inorganic binders
based on by‐products of the industry including the possibility of applying mixtures using
shotcrete technology.
Figure 15. Combined graphs of the dependence of stresses and the number of acoustic events ondeflections (Mix 6).
The proposed approach in substantiating the selected zones makes it possible to obtaintools for indirect inspection and monitoring of building structures, as well as to predict andcontrol the stages of crack development in the bent elements of the structures.
Materials 2022, 15, 1607 18 of 22
The use of strain-hardening composites based on inorganic binders is actually instructures for which the presence of a strain-hardening zone on the deformation curveof material is of priority importance compared to the value of compressive or bendingstrength. Walling of mine workings can be one of the areas of application. Often, sprayedconcrete with steel mesh reinforcement is used to fasten support. The sprayed concretesupport repeats the shape of the mine surface. Dispersed reinforcement with metal orsynthetic fiber is performed to improve the mechanical properties of the sprayed concretesupport. The main requirement for the mechanical behavior of fiber-reinforced sprayedconcrete for walling mine workings is imposed on the post peak zone. The value at whichthe structure completely loses its ability to resist the load and its destruction occurs aretaken as the value of the maximum bearing capacity of the support. Multiple crackingof concrete requires the development of non-destructive methods of structural control indifficult operating conditions [81,82].
The main advantages when using the fiber-reinforced spray concrete for walling themine workings are as follows [83–88]:
- fibers in a large amount contribute to the appearance of strain-hardening of materialafter the formation of microcracks under external loading;
- mechanical properties of lining increase under complex loading since reinforcement iscarried out in all directions of walling;
- residual strength of fiber-reinforced spray concrete is higher than the strength ofordinary concrete;
- connectivity of sprayed concrete with the rock contour increases since there are novoids that can form between the rock contour and the sprayed concrete in the case ofmesh reinforcement;
- ensuring the strength properties of concrete under elevated temperature [89,90].
It should be noted that the cost of fiber-reinforced concrete increases significantly withthe increase of microfiber amount. The use of ground slags and affordable polypropy-lene microfiber can solve this problem. Further research should be carried out in or-der to develop new compositions of strain-hardening composites with inorganic bindersbased on by-products of the industry including the possibility of applying mixtures usingshotcrete technology.
5. Conclusions
Strength and deformation properties of pseudo strain-hardening composites basedon inorganic binders with polypropylene microfiber under compression and tension inbending with the additional determination of the quantity of acoustic emission signalswere carried out. The following new knowledge is obtained in the work: new compositionsof strain-hardening material with alkali-activated slag matrix; data on the value of strain-hardening in composites with polypropylene microfiber depending on its quantity andwater-to-binder ratio, and data on the number of acoustic signals when approaching theultimate strength and in the area of residual strength.
A high-strength Portland cement matrix with compressive strength of 70 MPa andalkali-activated slag matrix with a compressive strength of 40 MPa were used. The matrixcompositions were selected for high filling the composites with polypropylene microfiber inthe amount of 5.5% vol. and 3.5% vol. for Portland cement and alkali-activated slag binder,respectively. Recommendations for the development of new strain-hardening compositeswith good workability are given.
The increase of PP microfiber amount from 4.4% to 5.5% by volume in Portland cementcomposites led to a decrease in bending strength. The strain-hardening zone appears onthe deformation curves of both mixes. However, this zone in samples with 5.5% vol. of PPmicrofiber is of interest because the bending strength corresponding to sample destructionexceeds the bending strength corresponding to the first microcrack.
The results show a contradictory pattern in the case of composites with alkali-activatedslag matrix. The bending strength decreases with the decrease of the water-to-binder ratio
Materials 2022, 15, 1607 19 of 22
from 0.3 to 0.22 at the constant microfiber amount of 3.5%. The strain-hardening zoneappears in composition with W/B = 0.22, which is more pronounced compared to the zoneon the deformation curve of composition with W/B = 0.3, namely, the bending strengthcorresponding to sample destruction exceeds the bending strength corresponding to thefirst microcrack.
Hydrophobic PP microfibers, in large amounts, reduce the compressive and tensilestrength in bending. However, the use of these microfibers in large quantities makesit possible to obtain significant strain-hardening, which is of priority in some areas ofconstruction, for example, in walling of mine workings.
The acoustic emission method was used to assess the destruction of composites. Asmaller number of acoustic signals, by 3–4 times, was observed for alkali-activated slagcomposites. Peaks in the number of acoustic signals in these samples were observed onlyin the strain-softening zone.
The recorded acoustic signals can be combined into seven groups depending on thestage of sample deformation. The proposed approach in substantiating the selected zonesmakes it possible to obtain tools for indirect inspection and monitoring of building structures.
Author Contributions: Conceptualization, O.M.S. and I.M.P.; Data curation, D.N.P. and M.G.P.;Formal analysis, I.M.P.; Investigation, O.M.S., A.V.A. and D.N.P.; Methodology, A.V.A. and D.N.P.;Project administration, O.M.S.; Resources, D.N.P.; Software, A.V.A. and D.N.P.; Supervision, O.M.S.and I.M.P.; Validation, D.N.P.; Visualization, M.G.P.; Writing—original draft, O.M.S. and A.V.A.;Writing—review & editing, D.N.P. and I.M.P. All authors have read and agreed to the publishedversion of the manuscript.
Funding: The research was carried out at the expense of a subsidy for the implementation of the statetask in the field of scientific activity for 2021 No. FSRW-2020-0014.
Institutional Review Board Statement: No. 11-2 from 19.11.2021 by Saint-Petersburg Mining University.
Informed Consent Statement: Informed consent was obtained from all subjects.
Data Availability Statement: Not available.
Conflicts of Interest: The authors declare no conflict of interest.
References1. Curosu, I.; Mechtcherine, V.; Millon, O. Effect of fiber properties and matrix composition on the tensile behavior of strain-
hardening cement-based composites (SHCCs) subject to impact loading. Cem. Concr. Res. 2016, 82, 23–35. [CrossRef]2. Heravi, A.A.; Mosig, O.; Tawfik, A.; Curbach, M.; Mechtcherine, V. An experimental investigation of the behavior of strain-
hardening cement-based composites (SHCC) under impact compression and shear loading. Materials 2020, 13, 4514. [CrossRef][PubMed]
3. Junger, D.; Storm, J.; Müller, S.; Kaliske, M.; Mechtcherine, V. Increasing the Fatigue Resistance of Strain-Hardening Cement-BasedComposites (SHCC) by Experimental-Virtual Multi-Scale Material Design. Materials 2021, 14, 5634. [CrossRef] [PubMed]
4. Klyuev, S.V.; Khezhev, T.A.; Pukharenko, Y.V.; Klyuev, A.V. Fibers and their properties for concrete reinforcement. Mater. Sci.Forum. 2019, 945, 125–130.
5. Iskhakov, I.; Frolov, I.; Ribakov, Y. Experimental Investigation of Concrete Transverse Deformations at Relatively High LoadingRates for Interpretation of High Strength Concrete Behavior. Appl. Sci. 2021, 11, 8460. [CrossRef]
6. Karasev, M.A.; Sotnikov, R.O. Prediction of the stress state of the shotcreting support under repeated seismic load. J. Min. Inst.2021, 251, 626–638. [CrossRef]
7. Tien, N.T.; Karasev, M.A.; Vilner, M.A. Study of the stress-strain state in the sub-rectangular tunnel. Lect. Notes Civ. Eng. 2020, 62,383–388.
8. Pang, M.; Shi, S.; Hu, H.; Lou, T. Flexural Behavior of Two-Span Continuous CFRP RC Beams. Materials 2021, 14, 6746. [CrossRef]9. Kim, M.J.; Chun, B.; Choi, H.J.; Shin, W.; Yoo, D.Y. Effects of supplementary cementitious materials and curing condition on
mechanical properties of ultra-high-performance, strain-hardening cementitious composites. Appl. Sci. 2021, 11, 2394. [CrossRef]10. Yang, E.H.; Li, V.C. Strain-rate effects on the tensile behavior of strain-hardening cementitious composites. Constr. Build. Mater.
2014, 52, 96–104. [CrossRef]11. Junger, D.; Müller, S.; Mechtcherine, V. Rheological Model to Describe the Cyclic Load-Bearing Behaviour of Strain-Hardening
Cement-Based Composites (SHCC). Materials 2021, 14, 6444. [CrossRef] [PubMed]12. Li, V.C. On engineered cementitious composites (ECC) a review of the material and its applications. J. Adv. Concr. Technol. 2003, 1,
215–230. [CrossRef]
Materials 2022, 15, 1607 20 of 22
13. Iskhakov, I.; Ribakov, Y. Structural phenomenon based theoretical model of concrete tensile behavior at different stress-strainconditions. J. Build. Eng. 2021, 33, 101594. [CrossRef]
14. Klyuev, S.V.; Bratanovskiy, S.N.; Trukhanov, S.V.; Manukyan, H.A. Strengthening of concrete structures with composite based oncarbon fiber. J. Comput. Theor. Nanosci. 2019, 16, 2810–2814. [CrossRef]
15. Mailyan, L.R.; Beskopylny, A.N.; Meskhi, B.; Shilov, A.V.; Stel’makh, S.A.; Shcherban, E.M.; Smolyanichenko, A.S.; El’shaeva, D.Improving the structural characteristics of heavy concrete by combined disperse reinforcement. Appl. Sci. 2021, 11, 6031.[CrossRef]
16. Xu, L.Y.; Huang, B.T.; Li, V.C.; Dai, J.G. High-strength high-ductility Engineered/Strain-Hardening Cementitious Composites(ECC/SHCC) incorporating geopolymer fine aggregates. Cem. Concr. Compos. 2021, 125, 104296. [CrossRef]
17. Mechtcherine, V.; Millon, O.; Butler, M.; Thoma, K. Mechanical behaviour of strain hardening cement-based composites underimpact loading. Cem. Concr. Compos. 2011, 33, 1–11. [CrossRef]
18. Serag, M.I.; Yasien, A.M.; El-Feky, M.S.; Elkady, H. Effect of nano silica on concrete bond strength modes of failure. Int J Geomate2017, 12, 2892–2899. [CrossRef]
19. Yasien, A.M.; Bassuoni, M.T.; Abayou, A.; Ghazy, A. Nano-Modified Concrete as Repair Material in Cold Weather. ACI Mater. J.2021, 118, 149–160.
20. Kazanskaya, L.F.; Isakovsky, V.I.; Fadeeva, S.A. Technological Properties of Self-Compacting Concrete Mixtures with GroundQuartz Sand. Int. J. Innov. Technol. Explor. Eng. 2019, 8, 799–803.
21. Kostyuk, T.; Vinnichenko, V.; Plugin, A.A.; Borziak, O.; Iefimenko, A. Physicochemical studies of the structure of energy-savingcompositions based on slags. IOP Conf. Ser.: Mater. Sci. Eng. 2021, 1021, 12016. [CrossRef]
22. Martauz, P.; Václavík, V.; Cvopa, B. The Influence of the Environment on the Properties of Hybrid Cement-Based Concrete withSteel and Air-Cooled Slags. Crystals 2021, 11, 1087. [CrossRef]
23. Deshmukh, M.P.; Sarode, D.D. Bulk utilization of industrial waste (bauxite residue) of red mud concrete. J. Mech. Civ. Eng. 2014,11, 1–3.
24. Bowen, J.; Rossetto, H.L.; Kendall, K. Adhesion between silica surfaces due to hydrogen bonding. Surf. Topogr. Metrol. Prop. 2016,4, 34001. [CrossRef]
25. Klyuev, S.V.; Khezhev, T.A.; Pukharenko, Y.V.; Klyuev, A.V. To the question of fiber reinforcement of concrete. Mater. Sci. Forum.2019, 945, 25–29.
26. Zukowski, B.; de Andrade Silva, F.; Toledo Filho, R.D. Design of strain hardening cement-based composites with alkali treatednatural curauá fiber. Cem. Concr. Compos. 2018, 89, 150–159. [CrossRef]
27. Ahmad, J.; Zaid, O.; Aslam, F.; Shahzaib, M.; Ullah, R.; Alabduljabbar, H.; Khedher, K.M. A Study on the Mechanical Characteris-tics of Glass and Nylon Fiber Reinforced Peach Shell Lightweight Concrete. Materials 2021, 14, 4488. [CrossRef]
28. Zaid, O.; Ahmad, J.; Siddique, M.S.; Aslam, F. Effect of incorporation of rice husk ash instead of cement on the performance ofsteel fibers reinforced concrete. Front. Mater. 2021, 8, 665625. [CrossRef]
29. Muendecke, E.; Mechtcherine, V. Tensile behaviour of strain-hardening cement-based composites (SHCC) with steel reinforcingbars. Cem. Concr. Compos. 2020, 105, 103423. [CrossRef]
30. Wang, L.; Rehman, N.U.; Curosu, I.; Zhu, Z.; Beigh, M.A.B.; Liebscher, M.; Mechtcherine, V. On the use of limestone calcinedclay cement (LC3) in high-strength strain-hardening cement-based composites (HS-SHCC). Cem. Concr. Res. 2021, 144, 106421.[CrossRef]
31. Shen, L.A.; Yu, W.; Li, L.; Zhang, T.; Abshir, I.Y.; Luo, P.; Liu, Z. Microorganism, Carriers, and Immobilization Methods of theMicrobial Self-Healing Cement-Based Composites: A Review. Materials 2021, 14, 5116. [CrossRef] [PubMed]
32. Plugin, A.A.; Pluhin, O.A.; Borziak, O.S.; Kaliuzhna, O.V. The Mechanism of a Penetrative Action for Portland Cement-BasedWaterproofing Compositions. Lect. Notes Civ. Eng. 2020, 47, 34–41.
33. Kilmartin-Lynch, S.; Saberian, M.; Li, J.; Roychand, R.; Zhang, G. Preliminary evaluation of the feasibility of using polypropylenefibres from COVID-19 single-use face masks to improve the mechanical properties of concrete. J. Clean. Prod. 2021, 296, 126460.[CrossRef] [PubMed]
34. Vafaei, D.; Ma, X.; Hassanli, R.; Duan, J.; Zhuge, Y. Microstructural behaviour and shrinkage properties of high-strengthfiber-reinforced seawater sea-sand concrete. Constr. Build. Mater. 2022, 320, 126222. [CrossRef]
35. Lee, B.Y.; Li, V.C.; Kim, Y.Y. Polypropylene fiber-based strain-hardening cementitious composites. In Proceedings of the 2013World Congress on Advances in Structural Engineering and Mechanics (ASEM13), Jeju, Korea, 8–12 September 2013; pp. 8–12.
36. Pakravan, H.R.; Jamshidi, M. Tensile properties of strain-hardening cementitious composites containing polyvinyl-alcohol fibershybridized with polypropylene fibers. J. Cent. South Univ. 2018, 25, 51–59. [CrossRef]
37. Sun, C.; Zhang, J.; Yan, C.; Yin, L.; Wang, X.; Liu, S. Hydration characteristics of low carbon cementitious materials with multiplesolid wastes. Constr. Build. Mater. 2022, 322, 126366. [CrossRef]
38. Lesovik, V.S.; Ahmed, A.A.; Fediuk, R.S.; Kozlenko, B.; Amran, Y.H.M.; Alaskhanov, A.K.; Asaad, M.A.; Murali, G.; Uvarov, V.A.Performance investigation of demolition wastes-based concrete composites. Mag. Civ. Eng. 2021, 106, 74–83.
39. Ghisellini, P.; Ncube, A.; D’Ambrosio, G.; Passaro, R.; Ulgiati, S. Potential Energy Savings from Circular Economy ScenariosBased on Construction and Agri-Food Waste in Italy. Energies 2021, 14, 8561. [CrossRef]
40. Nguyen, H.; Carvelli, V.; Adesanya, E.; Kinnunen, P.; Illikainen, M. High performance cementitious composite from alkali-activated ladle slag reinforced with polypropylene fibers. Cem. Concr. Compos. 2018, 90, 150–160. [CrossRef]
Materials 2022, 15, 1607 21 of 22
41. Nguyen, H.; Kinnunen, P.; Carvelli, V.; Mastali, M.; Illikainen, M. Strain hardening polypropylene fiber reinforced compositefrom hydrated ladle slag and gypsum. Compos. Part B: Eng. 2019, 158, 328–338. [CrossRef]
42. Pakravan, H.R.; Jamshidi, M.; Latifi, M. The effect of hybridization and geometry of polypropylene fibers on engineeredcementitious composites reinforced by polyvinyl alcohol fibers. J. Compos. Mater. 2016, 50, 1007–1020. [CrossRef]
43. Trinh-Duc, D.; Piotrowski, A.; Ajdukiewicz, C.; Woyciechowski, P.; Gajewski, M. Estimation of Post-Cracking DissipationCapabilities of Fiber Reinforced Concretes in Three Point Bending Test Monitored with Application of Digital Image CorrelationSystem. Materials 2021, 14, 5088. [CrossRef] [PubMed]
44. Liu, D.; Chen, H.; Tang, Y.; Gong, C.; Jian, Y.; Cao, K. Analysis and Prediction of Sulfate Erosion Damage of Concrete in ServiceTunnel Based on ARIMA Model. Materials 2021, 14, 5904. [CrossRef] [PubMed]
45. Protosenya, A.G.; Iovlev, G.A. Prediction of spatial stress-strain behavior of physically nonlinear soil mass in tunnel face area.MIAB Min. Inf. Anal. Bull. 2020, 5, 128–139. [CrossRef]
46. Paul, S.C.; Pirskawetz, S.; Van Zijl, G.P.A.G.; Schmidt, W. Acoustic emission for characterising the crack propagation in strain-hardening cement-based composites (SHCC). Cem. Concr. Res. 2015, 69, 19–24. [CrossRef]
47. Ohno, K.; Ohtsu, M. Crack classification in concrete based on acoustic emission. Constr. Build. Mater. 2010, 24, 2339–2346.[CrossRef]
48. Grosse, C.U.; Finck, F. Quantitative evaluation of fracture processes in concrete using signal-based acoustic emission techniques.Cem. Concr. Compos. 2006, 28, 330–336. [CrossRef]
49. Aggelis, D.G. Classification of cracking mode in concrete by acoustic emission parameters. Mech. Res. Commun. 2011, 38, 153–157.[CrossRef]
50. Curosu, I.; Pirskawetz, S.; Mechtcherine, V. Characterizing the crack development in strain-hardening cement-based composites(SHCC) by means of acoustic emission. In Proceedings of the 9th International Conference on Fracture Mechanics of Concreteand Concrete Structures FraMCoS-9, Berkeley, CA, USA, 29 May–1 June 2016.
51. Klyuev, S.V.; Khezhev, T.A.; Pukharenko, Y.V.; Klyuev, A.V. Experimental study of fiber-reinforced concrete structures. Mater. Sci.Forum. 2019, 945, 115–119.
52. Murali, G.; Fediuk, R. A Taguchi approach for study on impact response of ultra-high-performance polypropylene fibrouscementitious composite. J. Build. Eng. 2020, 30, 101301. [CrossRef]
53. Mosaberpanah, M.; Fediuk, R.; Lesovik, V.; Baranov, A. Link of Self-Compacting Fiber Concrete Behaviors to Composite Bindersand Superplasticizer. J. Adv. Concr. Technol. 2020, 18, 67–82.
54. Fediuk, R.; Mosaberpanah, M.A.; Lesovik, V. Development of fiber reinforced self-compacting concrete (FRSCC): Towards anefficient utilization of quaternary composite binders and fibers. Adv. Concr. Constr. 2020, 9, 387–395.
55. Fediuk, R.; Smoliakov, A.; Muraviov, A. Mechanical properties of fiber-reinforced concrete using composite binders. Adv. Mater.Sci. Eng. 2017, 2017, 2316347. [CrossRef]
56. Smirnova, O.M. Low-Clinker cements with low water demand. J. Mater. Civ. Eng. 2020, 32, 06020008. [CrossRef]57. Smirnova, O.M.; Potyomkin, D.A. Influence of ground granulated blast furnace slag properties on the superplasticizers effect. Int.
J. Civ. Eng. Technol. 2018, 9, 874–880.58. Beskopylny, A.N.; Shcherban, E.M.; Stel’makh, S.A.; Mailyan, L.R.; Meskhi, B.; El’shaeva, D. The Influence of Composition and
Recipe Dosage on the Strength Characteristics of New Geopolymer Concrete with the Use of Stone Flour. Appl. Sci. 2022, 12, 613.[CrossRef]
59. Ahmad, J.; Martínez-García, R.; Szelag, M.; de-Prado-Gil, J.; Marzouki, R.; Alqurashi, M.; Hussein, E.E. Effects of Steel Fibers (SF)and Ground Granulated Blast Furnace Slag (GGBS) on Recycled Aggregate Concrete. Materials 2021, 14, 7497. [CrossRef]
60. Amran, M.; Fediuk, R.; Abdelgader, H.S.; Murali, G.; Ozbakkaloglu, T.; Lee, Y.H.; Lee, Y.Y. Fiber-reinforced alkali-activatedconcrete: A review. J. Build. Eng. 2022, 45, 103638. [CrossRef]
61. Fediuk, R.; Mochalov, A.; Timokhin, R. Low-permeability fiber-reinforcement concrete of composite binder. IOP Conf. Ser. Mater.Sci. Eng. 2018, 463, 022058. [CrossRef]
62. Curosu, I.; Liebscher, M.; Mechtcherine, V.; Bellmann, C.; Michel, S. Tensile behavior of high-strength strain-hardening cement-based composites (HS-SHCC) made with high-performance polyethylene, aramid and PBO fibers. Cem. Concr. Res. 2017, 98,71–81. [CrossRef]
63. Smirnova, O.M. Development of classification of rheologically active microfillers for disperse systems with portland cement andsuper plasticizer. Int. J. Civ. Eng. Technol. 2018, 9, 1966–1973.
64. Klyuev, S.V.; Khezhev, T.A.; Pukharenko, Y.V.; Klyuev, A.V. Fiber concrete for industrial and civil construction. Mater. Sci. Forum.2019, 945, 120–124.
65. Xu, J.; Kang, A.; Wu, Z.; Gong, Y.; Xiao, P. The effect of mechanical-thermal synergistic activation on the mechanical propertiesand microstructure of recycled powder geopolymer. J. Clean. Prod. 2021, 327, 129477. [CrossRef]
66. Lehner, P.; Hornáková, M. Effect of Amount of Fibre and Damage Level on Service Life of SFR Recycled Concrete in AggressiveEnvironment. Buildings 2021, 11, 489. [CrossRef]
67. Hrabová, K.; Lehner, P.; Ghosh, P.; Konecný, P.; Teplý, B. Sustainability levels in comparison with mechanical properties anddurability of pumice high-performance concrete. Appl. Sci. 2021, 11, 4964. [CrossRef]
68. Algaifi, H.A.; Mustafa Mohamed, A.; Alsuhaibani, E.; Shahidan, S.; Alrshoudi, F.; Huseien, G.F.; Bakar, S.A. Optimisation ofGBFS, Fly Ash, and Nano-Silica Contents in Alkali-Activated Mortars. Polymers 2021, 13, 2750. [CrossRef] [PubMed]
Materials 2022, 15, 1607 22 of 22
69. Mircea, A.; Mircea, C.; Szilágyi, H.; Baeră, C.; Hegyi, A. Experimental study regarding the influence of fibre to matrix compatibilityon general performance of Fibre Engineered Cementitious Materials (FECM). MATEC Web Conf. 2019, 289, 04005. [CrossRef]
70. Rousakis, T. Natural fibre rebar cementitious composites. In Advanced High Strength Natural Fibre Composites in Construction;Woodhead Publishing: Cambridge, UK, 2017; pp. 215–234.
71. Xu, J.; Kang, A.; Wu, Z.; Xiao, P.; Gong, Y. Effect of high-calcium basalt fiber on the workability, mechanical properties andmicrostructure of slag-fly ash geopolymer grouting material. Constr. Build. Mater. 2021, 302, 124089. [CrossRef]
72. Faridmehr, I.; Nehdi, M.L.; Huseien, G.F.; Baghban, M.H.; Sam, A.R.M.; Algaifi, H.A. Experimental and informational modelingstudy of sustainable self-compacting geopolymer concrete. Sustainability 2021, 13, 7444. [CrossRef]
73. Cakiroglu, C.; Islam, K.; Bekdas, G.; Kim, S.; Geem, Z.W. CO2 Emission Optimization of Concrete-Filled Steel Tubular RectangularStub Columns Using Metaheuristic Algorithms. Sustainability 2021, 13, 10981. [CrossRef]
74. Akhmetov, D.; Akhazhanov, S.; Jetpisbayeva, A.; Pukharenko, Y.; Root, Y.; Utepov, Y.; Akhmetov, A. Effect of Low-ModulusPolypropylene Fiber on Physical and Mechanical Properties of Self-Compacting Concrete. Case Stud. Constr. Mater. 2021,16, e00814. [CrossRef]
75. Mesa, J.A.; Fúquene-Retamoso, C.; Maury-Ramírez, A. Life cycle assessment on construction and demolition waste: A systematicliterature review. Sustainability 2021, 13, 7676. [CrossRef]
76. Golewski, G.L. Green concrete based on quaternary binders with significant reduced of CO2 emissions. Energies 2021, 14, 4558.[CrossRef]
77. Ahmad, J.; Zaid, O.; Pérez, C.L.C.; Martínez-García, R.; López-Gayarre, F. Experimental Research on Mechanical and PermeabilityProperties of Nylon Fiber Reinforced Recycled Aggregate Concrete with Mineral Admixture. Appl. Sci. 2022, 12, 554. [CrossRef]
78. Wang, J.Y.; Guo, J.Y. Damage investigation of ultra high performance concrete under direct tensile test using acoustic emissiontechniques. Cem. Concr. Compos. 2018, 88, 17–28. [CrossRef]
79. Nosov, V.V. Control of inhomogeneous materials strength by method of acoustic emission. J. Min. Inst. 2017, 226, 469–479.80. Grigoriev, E.V.; Palaev, A.G.; Golikov, T.S.; Nosov, V.V. Quality control of hardening technologies using the acoustic emission
method. E3S Web Conf. 2021, 266, 4004. [CrossRef]81. Arbaoui, A.; Ouahabi, A.; Jacques, S.; Hamiane, M. Concrete cracks detection and monitoring using deep learning-based
multiresolution analysis. Electronics 2021, 10, 1772. [CrossRef]82. Arbaoui, A.; Ouahabi, A.; Jacques, S.; Hamiane, M. Wavelet-based multiresolution analysis coupled with deep learning to
efficiently monitor cracks in concrete. Frat. Ed Integrità Strutt./Fract. Struct. Integr. 2021, 15, 33–47. [CrossRef]83. Chirkst, D.E.; Lobacheva, O.L.; Dzhevaga, N.V. Ion flotation of rare-earth metals with sodium dodecyl sulfate. Russ. J. Appl. Chem.
2011, 84, 1476–1482. [CrossRef]84. Bumanis, G.; Vitola, L.; Stipniece, L.; Locs, J.; Korjakins, A.; Bajare, D. Evaluation of Industrial by-products as pozzolans: A road
map for use in concrete production. Case Stud. Constr. Mater. 2020, 13, e00424. [CrossRef]85. Elemba, M.; Lapsa, V.A.; Šahmenko, G.; Korjakins, A. Alternative non-destructive method for strength testing of structural
concrete. J. Phys.: Conf. Ser. 2021, 1889, 42091. [CrossRef]86. Plugin, A.; Trykoz, L.; Donets, O.; Nykytynskyj, A.; Pluhin, A. Diagnostics and regulation of rheological characteristics for
injection mortars by electromechanical sensors. E3S Web Conf. 2020, 166, 06006. [CrossRef]87. Samchenko, S.; Kozlova, I.; Zemskova, O.; Potaev, D.; Tsakhilova, D. Efficiency of stabilization of slag suspensions by polycar-
boxylate. E3S Web Conf. 2019, 91, 02039. [CrossRef]88. Gajewska, B.; Gajewski, M.; Lechowicz, Z. Parametric Studies of the Load Transfer Platform Reinforcement Interaction with
Columns. Materials 2021, 14, 4015. [CrossRef]89. Jayakumar, G.; Mathews, M.E.; Kiran, T.; Yadav, B.S.K.; Kanagaraj, B.; Anand, N. Development and strength assessment of
sustainable high strength fiber reinforced concrete. Mater. Today Proc. 2022, 49, 1148–1153. [CrossRef]90. Mathews, M.E.; Andrushia, A.D.; Kiran, T.; Yadav, B.S.K.; Kanagaraj, B.; Anand, N. Structural response of self-compacting
concrete beams under elevated temperature. Mater. Today Proc. 2022, 49, 1246–1254. [CrossRef]