impact on multi-layered polypropylene foams
TRANSCRIPT

Impact on multi-layered polypropylene foams
L. Maheoa, P. Viota,*
aArts et Metiers ParisTech, I2M - DuMAS, UMR CNRS 5295, F-33405 Talence, France
International Journal of Impact Engineering ?(?), ??-??, 2012.DOI: http://dx.doi.org/10.1016/j.ijimpeng.2012.03.011
Abstract
Foams, and particularly the polypropylene foam, are more and more often used in the area ofinjury protection and passive safety for its energy absorption capacity. This multi-scale materialis constituted of mesoscopic beads with a large variability of the material properties. To studythe effects of these mesoscopic heterogeneities on both the macroscopic and the local behaviors,numerical simulations on virtual volumes of foam under dynamic loading have been performed.The influence of the organized system of heterogeneities has also been studied in the cases of arandom distribution and a multi-layered volume. Experimental dynamic compressive tests havebeen performed on multi-layered volumes of foam and compared with the results of the FiniteElement Method.
Foams ; Multi-scale ; Virtual volume ; Dynamic compression ; Numerical simulation ; Experi-ments
1 Introduction
Foams are more and more often used as a cushioning structure (e.g. Helmets) in order to protectagainst impacts [10]. Following a first elastic stage, a great amount of energy of the impact can bedissipated by foams during the stress plateau [6]. Recently, energy-absorption capacity of foams hasbeen enhanced by using layered [5] or functionally graded [2, 3, 4] foams. Several studies have beenreported on different kinds of expanded materials such as polyurethane [10], polystyrene [5, 2, 3]or syntactic epoxy [4]. Authors of previous studies showed special interest in the use of foams inthe area of injury protection and passive safety.
The expanded polypropylene (EPP) material of this study is constituted of large mesoscopicbeads and microscopic cells [14]. This kind of material shows a multi-scale structure where themillimetric beads (about 2-5 mm) are themselves constituted of microscopic closed cells (Fig. 1a).Three scales can therefore be defined: the macroscopic scale for the foam sample, the mesoscopicscale for the beads and the microscopic scale for the microscopic cells. These microscopic andmesoscopic structures have an influence on the macroscopic behavior, as shown experimentallyby Viot et al.[13] and Bouix et al.[1]. Several models have already been implemented in manysoftware calculation codes to represent the foam behavior. In spite of its limits to represent strainlocalizations, the Finite Element (FE) Method remains the most used one. Most of foam modelsare proposed to FE code users in order to numerically estimate the macroscopic foam structureresponse under static and dynamic loadings. Using the FE method, the strain localizations cantherefore be approached by introducing some variability of the material properties in the numericalsample. In this case, the variability applied to the numerical sample of foam can be obtained fromX-Ray micro-tomography and a study of image analysis. Voxel-based datasets can therefore definea voxel-based FE mesh [9]. Another way to avoid this heavy and costly technique is to numericallybuild a virtual sample[3].
1
In the present study, authors proposed to show the effects of the mesoscopic heterogeneities atthe scale of the beads on both the macroscopic and the local behaviors with a numerical approachusing virtual samples of foam. The influence of the organized system of heterogeneities has alsobeen studied in the case of a random distribution or a multi-layered volume.
Experimental investigations were undertaken to characterize the behavior of the foam loaded touni-axial compressive impacts. FE simulations of such loadings have been performed on virtualsamples of foam including heterogeneous beads of variable properties. The material properties ofthis foam are obtained from the complete experimental study of Bouix et al.[1] which gives themacroscopic behavior of the EPP material for several values of density and several values of strainrate.
The first part of the work (i.e. section 2) consisted in studying some virtual samples of foam inorder to determine numerically if the presence of heterogeneities, i.e. the mesoscopic beads, canmodify the macroscopic and the mesoscopic behaviors. The second part (i.e. section 3) deals withthe capacity of multi-layered foams to absorb the impact energy. Three kinds of these foams havebeen tested experimentally and numerically and show their energy absorption capacities in suchimpact loadings. Finally, the results of this article are summarized in section 4.
2 Material
2.1 Experimental compressive tests
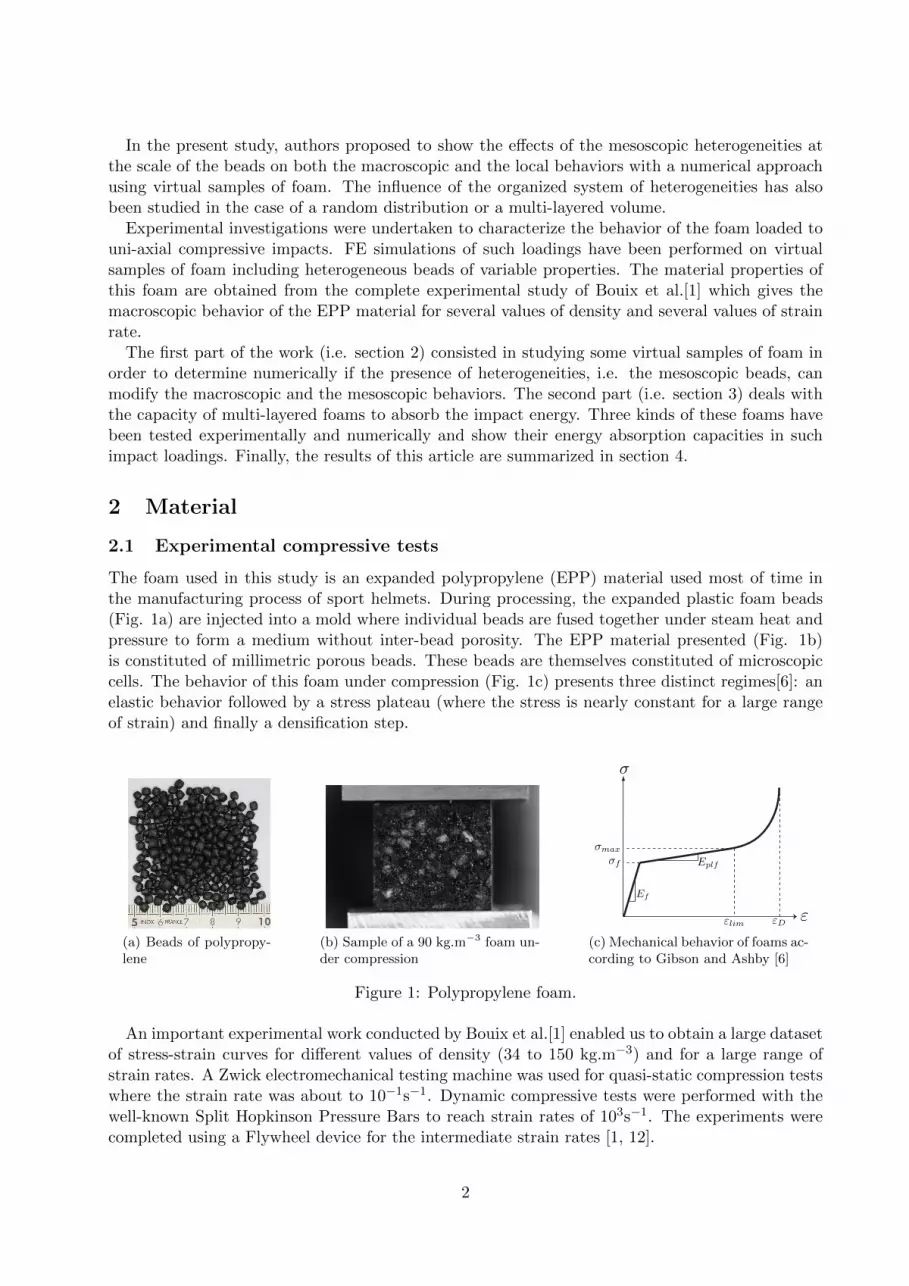
The foam used in this study is an expanded polypropylene (EPP) material used most of time inthe manufacturing process of sport helmets. During processing, the expanded plastic foam beads(Fig. 1a) are injected into a mold where individual beads are fused together under steam heat andpressure to form a medium without inter-bead porosity. The EPP material presented (Fig. 1b)is constituted of millimetric porous beads. These beads are themselves constituted of microscopiccells. The behavior of this foam under compression (Fig. 1c) presents three distinct regimes[6]: anelastic behavior followed by a stress plateau (where the stress is nearly constant for a large rangeof strain) and finally a densification step.
(a) Beads of polypropy-lene
(b) Sample of a 90 kg.m−3 foam un-der compression
σ
ε
σf
σmax
εDεlim
Ef
Eplf
(c) Mechanical behavior of foams ac-cording to Gibson and Ashby [6]
Figure 1: Polypropylene foam.
An important experimental work conducted by Bouix et al.[1] enabled us to obtain a large datasetof stress-strain curves for different values of density (34 to 150 kg.m−3) and for a large range ofstrain rates. A Zwick electromechanical testing machine was used for quasi-static compression testswhere the strain rate was about to 10−1s−1. Dynamic compressive tests were performed with thewell-known Split Hopkinson Pressure Bars to reach strain rates of 103s−1. The experiments werecompleted using a Flywheel device for the intermediate strain rates [1, 12].
2

Another experimental work by Viot et al.[14] based on the X-Ray microtomography techniquestudied the microstructure of the EPP material. Authors analyzed microtomography images andobserved a strong heterogeneity at the bead scale. The value of bead’s density can be evaluatedfrom 10 to 200 kg.m−3. However this study could not be used to determine bead densities withaccuracy because a significant error on local porosity is generated by measurements. For our study,the EPP material is different from the one used by Viot et al. [14] and the density range used inthe FE simulation is therefore chosen arbitrarily and discussed afterwards.
2.2 Virtual samples
The study of virtual volumes of foam has been preferred to the study of voxel-based datasetsobtained by microtomography technique. Indeed, the cost of this technique is not relevant andit is hardly applicable for large experimental-numerical studies. We decided to develop a virtualmaterial initially homogeneous and constituted of heterogeneities localized randomly in the cube(Fig.2a).
Homogeneous volume(~90 kg.m⁻³)
Heterogeneities(~140 kg.m⁻³)
Mean density: 100 kg.m⁻³
(a) Description.
0 0.2 0.4 0.6 0.8Strain [.]
0
1
2
3
4
5
6S
tres
s [M
Pa]
100 kg/m³150 kg/m³
(b) Dynamic behavior of foam with the densityvalues of 100 kg.m−3 and 150 kg.m−3 at a strainrate value of 200 s−1.
Figure 2: Virtual sample of foam.
The interest of such virtual samples is to create samples inside which the variability can beeasily controlled thanks to random functions. Indeed, the number, the size, the position of theheterogeneities and their material properties can easily be adjusted thanks to the software programdeveloped for this study. Finally, the software program creates the virtual samples by definingsome stacks of RGB-images which can be displayed in a 3-D view (Fig. 2a). The RGB value ofeach voxel is therefore related to a set of mechanical properties (density ρ, Young’s modulus E...).The objective of this research work is to study the influence of the density variability and the greylevel in the model is only for display purposes, representing the different densities.
Each virtual sample of foam can be characterized by its set of “number-size-position” of hetero-geneities. However, even if these sets are useful to build different virtual volumes, they are notsufficiently explicit to explain the macroscopic results in this case of uni-axial compressive tests.Another way to characterize them is to plot a function of the value of density for each voxels’ layer.This function gives more relevant characteristics to understand the macroscopic behavior of thefoam sample. The figure 3a shows a virtual sample of foam where the 125 heterogeneities with adiameter of 3.6 mm are localized at the middle of the sample height. The characteristic functionof this virtual sample is then plotted in the figure 3b.
The influence of the number, the size and the localization of the heterogeneities have been
3

(a) Stack of images of the vir-tual volume of foam.
90 100 110 120 130Density [kg/m3]
0
5
10
15
20
25
30
Hei
ght [
mm
]
Sample #5
(b) Profile of the density range. (c) FE discretization.
Figure 3: Example of a virtual sample where the heterogeneities are localized at the middle of thecube (sample #5).
studied. To do so, several kinds of virtual samples have been build, three per kind of sample,to check repeatability and the representative samples are listed in the Table 1. A difference indensity of 50 kg.m−3 has been arbitrarly applied between the heterogeneities and the rest of thevolume with heavier heterogeneities and their behavior is clearly different (Fig. 2b). Viot et al.[14]have shown that this density range can reach 200 kg.m−3 but the manufacturers try to reduce thisvariation in density in the microstructure to obtain more homogeneous material. Moreover, it isdifficult to estimate precisely the density range in industrial foams. First simulations have alsobeing performed by using a density range of 20 kg.m−3 and, the results being similar, just theresults of the simulations using 50 kg.m−3 are presented in this paper. In order to compare virtualvolumes with each other, their mean density has been globally adjusted to reach a value of 100kg.m−3.
Sample Number Size [mm] Localization Volume ratio of heterogeneities [%]
#1 337 3.6 randomly 15.9
#2 695 3.6 randomly 29.4#3 354 7.2 randomly 70.7#4 359 3.6 along a diagonal 14.3
#5 125 3.6 middle 5.8 (17.4 locally)#6 754 3.6 middle 23.9 (72.7 locally)#7 1747 3.6 middle 48.3 (100 locally)
Table 1: Characteristics of the virtual samples.
In the Table 1, the ratio of the heterogeneities’ volume over the total volume is also given. Thisvariable is interesting to be considered in order to differentiate the samples with each other.
2.3 FE simulation of dynamic compression of virtual samples
The virtual samples of foam are then discretized into finite elements. The software program calcu-lates the mean of RGB value of each voxel included in each finite element. This operation means togive different material properties up to 256, i.e. the number of RGB values, to each finite element.The grey level of the picture gives therefore a display of the density. A linear function of the densityversus the RGB values has been chosen for this study. It is just a way to represent the variation ofthe density in the sample. The discretization into FE for a virtual sample of foam can be observedin Figure 3c.
4
The calculations have been performed on the LS-Dyna software [7]. The behavior law usedfor this study is the *MAT FU CHANG FOAM[8] which describes the behavior of non-crushablefoams. As well as using basic parameters (i.e., the density and the Young modulus), this law needsdata such as the strain-stress curves at different strain rates in order to model rate effects. Thecurves obtained by Bouix et al. [1] and described in section 2.1 have been used for the currentstudy.
The first numerical study deals with the uni-axial compression of virtual samples of foam. It canbe expressed numerically by imposing a negative vertical displacement on the plane impactor. Avelocity of 3.9 m.s−1 with a maximum displacement of 21 mm was applied on the impactor. Thenodes at the bottom of the cube were fixed from any negative axial displacement but transversaldisplacement was allowed. A classical penalty contact for soft materials was defined between theimpactor and the cube. The cube was discretized by more than 160’000 linear tetrahedron elements.The choice of the finite elements is related to their capacity to overcome several numerical problems.The strain level of foam materials uses to reach more than 90% and the use of the finite elementmethod shows therefore its limits. Indeed, negative volumes of finite elements involve the forcedend of the calculation. One way to overcome this problem [7] is to use under-integrated linearhexahedric elements with a Hourglass control or to use fully-integrated linear tetrahedron. Themain advantage of the latter elements is their great capacity to describe (overtake) large volumechange without using any Hourglass correction.
2.3.1 Mesoscopic behavior
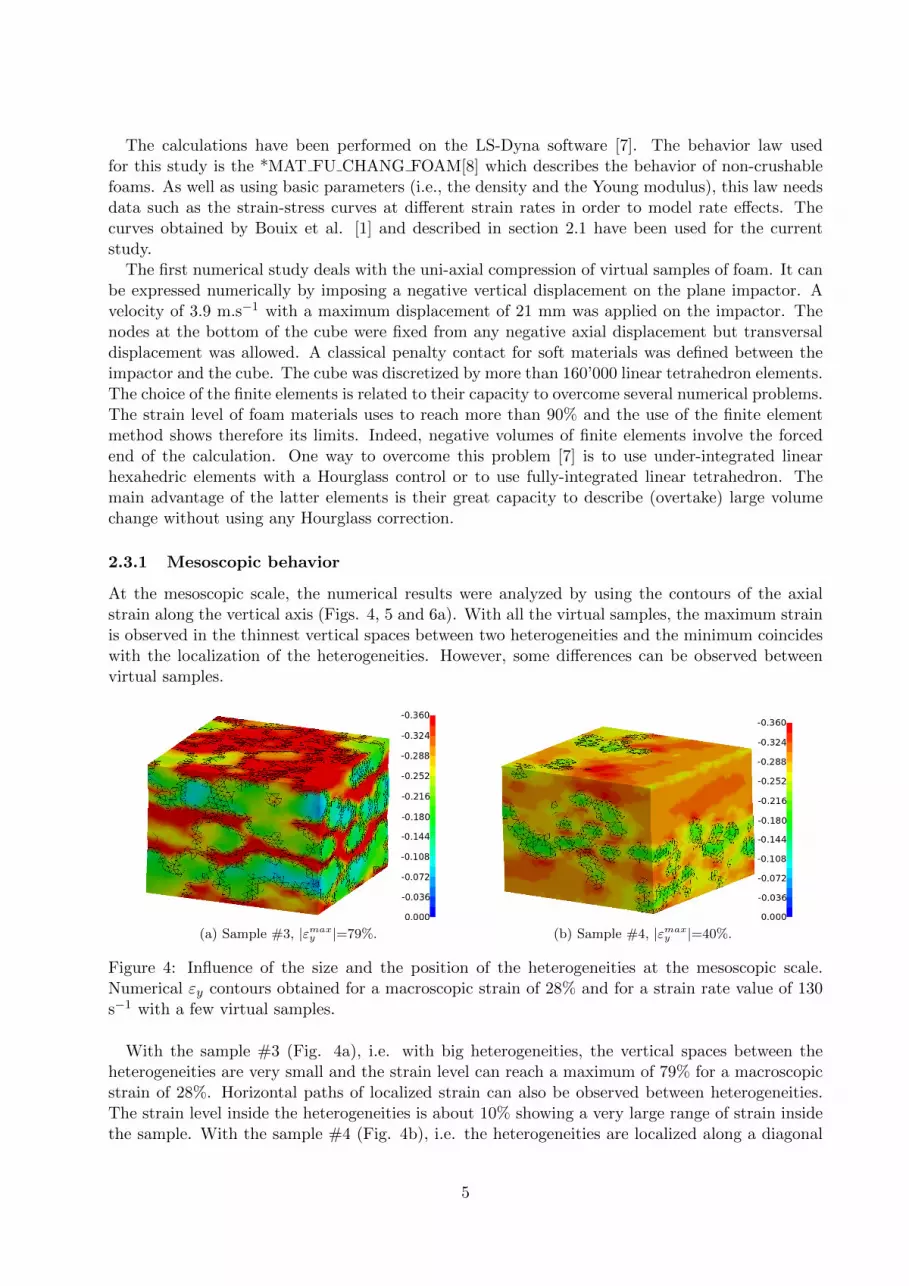
At the mesoscopic scale, the numerical results were analyzed by using the contours of the axialstrain along the vertical axis (Figs. 4, 5 and 6a). With all the virtual samples, the maximum strainis observed in the thinnest vertical spaces between two heterogeneities and the minimum coincideswith the localization of the heterogeneities. However, some differences can be observed betweenvirtual samples.
(a) Sample #3, |εmaxy |=79%. (b) Sample #4, |εmax
y |=40%.
Figure 4: Influence of the size and the position of the heterogeneities at the mesoscopic scale.Numerical εy contours obtained for a macroscopic strain of 28% and for a strain rate value of 130s−1 with a few virtual samples.
With the sample #3 (Fig. 4a), i.e. with big heterogeneities, the vertical spaces between theheterogeneities are very small and the strain level can reach a maximum of 79% for a macroscopicstrain of 28%. Horizontal paths of localized strain can also be observed between heterogeneities.The strain level inside the heterogeneities is about 10% showing a very large range of strain insidethe sample. With the sample #4 (Fig. 4b), i.e. the heterogeneities are localized along a diagonal
5

of the volume, the range is not as large as the previous sample and the maximum axial strain isabout 40% for a macroscopic strain of 28%. The strain is rather localized on every side of thediagonal but strain localization is hardly observable.
(a) Sample #5, |εmaxy |=33%. (b) Sample #6, |εmax
y |=41%.
Figure 5: Influence of the number of the heterogeneities in the middle of the sample at the meso-scopic scale. Numerical εy contours obtained for a macroscopic strain of 28% and for a strain ratevalue of 130 s−1 with a few virtual samples.
When the sample #5 (Fig. 5a) is compared with the sample #6 (Fig. 5b), it can be seen thathigher volume of heterogeneities in the middle of the virtual volume caused more strain localizationin the upper and lower parts of the sample. For a macroscopic strain of 28%, the mean of the axialstrain at the top and the bottom of the sample reaches approximately 29% and 33% with thesamples #5 and #6, respectively. It shows that even if the volume ratio of heterogeneities is about72% in the middle of the sample with a density difference of 50 kg.m−3, the strain value in thelocalized zone is only about 5% more than the macroscopic strain.
(a) Numerical results obtained with the FE simu-lation for the sample #1, |εmax
y |=36%.
-0.79
0.21
0.00
-0.42
-0.63
-0.21
(b) Experimental results obtained with theDIC technique, |εmax
y |=79%. Cumulated er-ror = 2.5%
Figure 6: Mesoscopic behavior. εy contours obtained for a macroscopic strain of 28% and for astrain rate value of 130 s−1 with an homogeneous sample of foam.
The numerical results (sample #1, Fig. 6a) can also be compared with the experimental datathanks to the Digital Image Correlation (DIC) technique used for the dynamic compressive load ofan homogeneous sample of foam. The software CORRELI-Q4 has been used for the study as in [11].
6
The contours of the axial strain for a Zone Of Interest (ZOI) of 8×8 are displayed in the figure 6b.The cumulated error which comes from the DIC technique does not exceed 2.5%. Localization of thestrain can be observed in the face of the sample. Experimentally, for this sample, the maximum ofthe axial strain reaches 79% for a mean strain of 28%. The value is underestimated in the numericalsample #1 (36%) compared to experiments. Several reasons can explain this difference. First, thiscan be due to a too small density range, i.e. 50 kg.m−3, with this kind of organized system ofheterogeneities. In this case, the approximation of this range performed for another EPP materialby Viot et al. [14] and mentioned previously (section 2.1) would be a mean to reduce the difference.Further investigations related to this topic will be part of future research work. Second, anotherway to approach the DIC results is to modify the organized system of heterogeneities itself. Suchstrain localization can be observed in the numerical sample #3 which shows that the volume ratioof heterogeneities must be sufficiently important to reach this strain level obtained experimentally.
2.3.2 Macroscopic behavior
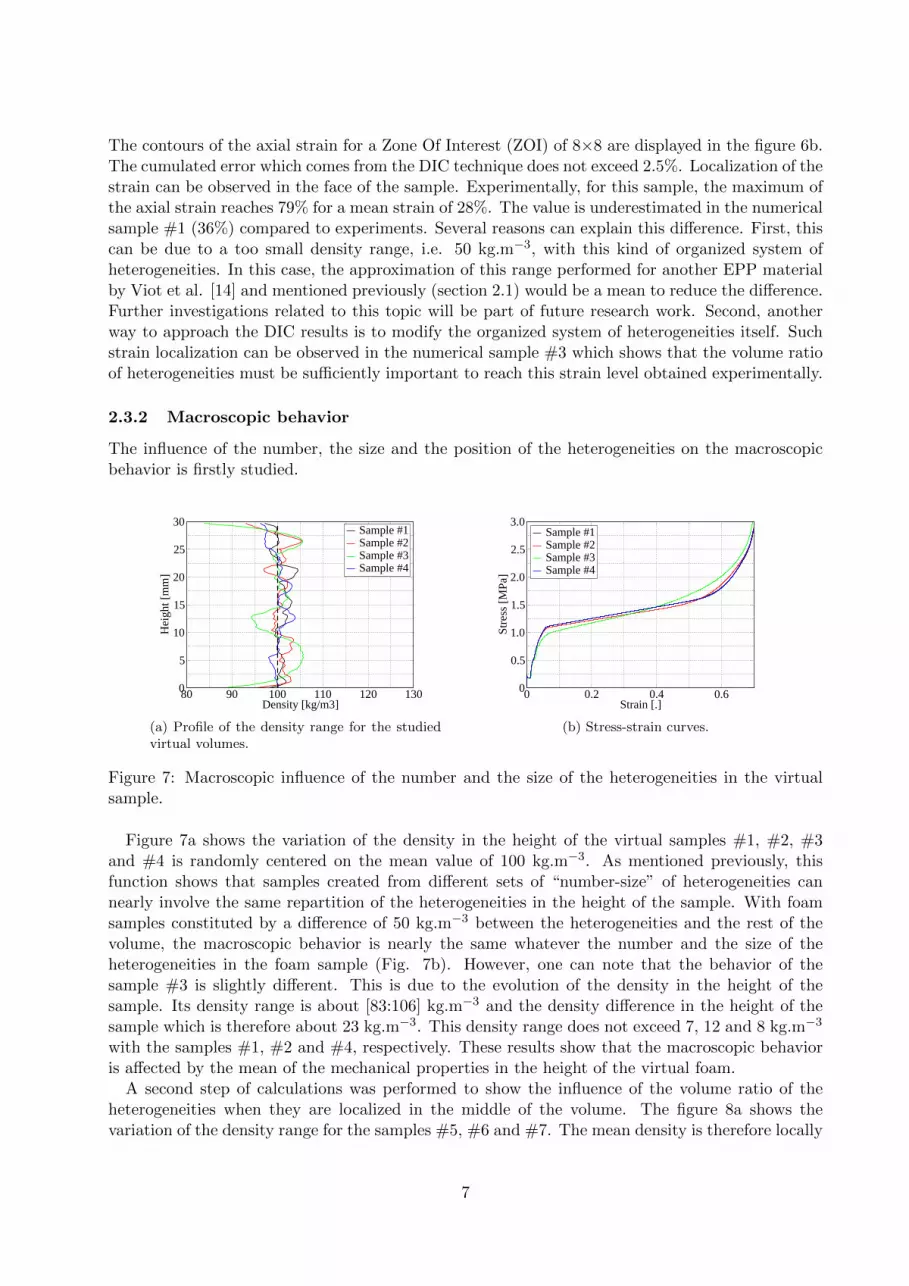
The influence of the number, the size and the position of the heterogeneities on the macroscopicbehavior is firstly studied.
80 90 100 110 120 130Density [kg/m3]
0
5
10
15
20
25
30
Hei
ght [
mm
]
Sample #1Sample #2Sample #3Sample #4
(a) Profile of the density range for the studiedvirtual volumes.
0 0.2 0.4 0.6Strain [.]
0
0.5
1.0
1.5
2.0
2.5
3.0
Stre
ss [
MPa
]
Sample #1Sample #2Sample #3Sample #4
(b) Stress-strain curves.
Figure 7: Macroscopic influence of the number and the size of the heterogeneities in the virtualsample.
Figure 7a shows the variation of the density in the height of the virtual samples #1, #2, #3and #4 is randomly centered on the mean value of 100 kg.m−3. As mentioned previously, thisfunction shows that samples created from different sets of “number-size” of heterogeneities cannearly involve the same repartition of the heterogeneities in the height of the sample. With foamsamples constituted by a difference of 50 kg.m−3 between the heterogeneities and the rest of thevolume, the macroscopic behavior is nearly the same whatever the number and the size of theheterogeneities in the foam sample (Fig. 7b). However, one can note that the behavior of thesample #3 is slightly different. This is due to the evolution of the density in the height of thesample. Its density range is about [83:106] kg.m−3 and the density difference in the height of thesample which is therefore about 23 kg.m−3. This density range does not exceed 7, 12 and 8 kg.m−3
with the samples #1, #2 and #4, respectively. These results show that the macroscopic behavioris affected by the mean of the mechanical properties in the height of the virtual foam.
A second step of calculations was performed to show the influence of the volume ratio of theheterogeneities when they are localized in the middle of the volume. The figure 8a shows thevariation of the density range for the samples #5, #6 and #7. The mean density is therefore locally
7
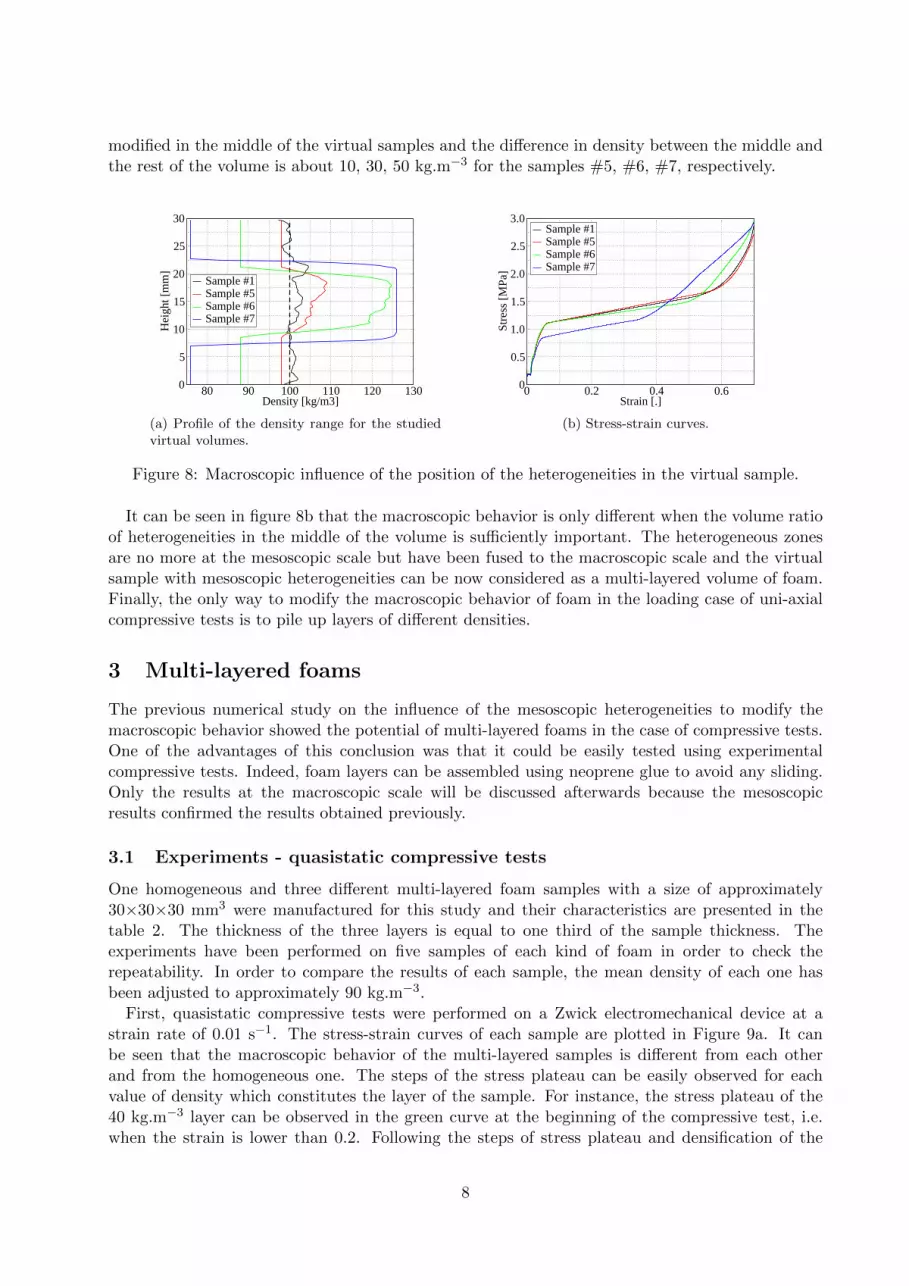
modified in the middle of the virtual samples and the difference in density between the middle andthe rest of the volume is about 10, 30, 50 kg.m−3 for the samples #5, #6, #7, respectively.
80 90 100 110 120 130Density [kg/m3]
0
5
10
15
20
25
30
Hei
ght [
mm
]
Sample #1Sample #5Sample #6Sample #7
(a) Profile of the density range for the studiedvirtual volumes.
0 0.2 0.4 0.6Strain [.]
0
0.5
1.0
1.5
2.0
2.5
3.0
Stre
ss [
MPa
]
Sample #1Sample #5Sample #6Sample #7
(b) Stress-strain curves.
Figure 8: Macroscopic influence of the position of the heterogeneities in the virtual sample.
It can be seen in figure 8b that the macroscopic behavior is only different when the volume ratioof heterogeneities in the middle of the volume is sufficiently important. The heterogeneous zonesare no more at the mesoscopic scale but have been fused to the macroscopic scale and the virtualsample with mesoscopic heterogeneities can be now considered as a multi-layered volume of foam.Finally, the only way to modify the macroscopic behavior of foam in the loading case of uni-axialcompressive tests is to pile up layers of different densities.
3 Multi-layered foams
The previous numerical study on the influence of the mesoscopic heterogeneities to modify themacroscopic behavior showed the potential of multi-layered foams in the case of compressive tests.One of the advantages of this conclusion was that it could be easily tested using experimentalcompressive tests. Indeed, foam layers can be assembled using neoprene glue to avoid any sliding.Only the results at the macroscopic scale will be discussed afterwards because the mesoscopicresults confirmed the results obtained previously.
3.1 Experiments - quasistatic compressive tests
One homogeneous and three different multi-layered foam samples with a size of approximately30×30×30 mm3 were manufactured for this study and their characteristics are presented in thetable 2. The thickness of the three layers is equal to one third of the sample thickness. Theexperiments have been performed on five samples of each kind of foam in order to check therepeatability. In order to compare the results of each sample, the mean density of each one hasbeen adjusted to approximately 90 kg.m−3.
First, quasistatic compressive tests were performed on a Zwick electromechanical device at astrain rate of 0.01 s−1. The stress-strain curves of each sample are plotted in Figure 9a. It canbe seen that the macroscopic behavior of the multi-layered samples is different from each otherand from the homogeneous one. The steps of the stress plateau can be easily observed for eachvalue of density which constitutes the layer of the sample. For instance, the stress plateau of the40 kg.m−3 layer can be observed in the green curve at the beginning of the compressive test, i.e.when the strain is lower than 0.2. Following the steps of stress plateau and densification of the
8

Sample Densitieslayer #1 layer #2 layer #3 mean[kg.m−3] [kg.m−3] [kg.m−3] [kg.m−3]
Homogeneous - - - 94±260-90-110 64±3 86±6 112±5 89±1110-40-110 109±3 42±3 112±5 89±160-130-60 62±2 130±4 67±2 87±2
Table 2: Characteristics of the experimental samples of foam.
40 kg.m−3 layer, i.e. when the strain is in [0.3:0.6], the stress plateau of both 110 kg.m−3 layerscan be observed. One can also note that the length of the stress plateau is directly related to thethickness of its layer. Moreover, the order of the constituted layers does not have any influence onthe macroscopic behavior in this case of compressive tests.
0 0.2 0.4 0.6 0.8train [.]
0
0.5
1.0
1.5
2.0
2.5
Stress
[MPa]
Homogeneous60-90-110110-40-11060-130-60
S
A
BC
D
(a) Stress-strain curves.
0 0,5 1 1,5 2 2,5Stress [MPa]
0
0.2
0.4
0.6A
bsor
bed
ener
gy [
J]
Homogeneous60-90-119110-40-11060-130-60
(b) Energy-stress curves.
Figure 9: Comparison between several kinds of multi-layered foams under quasistatic compressivetests (Zwick conventional device).
The strain localization can be observed in Fig. 10 and Fig. 11 for the samples 60-90-110 and60-130-60, respectively. For each sample, five images are analyzed at five different strain values: 0,0.15, 0.30, 0.45, and 0.60. White lines have been displayed between each layer to appreciate theevolution of the layers thicknesses.
(a) Initial. (b) A, ε = 15%. (c) B, ε = 30%. (d) C, ε = 45%. (e) D, ε = 60%.
Figure 10: 60-90-110 sample subjected to a quasistatic compressive test.
The Fig. 10 shows that even if the localization is mainly observed in the 60 kg.m−3 layer, i.e. thebottom one, small strains appear progressively in other layers, 90 kg.m−3 and 110 kg.m−3. This
9

is due to the small difference of density between the layers whereas in the 60-130-60 sample (Fig.11), the strain level in the 130 kg.m−3 middle layer is significantly less.
(a) Initial. (b) A, ε = 15%. (c) B, ε = 30%. (d) C, ε = 45%. (e) D, ε = 60%.
Figure 11: 60-130-60 sample subjected to a quasistatic compressive test.
These different macroscopic behaviors involve different capacity to absorb energy. The absorbedenergy versus the stress is plotted for each sample in the Figure 9b and show the interest of multi-layered foam to gradually absorb energy. When an homogeneous foam is tested, the foam doesnot absorb the energy before a stress of 0.5 MPa whereas energy is absorbed from 0.2 MPa withthe ‘110-40-110’ sample. However, this latter foam is less efficient than others when the 40 kg.m−3
layer reaches the step of densification, step during which a small quantity of energy is absorbed.This is due to the too large difference in density between the layers. Indeed, the ‘60-90-110’ sample(red curve) for which the density is gradually increased seems to be the most adapted to impactsfor which a gradual energy absorption is required.
3.2 Experiments - dynamic compressive tests
Dynamic compressive tests have been performed with an original Flywheel device[1] which allowsa quasi-constant strain rate during the test. The macroscopic strain rate chosen for this study isfixed to 110 s−1.
0 0.2 0.4 0.6Engineering strain [.]
0
0.5
1.0
1.5
2.0
2.5
Stress
[MPa
]
Homogeneous60-90-110110-40-11060-130-60
A
BC
D
0 0.2 0.4 0.6Engineering strain [.]
0
0.5
1.0
1.5
2.0
2.5
Stress
[MPa
]
Homogeneous60-90-110110-40-11060-130-60
Strain [.]
A
BC
D
(a) Stress-strain curves.
0 0.5 1.0 1.5 2.0 2.5Stress [MPa]
0
0.2
0.4
0.6
Absorbedenergy
[J]
Homogeneous60-90-110110-40-11060-130-60
(b) Energy-stress curves.
Figure 12: Comparison between several kinds of multi-layered foams under dynamic compressivetests (Flywheel Device).
The stress-strain curves obtained with the dynamic compressive tests and observed in the figure12a show similar results with the quasistatic tests. Nevertheless, oscillations due to wave reflectionin the device assembly perturb the measured signal. An increase in the stress level can be notedcompared with quasi-static tests. However, with the 94 kg.m−3 homogeneous sample, the slight
10

increase observed in the figure 12a is not consistent with the results obtained by Bouix et al. [1].The results obtained with this foam has therefore to be carefully analyzed. The same trends of theabsorbed energy in dynamics can be observed for the multi-layered samples (Fig. 12b) comparedto the quasistatic tests. It can also be shown that gradually dense foams, such as the 60-90-110,allow a progressive absorption of the energy impact without involving an energy absorption plateaudue to too large density difference between the layers.
(a) Initial. (b) A, ε = 15%. (c) B, ε = 30%. (d) C, ε = 45%. (e) D, ε = 60%.
Figure 13: 60-90-110 sample subjected to a dynamic compressive test.
(a) Initial. (b) A, ε = 15%. (c) B, ε = 30%. (d) C, ε = 45%. (e) D, ε = 60%.
Figure 14: 110-40-110 sample subjected to a dynamic compressive test.
The results of the dynamic compressive tests are also presented thanks to images obtained duringthe test (Figs. 13, 14 and 15). One can see that the strain is first localized in the less dense layersof foam. However, with the same manner as in dynamic, the strain is progressively distributed inall the layers in the 60-90-110 sample (Fig. 13). Because of large differences in density betweenlayers in the 110-40-110 (Fig. 14) and 60-130-60 (Fig. 15) samples, the strain is distributed in themost dense layers after a long step of densification for the least dense layers.
(a) Initial. (b) A, ε = 15%. (c) B, ε = 30%. (d) C, ε = 45%. (e) D, ε = 60%.
Figure 15: 60-130-60 sample subjected to a dynamic compressive test.
11

3.3 Numerical simulation - dynamic compressive tests
FE simulation of the dynamic compressive tests were performed using LS-Dyna software with thesame input data as in the section 2.3. The numerical results are presented in term of the stress-strain and the absorbed energy versus stress curves in the Figure 16. The macroscopic behavior ofeach multi-layered sample is well described by the FE simulation (figure 16a) and one can easilysee the different stress level of each layer. The evolution of the curves are not as smooth as withthe experimental quasistatic tests and the ‘straight line’ shape of these curves can be explained bythe limited number of recorded points, i.e. 15 points, used to describe the behavior. Even if thetrends are the same with the experimental dynamic compressive tests, the stress level of the firststep of the test, i.e. when the strain is approximately lower than 0.4, is overestimated by the FEsimulation with all the samples. This difference comes from a numerical artefact which is due tothe use of numerical damping in the LS-Dyna software to overcome negative volumes in the finiteelements [7, 8]. A numerical stiffness which is added to soft finite elements involves an increase ofthe stress level in the elastic and plateau stages. With this kind of multi-layered foams, the use ofthis numerical stiffness is necessary to prevent the soft layers from completely collapsing before thedeformation of other layers.
0 0.2 0.4 0.6 0.8Strain [.]
0
0.5
1.0
1.5
2.0
2.5
Stress
[MPa
]
Homogeneous60-90-110110-40-11060-130-60
AB
C
D
(a) Stress-strain curves.
0 0.5 1.0 1.5 2.0 2.5Stress [MPa]
0
0.2
0.4
0.6
0.8
Abs
orbe
d en
ergy
[J]
Homogeneous60-90-110110-40-11060-130-60
(b) Energy-stress curves.
Figure 16: Comparison between several kinds of multi-layered foams under dynamic compressivetests (Numerical results).
The results of these numerical tests are also presented using images obtained during the test(Figs. 17, 18 and 19). The trends are the same as with the experiments and show that the strainis localized firstly in the weakest layer of the samples. However, for a macroscopic strain of 45%(mark ‘C’ on the Figures), the strain is only localized in the weakest layer for the samples witha large density difference between layers (the 110-40-110 and the 60-130-60 samples) whereas thestrain is distributed in the 60 kg.m−3 and the 90 kg.m−3.
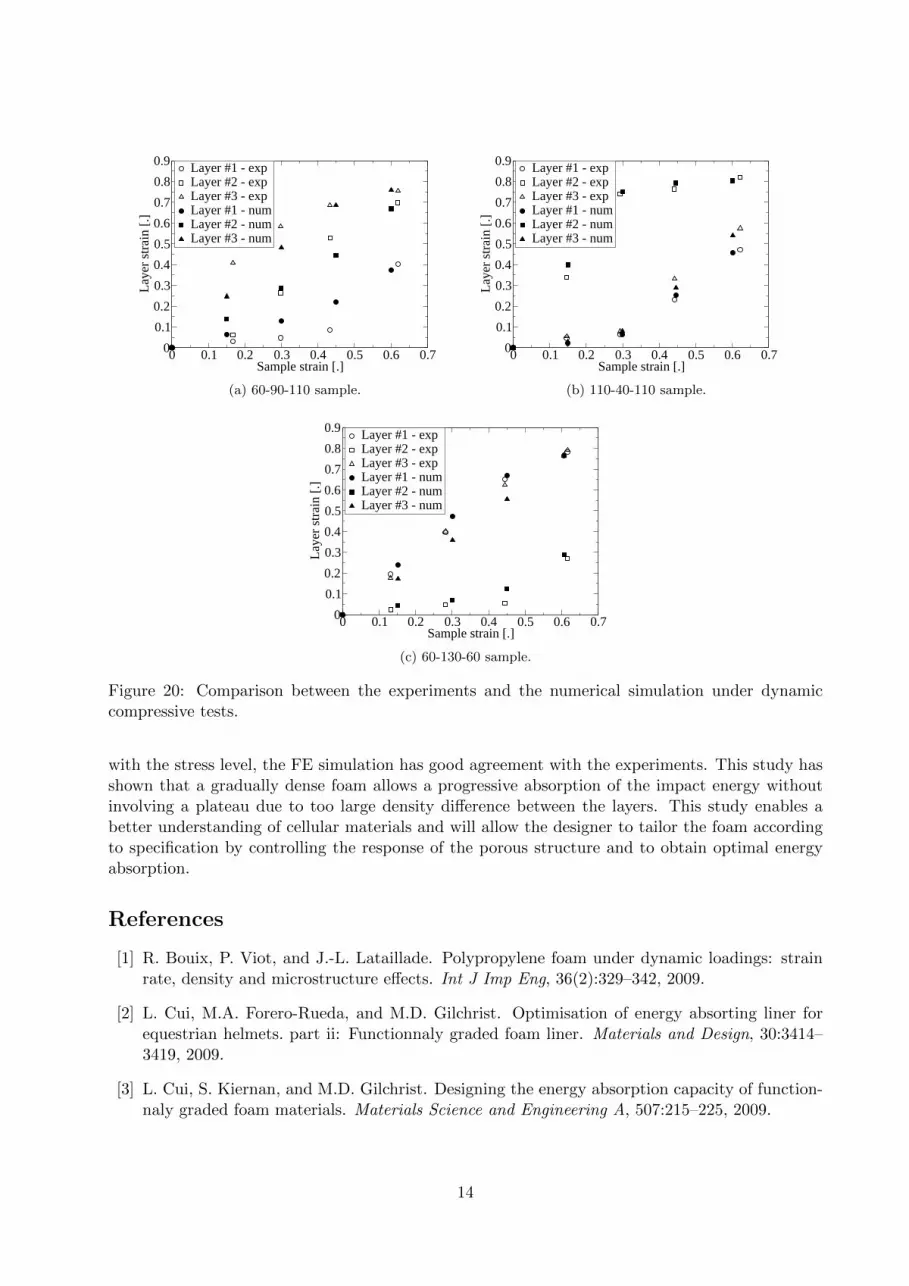
For each layer of these three samples dynamically loaded, the strain of the layer can also beplotted versus the strain of the sample (Figures 20). The strains of each layer of experimentalsamples are deduced from the variation of the thickness of each layer. This variation is directlymeasured on the images (Figures 13, 14 and 15). The strains of each numerical layer are obtaineddirectly from the LS-Dyna software results.
It can be seen from the figures 20b and 20c that there is a good agreement between numericalsimulations and experiments. The difference of the strain level between numerical and experimentalresults does not exceed 0.1 in every layers and these results are acceptable considering the numericalassumptions. In the figure 20a, the difference between numerical and experimental results is higher
12

(a) Initial. (b) A, ε = 15%. (c) B, ε = 30%. (d) C, ε = 45%. (e) D, ε = 60%.
Figure 17: Progression of compression in the 60-90-110 sample
(a) Initial. (b) A, ε = 15%. (c) B, ε = 30%. (d) C, ε = 45%. (e) D, ε = 60%.
Figure 18: Progression of compression in the 110-40-110 sample
(a) Initial. (b) A, ε = 15%. (c) B, ε = 30%. (d) C, ε = 45%. (e) D, ε = 60%.
Figure 19: Progression of compression in the 60-130-60 sample
than for the the other cases (the difference between experimental and numerical strains are inferiorto 0.16 for intermediate strain of the sample). However, this difference decreases for higher strainof the sample.
4 Conclusion
The polypropylene foam used for this study is defined as a multi-scale material which is constitutedof mesoscopic beads. The large variability of the mechanical properties of the beads could thereforemodify the macroscopic behavior. To study the influence of the beads variability on the macroscopicand local behaviors, virtual volumes of foam have been tested and compared in a Finite Elementframework. Dense heterogeneities have therefore been introduced into the virtual volume and theeffect of their size, number and place in the volume has been analyzed. It has been shown thatin the case of a dynamic compressive test, a system of heterogeneities randomly placed in thevolume modifies the mesoscopic behavior by the presence of strain localization but do not manageto change sufficiently the macroscopic behavior. The only way to modify it is to use multi-layeredvolumes of foam. The use of the Digital Image Correlation technique also allowed to discuss aboutthe characteristics of the heterogeneities inside the volume.
A second part of this work dealt with the compressive tests of multi-layered volumes of foam toexhibit their energy absorption capacity. Experimental quasi-static and dynamic compressive testshave been performed and compared with the FE simulation results. Except for a small difference
13
0 0.1 0.2 0.3 0.4 0.5 0.6 0.7Sample strain [.]
0
0.1
0.2
0.3
0.4
0.5
0.6
0.7
0.8
0.9L
ayer
str
ain
[.]
Layer #1 - expLayer #2 - expLayer #3 - expLayer #1 - numLayer #2 - numLayer #3 - num
(a) 60-90-110 sample.
0 0.1 0.2 0.3 0.4 0.5 0.6 0.7Sample strain [.]
0
0.1
0.2
0.3
0.4
0.5
0.6
0.7
0.8
0.9
Lay
er s
trai
n [.
]
Layer #1 - expLayer #2 - expLayer #3 - expLayer #1 - numLayer #2 - numLayer #3 - num
(b) 110-40-110 sample.
0 0.1 0.2 0.3 0.4 0.5 0.6 0.7Sample strain [.]
0
0.1
0.2
0.3
0.4
0.5
0.6
0.7
0.8
0.9
Lay
er s
trai
n [.
]
Layer #1 - expLayer #2 - expLayer #3 - expLayer #1 - numLayer #2 - numLayer #3 - num
(c) 60-130-60 sample.
Figure 20: Comparison between the experiments and the numerical simulation under dynamiccompressive tests.
with the stress level, the FE simulation has good agreement with the experiments. This study hasshown that a gradually dense foam allows a progressive absorption of the impact energy withoutinvolving a plateau due to too large density difference between the layers. This study enables abetter understanding of cellular materials and will allow the designer to tailor the foam accordingto specification by controlling the response of the porous structure and to obtain optimal energyabsorption.
References
[1] R. Bouix, P. Viot, and J.-L. Lataillade. Polypropylene foam under dynamic loadings: strainrate, density and microstructure effects. Int J Imp Eng, 36(2):329–342, 2009.
[2] L. Cui, M.A. Forero-Rueda, and M.D. Gilchrist. Optimisation of energy absorting liner forequestrian helmets. part ii: Functionnaly graded foam liner. Materials and Design, 30:3414–3419, 2009.
[3] L. Cui, S. Kiernan, and M.D. Gilchrist. Designing the energy absorption capacity of function-naly graded foam materials. Materials Science and Engineering A, 507:215–225, 2009.
14
[4] M.A. El-Hadek and H.V. Tippur. Dynamic fracture parameters and constraint effects infunctionnaly graded syntactic epoxy foams. International Journal of Solids and Structures,40:1885–1906, 2003.
[5] M.A. Forero-Rueda, L. Cui, and M.D. Gilchrist. Optimisation of energy absorting liner forequestrian helmets. part i: Layered foam liner. Materials and Design, 30:3405–3413, 2009.
[6] L.J. Gibson and M.F. Ashby. Cellular solids. Structure and properties. Cambridge Solid StateScience Series. Cambridge University Press, second edition, 1997.
[7] O. Hallquist. LS-Dyna Keyword user’s manual - version 971. Livermore Software TechnologyCorporation (LSTC), 2007.
[8] A. Hirth, P. DuBois, and K. Weimar, editors. Improvement of LS-Dyna Material Law 83 (FuChang) for the Industrial Simulation of Reversible Energy-Absorbing Foams. CAD-FEM UsersMeeting, October 7-9 1998.
[9] G. Landi, S.R. Niezgoda, and S.R. Kalidindi. Multi-scale modeling of elastic response ofthree-dimensional voxel-based microstructure datasets using dft-based knoledge systems. ActaMater, 58:2716–2725, 2010.
[10] N.J. Mills, C. Fitzgerald, A. Gilchrist, and R. Verdejo. Polymer foams for personal protection:cushions, shoes and helmets. Compos Sci Technol, 63(16):2389–2400, 2003.
[11] S. Roux, F. Hild, P. Viot, and D. Bernard. Three-dimensional image correlation from x-raycomputed tomography of solid foam. Compos A: Appl Sci Manuf, 39(8):1253–1265, 2008.
[12] P. Viot. Hydrostatic compression on polypropylene foam. Int J Imp Eng, 36:975–989, 2009.
[13] P. Viot, F. Beani, and J.-L. Lataillade. Polymeric foam behavior under dynamic compressiveloading. J Mater Sci, 40:5829–5837, 2005.
[14] P. Viot, E. Plougonven, and D. Bernard. Microtomography on polypropylene foam underdynamic loading: 3d analysis of bead morphology evolution. Compos A: Appl Sci Manuf,39(8):1266–1281, 2008.
15