mass transfer of volatile organic carbons through aqueous foams
TRANSCRIPT

s
ts for the,
bble sizesexane) atmeasured.
of collapsee foamlethe foams
Journal of Colloid and Interface Science 273 (2004) 611–625www.elsevier.com/locate/jcis
Mass transfer of volatile organic carbons through aqueous foam
Pankaj S. Gautam and Kishore K. Mohanty∗
Department of Chemical Engineering, Universityof Houston, 4800 Calhoun Road, Houston, TX 77204-4004, USA
Received 13 June 2003; accepted 26 January 2004
Abstract
A model is developed to study diffusive mass transfer of hydrocarbon vapor through a flexible foam blanket. The model accoundiffusion of hydrocarbon vapor through gas-phase and liquid lamellae,the combined gravityand capillary drainagefrom the plateau borderthe thinning of foam lamellae caused by the forces of capillary suction, London–van der Waals attraction, and electrostatic double-layerrepulsion, and foam collapse. Uniform bubble size is assumed, and hence, interbubble gas diffusion arising out of variation in bualone is not incorporated into the model. A high-stability aqueous foam formulation that remains stable in the presence of oil (hfoam–oil contact was developed using surfactants, stabilizers, and viscosifiers. Emission of hexane vapor through the foam wasThe model predicts that the initially taller foam columns collapse faster. Their mass-transfer resistance is higher before the onsetbut not very different from that of the shorter foam columns at long times. If the solubility and diffusivity of the hexane gas in thliquid are unaffected, the foams with higher viscosities persist longer and provide greater diffusive mass-transfer resistance. Foam bubbsize does not significantly impact the mass-transfer resistance of the foam column before the onset of foam collapse. However,with smaller bubbles collapse earlier, and theirability to act as a mass-transfer barrier to the diffusing hydrocarbon vapordiminishesrapidly.The experimental results compared reasonably with the model for varying initial foam heights and bubble sizes. 2004 Elsevier Inc. All rights reserved.
Keywords:Foam; Mass transfer; Volatile organic carbon; Emission;Vapor emission suppression; Foam barrier; Foam stability
ksom-porscon
comayop-of
verygiesVa-and
atoil.ent
up-er,then-
iblemis-firstse ofach
up-heirur-r,ater-omasswast al.for
ierod-
1. Introduction
During loading and unloading of crude oil/gasoline tanor tankers, considerable amounts of volatile organic cpounds (VOCs) are vented into the atmosphere. The vareleased from gasoline storage and loading operationstain a mixture of light hydrocarbons (C1–C7) and aromatichydrocarbons such as benzene and toluene. The vaporpositions are similar for crude oil loading terminals but mbe different for other organic chemicals. Each loadingeration takes from a few hours to half a day. Two typesapproaches are used for emission control: vapor recoand vapor suppression. Many of the existing technolofor emission control employ vapor recovery methods.por recovery systems include pressure swing adsorptionsteam-generated temperature swing adsorption, followed bythermal incineration. Vapor suppression techniques aimdecreasing the emission of vapors from gasoline/crudeCorino et al. [1] had suggested the use of a gelling ag
* Corresponding author.E-mail address:[email protected] (K.K. Mohanty).
0021-9797/$ – see front matter 2004 Elsevier Inc. All rights reserved.doi:10.1016/j.jcis.2004.01.055
-
-
to create a floating roof of the same material by theper layer of the oil in the oil tank. This technique, howevcauses considerable difficulties in cleaning the tanker iftanker has any plumbing lines or compartment walls. Aother method for suppression of VOCs is use of a flexfoam blanket to create a mass transfer barrier to the esion of hydrocarbon vapors. Canevari et al. [2] were theto suggest a foamed vapor barrier to suppress the releavolatile hydrocarbons using common aqueous foams. Thet al. [3] proposed foam formulations for the long-term spression of both polar and nonpolar hydrocarbons. Tdilute foam solution consists of a water-soluble nonionic sfactant, a fluorinated co-surfactant, a stabilizer, a viscosifieand water. Nonionic surfactants were chosen for seawtype applications. They claim that their foams persist fr12 h to several days. However, no modeling of the mtransfer of hydrocarbon gases across the foam barrierattempted. Dalland and Hanssen [4] and Mannhardt e[5] have studied stability of foams in the presence of oilcontrol of gas flow in oil fields.
Although the diffusion of gas across a thin liquid barrhas been modeled [6], there is a dearth of literature on m

612 P.S. Gautam, K.K. Mohanty / Journal of Colloid and Interface Science 273 (2004) 611–625
h ave
ac-eentionair.dy.dif-
sssion
rat-epeneau
orkandou
mn.rs:dif-hatlos-s a
is-bblefromintolacehar-ex-ion14]dis-15]s
ility.bblethe
state20]me-
stateupasi-inagingsteiningtheg.snede o
andmters,
lf-life25]
smithblep-ughcel-mence,
sizeentiq-e
n,is notughatThen forrmInuidtheForageuidloc-nde-ex-
ults5, a
wed
theeous
e-ed
o re-
n-ible.d
eling of diffusive mass transfer of hydrocarbons througstanding or collapsing foam column. Brown et al. [7] hastudied the diffusion of air from bubbles formed in a surftant solution. They observed a linear relationship betwthe square of bubble radius and time, and this informawas used to infer the permeability of bubble film to theHowever, film thickness was not determined in the stuPrincen et al. [8,9] presented an improved analysis of gasfusion across thin liquid films. In their study, film thicknewas measured by the interferometric method. The diffuof multicomponent gases was also studied.
In a foam column, the thickness of foam lamellae sepaing the discontinuous gas phase has a spatiotemporal ddence. The foam lamella drains into the adjoining platborders under the action of capillary suction and disjoiningpressure. The liquid then drains down through the netwof plateau borders under the combined action of gravityan opposing capillary pressure in plateau borders arisingof plateau border curvature gradient in the foam coluLong-term foam stability is affected by two main factoliquid drainage through the foam and interbubble gasfusion [10]. In the early stages, it is the bulk drainage tcauses the foam to shrink and decrease in height due toof liquid from the foam. Once most of the initial foam liquid has drained out, interbubble gas diffusion becomemore important factor affecting foam stability. In polydpersed foams, the pressure of the gas inside smaller buis higher than that in larger bubbles. Consequently, gassmaller bubbles diffuses across the thin liquid lamellathe larger bubbles and coarsening of the foam takes pNishioka and Ross [11] developed a new method to cacterize foam stability based on the total area of thetended liquid surface. The effect of bubble size distributon foam stability has also been studied [12,13]. Lemlich [described a theory to predict the evolution of bubble sizetribution due to interbubble gas diffusion. Sarma et al. [showed that the presence of water-soluble polymers retardinterbubble gas diffusion, thereby enhancing foam stabThey also presented a simplified model of one large busurrounded by nine smaller bubbles to qualitatively studyeffect of interbubble gas diffusion on foam half-life.
There exists a considerable literature on unsteady-drainage of static/collapsing foams [16–18]. Many [19,have studied foam generation and transport in porousdia. Narsimhan [21] presented a model for the unsteady-drainage of standing bulk foam. The initial liquid holdprofile for the standing foam was computed assuming qusteady state between the rates of entrainment and draof liquid during the process of generating foam by bubblgas through a surfactant solution. Bhakta and Rucken[22] improved on Narsimhan’s [21] approach by proposan unsteady-state model for computing the evolution ofliquid holdup profile during foam generation by bubblinThey showed that this mechanism is important as far afoam drainage rates are concerned. All the aforementiostudies assumed that the foam is static; i.e., no collaps
-
t
s
s
.
e
f
foam occurs within the time under consideration. BhaktaRuckenstein [23] incorporatedthe foam collapse mechanisinto their model and studied the effect of various paramesuch as superficial gas velocity, electrolyte concentrationand bubble size on steady-state height and collapse haof the foam. Grassia et al. [24] and Neethling et al. [present generalized models of foam drainage.
The objective of this work is to combine the mechaniof hydrocarbon diffusion through the foam lamellae wfoam drainage/collapse to investigate the effect of bubsize, initial foam column height, and foam solution proerties such as viscosity on mass transfer of VOCs throaqueous foams. The foam under consideration is a drylular foam having a high gas-to-liquid ratio. All the foabubbles are considered to be of same size and shape; hinterbubble gas diffusion occurring as a result of bubbledistribution of the foam is not considered in the preswork. Narsimhan [21] assumed a negligible fraction of luid in thin films and justified it by a comparison of timscales of film and plateau border drainage. This assumptiothough reasonable as far as bulk drainage is concerned,applicable to the case of diffusion of hydrocarbons throa foam column as it is primarily the liquid in the films thaccounts for resistance to the diffusive mass transfer.model presented here incorporates an evolution equatiothe film liquid holdup. Our model also assumes a unifoliquid holdup profile as the initial condition of the foam.other words, this analysis ignores the evolution of a liqholdup profile during the process of foam generation andsmall foam shrinkage thereafter due to bulk drainage.dry cellular foams, the foam shrinkage due to bulk drainis indeed negligible. The assumption of the uniform liqholdup may be justifiable when the superficial gas veity employed for foam generation is sufficiently large athe viscosity of the liquid sufficiently high. We start by dscribing the model in Section 2, and then describe theperimental methodology in Section 3. Experimental resare compared against the model in Section 4. In Sectionparametric analysis of the model is presented and is folloby the conclusions in Section 6.
2. Model
A number of simplifications have been made to modelphenomenon of diffusive mass transfer through an aqufoam column. These assumptions are:
1. The foam bubbles have a regular pentagonal dodecahdral shape. Additionally, all foam bubbles are assumto be of same size and the geometry is assumed tmain unchanged during hydrocarbon diffusion.
2. The holdup of diffusing hydrocarbon in the liquid cotained in the plateau borders is assumed to be negligSince the solubility of thehydrocarbon gas in the liquiis very small, this is a good approximation.

P.S. Gautam, K.K. Mohanty / Journal of Colloid and Interface Science 273 (2004) 611–625 613
Fig. 1. Typical concentration profile of a componentdiffusing from the center of one bubble to the other.
assrate
as–ssbyaree-
hemnt
amua-ceforhe
the
rd
herry
sin-tionneprol toisin-en
e
sfert de-ofn ofgherid–henfor
upx-
arin
resing
s
3. The contribution of the plateau borders to the total mtransfer resistance is neglected. This would be accuif the contribution of the plateau borders to the total gliquid interfacial area available for the diffusive matransfer is negligible in comparison to that providedthe foam lamellae. Moreover, the plateau bordersusually richer in liquid than the foam lamellae. Consquently, the mass transfer resistance provided by tis much larger, making them a relatively unimportamedium of mass transfer.
4. Concentration of surfactant on the surface of folamellae is high enough to justify use of Reynold’s eqtion [26] for film drainage. It assumes infinite surfaviscosity of the foam lamellae. However, the casea finite surface mobility could be incorporated into tmodel following Desai and Kumar [27].
5. The concentration of the diffusing components ingas phase is dilute.
6. The bulk diffusion constant of the foam lamellae towahydrocarbons (n-hexane) is constant.
7. The foam under consideration is dry foam. In otwords, the liquid fraction in the foam at any time is vemuch less than unity.
Let us focus on the diffusive mass transfer through agle foam lamellae. Fig. 1 shows the typical concentraprofile of the diffusing hydrocarbon from the center of obubble to another. Assuming that the surface resistancevided by the surfactant monolayer is approximately equathat provided by the bulk liquid film of same thickness ornegligible compared with the resistance of the bulk liquidside the film lamellae, the effective diffusivity can be givby (see Appendix A for derivation)
(1)1
Deff= εf H
Dl
+ 1− ε
Dg
≈ εf H
Dl
+ 1
Dg
,
where εf = Nnf Af hf ≈ (nf Af /Vb)hf and 1− ε ≈ 1.Thus, the effective diffusivity of the foam is a function of thliquid holdup in the films, diffusion coefficients(Dg,Dl),and Henry’s constant.
-
2.1. Film drainage
For describing the process of diffusive mass tranthrough the aqueous foam, we need another equation thascribes the variation in the film liquid holdup as a functionspace and time. In highly stable foams, the concentratiothe surfactants is often at least an order of magnitude hithan the critical micellar concentration. As such, the liqugas interface in a bubble can be assumed to be rigid. WReynold’s equation is used to describe the film thinningsuch foams,
(2a)−dhf
dt= 2h3
f �P
3µR2f
.
Assuming that the volume fraction of the total liquid holdis very small, i.e., 1− ε ≈ 1, Eq. (2a) could be also be epressed in the form
(2b)−dεf
dt= 2ε3
f θ2�P
3µR2f
,
whereθ = Vb/nf Af . Since the film lamellae are not circulbut a regular pentagon, the effective film radius for useEq. (2b) could be expressed as
(3)Rf = 0.606Rb.
The net pressure difference�P , that is, the driving force fothe film thinning, resulting from the capillary suction forcarising out of plateau border curvature and the disjoinpressure(Π) in the films, is given by
(4)�P = σ
Rp− Π,
whereΠ = ΠDL + ΠVW. From geometric consideration[21,28], the radius of plateau borderRp could be related tothe area of the plateau border and the film thicknesshf by
Rp =
(5)
−1.732hf + [(1.732hf )2 − 0.644(0.433h2f − ap)]1/2
0.322.
614 P.S. Gautam, K.K. Mohanty / Journal of Colloid and Interface Science 273 (2004) 611–625
or-
-
antaticper
ck-
lsiveerat
id
theil-pt toter-nts,la-nicesendthero-thetheiusnc-ize.s ofryin-vity, theor-ofaugeex-ene to
-ctiongra-
o then-ingrderr, thebeupithsub-
av-r
ient,
mtand
For h2f � ap, the simplified expression for the plateau b
der radius of curvature is given by
(6)Rp = αa1/2p ,
whereα is a constant (= √0.644/0.322). The cross-section
al area of the plateau border is given by the expression
(7)ap = εpb
Nnpl=
(εpb
1− ε
)(Vb
npl
)∼= εpb
(Vb
npl
).
The disjoining pressure in the films arises out of vder Waals attractive forces and the repulsive electrosdouble-layer forces. The van der Waals attractive forcesunit area are inversely proportional to the cube of film thiness and are given by [29]
(8)ΠVW = − Ah
6πh3f
.
Oshima and Kondo [30] gave an expression for the repupressure between the interacting double layers at modsurface potentials as
ΠDL = 16(6.02× 1026)ckT[γ 2A2
1 + 2γ 4A1(A2 + A3
1
)(9)+ γ 6(2A1A3 + 8A3
1A2 + 3A61 + A2
2
)],
where, for monovalent electrolytes,
γ = tanh
(eψs
4kT
),
A1 = 1
cosh( κhf
2
) ,
A2 = −κhf
2 tanh( κhf
2
)cosh3
( κhf
2
) ,
(10)
A3 = A1 − A31
4 cosh2( κhf
2
)+ 3A2
4 cosh2( κhf
2
)[1− 4
κhf
2tanh
(κhf
2
)]
− A1( κhf
2
)2
2 cosh4( κhf
2
) ,
and
(11)κ = c0.5
3.04× 10⁻¹⁰
(298
T
)0.5
.
Combining Eqs. (1)–(11), the evolution of the film liquholdup profile is described by the equation
(12)∂εf
∂t= β1ε
3f ΠDL(θεf ) − β2
ε3f
ε1/2pb
− β3,
where
β1 = 2θ2
3µR2f
, β2 = 2σθ2
3αµR2f
(npl
Vb
)1/2
,
β3 = Ah
9πµθR2.
f
e
It should be noted that Eq. (12) implicitly assumesfilm stability is governed only by the ionic repulsion, caplary suction, and van der Waals forces. We do not attemdescribe the film stability caused by the intermolecular inactions between the nonionic surfactants, ionic surfactaand polymers. Incidentally, the experimental foam formution used in this study consists of nonionic surfactants, io(fluorinated) surfactants, and water-soluble polymer. Ththeoretical limitations of Eq. (12) should be kept in mithroughout this study. Also note that Eq. (12) requiresevolution equation of the plateau border liquid holdup pfile for closure. Physically, the foam lamellae drain intoadjoining plateau borders by the capillary suction force,magnitude of which is inversely proportional to the radof curvature of the plateau border, which, in turn, is a fution of liquid holdup in the plateau border and bubble sThis is responsible for the coupling of evolution equationfilm liquid holdup and plateau border liquid holdup. For veshort initial times, the rate of film drainage into the adjoing plateau borders is far more rapid than the rate of gradrainage through the plateau borders [21]. In this periodfoam films rapidly drain into the neighboring plateau bders, swelling them. After this short initial period, the ratefilm drainage is typically much lower than the rate of plateborder gravity drainage. The contribution of film drainato the overall bulk drainage of the foams is negligiblecept for short initial times or, possibly, very late times whplateau border drainage almost stops. The films continuthin under the combined action of capillary suction and disjoining pressure. The plateau borders drain under the aof gravity counteracted by an adverse capillary pressuredient that is set up in the plateau borders in response tvariation inεpb with height in the foam column. Under coditions of mechanical drainage equilibrium, the net drivforce for bulk drainage of foams, i.e., both the plateau bodrainage and the film drainage, becomes zero. Howeverate at which the film liquid holdup profile evolves couldvery different from that of the plateau border liquid holdprofile. A comparison of the time scale of film drainage wthat of plateau border drainage is presented in the nextsection.
2.2. Comparison of time scales of film and plateauborder drainage
Desai and Kumar [27] derived an expression for theerage velocity of liquid flowing in a vertical plateau bordewith triangular cross section in terms of pressure gradwhich, in our case, could be expressed as
(13)u = − Cvap
20√
3µ
(ρg + ∂p
∂z
)z.
The axisz in Eq. (13) is directed vertically upward frothe foam/oil contact. The factorCv accounts for the effecof the mobile liquid–gas interface in the plateau borders

P.S. Gautam, K.K. Mohanty / Journal of Colloid and Interface Science 273 (2004) 611–625 615
f di-
-ce].res-
(liqto b
hatcity
ntsvity.or-
ecur-versthatr liq-g
rder
on-
ilythe
iumionethe
-side
topro-
itiallm
isticch
aue-
-ouldl-y
mm-
gra-vityeperr inthe
theichup
an-ure.
n,he
has been computed [27] as a function of the inverse omensionless surface viscosity(γs = 0.4387µ
√ap/µs). In
this study we have takenCv as unity, assuming an immobile liquid–gas interface, though the effect of finite surfaviscosity could be easily incorporated into the model [25
At the gas–liquid interface in the plateau border, the psure in the continuous liquid phase is given by
(14)p = pg − σ
Rp
.
Therefore, the pressure gradient in the continuous phaseuid), assuming the dispersed phase (gas in the bubbles)in hydrostatic equilibrium, is given by
(15)∂p
∂z= −ρgg − σ
∂
∂z
(1
Rp
).
Substituting Eq. (15) in Eq. (13) and remembering tρg � ρ in our case, the expression for the average veloof the liquid through the plateau border is given by
(16)u = − ap
20√
3µ
(ρg − σ
∂
∂z
(1
Rp
))z.
The first term on the right-hand side of Eq. (16) represethe liquid drainage from the plateau borders due to graAs the liquid drains down in a foam column, the plateau bders at the top become leaner inliquid relative to those at thbottom. The leaner plateau borders have smaller radii ofvature and hence a larger capillary pressure. Thus an adcapillary pressure gradient is set up in the foam columncounteracts the gravity drainage, and the plateau bordeuid holdup profile evolves to its equilibrium value. UsinEq. (16), a characteristic time constant for plateau boliquid drainage could be written as
(17)tpb,ch = L0
u0,
where
(18)u0 = ρgεpb,ch
20√
3µ
(Vb
npl
).
Based on the dominant force of capillary suction, a time cstant for film drainage would be
(19)tf,ch = ε1/2pb,ch
β2ε2f,ch
.
We are interested in the film liquid holdup profile primarfor estimation of the mass transfer resistance offered todiffusing species. In this study, we have used the equilibrplateau border liquid holdup profile in the evolution equatfor film liquid holdup. This approximation is good if the timscale of plateau border drainage is much smaller thantime scale of film drainage; i.e.,
(20)tpb,ch � tf,ch orε2f,ch
ε3/2
� 0.07326Bo
Lh
,
pb,ch
-e
e
where
Bo= ρgl2
σ, Lh = L0
l.
Bond number (Bo) is the ratio of gravitational force to capillary force, and length number (Lh) is the dimensionlesfoam height. In deriving the constant on the right-hand sof Eq. (20), we used the relations
l = 0.816Rb, Rf = 0.606Rb,
(21)np = 10, nf = 6.
Since the films drain very rapidly at short initial times inthe plateau borders as shown by Narsimhan [21], an appriate characteristic plateau border liquid holdup is the intotal liquid holdup of the foam, whereas a characteristic filiquid holdup corresponds to the critical film thickness, gen-erally orders of magnitude smaller than the characterplateau border liquid holdup. Eq. (20) is satisfied for sutypical cases.
2.3. Equilibrium plateau border liquid holdup
At equilibrium, the average flow velocity in the plateborder throughout the foam will be identically zero. Mathmatically,
(22)∂
∂z
(1
Rp
)= ρg
σ.
At the foam–liquid interface,the foam bubbles could be regarded as closely packed spherical bubbles, which wyield the bulk liquid holdup at the bottom of the foam coumn asεL = 0.26. A solution to Eq. (22) with this boundarcondition yields
(23)εpb,eqb= 1
1+ (a + bBoLhξ)2,
wherea = √(1− εL)/εL, b = 2.1882, andξ = z/L0. The
productBoLh governs the spatial gradient of the equilibriuplateau border liquid holdup profile. A higher Bond nuber keeping the dimensionless foam height (Lh) constantimplies a weaker force due to adverse capillary pressuredient in the plateau borders that serves to restrain gradrainage. Hence, the higher the Bond number, the steis the plateau border liquid holdup profile and the leaneliquid the plateau borders become as one moves up indirection against gravity. A higher length number, onother hand, implies higher dimensionless foam height, whwould automatically make the plateau border liquid holdprofile steeper in dimensionless terms.
2.4. Foam collapse
After the film reaches a certain critical thickness, a rdom perturbation on its surface may cause it to ruptSince the film is thinnest at the top of the foam columfoam collapse due to film rupture starts from the top. T

616 P.S. Gautam, K.K. Mohanty / Journal of Colloid and Interface Science 273 (2004) 611–625
rs
pseismur-d to
-tentm.
tanthister-
te op ofqui-iodhe
chig. 2ula-
ne,mmamoil
ring
ri-to
llfac-thei
r-
y of
lu-idswas
edotthe
er acon-
of
oream–t or
m-be
sidegasthe
theduebyis-m,am
ofdersn aspli-teautheingption
Fig. 2. Disjoining pressure as a function of film thickness. The parameteused arec = 0.001 M andψs = 19 mV.
particulate matter in the air may also initiate foam collain many of the foam applications. However, this mechanof foam collapse is not taken into consideration for the ppose of this study. Bhakta and Ruckenstein [23] attempteincorporate thin film dynamicsby using linear stability theory. However, they found the results physically inconsiswith the requirement for mechanical drainage equilibriuAs a first approximation, they used in their model a conscritical film thickness at which collapse occurs. Under tassumption, the rate at which the collapsing foam–air inface at the top moves could be described by
(24)
dεf
(z = L(t)
) = ∂εf
∂z
∣∣∣∣z1=L(t)
dz1 + ∂εf
∂t
∣∣∣∣z1=L(t)
dt = 0,
or
(25)dL
dt= −
∂εf
∂t∂εf
∂z
∣∣∣∣∣z=L(t), εf =εf,crit
.
It should be noted that Eqs. (24) and (25) describe the rafoam collapse only after the lamella thickness at the tothe column reaches a critical value. The assumption of elibrium plateau border liquid holdup throughout the perof foam collapse ineluctably implies that the liquid from tcollapsed bubbles leaves the foam columninstantaneously.The critical film thickness is the film thickness at whithe disjoining pressure attains an absolute maximum. Fshows the disjoining pressure isotherm used for the simtions.
For foam columns resting on top of a layer of oil/gasolifoam can be destabilized due to additional factors. Schraet al. [31,32] have discussed in detail the interactions of fowith the oils. The important parameters defining foam–interaction are spreading coefficientS (= σf − σof − σo)and entering coefficientE (= σf + σof − σo). The presenceof oil is not expected to destabilize foam when the entecoefficient is negative [33].
In this study, a fluorinated co-surfactant [3] is used pmarily to decrease the surface tension of foam liquidlow values such that the value ofE becomes negative. Afoam solutions used in this study shared common surtants that had surfactant concentrations much above
f
r
critical micelle concentration and their surface tension aveaged 20.5 mN/m at room temperature (22◦C). At the sametemperature, the surface tension of the oil (99.99% assaC6 saturated isomers) was found to be 23.3 mN/m. The oiland foam formulations were equilibrated for 48 h in a vometric ratio of 1:2. The interfacial tension between the fluwas measured using a spinning drop tensiometer andfound to be 1.5 mN/m. Thus, the entering coefficientE is−1.3 mN/m and the spreading coefficientS is −4.3 mN/mfor this foam–oil system. Experimentally, it was observthat the foam column in contact with the oil layer did nbreak up at the foam–oil interface, although a change insize of bubbles at the foam–oil interface was noted aftfew hours, possibly a result of excess pressure due totinuous evaporation of oil. For this reason, no mechanismfoam destabilization in the presence of oil at the oil–foaminterface has been incorporated into the model. In a mgeneral case, where foam destabilization occurs at the fooil interface, this model may overpredict the foam heighthe foam resistance to the mass transfer.
2.5. Mass transfer through the foam column
Unsteady-state material balance for the diffusing coponent in a volume element of the foam column couldwritten as
(26a)∂
∂t
[(1− ε)CA + εf
CA
H
]= ∂
∂z
[Deff
∂(CA)
∂z
]+ Q,
where
(26b)Q = CA
H
∂εf
∂t.
The first two terms inside the brackets on the left-handof Eq. (26a) are the diffusing species holdup in thephase and liquid phase, respectively. The first term onright-hand side of Eq. (26a) is the diffusive flux, andsecond term is the sink term for diffusing hydrocarbonto its removal by film thinning. It should be noted thatincorporating the removal of the diffusing hydrocarbon dsolved in the film liquid through film drainage as a sink terwe neglect the problem of its transport through the focolumn. Essentially, it implies that we assume the ratetransport of the dissolved gas through the plateau boris so rapid that it is removed from the system as sooit reaches the plateau borders. This is obviously a simfication and a consequence of assuming equilibrium plaborder liquid holdup profile to eliminate the need to solveplateau border liquid holdup evolution equation. SimplifyEqs. (26a), and (26b) and making the standard assumfor the dry foams, i.e.,(1− ε) ≈ 1, lead to
(27)
(1+ εf
H
)∂CA
∂t= ∂
∂z
(Deff
∂CA
∂z
)or
(28)∂CA = ∂
(Deff
∂CA)
since
(1+ εf
)≈ 1.
∂t ∂z ∂z H

P.S. Gautam, K.K. Mohanty / Journal of Colloid and Interface Science 273 (2004) 611–625 617
inrsto-ofama
bynot
thesurell itally
bil-ide
adi-ts indndobe
te
tedcanre-
car-ted
ro-sta
liq-ion.heisthehisri-utedialmtri-lds
atic
fto
sagethis
at
n
nd-. Ineepshro-theara-of
tra-ould
ondghoam
Af-ves
ob-
There are two different ways of recasting Eq. (28)terms of mole fractions of the diffusing component. The fipossibility is that the permeability of the diffusing compnent in the foam liquid is comparable to the permeabilityinert gas (air or nitrogen in this case) present in the fobubbles. Any diffusion of the hydrocarbon vapors intofoam bubble, provided the foam bubble is rigid enoughsurfactant adsorption at liquid/gas interface and doeschange its size, will cause bulk diffusion of gases frombubble to the neighboring bubbles. In this case no presgradient builds up inside the foam column and we caequimolar countercurrent diffusion. It can be mathematicexpressed as
(29)∂yA
∂t= ∂
∂z
(Deff
∂yA
∂z
).
At the other extreme, if the foam films have zero permeaity to the inert gas, a pressure gradient will be set up insthe foam column corresponding to the concentration grent of the diffusing species. This pressure variation resulincreased transport and hence this mechanism is calleen-hanced diffusion. Again, if it is assumed that the shape asize of the foam bubbles do not change and the gasesthe ideal gas law, Eq. (28) could be rewritten as
(30)∂yA
∂t= (1− yA)2 ∂
∂z
(Deff
1− yA
∂yA
∂z
).
Note that if the solution of the diffusing species is diluenough, i.e., in the limit ofyA → 0, Eq. (30) reduces toEq. (29). The initial and boundary conditions are presensubsequently for the countercurrent diffusion case andbe easily recasted for the “enhanced diffusion” model byplacingDeff with Deff/(1 − yA). If the foam bubbles wereconsidered to be deformable, the description of the hydrobon diffusion process would become far more complicaand is not attempted in this study.
2.6. Initial andboundary conditions
Narsimhan [21] and Bhakta and Ruckenstein [22] pposed the quasi-steady-state model and the unsteadymodel, respectively, to describe the evolution of foamuid holdup profile during the process of foam generatHowever, if the bubbling time is sufficiently small and tviscosity of the liquid in the foam sufficiently high, whichespecially true for high stability foams, the drainage offoam over the period of its generation would be small. In tstudy, the initial total liquid holdup of the foam was expementally measured and assumed to be uniformly distribthroughout the foam. Following Podual et al. [34], the initfilm liquid holdup is obtained by assuming the initial filthickness to be one-third of the median of an equilateralangle employed to describe the plateau borders. This yie
(31a)ε2f i =
(1
33/2θ2
Vb
n l
)εpb0,
p
y
te
where
(31b)εf i + εpb0 = ε0.
From Eqs. (31a) and (31b), it follows that the initial liquidholdup in the foam could be calculated from the quadrequation
(31c)ε2f i + C1εf i − C1ε0 = 0,
whereC1 = (1/33/2θ2)(Vb/npl). Of course, the choice omaking foam lamellae one-third of the plateau bordersdetermine the initial distribution of the foam liquid into filmand plateau borders is arbitrary. However, the foam drainor mass transfer through the foam is highly insensitive toinitial condition becausethick films drain very rapidly intothe plateau borders.
The concentration of the diffusing species in the foaminitial time is taken tobe zero throughout; i.e.,
(32)yA(t = 0) = 0.
At the oil layer–foam interface, the diffusing hydrocarbospecies is at its equilibrium vapor pressure or
(33)yA(z = 0) = pvap
Patm.
On the top of the foam, at the foam–air interface, the bouary condition for the diffusing species is more interestingour experimental apparatus, the carrier gas (nitrogen) swthe issuing hydrocarbon vapor and takes it to the gas cmatograph for compositional analysis. If it is assumedspace above the foam column in the experimental apptus is a well-mixed system such that the concentrationthe hydrocarbon in the effluent is equal to the concention everywhere inside the system, a material balance wyield
∂yA
∂t= 1
tr
[−yA − D0A
FL0H
(34)×((
εf
εf,ch+ D0
Dg
)−1∂yA
∂ξ
)ξ=L(t)/L0
],
whereD0 = Dl/εf,chH andtr = Vs/F . The first term on theright-hand side of Eq. (34) is the net influx and the secterm is the flux of the hydrocarbon vapor diffusing throuthe foam column and collecting in the space above the fcolumn in the apparatus. Note that the residence timetr ofthe carrier gas is not constant but variable with time.ter onset of the foam collapse, the foam–air interface modown and the residence time increases.
2.7. Dimensionless equations
A characteristic time constant for the system could betained by nondimensionalizing Eq. (29) and is given by
(35)tch = L20 .
D0

618 P.S. Gautam, K.K. Mohanty / Journal of Colloid and Interface Science 273 (2004) 611–625
Fig. 3. Experimental setup for mass transfer experiments.
ar-
ma-
film
entamamond-rvee.,fer-39)s re-tiond to
bil-ameters ofare
s ush isil-yellfac-veshtsionc-
ifier.me-nianeredas
Critical film thickness provides a natural choice for the chacteristic film liquid holdup and is given by
(36)εf,ch = θhf,crit.
The dimensionless equations in the final form are sumrized as follows:
τ = t
tch, εfD = εf
εf,ch, Lh = L0
l,
y∗A = yA
yA0, ξ = z
L0, Bo= ρgl2
σ.
(37)∂εfD
∂τ= β1
β2ε3f DΠDL(θεf ) − ε3
fD
ε1/2pb
− β3HL2
0
Dl.
(38)∂y∗
A
∂τ= ∂
∂ξ
[(εfD + D0
Dg
)−1∂y∗A
∂ξ
].
(39)d(L/L0)
dτ= −
∂εfD
∂τ∂εfD
∂ξ
∣∣∣∣∣ξ=L(t)/L0, εf D=1
.
The last equation (39) comes into effect after the foamat the top of the foam reaches critical thickness.
Initial conditions
(40)εfD = εf i
εf,ch, y∗
A(ξ) = 0.
Boundary conditions
(41)At ξ = 0, y∗A = 1.
At ξ = L(t)
L0,
(42)
∂y∗A
∂τ= −y∗
Atch
tr− tchD0A
VsL0H
×((
εfD + D0
Dg
)−1∂y∗A
∂ξ
).
ξ=L/L0
In the whole treatment, we have neglected the movemof the foam–oil interface at the bottom caused by fodrainage. This assumption may be valid for the dry fostudied here. Eq. (38) was discretized in space using secorder finite differencing in such a way so as to consethe diffusive flux. The resulting system of ODEs, i.Eqs. (37)–(42), was solved using Gear’s backward difencing formula [35]. The condition as specified in Eq. (was checked at every time step and the foam height wacalculated. The grid sizes were reduced until the soluconverged. It was found that 200 grid blocks are requiregenerate a reasonably accurate solution.
3. Experiment
The experimental setup used for studying the bulk staity of foams and mass transfer is shown in Fig. 3. The focell consists of a glass column having an internal diamof 1.4 cm at the bottom and 5 cm at the top. The lengththe bottom narrower region and the upper wider column10 and 45 cm, respectively. This kind of design enableto accurately measure the liquid drainage of foam, whicdifficult to study in a uniform-diameter glass column. A mlimeter graph strip was attached to the cell to enable easreading of the liquid level inside the column. The foam ccontains a valve at the bottom to regulate the flow of surtant solution into the cell. There are two additional valin the lower portion of the cell placed at calculated heigfor charging of nitrogen gas and oil. The foam formulat(similar to that in Ref. [3]) consists of a nonionic surfatant, a fluorinated surfactant, a stabilizer, and a viscosLiquid viscosities were measured using a U-tube viscoter. No attempt was made to ascertain the non-Newtonature of the solution. All the components of the foam wcarefully measured and the aqueous solution was then stirreovernight with a magnetic stirrer. The foam solution w
P.S. Gautam, K.K. Mohanty / Journal of Colloid and Interface Science 273 (2004) 611–625 619
and
heasdi-
oamngeithrger
r ex-fterlyTheas
ato-ro-nt atl-va-
uredd
ithtalulkdayual
e ofllero ob
e–sd-le
nsused
orol-
sedtheRuck-ass-g-ea-elm, theen-thisre-
sure
eliq-oure inh. Asnitialthe
mameis-ce,
ntalw theor-
ef-eatdentat
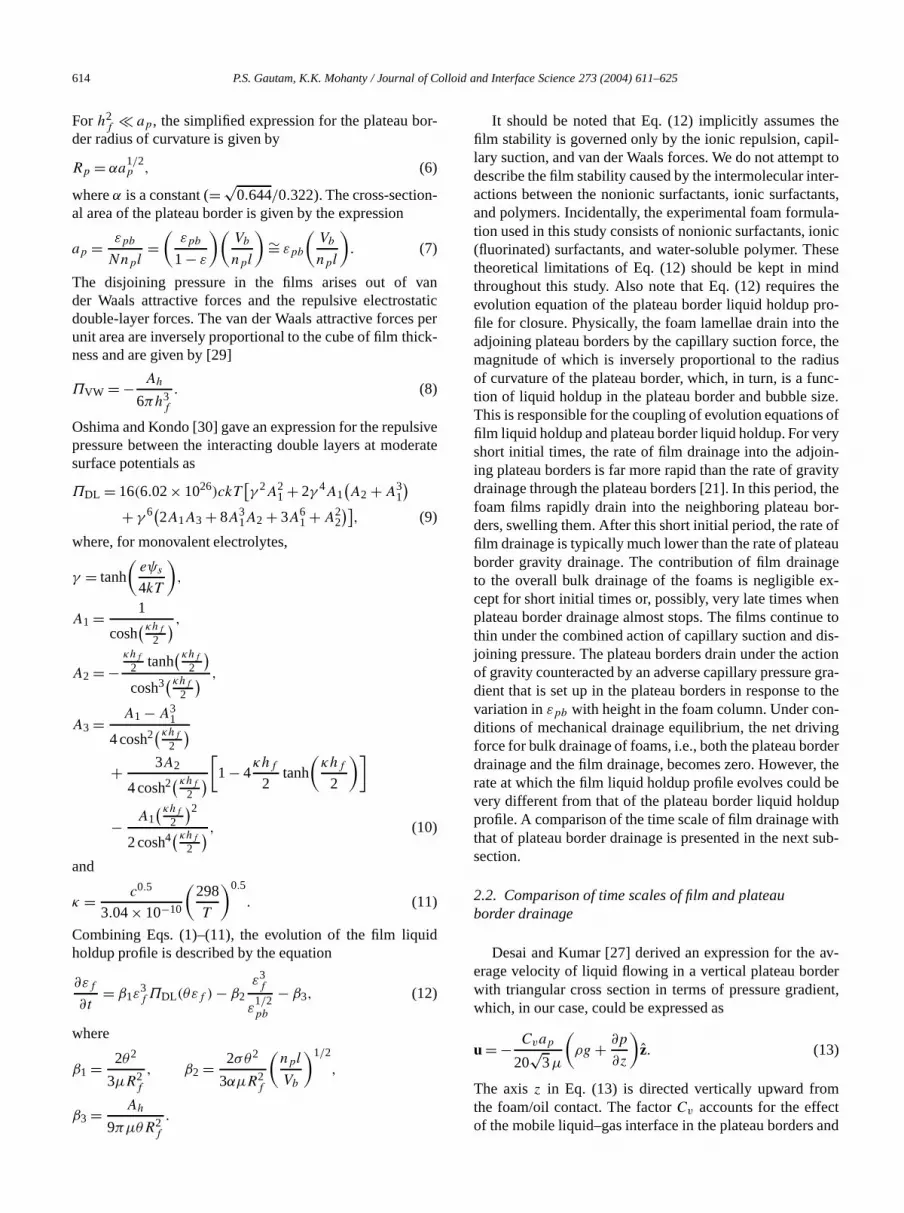
Fig. 4. Bulk drainage of foam. The foam solution viscosity is 18.1 cP,the initial height is 0.32 m.
charged into the cell and the initial height of liquid in tlower narrow portion of the cell was noted. Nitrogen wthen bubbled through the liquid at a constant rate. Theameter of the nozzle generating the foam was 1 mm. Fdrains into the lower, narrow part of the cell and the chain the level of drained liquid–foam interface is recorded wtime. The foam height, which changes over a much latime scale, is also monitored with time.
Commercially available hexane (99.99% assay of C6 sat-urated isomers) was used as oil for the mass-transfeperiments. The oil was introduced into the foam cell amost of the bulk liquid drained out, which is approximate50 min after the foam was generated in most cases.hexane vapor issuing from the top of the foam column wswept by the nitrogen gas and carried to a gas chromgraph for compositional analysis. The flow rate of nitgen gas was controlled by a flowmeter and kept consta4.8±0.2 mL/min during the experiment. After the foam colapsed completely, the concentration of the hydrocarbonpor in the effluent in the absence of any foam was measunder experimental conditions. Experiments were repeateto check the consistency of data.
Fig. 4 shows the bulk drainage of a foam column wan initial height of 32 cm. It is clear that the experimendata obtained are fairly reproducible, at least, for the bdrainage rates. These foams are stable for more than amass transfer data were collected typically over 10 h. Visobservation confirms that most of the foam bubbles arthe similar size, though a significant number of much smabubbles sandwiched between the larger bubbles are alsserved.
4. Comparison of the model with experiments
The bulk diffusivity of then-hexane vaporDl in waterat infinite dilution was calculated at 295 K using the WilkChang correlation as 7.7×10⁻¹⁰ m2/s. The data on Henry’constantH for the surfactant–polymer solution are not reaily available. The ratioDl/H is used as the only adjustabparameter in the simulations by altering the value ofH only
;
-
Fig. 5. Concentration of hexane in the effluent with time for foam columwith initial heights of 0.23 and 0.32 m. The values of the parametersare µ = 8 cP, ρ = 1.03 × 10³ kg/m3, σ = 20.5 mN/m, Rb = 10 mm,H = 7, ε0 = 0.009 (L0 = 0.23 m), andε0 = 0.007 (L0 = 0.32 m).
and keepingDl constant. The diffusivity of the hexane vapin N2 gas was calculated at 295 K using Fuller and cleagues’ correlation [36] and found to be 9.1 × 10⁻⁶ m2/s.Fig. 2 shows the disjoining pressure isotherm at 295 K ufor the purpose of simulations in this study. The values ofparameters are the same as those used by Bhakta andenstein [23], except temperature. It was found the mtransfer results are not significantly affected by increasinor decreasing electrolyte concentration by one order of magnitude and/or altering the double-layer potential in a rsonable range. This could be because the thickness of thfoam lamellae remains comfortably above the critical fithickness throughout the duration of experiment; henceeffect of disjoining pressure is not significant. Experimtally, it was observed that none of the foams used instudy collapsed for at least 10 h and the foam heightmained practically unchanged. The value of vapor presof n-hexane used at 295 K is 0.1732 atm.
Fig. 5 shows the concentration of hexane in the air spacabove the foam column as a function of time for a foamuid viscosity of 8 cP. It takes hexane vapor about an hto appear in the effluent gas. The concentration of hexanthe effluent increases and reaches a plateau at about 8expected, the mass-transfer resistance increases with ifoam height and the concentration of hexane vapor ineffluent decreases. It should be noted that the ratioDl/H
is kept constant in the simulations for varying initial foaheights. Since the foam liquid composition remains the sand the lamellae are thick enough for bulk diffusive restance in the film to dominate over the interface resistanthe ratioDl/H should not depend on initial foam height. Thematch between the model predictions and the experimeresults seems to be reasonably good. Figs. 6 and 7 shoeffect of initial foam heights on mass transfer for foam fmulation viscosities of 18.1 and 65.3 cP, respectively.
Fig. 8 shows the concentration of hexane vapor in thefluent for foam formulations with varying viscosities for thinitial foam height of 0.23 m. It is interesting to observe ththe mass-transfer resistance remains practically indepenof foam formulation viscosity. It was, however, noted th

620 P.S. Gautam, K.K. Mohanty / Journal of Colloid and Interface Science 273 (2004) 611–625
nsused
nsused
-ofere
arela-e,fer
ty ofal-
pocessur-tivehise, th
this
asstrol
rageling
ns
nsm.
lesev-
(21).10 toen-aneria-
ande isu-
ra-keyandpha-
sThethat
Fig. 6. Concentration of hexane in the effluent with time for foam columwith initial heights of 0.23 and 0.32 m. The values of the parametersareµ = 18.1 cP,ρ = 1.03× 10³ kg/m3, σ = 20.5 mN/m, Rb = 10 mm,H = 6.5, ε0 = 0.02 (L0 = 0.23 m), andε0 = 0.016 (L0 = 0.32 m).
Fig. 7. Concentration of hexane in the effluent with time for foam columwith initial heights of 0.23 and 0.32 m. The values of the parametersareµ = 65.3 cP,ρ = 1.03× 10³ kg/m3, σ = 20.5 mN/m, Rb = 10 mm,H = 5.5, ε0 = 0.024 (L0 = 0.23 m), andε0 = 0.018 (L0 = 0.32 m).
the mass-transfer resistance increased slightly with foam formulation viscosity at late times when the concentrationhexane in the effluent attained a plateau. Similar results wobtained for initial foam heights of 15 and 32 cm, whichnot shown here. Intuitively, the more viscous foam formution should result in slower thinning of the foam lamellalowering bulk diffusivity, and, hence, higher mass-transresistance. Xanthan gum was used to alter the viscosithe foam formulation. One conjecture could be that thetered surfactant/polymer ratio decreasesDl/H such that themass transfer resistance shows little change. The secondsibility is that the surfactant layer at the gas–liquid interfacontrols the mass transfer [6]. A better understanding offactant/polymer interaction and its impact on the effecdiffusivity of the foam lamellae is needed to explain texperimental observation. For the reasons stated abovmodel has not been compared against experiments incase.
Fig. 9 shows the effect of bubble size variation on mtransfer. Bubble size is the most difficult parameter to conin our studies. In this study, an attempt to alter the avebubble size of the foam was made by doubling the bubb
s-
e
Fig. 8. Concentration of hexane in the effluent with time for foam columwith an initial height of 0.23 m. The values of the parameters areρ =1.03× 10³ kg/m3, σ = 20.5 mN/m, Rb = 10 mm, andε0 = 0.009, 0.02,0.024 forµ = 8, 18.1, and 65.3 cP, respectively.
Fig. 9. Concentration of hexane in the effluent with time for foam columwith an initial height of 0.23 m but with bubble sizes of 10 and 12 mThe values of the parameters areµ = 18.1 cP, ρ = 1.03 × 10³ kg/m3,σ = 20.5 mN/m,H = 6, andε0 = 0.02 and 0.019 forRb = 10 and 12 mm,respectively.
gas flow rate from 315 to 630 mL/min. The average bubbsize was evaluated by measuring the edge lengths oferal bubbles and using the structural parameters of Eq.The average bubble size was observed to change from12 mm on doubling the bubbling gas flow rate. Experimtally, no significant change in the concentration of hexvapor in the effluent is observed at this bubble size vation. The model predictions for the bubble sizes of 1012 mm almost overlie each other and hence only onshown. A reasonable match isobtained between the simlations and the experimental observations.
5. Parametric analysis of the model and discussion
To fully appreciate the implications of the model, a pametric analysis of the model is necessary. To this end, theparameters were varied and their effect on foam collapsemass-transfer resistance of the foam was studied. We emsize that the results presented below are model implicationand have not been directly validated by experiments.disjoining pressure isotherm used for the simulations isshown in Fig. 2.
P.S. Gautam, K.K. Mohanty / Journal of Colloid and Interface Science 273 (2004) 611–625 621
the
the
ongheramuid
nse-de-y inandeenwit
statof-forever,oams-on-
theub-sultsng
ters
eters
amvely.h-ch
ry’sef-ingtionaddi-pseingce,
up-ses
ol-ol-ckerns,n is
bon
ter-the
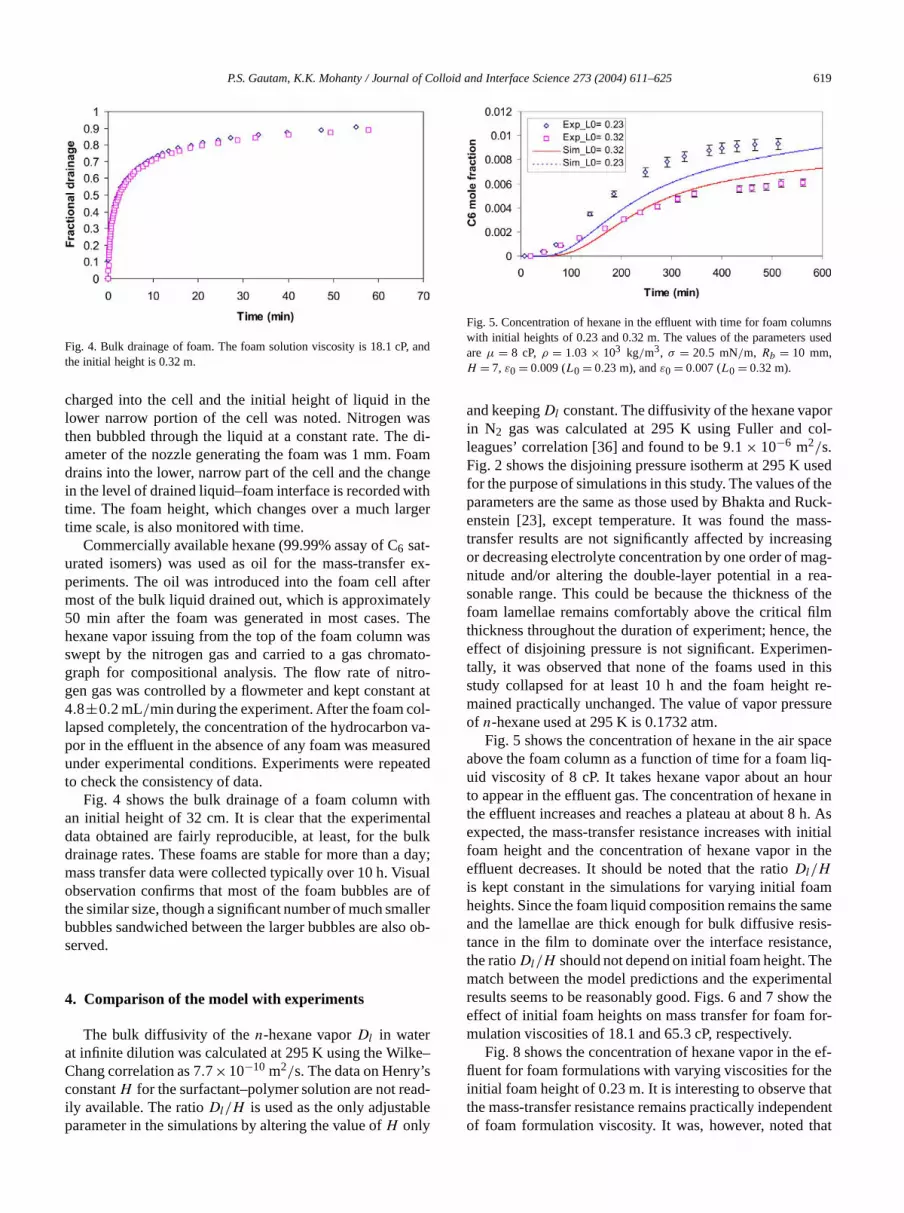
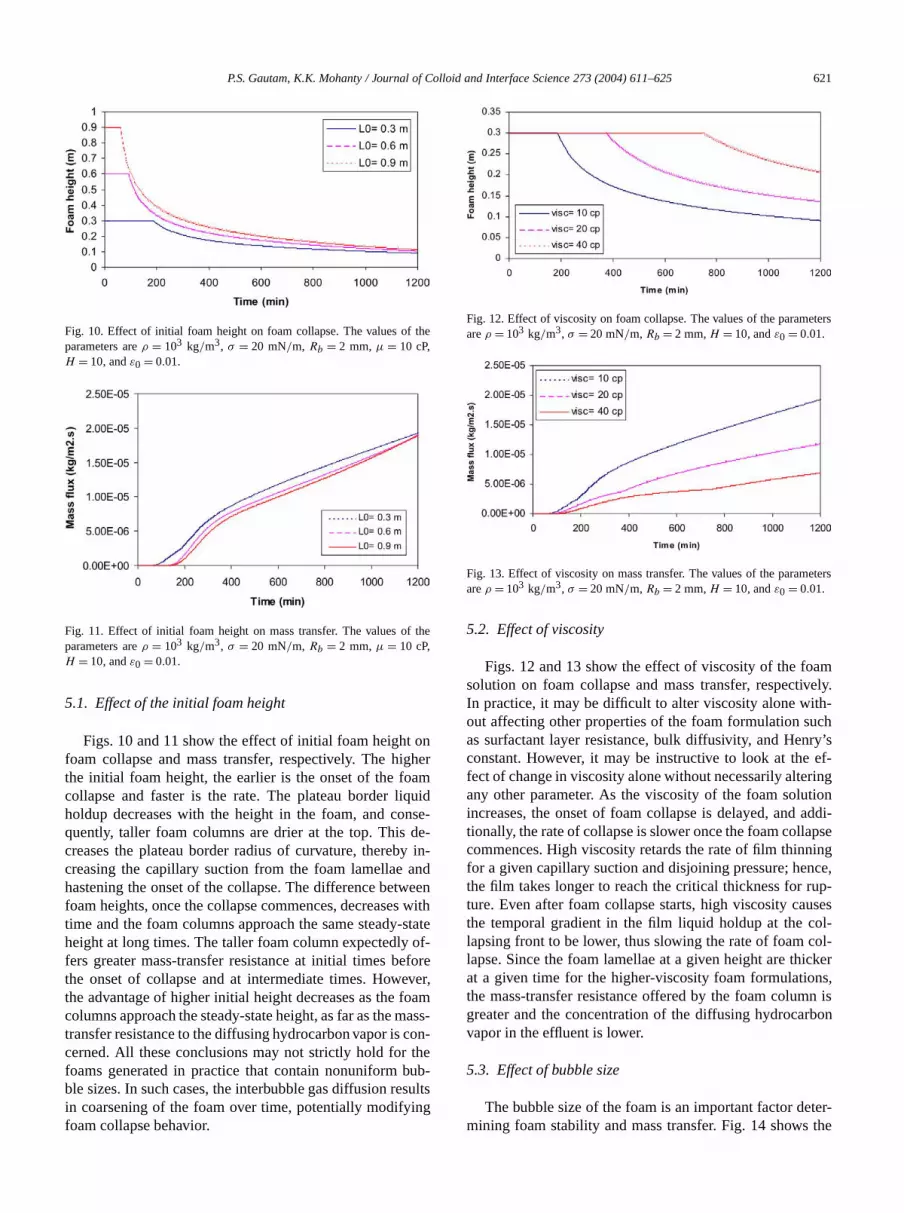
Fig. 10. Effect of initial foam height on foam collapse. The values ofparameters areρ = 103 kg/m3, σ = 20 mN/m, Rb = 2 mm,µ = 10 cP,H = 10, andε0 = 0.01.
Fig. 11. Effect of initial foam height on mass transfer. The values ofparameters areρ = 103 kg/m3, σ = 20 mN/m, Rb = 2 mm,µ = 10 cP,H = 10, andε0 = 0.01.
5.1. Effect of the initial foam height
Figs. 10 and 11 show the effect of initial foam heightfoam collapse and mass transfer, respectively. The hithe initial foam height, the earlier is the onset of the focollapse and faster is the rate. The plateau border liqholdup decreases with the height in the foam, and coquently, taller foam columns are drier at the top. Thiscreases the plateau border radius of curvature, therebcreasing the capillary suction from the foam lamellaehastening the onset of the collapse. The difference betwfoam heights, once the collapse commences, decreasestime and the foam columns approach the same steady-height at long times. The taller foam column expectedlyfers greater mass-transfer resistance at initial times bethe onset of collapse and at intermediate times. Howethe advantage of higher initial height decreases as the fcolumns approach the steady-state height, as far as the mastransfer resistance to the diffusing hydrocarbon vapor is ccerned. All these conclusions may not strictly hold forfoams generated in practice that contain nonuniform bble sizes. In such cases, the interbubble gas diffusion rein coarsening of the foam over time, potentially modifyifoam collapse behavior.
-
he
Fig. 12. Effect of viscosity on foam collapse. The values of the parameareρ = 103 kg/m3, σ = 20 mN/m, Rb = 2 mm,H = 10, andε0 = 0.01.
Fig. 13. Effect of viscosity on mass transfer. The values of the paramareρ = 103 kg/m3, σ = 20 mN/m, Rb = 2 mm,H = 10, andε0 = 0.01.
5.2. Effect of viscosity
Figs. 12 and 13 show the effect of viscosity of the fosolution on foam collapse and mass transfer, respectiIn practice, it may be difficult to alter viscosity alone witout affecting other properties of the foam formulation suas surfactant layer resistance, bulk diffusivity, and Henconstant. However, it may be instructive to look at thefect of change in viscosity alone without necessarily alterany other parameter. As the viscosity of the foam soluincreases, the onset of foam collapse is delayed, andtionally, the rate of collapse is slower once the foam collacommences. High viscosity retards the rate of film thinnfor a given capillary suction and disjoining pressure; henthe film takes longer to reach the critical thickness for rture. Even after foam collapse starts, high viscosity cauthe temporal gradient in the film liquid holdup at the clapsing front to be lower, thus slowing the rate of foam clapse. Since the foam lamellae at a given height are thiat a given time for the higher-viscosity foam formulatiothe mass-transfer resistance offered by the foam columgreater and the concentration of the diffusing hydrocarvapor in the effluent is lower.
5.3. Effect of bubble size
The bubble size of the foam is an important factor demining foam stability and mass transfer. Fig. 14 shows

622 P.S. Gautam, K.K. Mohanty / Journal of Colloid and Interface Science 273 (2004) 611–625
col-
theIn-
doeex-eautionble
mnaturhecifi-
atblepil-filmthethelesblesinameter. 15andave
les;-
umnn in
ithsuchr forclu-mss.
eters
rs
del
onuldde-
e astwoex-assvenow-
t be
ghpre-
ter.et ofamf
amsdif-s not
Fig. 14. Effect of bubble size on mass transfer for foams that do notlapse in 1200 min. The values of the parameters areρ = 103 kg/m3, σ =20 mN/m, L0 = 0.3 m,µ = 20 cP,H = 10, andε0 = 0.01.
effect of bubble size variation on the mass transfer whenfoams do not collapse during the period of observation.terestingly, we observe that mass transfer essentiallynot change significantly with bubble size. This can beplained as follows: The radius of curvature of the platborders, which determines the strength of capillary sucfrom the foam lamellae, depends very weakly on bubsize. As bubble size increases, the equilibrium liquid holdupin the plateau borders at a given height in the foam coludecreases; and since the plateau border radius of curvis a function of both bubble size and liquid holdup in tplateau borders, it does not change significantly. Specally, using Eqs. (6), (7), and (23), forξ � (BoLh)
−1, leadsto
(43)Rp = α′ σ
ρgL0ξ.
The typical values ofBo andLh are large enough so ththe radius of curvature is practically independent of bubsize for almost the entire foam column. Although the calary suction remains approximately the same, the rate ofthinning is lower for the larger bubbles since the area offilm is larger, as can be seen from Eq. (2a). However,smaller film thickness in the case of smaller foam bubbis adequately compensated by a larger number of bubin a unit volume. The net effect is very little differencemass flux for differing bubble sizes before the onset of focollapse. However, bubble size becomes an important dminant of mass flux after the foam starts collapsing. Figsand 16 show the effect of bubble size on foam collapsemass transfer. The foams with smaller bubble sizes hthinner films compared with the foams with larger bubbhence, they start collapsingearlier. Once foam collapse commences, the mass-transfer resistance of the foam colwith smaller bubble size deteriorates rapidly as showFig. 16. The onset of foam collapse is delayed for foams wlarger bubble size and the rate of collapse is also slowerthat they retain their resistance to diffusive mass transfelonger durations. It may be pointed out that these consions are subject to appropriate modification for the foagenerated in practice containing nonuniform bubble size
s
e
-
s
Fig. 15. Effect of bubble size on foam height. The values of the paramareρ = 103 kg/m3, σ = 20 mN/m, L0 = 0.3 m, µ = 10 cP,H = 10, andε0 = 0.01.
Fig. 16. Effect of bubble size on mass transfer. The values of the parameteareρ = 103 kg/m3, σ = 20 mN/m, L0 = 0.3 m, µ = 10 cP,H = 10, andε0 = 0.01.
5.4. Countercurrent diffusion vs. enhanced diffusion mo
While discussing the mode of diffusion of hydrocarbvapor through a foam column, we showed that there cobe two possible modes: a countercurrent diffusion modescribed by the Eq. (29), and an “enhanced diffusion” modexpressed in Eq. (30). Fig. 17 shows a comparison of themodels of diffusion for the case under consideration. Aspected, the “enhanced diffusion” model predicts higher mtransfer through the foam column. The contrast will be egreater for the higher vapor pressures of hydrocarbon. Hever, for the dilute solution of hydrocarbon vapor in N2, themass-transfer rates predicted by the two models will novery different.
6. Conclusions
A model for diffusive mass transfer of VOCs throuan aqueous collapsing foam is developed. The modeldicts that the initially taller foam columns collapse fasTheir mass-transfer resistance is higher before the onscollapse, but not very different from that of shorter focolumns at long times. If the solubility and diffusivity othe hexane gas in the foam liquid are unaffected, the fowith higher viscosities persist longer and provide greaterfusive mass-transfer resistance. Foam bubble size doe

P.S. Gautam, K.K. Mohanty / Journal of Colloid and Interface Science 273 (2004) 611–625 623
-
l-withs ain-ablylewaex-
he
thel inughble,-orteculeayfac-uleonoghhiny
mn
e inFor
top-thetelyethatesatffec-lm
pro-uch
is
gefi-
s
e
-
Fig. 17. Comparison of countercurrentdiffusion model with enhanced diffusion model. The values of the parameters areρ = 103 kg/m3, σ =20 mN/m, Rb = 4 mm,L0 = 0.3 m,µ = 20 cP,H = 10, andε0 = 0.01.
significantly impact mass-transfer resistance of the foam coumn before the onset of foam collapse. However, foamssmaller bubbles collapse earlier and their ability to act amass-transfer barrier to diffusing hydrocarbon vapor dimishes rapidly. The experimental results compared reasonwith the model for varying initial foam heights and bubbsizes. The film surfactant layer mass-transfer resistanceneglected in the model, but seems to be important in theperiments.
Acknowledgment
This work was partially supported by funding from tTexas Hazardous Waste Research Center.
Appendix A. Derivation of effective diffusivity
Fig. 1 shows the diffusion of a hydrocarbon gas fromcenter of one bubble to another, all of which are equasize. The hydrocarbon molecule must first diffuse throthe dispersed phase, i.e., the bulk gas filling the foam bubto reach the interface. At the interface, the diffusing component dissolves into the aqueous phase and is then transpthrough the adsorbed surfactant monolayer. The molethen diffuses through the bulk liquid in the film, which mor may not be microstructured depending on the surtant/polymer type and concentration. The diffusing moleconce again permeates through the adsorbed surfactant mlayer on the other side of the film and finally diffuses throuthe gaseous phase in the next foam bubble before reacits center. Let us replace the interface resistance provided bthe adsorbed surfactant monolayer of thicknessδ by a bulkaqueous film at the interface of thicknessδ∗ having equiva-lent resistance. Then, at steady state,
(A.1)
NA = Deff(C1 − C2)
2(hw + δ + Rb)= C1 − C1g
Rb/Dg
= C1L − C′1L
δ∗/Dl
= C′1L − C′
2L
2h /D= C′
2L − C2L
δ∗/D= C2g − C2
R /D,
w l l b g
s
d
-
g
(A.2)C1L = C1g
H,
(A.3)C2L = C2g
H,
whereNA is the molar flux of the diffusing component. FroEqs. (A.1)–(A.3) it follows that the effective diffusivity cabe written as
(A.4)1
Deff=
(Rb
Rb + hw + δ
)1
Dg
+(
hw + δ∗
hw + δ + Rb
)H
Dl
.
Now the first term in parentheses on the right-hand sidEq. (A.4) is the holdup of the gas for this simple system.dry cellular foams, the gas volume fraction is very closeunity. If (δ, δ∗) � hw, which would indeed be a good aproximation unless the aqueous foam film is too thin,second term in parentheses in Eq. (A.4) is approximaequal to the film liquid holdup. In case the diffusivity of thgas molecule in the adsorbed monolayer were equal toin aqueous bulk, orδ = δ∗, the second term in parenthesin Eq. (A.4) would be identical to the film liquid holdup,least for this simple case. With these assumptions, the etive diffusivity of the hydrocarbon gas through the foam fiis given by
(A.5)1
Deff= 1− ε
Dg
+ εf H
Dl
.
If, however, the adsorbed monolayer of the surfactantsvides most of the resistance to diffusive mass transfer sthatδ∗ � δ � hw, then Eq. (A.4) could be written as
(A.6)hw + δ∗
hw + δ + Rb
≈ δ∗
Rb
= δDl
RbDml
≈ εf Dl
Dml
.
The effective diffusivity of the foam lamellae for this casegiven by
(A.7)1
Deff= 1− ε
Dg+ εf H
Dml.
Appendix B. Nomenclature
Ah Hamaker’s constant of the foam lamellaeAf area of the foam lamellaeap cross-section area of the plateau borderBo Bond numberCv velocity coefficient, defined as the ratio of avera
velocity through the plateau border to that for innite surface viscosity
c molar concentrationDeff effective diffusivity of HC vapors through foamDg bulk diffusivity of HC vapors through non-HC ga
inside the bubbleDl bulk diffusivity of HC vapors through liquid phas
in the foam lamellaeDml diffusivity of the diffusing component in the ad
sorbed surfactant monolayere charge on an electron

624 P.S. Gautam, K.K. Mohanty / Journal of Colloid and Interface Science 273 (2004) 611–625
-
am
e
er-ctan
e
rsin
in
m
the
r
am
mpo-
3
.8.20
24
i. 54
124
01)
3th02,
Eur.
r 14
ed.,
E entering coefficientF volumetric flow rate of carrier gasg gravitational acceleration constantH Henry’s constanthf lamella thicknesshf,crit critical lamella thicknessK Boltzmann’s constantl length of plateau borderL height of foamL0 initial height of foam columnLh length numberN number of foam bubbles per unit volumenf number of films per bubble,= 6 for bubble geome
try considerednp number of plateau borders per bubble,= 10 for the
geometry consideredp pressure in the plateau borderPatm atmospheric pressurepg pressure in the gas phasepvap vapor pressure of the diffusing componentRb bubble radiusRf radius of the foam lamellaeRp radius of curvature of the plateau borderS spreading coefficientt timeT absolute temperaturetr residence time of carrier gasVb volume of the bubbleVs volume of the space in the foam cell above the fo
available for flow of carrier gasyA mole fraction of the diffusing component AyA0 mole fraction of diffusing component A at th
foam/oil interface (z = 0)z1 location of the collapsing foam–air interface
Greek letters
α constant (2.492)α′ constant (2.188)β1 double-layer repulsion coefficientβ2 capillary suction coefficientβ3 van der Waals attraction coefficientδ thickness of the adsorbed monolayerδ∗ equivalent thickness of the aqueous film off
ing the same resistance as the adsorbed surfamonolayer
ε volume fraction of total liquid holdup in the foamε0 initial volume fraction of total liquid holdup in th
foamεpb volume fraction of liquid holdup in plateau bordeεpb,ch characteristic volume fraction of liquid holdup
plateau bordersεpb,eqb characteristic volume fraction of liquid holdup
plateau bordersεf volume fraction of liquid holdup in filmsεf,crit critical volume fraction of liquid holdup in films
t
εf i volume fraction of initial liquid holdup in filmsεL volume fraction of liquid at the bottom of the foa
column at foam–liquid contactσ surface tension of the foam solutionσo surface tension of the oilσof interfacial tension between the foam liquid and
oilκ inverse of Debye lengthµ bulk viscosity of the foam solutionθ foam structure parameter,= Vb/(nf Af )
ψs electrostatic surface potential of the double layeρ density of the foam solution, kg/m3
ρg density of the gas, kg/m3
τ dimensionless timeξ dimensionless distance from the bottom of the fo
References
[1] Corino, et al., U.S. Patent 3,639,258 (1972).[2] Canevari, et al., U.S. Patent 3,850,206 (1974).[3] Thach, et al., U.S. Patent, 5,296,164 (1994).[4] M. Dalland, J.E. Hanssen, in: Proceedings, SPE International Sy
sium on Oil Field Chemistry, Houston, TX, 1999, SPE 50755.[5] K. Mannhardt, J.J. Novosad, L.L. Schramm, SPE Res. Eng. Eval.
(2002) 23.[6] P.N. Quoc, P.L.J. Zitha, P.K. Currie, J. Colloid Sci. 248 (2002) 467[7] A.C. Brown, W.C. Thuman, W.I. McBain, J. Colloid Sci. 8 (1953) 50[8] H.M. Princen, J.Th.G. Overbeek, S.G. Mason, J. Colloid Sci.
(1965) 353.[9] H.M. Princen, J.Th.G. Overbeek, S.G. Mason, J. Colloid Sci.
(1967) 125.[10] D. Weaire, S. Hutzler, Physica A 257 (1998) 264.[11] G. Nishioka, S. Ross, J. Colloid Interface Sci. 81 (1981) 1.[12] G. Narsimhan, E. Ruckenstein, Langmuir 2 (1986) 494.[13] S.A. Magrabi, B.Z. Dlugogorski, G.J. Jameson, Chem. Eng. Sc
(1990) 4007.[14] R. Lemlich, Ind. Eng. Chem. Fundam. 17 (1978) 89.[15] D.S.H.S.R. Sarma, J. Pandit, K.C. Khillar, J. Colloid Interface Sci.
(1988) 339.[16] S.A. Magrabi, B.Z. Dlugogorski, G.J. Jameson, AIChE J. 47 (20
314.[17] S. Hartland, A.D. Barber, Trans. Inst. Chem. Eng. 52 (1974) 43.[18] D. Desai, R. Kumar, Chem. Eng. Sci. 38 (1983) 1525.[19] W.R. Rossen, SPE J. 4 (1999) 409.[20] D. Tanzil, G.J. Hirasaki, C.A. Miller, in: Proceedings, SPE/DOE 1
Symposium on Improved Oil Recovery, Tulsa, OK, April 13–17, 20SPE 75176.
[21] G. Narsimhan, J. Food Eng. 14 (1991) 139.[22] A. Bhakta, E. Ruckenstein, Langmuir 11 (1995) 1486.[23] A. Bhakta, E. Ruckenstein, Langmuir 12 (1996) 3089.[24] P. Grassia, J.J.L. Cilliers, S.J. Neethling, E. Ventura-Medina,
Phys. J. E 6 (2001) 325.[25] S.J. Neethling, H.T. Lee, J.J.L. Cillier, J. Phys. Condens. Matte
(2002) 331.[26] O. Reynolds, Phil. Trans. R. Soc. London Ser. A 177 (1886) 157.[27] D. Desai, R. Kumar, Chem. Eng. Sci. 37 (1982) 1361.[28] R.A. Leonard, R. Lemlich, AIChE J. 11 (1965) 18.[29] D.F. Evans, H. Wennerstrom, The Colloidal Domain, second
Wiley–VCH, New York, 1999.

P.S. Gautam, K.K. Mohanty / Journal of Colloid and Interface Science 273 (2004) 611–625 625
3).ial
and
[30] H. Oshima, T. Kondo, J. Colloid Interface Sci. 122 (1988) 591.[31] L.L. Schramm, A.T. Turta, J.J. Novosad, SPE Reservoir Eng. 8 (199
201.[32] L.L. Schramm, J.J. Novosad, Colloids Surf. 46 (1990) 21.[33] S. Ross, J. Phys. Colloid Chem. 54 (1950) 429.
[34] K. Podual, R. Kumar, K.S. Gandhi, Chem. Eng. Sci. 51 (1996) 1393[35] C.W. Gear, Numerical Initial Value Problems in Ordinary Different
Equations, Prentice–Hall, New York, 1971.[36] R. Reid, J. Prausnitz, T.K. Sherwood, The Properties of Gases
Liquids, third ed., McGraw–Hill, New York, 1977.