rhodamine b removal with activated carbons obtained from lignocellulosic waste
TRANSCRIPT

lable at ScienceDirect
Journal of Environmental Management 155 (2015) 67e76
Contents lists avai
Journal of Environmental Management
journal homepage: www.elsevier .com/locate/ jenvman
Rhodamine B removal with activated carbons obtained fromlignocellulosic waste
Viviane da Silva Lacerda a, Juan B. L�opez-Sotelo a, Adriana Correa-Guimar~aes a,Salvador Hern�andez-Navarro a, Mercedes S�anchez-B�ascones a, Luis M. Navas-Gracia a,Pablo Martín-Ramos b, Jesús Martín-Gil a, *
a Department of Agricultural and Forestry Engineering, ETSIIAA, Universidad de Valladolid, Avenida de Madrid 44, 34004 Palencia, Spainb Department of Agricultural and Environmental Sciences, Higher Polytechnic School of Huesca, Universidad de Zaragoza, Carretera de Cuarte s/n, 22071Huesca, Spain
a r t i c l e i n f o
Article history:Received 28 November 2014Received in revised form2 March 2015Accepted 5 March 2015Available online
Keywords:Acrocomia aculeataActivated carbonAdsorptionCopernicia pruniferaPinus pineaRhodamine B
* Corresponding author.E-mail address: [email protected] (J. Mar
http://dx.doi.org/10.1016/j.jenvman.2015.03.0070301-4797/© 2015 Elsevier Ltd. All rights reserved.
a b s t r a c t
By-products from the wax production process from carnauba palm (leaves), from the extraction of oilfrom macauba seeds (endocarp) and from pine nut production (shell) have been assessed for activatedcarbon production, using H3PO4 or CaCl2 for their chemical activation. The resulting activated charcoalshave been thoroughly characterized by elemental and thermal analysis, X-ray diffraction, infraredspectroscopy, electron scanning microscopy and N2 adsorption behavior. Subsequently, their adsorptioncapacity for the removal of rhodamine B (RhB) from aqueous solutions has been evaluated by studyingdifferent parameters: contact time, pH, adsorbent dose, initial dye concentration and solution temper-ature. The adsorption of RhB followed Freundlich's model in all cases. Kinetic studies indicate that thepseudo-second order model can be used for describing the dynamics of the adsorption process. Ther-modynamic parameters have also been evaluated, indicating its endothermic and spontaneous nature.Finally, a preliminary analysis of the impact of cellulose content in the carbon precursor materials hasbeen conducted, by using a mixture of native cellulose with one of the lignocellulosic materials.
© 2015 Elsevier Ltd. All rights reserved.
1. Introduction
Synthetic dyes are widely used in industries, producing alarge amount of toxic, carcinogenic, mutagenic, bio-accumulativewastewaters that pollute the environment (Chen et al., 2010) andwhich have been deemed as one of the most important groups ofcontaminants for the aquatic environment (Hosseini et al., 2011).Dyes are difficult to remove by conventional wastewater purifi-cation treatments due to their high stability against light, tem-perature, chemical and microbial attacks (Forgacs et al., 2004).Wastewater from industries also are contaminated by heavymetals (Lo et al., 2012), causing severe poisoning due to theirhigh solubility in water and their non-biodegradability (Zainiet al., 2010). One of the most widely used products for theremoval of these pollutants are activated carbons (activatedcharcoals), which can be produced from agricultural residues
tín-Gil).
such as pecan nut shell (Bansode et al., 2004; Klasson et al.,2009; Ng et al., 2003), leather waste (Kong et al., 2013), olive-waste cake (Baccar et al., 2009), grass clippings, horse manure(Hao et al., 2013), rice husk waste (de Luna et al., 2013), etc.
The adsorption technique is used for the treatment of industrialeffluents, and activated carbon is extensively used for the removalof many pollutants, but it has the disadvantage of having a highassociated cost. Consequently, other low-cost materials have beenproposed as alternatives, in particular residual biomass, which is anatural biodegradable renewable product, with a minimum asso-ciated cost and which also has good adsorption properties forcontaminants, either metals or chemical compounds (Paraskevaet al., 2008).
The adsorption involves the separation of a substance, followedby its accumulation or concentration on the surface of anothermaterial (Metcalf and Eddy, 2003). Activated charcoal of plantorigin is a versatile adsorbent of great economic interest for thetreatment of water, either for human consumption or for industrialpurposes.
The aim of this research has been to find an efficient way to

V. da Silva Lacerda et al. / Journal of Environmental Management 155 (2015) 67e7668
produce, characterize and use activated charcoals obtained fromthree little exploited lignocellulosic waste materials (fromCopernicia prunifera, Acrocomia aculeata and Pinus pinea) for theadsorption of contaminants in wastewaters, taking Rhodamine-B(RhB) as a representative -and particularly harmful- example ofindustrial pollutant dye. The effect of impregnation of the rawmaterials with H3PO4 and CaCl2 has been assessed, together withthe impact of variations of the pH, concentration of adsorbate,contact time, temperature and adsorbent dose on the efficiencyof the adsorption process. Rhodamine-B adsorption mechanismshave been analyzed through isotherms, kinetic and thermody-namic studies. Moreover, the effect of the cellulose content in theprecursor materials on the RhB removal capability of theresulting activated charcoals has been evaluated by its artificialincrease with native cellulose for the first time.
2. Materials and methods
2.1. Precursor materials
Carnauba palm (C. prunifera) leaves from Ceara (Brazil), mac-auba palm (A. aculeata) endocarp from Minas Gerais (Brazil) andstone pine (P. pinea) nut shells from Valladolid (Spain) have beenselected as precursor lignocellulosic materials (da Silva Lacerdaet al., 2015). Commercial native cellulose was supplied by Merck.Phosphoric acid (H3PO4, 85%) and hydrochloric acid (HCl, 37%) werepurchased from Panreac, and calcium chloride (CaCl2, anhydrous,>93%) from Sigma Aldrich.
2.2. Activated carbon preparation
The chemical activation of the lignocellulosic raw materials wascarried out using phosphoric acid and calcium chloride. Prior to theimpregnation of the materials, they were washed with deionizedwater until constant pH and then were grounded on a Retsch ZM-100 ultra centrifugal mill to a particle size <0.25mm. Subsequently,the materials were impregnated with solutions of phosphoric acid(1 M) and calcium chloride (1 M), using 8 g of each lignocellulosicproduct in 100 mL of the respective solutions (H3PO4-1 M andCaCl2-1 M) for 24 h. After impregnation, the samples were filteredand dried at room temperature for 24 h. The carbonization of thematerials was conducted in a Mufla Digital oven mod. 10-PR/300 at500 �C for 1 h under N2 atmosphere. The materials resulting fromcarbonization were washed with 50 mL of hydrochloric acid (1 M)for 1 h and sonicated for 10 min in a JP Selecta ultrasonic cleaningbath, and then filtered and washed with deionized water untilchlorides complete elimination and constant pHwere attained. Thecharcoals were finally dried to remove all moisture. Aforemen-tioned washing process is essential in order to remove the chemicalactivating agents, allowing higher porosity (Pel�aez-Cid and Teutli-Le�on, 2012).
2.3. Physico-chemical characteristics of the activated carbons
The behavior of the impregnatedmaterials against pyrolysis wasstudied in a Mettler Toledo TGA/SDTA851e/SF/1100 thermalanalyzer, by heating the samples from 25 to 830 �C at a 25 �C/minrate under nitrogen atmosphere. The sample weights were in the9.5e10.5 mg range, each of them determined with 0.01 mgprecision.
C, H and N contents were measured using a Leco CHN-600Elemental Analyzer. Since ash and metal contents are low forthese lignocellulosic materials, the oxygen content was calculatedby subtraction, following a procedure analogous to that of Pastor-Villegas et al. (2006).
The content of cellulose, hemicellulose and lignin was deter-mined for each of the precursor materials as follows: the insolublelignin content was calculated according to ANSI/ASTM standard(ANASI and ASTM, 1977) and holocellulose(hemicelluloseþ cellulose) was obtained after delignification of thesample and its content was determined using the techniquedescribed by Browning (1967). Cellulose content was determinedaccording to ANSI/ASTM procedure (ANSI and ASTM, 1977) andhemicellulose content was then calculated by subtraction of cel-lulose content to that of holocellulose.
Structural characterization of the charcoals by X-ray powderdiffraction was carried out in a Bruker D8 Advance Bragg-Brentanodiffractometer, in reflection geometry. The diffractograms wererecorded with 2q sweep angles in the 5e70� range at 0.02 (2q/sec)speed with 2 s exposure time.
The functional groups present on the surface were determinedby infrared spectroscopy using a Thermo Nicolet 380 FT-IR appa-ratus equipped with a Smart Orbit Diamond ATR system.
The pore structure of the samples was characterized by nitrogenadsorption-desorption at 77 K using a Micromeritics ASAP 2020surface area and porosity analyzer. Prior to the analysis, sampleswere degassed for 2 h under vacuum at 393 K.
The surface morphology was studied by scanning electron mi-croscopy (SEM) in a FEI Quanta 200F apparatus.
2.4. RhB adsorption assays
Batch adsorption experiments were conducted to investigatethe adsorption of Rhodamine B on the various activated carbons. Alldeterminations were performed in triplicate biological replications,and the reported values correspond to the average.
To analyze the effect of pH on RhB adsorption, experiments werecarried out at initial pH values ranging from 2 to 10. The initial pHwas controlled by the addition of dilute HCl or NaOH solutions. Theeffect of the dose of adsorbent was studied by varying the amountof carbon in the solution (from 2 to 8 g/L). The influence of contacttime was assessed by using the same dye concentration andchanging the contact time from 5 to 240 min. The impact of theinitial dye concentration was determined by isotherms at 25, 35and 45 �C, varying the initial dye concentrations from 65 to 140mg/L while keeping the dose of adsorbent and the contact time fixed.Finally, with a view to determining to what extent the amount ofcellulose in the precursor materials affected the RhB adsorptioncapacity, a preliminary study has been conducted by mixingdifferent amounts of native cellulose (0 wt.%, 20 wt.% and 50 wt.%)with one of the lignocellulosic materials (pine nut shell) andcomparing the percentage of removal of RhB for each the resultingactivated charcoals. The aim of adding such native cellulose was toartificially increase the cellulose content prior to the activationphase (with H3PO4).
Rhodamine B concentrations in the solution before and afteradsorption were determined with a Hitachi U-2001 UVevis spec-trophotometer at 552 nm. The amount adsorbed per unit mass ofbiosorbent (mg/g) is calculated using the following equation (Eq.(1)):
qt ¼ ½VðC0 � CtÞ�=m (1)
where C0 (mg/L) is the initial concentration, Ct (mg/L) is the con-centration in the liquid phase at time t, V (L) the volume of thesolution andm (g) themass of adsorbent. In equilibrium conditions,qt ¼ qe and Ct ¼ Ce.
V. da Silva Lacerda et al. / Journal of Environmental Management 155 (2015) 67e76 69
3. Results and discussion
3.1. Activated carbon characterization
The C, H, O and N content (% dry matter) of the precursor ma-terials and their corresponding activated charcoals are summarizedin Table S1. As expected, the carbon content is increased bycarbonization (e.g., for carnauba leaves, it increases from 45.40% to72.03% when impregnated with CaCl2 or to 67.61% when impreg-natedwith H3PO4). The lownitrogen content formacauba endocarp(0.03%) and pine nut shell (0.03%) ensures low NOx emissionsduring the activated carbons preparation, while higher emissionscan be expected for carnauba leaves (3.40%). The highest oxygencontent in the precursor materials corresponds to carnauba leaves(48.7%), followed by pine nut shell (45.4%) and macauba endocarp(41.2%). These values are similar to those of other precursor mate-rials or hardwoods such as those of white oak (42%) or yellowpoplar (47.3%) (Jagtoyen and Derbyshire, 1998). It is worth notingthat during the carbonization process, oxygen is consumed and thisreduces its content in the carbonized materials to values between17.94% and 26.93%.
The cellulose, hemicellulose and lignin contents are summa-rized in Table S2. The highest cellulose content corresponds tocarnauba leaves (37.5%), followed by pine nut shell (30.9%) andmacauba endocarp (29.7%).
For all the charcoals under study, the X-ray powder diffractionpatterns (Figure S2) show the presence of broad peaks, indicatingthat most of the samples are amorphous, which is a typical char-acteristic of porous adsorbents (Bouchelta et al., 2008). However,some peaks arise sporadically in the profile for the activated carbonobtained from carnauba leaves treated with H3PO4 (C_carnau-ba_H3PO4) and to a lesser extent in those of the carbons obtainedfrom carnauba leaves treated with CaCl2 (C_carnauba_CaCl2) andfrom pine nut shell treated with H3PO4 (C_pine_nut_shell_H3PO4),indicating the presence of a small fraction of crystalline material.
The chemical structure and functional groups of the preparedactivated carbons have been studied by ATR-FTIR spectroscopy(Figure S3). The spectra can be interpreted on the basis of thecharacteristic vibration frequencies of the most common functionalgroups and structural components. The band at 2356 cm-1, presentin the coal derivatives obtained from macauba (for both impreg-nations), can be assigned to carboneoxygen groups due to thepresence of the ketone group or to CO2 contamination. The band ataround 1600 cm-1, present in all the activated carbons, can beattributed to aromatic rings or to C]C bonds and involves thepresence of carbonyl groups and the aromatization of the precursor(Guo and Rockstraw, 2007). All charcoals also exhibit wide bands inthe 1000e1300 cm�1 range, with a maximum at 1160 cm�1, due toabsorption caused by oxidized carbons and to the presence of CeOstretching vibrations in acids, alcohols, phenols, ethers and esters(Freeman and Gimblett, 1988). Although this band was observed inall the spectra, it is more intense in the H3PO4 impregnated
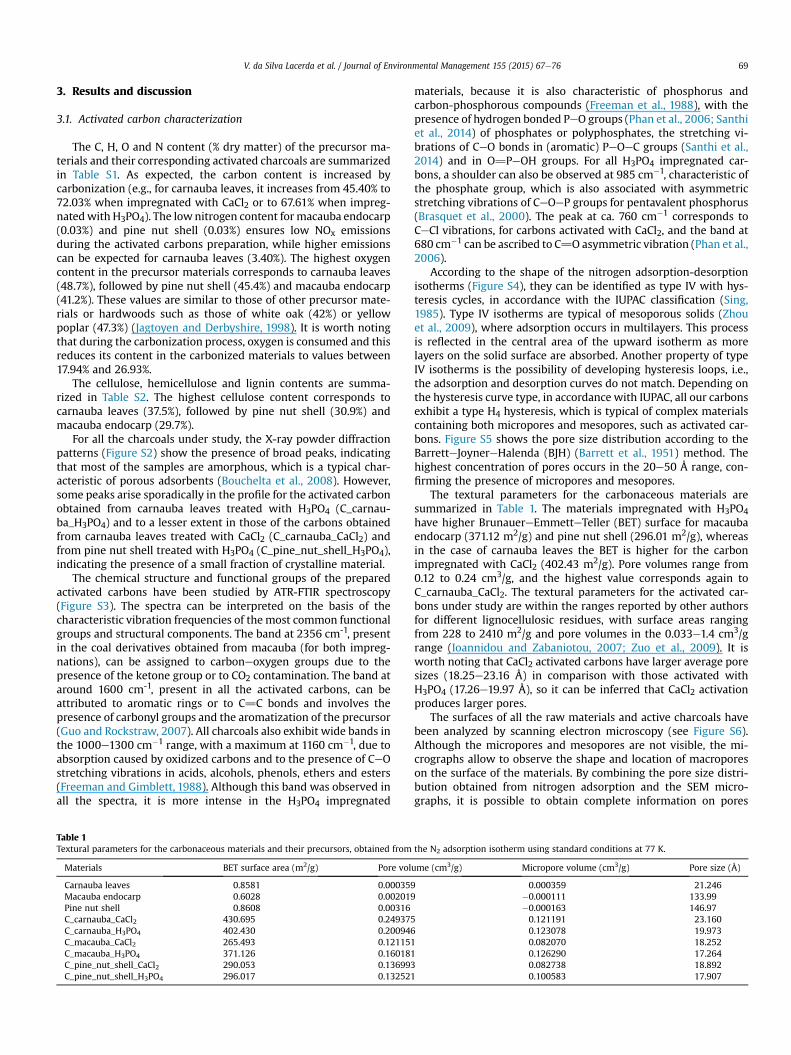
Table 1Textural parameters for the carbonaceous materials and their precursors, obtained from
Materials BET surface area (m2/g) Pore vol
Carnauba leaves 0.8581 0.000359Macauba endocarp 0.6028 0.002019Pine nut shell 0.8608 0.00316C_carnauba_CaCl2 430.695 0.249375C_carnauba_H3PO4 402.430 0.200946C_macauba_CaCl2 265.493 0.121151C_macauba_H3PO4 371.126 0.160181C_pine_nut_shell_CaCl2 290.053 0.136993C_pine_nut_shell_H3PO4 296.017 0.132521
materials, because it is also characteristic of phosphorus andcarbon-phosphorous compounds (Freeman et al., 1988), with thepresence of hydrogen bonded PeO groups (Phan et al., 2006; Santhiet al., 2014) of phosphates or polyphosphates, the stretching vi-brations of CeO bonds in (aromatic) PeOeC groups (Santhi et al.,2014) and in O]PeOH groups. For all H3PO4 impregnated car-bons, a shoulder can also be observed at 985 cm�1, characteristic ofthe phosphate group, which is also associated with asymmetricstretching vibrations of CeOeP groups for pentavalent phosphorus(Brasquet et al., 2000). The peak at ca. 760 cm�1 corresponds toCeCl vibrations, for carbons activated with CaCl2, and the band at680 cm�1 can be ascribed to C]O asymmetric vibration (Phan et al.,2006).
According to the shape of the nitrogen adsorption-desorptionisotherms (Figure S4), they can be identified as type IV with hys-teresis cycles, in accordance with the IUPAC classification (Sing,1985). Type IV isotherms are typical of mesoporous solids (Zhouet al., 2009), where adsorption occurs in multilayers. This processis reflected in the central area of the upward isotherm as morelayers on the solid surface are absorbed. Another property of typeIV isotherms is the possibility of developing hysteresis loops, i.e.,the adsorption and desorption curves do not match. Depending onthe hysteresis curve type, in accordance with IUPAC, all our carbonsexhibit a type H4 hysteresis, which is typical of complex materialscontaining both micropores and mesopores, such as activated car-bons. Figure S5 shows the pore size distribution according to theBarretteJoynereHalenda (BJH) (Barrett et al., 1951) method. Thehighest concentration of pores occurs in the 20e50 Å range, con-firming the presence of micropores and mesopores.
The textural parameters for the carbonaceous materials aresummarized in Table 1. The materials impregnated with H3PO4have higher BrunauereEmmetteTeller (BET) surface for macaubaendocarp (371.12 m2/g) and pine nut shell (296.01 m2/g), whereasin the case of carnauba leaves the BET is higher for the carbonimpregnated with CaCl2 (402.43 m2/g). Pore volumes range from0.12 to 0.24 cm3/g, and the highest value corresponds again toC_carnauba_CaCl2. The textural parameters for the activated car-bons under study are within the ranges reported by other authorsfor different lignocellulosic residues, with surface areas rangingfrom 228 to 2410 m2/g and pore volumes in the 0.033e1.4 cm3/grange (Ioannidou and Zabaniotou, 2007; Zuo et al., 2009). It isworth noting that CaCl2 activated carbons have larger average poresizes (18.25e23.16 Å) in comparison with those activated withH3PO4 (17.26e19.97 Å), so it can be inferred that CaCl2 activationproduces larger pores.
The surfaces of all the raw materials and active charcoals havebeen analyzed by scanning electron microscopy (see Figure S6).Although the micropores and mesopores are not visible, the mi-crographs allow to observe the shape and location of macroporeson the surface of the materials. By combining the pore size distri-bution obtained from nitrogen adsorption and the SEM micro-graphs, it is possible to obtain complete information on pores
the N2 adsorption isotherm using standard conditions at 77 K.
ume (cm3/g) Micropore volume (cm3/g) Pore size (Å)
0.000359 21.246�0.000111 133.99�0.000163 146.970.121191 23.1600.123078 19.9730.082070 18.2520.126290 17.2640.082738 18.8920.100583 17.907

V. da Silva Lacerda et al. / Journal of Environmental Management 155 (2015) 67e7670
development during carbonization and activation. In the precursormaterials no macropores are observed in the SEM micrographs.With regard to the activated carbons obtained from carnaubaleaves, macropores are found primarily within the fiber, in analogywith those reported for the activation of different fibers by otherauthors (Brasquet et al., 2000; Phan et al., 2006). In the case of thecarbons derived from macauba endocarp and pine nut shell, mac-ropores appear distributed all throughout the material surface. Themacropores for CaCl2 activated carbons show more variability andare larger than those of the materials activated with H3PO4. Thedistribution and shape of the pores in the activated carbonssignificantly vary depending on the raw material used.
Fig. 2. Effect of activated carbon dosage on RhB removal ([RheB]0 ¼ 80 mg/L, contacttime ¼ 120 min; pH ¼ 7; temperature ¼ 25 �C).
3.2. Effect of pH on RhB adsorption capacity
The pH of the solution can either promote or prevent the dyeadsorption, since it can affect the surface charge of the adsorbentand the adsorbate species in solution (Lin et al., 2013). Fig. 1 depictsthe effect of the pH of the solution on RhB adsorption on the acti-vated charcoals under study in the 2e10 pH range. As the pH in-creases from 2 to 8, a slight increase on the RhB adsorption capacitycan be observed (confirmed by a one-way ANOVA), which is morepronounced for those carbons activated with H3PO4. At low pHvalues, the high concentration of Hþ ions promotes the protonationof the functional groups of the adsorbent, charging it more posi-tively and leading to repulsion of the cationic dye molecules.Moreover, at low pH values, the Hþ ions compete with RhB mole-cules for the adsorption sites. On the other hand, when the pH ofthe solution is increased, the surface of the carbons gets negativelycharged due to OH� adsorption and deprotonation of functionalgroups, thus improving the adsorption by electrostatic attraction(Ahmad and Kumar, 2010). The decrease in the absorbance whenthe pH is higher than 8 is due to the formation of hydrated ions ofRhB, which lead to a larger molecular structure (dimer) that hin-ders the entry of the dye into the pores of the material. This samebehavior -with an increase in the absorption capacity and a sub-sequent decrease as the pH is increased- has also been reported in astudy of RhB removal by activated carbon produced from Acacianilotica leaves with H2SO4 (Santhi et al., 2014). Talebnia et al. (2010)also reported an optimal pH around 7 for the adsorption of RhB onmontmorillonite ((Na,Ca)0.33(Al,Mg)2(Si4O10)(OH)2$nH2O). Thehighest adsorption capacity the activated charcoals presentedherein occurs at pH 8. Since the work system is designed to operatein natural waters at pH in the 6e8 interval, no pH adjustment wasrequired for the tests on the effect of adsorbent dose discussed innext section.
Fig. 1. Effect of the pH of the solution on RhB adsorption (adsorbent dose ¼ 2 g/L;temperature ¼ 25 �C, [RhB]0 ¼ 65 mg/L; contact time ¼ 120 min).
3.3. Effect of activated carbon dosage on adsorption
Fig. 2 shows the percentage of RhB removal as a function of thedose of activated charcoal. As expected, for all the activated carbonatoms under study, dye adsorption increased with increasing car-bon concentration (e.g., from 87.6% to 99.85% for C_carnauba_-CaCl2). This increase in the removal percentage can be attributed tothe increase in the available surface area and availability of moreadsorption sites (Garg et al., 2004). On the basis of the resultspresented in Fig. 2, it can inferred that the most efficient activatedcharcoal dose is 4 g/L, since further increase in dose (6 or 8 g/L) doesnot lead to a significant increase in the removal of the dye. This canbe attributed to overlapping or aggregation of adsorption sites,resulting in a decrease in total adsorbent surface area available tothe pollutant and an increase in diffusion path length (Garg et al.,2004). The same behavior has also been reported by other au-thors, in relation to the absorption of RhB (Namasivayam et al.,2001) and to the adsorption of other dyes (Wang et al., 2010).
3.4. Impact of contact time on RhB removal
As it can be observed from Fig. 3, the adsorption is very rapid atfirst and it gradually decreases till equilibrium is reached after120 min, for all the activated carbons under study. In general, it canbe assumed that the dyes removal mechanism, by adsorption,consists of the following steps (Lazaridis and Asouhidou, 2003): (i)diffusion across the fluid phase surrounding the adsorbent parti-cles, i.e., external diffusion or film diffusion; (ii) diffusion in theliquid contained in the pores and/or along the pore walls, which isso-called internal diffusion or intra-particle diffusion; and (iii)adsorption and desorption between the adsorbate and active sites,i.e., mass action. The decrease in the amount of dye adsorptionversus time may be due to aggregation processes of the dye mol-ecules. This aggregation can prevent migration of the adsorbate,saturate the adsorption sites and generate a resistance to diffusionof dye molecules. Other authors have also reported a similarbehavior in the absorption of RhB, with a rapid initial phase fol-lowed by a gradually slower one (Fernandez et al., 2014; Gad andEl-Sayed, 2009; Wang and Zhu, 2007).
3.5. Effect of dye initial concentration and solution temperature
Fig. 4 depicts the effect of varying the initial RhB concentration

Fig. 3. Effect of contact time on RhB adsorption for the different carbons activated with(a) CaCl2 and (b) H3PO4 (pH ¼ 7; temperature ¼ 25 �C, [RhB]0 ¼ 80 mg/L; absorbentdose ¼ 2 g/L). Fitting of the data conducted by kinetic models.
V. da Silva Lacerda et al. / Journal of Environmental Management 155 (2015) 67e76 71
on the adsorption for the different activated carbons at 25, 35 and45 �C. An increase in the adsorption capacity with increasing dyeconcentration is observed. The largest increase occurs for C_car-nauba_CaCl2, for which it changes from 32.61 to 42.10 mg/L. Thisincrease in adsorption capacity is probably due to the increase inthe driving force of the concentration gradient, which decreasesresistance to the mass transfer of ions between the aqueous me-dium and the sorbent (Aksu and D€onmez, 2003). This behavior hasbeen widely reported in the literature (Gad and El-Sayed, 2009;Kadirvelu et al., 2005; Santhi et al., 2014).
Moreover, the increase in temperature also resulted in an in-crease in the adsorption capacity for all activated carbons. Amongstthe different materials under study, C_macauba_CaCl2 is the onewith themost significant increase in the adsorption capacity, whichchanged from 33.44 mg/L at 25 �C to 34.87 mg/L at 45 �C. This in-crease in adsorption capacity with temperature is due to the factthat the process is endothermic, leading to an increase in theintraparticle diffusion speed of the dye in the pores or to the for-mation of new adsorption sites (Karthikeyan et al., 2005). Wangand Zhu (2007) also reported the endothermic nature of the RhBadsorption process on a commercial activated carbon pretreatedwith acid.
3.6. Kinetic study
The experimental data have been fitted by nonlinear regressionto the two most commonly used kinetic models in the literature:the pseudo-first order model and the pseudo-second order model,which are described below.
The pseudo-first order model (Lagergren, 1898) considers thatthe occupation rate of adsorption sites is proportional to thenumber of unoccupied sites (see Eq. (2)). By integrating thisequation under conditions q¼ 0 at t¼ 0 and q¼ qt at t ¼ t, Eq. (3) isobtained, where qt (mg/g) is the absorption of the dye at time t, qe(mg/g) is the adsorption capacity in equilibrium, t (min) is theexposure time and k1 (h�1) is the adsorption rate constant:
dqdt
¼ k1ðqe � qÞ (2)
qt ¼ qe�1� e�k1t
�(3)
The pseudo-second order model (Ho, 1995) describes how theadsorption mechanism follows a second-order reaction. The ab-sorption rate is then proportional to the square of the number ofunoccupied sites (see Eq. (4)). By integrating this equation underthe following conditions, q ¼ 0 at t ¼ 0 and q ¼ qt at t ¼ t, Eq. (5) isobtained, where k2 (g/mg$h) is the rate constant of the pseudo-second order adsorption equation:
dqdt
¼ k2ðqe � qÞ2 (4)
qt ¼ t1�k2q2e þ t=qe
(5)
The adsorption kinetic fittings are shown in Fig. 3, and all thecalculated kinetic parameters are summarized in Table 2. C_car-nauba_H3PO4 presents the fastest rate of dye removal (k1), followedby C_carnauba_CaCl2 > C_pine_nut_shell_CaCl2 > C_mac-auba_CaCl2 > C_pine_nut_shell_H3PO4 > C_macauba_H3PO4.Although correlation coefficients higher than 0.99 were obtainedfor all activated carbons under study for the pseudo-first ordermodel, the calculated adsorption capacities (qe_cal) were signifi-cantly different from the experimental values (qe_exp) (Table 2). Asimilar situation has been reported by Ahmad et al. (2012), whoobserved that for very quick adsorption processes the r2 valueswere similar for both the pseudo-first and the pseudo-second ordermodels, and then attention should be paid to qe_cal values so as todistinguish which fitting is the most suitable. Consequently, it canbe concluded that the fitting of the dye adsorption with a pseudo-first order is not good.
On the other hand, when the pseudo-second order kineticmodel is chosen, not only the correlation coefficients are higherthan 0.99 (Table 2), but the calculated adsorption values (qe_cal) arealso in good agreement with the experimental data (qe_exp). Thisbetter fitting to a pseudo-second-order model suggests that theadsorption rate is more dependent on the availability of adsorptionsites than on the dye concentration in the solution. Similar phe-nomena have been observed for RhB adsorption on different bio-sorbents (Kadirvelu et al., 2005; Wang et al., 2010).
3.7. Adsorption isotherms
The adsorption data for the different activated carbons havebeen fitted by non-linear Langmuir and Freundlich models. Sig-maPlot™ v.10 (Systac Software Inc) software was used for thesefittings.

Fig. 4. Effect of RhB initial concentration on the adsorption by (a) C_carnauba_CaCl2; (b) C_carnauba_H3PO4; (c) C_macauba_CaCl2; (d) C_macauba_H3PO4; (e) C_pine_-nut_shell_CaCl2; (f) C_pine_nut_shell_H3PO4 (pH ¼ 7; adsorbent dose ¼ 2 g/L; contact time ¼ 120 min) at three different temperatures (25, 35 and 45 �C). The data have been fittedaccording to Langmuir y Freundlich non-linear models.
Table 2Kinetic parameters for rhodamine B adsorption for the different activated carbons under study.
Samples qe_exp Pseudo-first order model Pseudo-second order model
k1 (min) qe_cal (mg g�1) r2 k2 (g mg�1 min�1) qe_cal (mg g�1) r2
C_carnauba_CaCl2 33.315 0.769 36.186 0.998 0.236 36.363 0.998C_carnauba_H3PO4 32.429 0.851 32.365 0.999 0.431 32.467 0.999C_macauba_CaCl2 31.371 0.850 31.197 0.999 0.350 31.347 0.999C_macauba_H3PO4 31.099 0.856 30.948 0.999 0.280 31.055 0.999C_pine_nut_shell_CaCl2 31.855 0.861 31.687 0.999 0.299 31.847 0.999C_pine_nut_shell_H3PO4 31.184 0.920 31.035 0.999 0.332 31.152 0.999
V. da Silva Lacerda et al. / Journal of Environmental Management 155 (2015) 67e7672
The Langmuir model (Eq. (6)) assumes that adsorption occurs ina monolayer, where the active sites are identical and energeticallyequivalent, that there are no interactions between the adsorbedmolecules and that no transmigration of the adsorbed moleculestakes place on the adsorption surface (Langmuir, 1918):
qe ¼ kLqmaxCe1þ kLCe
(6)
where qe (mg/g) is the adsorption capacity in equilibrium, Ce (mg/L)is the pollutant concentration in equilibrium, kL (L/mg) is the
Langmuir constant related to the adsorption energy, which quan-titatively reflects the affinity between the adsorbent and adsorbate,and qmax (mg/g) is the theoretical maximum adsorption capacity.
The essential characteristics of the Langmuir adsorptionisotherm can be expressed as a dimensionless constant, calledseparation factor or equilibrium parameter (RL), which is defined byEq. (7)) (Hall et al., 1966):
RL ¼1
1þ kLC0(7)

V. da Silva Lacerda et al. / Journal of Environmental Management 155 (2015) 67e76 73
where C0 is the initial dye concentration (mg/L). The RL value in-dicates the shape of the isotherm, which can be irreversible(RL ¼ 0), favorable (0 < RL < 1), linear (RL ¼ 1) or unfavorable(RL > 1).
Freundlich isotherm is an empirical equation (Eq. (8)) whichconsiders the possibility of multilayer adsorption in multiple layerswith a heterogeneous energy distribution of the active sites,accompanied by interactions between the adsorbed molecules(Freundlich, 1906):
qe ¼ kF$C1=ne (8)
where kF (mg g�1(mg L�1)1/n) is the Freundlich isotherm constant,which is an indicator of the adsorptive capacity of an adsorbent fora solute, and n is a measure of the intensity of the adsorption orsurface heterogeneity (a value closer to zero represents a moreheterogeneous surface).
The fittings of the experimental data to the Langmuir andFreundlich isotherm models at different temperatures are depictedin Fig. 4. The correlation coefficients (r2) and the constants obtainedfrom the application of the Langmuir and Freundlich models aresummarized in Table 3. In light of these data, Freundlich model hasa better fit to the experimental data than Langmuir model in all
Table 3Adsorption isotherm parameters for rhodamine B adsorption for the different activated
Sample T (�C) Langmuir constants
qmax
(mg g�1)
C_carnauba_CaCl2 25 39.21835 39.73245 39.983
C_carnauba_H3PO4 25 35.27935 35.79645 35.998
C_macauba_CaCl2 25 32.95935 33.83045 34.217
C_macauba_H3PO4 25 32.65135 33.36345 33.694
C_pine_nut_shell_CaCl2 25 33.60635 33.68545 33.971
C_pine_nut_shell_H3PO4 25 32.49835 32.73245 33.080
Sample T (�C) Freundlich co
KF (mg g�1
(mg L�1)1/n)
C_carnauba_CaCl2 25 35.06235 35.60145 35.953
C_carnauba_H3PO4 25 29.75535 30.26745 30.431
C_macauba_CaCl2 25 27.45935 29.30645 30.039
C_macauba_H3PO4 25 29.55535 30.14145 30.333
C_pine_nut_shell_CaCl2 25 29.62935 30.14745 30.488
C_pine_nut_shell_H3PO4 25 29.50635 30.40645 31.1571
cases. This reveals the heterogeneity of the surface of the activatedcarbons under study.
The RL values (Table 3) confirm that the dye adsorption isfavorable, with values below 1 for all the activated carbons. Themaximum adsorption (qmax) for the different coals decrease in thefollowing order: C_carnauba_CaCl2 > C_carnauba_H3PO4 >C_macauba_CaCl2 > C_pine_nut_shell_CaCl2 > C_pine_-nut_shell_H3PO4 > C_macauba_H3PO4. All the charcoals activatedwith CaCl2 showed higher qmax values than those activated withH3PO4, as expected for the larger size of their pores (discussedabove).
Table S3 summarizes a comparison of the absorption capacityfor the activated charcoals presented herein with others found inthe literature (for a more general comparison of other lignocellu-losic products as adsorbents, the interested reader is referred to, forexample, the work by Parab et al. (2009)). The activated carbonsprepared from the selected lignocellulosic waste materials haveadsorption capacities between 33.08 and 39.98 mg/g, comparableto the values reported for commercial activated carbon (Bhadushaand Ananthabaskaran, 2012) and above the average of the valuesreported in the literature (which vary from 1.6 to 60.8 mg/L).Nonetheless, it should be noted that an accurate comparison is notfeasible in this case, given the differences on the nature of the
carbons under study.
KL (L mg�1) r2 RL s
38.881 0.976 3.21E-07 2.05743.164 0.975 2.90E-07 2.09352.488 0.975 2.38E-07 2.1592.459 0.994 5.08E-06 0.8912.479 0.996 5.04E-06 0.7792.497 0.995 5.01E-06 0.8091.505 0.996 8.31E-06 0.6422.661 0.996 4.70E-06 0.6713.123 0.998 4.00E-06 0.5303.492 0.998 3.58E-06 0.3653.973 0.998 3.15E-06 0.5224.241 0.997 2.95E-06 0.5682.688 0.998 4.65E-06 0.4623.795 0.997 3.29E-06 0.5534.131 0.998 3.03E-06 0.5554.117 0.997 3.04E-06 0.6016.899 0.997 1.81E-06 0.589
11.055 0.997 1.13E-06 0.560
nstants
n r2 s
23.463 0.997 0.70323.211 0.997 0.63523.285 0.998 0.61321.599 0.998 0.53921.989 0.998 0.54321.936 0.997 0.60721.832 0.999 0.33326.191 0.999 0.32528.644 0.999 0.15538.655 0.999 0.09436.983 0.999 0.33935.1259 0.999 0.32630.664 0.999 0.28833.536 0.999 0.31234.108 0.999 0.35938.957 0.999 0.39249.314 0.999 0.40858.790 0.999 0.393

Table 4Thermodynamic parameters for RhB adsorption for the different activated carbons under study.
Material T (�C) Thermodynamic parameters
DG0 (kJ mol�1) DH0 (kJ mol�1) DS0 (J mol�1 K�1) r2
C_carnauba_CaCl2 25 �9.069 11.778 69.82 0.96335 �9.64145 �10.471
C_carnauba_H3PO4 25 �2.229 0.604 9.509 0.99935 �2.32545 �2.419
C_macauba_CaCl2 25 �1.013 28.921 100.965 0.91635 �2.50645 �3.011
C_macauba_H3PO4 25 �3.098 7.679 36.244 0.97235 �3.53245 �3.819
C_pine_nut_shell_CaCl2 25 �2.449 17.032 65.709 0.90335 �3.41545 �3.750
C_pine_nut_shell_H3PO4 25 �3.506 38.916 142.377 0.99935 �4.94645 �6.353
V. da Silva Lacerda et al. / Journal of Environmental Management 155 (2015) 67e7674
precursors, on the activation agents and on the operational con-ditions amongst the different studies.
3.8. Thermodynamic parameters
The thermodynamic parameters for the adsorption process havebeen estimated from the Langmuir constants (mmol/g). Theenthalpy change (DH0), the entropy change (DS0) and the change inGibbs free energy (DG0) for the adsorption process can be calcu-lated from the KL constant and the temperature (T) using thefollowing equations (Singh, 1988):
DG0 ¼ �RT$lnKL (9)
DG0 ¼ DH0 � T$DS0 (10)
lnKL ¼�DS0
.RT
�þ�DH0
.R�
(11)
where R is the ideal gas constant (8.314 � 10�3 kJ/mol K), T is thetemperature in Kelvin, and KL is the distribution coefficient.
The thermodynamic parameters are summarized in Table 4. It
Fig. 5. Effect of additional native cellulose dose on RhB removal using H3PO4-activatedcarbons obtained from pine nut shell ([RhB]0 ¼ 80 mg/L, pH ¼ 7, activated carbondose ¼ 2 g/L; temperature ¼ 25 �C).
can be observed that all the activated carbons under study havenegative DG0 values, so the processes are spontaneous in nature. Itis also worth noting that DG0 values become more negative withincreasing temperature, which implies that the process is morespontaneous at higher temperatures. DH0 was positive for all coals,indicating that the adsorption process is endothermic, and havevalues below 40 kJ mol�1, characteristic of a physical-type ab-sorption (Bhatnagar et al., 2009). The maximum monolayer RhBadsorption capacity (qmax) increases when the temperature isincreased from 25 to 45 �C, further confirming the endothermicnature of the process. The positive value of DS0 suggests increasedrandomness at the solid/solution interface during the adsorption ofRhB in the different activated charcoals.
3.9. Preliminary assessment of the effect of cellulose content on RhBremoval
From a comparison of the components for the lignocellulosicmaterials under study (Table S2) with the textural characteristics oftheir corresponding activated carbons (Table 1), it can be inferredthat the BET surface area and pore volume increase with cellulosecontent. Cagnon et al. (2009), when using physical activation forthe different individual components (cellulose, lignin and hemi-cellulose), concluded that the activated carbon obtained from cel-lulose had a higher pore volume (0.32 cm3/g) than those obtainedfrom lignin (0.30 cm3/g) and hemicellulose (0.24 cm3/g). Khezamiet al. (2005) also reported a higher mesopore content for thechemical activation (with KOH) of cellulose (0.049 cm3/g) in com-parison to lignin (0.032 cm3/g) and hemicellulose (0.048 cm3/g).
Consequently, we have conducted a preliminary study aimed atassessing the impact of cellulose content on the RhB removal byadsorption. Pine nut shell has been selected for these tests, pro-vided that its cellulose content is similar to that of macaubaendocarp and lower than that of carnauba leaves (so there is moreroom for improvement). As indicated in the experimental section(subsection 2.4), the cellulose content was artificially increasedprior to activation with H3PO4 by adding different amounts ofnative cellulose (0 wt.%, 20 wt.% and 50 wt.%) to the pine nut shelllignocellulosic material. The respective RhB removal efficiencies aredepicted Fig. 5. It can be observed that the RhB removal signifi-cantly increases from 78% for the activated carbon obtained frompure pine nut shell to 97% when 50 wt.% of native cellulose wasadded for the same operational conditions. This improvement, asnoted above, would be associated to the higher mesopore ratio for

V. da Silva Lacerda et al. / Journal of Environmental Management 155 (2015) 67e76 75
higher cellulose content, which favors RhB adsorption. A detailedstudy on the suitability of different combinations of native cellulosewith lignocellulosic materials for activated charcoals productionwill be the objective of a further research.
4. Conclusions
Adsorption studies have been conducted for the different acti-vated carbons obtained from the three selected lignocellulosicwaste materials (carnauba palm leaves, macauba endocarp andpine nut shell) to assess their capability to remove Rhodamine B inthe aqueous phase. The adsorption process fits a pseudo-secondorder model, which suggests that the adsorption rate is moredependent on the availability of adsorption sites than on dye con-centration, and the equilibrium data fit the Freundlich isothermmodel, associated to multilayer adsorption and a heterogeneousenergy distribution of the active sites. The adsorptive capacity de-pends both on the lignocellulosic material used and on the acti-vation procedure, attaining better results for CaCl2 than H3PO4activation as a consequence of enhanced mesopore formation.From the thermodynamic parameters (DH0, DS0 and DG0) it can beconcluded that the physical adsorption process is endothermic andspontaneous for all the activated carbons, so they can be regardedas promising adsorbents for pollutants removal from aqueous so-lutions. Finally, the preliminary study on the impact of cellulosecontent (by adding native cellulose to the precursor) shows that itsincrease leads to an enhancement of the adsorption properties,associated to improved textural properties.
Acknowledgments
This work was supported by funds from Junta de Castilla y Le�onunder project VA036A12-2. Viviane da Silva would like to thankUniversidad de Valladolid for its financial support (“Programa deFormaci�on del Personal Investigador” PhD scholarship).
Appendix A. Supplementary data
Supplementary data related to this article can be found at http://dx.doi.org/10.1016/j.jenvman.2015.03.007.
References
Ahmad, F., Daud, W.M.A.W., Ahmad, M.A., Radzi, R., 2012. Cocoa (Theobroma cacao)shell-based activated carbon by CO2 activation in removing of cationic dye fromaqueous solution: kinetics and equilibrium studies. Chem. Eng. Res. Des. 90,1480e1490.
Ahmad, R., Kumar, R., 2010. Adsorption studies of hazardous malachite green ontotreated ginger waste. J. Environ. Manage 91, 1032e1038.
Aksu, Z., D€onmez, G., 2003. A comparative study on the biosorption characteristicsof some yeasts for Remazol blue reactive dye. Chemosphere 50, 1075e1083.
ANASI, ASTM,1977. Standard Test Methods for Lignin in Wood. D 1106-56. AmericanNational Standards Institute (ANSI) and American Society for Testing and Ma-terials (ASTM), Washington DC.
ANSI, ASTM, 1977. Standard Test Methods for Alpha-Cellulose in Wood. D 1103-60.American National Standards Institute (ANSI) and American Society for Testingand Materials (ASTM), Washington DC.
Baccar, R., Bouzid, J., Feki, M., Montiel, A., 2009. Preparation of activated carbonfrom Tunisian olive-waste cakes and its application for adsorption of heavymetal ions. J. Hazard. Mater. 162, 1522e1529.
Bansode, R., Losso, J., Marshall, W., Rao, R., Portier, R., 2004. Pecan shell-basedgranular activated carbon for treatment of chemical oxygen demand (COD) inmunicipal wastewater. Bioresour. Technol. 94, 129e135.
Barrett, E.P., Joyner, L.G., Halenda, P.P., 1951. The determination of pore volume andarea distributions in porous substances. I. Computations from nitrogen iso-therms. J. Am. Chem. Soc. 73, 373e380.
Bhadusha, N., Ananthabaskaran, T., 2012. Kinetic, thermodynamic and equilibriumstudies on uptake of rhodamine B onto ZnCl2 activated low cost carbon. J. Chem.9, 137e144.
Bhatnagar, A., Kumar, E., Minocha, A.K., Jeon, B.-H., Song, H., Seo, Y.-C., 2009.Removal of anionic dyes from water using citrus limonum (Lemon) peel:
equilibrium studies and kinetic modeling. Sep. Sci. Technol. 44, 316e334.Bouchelta, C., Medjram, M.S., Bertrand, O., Bellat, J.-P., 2008. Preparation and
characterization of activated carbon from date stones by physical activationwith steam. J. Anal. Appl. Pyrol. 82, 70e77.
Brasquet, C., Rousseau, B., Estrade-Szwarckopf, H., Le Cloirec, P., 2000. Observationof activated carbon fibres with SEM and AFM correlation with adsorption datain aqueous solution. Carbon 38, 407e422.
Browning, B.L., 1967. Methods of Wood Chemistry. Interscience Publishers, NewYork.
Cagnon, B., Py, X., Guillot, A., Stoeckli, F., Chambat, G., 2009. Contributions ofhemicellulose, cellulose and lignin to the mass and the porous properties ofchars and steam activated carbons from various lignocellulosic precursors.Bioresour. Technol. 100, 292e298.
Chen, S., Zhang, J., Zhang, C., Yue, Q., Li, Y., Li, C., 2010. Equilibrium and kineticstudies of methyl orange and methyl violet adsorption on activated carbonderived from phragmites australis. Desalination 252, 149e156.
da Silva Lacerda, V., L�opez-Sotelo, J.B., Correa-Guimar~aes, A., Hern�andez-Navarro, S.,S�anchez-Bascones, M., Navas-Gracia, L.M., Martín-Ramos, P., P�erez-Lebe~na, E.,Martín-Gil, J., 2015. A kinetic study on microwave-assisted conversion of cel-lulose and lignocellulosic waste into hydroxymethylfurfural/furfural. Bioresour.Technol. 180, 88e96.
de Luna, M.D.G., Flores, E.D., Genuino, D.A.D., Futalan, C.M., Wan, M.-W., 2013.Adsorption of eriochrome black T (EBT) dye using activated carbon preparedfrom waste rice hullsdoptimization, isotherm and kinetic studies. J. TaiwanInst. Chem. Eng. 44, 646e653.
Fernandez, M.E., Nunell, G.V., Bonelli, P.R., Cukierman, A.L., 2014. Activated carbondeveloped from orange peels: batch and dynamic competitive adsorption ofbasic dyes. Ind. Crop. Prod. 62, 437e445.
Forgacs, E., Cserh�ati, T., Oros, G., 2004. Removal of synthetic dyes fromwastewaters:a review. Environ. Int. 30, 953e971.
Freeman, J.J., Gimblett, F.G.R., 1988. Studies of activated charcoal cloth. IV. Influenceof phosphate impregnants on the rate of activation in carbon dioxide gas.Carbon 26, 501e505.
Freeman, J.J., Gimblett, F.G.R., Roberts, R.A., Sing, K.S.W., 1988. Studies of activatedcharcoal cloth. III. Mesopore development induced by phosphate impregnants.Carbon 26, 7e11.
Freundlich, H., 1906. Über die Adsorption in L€osungen. Wilhelm Engelmann,Leipzig.
Gad, H.M.H., El-Sayed, A.A., 2009. Activated carbon from agricultural by-productsfor the removal of Rhodamine-B from aqueous solution. J. Hazard. Mater. 168,1070e1081.
Garg, V.K., Kumar, R., Gupta, R., 2004. Removal of malachite green dye from aqueoussolution by adsorption using agro-industry waste: a case study of prosopiscineraria. Dyes Pigments 62, 1e10.
Guo, Y., Rockstraw, D.A., 2007. Physicochemical properties of carbons prepared frompecan shell by phosphoric acid activation. Bioresour. Technol. 98, 1513e1521.
Hall, K.R., Eagleton, L.C., Acrivos, A., Vermeulen, T., 1966. Pore- and solid-diffusionkinetics in fixed-bed adsorption under constant-pattern conditions. Ind. Eng.Chem. Fundam. 5, 212e223.
Hao, W., Bj€orkman, E., Lilliestråle, M., Hedin, N., 2013. Activated carbons preparedfrom hydrothermally carbonized waste biomass used as adsorbents for CO2.Appl. Energy 112, 526e532.
Ho, Y.-S., 1995. Absorption of Heavy Metals from Waste Streams by Peat. Universityof Birmingham, Birmingham, United Kingdom.
Hosseini, S., Khan, M.A., Malekbala, M.R., Cheah, W., Choong, T.S., 2011. Carboncoated monolith, a mesoporous material for the removal of methyl orange fromaqueous phase: adsorption and desorption studies. Chem. Eng. J. 171,1124e1131.
Ioannidou, O., Zabaniotou, A., 2007. Agricultural residues as precursors for activatedcarbon productionda review. Renew. Sust. Energ. Rev. 11, 1966e2005.
Jagtoyen, M., Derbyshire, F., 1998. Activated carbons from yellow poplar and whiteoak by H3PO4 activation. Carbon 36, 1085e1097.
Kadirvelu, K., Karthika, C., Vennilamani, N., Pattabhi, S., 2005. Activated carbon fromindustrial solid waste as an adsorbent for the removal of Rhodamine-B fromaqueous solution: kinetic and equilibrium studies. Chemosphere 60,1009e1017.
Karthikeyan, T., Rajgopal, S., Miranda, L.R., 2005. Chromium(VI) adsorption fromaqueous solution by Hevea brasilinesis sawdust activated carbon. J. Hazard.Mater. 124, 192e199.
Khezami, L., Chetouani, A., Taouk, B., Capart, R., 2005. Production and characteri-sation of activated carbon from wood components in powder: cellulose, lignin,xylan. Powder Technol. 157, 48e56.
Klasson, K.T., Wartelle, L.H., Rodgers III, J.E., Lima, I.M., 2009. Copper (II) adsorptionby activated carbons from pecan shells: effect of oxygen level during activation.Ind. Crop. Prod. 30, 72e77.
Kong, J., Yue, Q., Huang, L., Gao, Y., Sun, Y., Gao, B., Li, Q., Wang, Y., 2013. Preparation,characterization and evaluation of adsorptive properties of leather waste basedactivated carbon via physical and chemical activation. Chem. Eng. J. 221, 62e71.
Lagergren, S., 1898. Zur Theorie der sogenannten Absorption gel€oster Stoffe. PANorstedt & s€oner, Stockholm.
Langmuir, I., 1918. The adsorption of gases on plane surface of glass, mica andplatinum. J. Am. Chem. Soc. 40, 1361e1403.
Lazaridis, N.K., Asouhidou, D.D., 2003. Kinetics of sorptive removal of chromium(VI)from aqueous solutions by calcined MgeAleCO3 hydrotalcite. Water Res. 37,2875e2882.
V. da Silva Lacerda et al. / Journal of Environmental Management 155 (2015) 67e7676
Lin, L., Zhai, S.-R., Xiao, Z.-Y., Song, Y., An, Q.-D., Song, X.-W., 2013. Dye adsorption ofmesoporous activated carbons produced from NaOH-pretreated rice husks.Bioresour. Technol. 136, 437e443.
Lo, S.-F., Wang, S.-Y., Tsai, M.-J., Lin, L.-D., 2012. Adsorption capacity and removalefficiency of heavy metal ions by Moso and Ma bamboo activated carbons.Chem. Eng. Res. Des. 90, 1397e1406.
Metcalf, Eddy, 2003. Wastewater Engineering: Treatment and Reuse (Nueva York).Namasivayam, C., Radhika, R., Suba, S., 2001. Uptake of dyes by a promising locally
available agricultural solid waste: coir pith. Waste manage. Oxf. 21, 381e387.Ng, C., Marshall, W.E., Rao, R.M., Bansode, R.R., Losso, J.N., 2003. Activated carbon
from pecan shell: process description and economic analysis. Ind. Crop. Prod. 17,209e217.
Parab, H., Sudersanan, M., Shenoy, N., Pathare, T., Vaze, B., 2009. Use of agro-industrial wastes for removal of basic dyes from aqueous solutions. Clean 37,963e969.
Paraskeva, P., Kalderis, D., Diamadopoulos, E., 2008. Production of activated carbonfrom agricultural by-products. J. Chem. Technol. Biotechnol. 83, 581e592.
Pastor-Villegas, J., Pastor-Valle, J.F., Rodríguez, J.M.M., García, M.G., 2006. Study ofcommercial wood charcoals for the preparation of carbon adsorbents. J. Anal.Appl. Pyrol. 76, 103e108.
Pel�aez-Cid, A.A., Teutli-Le�on, M.M., 2012. Lignocellulosic precursors used in theelaboration of activated carbon. In: Petriciolet, V.H.M.a.A.B. (Ed.), LignocellulosicPrecursors Used in the Synthesis of Activated Carbon-Characterization Tech-niques and Applications in the Wastewater Treatment.
Phan, N.H., Rio, S., Faur, C., Le Coq, L., Le Cloirec, P., Nguyen, T.H., 2006. Production of
fibrous activated carbons from natural cellulose (jute, coconut) fibers for watertreatment applications. Carbon 44, 2569e2577.
Santhi, T., Prasad, A.L., Manonmani, S., 2014. A comparative study of microwave andchemically treated Acacia nilotica leaf as an eco friendly adsorbent for theremoval of rhodamine B dye from aqueous solution. Arab. J. Chem. 7, 494e503.
Sing, K.S.W., 1985. Reporting physisorption data for gas/solid systems with specialreference to the determination of surface area and porosity (Recommendations1984). Pure Appl. Chem. 603.
Talebnia, F., Karakashev, D., Angelidaki, I., 2010. Production of bioethanol fromwheat straw: an overview on pretreatment, hydrolysis and fermentation. Bio-resour. Technol. 101, 4744e4753.
Wang, L., Zhang, J., Zhao, R., Li, C., Li, Y., Zhang, C., 2010. Adsorption of basic dyes onactivated carbon prepared from polygonum orientale Linn: equilibrium, kineticand thermodynamic studies. Desalination 254, 68e74.
Wang, S., Zhu, Z.H., 2007. Effects of acidic treatment of activated carbons on dyeadsorption. Dyes Pigments 75, 306e314.
Zaini, M.A.A., Amano, Y., Machida, M., 2010. Adsorption of heavy metals ontoactivated carbons derived from polyacrylonitrile fiber. J. Hazard. Mater. 180,552e560.
Zhou, A., Ma, X., Song, C., 2009. Effects of oxidative modification of carbon surfaceon the adsorption of sulfur compounds in diesel fuel. Appl. Catal. B 87, 190e199.
Zuo, S., Yang, J., Liu, J., Cai, X., 2009. Significance of the carbonization of volatilepyrolytic products on the properties of activated carbons from phosphoric acidactivation of lignocellulosic material. Fuel Process. Technol. 90, 994e1001.