investigation of the functional groups on the surface of activated carbons
TRANSCRIPT
J.Serb.Chem.Soc. 69(5)363–375(2004) UDC 665.587+541.183:541.121JSCS – 3163 Original scientific paper
An investigation of the functional groups on the surface ofactivated carbons
JURGIS BARKAUSKAS and MARYTE DERVINYTE
Department of General and Inorganic Chemistry, Vilnius University, Naugarduko 24, 2006 Vilnius,
Lithuania (e-mail: [email protected])
(Received 24 April, revised 16 December 2003)
Abstract: Activated carbons were produced in the laboratory from wood using a20-run Plackett–Burman experimental design for 19 factors. The obtained batchesof activated carbon were analysed by potentiometric titration and FTIR spectros-copy to determine the surface functional groups. The results obtained by potentio-metric titration displayed the distribution of individual acidity constants of thosegroups in the pK range. Considering this parameter, the surface functional groupswere divided into carboxyl, lactone and phenol. The linear regression equations re-flecting the influence of each operation used for the synthesis on the amount of thesefunctional groups in the obtained activated carbons were generated. The FTIR spec-tra were used in parallel for the evaluation of the amount and the type of the surfacefunctional groups. Relationships between the two data sets obtained by potentio-metric titration and FTIR spectroscopy were evaluated by correlation analysis. Itwas established that the amount of surface functional groups determined by poten-tiometric titration positively correlates with the intensity of the peaks of hydrophilicfunctional groups in the FTIR spectra. At the same time, the negative correlation be-tween potentiometrically determined amount of surface functional groups and theintensity of peaks of hydrophobic functional groups was observed. Most probably,these non-polar formations can take part in the interaction of carbon surface withH+/OH- ions and diminish the strength of existent functional groups.
Keywords: activated carbon, functional groups, adsorption, correlation, acid-baseequilibrium.
INTRODUCTION
Activated carbons (ACs) are produced with a wide range of properties andphysical forms, which leads to their use in numerous applications. They have notbeen replaced in many industrial processes until now, despite hard competition fromthe side of polymers, zeolytes and other new-created sorbents. Furthermore, ACshave found usage in a number of new fields and technologies, such as catalysts andcatalyst supports, supercapacitors, composite fillers in polymer matrix, gas storage
363
and separation, rechargeable batteries, etc. The practical use of ACs is, in most cases,based on the fact that the numerous assortments of their modifications are unique inan extremely large surface area, which originates from the porous structure of thismaterial. Due to this large surface area, physical adsorption becomes effective. Inmany industrial processes physical adsorption plays the most important role. Never-theless, the surface chemistry of the carbon is also an important factor; this is evidentfrom the constantly increasing number of publications dealing with this topic. Theselectivity of ACs for adsorption is dependent on their surface chemistry, as well ason their pore size distribution. The approaches that have been taken to modify thetype and distribution of surface functional groups have mostly involved posttre-atment of ACs or modification of the precursor composition, although the synthesisroute and conditions can also be employed to control the properties of the product.1
It has been shown that through appropriate chemical reaction, the surface can be ren-dered more acidic, basic, polar, or completely neutral.2 The chemical composition ofthe precursor also influences the surface chemistry.
It is known that the functional groups are concentrated on the edges ofgraphene layers.3 Some authors suggest that the distribution of the functionalgroups on the surface of ACs depends on pore size.4 An uneven distribution offunctional groups creates surface heterogeneity. Another reason for heterogeneityis the presence of heteroatoms (commonly O, N and S).5
Efforts towards a comprehensive understanding of the structure of the surfaceof ACs are afoot, progressively lining up appropriate information. The basis forthis information is a lot of different analytical methods, at the same time thesemethods are a bare source of ambiguous data. Such a paradox indicates that mod-ern and powerful analytical methods should be applied to the analysis of AC sur-faces but the results should be interpreted with definite caution taking into accountthe extremely complex nature of ACs. Among the elements of complexity are thehigh surface area resulting from an intricate pore structure, significant differencesin the physico-chemical parameters among the heterogeneous surface sites, the
occurrance of partial delocalisation of the �-electrons and the ability of certain sur-
face sites to react with water and other solvents. Each analytical method in case of
ACs gives only partial information about the surface state. Therefore, a correlation
of the obtained results may be useful. The aim of this work was to compare an as-
sortment of surface functional groups of ACs obtained using a set of different oper-
ations in the preparation process.
EXPERIMENTAL
The Ac samples in our experiment were synthesized using a set of operations organized in theform of a Plackett–Burman experimental design.6 The 20-run design matrix for 19 factors presentedin Table I was used to estimate the influence of each operation on the measured parameters. Each po-sition in the column for the rows in Table I represents the batch of ACs prepared using a set of defi-nite preparation conditions (i.e., factors). These conditions (factors) are detailed in Table II. The
364 BARKAUSKAS and DERVINYTE
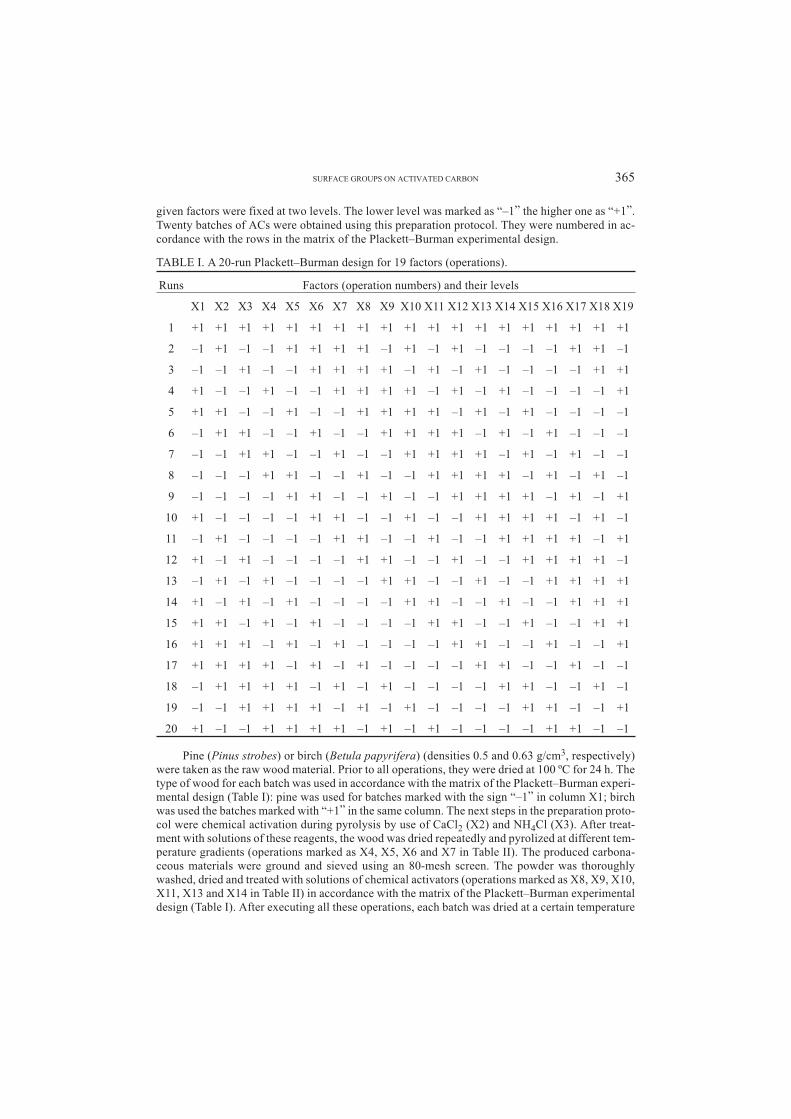
given factors were fixed at two levels. The lower level was marked as “–1” the higher one as “+1”.Twenty batches of ACs were obtained using this preparation protocol. They were numbered in ac-cordance with the rows in the matrix of the Plackett–Burman experimental design.
TABLE I. A 20-run Plackett–Burman design for 19 factors (operations).
Runs Factors (operation numbers) and their levels
X1 X2 X3 X4 X5 X6 X7 X8 X9 X10 X11 X12 X13 X14 X15 X16 X17 X18 X19
1 +1 +1 +1 +1 +1 +1 +1 +1 +1 +1 +1 +1 +1 +1 +1 +1 +1 +1 +1
2 –1 +1 –1 –1 +1 +1 +1 +1 –1 +1 –1 +1 –1 –1 –1 –1 +1 +1 –1
3 –1 –1 +1 –1 –1 +1 +1 +1 +1 –1 +1 –1 +1 –1 –1 –1 –1 +1 +1
4 +1 –1 –1 +1 –1 –1 +1 +1 +1 +1 –1 +1 –1 +1 –1 –1 –1 –1 +1
5 +1 +1 –1 –1 +1 –1 –1 +1 +1 +1 +1 –1 +1 –1 +1 –1 –1 –1 –1
6 –1 +1 +1 –1 –1 +1 –1 –1 +1 +1 +1 +1 –1 +1 –1 +1 –1 –1 –1
7 –1 –1 +1 +1 –1 –1 +1 –1 –1 +1 +1 +1 +1 –1 +1 –1 +1 –1 –1
8 –1 –1 –1 +1 +1 –1 –1 +1 –1 –1 +1 +1 +1 +1 –1 +1 –1 +1 –1
9 –1 –1 –1 –1 +1 +1 –1 –1 +1 –1 –1 +1 +1 +1 +1 –1 +1 –1 +1
10 +1 –1 –1 –1 –1 +1 +1 –1 –1 +1 –1 –1 +1 +1 +1 +1 –1 +1 –1
11 –1 +1 –1 –1 –1 –1 +1 +1 –1 –1 +1 –1 –1 +1 +1 +1 +1 –1 +1
12 +1 –1 +1 –1 –1 –1 –1 +1 +1 –1 –1 +1 –1 –1 +1 +1 +1 +1 –1
13 –1 +1 –1 +1 –1 –1 –1 –1 +1 +1 –1 –1 +1 –1 –1 +1 +1 +1 +1
14 +1 –1 +1 –1 +1 –1 –1 –1 –1 +1 +1 –1 –1 +1 –1 –1 +1 +1 +1
15 +1 +1 –1 +1 –1 +1 –1 –1 –1 –1 +1 +1 –1 –1 +1 –1 –1 +1 +1
16 +1 +1 +1 –1 +1 –1 +1 –1 –1 –1 –1 +1 +1 –1 –1 +1 –1 –1 +1
17 +1 +1 +1 +1 –1 +1 –1 +1 –1 –1 –1 –1 +1 +1 –1 –1 +1 –1 –1
18 –1 +1 +1 +1 +1 –1 +1 –1 +1 –1 –1 –1 –1 +1 +1 –1 –1 +1 –1
19 –1 –1 +1 +1 +1 +1 –1 +1 –1 +1 –1 –1 –1 –1 +1 +1 –1 –1 +1
20 +1 –1 –1 +1 +1 +1 +1 –1 +1 –1 +1 –1 –1 –1 –1 +1 +1 –1 –1
Pine (Pinus strobes) or birch (Betula papyrifera) (densities 0.5 and 0.63 g/cm3, respectively)were taken as the raw wood material. Prior to all operations, they were dried at 100 ºC for 24 h. Thetype of wood for each batch was used in accordance with the matrix of the Plackett–Burman experi-mental design (Table I): pine was used for batches marked with the sign “–1” in column X1; birchwas used the batches marked with “+1” in the same column. The next steps in the preparation proto-col were chemical activation during pyrolysis by use of CaCl2 (X2) and NH4Cl (X3). After treat-ment with solutions of these reagents, the wood was dried repeatedly and pyrolized at different tem-perature gradients (operations marked as X4, X5, X6 and X7 in Table II). The produced carbona-ceous materials were ground and sieved using an 80-mesh screen. The powder was thoroughlywashed, dried and treated with solutions of chemical activators (operations marked as X8, X9, X10,X11, X13 and X14 in Table II) in accordance with the matrix of the Plackett–Burman experimentaldesign (Table I). After executing all these operations, each batch was dried at a certain temperature
SURFACE GROUPS ON ACTIVATED CARBON 365
TA
BL
EII
.T
he
set
of
op
erat
ion
su
sed
for
the
syn
thes
iso
fth
eac
tiv
ated
carb
on
san
dth
eir
infl
uen
ceo
nth
efo
rmat
ion
of
surf
ace
fun
ctio
nal
gro
up
s
Op
er.
No
Op
erat
ion
blo
ckC
on
dit
ion
sF
ixed
lev
els
Par
amet
eres
tim
ato
rsfo
rre
gr.
equ
atio
ns
(–1
)(+
1)
Car
bo
xy
lL
acto
ne
Ph
eno
l
X1
So
rto
fw
oo
dD
ensi
ty/(
g/c
m3)
0.5
00
.63
00
0
X2
Act
ivat
ion
du
rin
gp
yro
lysi
sC
aCl 2
/%0
10
0–
0.0
40
40
X3
NH
4C
l/%
01
00
.16
80
.05
40
90
X4
Py
roly
sis
rate
atth
ete
mp
.in
terv
al2
0–
15
0ºC
20
10
00
00
.08
17
2
X5
15
0–
30
0ºC
20
10
00
.21
49
30
.04
111
–0
.09
69
X6
30
0–
45
0ºC
20
10
00
–0
.02
52
–0
.04
72
X7
45
0–
60
0ºC
20
10
0–
0.1
59
2–
0.1
21
7–
0.2
75
2
X8
Act
ivat
ion
afte
rp
yro
lysi
sH
NO
3/%
04
.5–
0.1
21
20
.06
12
7–
0.0
64
7
X9
H2C
2O
4/%
05
–0
.10
92
–0
.02
78
0
X1
0(N
H4) 2
S2O
8/%
05
00
.06
83
40
X11
NH
4N
O3/%
05
00
.03
76
70
.04
81
4
X1
2N
aClO
3/%
05
–0
.17
33
–0
.06
54
0
X1
3N
H4C
l/%
05
0.1
01
74
0.0
39
45
0.1
22
07
X1
4H
2S
O4/%
52
50
.15
30
90
.07
78
50
.05
32
3
X1
5S
atu
rati
on
Tem
per
atu
re/º
C2
01
20
–0
.12
72
0–
0.0
97
7
X1
6C
apsu
lati
on
Ced
arb
alsa
m/%
03
–0
.14
89
–0
.09
59
–0
.12
28
X1
7P
VA
/%0
30
.17
70
70
0
X1
8D
ryin
gT
emp
erat
ure
/ºC
40
80
0.1
21
27
00
X1
9T
her
mal
sho
ckT
emp
erat
ure
/ºC
70
01
00
00
0.0
98
73
0.0
50
05
TA
BL
EII
.C
on
tin
ued
.S
tati
stic
alev
alu
atio
n
Co
nd
itio
ns
Car
bo
xy
lL
acto
ne
Ph
eno
l
Yin
terc
ept
(b0)
1.5
31
46
0.3
911
30
.74
35
5
Pre
cisi
on
esti
mat
or
(S(b
i))
0.0
63
90
.00
65
0.0
22
90
Un
bia
sed
dev
iati
on
(S(U
))0
.28
60
20
.02
90
40
.10
23
9
Cal
cula
ted
F-v
alu
e1
.08
33
31
.07
14
31
.09
09
1
No
rmal
F-d
istr
ibu
tio
n2
.62
.52
.7
(operation marked as saturation, X15, in Table II). The capsulation procedures were executed bytreating the carbonaceous powder with an appropriate solution (an ethanolic solution of cedar bal-sam, X16, or an aqueous solution of poly(vinyl alcohol),X17. The capsulated batches were dried at acertain temperature (X18) and treated under thermal shock conditions (X19). The exposure time inthe high temperature zone was 5 s. Finally, each batch of AC was washed with water + di-methylketone mixture (1 : 1), dried and annealed in the tube furnace (nitrogen stream, 2 h, 1100 ºC).The synthesized batches of ACs were stored in dark phials filled with nitrogen.
The equipment for the potentiometric titration consisted of a pH meter pH-340 with a glasselectrode. The pH changes were measured in solutions of constant ionic strength by adding 0.1 MNaOH or HCl. The pH values were determined after 24 h of contact of the carbon with the solution.The carbon samples were protected by a nitrogen atmosphere during titration and storage.
The FTIR spectra were recorded using a Perkin – Elmer IR – Spectrum BXII spectrometer witha HATR reflectance unit and a ZnSe monocrystal. The powdered samples were placed in a holder onthe surface of the monocrystal and evacuated. Before each measurement, the instrument was run tocollect the background, which was then automatically subtracted from the sample spectrum.
RESULTS AND DISCUSSION
The functional groups on the surface of ACs are involved in acid – base equi-librium. Due to the complexity and heterogeneity of the carbon surface, inter- andintra-molecular interactions, the strength of these functional groups may be con-siderably altered. Consequently, as in a case of other complex systems, distinctacidity constants, Ka, for each functional group existing on the surface of an ACcannot be distinguished. In this case, the systems are characterized by a continuousdistribution of acidity constants.7 Each carbon sample consists of acidic and basicsites with their individual acidity constants Ka.8 The fraction of sites with certainKa in a solution of a definite pH is given by:
q = �1 + 10(pH–pKa)�–1. (1)
In general, an AC sample with a definite set of individual functional groupsmay be characterized by the Langmuir adsorption isotherm Q vs. pH (with Q beingthe amount of protons, in mmol/g, either adsorbed or released from the carbon sur-face). In the case of titration with a base, Q acquires negative values (i.e., protonsare released from the carbon surface). The experimentally measured proton-bind-ing isotherm Q(pH) can be represented as an integral equation.:
Q(pH) = q F K K Qa a
K
K
; ( )p dpp
p
�� 0
1
2
, (2)
where F(pKa) is the distribution of acidity sites in terms of pK values, Q0 is related to an ar-bitrary reference level and includes the amount of protons reacted with groups outside theintegration limits. The function F(pKa) is a differential quantity, representing the number ofsites with pKa values in the interval pK1 – pK2. Integration of this function yields the totalamount of sites whose pKa values belong to this interval.
The number of functional groups including even a single heteroatom, e.g., ox-ygen, is rather significant. This number significantly increases in the case of hete-
368 BARKAUSKAS and DERVINYTE
roatoms, such as sulphur or nitrogen. Therefore, the concept of conventional func-tional groups is often used to characterize the surfaces of ACs.9 These groups aredivided into: carboxyl (pKa = 2.0 – 4.0), lactone (pKa = 4.0 – 7.0) and phenol (pKa= 7.0 – 10.0); in the brackets are given the pKa interval typical for the type of func-tional groups.5
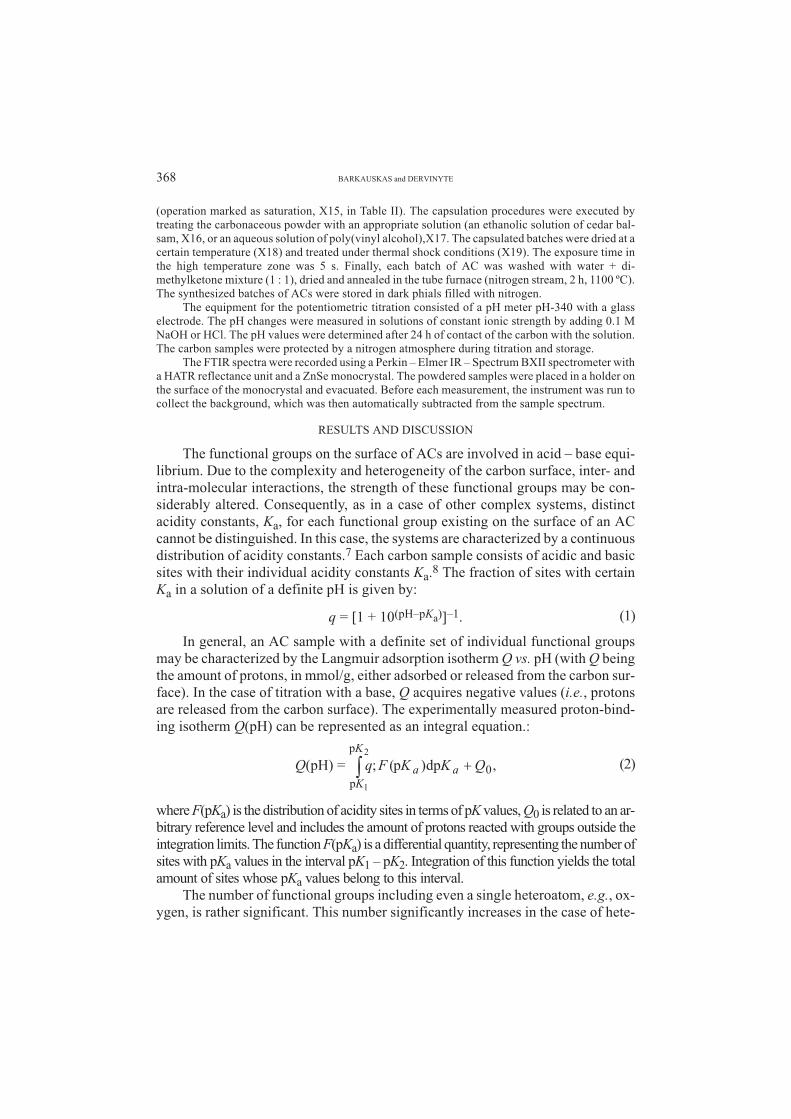
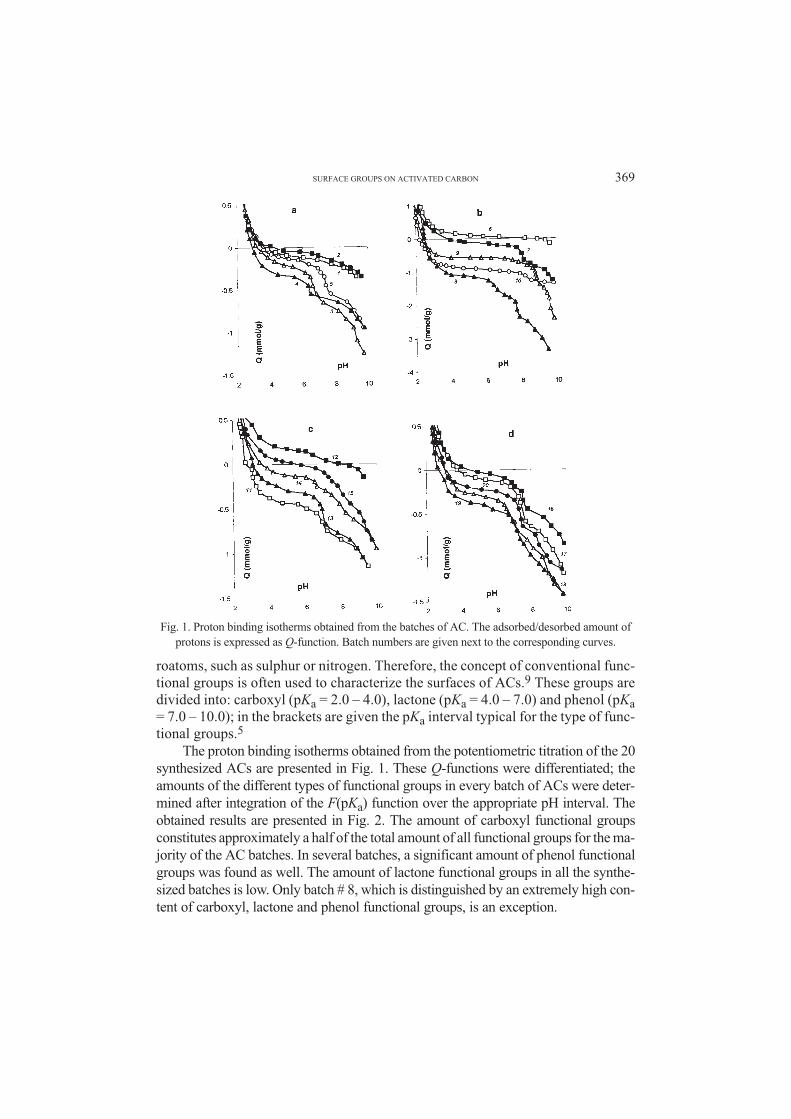
The proton binding isotherms obtained from the potentiometric titration of the 20synthesized ACs are presented in Fig. 1. These Q-functions were differentiated; theamounts of the different types of functional groups in every batch of ACs were deter-mined after integration of the F(pKa) function over the appropriate pH interval. Theobtained results are presented in Fig. 2. The amount of carboxyl functional groupsconstitutes approximately a half of the total amount of all functional groups for the ma-jority of the AC batches. In several batches, a significant amount of phenol functionalgroups was found as well. The amount of lactone functional groups in all the synthe-sized batches is low. Only batch # 8, which is distinguished by an extremely high con-tent of carboxyl, lactone and phenol functional groups, is an exception.
SURFACE GROUPS ON ACTIVATED CARBON 369
Fig. 1. Proton binding isotherms obtained from the batches of AC. The adsorbed/desorbed amount of
protons is expressed as Q-function. Batch numbers are given next to the corresponding curves.
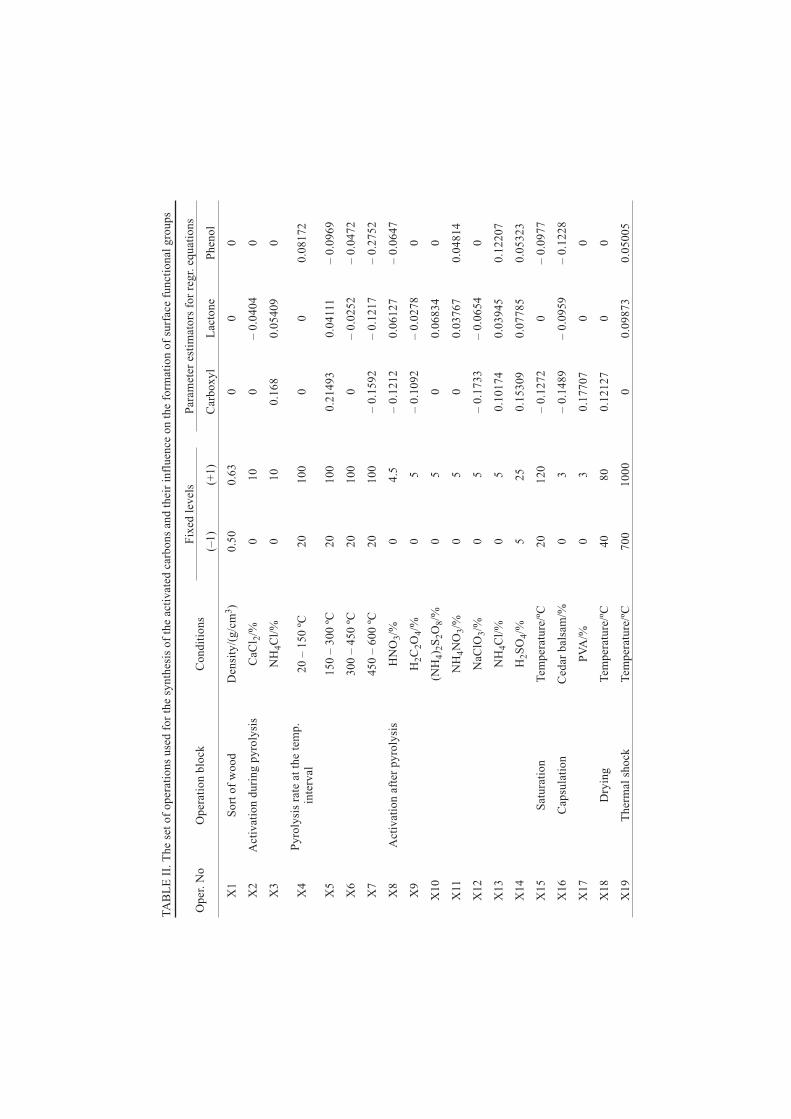
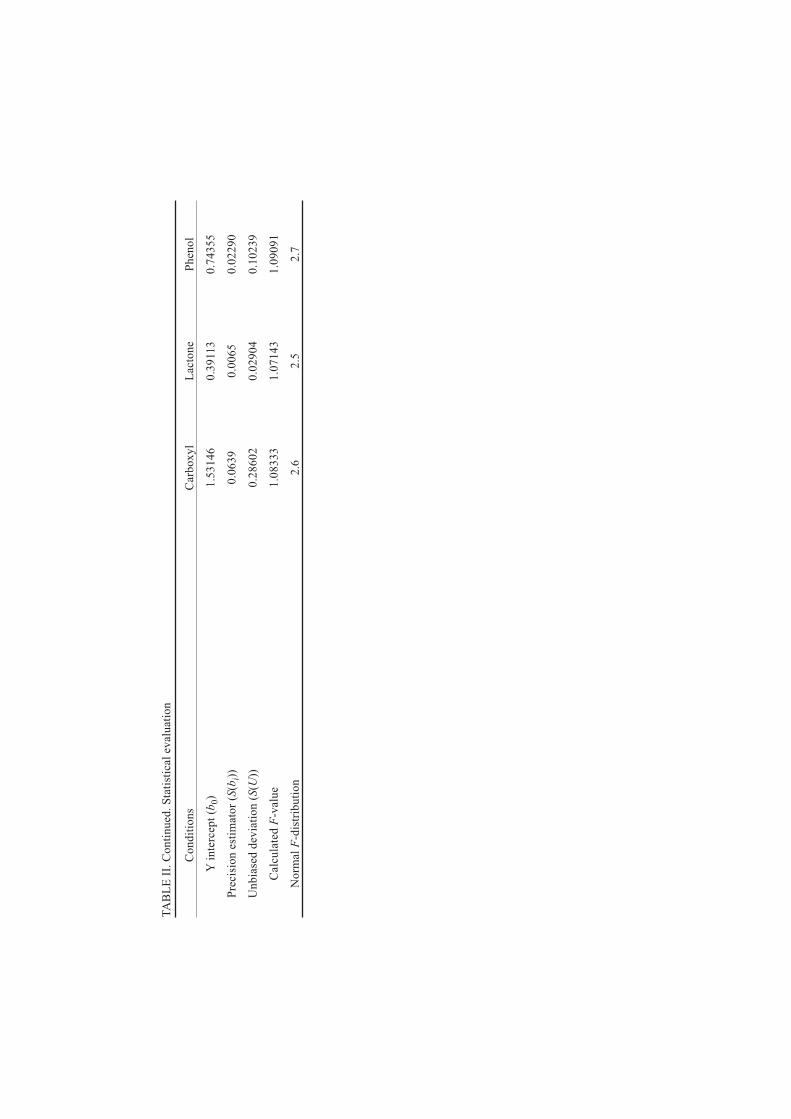
Models reflecting the influence of each operation used in the preparation ofACs on the measured parameters (amount of carboxyl, lactone and phenol func-tional groups on the surface of ACs) are given in the form of a linear regression:
C = b0 + b xj jj��
1
19,
(3)
where C is amount of a functional group (mmol/g) on the surface of an AC sample, b areparameter estimators (coefficients) in the given equation, xj are values of the j-parameterexpressed in terms of dimensionless units. The values of bj and the statistical evaluation ofthe corresponding equations are presented in Table II. The adequacy of each regressionequation was tested by means of an unbiased variance estimator S(U) for experimental er-ror and the F-test. On this basis, the absolute values of bj which were smaller than the pre-cision estimator S(bj) for a certain regression equation were equated to zero. The data inTable II show that all three presented regression equations for carboxyl, lactone and phenolfunctional groups are adequate.
The values of the bj coefficients presented in Table II reflect the influence of theoperations used for the preparation of ACs on the amount of functional groups. Ahigh positive value of bj indicates that mainly this j-operation acts toward increasingthe content of functional groups. A negative value shows that this operation hindersthe process of functional group formation. Comparing the obtained bj values, con-clusions about the process of AC synthesis could be made. An increased amount ofcarboxyl and lactone functional groups is found after chemical activation withNH4Cl (operation X3 in Table I and Table II). High rates of pyrolysis at low tempera-
370 BARKAUSKAS and DERVINYTE
Fig. 2. Amount of conventional surface functional groups found in the batches of AC.
tures (operations X4 and X5) are favorable for the formation of certain surface func-tional groups. On the contrary, at high temperatures this process becomes more fa-vorable for low rates of pyrolysis (operations X6 and X7). The reagents used forchemical activation after the first step of pyrolysis may be divided into severalgroups. Nitric acid is favorable for lactone formation, yet it blocks the formation ofcarboxyl and phenol functional groups. HN4Cl and H2SO4 are agents which stimu-late the formation of all functional groups, while NaClO3 and H2C2O4 could be con-sidered as acting in the opposite direction. Capsulation of the granules with cedarbalsam (operation X16) prevents the formation of surface functional groups. Ther-
SURFACE GROUPS ON ACTIVATED CARBON 371
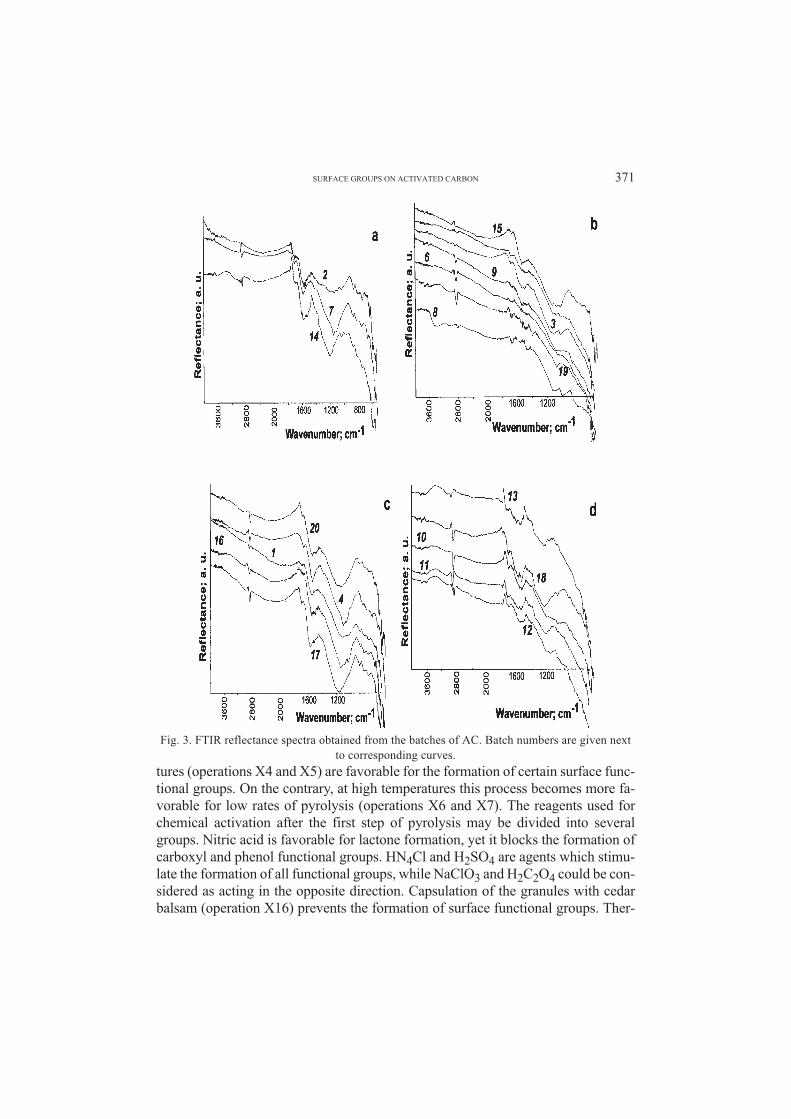
Fig. 3. FTIR reflectance spectra obtained from the batches of AC. Batch numbers are given next
to corresponding curves.
mal shock is favorable for the formation of lactone and phenol functional groups onthe surface of ACs. In general, considering the influence of the operations used forthe preparation of the ACs, it can be concluded that a definite set of surface func-tional groups may be synthesized using an appropriate synthesis protocol.
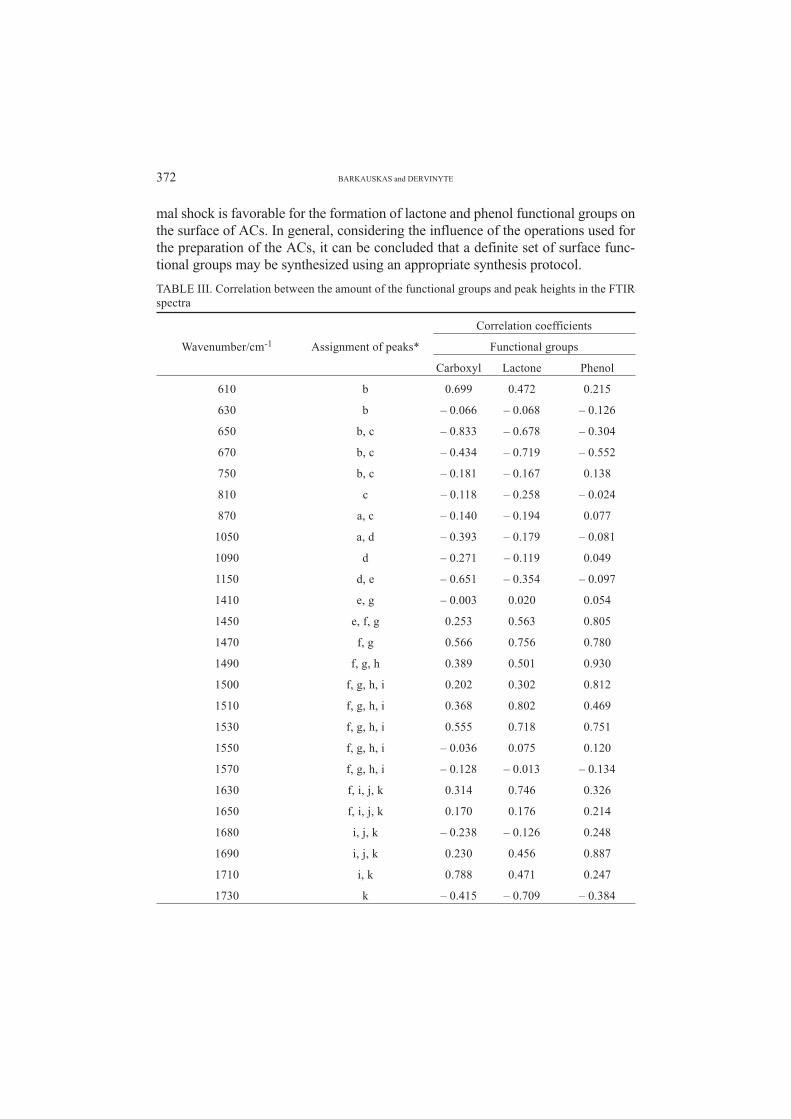
TABLE III. Correlation between the amount of the functional groups and peak heights in the FTIRspectra
Wavenumber/cm-1 Assignment of peaks*
Correlation coefficients
Functional groups
Carboxyl Lactone Phenol
610 b 0.699 0.472 0.215
630 b – 0.066 – 0.068 – 0.126
650 b, c – 0.833 – 0.678 – 0.304
670 b, c – 0.434 – 0.719 – 0.552
750 b, c – 0.181 – 0.167 0.138
810 c – 0.118 – 0.258 – 0.024
870 a, c – 0.140 – 0.194 0.077
1050 a, d – 0.393 – 0.179 – 0.081
1090 d – 0.271 – 0.119 0.049
1150 d, e – 0.651 – 0.354 – 0.097
1410 e, g – 0.003 0.020 0.054
1450 e, f, g 0.253 0.563 0.805
1470 f, g 0.566 0.756 0.780
1490 f, g, h 0.389 0.501 0.930
1500 f, g, h, i 0.202 0.302 0.812
1510 f, g, h, i 0.368 0.802 0.469
1530 f, g, h, i 0.555 0.718 0.751
1550 f, g, h, i – 0.036 0.075 0.120
1570 f, g, h, i – 0.128 – 0.013 – 0.134
1630 f, i, j, k 0.314 0.746 0.326
1650 f, i, j, k 0.170 0.176 0.214
1680 i, j, k – 0.238 – 0.126 0.248
1690 i, j, k 0.230 0.456 0.887
1710 i, k 0.788 0.471 0.247
1730 k – 0.415 – 0.709 – 0.384
372 BARKAUSKAS and DERVINYTE
Wavenumber/cm-1 Assignment of peaks*
Correlation coefficients
Functional groups
Carboxyl Lactone Phenol
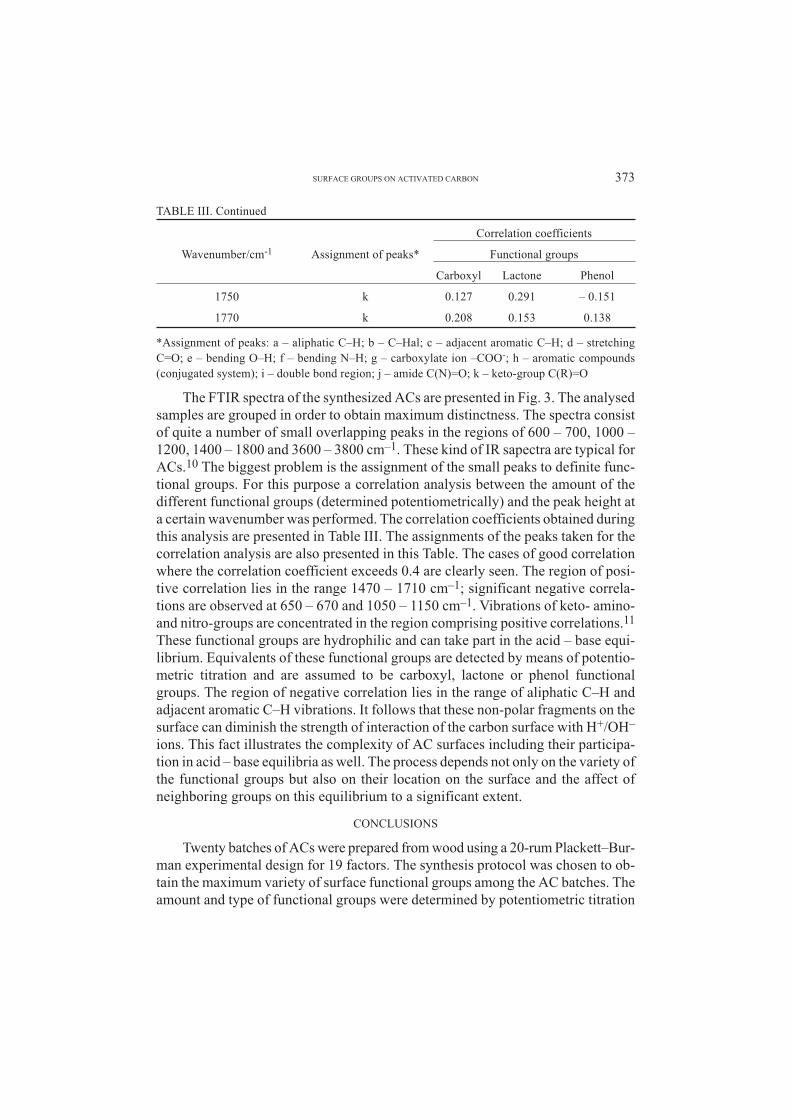
1750 k 0.127 0.291 – 0.151
1770 k 0.208 0.153 0.138
*Assignment of peaks: a – aliphatic C–H; b – C–Hal; c – adjacent aromatic C–H; d – stretching
C=O; e – bending O–H; f – bending N–H; g – carboxylate ion –COO-; h – aromatic compounds
(conjugated system); i – double bond region; j – amide C(N)=O; k – keto-group C(R)=O
The FTIR spectra of the synthesized ACs are presented in Fig. 3. The analysedsamples are grouped in order to obtain maximum distinctness. The spectra consistof quite a number of small overlapping peaks in the regions of 600 – 700, 1000 –1200, 1400 – 1800 and 3600 – 3800 cm–1. These kind of IR sapectra are typical forACs.10 The biggest problem is the assignment of the small peaks to definite func-tional groups. For this purpose a correlation analysis between the amount of thedifferent functional groups (determined potentiometrically) and the peak height ata certain wavenumber was performed. The correlation coefficients obtained duringthis analysis are presented in Table III. The assignments of the peaks taken for thecorrelation analysis are also presented in this Table. The cases of good correlationwhere the correlation coefficient exceeds 0.4 are clearly seen. The region of posi-tive correlation lies in the range 1470 – 1710 cm–1; significant negative correla-tions are observed at 650 – 670 and 1050 – 1150 cm–1. Vibrations of keto- amino-and nitro-groups are concentrated in the region comprising positive correlations.11
These functional groups are hydrophilic and can take part in the acid – base equi-
librium. Equivalents of these functional groups are detected by means of potentio-
metric titration and are assumed to be carboxyl, lactone or phenol functional
groups. The region of negative correlation lies in the range of aliphatic C–H and
adjacent aromatic C–H vibrations. It follows that these non-polar fragments on the
surface can diminish the strength of interaction of the carbon surface with H+/OH–
ions. This fact illustrates the complexity of AC surfaces including their participa-tion in acid – base equilibria as well. The process depends not only on the variety ofthe functional groups but also on their location on the surface and the affect ofneighboring groups on this equilibrium to a significant extent.
CONCLUSIONS
Twenty batches of ACs were prepared from wood using a 20-rum Plackett–Bur-man experimental design for 19 factors. The synthesis protocol was chosen to ob-tain the maximum variety of surface functional groups among the AC batches. Theamount and type of functional groups were determined by potentiometric titration
SURFACE GROUPS ON ACTIVATED CARBON 373
TABLE III. Continued
and FTIR spectroscopy. The results of potentiometric titration were used for theevaluation of the influence of synthesis conditions on the amount and type of func-tional groups formed on the surface of the ACs. Moreover, data from the FTIRspectra were correlated with the results of the potentiometric titrations. The resultsobtained demonstrate both positive and the negative correlations. The positive cor-relations are, in most cases, observed in the region of hydrophilic functionalgroups. The effect of negative correlation is displayed in the range of hydrophobicfunctional groups and surface formations. The results obtained imply that a set offunctional groups on the surface of ACs is affected by mutual interaction to a sig-nificant extent.
I Z V O D
PROU^AVAWE FUNKCIONALNIH GRUPA NA POVR[INI
AKTIVNIH UGQEVA
JURGIS BARKAUSKAS and MARYTE DERVINYTE
Department of General and Inorganic Chemistry, Vilnius University, Naugarduko 24, 2006 Vilnius, Lithuania
Aktivni ugqevi dobiveni su laboratorijski od drveta kori{}ewem Plackett–Burman-ovog
postupka kojim se mo`e u 20 eksperimenata kontrolisati 19 nezavisnih faktora. Dobivene porcije
aktivnog ugqa analizirane su potenciometrijskom titracijom i FTIR spektroskopijom radi
odre|ivawa povr{inskih funkcionalnih grupa. Dobiveni rezultati potenciometrijskih titracija
pokazali su raspodelu pojedina~nih konstanti kiselosti ovih grupa u odre|noj pK oblasti. Na osnovu
ovih parametara povr{inske funkcionalne grupe su podeqene u karboksilne, laktonske i fenolne.
Odre|ene su jedna~ine na osnovu linearne regresione analize koje pokazuju uticaj svake operacije
pri sintezi dobivenih aktivnih ugqeva na broj ovih funkcionalnih grupa. FTIR spektri su kori{}eni,
tako|e, za odre|ivawe vrste i broja ovih funkcionalnih grupa. Korelacionom analizom utvr|en je
odnos izme|u podataka dobijenih potenciometrijskom titracijom i FTIR spektroskopijom. Utvr|eno
je da postoji dobra korelacija izme|u broja funkcionalnih grupa utvr|enog potenciometrijskom
metodom i FTIR spektroskopijom. Me|utim, opa`ena je negativna korelacija izme|u broja
funkcionalnih grupa odre|enog potenciometrijski i intenziteta maksimuma za hidrofobne
funkcionalne grupe u FTIR spektrima. Najverovatnije da ove nepolarne strukture uzimaju u~e{}e u
interakciji povr{ine aktivnog ugwa sa H+/OH- jonima i smawuje ja~inu postoje}ih funkcionalnih
grupa.
(Primqeno 24. aprila, revidirano 16. decembra 2003)
REFERENCES
1. F. Derbyshire, M. Jagtoyen, R. Andrews, A. Rao, I. Martin – Gullón, E. A. Grulke, in Chemistry
and Physics of Carbon, Marcel Dekker, N. Y. 27 (2001) 12. J. Economy, M. Daley, C. Mangun, Activated Carbon Fibers – Past, Present and Futur. Ameri-
can Chemical Society, Division of Fuel Chemistry Preprints, New Orleans, L. A. 1996, p. 3213. D. Pantea, H. Darmstadt, S. Kaliaguine, C. Roy, J. Anal. Appl. Pyrolysis 67 (2003) 554. S.-J. Park, Y.-S. Jand, J.-W. Shim, S.-K. Ryu, J. Coll. Interface Sci. 260 (2003) 2595. C. A. Leon y Leon, L. R. Radovi}, in Chemistry and Physics of Carbon, Marcel Dekker, N. Y. 24
(1994) 2136. P. Haaland, Experimental Design in Biotechnology, Marcel Dekker, N. Y., 1989, p. 2167. A. Contescu, C. Contescu, K. Putyera, J. A. Schwarz, Carbon 35 (1997) 83
374 BARKAUSKAS and DERVINYTE

8. J. Jagiello, T. J. Bandosz, K. Putyera, J. A. Schwarz, J. Colloid Interface Sci. 172 (1995) 3419. H. P. Boehm, E. Diehl, W. Heck, R. Sappok, Angew. Chem. 17 (1964) 742
10. A. A. El-Hendawy, Carbon 41 (2003) 71311. H. A. Szymanski, Infrared Band Handbook, Plenum-Press, N. Y., 1963, p. 350.
SURFACE GROUPS ON ACTIVATED CARBON 375