twigs-derived activated carbons via h3po4/zncl2 composite
TRANSCRIPT
1
Vol.:(0123456789)
Scientific RepoRtS | (2020) 10:14050 | https://doi.org/10.1038/s41598-020-71034-6
www.nature.com/scientificreports
twigs‑derived activated carbons via H3po4/Zncl2 composite activation for methylene blue and congo red dyes removalMuhammad Hadzirun Muhamad Zubir1,2 & Muhammad Abbas Ahmad Zaini1,2*
this work is aimed at evaluating the conversion of Pterocarpus indicus twigs into activated carbon via composite chemical activation for methylene blue and congo red dyes adsorption. the activated carbons were prepared by single‑step chemical activation using zinc chloride and/or phosphoric acid at different mass impregnation ratios at 600 °C for 90 min. The activated carbons were characterized for textural properties and surface chemistry. The batch adsorption was investigated at different concentrations (5–1,000 mg/L), contact times (2–540 min) and temperatures (30–60 °C). Phosphoric acid-activated twigs carbon showed a high surface area of 1,445 m2/g with maximum methylene blue adsorption capacity of 438 mg/g. On the other hand, a composite-activated carbon yields a 217 mg/g of congo red removal. The adsorption data for both dyes fitted well with Langmuir and pseudo-second-order kinetics models, indicating the predominance of chemical adsorption through monolayer coverage of dye molecules on the homogenous surface of activated carbon. the thermodynamics properties of dye adsorption onto twigs‑derived activated carbons indicated that the process is endothermic, spontaneous and favourable at high temperature. Overall, activated carbons derived from Pterocarpus indicus twigs could be effectively used for dye wastewater treatment.
In many developing countries worldwide, textile industry is among the vast economy-driven activities with 2.8% rise in demand every year1. However, it becomes a main contributor to water pollution issue that brings about multiple negative impacts to aquatic environment, ecological balance, and human health2. The fabric sector consumes nearly several hundred thousand gallons of water every day, hence generating a large quantity of wastewater3. Typical textile wastewater consists of nutrients such as phosphate, nitrates, micronutrients, and sources of carbon for algae cultivation4. Yet, it also primarily includes colorants and auxiliary chemicals which are toxic and harmful, hence creating negative implications to the water streams5.
Dyestuff components are toxic, carcinogenic, and mutagenic. Generally, dye is persistent for a long duration because the molecular structure is complex and can withstand degradation by sunlight and microorganism in water. Additionally, dye in water can impede the penetration of sunlight, thereby reducing the rate of photo-synthesis and consequently results in oxygen deficiency for respiration6. Dyes can be categorized into anionic, cationic, and non-ionic. For example, methylene blue (basic blue 9) is among the prevalent cationic dyes used in the fabric sector and can cause damaging effects, primarily to the aquatic ecosystem and human health.
Wastewater treatment strategies have been introduced to mitigate water pollution. Among others, adsorption outweighs other removal techniques because the process is simple, economical, and feasible for dye wastewater decontamination even at low concentration depending on the physicochemical properties of adsorbent6. Acti-vated carbon is a commonly used adsorbent in adsorption. It can be produced from cellulosic and carbonaceous materials through physical activation using air, CO2, and steam, or chemical activation using dehydrating agents such as ZnCl2, KOH and H3PO4. Chemical activation brings certain advantages over physical activation, because of lower activation temperature (450–700 °C), high activated carbon yield and high total surface area of activated carbon produced for effective water pollutants removal.
open
1Centre of Lipids Engineering and Applied Research (CLEAR), Ibnu-Sina Institute for Scientific and Industrial Research, Universiti Teknologi Malaysia, 81310 UTM Johor Bharu, Johor, Malaysia. 2School of Chemical and Energy Engineering, Faculty of Engineering, Universiti Teknologi Malaysia, 81310 UTM Johor Bahru, Johor, Malaysia. *email: [email protected]
2
Vol:.(1234567890)
Scientific RepoRtS | (2020) 10:14050 | https://doi.org/10.1038/s41598-020-71034-6
www.nature.com/scientificreports/
To date, the characteristics and adsorptive properties of activated carbons derived from abundantly available natural cellulose, namely Pterocarpus indicus twigs via composite chemical activation are not well documented, therefore worth to be investigated to broaden the body of existing knowledge. The exploitation of combined activating agents, as in this work, H3PO4 and ZnCl2 may contribute significant findings towards dyes adsorption from the viewpoints of surface chemistry and structure of activated carbons produced. Two commonly used dyes in textile industry, namely congo red (anionic dye) and methylene blue (cationic dye) were employed to establish the adsorption profiles of isotherm, kinetics, and thermodynamics to shed insight into industrial applications. The adsorption selectivity and governing mechanisms were also discussed.
Materials and methodsPterocarpus indicus twigs was collected in UTM Johor Bahru campus. It was cut to a size of 1.5–2.0 cm in length and dried in an oven (UFB-400, Memmert, Germany) at 110 °C for 12 h to remove moisture. Zinc chloride and methylene blue dye were purchased from HmbG Chemicals (Hamburg, Germany), while H3PO4 was obtained from R&M Chemicals (Essex, UK). Hydrochloric acid sodium hydroxide and congo red dye were purchased from Merck (Darmstadt, Germany). All chemicals are of analytical grade reagents.
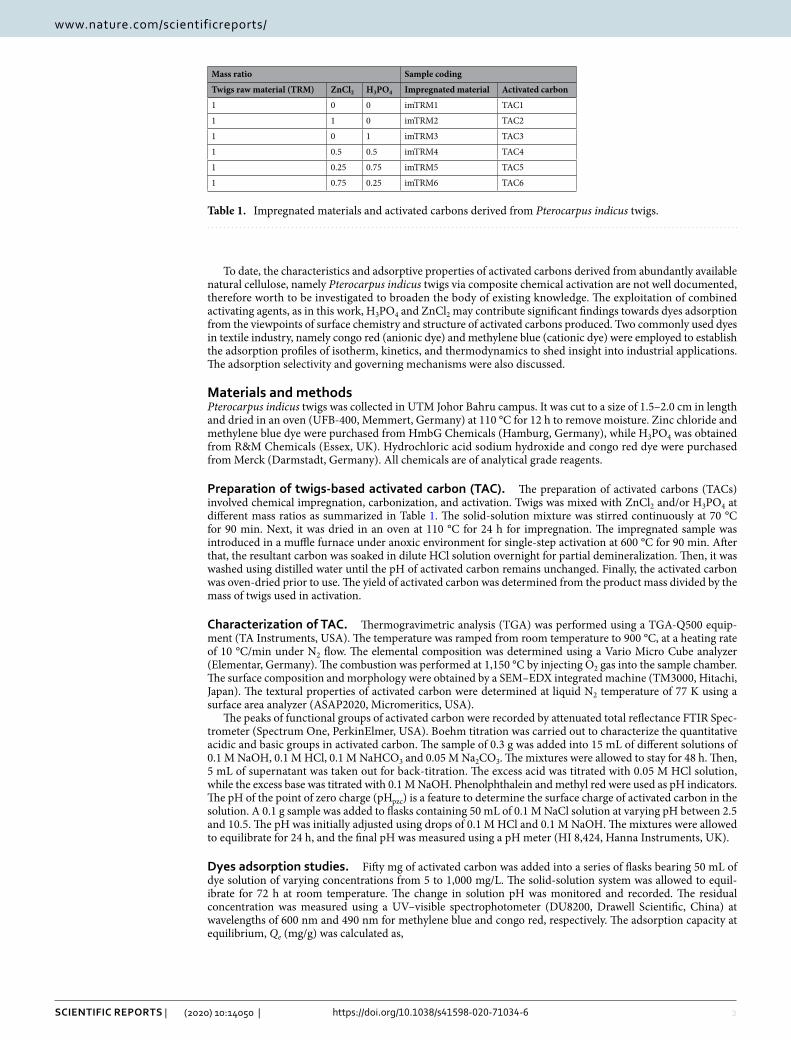
Preparation of twigs-based activated carbon (TAC). The preparation of activated carbons (TACs) involved chemical impregnation, carbonization, and activation. Twigs was mixed with ZnCl2 and/or H3PO4 at different mass ratios as summarized in Table 1. The solid-solution mixture was stirred continuously at 70 °C for 90 min. Next, it was dried in an oven at 110 °C for 24 h for impregnation. The impregnated sample was introduced in a muffle furnace under anoxic environment for single-step activation at 600 °C for 90 min. After that, the resultant carbon was soaked in dilute HCl solution overnight for partial demineralization. Then, it was washed using distilled water until the pH of activated carbon remains unchanged. Finally, the activated carbon was oven-dried prior to use. The yield of activated carbon was determined from the product mass divided by the mass of twigs used in activation.
characterization of tAc . Thermogravimetric analysis (TGA) was performed using a TGA-Q500 equip-ment (TA Instruments, USA). The temperature was ramped from room temperature to 900 °C, at a heating rate of 10 °C/min under N2 flow. The elemental composition was determined using a Vario Micro Cube analyzer (Elementar, Germany). The combustion was performed at 1,150 °C by injecting O2 gas into the sample chamber. The surface composition and morphology were obtained by a SEM–EDX integrated machine (TM3000, Hitachi, Japan). The textural properties of activated carbon were determined at liquid N2 temperature of 77 K using a surface area analyzer (ASAP2020, Micromeritics, USA).
The peaks of functional groups of activated carbon were recorded by attenuated total reflectance FTIR Spec-trometer (Spectrum One, PerkinElmer, USA). Boehm titration was carried out to characterize the quantitative acidic and basic groups in activated carbon. The sample of 0.3 g was added into 15 mL of different solutions of 0.1 M NaOH, 0.1 M HCl, 0.1 M NaHCO3 and 0.05 M Na2CO3. The mixtures were allowed to stay for 48 h. Then, 5 mL of supernatant was taken out for back-titration. The excess acid was titrated with 0.05 M HCl solution, while the excess base was titrated with 0.1 M NaOH. Phenolphthalein and methyl red were used as pH indicators. The pH of the point of zero charge (pHpzc) is a feature to determine the surface charge of activated carbon in the solution. A 0.1 g sample was added to flasks containing 50 mL of 0.1 M NaCl solution at varying pH between 2.5 and 10.5. The pH was initially adjusted using drops of 0.1 M HCl and 0.1 M NaOH. The mixtures were allowed to equilibrate for 24 h, and the final pH was measured using a pH meter (HI 8,424, Hanna Instruments, UK).
Dyes adsorption studies. Fifty mg of activated carbon was added into a series of flasks bearing 50 mL of dye solution of varying concentrations from 5 to 1,000 mg/L. The solid-solution system was allowed to equil-ibrate for 72 h at room temperature. The change in solution pH was monitored and recorded. The residual concentration was measured using a UV–visible spectrophotometer (DU8200, Drawell Scientific, China) at wavelengths of 600 nm and 490 nm for methylene blue and congo red, respectively. The adsorption capacity at equilibrium, Qe (mg/g) was calculated as,
Table 1. Impregnated materials and activated carbons derived from Pterocarpus indicus twigs.
Mass ratio Sample coding
Twigs raw material (TRM) ZnCl2 H3PO4 Impregnated material Activated carbon
1 0 0 imTRM1 TAC1
1 1 0 imTRM2 TAC2
1 0 1 imTRM3 TAC3
1 0.5 0.5 imTRM4 TAC4
1 0.25 0.75 imTRM5 TAC5
1 0.75 0.25 imTRM6 TAC6
3
Vol.:(0123456789)
Scientific RepoRtS | (2020) 10:14050 | https://doi.org/10.1038/s41598-020-71034-6
www.nature.com/scientificreports/
where Co and Ce (mg/L) are initial concentration and equilibrium concentration, respectively, V (L) is the solu-tion volume and m (g) is the mass of activated carbon.
Similar settings were repeated for adsorption kinetics. Fifty mg of activated carbon was added to flasks containing 50 mL of dye solution with concentrations of 20 and 100 mg/L. The system was allowed to stay at ambient temperature and the concentration was measured at different time intervals between 2 and 540 min. The adsorption capacity at time t, Qt (mg/g) was calculated as,
where Ct (mg/L) is the concentration at time, t.The thermodynamic parameters were determined from the equilibrium adsorption at different temperatures
from 30 to 60 °C. The concentrations of 20 and 100 mg/L were selected to represent the adsorption conditions. The pH was left unadjusted for the entire adsorption process. All experiments and measurements were repro-duced in duplicate and the average values were reported.
Models fitting. The adsorption data were analyzed using adsorption models to describe the transport behaviour and removal mechanisms. The isotherm and kinetic models and thermodynamic parameters are summarized in Table S1. The non-linear equations were solved using Microsoft Excel solver.
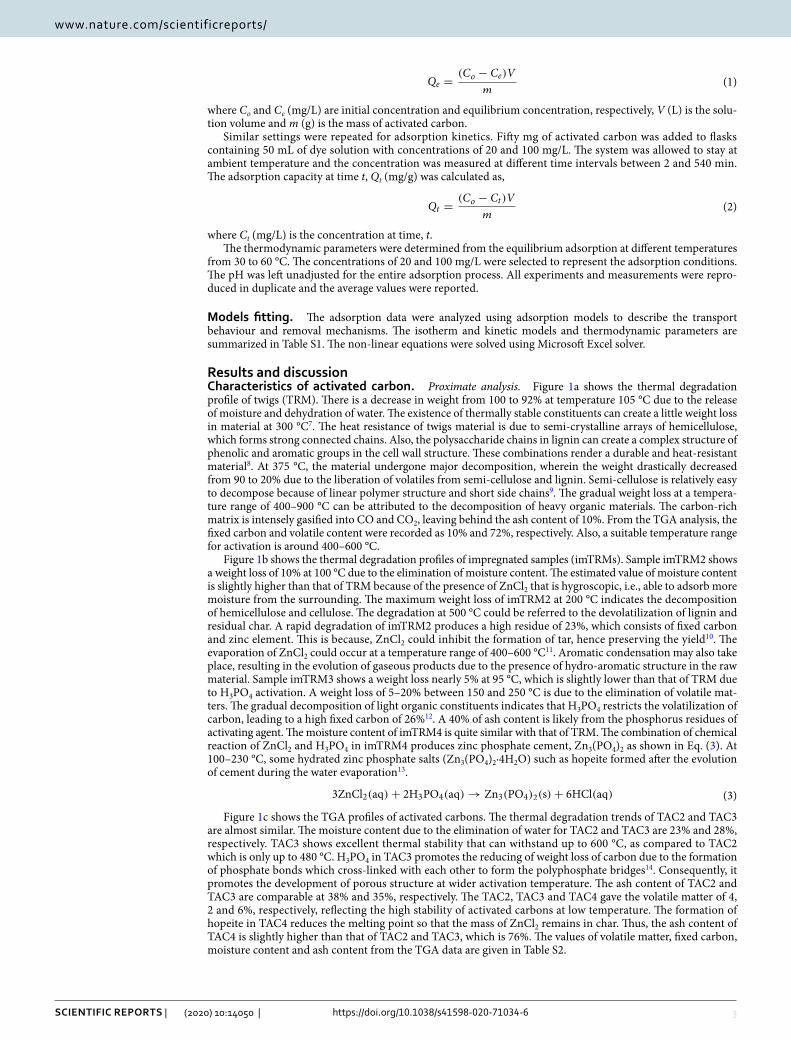
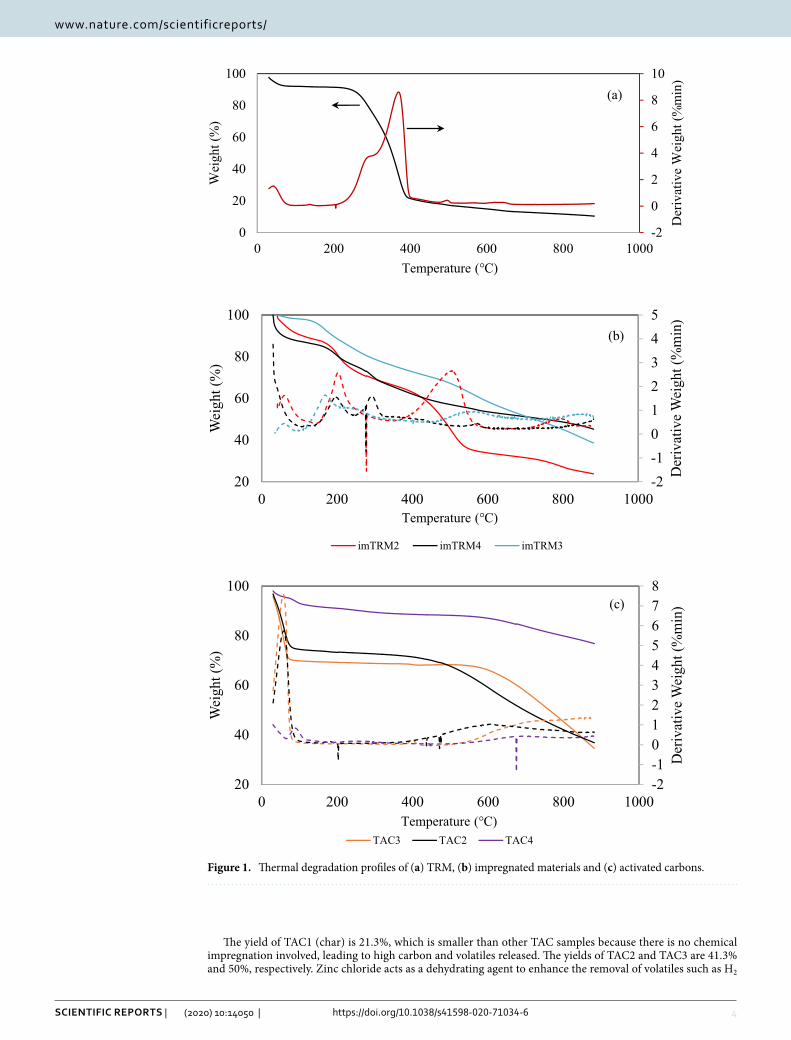
Results and discussioncharacteristics of activated carbon. Proximate analysis. Figure 1a shows the thermal degradation profile of twigs (TRM). There is a decrease in weight from 100 to 92% at temperature 105 °C due to the release of moisture and dehydration of water. The existence of thermally stable constituents can create a little weight loss in material at 300 °C7. The heat resistance of twigs material is due to semi-crystalline arrays of hemicellulose, which forms strong connected chains. Also, the polysaccharide chains in lignin can create a complex structure of phenolic and aromatic groups in the cell wall structure. These combinations render a durable and heat-resistant material8. At 375 °C, the material undergone major decomposition, wherein the weight drastically decreased from 90 to 20% due to the liberation of volatiles from semi-cellulose and lignin. Semi-cellulose is relatively easy to decompose because of linear polymer structure and short side chains9. The gradual weight loss at a tempera-ture range of 400–900 °C can be attributed to the decomposition of heavy organic materials. The carbon-rich matrix is intensely gasified into CO and CO2, leaving behind the ash content of 10%. From the TGA analysis, the fixed carbon and volatile content were recorded as 10% and 72%, respectively. Also, a suitable temperature range for activation is around 400–600 °C.
Figure 1b shows the thermal degradation profiles of impregnated samples (imTRMs). Sample imTRM2 shows a weight loss of 10% at 100 °C due to the elimination of moisture content. The estimated value of moisture content is slightly higher than that of TRM because of the presence of ZnCl2 that is hygroscopic, i.e., able to adsorb more moisture from the surrounding. The maximum weight loss of imTRM2 at 200 °C indicates the decomposition of hemicellulose and cellulose. The degradation at 500 °C could be referred to the devolatilization of lignin and residual char. A rapid degradation of imTRM2 produces a high residue of 23%, which consists of fixed carbon and zinc element. This is because, ZnCl2 could inhibit the formation of tar, hence preserving the yield10. The evaporation of ZnCl2 could occur at a temperature range of 400–600 °C11. Aromatic condensation may also take place, resulting in the evolution of gaseous products due to the presence of hydro-aromatic structure in the raw material. Sample imTRM3 shows a weight loss nearly 5% at 95 °C, which is slightly lower than that of TRM due to H3PO4 activation. A weight loss of 5–20% between 150 and 250 °C is due to the elimination of volatile mat-ters. The gradual decomposition of light organic constituents indicates that H3PO4 restricts the volatilization of carbon, leading to a high fixed carbon of 26%12. A 40% of ash content is likely from the phosphorus residues of activating agent. The moisture content of imTRM4 is quite similar with that of TRM. The combination of chemical reaction of ZnCl2 and H3PO4 in imTRM4 produces zinc phosphate cement, Zn3(PO4)2 as shown in Eq. (3). At 100–230 °C, some hydrated zinc phosphate salts (Zn3(PO4)2·4H2O) such as hopeite formed after the evolution of cement during the water evaporation13.
Figure 1c shows the TGA profiles of activated carbons. The thermal degradation trends of TAC2 and TAC3 are almost similar. The moisture content due to the elimination of water for TAC2 and TAC3 are 23% and 28%, respectively. TAC3 shows excellent thermal stability that can withstand up to 600 °C, as compared to TAC2 which is only up to 480 °C. H3PO4 in TAC3 promotes the reducing of weight loss of carbon due to the formation of phosphate bonds which cross-linked with each other to form the polyphosphate bridges14. Consequently, it promotes the development of porous structure at wider activation temperature. The ash content of TAC2 and TAC3 are comparable at 38% and 35%, respectively. The TAC2, TAC3 and TAC4 gave the volatile matter of 4, 2 and 6%, respectively, reflecting the high stability of activated carbons at low temperature. The formation of hopeite in TAC4 reduces the melting point so that the mass of ZnCl2 remains in char. Thus, the ash content of TAC4 is slightly higher than that of TAC2 and TAC3, which is 76%. The values of volatile matter, fixed carbon, moisture content and ash content from the TGA data are given in Table S2.
(1)Qe =(Co − Ce)V
m
(2)Qt =(Co − Ct)V
m
(3)3ZnCl2(aq)+ 2H3PO4(aq) → Zn3(PO4)2(s)+ 6HCl(aq)
4
Vol:.(1234567890)
Scientific RepoRtS | (2020) 10:14050 | https://doi.org/10.1038/s41598-020-71034-6
www.nature.com/scientificreports/
The yield of TAC1 (char) is 21.3%, which is smaller than other TAC samples because there is no chemical impregnation involved, leading to high carbon and volatiles released. The yields of TAC2 and TAC3 are 41.3% and 50%, respectively. Zinc chloride acts as a dehydrating agent to enhance the removal of volatiles such as H2
-2
0
2
4
6
8
10
0
20
40
60
80
100
0 200 400 600 800 1000
Der
ivat
ive
Wei
ght (
%m
in)
Wei
ght (
%)
Temperature (°C)
Temperature (°C)
Temperature (°C)
(a)
-2-1012345
20
40
60
80
100
0 200 400 600 800 1000
Der
ivat
ive
Wei
ght (
%m
in)
Wei
ght (
%)
imTRM2 imTRM4 imTRM3
-2-1012345678
20
40
60
80
100
0 200 400 600 800 1000
Der
ivat
ive
Wei
ght (
%m
in)
Wei
ght (
%)
TAC3 TAC2 TAC4
(b)
(c)
Figure 1. Thermal degradation profiles of (a) TRM, (b) impregnated materials and (c) activated carbons.
5
Vol.:(0123456789)
Scientific RepoRtS | (2020) 10:14050 | https://doi.org/10.1038/s41598-020-71034-6
www.nature.com/scientificreports/
and O2 from the carbon matrix. It exhibits a high boiling point of 732 °C, and highly soluble in water which accelerates the removal of water and volatile molecules. A high amount of ZnCl2 can accelerate the evaporation of volatiles through the breakdown of aromatic and aliphatic chains. Nevertheless, ZnCl2 can preserve the carbon content via the formation of long aromatic chain structure composed primarily of graphitic structure of carbon atoms, resulting in a high yield of TAC2 as compared to that of TAC1. It comprises of networks of pores with channels constructed within a rigid skeleton of disordered layers of carbon atoms, connected by chemical bonds and stacked unevenly. ZnCl2 also acts in pore drilling that enters the carbon matrix to form large pore volume and high surface area of activated carbon, while at the same time releasing some volatiles10.
The high percentage yield of TAC3 compared to TAC2 is due to the residual phosphorus element present after the activation process because. The phosphate residue from H3PO4 activation is water insoluble. The chemical reaction between H3PO4 and lignocellulosic materials like hemicellulose and lignin during activation creates weak hydrolyze glycosidic linkages, thus accelerating the decomposition process. However, cellulose is not easily broken down because it acts as acid hydrolysis resistant material, leading to the high yield of TAC315.
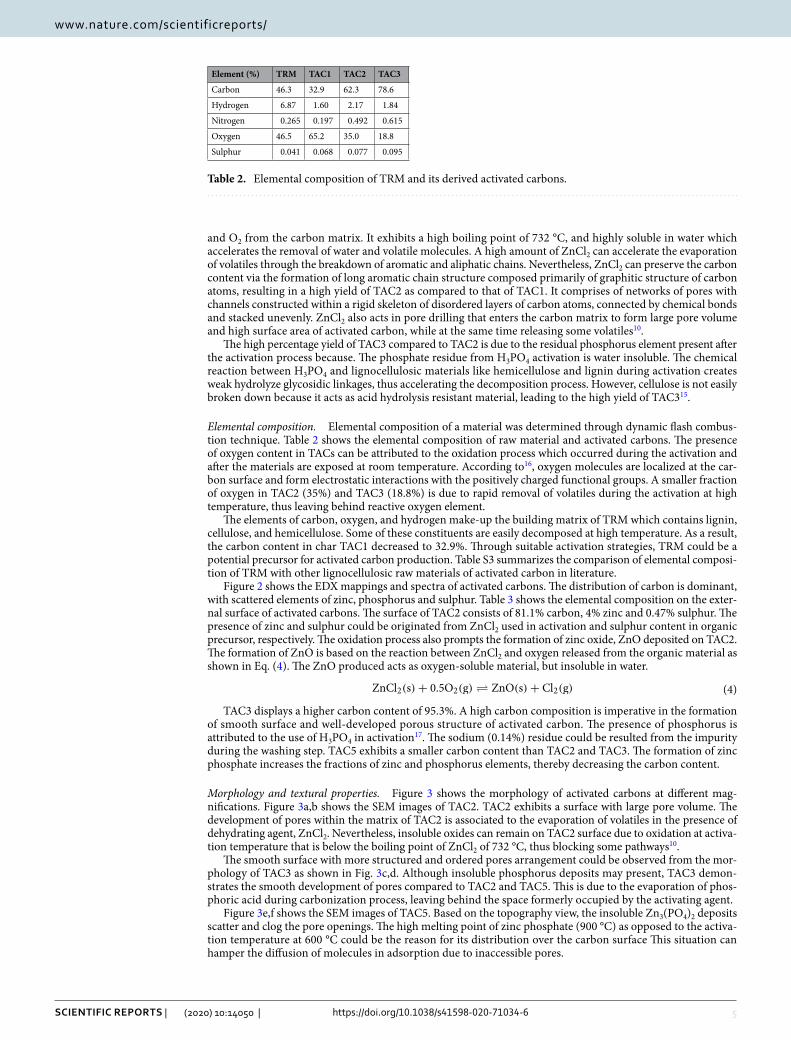
Elemental composition. Elemental composition of a material was determined through dynamic flash combus-tion technique. Table 2 shows the elemental composition of raw material and activated carbons. The presence of oxygen content in TACs can be attributed to the oxidation process which occurred during the activation and after the materials are exposed at room temperature. According to16, oxygen molecules are localized at the car-bon surface and form electrostatic interactions with the positively charged functional groups. A smaller fraction of oxygen in TAC2 (35%) and TAC3 (18.8%) is due to rapid removal of volatiles during the activation at high temperature, thus leaving behind reactive oxygen element.
The elements of carbon, oxygen, and hydrogen make-up the building matrix of TRM which contains lignin, cellulose, and hemicellulose. Some of these constituents are easily decomposed at high temperature. As a result, the carbon content in char TAC1 decreased to 32.9%. Through suitable activation strategies, TRM could be a potential precursor for activated carbon production. Table S3 summarizes the comparison of elemental composi-tion of TRM with other lignocellulosic raw materials of activated carbon in literature.
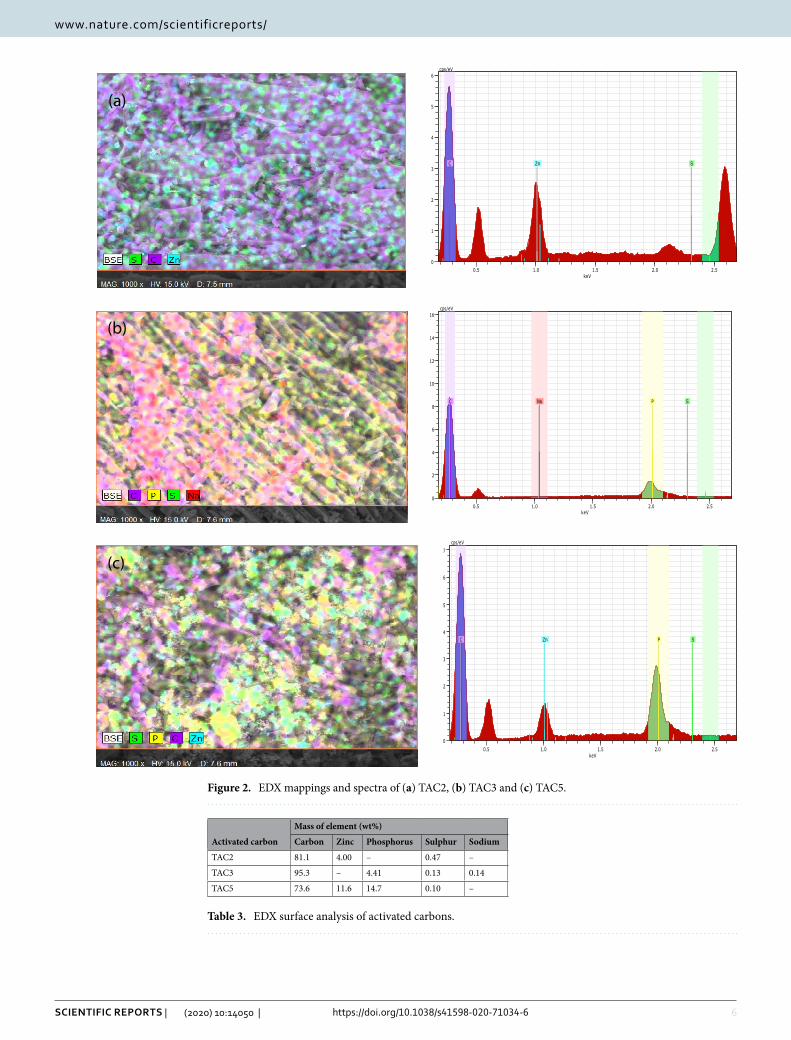
Figure 2 shows the EDX mappings and spectra of activated carbons. The distribution of carbon is dominant, with scattered elements of zinc, phosphorus and sulphur. Table 3 shows the elemental composition on the exter-nal surface of activated carbons. The surface of TAC2 consists of 81.1% carbon, 4% zinc and 0.47% sulphur. The presence of zinc and sulphur could be originated from ZnCl2 used in activation and sulphur content in organic precursor, respectively. The oxidation process also prompts the formation of zinc oxide, ZnO deposited on TAC2. The formation of ZnO is based on the reaction between ZnCl2 and oxygen released from the organic material as shown in Eq. (4). The ZnO produced acts as oxygen-soluble material, but insoluble in water.
TAC3 displays a higher carbon content of 95.3%. A high carbon composition is imperative in the formation of smooth surface and well-developed porous structure of activated carbon. The presence of phosphorus is attributed to the use of H3PO4 in activation17. The sodium (0.14%) residue could be resulted from the impurity during the washing step. TAC5 exhibits a smaller carbon content than TAC2 and TAC3. The formation of zinc phosphate increases the fractions of zinc and phosphorus elements, thereby decreasing the carbon content.
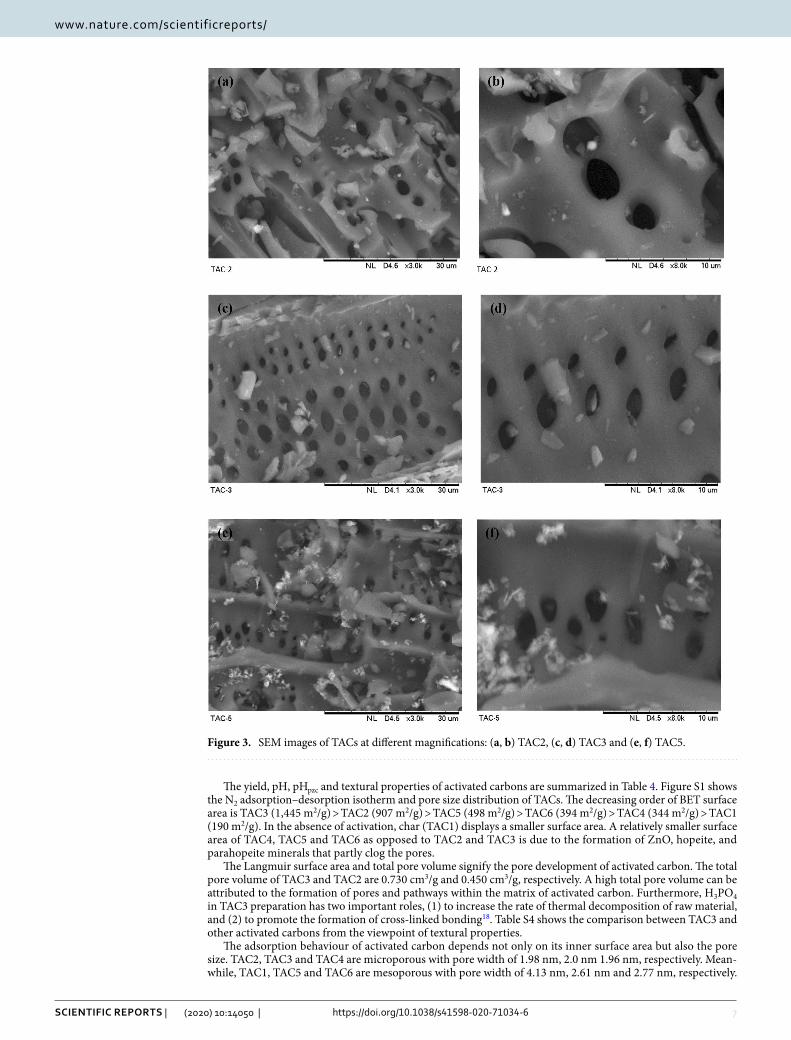
Morphology and textural properties. Figure 3 shows the morphology of activated carbons at different mag-nifications. Figure 3a,b shows the SEM images of TAC2. TAC2 exhibits a surface with large pore volume. The development of pores within the matrix of TAC2 is associated to the evaporation of volatiles in the presence of dehydrating agent, ZnCl2. Nevertheless, insoluble oxides can remain on TAC2 surface due to oxidation at activa-tion temperature that is below the boiling point of ZnCl2 of 732 °C, thus blocking some pathways10.
The smooth surface with more structured and ordered pores arrangement could be observed from the mor-phology of TAC3 as shown in Fig. 3c,d. Although insoluble phosphorus deposits may present, TAC3 demon-strates the smooth development of pores compared to TAC2 and TAC5. This is due to the evaporation of phos-phoric acid during carbonization process, leaving behind the space formerly occupied by the activating agent.
Figure 3e,f shows the SEM images of TAC5. Based on the topography view, the insoluble Zn3(PO4)2 deposits scatter and clog the pore openings. The high melting point of zinc phosphate (900 °C) as opposed to the activa-tion temperature at 600 °C could be the reason for its distribution over the carbon surface This situation can hamper the diffusion of molecules in adsorption due to inaccessible pores.
(4)ZnCl2(s)+ 0.5O2(g) ⇋ ZnO(s)+ Cl2(g)
Table 2. Elemental composition of TRM and its derived activated carbons.
Element (%) TRM TAC1 TAC2 TAC3
Carbon 46.3 32.9 62.3 78.6
Hydrogen 6.87 1.60 2.17 1.84
Nitrogen 0.265 0.197 0.492 0.615
Oxygen 46.5 65.2 35.0 18.8
Sulphur 0.041 0.068 0.077 0.095
6
Vol:.(1234567890)
Scientific RepoRtS | (2020) 10:14050 | https://doi.org/10.1038/s41598-020-71034-6
www.nature.com/scientificreports/
0.5 1.0 1.5 2.0 2.5keV
0
1
2
3
4
5
6 cps/eV
S C Zn
(a)
0.5 1.0 1.5 2.0 2.5keV
0
2
4
6
8
10
12
14
16 cps/eV
C P S Na
0.5 1.0 1.5 2.0 2.5keV
0
1
2
3
4
5
6
7 cps/eV
S P C Zn
(b)
(c)
Figure 2. EDX mappings and spectra of (a) TAC2, (b) TAC3 and (c) TAC5.
Table 3. EDX surface analysis of activated carbons.
Activated carbon
Mass of element (wt%)
Carbon Zinc Phosphorus Sulphur Sodium
TAC2 81.1 4.00 – 0.47 –
TAC3 95.3 – 4.41 0.13 0.14
TAC5 73.6 11.6 14.7 0.10 –
7
Vol.:(0123456789)
Scientific RepoRtS | (2020) 10:14050 | https://doi.org/10.1038/s41598-020-71034-6
www.nature.com/scientificreports/
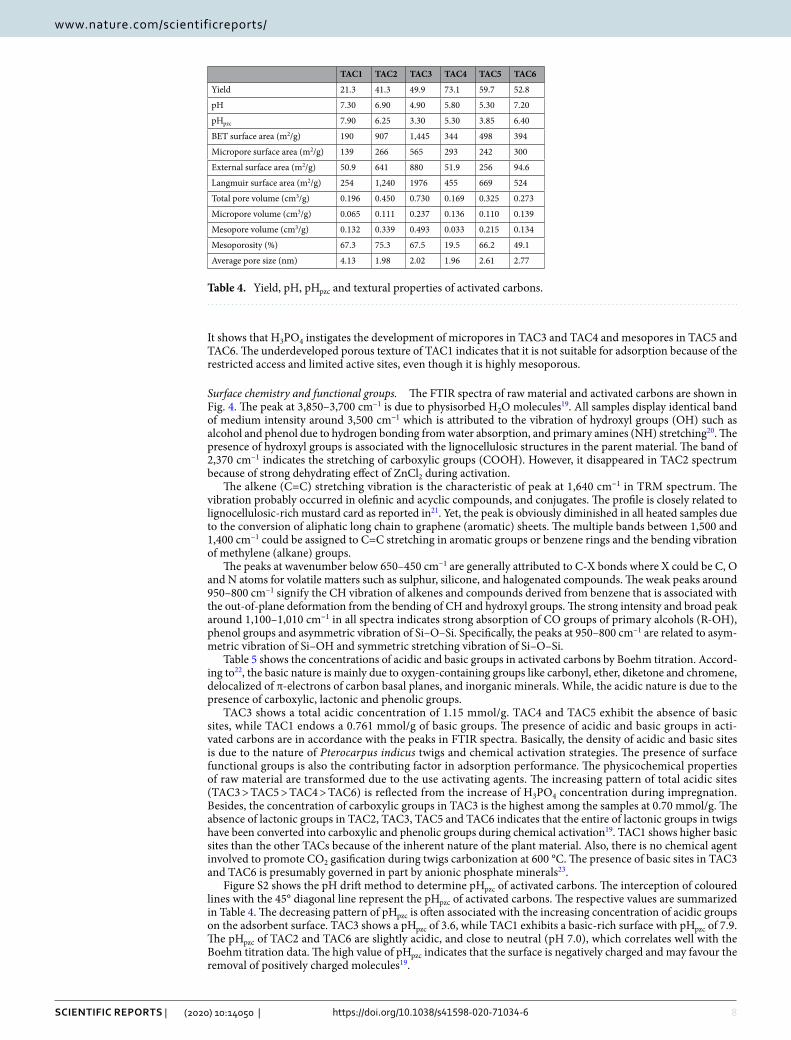
The yield, pH, pHpzc and textural properties of activated carbons are summarized in Table 4. Figure S1 shows the N2 adsorption–desorption isotherm and pore size distribution of TACs. The decreasing order of BET surface area is TAC3 (1,445 m2/g) > TAC2 (907 m2/g) > TAC5 (498 m2/g) > TAC6 (394 m2/g) > TAC4 (344 m2/g) > TAC1 (190 m2/g). In the absence of activation, char (TAC1) displays a smaller surface area. A relatively smaller surface area of TAC4, TAC5 and TAC6 as opposed to TAC2 and TAC3 is due to the formation of ZnO, hopeite, and parahopeite minerals that partly clog the pores.
The Langmuir surface area and total pore volume signify the pore development of activated carbon. The total pore volume of TAC3 and TAC2 are 0.730 cm3/g and 0.450 cm3/g, respectively. A high total pore volume can be attributed to the formation of pores and pathways within the matrix of activated carbon. Furthermore, H3PO4 in TAC3 preparation has two important roles, (1) to increase the rate of thermal decomposition of raw material, and (2) to promote the formation of cross-linked bonding18. Table S4 shows the comparison between TAC3 and other activated carbons from the viewpoint of textural properties.
The adsorption behaviour of activated carbon depends not only on its inner surface area but also the pore size. TAC2, TAC3 and TAC4 are microporous with pore width of 1.98 nm, 2.0 nm 1.96 nm, respectively. Mean-while, TAC1, TAC5 and TAC6 are mesoporous with pore width of 4.13 nm, 2.61 nm and 2.77 nm, respectively.
Figure 3. SEM images of TACs at different magnifications: (a, b) TAC2, (c, d) TAC3 and (e, f) TAC5.
8
Vol:.(1234567890)
Scientific RepoRtS | (2020) 10:14050 | https://doi.org/10.1038/s41598-020-71034-6
www.nature.com/scientificreports/
It shows that H3PO4 instigates the development of micropores in TAC3 and TAC4 and mesopores in TAC5 and TAC6. The underdeveloped porous texture of TAC1 indicates that it is not suitable for adsorption because of the restricted access and limited active sites, even though it is highly mesoporous.
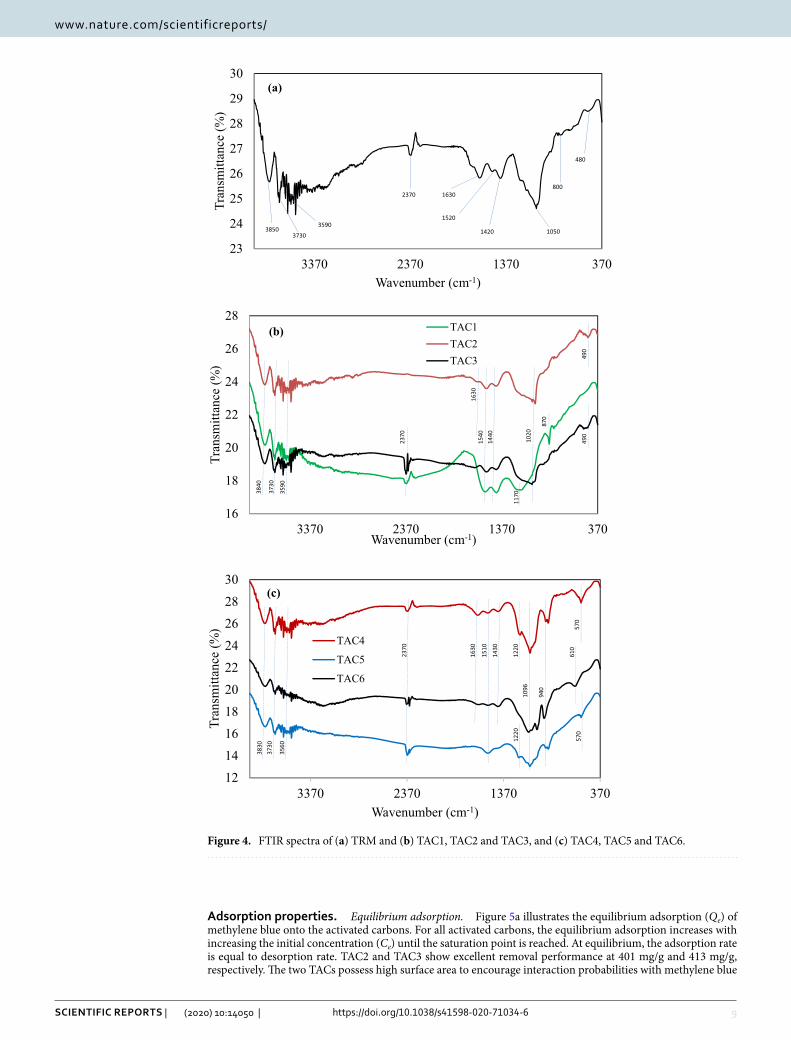
Surface chemistry and functional groups. The FTIR spectra of raw material and activated carbons are shown in Fig. 4. The peak at 3,850–3,700 cm−1 is due to physisorbed H2O molecules19. All samples display identical band of medium intensity around 3,500 cm−1 which is attributed to the vibration of hydroxyl groups (OH) such as alcohol and phenol due to hydrogen bonding from water absorption, and primary amines (NH) stretching20. The presence of hydroxyl groups is associated with the lignocellulosic structures in the parent material. The band of 2,370 cm−1 indicates the stretching of carboxylic groups (COOH). However, it disappeared in TAC2 spectrum because of strong dehydrating effect of ZnCl2 during activation.
The alkene (C=C) stretching vibration is the characteristic of peak at 1,640 cm−1 in TRM spectrum. The vibration probably occurred in olefinic and acyclic compounds, and conjugates. The profile is closely related to lignocellulosic-rich mustard card as reported in21. Yet, the peak is obviously diminished in all heated samples due to the conversion of aliphatic long chain to graphene (aromatic) sheets. The multiple bands between 1,500 and 1,400 cm−1 could be assigned to C=C stretching in aromatic groups or benzene rings and the bending vibration of methylene (alkane) groups.
The peaks at wavenumber below 650–450 cm−1 are generally attributed to C-X bonds where X could be C, O and N atoms for volatile matters such as sulphur, silicone, and halogenated compounds. The weak peaks around 950–800 cm−1 signify the CH vibration of alkenes and compounds derived from benzene that is associated with the out-of-plane deformation from the bending of CH and hydroxyl groups. The strong intensity and broad peak around 1,100–1,010 cm−1 in all spectra indicates strong absorption of CO groups of primary alcohols (R-OH), phenol groups and asymmetric vibration of Si–O–Si. Specifically, the peaks at 950–800 cm−1 are related to asym-metric vibration of Si–OH and symmetric stretching vibration of Si–O–Si.
Table 5 shows the concentrations of acidic and basic groups in activated carbons by Boehm titration. Accord-ing to22, the basic nature is mainly due to oxygen-containing groups like carbonyl, ether, diketone and chromene, delocalized of π-electrons of carbon basal planes, and inorganic minerals. While, the acidic nature is due to the presence of carboxylic, lactonic and phenolic groups.
TAC3 shows a total acidic concentration of 1.15 mmol/g. TAC4 and TAC5 exhibit the absence of basic sites, while TAC1 endows a 0.761 mmol/g of basic groups. The presence of acidic and basic groups in acti-vated carbons are in accordance with the peaks in FTIR spectra. Basically, the density of acidic and basic sites is due to the nature of Pterocarpus indicus twigs and chemical activation strategies. The presence of surface functional groups is also the contributing factor in adsorption performance. The physicochemical properties of raw material are transformed due to the use activating agents. The increasing pattern of total acidic sites (TAC3 > TAC5 > TAC4 > TAC6) is reflected from the increase of H3PO4 concentration during impregnation. Besides, the concentration of carboxylic groups in TAC3 is the highest among the samples at 0.70 mmol/g. The absence of lactonic groups in TAC2, TAC3, TAC5 and TAC6 indicates that the entire of lactonic groups in twigs have been converted into carboxylic and phenolic groups during chemical activation19. TAC1 shows higher basic sites than the other TACs because of the inherent nature of the plant material. Also, there is no chemical agent involved to promote CO2 gasification during twigs carbonization at 600 °C. The presence of basic sites in TAC3 and TAC6 is presumably governed in part by anionic phosphate minerals23.
Figure S2 shows the pH drift method to determine pHpzc of activated carbons. The interception of coloured lines with the 45° diagonal line represent the pHpzc of activated carbons. The respective values are summarized in Table 4. The decreasing pattern of pHpzc is often associated with the increasing concentration of acidic groups on the adsorbent surface. TAC3 shows a pHpzc of 3.6, while TAC1 exhibits a basic-rich surface with pHpzc of 7.9. The pHpzc of TAC2 and TAC6 are slightly acidic, and close to neutral (pH 7.0), which correlates well with the Boehm titration data. The high value of pHpzc indicates that the surface is negatively charged and may favour the removal of positively charged molecules19.
Table 4. Yield, pH, pHpzc and textural properties of activated carbons.
TAC1 TAC2 TAC3 TAC4 TAC5 TAC6
Yield 21.3 41.3 49.9 73.1 59.7 52.8
pH 7.30 6.90 4.90 5.80 5.30 7.20
pHpzc 7.90 6.25 3.30 5.30 3.85 6.40
BET surface area (m2/g) 190 907 1,445 344 498 394
Micropore surface area (m2/g) 139 266 565 293 242 300
External surface area (m2/g) 50.9 641 880 51.9 256 94.6
Langmuir surface area (m2/g) 254 1,240 1976 455 669 524
Total pore volume (cm3/g) 0.196 0.450 0.730 0.169 0.325 0.273
Micropore volume (cm3/g) 0.065 0.111 0.237 0.136 0.110 0.139
Mesopore volume (cm3/g) 0.132 0.339 0.493 0.033 0.215 0.134
Mesoporosity (%) 67.3 75.3 67.5 19.5 66.2 49.1
Average pore size (nm) 4.13 1.98 2.02 1.96 2.61 2.77
9
Vol.:(0123456789)
Scientific RepoRtS | (2020) 10:14050 | https://doi.org/10.1038/s41598-020-71034-6
www.nature.com/scientificreports/
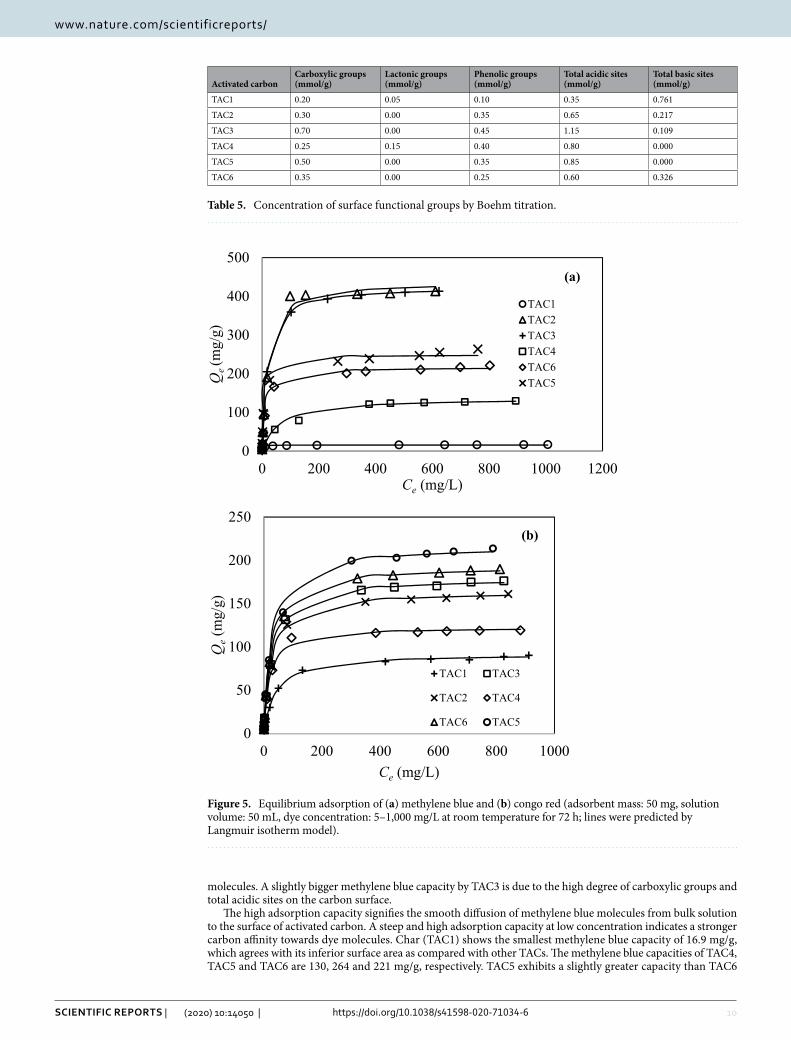
Adsorption properties. Equilibrium adsorption. Figure 5a illustrates the equilibrium adsorption (Qe) of methylene blue onto the activated carbons. For all activated carbons, the equilibrium adsorption increases with increasing the initial concentration (Ce) until the saturation point is reached. At equilibrium, the adsorption rate is equal to desorption rate. TAC2 and TAC3 show excellent removal performance at 401 mg/g and 413 mg/g, respectively. The two TACs possess high surface area to encourage interaction probabilities with methylene blue
23
24
25
26
27
28
29
30
370137023703370
Tran
smitt
ance
(%)
Wavenumber (cm-1)
16
18
20
22
24
26
28
370137023703370
Tran
smitt
ance
(%)
Wavenumber (cm-1)
TAC1TAC2TAC3
(b)
3590
(a)
3850 3730
800
480
1050 1420
1630 2370
3590 1520
3840
3730
2370
1540
1440
1020
1170
870
490
490
1630
12141618202224262830
370137023703370
Tran
smitt
ance
(%)
Wavenumber (cm-1)
TAC4
TAC5
TAC6
(c)
3830
37
30
3560
2370
1630
1510
1430
1220
12
20
1096
940
610
570
570
Figure 4. FTIR spectra of (a) TRM and (b) TAC1, TAC2 and TAC3, and (c) TAC4, TAC5 and TAC6.
10
Vol:.(1234567890)
Scientific RepoRtS | (2020) 10:14050 | https://doi.org/10.1038/s41598-020-71034-6
www.nature.com/scientificreports/
molecules. A slightly bigger methylene blue capacity by TAC3 is due to the high degree of carboxylic groups and total acidic sites on the carbon surface.
The high adsorption capacity signifies the smooth diffusion of methylene blue molecules from bulk solution to the surface of activated carbon. A steep and high adsorption capacity at low concentration indicates a stronger carbon affinity towards dye molecules. Char (TAC1) shows the smallest methylene blue capacity of 16.9 mg/g, which agrees with its inferior surface area as compared with other TACs. The methylene blue capacities of TAC4, TAC5 and TAC6 are 130, 264 and 221 mg/g, respectively. TAC5 exhibits a slightly greater capacity than TAC6
Table 5. Concentration of surface functional groups by Boehm titration.
Activated carbonCarboxylic groups (mmol/g)
Lactonic groups (mmol/g)
Phenolic groups (mmol/g)
Total acidic sites (mmol/g)
Total basic sites (mmol/g)
TAC1 0.20 0.05 0.10 0.35 0.761
TAC2 0.30 0.00 0.35 0.65 0.217
TAC3 0.70 0.00 0.45 1.15 0.109
TAC4 0.25 0.15 0.40 0.80 0.000
TAC5 0.50 0.00 0.35 0.85 0.000
TAC6 0.35 0.00 0.25 0.60 0.326
0
100
200
300
400
500
0 200 400 600 800 1000 1200
Qe(m
g/g)
Ce (mg/L)
TAC1TAC2TAC3TAC4TAC6TAC5
(a)
0
50
100
150
200
250
0 200 400 600 800 1000
Qe
(mg/
g)
Ce (mg/L)
TAC1 TAC3
TAC2 TAC4
TAC6 TAC5
(b)
Figure 5. Equilibrium adsorption of (a) methylene blue and (b) congo red (adsorbent mass: 50 mg, solution volume: 50 mL, dye concentration: 5–1,000 mg/L at room temperature for 72 h; lines were predicted by Langmuir isotherm model).
11
Vol.:(0123456789)
Scientific RepoRtS | (2020) 10:14050 | https://doi.org/10.1038/s41598-020-71034-6
www.nature.com/scientificreports/
because of higher surface area and smaller pHpzc. This signifies the primary role of surface area (pore volume) and pHpzc in methylene blue adsorption by TACs. Generally, the positively charged dye shows a stronger elec-trostatic attraction with the negatively charged carbon surface, which correlates well with the pHpzc and Boehm titration data.
Figure 5b shows the equilibrium adsorption of congo red onto activated carbons. A small adsorption indi-cates that the adsorption is concentration-dependent due to limited number of dye molecules in solution at low concentration. The highest congo red capacity is 214 mg/g (TAC5), which is about half that of methylene blue (in mass basis). TAC6 endows a 190 mg/g capacity of congo red. It implies the role of zinc phosphate complex in the performance of TAC5 and TAC6. The formation of complex can be represented as ligand that forms strong covalent bonds with anionic molecules24. A better performance of TAC5 than that of TAC6 is due to high H3PO4 concentration used in activation that results in a higher surface area of 498 m2/g.
The negatively charged surface of TAC3 creates electrostatic repulsion that weakens the dispersion forces, hence decreasing the adsorption capacity25. Nevertheless, the removal performance of TAC2 (161.1 mg/g) and TAC3 (176.2 mg/g) can still be considered high when compared to that of TAC1 and TAC4. This can be attributed to the high surface area and pore volume of the former. Furthermore, the high adsorption capacity of TAC3 is due to the presence of H3PO4 that increases the chemisorbed oxygen on the carbon surface26 . TAC1 shows a 90.3 mg/g capacity of congo red. TAC4 also possesses a low adsorption capacity (119.1 mg/g) than other treated activated carbons due to poor pore development.
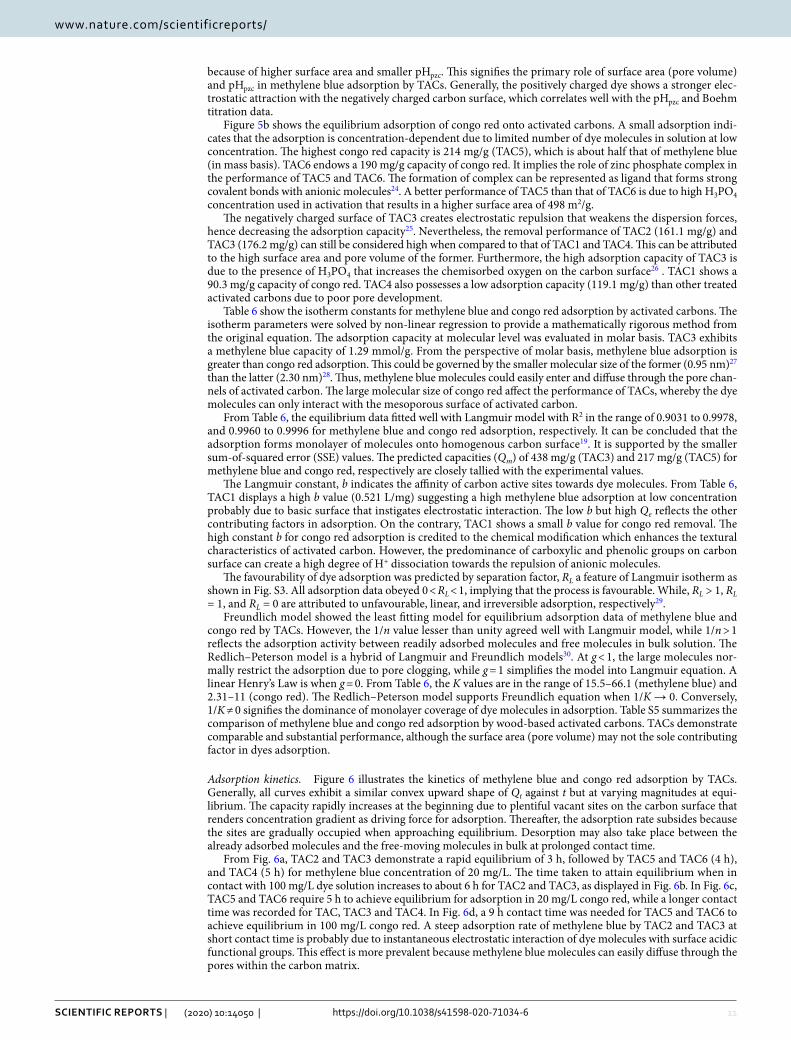
Table 6 show the isotherm constants for methylene blue and congo red adsorption by activated carbons. The isotherm parameters were solved by non-linear regression to provide a mathematically rigorous method from the original equation. The adsorption capacity at molecular level was evaluated in molar basis. TAC3 exhibits a methylene blue capacity of 1.29 mmol/g. From the perspective of molar basis, methylene blue adsorption is greater than congo red adsorption. This could be governed by the smaller molecular size of the former (0.95 nm)27 than the latter (2.30 nm)28. Thus, methylene blue molecules could easily enter and diffuse through the pore chan-nels of activated carbon. The large molecular size of congo red affect the performance of TACs, whereby the dye molecules can only interact with the mesoporous surface of activated carbon.
From Table 6, the equilibrium data fitted well with Langmuir model with R2 in the range of 0.9031 to 0.9978, and 0.9960 to 0.9996 for methylene blue and congo red adsorption, respectively. It can be concluded that the adsorption forms monolayer of molecules onto homogenous carbon surface19. It is supported by the smaller sum-of-squared error (SSE) values. The predicted capacities (Qm) of 438 mg/g (TAC3) and 217 mg/g (TAC5) for methylene blue and congo red, respectively are closely tallied with the experimental values.
The Langmuir constant, b indicates the affinity of carbon active sites towards dye molecules. From Table 6, TAC1 displays a high b value (0.521 L/mg) suggesting a high methylene blue adsorption at low concentration probably due to basic surface that instigates electrostatic interaction. The low b but high Qe reflects the other contributing factors in adsorption. On the contrary, TAC1 shows a small b value for congo red removal. The high constant b for congo red adsorption is credited to the chemical modification which enhances the textural characteristics of activated carbon. However, the predominance of carboxylic and phenolic groups on carbon surface can create a high degree of H+ dissociation towards the repulsion of anionic molecules.
The favourability of dye adsorption was predicted by separation factor, RL a feature of Langmuir isotherm as shown in Fig. S3. All adsorption data obeyed 0 < RL < 1, implying that the process is favourable. While, RL > 1, RL = 1, and RL = 0 are attributed to unfavourable, linear, and irreversible adsorption, respectively29.
Freundlich model showed the least fitting model for equilibrium adsorption data of methylene blue and congo red by TACs. However, the 1/n value lesser than unity agreed well with Langmuir model, while 1/n > 1 reflects the adsorption activity between readily adsorbed molecules and free molecules in bulk solution. The Redlich–Peterson model is a hybrid of Langmuir and Freundlich models30. At g < 1, the large molecules nor-mally restrict the adsorption due to pore clogging, while g = 1 simplifies the model into Langmuir equation. A linear Henry’s Law is when g = 0. From Table 6, the K values are in the range of 15.5–66.1 (methylene blue) and 2.31–11 (congo red). The Redlich–Peterson model supports Freundlich equation when 1/K → 0. Conversely, 1/K ≠ 0 signifies the dominance of monolayer coverage of dye molecules in adsorption. Table S5 summarizes the comparison of methylene blue and congo red adsorption by wood-based activated carbons. TACs demonstrate comparable and substantial performance, although the surface area (pore volume) may not the sole contributing factor in dyes adsorption.
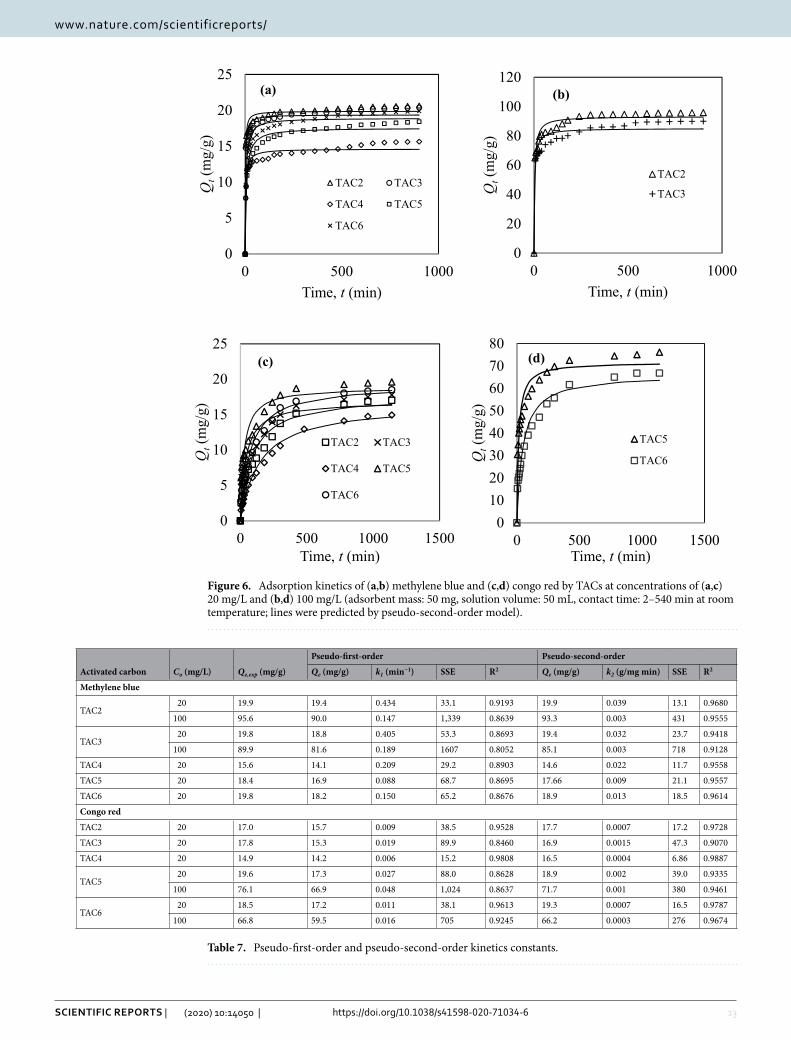
Adsorption kinetics. Figure 6 illustrates the kinetics of methylene blue and congo red adsorption by TACs. Generally, all curves exhibit a similar convex upward shape of Qt against t but at varying magnitudes at equi-librium. The capacity rapidly increases at the beginning due to plentiful vacant sites on the carbon surface that renders concentration gradient as driving force for adsorption. Thereafter, the adsorption rate subsides because the sites are gradually occupied when approaching equilibrium. Desorption may also take place between the already adsorbed molecules and the free-moving molecules in bulk at prolonged contact time.
From Fig. 6a, TAC2 and TAC3 demonstrate a rapid equilibrium of 3 h, followed by TAC5 and TAC6 (4 h), and TAC4 (5 h) for methylene blue concentration of 20 mg/L. The time taken to attain equilibrium when in contact with 100 mg/L dye solution increases to about 6 h for TAC2 and TAC3, as displayed in Fig. 6b. In Fig. 6c, TAC5 and TAC6 require 5 h to achieve equilibrium for adsorption in 20 mg/L congo red, while a longer contact time was recorded for TAC, TAC3 and TAC4. In Fig. 6d, a 9 h contact time was needed for TAC5 and TAC6 to achieve equilibrium in 100 mg/L congo red. A steep adsorption rate of methylene blue by TAC2 and TAC3 at short contact time is probably due to instantaneous electrostatic interaction of dye molecules with surface acidic functional groups. This effect is more prevalent because methylene blue molecules can easily diffuse through the pores within the carbon matrix.
12
Vol:.(1234567890)
Scientific RepoRtS | (2020) 10:14050 | https://doi.org/10.1038/s41598-020-71034-6
www.nature.com/scientificreports/
Table 7 summarizes the kinetics constants of methylene blue and congo red adsorption by TACs. The models demonstrate the rate-limiting step in adsorption. From Table 7, the pseudo-second-order model shows a good correlation with the kinetics data. The close agreement between the calculated Qe and experimental value shows the applicability of the model to explain the mechanisms of dyes adsorption by TACs. Dyes removal can be described as chemisorption through the exchange of electrons or electrons sharing between the dye molecules and activated carbon31. Additionally, the rate-limiting step for dye adsorption is surface adsorption.
The pseudo-first-order equation did not obey the kinetics data for the entire range of contact time but may only applicable for the initial adsorption stage31. A high dye concentration induces stronger molecular repulsion and competition for active sites. Consequently, the rate constant, k2 and adsorption rate decreased, resulting in a longer contact time to reach equilibrium. A high k2 value is also associated with the developed porous structure of activated carbon.
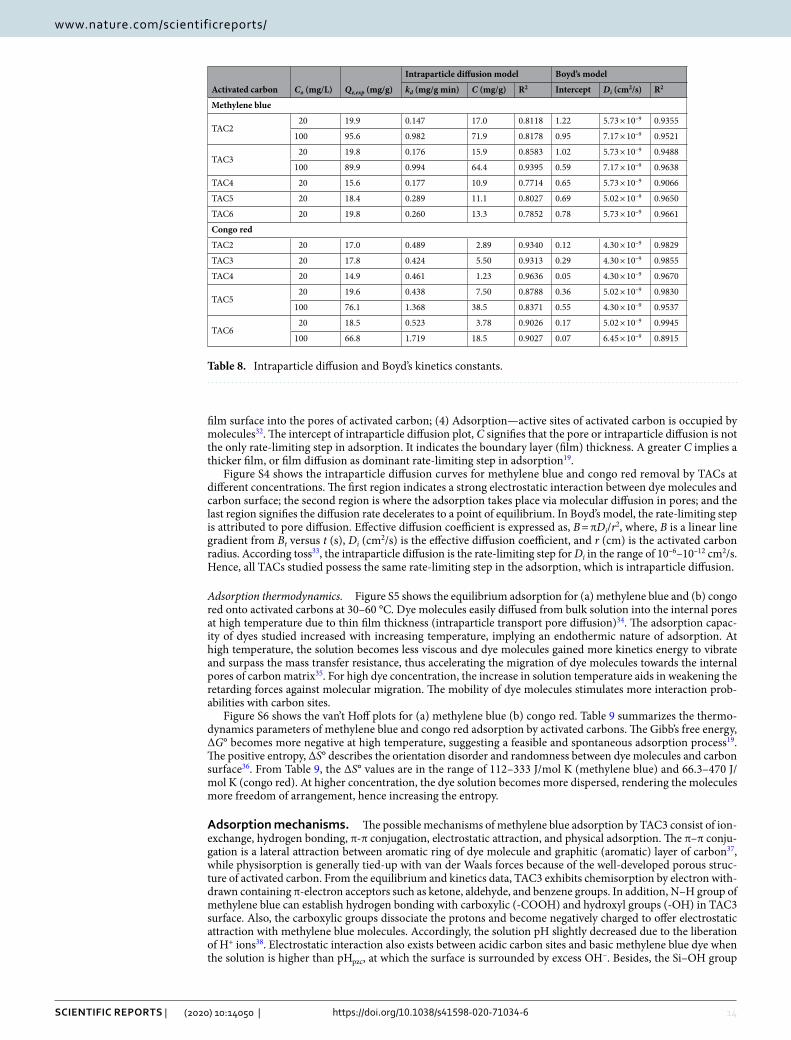
Table 8 summarizes the kinetics constants for intraparticle diffusion (Webber-Morris) and Boyd’s models to elucidate the adsorption diffusion mechanism. The adsorption is often controlled by a sequence of four stages: (1) Bulk diffusion—molecules diffuse onto the activated carbon surface from the bulk solution; (2) Film dif-fusion—molecules diffuse through the boundary layer; (3) Intraparticle diffusion—molecules diffuse from the
Table 6. Isotherm constants of methylene blue and congo red adsorption by activated carbons.
Activated carbon TAC1 TAC2 TAC3 TAC4 TAC5 TAC6
Methylene blue
Qe,exp (mg/g) 16.9 401 413 130 264 221
Qe,exp (mmol/g) 0.053 1.25 1.29 0.406 0.825 0.692
Langmuir model
Qm (mg/g) 15.7 425 438 137 249 217
Qm (mmol/g) 0.049 1.33 1.37 0.429 0.779 0.678
b (L/mg) 0.521 0.053 0.052 0.016 0.152 0.079
SSE 16.5 2,162 2,265 1,790 888 282
R2 0.9031 0.9937 0.9937 0.9616 0.9929 0.9978
Freundlich model
Kf ((mg/g)(L/mg)1/n) 7.70 77.6 81.5 21.5 58.1 48.7
n 8.44 3.62 3.63 3.63 4.25 4.23
SSE 15.35 28,557 32,063 606 7,044 4,789
R2 0.9087 0.9210 0.9152 0.9777 0.9450 0.9476
Redlich–Peterson model
K 15.5 22.7 22.9 66.1 54.3 19.5
a 1.47 0.053 0.052 2.44 0.331 0.11
g 0.932 1.00 1.00 0.761 0.932 0.969
SSE 2.59 2,162 2,265 463 146 214
R2 0.9845 0.9937 0.9937 0.9825 0.9988 0.9982
Congo red
Qe,exp (mg/g) 90.3 161 176 119 214 190
Qe,exp (mmol/g) 0.13 0.231 0.253 0.171 0.307 0.273
Langmuir model
Qm (mg/g) 92.4 165 180 123 217 194
Qm (mmol/g) 0.133 0.236 0.258 0.176 0.312 0.278
b (L/mg) 0.025 0.037 0.036 0.051 0.035 0.038
SSE 19.9 30.1 38.0 99.0 371 97.5
R2 0.9984 0.9994 0.9996 0.9960 0.9972 0.9991
Freundlich model
Kf ((mg/g)(L/mg)1/n) 13.1 26.6 28.7 24.6 34.2 31.4
N 3.41 3.58 3.53 4.04 3.49 3.56
SSE 931 2,958 3,087 2,662 2,731 3,151
R2 0.9313 0.9387 0.9474 0.8967 0.9694 0.9547
Redlich–Peterson model
K 2.31 6.02 6.94 6.27 11.0 8.72
A 0.025 0.037 0.043 0.051 0.089 0.06
G 1.00 1.00 0.98 1.00 0.91 0.95
SSE 19.9 30.1 30.5 99.0 143 39.4
R2 0.9984 0.9994 0.9996 0.9960 0.9987 0.9996
13
Vol.:(0123456789)
Scientific RepoRtS | (2020) 10:14050 | https://doi.org/10.1038/s41598-020-71034-6
www.nature.com/scientificreports/
0
5
10
15
20
25
0 500 1000
Qt(
mg/
g)
Time, t (min)
TAC2 TAC3
TAC4 TAC5
TAC6
0
20
40
60
80
100
120
0 500 1000
Qt(
mg/
g)
Time, t (min)
TAC2
TAC3
(b)
0
5
10
15
20
25
0 500 1000 1500
Qt(
mg/
g)
Time, t (min)
TAC2 TAC3
TAC4 TAC5
TAC6
(c)
01020304050607080
0 500 1000 1500
Qt(
mg/
g)
Time, t (min)
TAC5
TAC6
(d)
(a)
Figure 6. Adsorption kinetics of (a,b) methylene blue and (c,d) congo red by TACs at concentrations of (a,c) 20 mg/L and (b,d) 100 mg/L (adsorbent mass: 50 mg, solution volume: 50 mL, contact time: 2–540 min at room temperature; lines were predicted by pseudo-second-order model).
Table 7. Pseudo-first-order and pseudo-second-order kinetics constants.
Activated carbon Co (mg/L) Qe,exp (mg/g)
Pseudo-first-order Pseudo-second-order
Qe (mg/g) k1 (min−1) SSE R2 Qe (mg/g) k2 (g/mg min) SSE R2
Methylene blue
TAC220 19.9 19.4 0.434 33.1 0.9193 19.9 0.039 13.1 0.9680
100 95.6 90.0 0.147 1,339 0.8639 93.3 0.003 431 0.9555
TAC320 19.8 18.8 0.405 53.3 0.8693 19.4 0.032 23.7 0.9418
100 89.9 81.6 0.189 1607 0.8052 85.1 0.003 718 0.9128
TAC4 20 15.6 14.1 0.209 29.2 0.8903 14.6 0.022 11.7 0.9558
TAC5 20 18.4 16.9 0.088 68.7 0.8695 17.66 0.009 21.1 0.9557
TAC6 20 19.8 18.2 0.150 65.2 0.8676 18.9 0.013 18.5 0.9614
Congo red
TAC2 20 17.0 15.7 0.009 38.5 0.9528 17.7 0.0007 17.2 0.9728
TAC3 20 17.8 15.3 0.019 89.9 0.8460 16.9 0.0015 47.3 0.9070
TAC4 20 14.9 14.2 0.006 15.2 0.9808 16.5 0.0004 6.86 0.9887
TAC520 19.6 17.3 0.027 88.0 0.8628 18.9 0.002 39.0 0.9335
100 76.1 66.9 0.048 1,024 0.8637 71.7 0.001 380 0.9461
TAC620 18.5 17.2 0.011 38.1 0.9613 19.3 0.0007 16.5 0.9787
100 66.8 59.5 0.016 705 0.9245 66.2 0.0003 276 0.9674
14
Vol:.(1234567890)
Scientific RepoRtS | (2020) 10:14050 | https://doi.org/10.1038/s41598-020-71034-6
www.nature.com/scientificreports/
film surface into the pores of activated carbon; (4) Adsorption—active sites of activated carbon is occupied by molecules32. The intercept of intraparticle diffusion plot, C signifies that the pore or intraparticle diffusion is not the only rate-limiting step in adsorption. It indicates the boundary layer (film) thickness. A greater C implies a thicker film, or film diffusion as dominant rate-limiting step in adsorption19.
Figure S4 shows the intraparticle diffusion curves for methylene blue and congo red removal by TACs at different concentrations. The first region indicates a strong electrostatic interaction between dye molecules and carbon surface; the second region is where the adsorption takes place via molecular diffusion in pores; and the last region signifies the diffusion rate decelerates to a point of equilibrium. In Boyd’s model, the rate-limiting step is attributed to pore diffusion. Effective diffusion coefficient is expressed as, B = πDi/r2, where, B is a linear line gradient from Bt versus t (s), Di (cm2/s) is the effective diffusion coefficient, and r (cm) is the activated carbon radius. According toss33, the intraparticle diffusion is the rate-limiting step for Di in the range of 10–6–10–12 cm2/s. Hence, all TACs studied possess the same rate-limiting step in the adsorption, which is intraparticle diffusion.
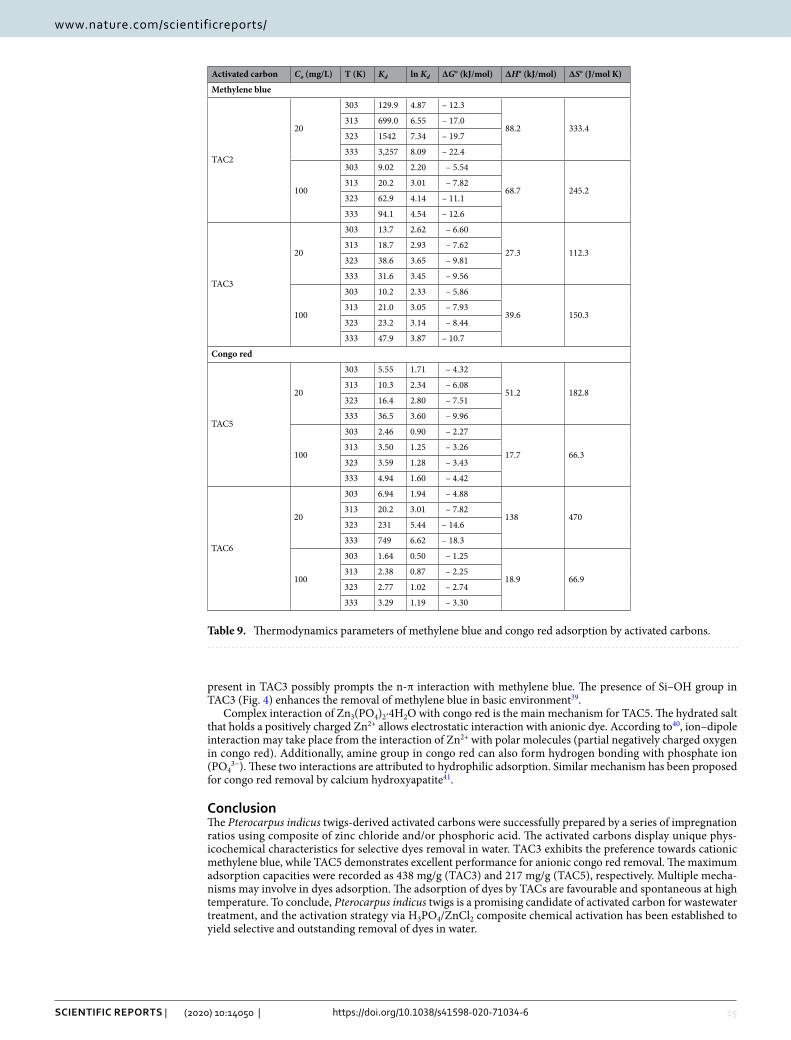
Adsorption thermodynamics. Figure S5 shows the equilibrium adsorption for (a) methylene blue and (b) congo red onto activated carbons at 30–60 °C. Dye molecules easily diffused from bulk solution into the internal pores at high temperature due to thin film thickness (intraparticle transport pore diffusion)34. The adsorption capac-ity of dyes studied increased with increasing temperature, implying an endothermic nature of adsorption. At high temperature, the solution becomes less viscous and dye molecules gained more kinetics energy to vibrate and surpass the mass transfer resistance, thus accelerating the migration of dye molecules towards the internal pores of carbon matrix35. For high dye concentration, the increase in solution temperature aids in weakening the retarding forces against molecular migration. The mobility of dye molecules stimulates more interaction prob-abilities with carbon sites.
Figure S6 shows the van’t Hoff plots for (a) methylene blue (b) congo red. Table 9 summarizes the thermo-dynamics parameters of methylene blue and congo red adsorption by activated carbons. The Gibb’s free energy, ΔG° becomes more negative at high temperature, suggesting a feasible and spontaneous adsorption process19. The positive entropy, ΔS° describes the orientation disorder and randomness between dye molecules and carbon surface36. From Table 9, the ΔS° values are in the range of 112–333 J/mol K (methylene blue) and 66.3–470 J/mol K (congo red). At higher concentration, the dye solution becomes more dispersed, rendering the molecules more freedom of arrangement, hence increasing the entropy.
Adsorption mechanisms. The possible mechanisms of methylene blue adsorption by TAC3 consist of ion-exchange, hydrogen bonding, π-π conjugation, electrostatic attraction, and physical adsorption. The π–π conju-gation is a lateral attraction between aromatic ring of dye molecule and graphitic (aromatic) layer of carbon37, while physisorption is generally tied-up with van der Waals forces because of the well-developed porous struc-ture of activated carbon. From the equilibrium and kinetics data, TAC3 exhibits chemisorption by electron with-drawn containing π-electron acceptors such as ketone, aldehyde, and benzene groups. In addition, N–H group of methylene blue can establish hydrogen bonding with carboxylic (-COOH) and hydroxyl groups (-OH) in TAC3 surface. Also, the carboxylic groups dissociate the protons and become negatively charged to offer electrostatic attraction with methylene blue molecules. Accordingly, the solution pH slightly decreased due to the liberation of H+ ions38. Electrostatic interaction also exists between acidic carbon sites and basic methylene blue dye when the solution is higher than pHpzc, at which the surface is surrounded by excess OH−. Besides, the Si–OH group
Table 8. Intraparticle diffusion and Boyd’s kinetics constants.
Activated carbon Co (mg/L) Qe,exp (mg/g)
Intraparticle diffusion model Boyd’s model
kd (mg/g min) C (mg/g) R2 Intercept Di (cm2/s) R2
Methylene blue
TAC220 19.9 0.147 17.0 0.8118 1.22 5.73 × 10⁻⁹ 0.9355
100 95.6 0.982 71.9 0.8178 0.95 7.17 × 10⁻⁹ 0.9521
TAC320 19.8 0.176 15.9 0.8583 1.02 5.73 × 10⁻⁹ 0.9488
100 89.9 0.994 64.4 0.9395 0.59 7.17 × 10⁻⁹ 0.9638
TAC4 20 15.6 0.177 10.9 0.7714 0.65 5.73 × 10⁻⁹ 0.9066
TAC5 20 18.4 0.289 11.1 0.8027 0.69 5.02 × 10⁻⁹ 0.9650
TAC6 20 19.8 0.260 13.3 0.7852 0.78 5.73 × 10⁻⁹ 0.9661
Congo red
TAC2 20 17.0 0.489 2.89 0.9340 0.12 4.30 × 10⁻⁹ 0.9829
TAC3 20 17.8 0.424 5.50 0.9313 0.29 4.30 × 10⁻⁹ 0.9855
TAC4 20 14.9 0.461 1.23 0.9636 0.05 4.30 × 10⁻⁹ 0.9670
TAC520 19.6 0.438 7.50 0.8788 0.36 5.02 × 10⁻⁹ 0.9830
100 76.1 1.368 38.5 0.8371 0.55 4.30 × 10⁻⁹ 0.9537
TAC620 18.5 0.523 3.78 0.9026 0.17 5.02 × 10⁻⁹ 0.9945
100 66.8 1.719 18.5 0.9027 0.07 6.45 × 10⁻⁹ 0.8915
15
Vol.:(0123456789)
Scientific RepoRtS | (2020) 10:14050 | https://doi.org/10.1038/s41598-020-71034-6
www.nature.com/scientificreports/
present in TAC3 possibly prompts the n-π interaction with methylene blue. The presence of Si–OH group in TAC3 (Fig. 4) enhances the removal of methylene blue in basic environment39.
Complex interaction of Zn3(PO4)2·4H2O with congo red is the main mechanism for TAC5. The hydrated salt that holds a positively charged Zn2+ allows electrostatic interaction with anionic dye. According to40, ion–dipole interaction may take place from the interaction of Zn2+ with polar molecules (partial negatively charged oxygen in congo red). Additionally, amine group in congo red can also form hydrogen bonding with phosphate ion (PO4
3−). These two interactions are attributed to hydrophilic adsorption. Similar mechanism has been proposed for congo red removal by calcium hydroxyapatite41.
conclusionThe Pterocarpus indicus twigs-derived activated carbons were successfully prepared by a series of impregnation ratios using composite of zinc chloride and/or phosphoric acid. The activated carbons display unique phys-icochemical characteristics for selective dyes removal in water. TAC3 exhibits the preference towards cationic methylene blue, while TAC5 demonstrates excellent performance for anionic congo red removal. The maximum adsorption capacities were recorded as 438 mg/g (TAC3) and 217 mg/g (TAC5), respectively. Multiple mecha-nisms may involve in dyes adsorption. The adsorption of dyes by TACs are favourable and spontaneous at high temperature. To conclude, Pterocarpus indicus twigs is a promising candidate of activated carbon for wastewater treatment, and the activation strategy via H3PO4/ZnCl2 composite chemical activation has been established to yield selective and outstanding removal of dyes in water.
Table 9. Thermodynamics parameters of methylene blue and congo red adsorption by activated carbons.
Activated carbon Co (mg/L) T (K) Kd ln Kd ΔG° (kJ/mol) ΔH° (kJ/mol) ΔS° (J/mol K)
Methylene blue
TAC2
20
303 129.9 4.87 – 12.3
88.2 333.4313 699.0 6.55 – 17.0
323 1542 7.34 – 19.7
333 3,257 8.09 – 22.4
100
303 9.02 2.20 – 5.54
68.7 245.2313 20.2 3.01 – 7.82
323 62.9 4.14 – 11.1
333 94.1 4.54 – 12.6
TAC3
20
303 13.7 2.62 – 6.60
27.3 112.3313 18.7 2.93 – 7.62
323 38.6 3.65 – 9.81
333 31.6 3.45 – 9.56
100
303 10.2 2.33 – 5.86
39.6 150.3313 21.0 3.05 – 7.93
323 23.2 3.14 – 8.44
333 47.9 3.87 – 10.7
Congo red
TAC5
20
303 5.55 1.71 – 4.32
51.2 182.8313 10.3 2.34 – 6.08
323 16.4 2.80 – 7.51
333 36.5 3.60 – 9.96
100
303 2.46 0.90 – 2.27
17.7 66.3313 3.50 1.25 – 3.26
323 3.59 1.28 – 3.43
333 4.94 1.60 – 4.42
TAC6
20
303 6.94 1.94 – 4.88
138 470313 20.2 3.01 – 7.82
323 231 5.44 – 14.6
333 749 6.62 – 18.3
100
303 1.64 0.50 – 1.25
18.9 66.9313 2.38 0.87 – 2.25
323 2.77 1.02 – 2.74
333 3.29 1.19 – 3.30
16
Vol:.(1234567890)
Scientific RepoRtS | (2020) 10:14050 | https://doi.org/10.1038/s41598-020-71034-6
www.nature.com/scientificreports/
Received: 25 February 2020; Accepted: 4 August 2020
References 1. Ghaly, A. E., Ananthashankar, R., Alhattab, M. V. V. R. & Ramakrishnan, V. V. Production, characterization and treatment of textile
effluents: a critical review. J. Chem. Eng. Process Technol. 5(1), 1–18 (2014). 2. Ming-Twang, S., Zhi-Yong, Q., Lin-Zhi, L., Pei-Yee, A. Y. & Zaini, M. A. A. Dyes in water: characteristics, impacts to the environ-
ment and human health, and the removal strategies. Adv. Chem. Res. 23, 143–156 (2015). 3. Khatri, A., Peerzada, M. H., Mohsin, M. & White, M. A review on developments in dyeing cotton fabrics with reactive dyes for
reducing effluent pollution. J. Clean. Prod. 87, 50–57 (2015). 4. Fazal, T. et al. Bioremediation of textile wastewater and successive biodiesel production using microalgae. Renew. Sustain. Energy
Rev. 82, 3107–3126 (2018). 5. Shu-Hui, T. & Zaini, M. A. A. Dyes: classification and effective removal techniques. Adv. Chem. Res. 30, 19–34 (2016). 6. Ming-Twang, S., Lin-Zhi, L., Zaini, M. A. A., Zhi-Yong, Q. & Pei-Yee, A. Y. Activated carbon for dyes adsorption in aqueous solu-
tion. Adv. Environ. Res. 36, 217–234 (2015). 7. Wyasu, G., Gimba, C. E., Agbaji, E. B. & Ndukwe, G. I. Thermo-gravimetry (TGA) and DSC of thermal analysis techniques in
production of active carbon from lignocellulosic materials. Adv. Appl. Sci. Res. 7(2), 109–115 (2016). 8. Chen, W. H. & Kuo, P. C. A study on torrefaction of various biomass materials and its impact on lignocellulosic structure simulated
by a thermogravimetry. Energy. 35(6), 2580–2586 (2010). 9. Abdullah, S. S., Yusup, S., Ahmad, M. M., Ramli, A. & Ismail, L. Thermogravimetry study on pyrolysis of various lignocellulosic
biomass for potential hydrogen production. Int. J. Chem. Biol. Eng. 3(3), 137–141 (2010). 10. Hock, P. E. & Zaini, M. A. A. Activated carbons by zinc chloride activation for dye removal: a commentary. Acta Chim. Slovaca
11(2), 99–106 (2018). 11. Zaini, M. A. A., Meng, T. W., Kamaruddin, M. J., Setapar, S. H. M. & Yunus, M. A. C. Microwave-induced zinc chloride activated
palm kernel shell for dye removal. Sains Malaysiana 43(9), 1421–1428 (2014). 12. Sun, Y. et al. Characterization and ciprofloxacin adsorption properties of activated carbons prepared from biomass wastes by
H3PO4 activation. Biores. Technol. 217, 239–244 (2016). 13. Jabri, M., Mejdoubi, E., El Gadi, M. & Hammouti, B. Hydratation mechanism of a zinc phosphate cement and development of its
mechanical profile. Res. Chem. Intermed. 39, 3117–3126 (2013). 14. Yang, R. et al. Surface texture, chemistry and adsorption properties of acid blue 9 of hemp (Cannabis sativa L.) bast-based activated
carbon fibers prepared by phosphoric acid activation. Biomass Bioenergy 35(1), 437–445 (2011). 15. Mi, T., Chen, L., Xin, S. & Yu, X. Activated carbon from the Chinese herbal medicine waste by H3PO4 activation. J. Nanomater.
2015, 9 (2015). 16. Elmouwahidi, A., Bailón-García, E., Pérez-Cadenas, A. F., Maldonado-Hódar, F. J. & Carrasco-Marín, F. Activated carbons from
KOH and H3PO4-activation of olive residues and its application as supercapacitor electrodes. Electrochim. Acta 229, 219–228 (2017).
17. Yakout, S. M. & El-Deen, G. S. Characterization of activated carbon prepared by phosphoric acid activation of olive stones. Arab. J. Chem. 9(2), 1155–1162 (2016).
18. Budinova, T. et al. Characterization and application of activated carbon produced by H3PO4 and water vapor activation. Fuel Process Technol. 87, 899–905 (2006).
19. Shaid, M. S. H. M., Zaini, M. A. A. & Nasri, N. S. Evaluation of methylene blue dye and phenol removal onto modified CO2-activated pyrolysis tyre powder. J. Clean. Prod. 223, 487–498 (2019).
20. Zawawi, N. M., Hamzah, F., Sarif, M., Manaf, S. F. A. & Idris, A. Characterization of activated carbon using chemical activation via mocrowave ultrasonic system. Malays. J. Anal. Sci. 21(1), 159–165 (2017).
21. Singh, K., Bharose, R., Verma, S. K. & Singh, V. K. Potential of powdered activated mustard cake for decolorising raw sugar. J. Sci. Food Agric. 93, 157–165 (2013).
22. Boehm, H. P. Surface oxides on carbon and their analysis: a critical assessment. Carbon 40, 145–149 (2002). 23. Zhang, L. et al. Removal of phosphate from water by activated carbon fiber loaded with lanthanum oxide. J. Hazard. Mater. 190,
848–855 (2011). 24. Bernal, V., Erto, A., Giraldo, L. & Moreno-Piraján, J. C. Effect of solution pH on the adsorption of paracetamol on chemically
modified activated carbons. Molecules 22(7), 1032 (2017). 25. Wang, S., Zhu, Z. H., Coomes, A., Haghseresht, F. & Lu, G. Q. The physical and surface chemical characteristics of activated carbons
and the adsorption of methylene blue from wastewater. J. Colloid Interface Sci. 284(2), 440–446 (2005). 26. Ghouma, I. et al. Factors influencing NO2 adsorption/reduction on microporous activated carbon: porosity vs. surface chemistry.
Materials 11(4), 622 (2018). 27. Sulaiman, N. S., Zaini, M. A. A. & Arsad, A. Evaluation of dyes removal by beta-cyclodextrin adsorbent. Mater. Today Proc. https
://doi.org/10.1016/j.matpr .2020.03.696 (2020). 28. Swan, N. B. & Zaini, M. A. A. Adsorption of malachite green and congo red dyes from water: recent progress and future outlook.
Ecol. Chem. Eng. S. 26(1), 119–132 (2019). 29. Webber, T. W. & Chakkravorti, R. K. Pore and solid diffusion models for fixed-bed adsorbers. AlChE J. 20, 228–238 (1974). 30. Redlich, O. & Peterson, D. L. A useful adsorption isotherm. J. Phys. Chem. 63(6), 1024–1024 (1959). 31. Ho, Y. S. Review of second-order models for adsorption systems. J. Hazard. Mater. 136(3), 681–689 (2006). 32. Suteu, D. & Malutan, T. Industrial cellolignin wastes as adsorbent for removal of methylene blue dye from aqueous solutions.
BioResources 8(1), 427–446 (2013). 33. Karthikeyan, S., Sivakumar, B. & Sivakumar, N. Film and pore diffusion modeling for adsorption of reactive red 2 from aqueous
solution to activated carbon prepared from bio-diesel industrial waste. E-J. Chem. 7(1), 175–184 (2010). 34. Ahmad, M. A., Ahmad Puad, N. A. & Bello, O. S. Kinetic, equilibrium and thermodynamic studies of synthetic dye removal using
pomegranate peel activated carbon prepared by microwave-induced KOH activation. Water Resour. Ind. 6, 18–35 (2014). 35. Adeyemo, A. A., Adeoye, I. O. & Bello, O. S. Adsorption of dyes using different types of clay: a review. Appl. Water Sci. 7(2), 543–568
(2017). 36. Lima, E. C., Hosseini-Bandegharaei, A., Moreno-Piraján, J. C. & Anastopoulos, I. A critical review of the estimation of the ther-
modynamic parameters on adsorption equilibria. Wrong use of equilibrium constant in the Van’t Hoof equation for calculation of thermodynamic parameters of adsorption. J. Mol. Liquids 273, 425–434 (2019).
37. Zhang, S., Shao, T., Kose, H. S. & Karanfil, T. Adsorption of aromatic compounds by carbonaceous adsorbents: a comparative study on granular activated carbon, activated carbon fiber, and carbon nanotubes. Environ. Sci. Technol. 44(16), 6377–6383 (2010).
38. Zaini, M. A. A., Okayama, R. & Machida, M. Adsorption of aqueous metal ions on cattle-manure-compost based activated carbons. J. Hazard. Mater. 170(2–3), 1119–1124 (2009).
39. Zhu, J., Li, Y., Xu, L. & Liu, Z. Removal of toluene from waste gas by adsorption-desorption process using corncob-based activated carbons as adsorbents. Ecotoxicol. Environ. Saf. 165, 115–125 (2018).
17
Vol.:(0123456789)
Scientific RepoRtS | (2020) 10:14050 | https://doi.org/10.1038/s41598-020-71034-6
www.nature.com/scientificreports/
40. Zheng, H. et al. CheckMyMetal: a macromolecular metal-binding validation tool. Acta Crystallogr. Sect. D Struct. Biol. 73, 223–233 (2017).
41. Chahkandi, M. Mechanism of Congo red adsorption on new sol-gel-derived hydroxyapatite nano-particle. Mater. Chem. Phys. 202, 340–351 (2017).
AcknowledgementsThis work was fully supported by UTM Signature Grant No. 07G80.
Author contributionsM.H.M.Z.: Conceptualization, Methodology, Data curation, Investigation, Writing—Original draft preparation. M.A.A.Z.: Supervision, Investigation, Validation, Writing—Reviewing and Editing.
competing interests The authors declare no competing interests.
Additional informationSupplementary information is available for this paper at https ://doi.org/10.1038/s4159 8-020-71034 -6.
Correspondence and requests for materials should be addressed to M.A.A.Z.
Reprints and permissions information is available at www.nature.com/reprints.
Publisher’s note Springer Nature remains neutral with regard to jurisdictional claims in published maps and institutional affiliations.
Open Access This article is licensed under a Creative Commons Attribution 4.0 International License, which permits use, sharing, adaptation, distribution and reproduction in any medium or
format, as long as you give appropriate credit to the original author(s) and the source, provide a link to the Creative Commons licence, and indicate if changes were made. The images or other third party material in this article are included in the article’s Creative Commons licence, unless indicated otherwise in a credit line to the material. If material is not included in the article’s Creative Commons licence and your intended use is not permitted by statutory regulation or exceeds the permitted use, you will need to obtain permission directly from the copyright holder. To view a copy of this licence, visit http://creat iveco mmons .org/licen ses/by/4.0/.
© The Author(s) 2020