rice straw as precursor of activated carbons: activation with ortho-phosphoric acid
TRANSCRIPT
Ro
Va
8b
c
a
ARRAA
KRAHMA
1
Ecdafafib
atshma
hi
0d
Journal of Hazardous Materials 181 (2010) 27–34
Contents lists available at ScienceDirect
Journal of Hazardous Materials
journa l homepage: www.e lsev ier .com/ locate / jhazmat
ice straw as precursor of activated carbons: Activation withrtho-phosphoric acid
. Fierroa,∗, G. Muniza,b, A.H. Bastac, H. El-Saiedc, A. Celzarda
Institut Jean Lamour - UMR CNRS 7198, CNRS - Nancy-Université – UPV-Metz, ENSTIB, 27 rue du Merle Blanc, BP 1041,8051 Epinal Cedex 9, FranceFacultad de Ciencias Químicas, Universidad Autónoma de Chihuahua, Circuito Universitario S/N, Chihuahua, MexicoNational Research Centre, Cellulose & Paper Dept., El-Tahrir Street, Dokki-12622, Cairo, Egypt
r t i c l e i n f o
rticle history:eceived 7 January 2010eceived in revised form 14 April 2010ccepted 15 April 2010
a b s t r a c t
Highly mesoporous activated carbons (ACs) with a mesopore fraction ranging from 42 to 73% wereobtained by activation of rice straw (RS) with ortho-phosphoric acid (PA). Due to such a high mesoporos-ity, these ACs can be successfully used for pollutant removal in aqueous phase. The ACs were preparedat activation temperatures (T) ranging from 350 to 500 ◦C, using PA to RS weight ratios (R) from 0 to 1.6
vailable online 21 April 2010
eywords:ice strawctivated carbon3PO4
ethylene blue
and activation times from 0 to 2 h. They were characterised by nitrogen adsorption at −196 ◦C, SEM-EDX,and methylene blue adsorption. RS is a very heterogeneous material with a variable content of mineralmatter: using the product of activated carbon yield multiplied by surface area (C × SBET) as the perfor-mance criterion, the best AC was produced at T = 450 ◦C and R ≥ 1. These conditions lead to SBET higherthan 500 m2 g−1 and a C × SBET around 270 m2 g−1.
© 2010 Elsevier B.V. All rights reserved.
dsorption. Introduction
Three million tons of rice straws (RS) are produced annually ingypt. So far, such a resource is mainly considered as a waste, andonsequently burnt without any profit, except in a few cases ofomestic uses for cooking and heating. Worse, biomass burning ismajor source of atmospheric pollution [1], especially through the
umes and the very fine silica particles thus produced, both havingsuffocating effect. Although wildfires are prohibited in cultivationelds of most countries, farmers usually keep on burning their cropy-products.
Rice-derived wastes comprise two different materials: husksnd straws. Rice husks have been commonly investigated as poten-ial precursors of ACs [2–4]. By contrast, straws have been seldomuggested for this application, whereas other routes of valorisationave been considered in the past, e.g., pulp and paper, constructionaterials, compost, fuel, production of chemicals such as ethanol
nd bio-adsorbents [5] and references therein.To the best knowledge of the present authors, only three works
ave been carried out using RS as AC precursor, based on chem-cal activation by potassium hydroxide on one hand [5,6], and by
∗ Corresponding author. Tel.: +33 329296177; fax: +33 329296177.E-mail address: [email protected] (V. Fierro).
304-3894/$ – see front matter © 2010 Elsevier B.V. All rights reserved.oi:10.1016/j.jhazmat.2010.04.062
sodium hydroxide on the other hand [7]. In our previous paper [5],three pre-treatment protocols were tested: mechanical, chemical(by NaOH pulping), and a combination of both, followed by a furtheractivation with KOH according to either one or two steps. Employ-ing the combined mechanical–chemical pre-treatment methodand a 2-steps KOH activation process, surface areas as high as1917 m2 g−1 could be obtained. However, the use of such com-plex activation protocol working at temperatures as high as 800 ◦Cmakes RS-based AC production rather expensive.
Ortho-phosphoric acid (PA), H3PO4, is a common activatingagent whose use has been extensively reported for preparing acti-vated carbons from agricultural by-products [8–12], wood [13,14],natural [15,16] as well as synthetic [17,18] carbons. PA promotesthe bond cleavage in the biopolymers and dehydration at lowtemperatures [19], followed by extensive cross-linking that bindsvolatile matter into the carbon product and thus increases the car-bon yield. Benaddi et al. [20] showed that the mechanism of PAactivation of biomass feedstock occurs through various steps: cel-lulose depolymerisation, biopolymers dehydration, formation ofaromatic rings and elimination of phosphate groups. This allowsactivated carbons to be prepared with good yields and high sur-
face areas. Activation conditions thus depend on the nature of theprecursor, i.e., on the relative amounts of cellulose, hemicellulose,lignin and ashes. For example, the present authors already preparedACs from lignin (L) by activation with H3PO4, and the optimumPA/L weight ratio allowing complete reaction of lignin has been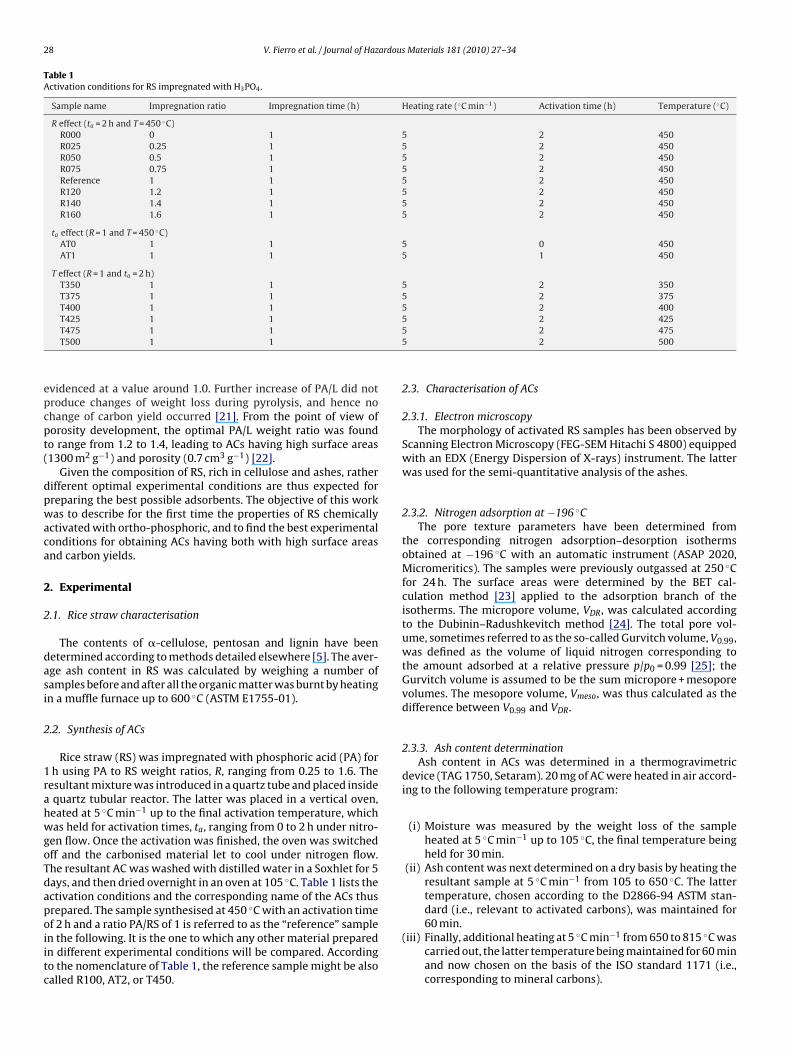
28 V. Fierro et al. / Journal of Hazardous Materials 181 (2010) 27–34
Table 1Activation conditions for RS impregnated with H3PO4.
Sample name Impregnation ratio Impregnation time (h) Heating rate (◦C min−1) Activation time (h) Temperature (◦C)
R effect (ta = 2 h and T = 450 ◦C)R000 0 1 5 2 450R025 0.25 1 5 2 450R050 0.5 1 5 2 450R075 0.75 1 5 2 450Reference 1 1 5 2 450R120 1.2 1 5 2 450R140 1.4 1 5 2 450R160 1.6 1 5 2 450
ta effect (R = 1 and T = 450 ◦C)AT0 1 1 5 0 450AT1 1 1 5 1 450
T effect (R = 1 and ta = 2 h)T350 1 1 5 2 350T375 1 1 5 2 375T400 1 1 5 2 400
epcpt(
dpwaca
2
2
dasi
2
1rahwgoTdapoiitc
T425 1 1T475 1 1T500 1 1
videnced at a value around 1.0. Further increase of PA/L did notroduce changes of weight loss during pyrolysis, and hence nohange of carbon yield occurred [21]. From the point of view oforosity development, the optimal PA/L weight ratio was foundo range from 1.2 to 1.4, leading to ACs having high surface areas1300 m2 g−1) and porosity (0.7 cm3 g−1) [22].
Given the composition of RS, rich in cellulose and ashes, ratherifferent optimal experimental conditions are thus expected forreparing the best possible adsorbents. The objective of this workas to describe for the first time the properties of RS chemically
ctivated with ortho-phosphoric, and to find the best experimentalonditions for obtaining ACs having both with high surface areasnd carbon yields.
. Experimental
.1. Rice straw characterisation
The contents of �-cellulose, pentosan and lignin have beenetermined according to methods detailed elsewhere [5]. The aver-ge ash content in RS was calculated by weighing a number ofamples before and after all the organic matter was burnt by heatingn a muffle furnace up to 600 ◦C (ASTM E1755-01).
.2. Synthesis of ACs
Rice straw (RS) was impregnated with phosphoric acid (PA) forh using PA to RS weight ratios, R, ranging from 0.25 to 1.6. The
esultant mixture was introduced in a quartz tube and placed insidequartz tubular reactor. The latter was placed in a vertical oven,eated at 5 ◦C min−1 up to the final activation temperature, whichas held for activation times, ta, ranging from 0 to 2 h under nitro-
en flow. Once the activation was finished, the oven was switchedff and the carbonised material let to cool under nitrogen flow.he resultant AC was washed with distilled water in a Soxhlet for 5ays, and then dried overnight in an oven at 105 ◦C. Table 1 lists thectivation conditions and the corresponding name of the ACs thusrepared. The sample synthesised at 450 ◦C with an activation time
f 2 h and a ratio PA/RS of 1 is referred to as the “reference” samplen the following. It is the one to which any other material preparedn different experimental conditions will be compared. Accordingo the nomenclature of Table 1, the reference sample might be alsoalled R100, AT2, or T450.5 2 4255 2 4755 2 500
2.3. Characterisation of ACs
2.3.1. Electron microscopyThe morphology of activated RS samples has been observed by
Scanning Electron Microscopy (FEG-SEM Hitachi S 4800) equippedwith an EDX (Energy Dispersion of X-rays) instrument. The latterwas used for the semi-quantitative analysis of the ashes.
2.3.2. Nitrogen adsorption at −196 ◦CThe pore texture parameters have been determined from
the corresponding nitrogen adsorption–desorption isothermsobtained at −196 ◦C with an automatic instrument (ASAP 2020,Micromeritics). The samples were previously outgassed at 250 ◦Cfor 24 h. The surface areas were determined by the BET cal-culation method [23] applied to the adsorption branch of theisotherms. The micropore volume, VDR, was calculated accordingto the Dubinin–Radushkevitch method [24]. The total pore vol-ume, sometimes referred to as the so-called Gurvitch volume, V0.99,was defined as the volume of liquid nitrogen corresponding tothe amount adsorbed at a relative pressure p/p0 = 0.99 [25]; theGurvitch volume is assumed to be the sum micropore + mesoporevolumes. The mesopore volume, Vmeso, was thus calculated as thedifference between V0.99 and VDR.
2.3.3. Ash content determinationAsh content in ACs was determined in a thermogravimetric
device (TAG 1750, Setaram). 20 mg of AC were heated in air accord-ing to the following temperature program:
(i) Moisture was measured by the weight loss of the sampleheated at 5 ◦C min−1 up to 105 ◦C, the final temperature beingheld for 30 min.
(ii) Ash content was next determined on a dry basis by heating theresultant sample at 5 ◦C min−1 from 105 to 650 ◦C. The lattertemperature, chosen according to the D2866-94 ASTM stan-dard (i.e., relevant to activated carbons), was maintained for
60 min.(iii) Finally, additional heating at 5 ◦C min−1 from 650 to 815 ◦C wascarried out, the latter temperature being maintained for 60 minand now chosen on the basis of the ISO standard 1171 (i.e.,corresponding to mineral carbons).
V. Fierro et al. / Journal of Hazardous Materials 181 (2010) 27–34 29
Table 2Solid yield (i.e., pure activated carbon + ashes), ash content, and textural parameters determined by nitrogen adsorption at −196◦C.
Sample name Solid yield, C (%) Ash content (%) SBET (m2 g−1) C × SBET (m2 g−1) V0.99 (cm3 g−1) VDR (cm3 g−1) Vmeso (cm3 g−1)
R effect (ta = 2 h and T = 450 ◦C)R000 41.0 41.3 27 11.1 0.04 0.01 0.03R025 42.2 33.8 359 151.5 0.24 0.14 0.10R050 35.3 17.4 571 201.4 0.50 0.21 0.29R075 49.3 36.0 448 220.9 0.41 0.17 0.24Reference 51.9 33.0 522 270.7 0.55 0.18 0.37R120 49.9 36.1 540 269.4 0.53 0.19 0.34R140 45.9 34.5 598 274.0 0.75 0.21 0.54R160 33.9 16.7 786 266.0 1.05 0.28 0.77
ta effect (R = 1 and T = 450 ◦C)AT0 34.6 52.6 664 229.8 0.72 0.24 0.48AT1 44.4 34.1 588 260.9 0.65 0.21 0.44Reference 51.9 33.0 522 270.7 0.55 0.18 0.37
T effect (R = 1 and ta = 2 h)T350 36.3 20.3 551 200.0 0.57 0.205 0.36T375 33.9 18.5 576 193.9 0.62 0.213 0.41T400 39.7 21.4 635 251.9 0.64 0.23 0.41
2
ao2pdisc(awfonF
q
wbcat(
wmLTdf
E
wswu
T425 37.5 27.9 685Reference 51.9 33.0 522T475 53.2 53.3 378T500 39.4 28.5 466
.3.4. Methylene blue adsorptionMethylene blue (MB) adsorption is frequently used to test the
dsorption performances of ACs [26–28]. Five different amountsf dry powdered AC (typically from 0.05 to 0.5 g) were added to5 mL of MB of concentration 0.6 g L−1 in distilled water. The sus-ensions were kept in a shaker at a fixed temperature of 30 ◦Curing 24 h. According to a number of previous trials, such a time
s enough for guaranteeing adsorption equilibrium of MB over ACurface. The AC suspensions were next filtered, and the residual MBontained in the solution was quantified by UV–vis spectrometryLambda 3B UV–vis Spectrophotometer, Perkin Elmer) working atfixed wavelength of 625 nm. Freundlich and Langmuir equationsere applied to the adsorption data at equilibrium. The main dif-
erence between these two equations concerns the way the heatf adsorption decreases with surface coverage: Langmuir assumeso decrease, whereas Freundlich assumes a logarithmic decrease.reundlich’s equation [29] reads:
e = kf C1/ne (1)
here qe is the amount of MB adsorbed per unit mass of adsor-ent (mg g−1), kf is Freundlich’s constant related to the adsorptionapacity (mg g−1·(mg L−1)n), Ce is the equilibrium concentration ofdsorbate in the solution (mg L−1), and n is the empirical parame-er representing the energetic heterogeneity of the adsorption sitesdimensionless).
Langmuir’s equation [30] can be written as:
Ce
qe= 1
Q0ˇ+ Ce
Q0(2)
here Ce and qe have the same meaning as before; Q0 is theaximum uptake per unit mass of adsorbent (mg g−1), and ˇ is
angmuir’s constant related to the adsorption energy (L mg−1).he efficiency of the adsorption process can be predicted by theimensionless equilibrium parameter EL, which is defined by theollowing equation:
L = 11 + ˇC0
(3)
here C0 is the initial concentration of methylene blue in theolution (mg L−1). The adsorption is considered as irreversiblehen EL = 0, favourable when 0 < EL < 1, linear when EL = 1, andnfavourable when EL > 1.
257.0 0.75 0.25 0.50270.7 0.55 0.18 0.37201.0 0.45 0.14 0.31183.70 0.57 0.17 0.39
3. Results
3.1. Rice straw characterisation
Raw rice straw (RS) has very high ash content (mainly silica)of 18.2%, on average, much higher than in any other kind of cerealstraw. Given that heat-treatment unavoidably induces the releaseof volatiles, the fraction of ashes in the final activated carbon isexpected to be even higher. �-Cellulose, pentosan and Klason lignincontents are found to be 51.3, 12.7 and 17.8%, respectively. It iswell known that such components have different carbon yields,typically 20% for cellulose and even below for hemicellulose, and40% for lignin. The fraction of lignin being lower than 20%, ratherlow carbon yields are foreseen, even in PA activation hinders theformation of volatiles and thereby leads to higher yields thanwhat is obtained by simple pyrolysis at the same temperature (seebelow).
3.2. Activated carbon yield and textural properties
Table 2 presents the yield (C) of as-prepared activated carbonand the corresponding ash content, as well as some physical param-eters determined by nitrogen adsorption at −196 ◦C such as SBET,V0.99, VDR and Vmeso. The product C × SBET is also given. By “yield ofas-prepared activated carbon”, we mean the weight ratio of finalto initial solid, i.e., including the ashes. The true carbon yield, i.e.,only taking into account the carbon present inside the solid, is thuslower. No difference in ash content could be experimentally found,whatever the final temperature used for burning the organic mat-ter (see Section 2.3.3). Thus, heating at 815 ◦C instead of 650 ◦C justallowed checking our results.
The ash content is strongly modified through chemical activa-tion, indeed varying in a very wide range of values: from 16.7 to53.3% (see 3rd column of Table 2), without any logical correlationwith the synthesis parameters. Each line of Table 2 represents thedata for one given sample (in other words, not averages of a setof values), consequently such high differences may be ascribed to
significant heterogeneity in the composition of rice straw. By con-trast, in the figures of the present manuscript, several differentsamples have been tested for giving one’s idea about the scatteringof the results. The assumption of heterogeneity of composition isstrongly supported as soon as the results are analysed on the basis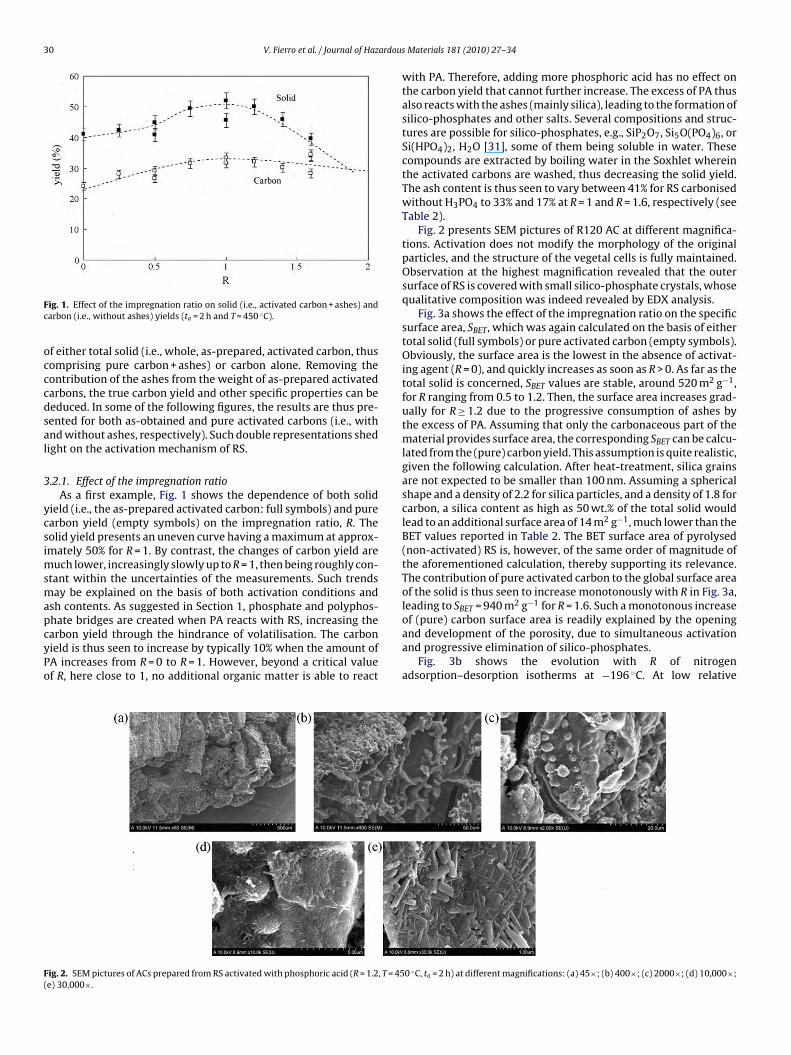
30 V. Fierro et al. / Journal of Hazardou
Fc
occcdsal
3
ycsimsmapcyPo
of (pure) carbon surface area is readily explained by the opening
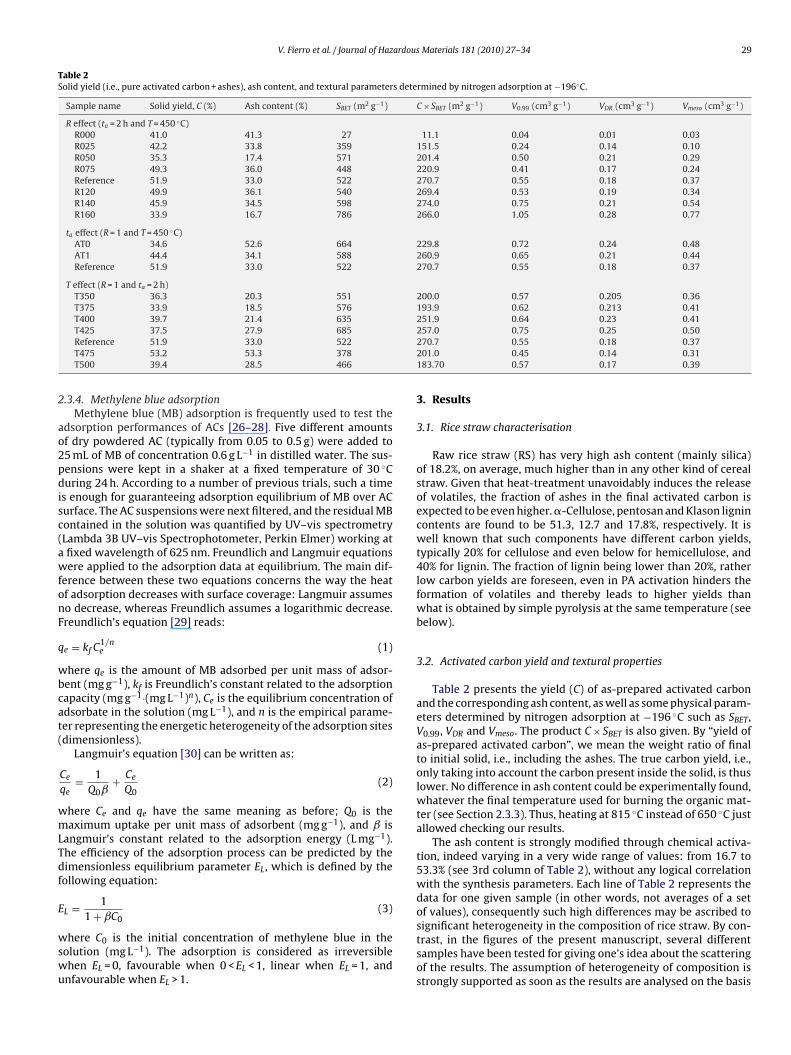
F(
ig. 1. Effect of the impregnation ratio on solid (i.e., activated carbon + ashes) andarbon (i.e., without ashes) yields (ta = 2 h and T = 450 ◦C).
f either total solid (i.e., whole, as-prepared, activated carbon, thusomprising pure carbon + ashes) or carbon alone. Removing theontribution of the ashes from the weight of as-prepared activatedarbons, the true carbon yield and other specific properties can beeduced. In some of the following figures, the results are thus pre-ented for both as-obtained and pure activated carbons (i.e., withnd without ashes, respectively). Such double representations shedight on the activation mechanism of RS.
.2.1. Effect of the impregnation ratioAs a first example, Fig. 1 shows the dependence of both solid
ield (i.e., the as-prepared activated carbon: full symbols) and purearbon yield (empty symbols) on the impregnation ratio, R. Theolid yield presents an uneven curve having a maximum at approx-mately 50% for R = 1. By contrast, the changes of carbon yield are
uch lower, increasingly slowly up to R = 1, then being roughly con-tant within the uncertainties of the measurements. Such trendsay be explained on the basis of both activation conditions and
sh contents. As suggested in Section 1, phosphate and polyphos-
hate bridges are created when PA reacts with RS, increasing thearbon yield through the hindrance of volatilisation. The carbonield is thus seen to increase by typically 10% when the amount ofA increases from R = 0 to R = 1. However, beyond a critical valuef R, here close to 1, no additional organic matter is able to reactig. 2. SEM pictures of ACs prepared from RS activated with phosphoric acid (R = 1.2, T = 45e) 30,000×.
s Materials 181 (2010) 27–34
with PA. Therefore, adding more phosphoric acid has no effect onthe carbon yield that cannot further increase. The excess of PA thusalso reacts with the ashes (mainly silica), leading to the formation ofsilico-phosphates and other salts. Several compositions and struc-tures are possible for silico-phosphates, e.g., SiP2O7, Si5O(PO4)6, orSi(HPO4)2, H2O [31], some of them being soluble in water. Thesecompounds are extracted by boiling water in the Soxhlet whereinthe activated carbons are washed, thus decreasing the solid yield.The ash content is thus seen to vary between 41% for RS carbonisedwithout H3PO4 to 33% and 17% at R = 1 and R = 1.6, respectively (seeTable 2).
Fig. 2 presents SEM pictures of R120 AC at different magnifica-tions. Activation does not modify the morphology of the originalparticles, and the structure of the vegetal cells is fully maintained.Observation at the highest magnification revealed that the outersurface of RS is covered with small silico-phosphate crystals, whosequalitative composition was indeed revealed by EDX analysis.
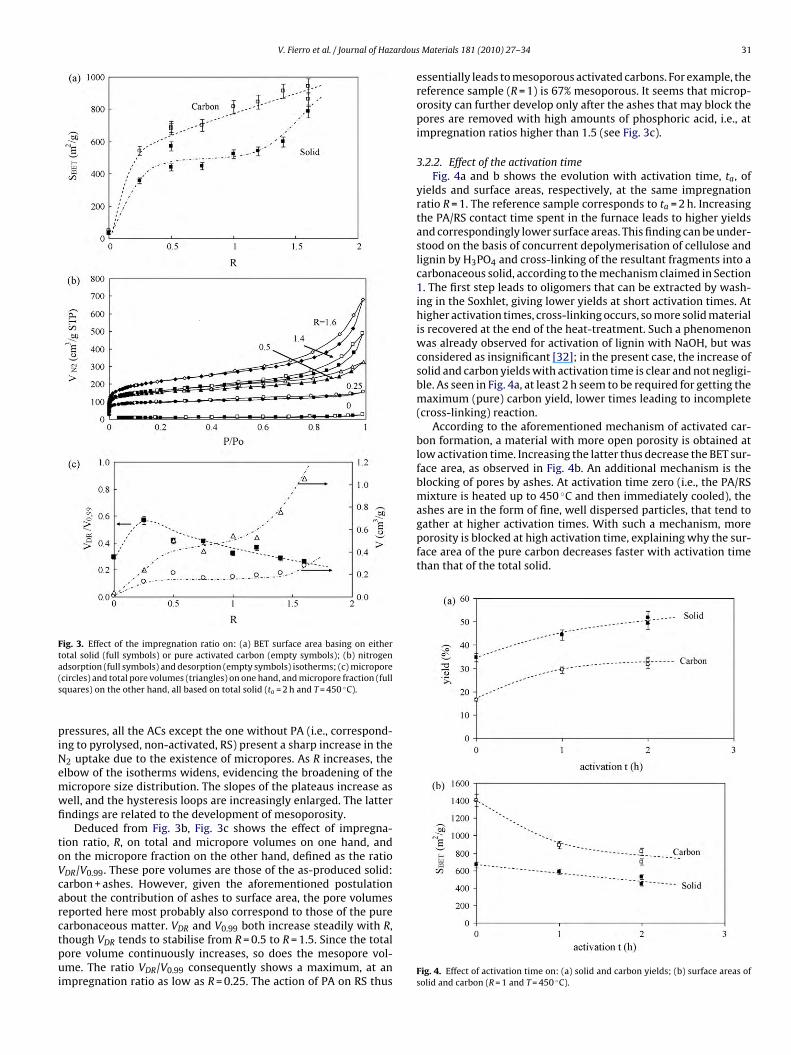
Fig. 3a shows the effect of the impregnation ratio on the specificsurface area, SBET, which was again calculated on the basis of eithertotal solid (full symbols) or pure activated carbon (empty symbols).Obviously, the surface area is the lowest in the absence of activat-ing agent (R = 0), and quickly increases as soon as R > 0. As far as thetotal solid is concerned, SBET values are stable, around 520 m2 g−1,for R ranging from 0.5 to 1.2. Then, the surface area increases grad-ually for R ≥ 1.2 due to the progressive consumption of ashes bythe excess of PA. Assuming that only the carbonaceous part of thematerial provides surface area, the corresponding SBET can be calcu-lated from the (pure) carbon yield. This assumption is quite realistic,given the following calculation. After heat-treatment, silica grainsare not expected to be smaller than 100 nm. Assuming a sphericalshape and a density of 2.2 for silica particles, and a density of 1.8 forcarbon, a silica content as high as 50 wt.% of the total solid wouldlead to an additional surface area of 14 m2 g−1, much lower than theBET values reported in Table 2. The BET surface area of pyrolysed(non-activated) RS is, however, of the same order of magnitude ofthe aforementioned calculation, thereby supporting its relevance.The contribution of pure activated carbon to the global surface areaof the solid is thus seen to increase monotonously with R in Fig. 3a,leading to SBET = 940 m2 g−1 for R = 1.6. Such a monotonous increase
and development of the porosity, due to simultaneous activationand progressive elimination of silico-phosphates.
Fig. 3b shows the evolution with R of nitrogenadsorption–desorption isotherms at −196 ◦C. At low relative
0 ◦C, ta = 2 h) at different magnifications: (a) 45×; (b) 400×; (c) 2000×; (d) 10,000×;
V. Fierro et al. / Journal of Hazardous
Fig. 3. Effect of the impregnation ratio on: (a) BET surface area basing on eithertotal solid (full symbols) or pure activated carbon (empty symbols); (b) nitrogena(s
piNemwfi
toVcarctpui
ashes are in the form of fine, well dispersed particles, that tend togather at higher activation times. With such a mechanism, moreporosity is blocked at high activation time, explaining why the sur-face area of the pure carbon decreases faster with activation timethan that of the total solid.
dsorption (full symbols) and desorption (empty symbols) isotherms; (c) microporecircles) and total pore volumes (triangles) on one hand, and micropore fraction (fullquares) on the other hand, all based on total solid (ta = 2 h and T = 450 ◦C).
ressures, all the ACs except the one without PA (i.e., correspond-ng to pyrolysed, non-activated, RS) present a sharp increase in the
2 uptake due to the existence of micropores. As R increases, thelbow of the isotherms widens, evidencing the broadening of theicropore size distribution. The slopes of the plateaus increase asell, and the hysteresis loops are increasingly enlarged. The latterndings are related to the development of mesoporosity.
Deduced from Fig. 3b, Fig. 3c shows the effect of impregna-ion ratio, R, on total and micropore volumes on one hand, andn the micropore fraction on the other hand, defined as the ratioDR/V0.99. These pore volumes are those of the as-produced solid:arbon + ashes. However, given the aforementioned postulationbout the contribution of ashes to surface area, the pore volumeseported here most probably also correspond to those of the purearbonaceous matter. VDR and V0.99 both increase steadily with R,
hough VDR tends to stabilise from R = 0.5 to R = 1.5. Since the totalore volume continuously increases, so does the mesopore vol-me. The ratio VDR/V0.99 consequently shows a maximum, at anmpregnation ratio as low as R = 0.25. The action of PA on RS thus
Materials 181 (2010) 27–34 31
essentially leads to mesoporous activated carbons. For example, thereference sample (R = 1) is 67% mesoporous. It seems that microp-orosity can further develop only after the ashes that may block thepores are removed with high amounts of phosphoric acid, i.e., atimpregnation ratios higher than 1.5 (see Fig. 3c).
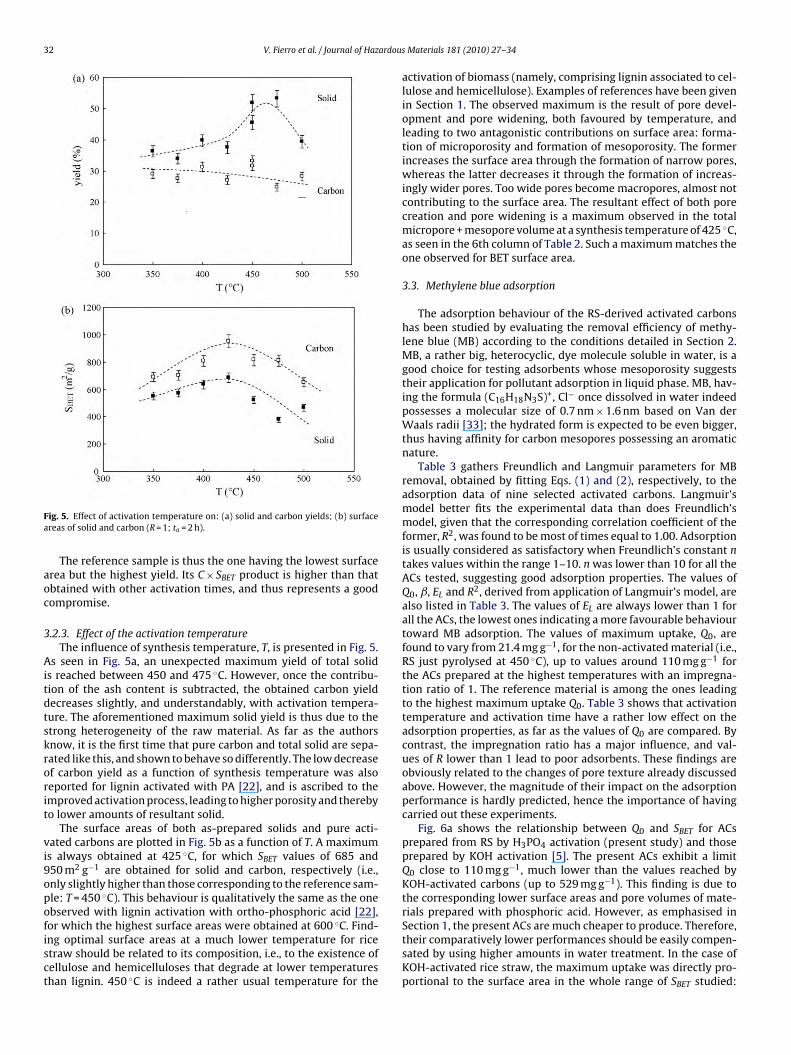
3.2.2. Effect of the activation timeFig. 4a and b shows the evolution with activation time, ta, of
yields and surface areas, respectively, at the same impregnationratio R = 1. The reference sample corresponds to ta = 2 h. Increasingthe PA/RS contact time spent in the furnace leads to higher yieldsand correspondingly lower surface areas. This finding can be under-stood on the basis of concurrent depolymerisation of cellulose andlignin by H3PO4 and cross-linking of the resultant fragments into acarbonaceous solid, according to the mechanism claimed in Section1. The first step leads to oligomers that can be extracted by wash-ing in the Soxhlet, giving lower yields at short activation times. Athigher activation times, cross-linking occurs, so more solid materialis recovered at the end of the heat-treatment. Such a phenomenonwas already observed for activation of lignin with NaOH, but wasconsidered as insignificant [32]; in the present case, the increase ofsolid and carbon yields with activation time is clear and not negligi-ble. As seen in Fig. 4a, at least 2 h seem to be required for getting themaximum (pure) carbon yield, lower times leading to incomplete(cross-linking) reaction.
According to the aforementioned mechanism of activated car-bon formation, a material with more open porosity is obtained atlow activation time. Increasing the latter thus decrease the BET sur-face area, as observed in Fig. 4b. An additional mechanism is theblocking of pores by ashes. At activation time zero (i.e., the PA/RSmixture is heated up to 450 ◦C and then immediately cooled), the
Fig. 4. Effect of activation time on: (a) solid and carbon yields; (b) surface areas ofsolid and carbon (R = 1 and T = 450 ◦C).
32 V. Fierro et al. / Journal of Hazardou
Fa
aoc
3
Aitdtskrorit
vi9opofisct
ig. 5. Effect of activation temperature on: (a) solid and carbon yields; (b) surfacereas of solid and carbon (R = 1; ta = 2 h).
The reference sample is thus the one having the lowest surfacerea but the highest yield. Its C × SBET product is higher than thatbtained with other activation times, and thus represents a goodompromise.
.2.3. Effect of the activation temperatureThe influence of synthesis temperature, T, is presented in Fig. 5.
s seen in Fig. 5a, an unexpected maximum yield of total solids reached between 450 and 475 ◦C. However, once the contribu-ion of the ash content is subtracted, the obtained carbon yieldecreases slightly, and understandably, with activation tempera-ure. The aforementioned maximum solid yield is thus due to thetrong heterogeneity of the raw material. As far as the authorsnow, it is the first time that pure carbon and total solid are sepa-ated like this, and shown to behave so differently. The low decreasef carbon yield as a function of synthesis temperature was alsoeported for lignin activated with PA [22], and is ascribed to themproved activation process, leading to higher porosity and therebyo lower amounts of resultant solid.
The surface areas of both as-prepared solids and pure acti-ated carbons are plotted in Fig. 5b as a function of T. A maximums always obtained at 425 ◦C, for which SBET values of 685 and50 m2 g−1 are obtained for solid and carbon, respectively (i.e.,nly slightly higher than those corresponding to the reference sam-le: T = 450 ◦C). This behaviour is qualitatively the same as the onebserved with lignin activation with ortho-phosphoric acid [22],
◦
or which the highest surface areas were obtained at 600 C. Find-ng optimal surface areas at a much lower temperature for ricetraw should be related to its composition, i.e., to the existence ofellulose and hemicelluloses that degrade at lower temperatureshan lignin. 450 ◦C is indeed a rather usual temperature for thes Materials 181 (2010) 27–34
activation of biomass (namely, comprising lignin associated to cel-lulose and hemicellulose). Examples of references have been givenin Section 1. The observed maximum is the result of pore devel-opment and pore widening, both favoured by temperature, andleading to two antagonistic contributions on surface area: forma-tion of microporosity and formation of mesoporosity. The formerincreases the surface area through the formation of narrow pores,whereas the latter decreases it through the formation of increas-ingly wider pores. Too wide pores become macropores, almost notcontributing to the surface area. The resultant effect of both porecreation and pore widening is a maximum observed in the totalmicropore + mesopore volume at a synthesis temperature of 425 ◦C,as seen in the 6th column of Table 2. Such a maximum matches theone observed for BET surface area.
3.3. Methylene blue adsorption
The adsorption behaviour of the RS-derived activated carbonshas been studied by evaluating the removal efficiency of methy-lene blue (MB) according to the conditions detailed in Section 2.MB, a rather big, heterocyclic, dye molecule soluble in water, is agood choice for testing adsorbents whose mesoporosity suggeststheir application for pollutant adsorption in liquid phase. MB, hav-ing the formula (C16H18N3S)+, Cl− once dissolved in water indeedpossesses a molecular size of 0.7 nm × 1.6 nm based on Van derWaals radii [33]; the hydrated form is expected to be even bigger,thus having affinity for carbon mesopores possessing an aromaticnature.
Table 3 gathers Freundlich and Langmuir parameters for MBremoval, obtained by fitting Eqs. (1) and (2), respectively, to theadsorption data of nine selected activated carbons. Langmuir’smodel better fits the experimental data than does Freundlich’smodel, given that the corresponding correlation coefficient of theformer, R2, was found to be most of times equal to 1.00. Adsorptionis usually considered as satisfactory when Freundlich’s constant ntakes values within the range 1–10. n was lower than 10 for all theACs tested, suggesting good adsorption properties. The values ofQ0, ˇ, EL and R2, derived from application of Langmuir’s model, arealso listed in Table 3. The values of EL are always lower than 1 forall the ACs, the lowest ones indicating a more favourable behaviourtoward MB adsorption. The values of maximum uptake, Q0, arefound to vary from 21.4 mg g−1, for the non-activated material (i.e.,RS just pyrolysed at 450 ◦C), up to values around 110 mg g−1 forthe ACs prepared at the highest temperatures with an impregna-tion ratio of 1. The reference material is among the ones leadingto the highest maximum uptake Q0. Table 3 shows that activationtemperature and activation time have a rather low effect on theadsorption properties, as far as the values of Q0 are compared. Bycontrast, the impregnation ratio has a major influence, and val-ues of R lower than 1 lead to poor adsorbents. These findings areobviously related to the changes of pore texture already discussedabove. However, the magnitude of their impact on the adsorptionperformance is hardly predicted, hence the importance of havingcarried out these experiments.
Fig. 6a shows the relationship between Q0 and SBET for ACsprepared from RS by H3PO4 activation (present study) and thoseprepared by KOH activation [5]. The present ACs exhibit a limitQ0 close to 110 mg g−1, much lower than the values reached byKOH-activated carbons (up to 529 mg g−1). This finding is due tothe corresponding lower surface areas and pore volumes of mate-rials prepared with phosphoric acid. However, as emphasised in
Section 1, the present ACs are much cheaper to produce. Therefore,their comparatively lower performances should be easily compen-sated by using higher amounts in water treatment. In the case ofKOH-activated rice straw, the maximum uptake was directly pro-portional to the surface area in the whole range of SBET studied: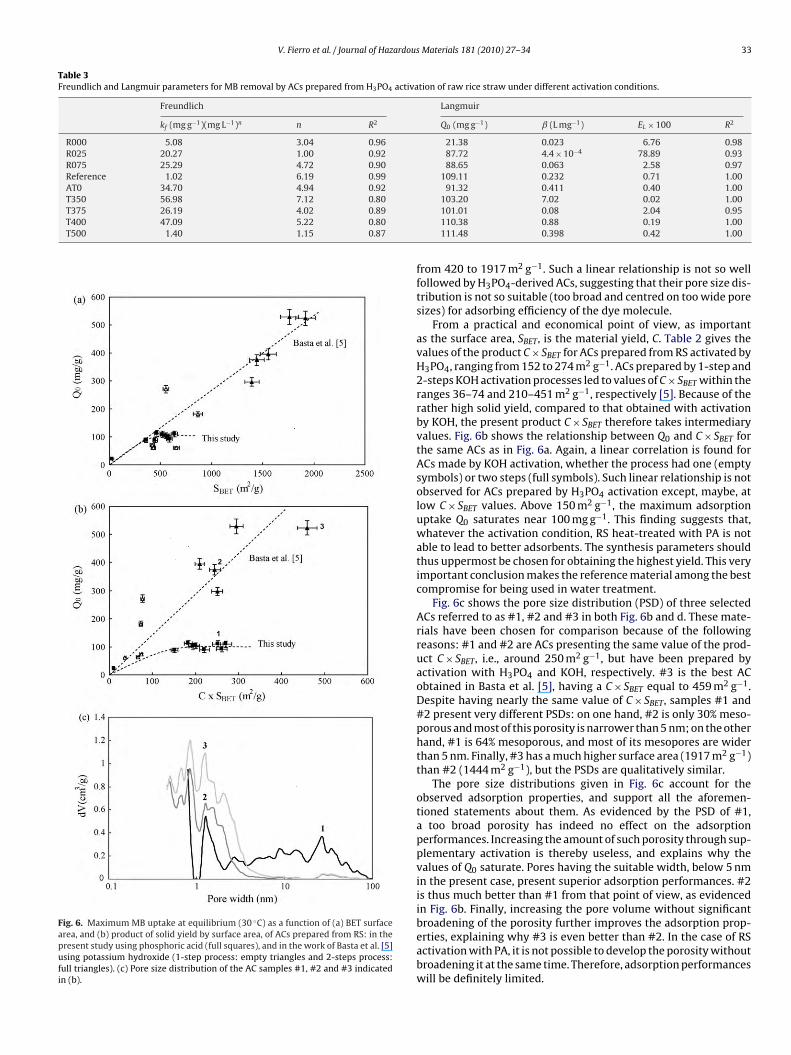
V. Fierro et al. / Journal of Hazardous Materials 181 (2010) 27–34 33
Table 3Freundlich and Langmuir parameters for MB removal by ACs prepared from H3PO4 activation of raw rice straw under different activation conditions.
Freundlich Langmuir
kf (mg g−1)(mg L−1)n n R2 Q0 (mg g−1) ˇ (L mg−1) EL × 100 R2
R000 5.08 3.04 0.96 21.38 0.023 6.76 0.98R025 20.27 1.00 0.92 87.72 4.4 × 10⁻⁴ 78.89 0.93R075 25.29 4.72 0.90 88.65 0.063 2.58 0.97Reference 1.02 6.19 0.99 109.11 0.232 0.71 1.00AT0 34.70 4.94 0.92 91.32 0.411 0.40 1.00T350 56.98 7.12 0.80T375 26.19 4.02 0.89T400 47.09 5.22 0.80T500 1.40 1.15 0.87
Fig. 6. Maximum MB uptake at equilibrium (30 ◦C) as a function of (a) BET surfacearea, and (b) product of solid yield by surface area, of ACs prepared from RS: in thepresent study using phosphoric acid (full squares), and in the work of Basta et al. [5]using potassium hydroxide (1-step process: empty triangles and 2-steps process:full triangles). (c) Pore size distribution of the AC samples #1, #2 and #3 indicatedin (b).
103.20 7.02 0.02 1.00101.01 0.08 2.04 0.95110.38 0.88 0.19 1.00111.48 0.398 0.42 1.00
from 420 to 1917 m2 g−1. Such a linear relationship is not so wellfollowed by H3PO4-derived ACs, suggesting that their pore size dis-tribution is not so suitable (too broad and centred on too wide poresizes) for adsorbing efficiency of the dye molecule.
From a practical and economical point of view, as importantas the surface area, SBET, is the material yield, C. Table 2 gives thevalues of the product C × SBET for ACs prepared from RS activated byH3PO4, ranging from 152 to 274 m2 g−1. ACs prepared by 1-step and2-steps KOH activation processes led to values of C × SBET within theranges 36–74 and 210–451 m2 g−1, respectively [5]. Because of therather high solid yield, compared to that obtained with activationby KOH, the present product C × SBET therefore takes intermediaryvalues. Fig. 6b shows the relationship between Q0 and C × SBET forthe same ACs as in Fig. 6a. Again, a linear correlation is found forACs made by KOH activation, whether the process had one (emptysymbols) or two steps (full symbols). Such linear relationship is notobserved for ACs prepared by H3PO4 activation except, maybe, atlow C × SBET values. Above 150 m2 g−1, the maximum adsorptionuptake Q0 saturates near 100 mg g−1. This finding suggests that,whatever the activation condition, RS heat-treated with PA is notable to lead to better adsorbents. The synthesis parameters shouldthus uppermost be chosen for obtaining the highest yield. This veryimportant conclusion makes the reference material among the bestcompromise for being used in water treatment.
Fig. 6c shows the pore size distribution (PSD) of three selectedACs referred to as #1, #2 and #3 in both Fig. 6b and d. These mate-rials have been chosen for comparison because of the followingreasons: #1 and #2 are ACs presenting the same value of the prod-uct C × SBET, i.e., around 250 m2 g−1, but have been prepared byactivation with H3PO4 and KOH, respectively. #3 is the best ACobtained in Basta et al. [5], having a C × SBET equal to 459 m2 g−1.Despite having nearly the same value of C × SBET, samples #1 and#2 present very different PSDs: on one hand, #2 is only 30% meso-porous and most of this porosity is narrower than 5 nm; on the otherhand, #1 is 64% mesoporous, and most of its mesopores are widerthan 5 nm. Finally, #3 has a much higher surface area (1917 m2 g−1)than #2 (1444 m2 g−1), but the PSDs are qualitatively similar.
The pore size distributions given in Fig. 6c account for theobserved adsorption properties, and support all the aforemen-tioned statements about them. As evidenced by the PSD of #1,a too broad porosity has indeed no effect on the adsorptionperformances. Increasing the amount of such porosity through sup-plementary activation is thereby useless, and explains why thevalues of Q0 saturate. Pores having the suitable width, below 5 nmin the present case, present superior adsorption performances. #2is thus much better than #1 from that point of view, as evidencedin Fig. 6b. Finally, increasing the pore volume without significant
broadening of the porosity further improves the adsorption prop-erties, explaining why #3 is even better than #2. In the case of RSactivation with PA, it is not possible to develop the porosity withoutbroadening it at the same time. Therefore, adsorption performanceswill be definitely limited.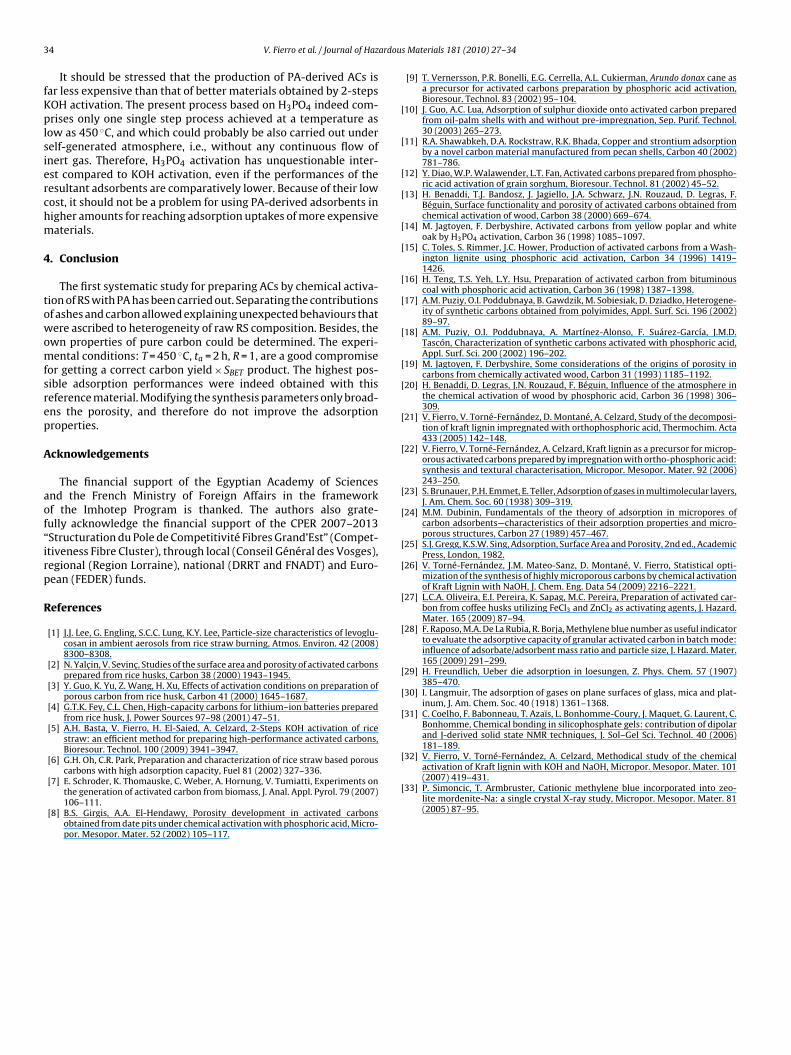
3 ardou
fKplsierchm
4
towomfsrep
A
aof“irp
R
[
[
[
[
[
[
[
[
[
[
[
[
[
[
[
[
[
[
[
[
[
[
[32] V. Fierro, V. Torné-Fernández, A. Celzard, Methodical study of the chemicalactivation of Kraft lignin with KOH and NaOH, Micropor. Mesopor. Mater. 101
4 V. Fierro et al. / Journal of Haz
It should be stressed that the production of PA-derived ACs isar less expensive than that of better materials obtained by 2-stepsOH activation. The present process based on H3PO4 indeed com-rises only one single step process achieved at a temperature as
ow as 450 ◦C, and which could probably be also carried out underelf-generated atmosphere, i.e., without any continuous flow ofnert gas. Therefore, H3PO4 activation has unquestionable inter-st compared to KOH activation, even if the performances of theesultant adsorbents are comparatively lower. Because of their lowost, it should not be a problem for using PA-derived adsorbents inigher amounts for reaching adsorption uptakes of more expensiveaterials.
. Conclusion
The first systematic study for preparing ACs by chemical activa-ion of RS with PA has been carried out. Separating the contributionsf ashes and carbon allowed explaining unexpected behaviours thatere ascribed to heterogeneity of raw RS composition. Besides, the
wn properties of pure carbon could be determined. The experi-ental conditions: T = 450 ◦C, ta = 2 h, R = 1, are a good compromise
or getting a correct carbon yield × SBET product. The highest pos-ible adsorption performances were indeed obtained with thiseference material. Modifying the synthesis parameters only broad-ns the porosity, and therefore do not improve the adsorptionroperties.
cknowledgements
The financial support of the Egyptian Academy of Sciencesnd the French Ministry of Foreign Affairs in the frameworkf the Imhotep Program is thanked. The authors also grate-ully acknowledge the financial support of the CPER 2007–2013Structuration du Pole de Competitivité Fibres Grand’Est” (Compet-tiveness Fibre Cluster), through local (Conseil Général des Vosges),egional (Region Lorraine), national (DRRT and FNADT) and Euro-ean (FEDER) funds.
eferences
[1] J.J. Lee, G. Engling, S.C.C. Lung, K.Y. Lee, Particle-size characteristics of levoglu-cosan in ambient aerosols from rice straw burning, Atmos. Environ. 42 (2008)8300–8308.
[2] N. Yalcin, V. Sevinc, Studies of the surface area and porosity of activated carbonsprepared from rice husks, Carbon 38 (2000) 1943–1945.
[3] Y. Guo, K. Yu, Z. Wang, H. Xu, Effects of activation conditions on preparation ofporous carbon from rice husk, Carbon 41 (2000) 1645–1687.
[4] G.T.K. Fey, C.L. Chen, High-capacity carbons for lithium–ion batteries preparedfrom rice husk, J. Power Sources 97–98 (2001) 47–51.
[5] A.H. Basta, V. Fierro, H. El-Saied, A. Celzard, 2-Steps KOH activation of ricestraw: an efficient method for preparing high-performance activated carbons,Bioresour. Technol. 100 (2009) 3941–3947.
[6] G.H. Oh, C.R. Park, Preparation and characterization of rice straw based porouscarbons with high adsorption capacity, Fuel 81 (2002) 327–336.
[7] E. Schroder, K. Thomauske, C. Weber, A. Hornung, V. Tumiatti, Experiments onthe generation of activated carbon from biomass, J. Anal. Appl. Pyrol. 79 (2007)106–111.
[8] B.S. Girgis, A.A. El-Hendawy, Porosity development in activated carbonsobtained from date pits under chemical activation with phosphoric acid, Micro-por. Mesopor. Mater. 52 (2002) 105–117.
[
s Materials 181 (2010) 27–34
[9] T. Vernersson, P.R. Bonelli, E.G. Cerrella, A.L. Cukierman, Arundo donax cane asa precursor for activated carbons preparation by phosphoric acid activation,Bioresour. Technol. 83 (2002) 95–104.
10] J. Guo, A.C. Lua, Adsorption of sulphur dioxide onto activated carbon preparedfrom oil-palm shells with and without pre-impregnation, Sep. Purif. Technol.30 (2003) 265–273.
11] R.A. Shawabkeh, D.A. Rockstraw, R.K. Bhada, Copper and strontium adsorptionby a novel carbon material manufactured from pecan shells, Carbon 40 (2002)781–786.
12] Y. Diao, W.P. Walawender, L.T. Fan, Activated carbons prepared from phospho-ric acid activation of grain sorghum, Bioresour. Technol. 81 (2002) 45–52.
13] H. Benaddi, T.J. Bandosz, J. Jagiello, J.A. Schwarz, J.N. Rouzaud, D. Legras, F.Béguin, Surface functionality and porosity of activated carbons obtained fromchemical activation of wood, Carbon 38 (2000) 669–674.
14] M. Jagtoyen, F. Derbyshire, Activated carbons from yellow poplar and whiteoak by H3PO4 activation, Carbon 36 (1998) 1085–1097.
15] C. Toles, S. Rimmer, J.C. Hower, Production of activated carbons from a Wash-ington lignite using phosphoric acid activation, Carbon 34 (1996) 1419–1426.
16] H. Teng, T.S. Yeh, L.Y. Hsu, Preparation of activated carbon from bituminouscoal with phosphoric acid activation, Carbon 36 (1998) 1387–1398.
17] A.M. Puziy, O.I. Poddubnaya, B. Gawdzik, M. Sobiesiak, D. Dziadko, Heterogene-ity of synthetic carbons obtained from polyimides, Appl. Surf. Sci. 196 (2002)89–97.
18] A.M. Puziy, O.I. Poddubnaya, A. Martínez-Alonso, F. Suárez-García, J.M.D.Tascón, Characterization of synthetic carbons activated with phosphoric acid,Appl. Surf. Sci. 200 (2002) 196–202.
19] M. Jagtoyen, F. Derbyshire, Some considerations of the origins of porosity incarbons from chemically activated wood, Carbon 31 (1993) 1185–1192.
20] H. Benaddi, D. Legras, J.N. Rouzaud, F. Béguin, Influence of the atmosphere inthe chemical activation of wood by phosphoric acid, Carbon 36 (1998) 306–309.
21] V. Fierro, V. Torné-Fernández, D. Montané, A. Celzard, Study of the decomposi-tion of kraft lignin impregnated with orthophosphoric acid, Thermochim. Acta433 (2005) 142–148.
22] V. Fierro, V. Torné-Fernández, A. Celzard, Kraft lignin as a precursor for microp-orous activated carbons prepared by impregnation with ortho-phosphoric acid:synthesis and textural characterisation, Micropor. Mesopor. Mater. 92 (2006)243–250.
23] S. Brunauer, P.H. Emmet, E. Teller, Adsorption of gases in multimolecular layers,J. Am. Chem. Soc. 60 (1938) 309–319.
24] M.M. Dubinin, Fundamentals of the theory of adsorption in micropores ofcarbon adsorbents—characteristics of their adsorption properties and micro-porous structures, Carbon 27 (1989) 457–467.
25] S.J. Gregg, K.S.W. Sing, Adsorption, Surface Area and Porosity, 2nd ed., AcademicPress, London, 1982.
26] V. Torné-Fernández, J.M. Mateo-Sanz, D. Montané, V. Fierro, Statistical opti-mization of the synthesis of highly microporous carbons by chemical activationof Kraft Lignin with NaOH, J. Chem. Eng. Data 54 (2009) 2216–2221.
27] L.C.A. Oliveira, E.I. Pereira, K. Sapag, M.C. Pereira, Preparation of activated car-bon from coffee husks utilizing FeCl3 and ZnCl2 as activating agents, J. Hazard.Mater. 165 (2009) 87–94.
28] F. Raposo, M.A. De La Rubia, R. Borja, Methylene blue number as useful indicatorto evaluate the adsorptive capacity of granular activated carbon in batch mode:influence of adsorbate/adsorbent mass ratio and particle size, J. Hazard. Mater.165 (2009) 291–299.
29] H. Freundlich, Ueber die adsorption in loesungen, Z. Phys. Chem. 57 (1907)385–470.
30] I. Langmuir, The adsorption of gases on plane surfaces of glass, mica and plat-inum, J. Am. Chem. Soc. 40 (1918) 1361–1368.
31] C. Coelho, F. Babonneau, T. Azaïs, L. Bonhomme-Coury, J. Maquet, G. Laurent, C.Bonhomme, Chemical bonding in silicophosphate gels: contribution of dipolarand J-derived solid state NMR techniques, J. Sol–Gel Sci. Technol. 40 (2006)181–189.
(2007) 419–431.33] P. Simoncic, T. Armbruster, Cationic methylene blue incorporated into zeo-
lite mordenite-Na: a single crystal X-ray study, Micropor. Mesopor. Mater. 81(2005) 87–95.