characterization of polyurethane foams from soybean oil
TRANSCRIPT
Characterization of Polyurethane Foams from Soybean Oil
Jacob John,1 Mrinal Bhattacharya,1 Robert B. Turner2
1Department of Biosystems and Agricultural Engineering, University of Minnesota, St. Paul, Minnesota 551082Urethane Soy Systems Incorporated, 109 Juniper Berry Trail, Georgetown, Texas 78626
Received 15 February 2002; accepted 28 March 2002Published online 3 October 2002 in Wiley InterScience (www.interscience.wiley.com). DOI 10.1002/app.11322
ABSTRACT: Modified soy-based vegetable oil polyolswere successfully incorporated as a replacement for conven-tional polyols to produce flexible slabstock polyurethanefoams. The oil was characterized for its hydroxyl value andfatty acid composition. The modified oils had higher hy-droxyl values and lower unsaturated acids than regularunmodified oils. Three different modified polyols were usedto investigate the reactivity with isocyanates. The effects onthe foaming reaction of two different isocyanates, namelyTDI and MDI, were investigated. The reactions were alsocarried out with a mixture of polyols containing syntheticpolyols and vegetable oil-based polyols to delineate theeffect of each component. FTIR technique was used to iden-tify the sequence of chemical reactions during the foamingprocess. The effect of water levels and isocyanate content onthe kinetics of the foaming reaction was investigated. Infor-
mation regarding the formation of hard and soft segmentswith the varying compositions was obtained. As the watercontent increased, the amount of the hard segment and ureaformation increased in both soy oil polyols and syntheticpolyols. Increased synthetic polyols in the mixture increasedthe rate of reaction and phase mixing due to the availabilityof primary hydroxyl groups. Scanning electron microscopy(SEM) and small-angle X-ray scattering (SAXS) were used toprobe the morphology. As the water content increased, thecell size increased. At lower water content a more uniformcell structure was evident and at higher water levels harddomain size increased. © 2002 Wiley Periodicals, Inc. J ApplPolym Sci 86: 3097–3107, 2002
Key words: soybean oil; polyurethanes; FTIR; NMR; gelpermeation chromatography (GPC)
INTRODUCTION
Soybean oil is an inexpensive, readily available renew-able resource. The oil, comprised of triglycerides offatty acids, provides an excellent platform for valuablepolymeric materials like polyepoxides, polyurethanes,and similar compounds. Soybean oil triglycerides con-tain both saturated and unsaturated fatty acids. Theunsaturated fatty acid composition exceeds 80%, de-pending on the variety and climatic conditions of har-vest.1 The unsaturated sites in oil can be utilized tointroduce functional groups. Petrovic and coworkers2
reported that functional groups can be introduced atthe positions of double bonds. Thus, the number offunctional groups will vary with the type of vegetableoil as well as the degree of conversion.
In recent decades, there has been an increased de-mand for urethane materials.3 There are several refer-ences4,5 that indicates vegetable oils can be used asintegral parts of urethane materials. The properties ofa castor oil–diisocynate coatings were found to im-prove when treated with low molecular polyols byalcoholysis.6 Our interest in polyurethanes stems fromthe fact that soy oil can be modified to react withisocyanate to produce urethane products that will add
value to the soy oil and decrease the cost of the sys-tem. A second important aspect is the fact that soy-bean oil is a renewable resource. Because most of ouroil is imported from politically unstable regions, thishas the potential to increase our national security.
The objective of this research is to conduct a sys-tematic study comparing the reaction kinetics to themorphology of urethane foams made from vegetableoils. In the present study, functionalized soybean oilwas used to prepare polyurethane foam. The oil wascharacterized using FTIR, NMR, and gas chromatog-raphy (GC). Hydroxyl value, acid value, and iodinevalue were determined using AOCS methods. Thereaction was monitored using FTIR. The polyols werealso mixed with synthetic polyols water mixtures toexamine the rate of foaming reaction. The isocyanateindex and water content in the foam formulation wasvaried to examine the properties of the foam. Themorphology of the foams was examined with the helpof a scanning electron microscope. Small-angle X-rayscattering was used to investigate the hard domainstructure.
EXPERIMENTAL
Materials
Three different soy polyol samples were obtainedfrom Urethane Soy Systems Inc. (Illinois) and labeledas P38.05, P38-GC5, and P3805. Crude soybean oil
Correspondence to: M. Bhattacharya ([email protected]).
Journal of Applied Polymer Science, Vol. 86, 3097–3107 (2002)© 2002 Wiley Periodicals, Inc.
samples supplied by Volga Oil Processing Company,Volga, SD, and commercial edible soybean oil ob-tained from a grocery store were also analyzed forcomparative purposes. These oils were subjected tovarious spectroscopic and chemical analyses to evalu-ate the structural and physical characteristics.
Toluene Diisocynate, an 80 : 20 mixture of 2,4- and2,6-isomers of toluene diisocyanate (TDI) and spectro-scopic grade solvent was obtained from AldrichChemicals, Milwaukee, WI. ISONATE 143L, a modi-fied MDI, is a polycarbodiimide-modified diphenyl-methane diisocyanate that is liquid at room tempera-ture, was supplied by Dow Chemicals, Midlands, MI.Dabco T-9 (Stannous Octoate catalyst) and Dabco33-LV (Amine catalyst, 33% triethylenediamine in 67%dipropylene glycol) catalysts were supplied by AirProducts, PA. HPLC grade standards were obtainedfrom Sigma Aldrich, St. Louis, MO. Deionized waterwas obtained using the Millipore water purificationsystem.
Hydroxyl value
The hydroxyl value is defined as the number of mil-ligrams potassium hydroxide equivalent to the hy-droxyl content of 1 g of sample. The AOCS officialmethod Cd 13-60 was used to determine the hydroxylvalue of the oil samples. Acid value and iodine valuewere determined according to AOCS procedures Cd3d-63 and Cd 1c-85, respectively.
Fatty acid composition
The fatty acid components were separated and iden-tified with the help of gas chromatography. To deter-mine the fatty acid concentration, fatty acids are con-verted to corresponding methyl esters according toAOCS method Ce 2-66. The oil sample was taken in a125-mL flask. A specific amount of BF3 –methanolmixture was added, and a reflux condenser was at-tached and the mixture was boiled for 2 min. Fivemilliliters of heptane was added through the con-denser, and the mixture was boiled for an additionalminute. After removing from heat, 15 mL of saturatedsodium chloride solution was added. The mixture wasshaken vigorously for 15 s. The ester layer was sepa-rated from the flask into a small test tube, and a smallamount of anhydrous sodium sulfate was added. Thisdry mixture was then directly injected into the gaschromatograph (Hewlett Packard 5890). A DBWAXcolumn (L � 30 m, d � 0.32 cm, size � 0.5 �m)obtained from J&W Scientific Inc (Folsom, CA) wasused with a temperature ramp of 60 to 230°C at therate of 8°C/min. The detector temperature was 230°C,and the carrier gas used was helium. A standard wasrun before the sample was injected, and the percent-
age composition was directly obtained from the chro-matogram.
FTIR measurements
The FTIR measurements of the oil samples were con-ducted using a Nicolet 7000 series spectrometer. Thesamples were dissolved in chloroform and casted on asodium chloride crystal to obtain a thin film, and thespectra of the films were taken.
NMR spectra
The NMR spectra of the oil and polyol samples wereobtained at 300 MHZ using a Varian VXR300 instru-ment with a 12.2-�s (90 degree) pulse and an acquisi-tion time of 2.0 s. The samples were dissolved indeuterated chloroform, and 1H-NMR spectra were ob-tained at room temperature.
Foam formulation
The basic foam formulation contains a polyol, surfac-tant, water, catalyst, and isocynate. Hence, there areseveral variables that can play a significant role in thefinal foam quality. The components were mixed in aStyrofoam cup, and the volume and temperature risemonitored. To account for traces of water, an excessisocyante index (1.10) was used to obtain good qualityfoam.
Infrared measurements during foaming reaction
The foaming reactions were also monitored using thesame spectrometer with the help of the experimentalsetup described in detail by Artavia.7 The reactionmixture (soy polyol, water, catalysts, and surfactant)were mixed together and required amount of TDI wasadded. The mixture was again mixed well and imme-diately transferred in to the reaction cell (45–50 s). Thecell was equipped with a 45° KRS-5 single-pass paral-lelogram prism with a dimension of 50 � 5 � 2 mm.The technique used was attenuated total reflectanceinfrared spectroscopy (ATR). As the ATR crystaltouches the reactive form, it can act like a cold sinkaltering the reaction exotherm. Hence, the cell and thecrystal were heated at the same rate as the reactionprogressed with the help of previously saved reactiondata. This was achieved with a temperature controllerand a heating element attached to the cell. Thechanges taking place during the foaming reactionwere monitored with a Nicolet FTIR instrument usinga MCT detector. Infrared spectra were collected at 4cm�1 resolutions and the scanning time was 15 s perfile. A background spectrum was also collected beforeheating the probe. The FTIR data was collected for 20min from the start of the reaction, and it was found
3098 JOHN, BHATTACHARYA, AND TURNER
that the visible spectral changes ceases after 10 minfrom the start.
Gel permeation chromatography (GPC)
A Waters 150 LC/GPC was used with a refractiveindex detector to measure the molecular mass. A Phe-nogel (Phenomenex, Torrance, CA) column (300 � 7.8mm) with 500-�m particles was used for separation.HPLC grade tetrahydrofuran (THF) was used as themobile phase. The experiment was carried out at roomtemperature with a solvent flow rate of 1 mL/minwith 35 bars pressure. The refractive index versus theelution volume was obtained for each sample andcorrelated to the elution volume vs. molecular weightfor the polystyrene standard.
Mass spectroscopy
Matrix-Assisted Laser Desorption/Ionization (MALDI-TOF) mass spectroscopy was used to determine theabsolute molecular weight of selected oil samples. ABruker reflex IV machine was used for this purpose.
Small angle X-ray scattering
The data was collected on the 2D small-angle X-raylines with copper radiation. Two sample-to-detectordistances were run: 112 and 232 cm. The detector usedis a Bruker GADDS. Data was collected at room tem-perature for 10 min per sample.
Morphology
The morphology of the foam samples was examinedwith the help of a Hitachi S-800 scanning electronmicroscope. A small portion of the foam was cut fromthe appropriate foam block and frozen in liquid nitro-gen. A thin piece of foam was then carefully slicedwith a sharp blade and stuck to aluminum stubs. Thesamples were then sputter-coated with a total of 15 nmof Au/Pd and observed under the microscope em-ploying an accelerating voltage of 10 kV and a probecurrent of 6 � 10�11 amps.
RESULTS AND DISCUSSION
Composition
Soybean oil is less expensive than corn, safflower, andsunflower oils, yet it has many of the desirable char-acteristics of premium vegetable oils. It also has ahigher level of unsaturation compared to some othervegetable oils. Crude soybean oil contains approxi-mately 95–97% triglycerides.8 The fatty acid composi-
TABLE IAverage Fatty Acid Composition of Soybean Oil from
Literature Data
Component acid Average composition %
SaturatedLauric 0.1Myristic 0.2Palmitic 10.7Stearic 3.9Arachidic 0.2Behenic �0.5Total �15.0
UnsaturatedPalmitoleic 0.3Oleic 22.8Linoleic 50.8Linonelic 6.8Eicosenic �1.0Total �80.7
TABLE IIFatty Acid Profile for the Soybean Oil and Polyol Samples Obtained from GC
Component acid Store soy oil P38.05 P38-GC5 P3805
SaturatedLauric 0.103 0.098 0.11 0.042Myristic (14 : 0) 13.12 0.165 0.087 0.086Palmitic (16 : 0) 5.07 21.29 20.81 19.56Stearic (18 : 0) 0.256 5.92 6.26 5.79Arachidic (20 : 0) 0.147 0.312 0.183 0.31Behenic (22 : 0) 0.101 0.435 0.184 0.125Total 18.69 27.78 27.45 25.78
UnsaturatedPlamitoleic (16 : 1) 0.118 0.131 0.114 0.113Oleic (18 : 1) 22.51 26.19 30.41 29.63Linoleic (18 : 2) 48.90 32.36 37.24 39.71Linonelic (18 : 3) 5.49 2.53 2.49 3.15Eicosenic (20 : 1) 0.225 0.505 0.174 0.151Total 77.24 61.72 70.42 72.75
CHARACTERIZATION OF POLYURETHANE FOAMS FROM SOYBEAN OIL 3099
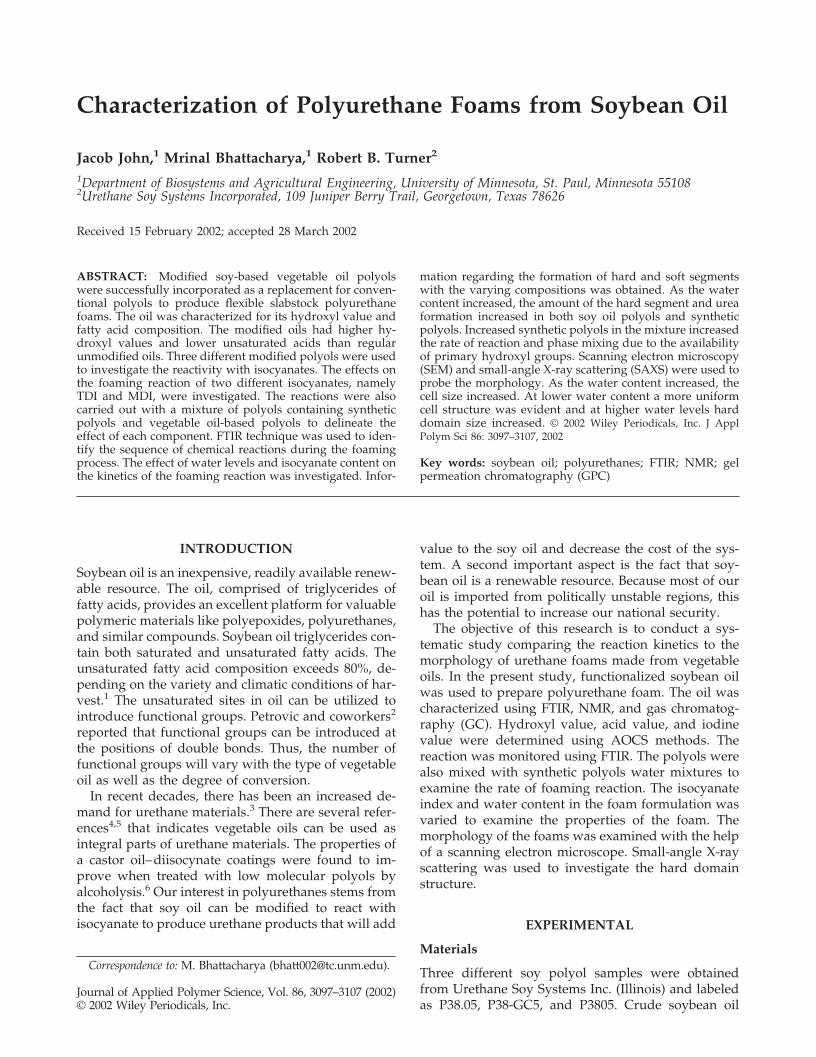
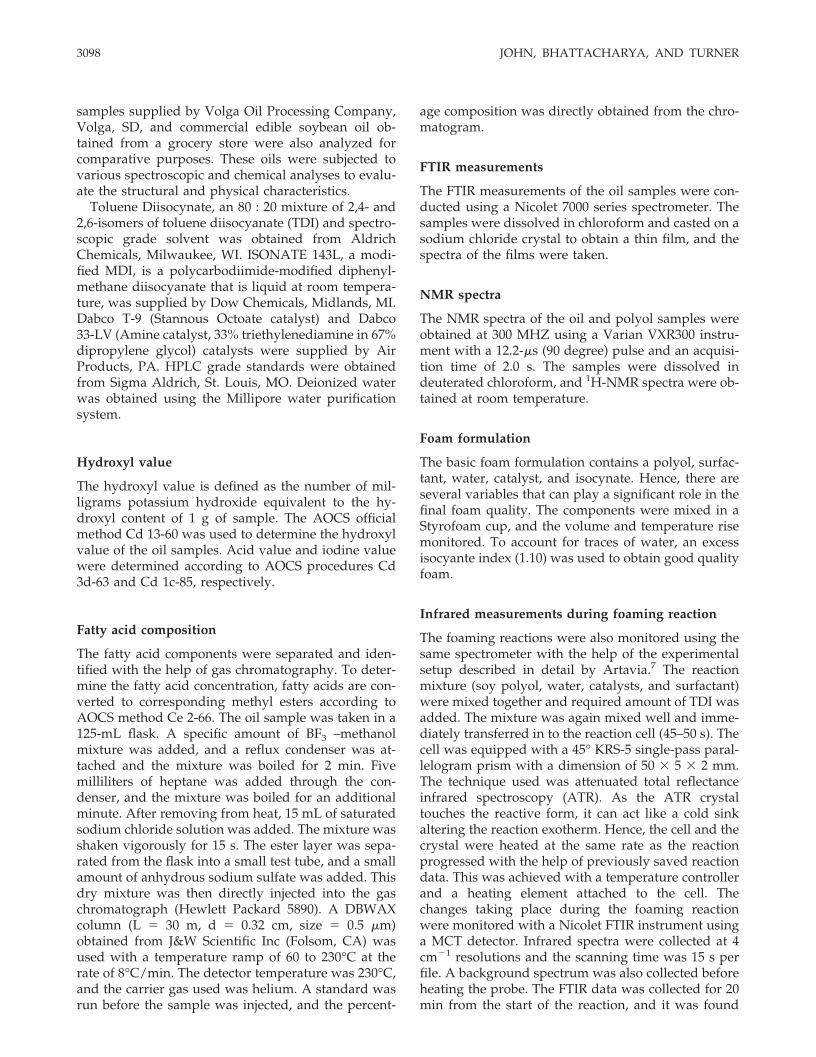
tion of soybean oil is shown in Table I. As evidentfrom the table, the soybean oil triglycerides containboth saturated and unsaturated fatty acids. It wasfound that the soybean oil did not generate any foamwhen used in the unmodified form. Attempts weremade to modify the soybean oil by introducing hy-droxyl groups so that it could be used in polyurethaneformulations. Guo and coworkers9 reported the prep-aration of soy polyols via the oxirane ring-openingreaction of epoxidized soybean oil with methanol. Thefatty acid composition of modified and unmodifiedsoybean oils obtained from GC analysis are given inTable II. A schematic representation of soy oil mole-cule is given in Figure 1. The unsaturated fatty acidsare viable to oxidation and hydroxyl groups can beadded to the oil chain after oxidation. Figure 1(b)shows an idealized soy polyol obtained after oxida-tion. It is not necessary that all the double bonds willbe converted to hydroxyl groups during air oxidationprocess and needs further investigation to assert thechemical changes.
Changes in fatty acid composition can be observedwhile examining the three different polyols and thesoybean oil. There is a decrease in percentage compo-sition of unsaturated fatty acids. This is particularlytrue in the case of linolenic (18 : 3) and linoleic (18 : 2)acid, which is reduced by a third and a quarter, re-spectively, for all the three modified polyols whencompared to unmodifed soybean oil. From Table II, itis clear that linoleic acid, which is the largest of theunsaturated acids, is the most susceptible to function-alization compared to other unsaturated fatty ac-ids.10,11 Neff et al.11 observed trilinoleoylglycerol anddilinoleoyl-oleoylglycerol were the major product pre-cursors during photooxidation of soybean oil. Similarobservation was also reported during the oxidativestability studies of polyunsaturated fatty acids of soy-bean oil in presence of emulsifiers and found thatlinoleic acid was more unstable.11 This could be due tothe oxidation of linoleic to oleic acid.12 Fatty acidprofile indicates that the saturated acid composition,especially palmitic acid (16 : 0) and stearic acid (18 : 0)content increased.12 The increase in saturated fattyacid content could also be due to the conversion ofunsaturated to saturated during a oxidation process. Itwas also reported that linolenate polymerizes veryrapidly into a complex mixture of oxygen-containingcompounds. These materials include dimers, trimers,and higher polymers responsible for a higher molec-ular weight fraction.1
The viscosities of the polyols were much higher(�2800 cps at 72°F) than the regular soybean oil(�50.5 cps at 77°F). The hydroxyl numbers of the soypolyols were also higher (Table III), indicating theintroduction of OH functionality to the molecule. Guoand coworkers13 also reported an increase in viscosity,even with a single OH group per double bond. Lino-leic acid, comprise about 50% of the total fatty acids,has two double bonds and oleic acid (�25% byweight) has one double bond. The fatty acid content ofthe polyols indicates that as the linoleic acid contentdecreases, the oleic acid and stearic acid content in-creases. Table III shows the acid values for the polyolsamples, which is a measure of the free acids per gramof the sample. Hence, in samples that contain virtuallyno free acids other than fatty acids, the acid value may
Figure 1 Structure of (1) soy oil, and (2) soy polyol.
TABLE IIIAcid Value and Iodine Value and Hydroxyl Value of Oil Samples
SampleAcid valuemgKOH/g
Iodine valuecent. g ofiodine/g
Hydroxyl valuemgKOHequiva/g Functionality
Molecularweight(Mn)
Polydispersity(Mw/Mn)
Crude Soy 1.28 133.39 35.4 1.0 1587 1.01Store Soy 0.45 124.17 32.5 1.0 1583 1.01P38.05 7.04 89.90 53.2 2.85 3008 4.81P38-GC5, 4.84 101.96 91.8 5.08 3110 5.35P3805 6.76 107.48 92.5 5.20 3161 8.33
3100 JOHN, BHATTACHARYA, AND TURNER
be directly converted to percent free fatty acids. It wasnoticed that the acid values were higher for polyolswhen compared to the soybean oil samples. The io-dine value represents the magnitude of unsaturationin the molecule. While examining the iodine values forthe polyols and the oil, it is evident that the unsatura-tion decreases after the functionalization process.
Molecular weight
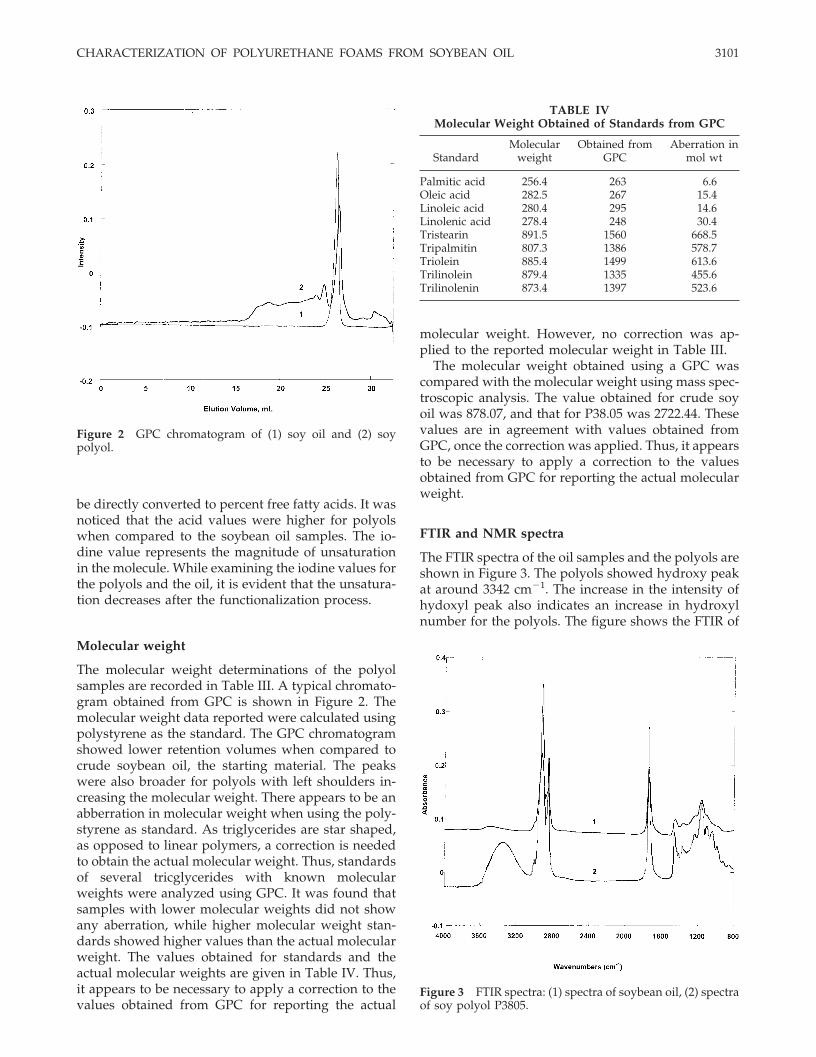
The molecular weight determinations of the polyolsamples are recorded in Table III. A typical chromato-gram obtained from GPC is shown in Figure 2. Themolecular weight data reported were calculated usingpolystyrene as the standard. The GPC chromatogramshowed lower retention volumes when compared tocrude soybean oil, the starting material. The peakswere also broader for polyols with left shoulders in-creasing the molecular weight. There appears to be anabberration in molecular weight when using the poly-styrene as standard. As triglycerides are star shaped,as opposed to linear polymers, a correction is neededto obtain the actual molecular weight. Thus, standardsof several tricglycerides with known molecularweights were analyzed using GPC. It was found thatsamples with lower molecular weights did not showany aberration, while higher molecular weight stan-dards showed higher values than the actual molecularweight. The values obtained for standards and theactual molecular weights are given in Table IV. Thus,it appears to be necessary to apply a correction to thevalues obtained from GPC for reporting the actual
molecular weight. However, no correction was ap-plied to the reported molecular weight in Table III.
The molecular weight obtained using a GPC wascompared with the molecular weight using mass spec-troscopic analysis. The value obtained for crude soyoil was 878.07, and that for P38.05 was 2722.44. Thesevalues are in agreement with values obtained fromGPC, once the correction was applied. Thus, it appearsto be necessary to apply a correction to the valuesobtained from GPC for reporting the actual molecularweight.
FTIR and NMR spectra
The FTIR spectra of the oil samples and the polyols areshown in Figure 3. The polyols showed hydroxy peakat around 3342 cm�1. The increase in the intensity ofhydoxyl peak also indicates an increase in hydroxylnumber for the polyols. The figure shows the FTIR of
Figure 2 GPC chromatogram of (1) soy oil and (2) soypolyol.
TABLE IVMolecular Weight Obtained of Standards from GPC
StandardMolecular
weightObtained from
GPCAberration in
mol wt
Palmitic acid 256.4 263 6.6Oleic acid 282.5 267 15.4Linoleic acid 280.4 295 14.6Linolenic acid 278.4 248 30.4Tristearin 891.5 1560 668.5Tripalmitin 807.3 1386 578.7Triolein 885.4 1499 613.6Trilinolein 879.4 1335 455.6Trilinolenin 873.4 1397 523.6
Figure 3 FTIR spectra: (1) spectra of soybean oil, (2) spectraof soy polyol P3805.
CHARACTERIZATION OF POLYURETHANE FOAMS FROM SOYBEAN OIL 3101
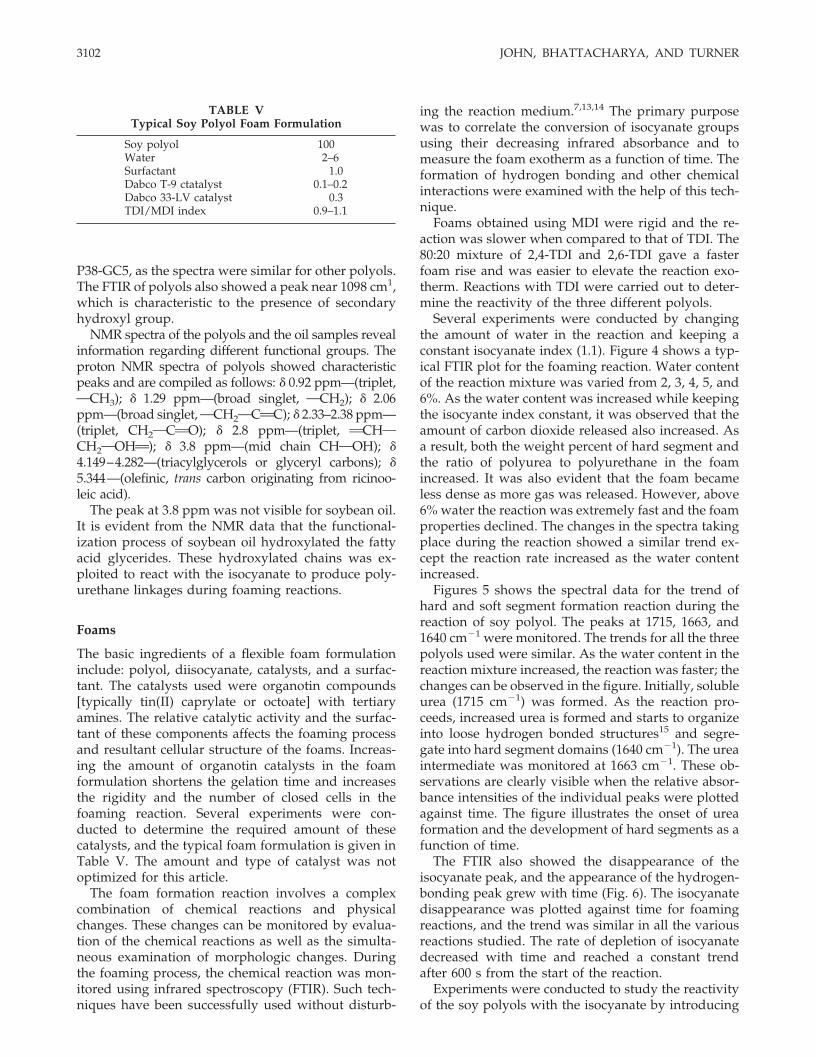
P38-GC5, as the spectra were similar for other polyols.The FTIR of polyols also showed a peak near 1098 cm1,which is characteristic to the presence of secondaryhydroxyl group.
NMR spectra of the polyols and the oil samples revealinformation regarding different functional groups. Theproton NMR spectra of polyols showed characteristicpeaks and are compiled as follows: � 0.92 ppm—(triplet,OCH3); � 1.29 ppm—(broad singlet, OCH2); � 2.06ppm—(broad singlet,OCH2OCAC); � 2.33–2.38 ppm—(triplet, CH2OCAO); � 2.8 ppm—(triplet, ACHOCH2OOHA); � 3.8 ppm—(mid chain CHOOH); �4.149–4.282—(triacylglycerols or glyceryl carbons); �5.344—(olefinic, trans carbon originating from ricinoo-leic acid).
The peak at 3.8 ppm was not visible for soybean oil.It is evident from the NMR data that the functional-ization process of soybean oil hydroxylated the fattyacid glycerides. These hydroxylated chains was ex-ploited to react with the isocyanate to produce poly-urethane linkages during foaming reactions.
Foams
The basic ingredients of a flexible foam formulationinclude: polyol, diisocyanate, catalysts, and a surfac-tant. The catalysts used were organotin compounds[typically tin(II) caprylate or octoate] with tertiaryamines. The relative catalytic activity and the surfac-tant of these components affects the foaming processand resultant cellular structure of the foams. Increas-ing the amount of organotin catalysts in the foamformulation shortens the gelation time and increasesthe rigidity and the number of closed cells in thefoaming reaction. Several experiments were con-ducted to determine the required amount of thesecatalysts, and the typical foam formulation is given inTable V. The amount and type of catalyst was notoptimized for this article.
The foam formation reaction involves a complexcombination of chemical reactions and physicalchanges. These changes can be monitored by evalua-tion of the chemical reactions as well as the simulta-neous examination of morphologic changes. Duringthe foaming process, the chemical reaction was mon-itored using infrared spectroscopy (FTIR). Such tech-niques have been successfully used without disturb-
ing the reaction medium.7,13,14 The primary purposewas to correlate the conversion of isocyanate groupsusing their decreasing infrared absorbance and tomeasure the foam exotherm as a function of time. Theformation of hydrogen bonding and other chemicalinteractions were examined with the help of this tech-nique.
Foams obtained using MDI were rigid and the re-action was slower when compared to that of TDI. The80:20 mixture of 2,4-TDI and 2,6-TDI gave a fasterfoam rise and was easier to elevate the reaction exo-therm. Reactions with TDI were carried out to deter-mine the reactivity of the three different polyols.
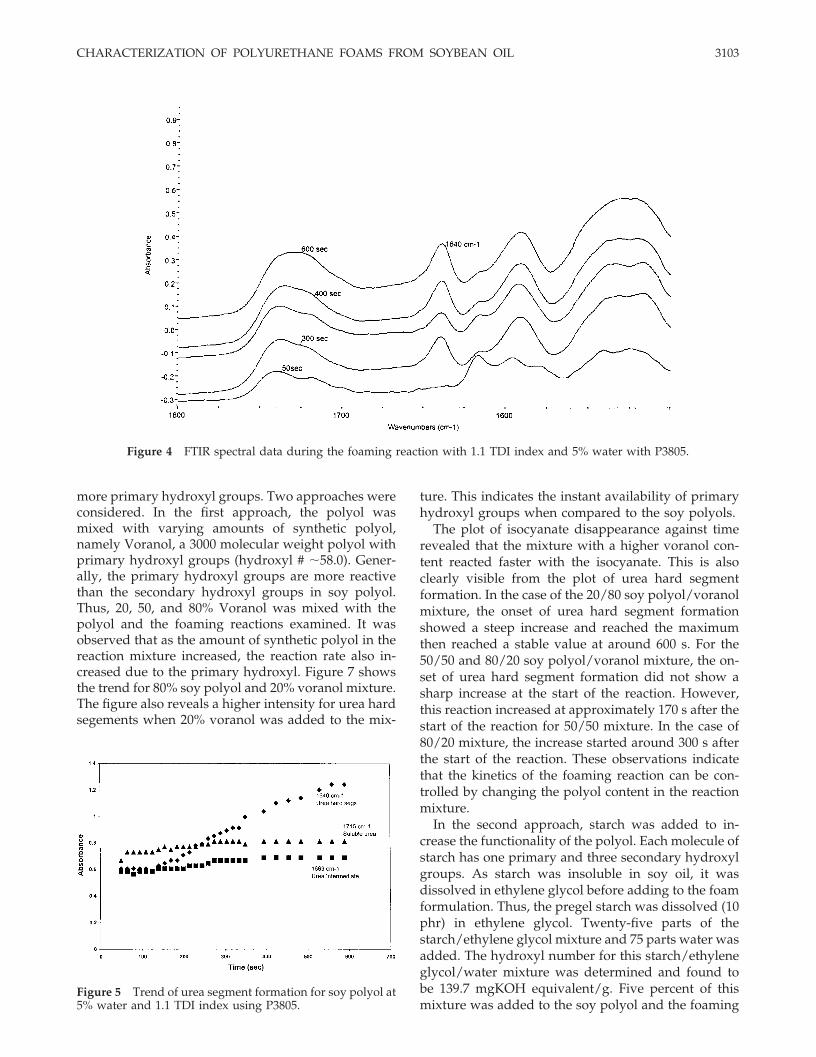
Several experiments were conducted by changingthe amount of water in the reaction and keeping aconstant isocyanate index (1.1). Figure 4 shows a typ-ical FTIR plot for the foaming reaction. Water contentof the reaction mixture was varied from 2, 3, 4, 5, and6%. As the water content was increased while keepingthe isocyante index constant, it was observed that theamount of carbon dioxide released also increased. Asa result, both the weight percent of hard segment andthe ratio of polyurea to polyurethane in the foamincreased. It was also evident that the foam becameless dense as more gas was released. However, above6% water the reaction was extremely fast and the foamproperties declined. The changes in the spectra takingplace during the reaction showed a similar trend ex-cept the reaction rate increased as the water contentincreased.
Figures 5 shows the spectral data for the trend ofhard and soft segment formation reaction during thereaction of soy polyol. The peaks at 1715, 1663, and1640 cm�1 were monitored. The trends for all the threepolyols used were similar. As the water content in thereaction mixture increased, the reaction was faster; thechanges can be observed in the figure. Initially, solubleurea (1715 cm�1) was formed. As the reaction pro-ceeds, increased urea is formed and starts to organizeinto loose hydrogen bonded structures15 and segre-gate into hard segment domains (1640 cm�1). The ureaintermediate was monitored at 1663 cm�1. These ob-servations are clearly visible when the relative absor-bance intensities of the individual peaks were plottedagainst time. The figure illustrates the onset of ureaformation and the development of hard segments as afunction of time.
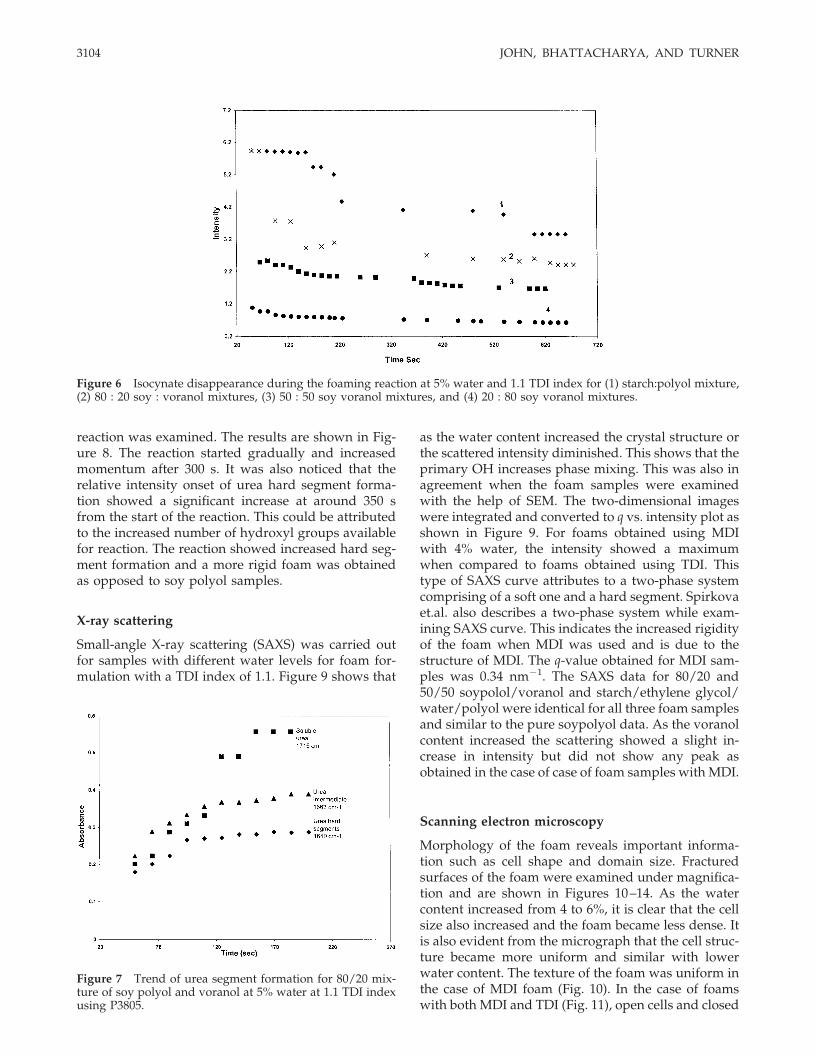
The FTIR also showed the disappearance of theisocyanate peak, and the appearance of the hydrogen-bonding peak grew with time (Fig. 6). The isocyanatedisappearance was plotted against time for foamingreactions, and the trend was similar in all the variousreactions studied. The rate of depletion of isocyanatedecreased with time and reached a constant trendafter 600 s from the start of the reaction.
Experiments were conducted to study the reactivityof the soy polyols with the isocyanate by introducing
TABLE VTypical Soy Polyol Foam Formulation
Soy polyol 100Water 2–6Surfactant 1.0Dabco T-9 ctatalyst 0.1–0.2Dabco 33-LV catalyst 0.3TDI/MDI index 0.9–1.1
3102 JOHN, BHATTACHARYA, AND TURNER
more primary hydroxyl groups. Two approaches wereconsidered. In the first approach, the polyol wasmixed with varying amounts of synthetic polyol,namely Voranol, a 3000 molecular weight polyol withprimary hydroxyl groups (hydroxyl # �58.0). Gener-ally, the primary hydroxyl groups are more reactivethan the secondary hydroxyl groups in soy polyol.Thus, 20, 50, and 80% Voranol was mixed with thepolyol and the foaming reactions examined. It wasobserved that as the amount of synthetic polyol in thereaction mixture increased, the reaction rate also in-creased due to the primary hydroxyl. Figure 7 showsthe trend for 80% soy polyol and 20% voranol mixture.The figure also reveals a higher intensity for urea hardsegements when 20% voranol was added to the mix-
ture. This indicates the instant availability of primaryhydroxyl groups when compared to the soy polyols.
The plot of isocyanate disappearance against timerevealed that the mixture with a higher voranol con-tent reacted faster with the isocyanate. This is alsoclearly visible from the plot of urea hard segmentformation. In the case of the 20/80 soy polyol/voranolmixture, the onset of urea hard segment formationshowed a steep increase and reached the maximumthen reached a stable value at around 600 s. For the50/50 and 80/20 soy polyol/voranol mixture, the on-set of urea hard segment formation did not show asharp increase at the start of the reaction. However,this reaction increased at approximately 170 s after thestart of the reaction for 50/50 mixture. In the case of80/20 mixture, the increase started around 300 s afterthe start of the reaction. These observations indicatethat the kinetics of the foaming reaction can be con-trolled by changing the polyol content in the reactionmixture.
In the second approach, starch was added to in-crease the functionality of the polyol. Each molecule ofstarch has one primary and three secondary hydroxylgroups. As starch was insoluble in soy oil, it wasdissolved in ethylene glycol before adding to the foamformulation. Thus, the pregel starch was dissolved (10phr) in ethylene glycol. Twenty-five parts of thestarch/ethylene glycol mixture and 75 parts water wasadded. The hydroxyl number for this starch/ethyleneglycol/water mixture was determined and found tobe 139.7 mgKOH equivalent/g. Five percent of thismixture was added to the soy polyol and the foaming
Figure 4 FTIR spectral data during the foaming reaction with 1.1 TDI index and 5% water with P3805.
Figure 5 Trend of urea segment formation for soy polyol at5% water and 1.1 TDI index using P3805.
CHARACTERIZATION OF POLYURETHANE FOAMS FROM SOYBEAN OIL 3103
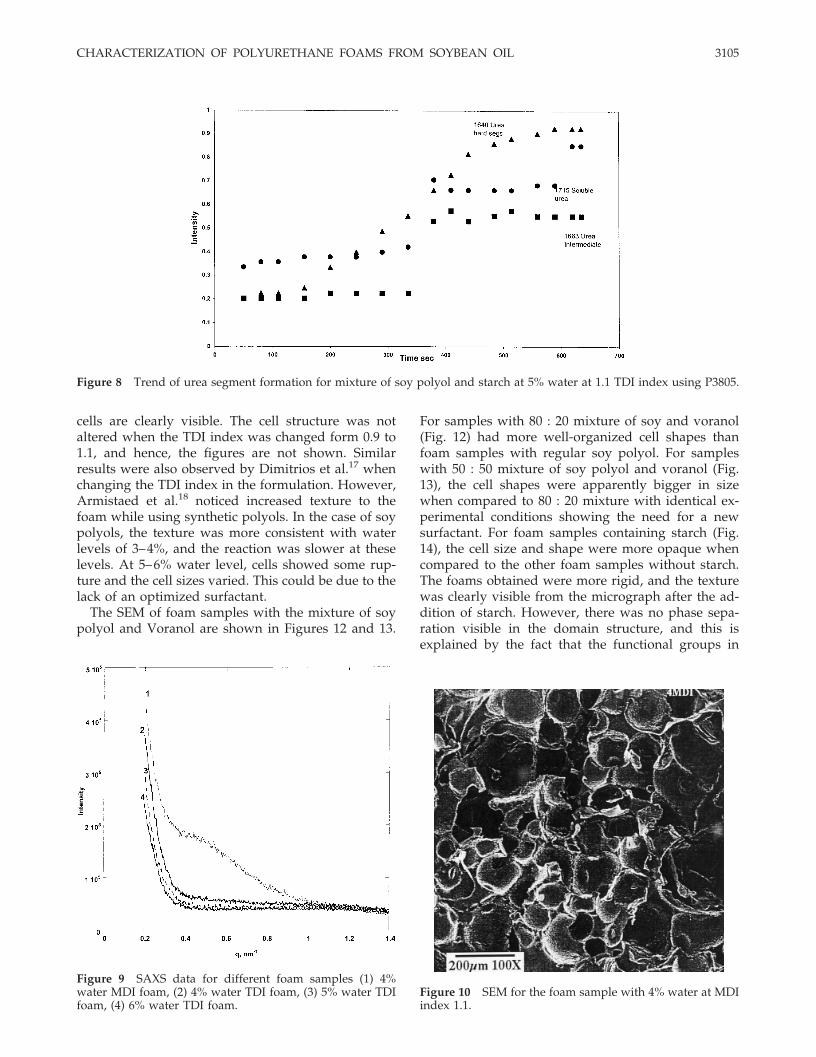
reaction was examined. The results are shown in Fig-ure 8. The reaction started gradually and increasedmomentum after 300 s. It was also noticed that therelative intensity onset of urea hard segment forma-tion showed a significant increase at around 350 sfrom the start of the reaction. This could be attributedto the increased number of hydroxyl groups availablefor reaction. The reaction showed increased hard seg-ment formation and a more rigid foam was obtainedas opposed to soy polyol samples.
X-ray scattering
Small-angle X-ray scattering (SAXS) was carried outfor samples with different water levels for foam for-mulation with a TDI index of 1.1. Figure 9 shows that
as the water content increased the crystal structure orthe scattered intensity diminished. This shows that theprimary OH increases phase mixing. This was also inagreement when the foam samples were examinedwith the help of SEM. The two-dimensional imageswere integrated and converted to q vs. intensity plot asshown in Figure 9. For foams obtained using MDIwith 4% water, the intensity showed a maximumwhen compared to foams obtained using TDI. Thistype of SAXS curve attributes to a two-phase systemcomprising of a soft one and a hard segment. Spirkovaet.al. also describes a two-phase system while exam-ining SAXS curve. This indicates the increased rigidityof the foam when MDI was used and is due to thestructure of MDI. The q-value obtained for MDI sam-ples was 0.34 nm�1. The SAXS data for 80/20 and50/50 soypolol/voranol and starch/ethylene glycol/water/polyol were identical for all three foam samplesand similar to the pure soypolyol data. As the voranolcontent increased the scattering showed a slight in-crease in intensity but did not show any peak asobtained in the case of case of foam samples with MDI.
Scanning electron microscopy
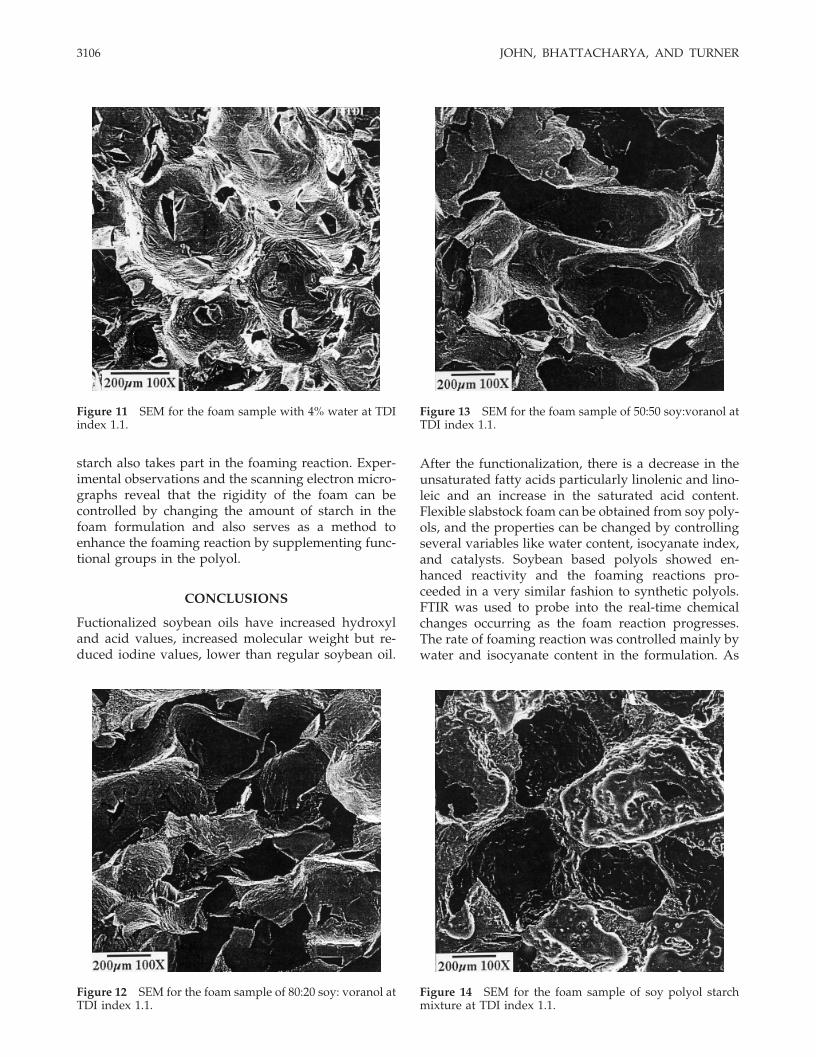
Morphology of the foam reveals important informa-tion such as cell shape and domain size. Fracturedsurfaces of the foam were examined under magnifica-tion and are shown in Figures 10–14. As the watercontent increased from 4 to 6%, it is clear that the cellsize also increased and the foam became less dense. Itis also evident from the micrograph that the cell struc-ture became more uniform and similar with lowerwater content. The texture of the foam was uniform inthe case of MDI foam (Fig. 10). In the case of foamswith both MDI and TDI (Fig. 11), open cells and closed
Figure 7 Trend of urea segment formation for 80/20 mix-ture of soy polyol and voranol at 5% water at 1.1 TDI indexusing P3805.
Figure 6 Isocynate disappearance during the foaming reaction at 5% water and 1.1 TDI index for (1) starch:polyol mixture,(2) 80 : 20 soy : voranol mixtures, (3) 50 : 50 soy voranol mixtures, and (4) 20 : 80 soy voranol mixtures.
3104 JOHN, BHATTACHARYA, AND TURNER
cells are clearly visible. The cell structure was notaltered when the TDI index was changed form 0.9 to1.1, and hence, the figures are not shown. Similarresults were also observed by Dimitrios et al.17 whenchanging the TDI index in the formulation. However,Armistaed et al.18 noticed increased texture to thefoam while using synthetic polyols. In the case of soypolyols, the texture was more consistent with waterlevels of 3–4%, and the reaction was slower at theselevels. At 5–6% water level, cells showed some rup-ture and the cell sizes varied. This could be due to thelack of an optimized surfactant.
The SEM of foam samples with the mixture of soypolyol and Voranol are shown in Figures 12 and 13.
For samples with 80 : 20 mixture of soy and voranol(Fig. 12) had more well-organized cell shapes thanfoam samples with regular soy polyol. For sampleswith 50 : 50 mixture of soy polyol and voranol (Fig.13), the cell shapes were apparently bigger in sizewhen compared to 80 : 20 mixture with identical ex-perimental conditions showing the need for a newsurfactant. For foam samples containing starch (Fig.14), the cell size and shape were more opaque whencompared to the other foam samples without starch.The foams obtained were more rigid, and the texturewas clearly visible from the micrograph after the ad-dition of starch. However, there was no phase sepa-ration visible in the domain structure, and this isexplained by the fact that the functional groups in
Figure 8 Trend of urea segment formation for mixture of soy polyol and starch at 5% water at 1.1 TDI index using P3805.
Figure 9 SAXS data for different foam samples (1) 4%water MDI foam, (2) 4% water TDI foam, (3) 5% water TDIfoam, (4) 6% water TDI foam.
Figure 10 SEM for the foam sample with 4% water at MDIindex 1.1.
CHARACTERIZATION OF POLYURETHANE FOAMS FROM SOYBEAN OIL 3105
starch also takes part in the foaming reaction. Exper-imental observations and the scanning electron micro-graphs reveal that the rigidity of the foam can becontrolled by changing the amount of starch in thefoam formulation and also serves as a method toenhance the foaming reaction by supplementing func-tional groups in the polyol.
CONCLUSIONS
Fuctionalized soybean oils have increased hydroxyland acid values, increased molecular weight but re-duced iodine values, lower than regular soybean oil.
After the functionalization, there is a decrease in theunsaturated fatty acids particularly linolenic and lino-leic and an increase in the saturated acid content.Flexible slabstock foam can be obtained from soy poly-ols, and the properties can be changed by controllingseveral variables like water content, isocyanate index,and catalysts. Soybean based polyols showed en-hanced reactivity and the foaming reactions pro-ceeded in a very similar fashion to synthetic polyols.FTIR was used to probe into the real-time chemicalchanges occurring as the foam reaction progresses.The rate of foaming reaction was controlled mainly bywater and isocyanate content in the formulation. As
Figure 11 SEM for the foam sample with 4% water at TDIindex 1.1.
Figure 12 SEM for the foam sample of 80:20 soy: voranol atTDI index 1.1.
Figure 13 SEM for the foam sample of 50:50 soy:voranol atTDI index 1.1.
Figure 14 SEM for the foam sample of soy polyol starchmixture at TDI index 1.1.
3106 JOHN, BHATTACHARYA, AND TURNER

the water content increased, the amount of the hardsegment and urea formation increased. Both MDI andTDI can be used with soy polyol to produce foam withvarying physical properties, depending on the enduse. Foams with MDI were more rigid than foamswith TDI. The addition of synthetic polyol with pri-mary hydroxyl group increased the rate of reactionand phase mixing in the foam.
Increased water content also increased the cell size.This work shows that vegetable oils can be success-fully used in place of synthetic polyols, thereby add-ing value to agricultural resources.
References
1. Erickon, D. R.; Pryde, E. H.; Brekke, O. L.; Mounts, T. L.; Falb,R. A. Eds. Handbook of Soy Oil Processing and Utilization;AOCS: St. Louis, 1980.
2. Petrovic, Z. R.; Guo, A.; Zhang, W. J Polym Sci A Polym Chem2000, 38, 4062.
3. Husbands, M. J.; Standen, C. J. S.; Hayward, G. A Manual ofResins for Surface Coatings; Oldring, P.; Hayward, G., Eds.;McGraw–Hill: London, 1987, vol. III..
4. Misra, J. P.; Sivasamban, M. A. Paint Manuf 1971, 41, 30.5. Robinson, E. B.; Waters, R. B. J Oil Colour Chem Assoc 1951, 34,
361.6. Toone, G. C.; Wooster, C. S. Off. Dig Fed Paint Varnish Prod
Clubs 1960, 32, 230.7. Artavia, L. D. Ph.D. Thesis, University of Minnesota (1991).8. Evans, C. D.; List, G. R.; Beal, R. E.; Black, L.T. J Am Oil Chem
Soc 1974, 51, 444.9. Guo, A.; Cho, Y.; Petrovic, Z. S. J Polym Sci A Polym Chem 2000,
38, 3900.10. Neff, W. E.; Mounts, T. L.; Rinsch, W. M.; Konishi, H.; El-
Agaimy, M. A. JAOCS 1994, 71, 1101.11. Duh, P.-D.; Yen, W. J.; Yen, G.-C. JAOCS 1999, 76, 201.12. Crapiste, G. H.; Brevedan, M. I. V.; Carelli, A. A. JAOCS 1999,
76, 1437.13. Rowton, R. L. J Cell Plastics 1980, 16, 287.14. Christenson, C. P.; Harthcock, M. A.; Meadows, M. D.; Spell,
H. L.; Howard, W. L.; Creswick, M. W.; Guerra, R.; Turner, R. B.J Polym Sci Part B Polym Phys 1986, 24, 1401.
15. Priester, R. D.; McClusky, J. V.; O’Neill, R. E.; Turner, R. B.;Harthcock, M. A.; Davis, B. L. J Cell Plastics 1990, 26, 346.
16. Spirkova, M.; Matejka, L.; Hlavata, D.; Meissner, B.; Pytela, J. JAppl Polym Sci 2000, 77, 381.
17. Dounis, D. V.; Wilkes, G. L. J Appl Polym Sci 1997, 66, 2395.18. Armistead, J. P.; Wilkes, G. L.; Turner, R. B. J Appl Polym Sci
1988, 35, 601.
CHARACTERIZATION OF POLYURETHANE FOAMS FROM SOYBEAN OIL 3107