polypropylene analysis from chips to fibre
TRANSCRIPT
Polypropylene Analysis from Chips to Fibre
Mohammad Ali,Lecturer (Tech), College of Textile Technology, Tejgaon, Dhaka-1208
AbstractPolypropylene was first produced in Italy in 1957. US production began in 1962. Polypropylene is made from a raw material, propylene, which is a by product from the cracking process in the petroleum industry [1]. Polypropylene fibres are very regular rod shaped, smoothed surfaced fibres with round cross sections. The proportion of crystalline area is usually 50-65%.Thermal behavior of the polypropylene is not affected by drawing. An increase in drawing causes the decrease in diameter of the fibre. Increase in draw ratio will decrease in linear density of the fibre. The tenacity of fibre is increasing with the increase in draw ratio due to better orientation of the molecular chain. But in the case of 6:1 the tenacity has been decreased due to breakage of the molecular chain. Hence 5/1 is the optimum draw ratio for the polypropylene fibres.
Keywords: Polypropylene,Tenacity, Thermal behaviour, Draw ratio, Tensile Properties
1. INTRODUCTION Propylene is a hydrocarbon with three carbons atoms. When it polymerizes in a step-chain reaction, it forms a polymer in which methyl groups (-CH3) extend from the polymer backbone. Giulio Natta is credited with the discovery of stereo specific polymerisation (the positioning of the monomers in space to add to a growing polymer). Simultaneously Karl Ziegler worked with catalyst to obtain high molecular weight, crystalline polypropylene polymers. These two discoveries permitted the polymerisation of isotactic polypropylene that could be formed into a textile fibre.
Three different polypropylene polymers- isotactic, syndiotactic and atactic- are formed. These polymers differ in the position of the methyl groups in three dimensional space. Only the isotactic polypropylene is useful to form textile fibres, because its allows the polymers to pack closely enough for crystallisation to occur.
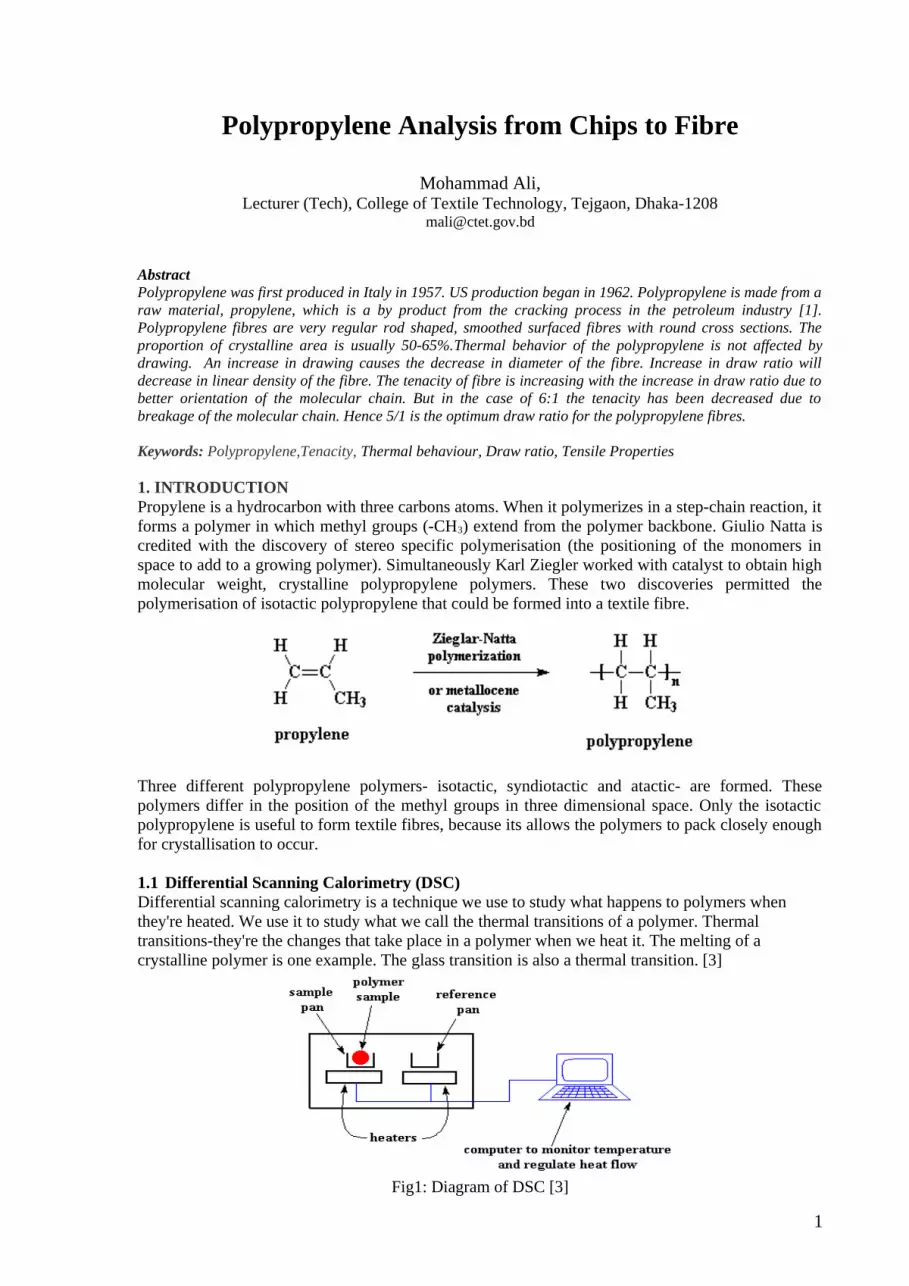
1.1 Differential Scanning Calorimetry (DSC) Differential scanning calorimetry is a technique we use to study what happens to polymers when they're heated. We use it to study what we call the thermal transitions of a polymer. Thermal transitions-they're the changes that take place in a polymer when we heat it. The melting of a crystalline polymer is one example. The glass transition is also a thermal transition. [3]
Fig1: Diagram of DSC [3]
1

1.2 Rheometer
Fig 5 : Diagram of Rheometer [6]Thermostatically controlled capillary rheometer of general design as shown in figure no.5. The thermoplastic material is contained in a vertical metal cylinder and extruded through a die by the application of a constant force under controlled temperature conditions. All surfaces of the apparatus in contact with the material under test shall have a high polish.
1.3 Statimat Tensile Tester After production of polypropylene fibres in the laboratory melt extruder with different ratio, tensile strength testing was carried out to observe the effect of draw ratio on the tensile characteristics of the polypropylene fibre. Statimat M tensile tester was used to carry out the test.
The STATIMAT M is an automatic tensile tester manufactured by Textechno GmbH, Germany. The machine is PC Operated and pneumatic. It has two jaws, the upper clamp is fixed and the lower clamp is movable. All testing parameters were adjusted in the PC at the beginning of the test and the fibre was clamped by the upper clamp and followed by the lower clamp.[9]
The parameters used in the STATIMAT M are below:
2

Gauge Length: 100mmLoad cell 10 (N) load 0.5 cN/tex
Test speed 200-400m/min
Fig7: Statimat M
2. PRODUCTION OF POLYPROPELENE FIBREAll manmade fibres are produced from polymers. These substances are solids at normal temperature. The polymers which are the starting products for Manmade fibres may well be in the form of chips, small particles of perhaps one to two millimetres in diameter and two to three millimetres in length. In order to make filaments form these polymers, their physical shape must be altered and the polymer chips must be converted to a liquid form. This is necessary as the polymer needs to be forced or extruded through fine holes to form filaments. The process of producing a manmade fibre is often termed extrusion. There are three methods of extrusion fibres, melt extrusion, dry extrusion and wet extrusion. The methods used for each fibre depends upon the ease of conversion of the polymer from solid to liquid state. Melt extrusion is used for the production of polypropylene fibres. [7]
2.1 Laboratory Melt extruderFor the production of polypropylene fibres Laboratory Melt extruder is used. The polypropylene chips are fed from the hopper into a melter heated to the correct extrusion temperature. The granules were advanced along the barrel-1, barrel-2,barrel-3, and adapter by an extrusion single screw and finally reached to the die. The polymer was extruded through circular holes of the die to form fibres.After extrusion the fibre was taken around two Top and Bottom rollers. It then passed trough a heated chamber to two draw rollers, one is slow roll and another is Fast roll. To orientate the fibres chains the fibres are drawn to form crystallisation. Finally the fibres are wound on to a package.
Figure. 6: Schematic diagram of melt spinning process
extruded the polypropylene fibres with different draw ratios such as 2/1,4/1,5/1,6/1.The purpose of drawing fibres with different draw ratios is to observe the difference in thermal behaviour mechanical and physical properties of Un drawn polypropylene and drawn polypropylene fibres.
2.2 Processing Parameters of the extruder The processing parameters used in Laboratory melt extruder for the production of polypropylene fibres were below:Chips type Novollen 1101RTemperature(0C)
Barrel-1 Barrel-2 Barrel-3 Adapter Die190 200 200 222 220
Top roll-1 Top roll-2 Bottom roll-1 Bottom roll-2 Relax heater
3
34 70 40 60 25
SpeedExtruder dive Slow roll Fast roll (Draw ratio)
10 rpm 4 m/min 8m/min (2:1) 16m/min (4:1)
20m/min (5:1)
24m/min (6:1)
Pressure 13-24 PSIType of the Spinneret 40 holes, 0.3 mm
3 TEST RESULTS & DISCUSSION
MFI is inversely proportional to viscosity ie, MFI
The rheology or fluidity of given polymer in molten form is influenced by the state of its molecular weight distribution, temperature and pressure. High molecular weight polymers are generally more viscose and more resistant to movement than low molecular weight polymers when all other parameters are keep constant. MFI is very important to check the variation from lot to lot supplied by the manufacturer.
Sample No. Mass of Individual cut off
Average mass of
cut off in gm.
MFI
1 0.47 0.44 0.43 0.45 26.802 0.53 0.59 0.59 0.57 34.203 0.58 0.55 0.5 0.54 32.604 0.49 0.5 0.52 0.50 30.205 0.67 0.45 0.7 0.61 36.40
Average MFI of polypropylene chips = 32.04
Each drawn sample was tested there times by the Statimat M and obtained a printed test result. The table contains summarized mean value of the tested result.
Draw ratio
Count
(tex)
Force
(cN)
Elongation
%
Tenacity
(cN/tex)
Breaking time
(sec)
Work of rupture
( cN*cm)2/1 16.00 108.60 351.01 6.79 52.38 2400.694/1 7.10 126.75 152.51 17.85 30.16 1411.375/1 4.50 151.24 124.33 33.61 37.21 1411.126/1 7.30 199.54 81.56 27.33 12.26 1320.95
4
Draw ratio Vs Fibre Count
0.00
5.00
10.00
15.00
20.00
2/1 4/1 5/1 6/1
Draw ratio
Yarn
cou
nt(t
ex)
Count (tex)
Linear (Count (tex))
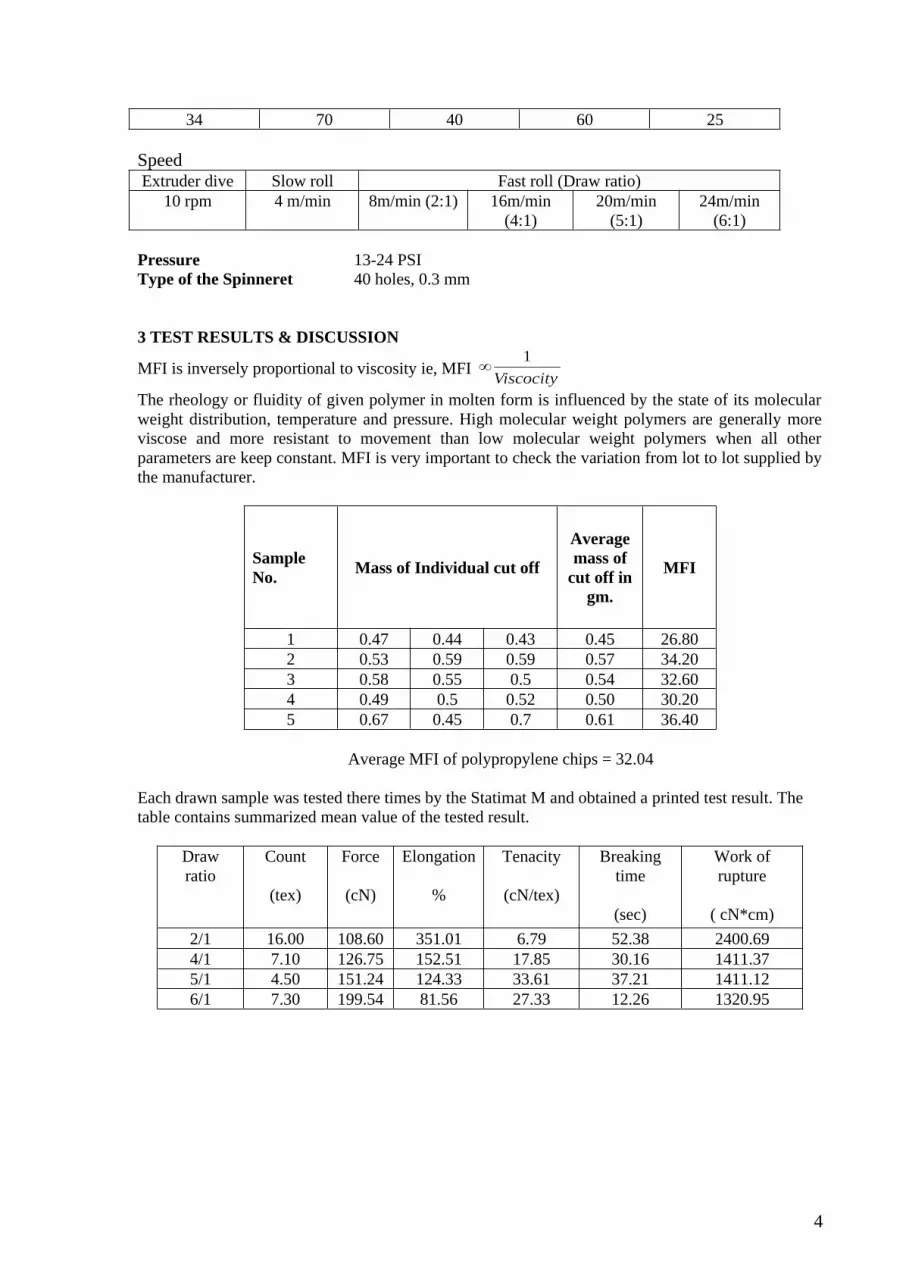
The above chart showing that increase in draw ratio will decrease in linear density of the fibre.Draw ratio Vs Tenacity (cN/tex)
0.00
10.00
20.00
30.00
40.00
2/1 4/1 5/1 6/1
Draw ratio
Tena
city
(cN
/tex)
Tenacity (cN/tex)
Linear (Tenacity (cN/tex))
The chart shows that the tenacity of fibre is increasing with the increase in draw ratio due to better orientation of the molecular chain. But in the case of 6:1 the tenacity has been decreased due to breakage of the molecular chain. Hence 5/1 is the optimum draw ratio for the polypropylene fibres.
Draw ratio Vs Elongation%
0.00
100.00
200.00
300.00
400.00
2/1 4/1 5/1 6/1
Draw ratio
Elon
gatio
n%
Elongation%
Linear (Elongation%)
The chart tells that lower draw ratio provides higher elongation property of the polypropylene fibre ie less drawn fibre is more elastic as compare to highly drawn one.
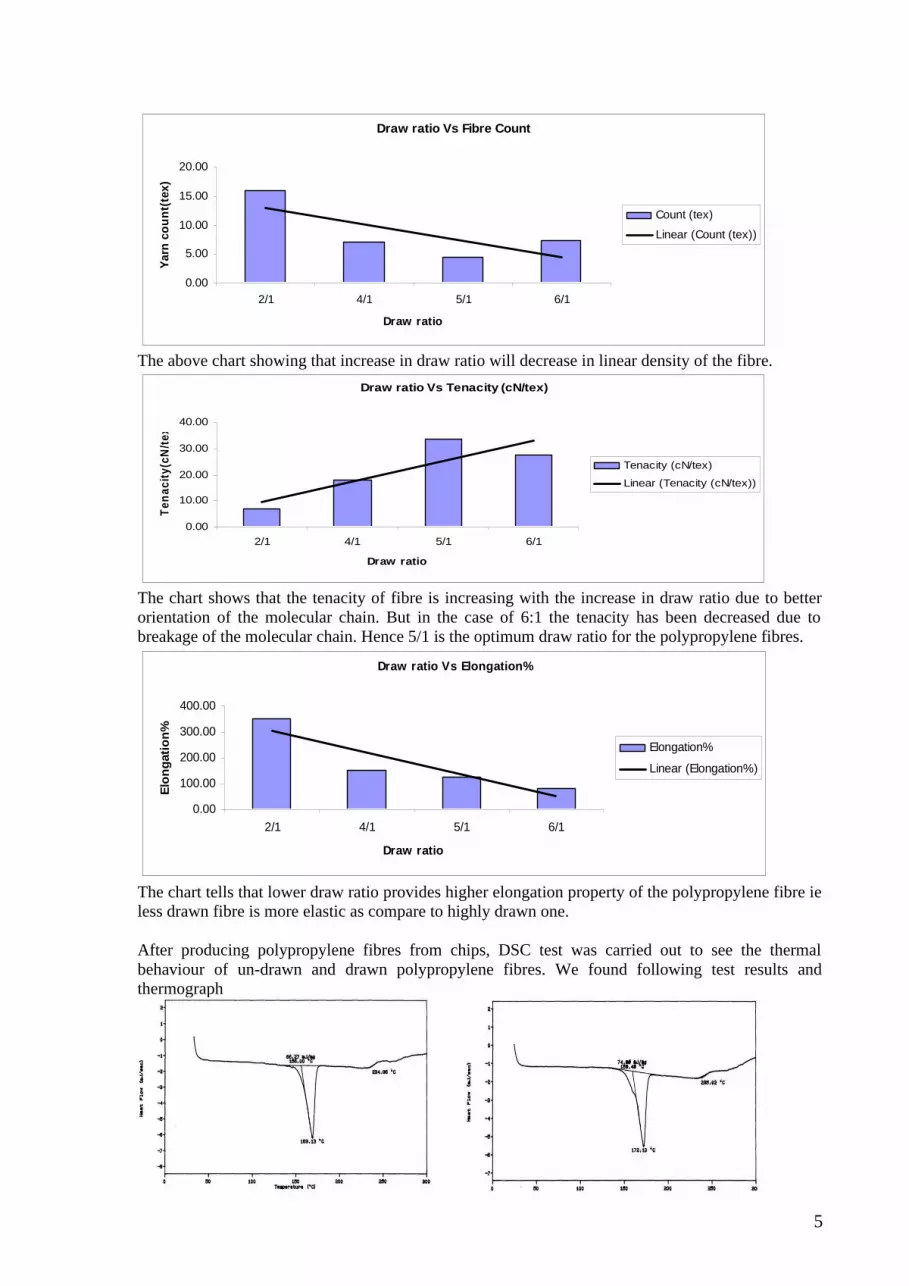
After producing polypropylene fibres from chips, DSC test was carried out to see the thermal behaviour of un-drawn and drawn polypropylene fibres. We found following test results and thermograph
5

Fig 3 DSC Thermograph of un-drawn pp fibre Fig 4 DSC Thermograph of 6:1 drawn pp fibre
Name of thePolymer Chips
Glass TransitionTemperature
(°C)
crystallizationTemperature (°C)
Melting Temperature
(°C)
Average heat flow of melting Zone
(mj/mg)Polypropylene
Un-drawn - 234.96 169.13 66.27
PolypropyleneDrawn(6:1) - 235.02 172.10 74.96
The above results show that the thermal behaviour of polypropylene un-drawn and drawn fibre is very similar with respect to polypropylene chips (The melting point of the polypropylene chips was found 177.090C in our earlier DSC test. We can conclude that that the thermal behaviour of the polypropylene is not affected by drawing.
Using Bench microscope we observed the fibre diameter and cross sectional view of the polypropylene fibres which we produced to see the effect of drawing or diameter changes of the polypropylene fibres due to drawing. We took the fibres in the microscope slides and use drop of paraffin liquid and then mount the slides on the bench of the microscope using a 100 times magnification. We measure the diameter of the un-drawn and drawn fibres with different draw ratio and found the following results
PP fibres Readings(mm)
Averagereadings
(mm)
Averagediameter
(mm)
% of diameter changes with respect to
un-drawn
Un-drawn 54 32 32 39.33 0.393Drawn 2:1 13 17 16 15.33 0.153 61.02%Drawn 4:1 9 9 10 9.33 0.093 76.27%Drawn 5:1 8 8 8 8.00 0.080 79.66%Drawn 6:1 7 9 7 7.67 0.077 80.51%
Average diamter (mm)
0.0000.0500.1000.1500.2000.2500.3000.3500.4000.450
Un-drawn Drawn 2:1 Drawn 4:1 Drawn 5:1 Drawn 6:1
Diam
eter
(mm
)
Average diamter (mm)
The above chart is telling us the effect of drawing on fibre diameter. An increase in drawing causes the decrease in diameter of the fibre. Polypropylene fibre was mounted in liquid paraffin with its axis parallel to the axis of the slide. Using a magnification of 100x focus the fibre image. After selecting the polarizing analyzer, polarizing filter was placed over the light source and was rotated it until extinction was produced. Red background produced by selecting red interference analyzer and we took the interference colours of the images of polypropylene fibres with different draw ratio.
4. CONCLUSION
6

An increase in draw ratio will decrease in linear density of the fibre. Thermal behaviour of the polypropylene is not affected by drawing. An increase in drawing causes the decrease in diameter of the fibre. In the image of un-drawn fibre we found almost same colour along the axis of the fibre and are not prominent because molecules are in the same way that is are not orientedIn the 6:1 drawn fibre image we found several layers of colour along the fibre axis due to changes of molecular arrangement. In the image we found a wide green colour layer due molecular orientation.
References[1] Kathryn L. Hatch, Textile Science, (1993), West publishing company, Saint Paul New York,[2] http://www.filamentfiber.com/poly.html[3] http://www.pslc.ws/macrog/dsc.htm[4] http://las.perkinelmer.com/content/ApplicationNotes/TA%20PETech-40.PDF[5] http://www.polydynamics.com/glossary2.htm#D][6] British Standard BS2782: Part 7: Method 720A:1979[7] Macmillan “Textiles.” .A Wynne 1997., Oxford[8] B P Saville ,”Physical testing of textiles” , woodhead publishing ltd. Uk 1999[9] www.textechno.de
7