sweet potato chips development and optimization of chips
TRANSCRIPT
Open Agriculture. 2019; 4: 118–128
1 IntroductionSweet potatoes are nutritionally rich crops and are a superior source of many food products which have the potential to prevent many diseases (Suda et al. 2003). Sweet potatoes are starchy sweet taste root vegetables which are adaptable to grow in diverse environmental conditions (Ravindran et al. 1995). They are rich in carbohydrates, vitamin A and have a high energy content. Sweet potatoes are mostly orange in color and this orange flesh provides vitamins A and C (Bengtsson et al. 2010). Some varieties of sweet potatoes have anti-carcinogenic properties and are also known to be one of the crops which assures food security, health promotion and disease prevention (Teow et al. 2007). Healthy and nutritious snack products can be produced from sweet potatoes using a simple deep-fat frying process.
Deep-fat fried vegetables and fruit chips (containing 35-45% oil content) are covering a wide range in the food market across the World due to their convenience and availability (Maity et al. 2012; Pedreschi and Moyano 2005). However, consumers today are always seeking healthy snacks with low fat and attractive color, texture and taste because the excessive consumption of such high-oil fried products can cause obesity and other diseases such as cardiovascular disease (Akinpelu et al. 2014; Pedreschi and Moyano 2005). Much research has been conducted to reduce the fat content in deep-fat fried products by different approaches such as altering the frying temperature, modifying process conditions, the pretreatments like blanching, dipping in sugar solutions, using edible coatings, adding hydrocolloids and pre-drying (Bravo et al. 2011; Pedreschi and Moyano 2005). It was observed that pre-drying, baking and microwave treatment of the slices before deep-fat frying were helpful to significantly reduce the amount of oil content in the chips (Krokida et al. 2001). Pre-drying of the potato slices before frying improved the final product quality with low fat and it was observed that the pre-drying of French fries helped to absorb low fat content during frying and enhanced color and texture of the chips (Tajner-Czopek
https://doi.org/10.1515/opag-2019-0011received June 29, 2018; accepted January 17, 2019
Abstract: Sweet potatoes are nutritionally rich and can be converted into chips using a simple frying technique. However, frying processing variables affect the quality of chips significantly and optimization of processing variables is necessary to produce the desired quality chips. The objective of this study was to optimize the pre-drying time and the frying conditions (time and temperature) to obtain quality sweet potato chips with low fat. RSM with CCRD was used to develop regression and response surface models to observe the effect of pre-drying time and frying variables and optimize the frying conditions for the desired physicochemical properties of chips as response variables. The regression and response surface modeling indicated that the pre-drying time, frying temperature and frying time had a linear effect on moisture content, water activity, oil content and total color difference and a quadratic effect on L value, hardness and crispness of the sweet potato chips. The numerical and graphical optimization indicated that the quality of the chips was improved in the range of pre-drying (25-30 min), frying temperature (155-160°C) and frying time (5-6 min). The findings of this research will be helpful for a commercial setting of processing variables for sweet potato chips development within the experimental range.
Keywords: Sweet potato chips, process optimization, RSM, CCRD
Research ArticlePratiksha Timalsina, Reena Prajapati, Sabina Bhaktaraj, Razina Shrestha, Susmita Shrestha, Pranabendu Mitra*
Sweet Potato Chips Development and Optimization of Chips Processing Variables
*Corresponding author: Pranabendu Mitra, Department of Food and Nutrition, University of Wisconsin-Stout, 415 10th Avenue E., Menomonie, WI, 54751, USA, E-mail: [email protected] Timalsina, Reena Prajapati, Sabina Bhaktaraj, Razina Shrestha, Susmita Shrestha, Department of Food and Nutrition, University of Wisconsin-Stout, 415 10th Avenue E., Menomonie, WI, 54751, USA
Open Access. © 2019 Pratiksha Timalsina et al., published by De Gruyter. This work is licensed under the Creative Commons Attribution 4.0 Public License.
Sweet Potato Chips Development and Optimization of Chips Processing Variables 119
et al. 2008). But the determination of the optimum pre-drying conditions is necessary to produce low fat quality sweet potato chips. The deep-fat frying process of chips can be considered as a two-way diffusion process (Mitra et al. 2007). In this process, the food materials undergo physicochemical changes that affect their structure, texture (i.e. hardness and crispness), color, flavor, moisture content, oil content and the quality attributes of chips during frying can provide critical information to produce desired quality sweet potato chips (Taiwo and Baik 2007). A high-heat transfer rate from cooking oil to the slices during the frying process helps for rapid frying and develops flavor and desired sensorial properties of chips. The high frying temperature and high convective heat transfer coefficient of frying oil are vital factors to generate a high-heat transfer rate (Pedreschi and Moyano 2005). Frying temperature and frying time showed a significant effect on the color and texture of fried green banana chips (Mitra et al. 2007). The texture of chips (i.e. hardness and crispness) is an important factor for the desired quality of chips and the desired texture of chips depends on the optimum frying temperature and frying time because a very high temperature and long frying time cause surface darkening and may cause adverse reactions before complete frying. Also, the continuous use of oil at a high temperature deteriorates frying oil through oxidation, hydrolysis and polymerization which can lead to poor quality chips with off-flavor (Akinpelu et al. 2014). It is a challenge to set optimum frying conditions such as frying temperature, frying time and pre-drying time to produce organoleptically acceptable quality attributed nutritious sweet potato chips.
Response Surface Methodology (RSM) combining with Central Composite Rotatable Design (CCRD) is a commonly used method to determine the optimum processing independent variables on dependent or response variables (Akinpelu et al. 2014; Esan et al. 2015). This optimization process combines mathematics and statistics to determine a relationship between independent variables and response variables for arriving at an optimum processing condition. The RSM with the CCRD process determines the effects of processing variables on response variables and obtains the optimum processing conditions based on desired responses (Meda et al. 2016). The objective of this research was to optimize pre-drying time, frying temperature and frying time of sweet potato chips on the physicochemical properties (moisture content, oil content, water activity, hardness, crispness, L value and total color difference) of final sweet potato chip products.
2 Materials and Methods
2.1 Materials
Sweet potato tubers (Ipomoea batatas), grown in California (USA) and harvested between August and September, were purchased from a local Walmart. The canola oil and low-density polyethylene (LDPE) bags for initial packing of chips before analyzing the physicochemical properties of sweet potato chips were purchased from a local market (Menomonie, WI, USA). The sweet potatoes were washed, manually peeled with a hand peeler and cut into 2.5 mm thick slices using an electric slicing machine. Hexane was purchased from Sigma-Aldrich (USA).
2.2 Pre-treatments of the sweet potato slices
Blanching of the sweet potato slices was conducted as per the method described by Pedreschi and Moyano (2005). The slices were submerged into water at 85°C for 3.5 min and the blanched slices were washed with cold water immediately after each treatment. The excess water from the surface of the slices was removed by gently blotting with absorbent paper prior to pre-drying. The blanched sweet potato slices were then pre-dried using a conventional hot air-drying method to observe the effect of pre-drying on the oil content of fried sweet potato chips. The sweet potato slices were arranged on a tray in a single layer and then dried in a convection oven (Fisher Scientific Company, Ottawa, Canada) at 60°C. Different pre-drying times were set as per CCRD as shown in Table 1.
2.3 Sweet potato chips processing
The steps used to prepare the sweet potato chips are shown in Figure 1. The pre-dried sweet potato slices were deep-fried in canola oil with a slice to oil ratio of 1:10 (w/v) at varying frying temperatures and frying times as per CCRD as shown in Table 1. After frying, the fried sweet potato slices were removed from the oil and placed on a wire screen to drain the surface oil and cooled to room temperature. The sweet potato chips were then packed in low-density polyethylene (LDPE) bags to store for quality characterization.

120 Pratiksha Timalsina, et al.
Sweet Potatoes
Washing and peeling
Cut into slices of 2.5 mm thickness
Blanching (at 850C for 3.5 min)
Pre-drying at 600C as per CCRD shown in Table 1
Frying as per CCRD shown in Table 1
Packaging with LDPE before analysis
Quality characterization: Moisture content, water activity, oil content, color, hardness and crispness
M
Figure 1: A flow chart of processing of sweet potato chips
Regression modeling
Response surface modeling
Modeling and process optimization
Optimization: Numerical and graphical
Figure 1: A flow chart of processing of sweet potato chips
Table 1: Experimental design (CCRD) of sweet potato chips processing conditions and the experimental results of moisture content, water activity, oil content, L value, total color difference, hardness and crispness of different fried sweet potato chips
Frying conditions
Pre-Drying Time (min), DT
Frying Temp (°C), Ft
Frying Time (min), FT
Moisture Content (%)
Water Activity
Oil Content (%) L-value
Total Color Difference
Hardness(N)
Crispness
X1 X2 X3
1 20 (-1) 130 (-1) 3 (-1) 42.07±0.00 0.93±0.01 12.57±3.44 45.87±1.57 16.28±1.41 0.14±0.02 1±0.44
2 20 (-1) 160 (1) 3 (-1) 49.96±0.07 0.96±0.00 12.47±4.01 41.86±2.50 20.09±3.08 38.01±4.68 4±0.488
3 20 (-1) 130 (-1) 7 (1) 22.90±0.00 0.62±0.01 14.13±0.74 42.35±0.09 19.99±0.12 4.36±1.43 1±0.50
4 20 (-1) 160 (1) 7 (1) 13.97±0.12 0.24±0.01 24.32±0.88 23.08±2.35 51.51±2.56 12.35±0.61 10±1.21
5 40 (1) 130 (-1) 3 (-1) 15.77±0.02 0.56±0.01 26.95±0.28 48.10±0.76 14.69±0.54 27.76±0.90 5±0.89
6 40 (1) 160 (1) 3 (-1) 24.54±0.03 0.76±0.00 23.35±5.94 46.88±2.48 15.44±2.57 28.55±1.36 4±0.43
7 40 (1) 130 (-1) 7 (1) 16.09±0.00 0.37±0.01 19.77±2.37 44.58±1.57 16.83±1.51 56.89±3.68 5±0.62
8 40 (1) 160 (1) 7 (1) 17.24±0.02 0.38±0.02 28.35±2.69 44.78±4.15 18.09±3.64 48.89±1.76 4±1.07
9 30 (0) 145 (0) 5 (0) 12.67±0.03 0.34±0.03 16.75±1.21 49.68±4.13 15.87±2.43 45.67±2.21 10±1.16
10 30 (0) 145 (0) 5 (0) 10.35±0.02 0.40±0.14 23.95±3.66 35.35±5.41 32.39±6.34 53.45±1.76 10±0.40
11 30 (0) 145 (0) 5 (0) 12.10±0.01 0.34±0.02 17.60±2.03 38.63±9.53 24.88±9.92 50.99±3.46 10±1.09
12 30 (0) 145 (0) 5 (0) 12.35±0.01 0.30±0.01 21.25±2.48 42.93±4.42 21.39±4.61 40.55±2.09 10±1.18
13 30 (0) 145 (0) 5 (0) 10.89±0.02 0.24±0.01 16.75±0.89 42.56±5.43 21.72±5.27 53.89±1.23 9±0.40
14 30 (0) 145 (0) 5 (0) 12.32±0.02 0.31±0.01 17.60±1.44 42.67±4.47 21.79±4.61 51.23±1.56 10±1.06
15 13 (-1.68) 145 (0) 5 (0) 28.59±0.08 0.83±0.01 14.45±0.79 43.60±5.50 19.05±5.27 1.23±0.02 1±0.00
16 47 (1.68) 145 (0) 5 (0) 13.32±0.04 0.53±0.01 25.15±3.54 51.99±2.34 13.80±0.85 43.22±0.89 4±0.81
17 30 (0) 120 (-1.68) 5 (0) 55.59±0.01 0.93±0.01 13.35±1.57 48.71±0.26 13.87±0.11 2.35±0.04 2±0.4
18 30 (0) 170 (1.68) 5 (0) 12.84±0.03 0.39±0.02 36.05±4.32 51.27±2.99 12.64±1.50 46.78±2.23 9±1.21
19 30 (0) 145 (0) 2 (-1.68) 25.38±0.00 0.82±0.00 3.45±0.68 47.68±0.38 13.82±0.36 27.89±1.85 2±0.44
20 30 (0) 145 (0) 8 (1.68) 14.46±0.00 0.33±0.00 16.50±1.64 41.81±2.81 20.18±2.88 5.54±0.12 8±0.98
X1= (DT- 30)/10, X2= (Ft- 145)/15, X3= (FT-5)/2

Sweet Potato Chips Development and Optimization of Chips Processing Variables 121
2.4 Quality characterization of sweet potato chips
2.4.1 Determination of moisture content of sweet potato chips
The moisture content of the sweet potato chip samples was determined using the oven drying method (Horwitz and Latimer 2005) with a little modification of drying temperature and time. Five grams of sweet potato chips were dried at 140°C for 2 hours to a constant weight of chips. The moisture content of the chips was calculated from the weight difference between the initial and dried sweet potato chip samples and was expressed as percentage of the initial weight using the following equation. All samples were performed in duplicates.
2.4.2 Determination of water activity of sweet potato chips
The water activity of fried sweet potato chips was measured using an Aqualab Water Activity Meter 4TE (Corona, CA). The fried sweet potato chip sample sample was placed in a disposable cup. The cup with samples was placed in the water activity meter and the sample chamber lid of the water activity meter was sealed over the sample. The sample was left in the water activity meter until a constant reading was obtained. The mean water activity of the samples was calculated with triplicate measurements.
2.4.3 Determination of oil content of sweet potato chips
The oil content of sweet potato chips was determined based on the concept of hexane solubility solvent extraction principle (Kemper 2013: Ch. 4). In this process, three grams of ground chip samples was taken into a test tube and hexane (30 mL) was added to the test tube. The test tubes with a mixture of hexane and chip samples were placed in a water bath at 60°C for 3 hours with continuous gentle shaking. After extraction, the extracted samples were centrifuged for 15 min at 15000 rpm (L-60 Ultracentrifuge, Beckman Coulter, Inc., Chaska, USA). The supernatants (oil and hexane mixture) were poured into petri-dishes of a known weight and dried in an oven at 80°C until complete removal of hexane. The weight of the petri-dishes with extracted oil was measured and the weight of extracted oil content was calculated by
the difference between the weight of petri-dishes with extracted oil and petri-dishes. The oil content of sweet potato chip samples was expressed as a percentage and was calculated using the following equation. All samples were conducted in duplicates.
2.4.4 Determination of color of sweet potato chips
The color parameters were measured using a Hunter Lab Color Flex-EZ Colorimeter (Hunter Associates Laboratory Inc., Reston, Virginia, U.S.A.). The Hunter Lab Colorimeter was used to determine the “L” value (lightness/darkness), “a” value (redness/greenness) and “b” value (yellowness/blueness) of fresh and fried sweet potato samples (Meda et al. 2016). The color measurement of the samples was performed six times and the mean value was calculated. The total color difference (ΔE) of the chips samples was calculated according to the following formula (Shyu and Hwang 2011):
Where, Lo, ao and bo are color values of fresh sweet potato slices while L, a and b are values of fried sweet potato chips.
2.4.5 Determination of hardness and crispness of sweet potato chips
The hardness (N) and the crispness of the sweet potato chips were determined using an Instron Machine (Instron Corporation, Norwood, USA). A sweet potato chip sample was placed on the lower ram and the upper ram with a 35 mm diameter stainless steel probe attached with a 500 N load cell was compressed the chip sample to break 80% strain of a sample. A strain level of 80% provided complete information on the behavior of the sample without excessive densification because the total strain during the chewing process in the mouth was reported to be about 70% (Dogan and Kokini 2007). Before starting the compression test, the anvil height of the probe was adjusted to 3-5 mm depending on the height of the tested samples. The pre-test speed (2 mm/s), test speed (1 mm/s) and post-test speed (2 mm/s) were set to perform the compression test. A force-deformation curve was generated using the Bluehill 3 software to determine the textural properties of sweet potato chips. The maximum force during the compression to 80% strain was calculated
122 Pratiksha Timalsina, et al.
as the hardness of the chips and the number of peaks was calculated as the crispness of the sweet potato chips. The number of peaks from the force-deformation curve indicated the cell wall-fracture of the sample, which correlated to the crispness (Dogan and Kokini 2007; Peleg 2015). Ten replications were conducted for all textural analysis and the mean value for hardness and crispness of the sweet potato chips was reported.
2.5 Statistical analysis and modeling
2.5.1 Experimental Design
Central Composite Rotatable Design (CCRD) was used to study the effect of sweet potato chips processing variables (pre-drying time, frying temperature and frying time) on the response variables (moisture content, water activity, oil content, L value, total color difference, hardness and crispness) of the fried sweet potato chips. The three independent variables were pre-drying time (13-47 min, X1), frying temperature (120-170°C, X2) and frying time (2-8 min, X3). The five levels determined were -1.68, -1, 0, +1 and +1.68 as shown in Table 1. The experimental design consisted of 20 experimental points (n = 2k + 2k + m, where, n = total experimental points, input variables, k = 3 and center point, m = 6 replications), which included 8 factorials points, 6 axial points and six replicated center points (Mason et al. 2003) as shown in Table 1.
2.5.2 Modeling and process optimization
Response Surface Methodology (RSM) was used to determine the correlation between sweet potato chips processing independent variables (pre-drying time, frying temperature and frying time) and response variables (moisture content, water activity, oil content, L value, total color difference, hardness and crispness) and to optimize the independent variables on response variables (physicochemical properties of sweet potato chips). Data analysis was carried out assuming a second order polynomial equation for each of the response variables as a function of independent variables of pre-drying time (X1), frying temperature (X2) and frying time (X3). The second order polynomial model to fit the coded variables is as follow:
Y = B0 + B1 X1 + B2 X2 + B3 X3 + B11X12 +B22X2
2 + B33X32 +
B12X1X2 + B23X2 X3 + B31X3X1
Where, Y was the experimental response variable, B0,
B1, B2, B3, B11, B22, B33, B12, B23 and B31 were constants and regression coefficients of the model, and X1, X2 and X3 were the independent variables.
The Design-Expert software (version 11) was used to solve the second order polynomial equation to develop regression models, response surface models and numerical and graphical optimization of processing variables. Analysis of Variance (ANOVA) was conducted and the model was justified with F value > Fcrit (F value at critical point), (Prob > F) < 0.05, adequate precision and R2. The three-dimensional response surface model was generated by presenting the response as a function of two factors keeping the third constant at the center point. Numerical optimization was conducted on the basis of a desirability function and a trial and error method was used to determine the numerical optimum using Design-Expert software and the optimum regions were visualized by graphical optimization with the Design-Expert Software.
Ethical approval: The conducted research is not related to either human or animal use.
3 Results and discussion
3.1 Experimental data and regression modeling
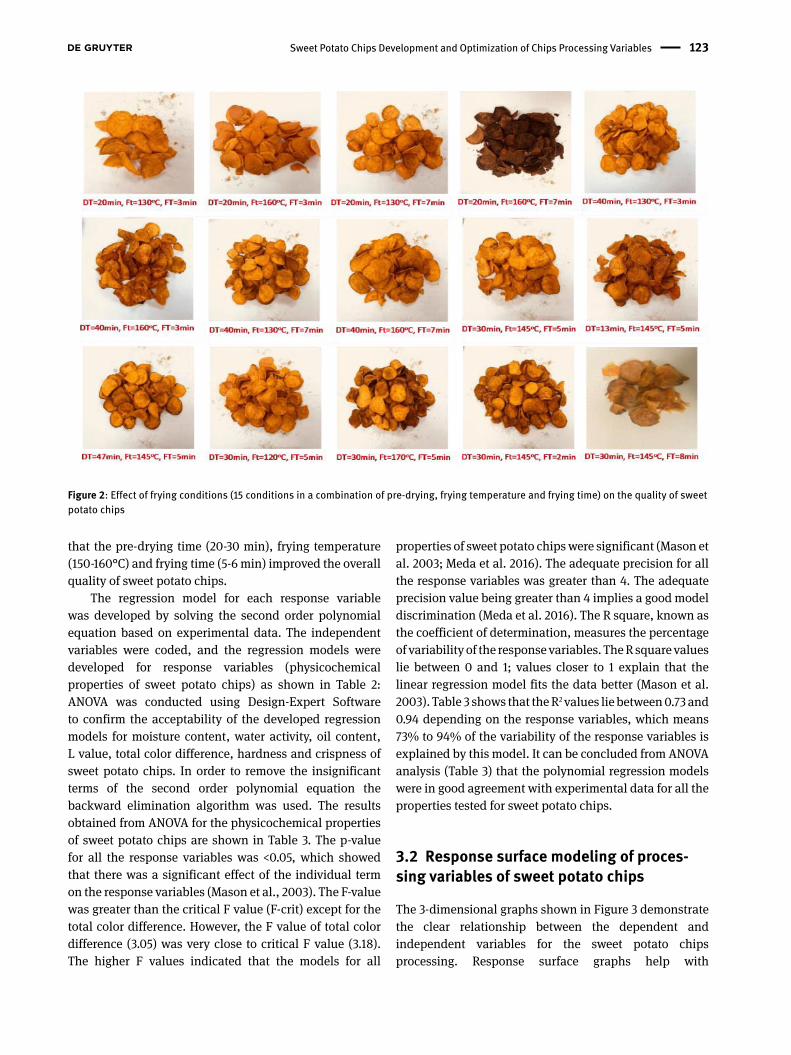
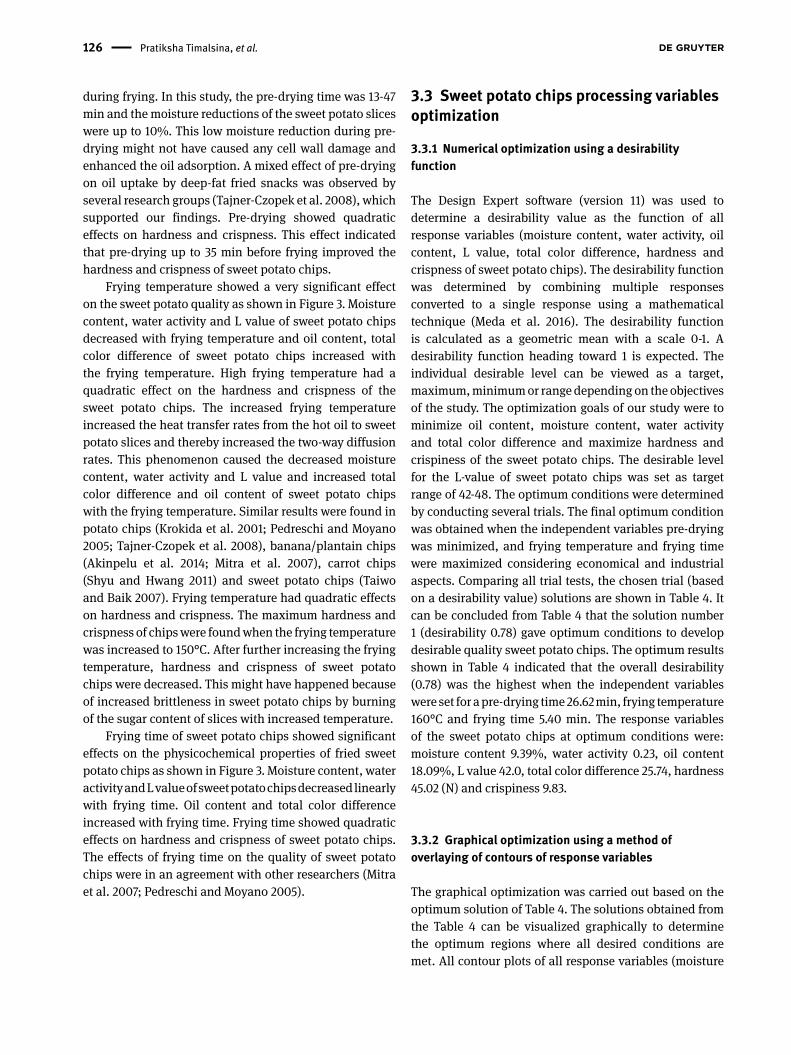
After deep-fat frying, the sweet potato chips were characterized by determining the physicochemical properties and the results are summarized in Table 1. Different sweet potato chip samples were prepared as per CCRD and are shown in Figure 2. The response surface methodology combined with CCRD was used to observe the effect of the pre-drying time and frying variables (frying temperature and frying time) and to optimize the sweet potato chips processing conditions on the physicochemical properties of fried chips as response variables (moisture content, water activity, oil content, L value, total color difference, hardness, and crispiness). The overall observations of results presented in Table 1 revealed that the increase in pre-drying time, frying temperature and frying time increased the oil-content, hardness, crispness, L value and total color difference of the sweet potato chips, but decreased the moisture content and water activity of the sweet potato chips. Figure 2 showed that sweet potato slices fried at a high temperature (160°C) and a long time (7 min) were the darkest in color among the samples tested. This may be because sugar content of the sweet potato slices was burned quickly with the high temperature and longer time. The results shown in Figure 2 and Table 1 indicated
Sweet Potato Chips Development and Optimization of Chips Processing Variables 123
that the pre-drying time (20-30 min), frying temperature (150-160°C) and frying time (5-6 min) improved the overall quality of sweet potato chips.
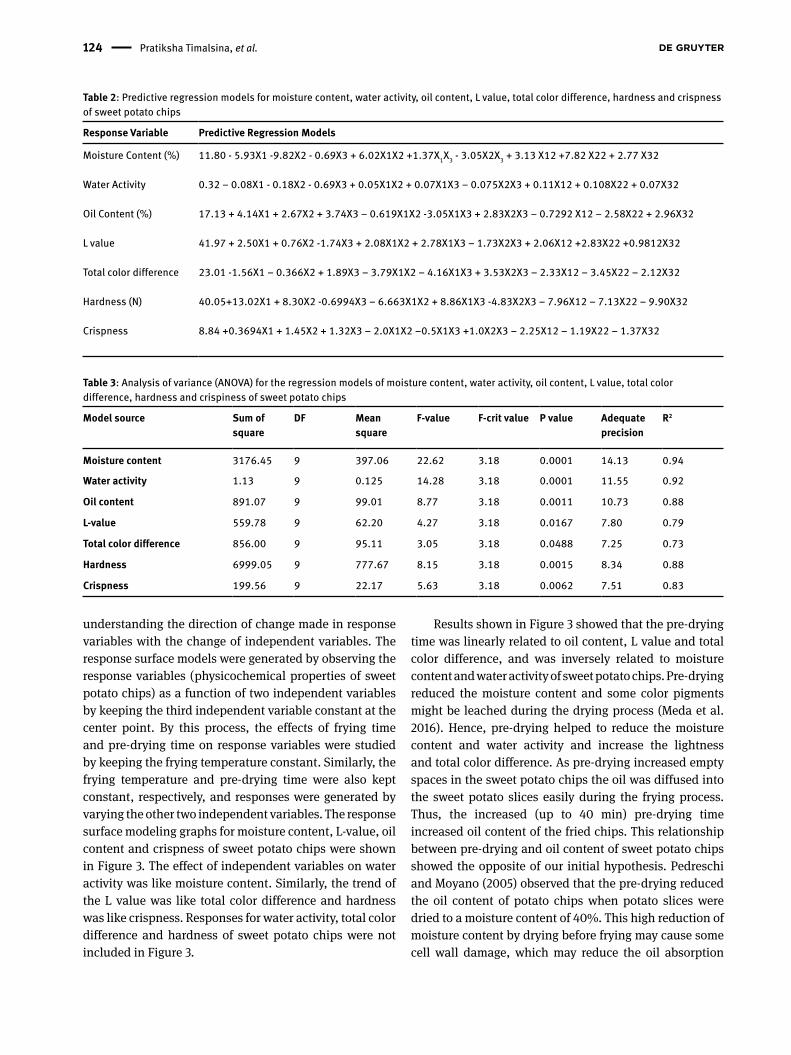
The regression model for each response variable was developed by solving the second order polynomial equation based on experimental data. The independent variables were coded, and the regression models were developed for response variables (physicochemical properties of sweet potato chips) as shown in Table 2: ANOVA was conducted using Design-Expert Software to confirm the acceptability of the developed regression models for moisture content, water activity, oil content, L value, total color difference, hardness and crispness of sweet potato chips. In order to remove the insignificant terms of the second order polynomial equation the backward elimination algorithm was used. The results obtained from ANOVA for the physicochemical properties of sweet potato chips are shown in Table 3. The p-value for all the response variables was <0.05, which showed that there was a significant effect of the individual term on the response variables (Mason et al., 2003). The F-value was greater than the critical F value (F-crit) except for the total color difference. However, the F value of total color difference (3.05) was very close to critical F value (3.18). The higher F values indicated that the models for all
properties of sweet potato chips were significant (Mason et al. 2003; Meda et al. 2016). The adequate precision for all the response variables was greater than 4. The adequate precision value being greater than 4 implies a good model discrimination (Meda et al. 2016). The R square, known as the coefficient of determination, measures the percentage of variability of the response variables. The R square values lie between 0 and 1; values closer to 1 explain that the linear regression model fits the data better (Mason et al. 2003). Table 3 shows that the R2 values lie between 0.73 and 0.94 depending on the response variables, which means 73% to 94% of the variability of the response variables is explained by this model. It can be concluded from ANOVA analysis (Table 3) that the polynomial regression models were in good agreement with experimental data for all the properties tested for sweet potato chips.
3.2 Response surface modeling of proces-sing variables of sweet potato chips
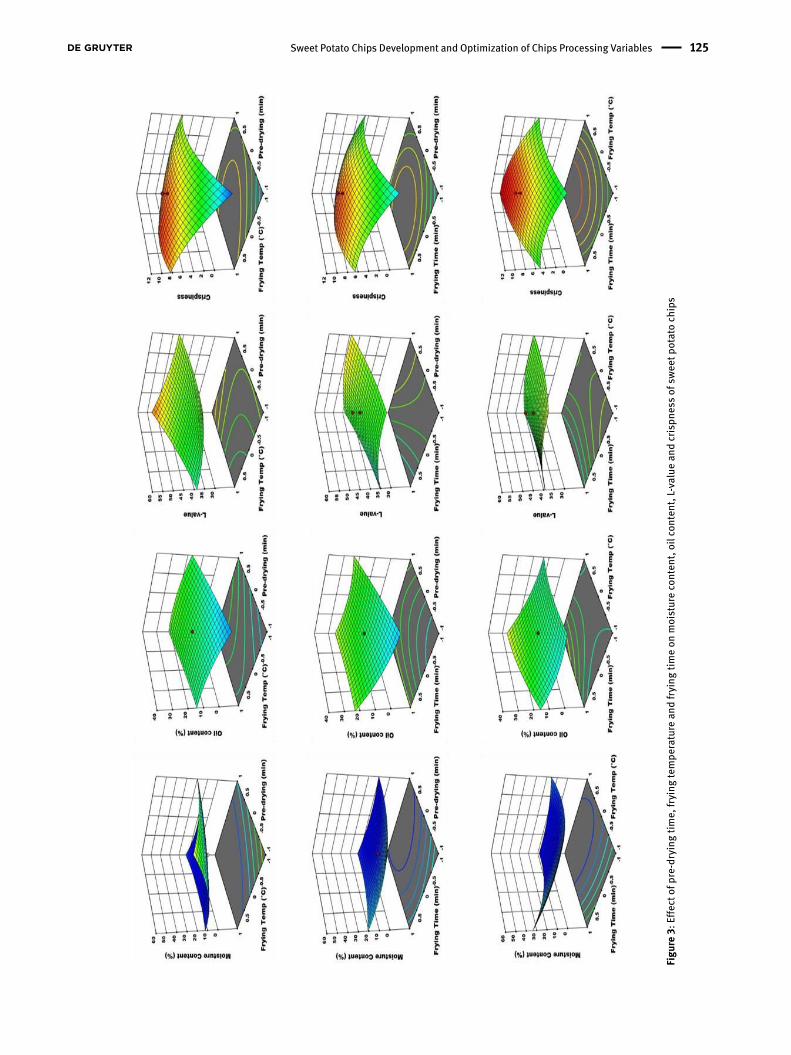
The 3-dimensional graphs shown in Figure 3 demonstrate the clear relationship between the dependent and independent variables for the sweet potato chips processing. Response surface graphs help with
Figure 2: Effect of frying conditions (15 conditions in a combination of pre-drying, frying temperature and frying time) on the quality of sweet potato chips
Figure 2: Effect of frying conditions (15 conditions in a combination of pre-drying, frying temperature and frying time) on the quality
of sweet potato chips
124 Pratiksha Timalsina, et al.
Results shown in Figure 3 showed that the pre-drying time was linearly related to oil content, L value and total color difference, and was inversely related to moisture content and water activity of sweet potato chips. Pre-drying reduced the moisture content and some color pigments might be leached during the drying process (Meda et al. 2016). Hence, pre-drying helped to reduce the moisture content and water activity and increase the lightness and total color difference. As pre-drying increased empty spaces in the sweet potato chips the oil was diffused into the sweet potato slices easily during the frying process. Thus, the increased (up to 40 min) pre-drying time increased oil content of the fried chips. This relationship between pre-drying and oil content of sweet potato chips showed the opposite of our initial hypothesis. Pedreschi and Moyano (2005) observed that the pre-drying reduced the oil content of potato chips when potato slices were dried to a moisture content of 40%. This high reduction of moisture content by drying before frying may cause some cell wall damage, which may reduce the oil absorption
understanding the direction of change made in response variables with the change of independent variables. The response surface models were generated by observing the response variables (physicochemical properties of sweet potato chips) as a function of two independent variables by keeping the third independent variable constant at the center point. By this process, the effects of frying time and pre-drying time on response variables were studied by keeping the frying temperature constant. Similarly, the frying temperature and pre-drying time were also kept constant, respectively, and responses were generated by varying the other two independent variables. The response surface modeling graphs for moisture content, L-value, oil content and crispness of sweet potato chips were shown in Figure 3. The effect of independent variables on water activity was like moisture content. Similarly, the trend of the L value was like total color difference and hardness was like crispness. Responses for water activity, total color difference and hardness of sweet potato chips were not included in Figure 3.
Table 2: Predictive regression models for moisture content, water activity, oil content, L value, total color difference, hardness and crispness of sweet potato chips
Response Variable Predictive Regression Models
Moisture Content (%) 11.80 - 5.93X1 -9.82X2 - 0.69X3 + 6.02X1X2 +1.37X1X3 - 3.05X2X3 + 3.13 X12 +7.82 X22 + 2.77 X32
Water Activity 0.32 – 0.08X1 - 0.18X2 - 0.69X3 + 0.05X1X2 + 0.07X1X3 – 0.075X2X3 + 0.11X12 + 0.108X22 + 0.07X32
Oil Content (%) 17.13 + 4.14X1 + 2.67X2 + 3.74X3 – 0.619X1X2 -3.05X1X3 + 2.83X2X3 – 0.7292 X12 – 2.58X22 + 2.96X32
L value 41.97 + 2.50X1 + 0.76X2 -1.74X3 + 2.08X1X2 + 2.78X1X3 – 1.73X2X3 + 2.06X12 +2.83X22 +0.9812X32
Total color difference 23.01 -1.56X1 – 0.366X2 + 1.89X3 – 3.79X1X2 – 4.16X1X3 + 3.53X2X3 – 2.33X12 – 3.45X22 – 2.12X32
Hardness (N) 40.05+13.02X1 + 8.30X2 -0.6994X3 – 6.663X1X2 + 8.86X1X3 -4.83X2X3 – 7.96X12 – 7.13X22 – 9.90X32
Crispness 8.84 +0.3694X1 + 1.45X2 + 1.32X3 – 2.0X1X2 –0.5X1X3 +1.0X2X3 – 2.25X12 – 1.19X22 – 1.37X32
Table 3: Analysis of variance (ANOVA) for the regression models of moisture content, water activity, oil content, L value, total color difference, hardness and crispiness of sweet potato chips
Model source Sum of square
DF Mean square
F-value F-crit value P value Adequate precision
R2
Moisture content 3176.45 9 397.06 22.62 3.18 0.0001 14.13 0.94
Water activity 1.13 9 0.125 14.28 3.18 0.0001 11.55 0.92
Oil content 891.07 9 99.01 8.77 3.18 0.0011 10.73 0.88
L-value 559.78 9 62.20 4.27 3.18 0.0167 7.80 0.79
Total color difference 856.00 9 95.11 3.05 3.18 0.0488 7.25 0.73
Hardness 6999.05 9 777.67 8.15 3.18 0.0015 8.34 0.88
Crispness 199.56 9 22.17 5.63 3.18 0.0062 7.51 0.83
Sweet Potato Chips Development and Optimization of Chips Processing Variables 125
Figu
re 3
: Eff
ect o
f pre
-dry
ing
time,
fryi
ng te
mpe
ratu
re a
nd fr
ying
tim
e on
moi
stur
e co
nten
t, oi
l con
tent
, L v
alue
and
cris
pnes
s of
swee
t pot
ato
chip
s
Figu
re 3
: Effe
ct o
f pre
-dry
ing
time,
fryi
ng te
mpe
ratu
re a
nd fr
ying
tim
e on
moi
stur
e co
nten
t, oi
l con
tent
, L-v
alue
and
cris
pnes
s of
sw
eet p
otat
o ch
ips
126 Pratiksha Timalsina, et al.
3.3 Sweet potato chips processing variables optimization
3.3.1 Numerical optimization using a desirability function
The Design Expert software (version 11) was used to determine a desirability value as the function of all response variables (moisture content, water activity, oil content, L value, total color difference, hardness and crispness of sweet potato chips). The desirability function was determined by combining multiple responses converted to a single response using a mathematical technique (Meda et al. 2016). The desirability function is calculated as a geometric mean with a scale 0-1. A desirability function heading toward 1 is expected. The individual desirable level can be viewed as a target, maximum, minimum or range depending on the objectives of the study. The optimization goals of our study were to minimize oil content, moisture content, water activity and total color difference and maximize hardness and crispiness of the sweet potato chips. The desirable level for the L-value of sweet potato chips was set as target range of 42-48. The optimum conditions were determined by conducting several trials. The final optimum condition was obtained when the independent variables pre-drying was minimized, and frying temperature and frying time were maximized considering economical and industrial aspects. Comparing all trial tests, the chosen trial (based on a desirability value) solutions are shown in Table 4. It can be concluded from Table 4 that the solution number 1 (desirability 0.78) gave optimum conditions to develop desirable quality sweet potato chips. The optimum results shown in Table 4 indicated that the overall desirability (0.78) was the highest when the independent variables were set for a pre-drying time 26.62 min, frying temperature 160°C and frying time 5.40 min. The response variables of the sweet potato chips at optimum conditions were: moisture content 9.39%, water activity 0.23, oil content 18.09%, L value 42.0, total color difference 25.74, hardness 45.02 (N) and crispiness 9.83.
3.3.2 Graphical optimization using a method of overlaying of contours of response variables
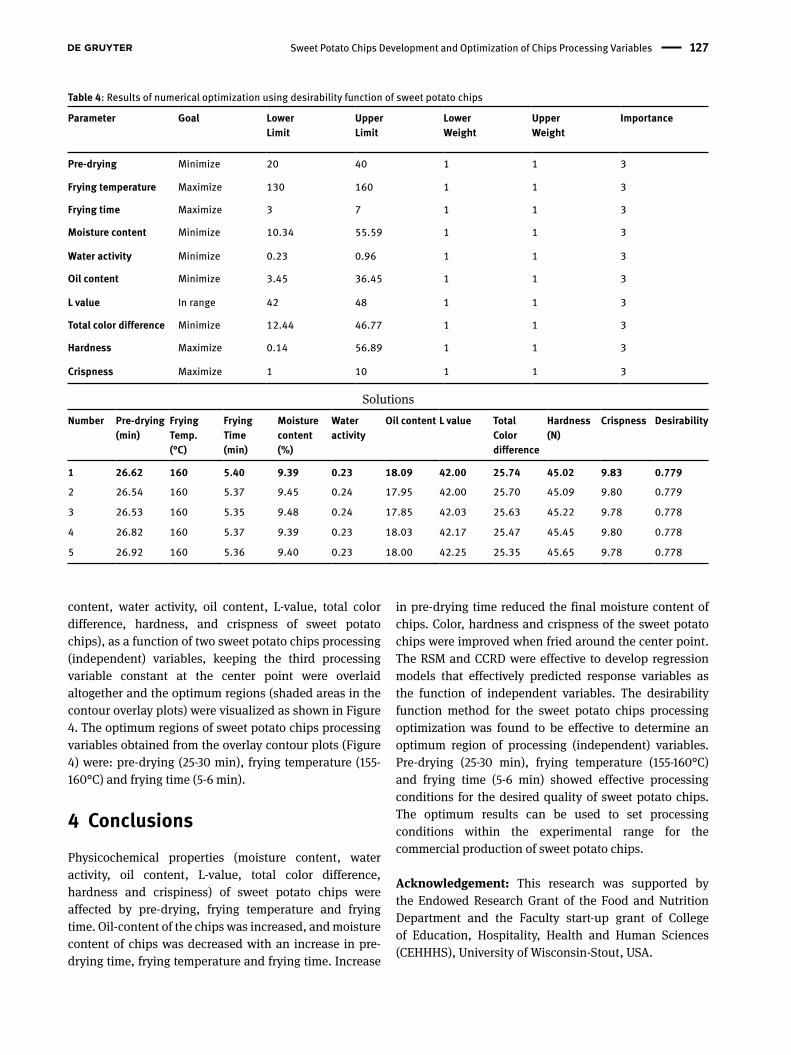
The graphical optimization was carried out based on the optimum solution of Table 4. The solutions obtained from the Table 4 can be visualized graphically to determine the optimum regions where all desired conditions are met. All contour plots of all response variables (moisture
during frying. In this study, the pre-drying time was 13-47 min and the moisture reductions of the sweet potato slices were up to 10%. This low moisture reduction during pre-drying might not have caused any cell wall damage and enhanced the oil adsorption. A mixed effect of pre-drying on oil uptake by deep-fat fried snacks was observed by several research groups (Tajner-Czopek et al. 2008), which supported our findings. Pre-drying showed quadratic effects on hardness and crispness. This effect indicated that pre-drying up to 35 min before frying improved the hardness and crispness of sweet potato chips.
Frying temperature showed a very significant effect on the sweet potato quality as shown in Figure 3. Moisture content, water activity and L value of sweet potato chips decreased with frying temperature and oil content, total color difference of sweet potato chips increased with the frying temperature. High frying temperature had a quadratic effect on the hardness and crispness of the sweet potato chips. The increased frying temperature increased the heat transfer rates from the hot oil to sweet potato slices and thereby increased the two-way diffusion rates. This phenomenon caused the decreased moisture content, water activity and L value and increased total color difference and oil content of sweet potato chips with the frying temperature. Similar results were found in potato chips (Krokida et al. 2001; Pedreschi and Moyano 2005; Tajner-Czopek et al. 2008), banana/plantain chips (Akinpelu et al. 2014; Mitra et al. 2007), carrot chips (Shyu and Hwang 2011) and sweet potato chips (Taiwo and Baik 2007). Frying temperature had quadratic effects on hardness and crispness. The maximum hardness and crispness of chips were found when the frying temperature was increased to 150°C. After further increasing the frying temperature, hardness and crispness of sweet potato chips were decreased. This might have happened because of increased brittleness in sweet potato chips by burning of the sugar content of slices with increased temperature.
Frying time of sweet potato chips showed significant effects on the physicochemical properties of fried sweet potato chips as shown in Figure 3. Moisture content, water activity and L value of sweet potato chips decreased linearly with frying time. Oil content and total color difference increased with frying time. Frying time showed quadratic effects on hardness and crispness of sweet potato chips. The effects of frying time on the quality of sweet potato chips were in an agreement with other researchers (Mitra et al. 2007; Pedreschi and Moyano 2005).
Sweet Potato Chips Development and Optimization of Chips Processing Variables 127
in pre-drying time reduced the final moisture content of chips. Color, hardness and crispness of the sweet potato chips were improved when fried around the center point. The RSM and CCRD were effective to develop regression models that effectively predicted response variables as the function of independent variables. The desirability function method for the sweet potato chips processing optimization was found to be effective to determine an optimum region of processing (independent) variables. Pre-drying (25-30 min), frying temperature (155-160°C) and frying time (5-6 min) showed effective processing conditions for the desired quality of sweet potato chips. The optimum results can be used to set processing conditions within the experimental range for the commercial production of sweet potato chips.
Acknowledgement: This research was supported by the Endowed Research Grant of the Food and Nutrition Department and the Faculty start-up grant of College of Education, Hospitality, Health and Human Sciences (CEHHHS), University of Wisconsin-Stout, USA.
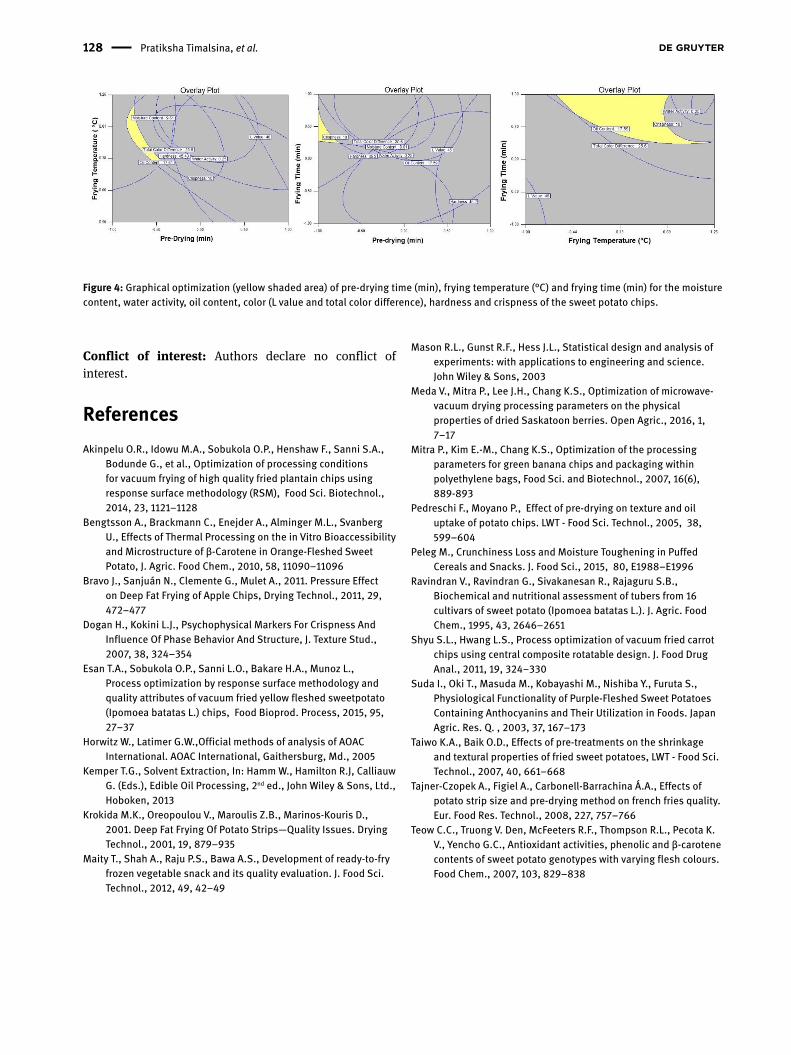
content, water activity, oil content, L-value, total color difference, hardness, and crispness of sweet potato chips), as a function of two sweet potato chips processing (independent) variables, keeping the third processing variable constant at the center point were overlaid altogether and the optimum regions (shaded areas in the contour overlay plots) were visualized as shown in Figure 4. The optimum regions of sweet potato chips processing variables obtained from the overlay contour plots (Figure 4) were: pre-drying (25-30 min), frying temperature (155-160°C) and frying time (5-6 min).
4 ConclusionsPhysicochemical properties (moisture content, water activity, oil content, L-value, total color difference, hardness and crispiness) of sweet potato chips were affected by pre-drying, frying temperature and frying time. Oil-content of the chips was increased, and moisture content of chips was decreased with an increase in pre-drying time, frying temperature and frying time. Increase
Table 4: Results of numerical optimization using desirability function of sweet potato chips
Parameter
Goal Lower Limit
Upper Limit
Lower Weight
Upper Weight
Importance
Pre-drying Minimize 20 40 1 1 3
Frying temperature Maximize 130 160 1 1 3
Frying time Maximize 3 7 1 1 3
Moisture content Minimize 10.34 55.59 1 1 3
Water activity Minimize 0.23 0.96 1 1 3
Oil content Minimize 3.45 36.45 1 1 3
L value In range 42 48 1 1 3
Total color difference Minimize 12.44 46.77 1 1 3
Hardness Maximize 0.14 56.89 1 1 3
Crispness Maximize 1 10 1 1 3
SolutionsNumber Pre-drying
(min)Frying Temp.(°C)
FryingTime(min)
Moisture content(%)
Wateractivity
Oil content L value TotalColordifference
Hardness(N)
Crispness Desirability
1 26.62 160 5.40 9.39 0.23 18.09 42.00 25.74 45.02 9.83 0.779
2 26.54 160 5.37 9.45 0.24 17.95 42.00 25.70 45.09 9.80 0.779
3 26.53 160 5.35 9.48 0.24 17.85 42.03 25.63 45.22 9.78 0.778
4 26.82 160 5.37 9.39 0.23 18.03 42.17 25.47 45.45 9.80 0.778
5 26.92 160 5.36 9.40 0.23 18.00 42.25 25.35 45.65 9.78 0.778
128 Pratiksha Timalsina, et al.
Mason R.L., Gunst R.F., Hess J.L., Statistical design and analysis of experiments: with applications to engineering and science. John Wiley & Sons, 2003
Meda V., Mitra P., Lee J.H., Chang K.S., Optimization of microwave-vacuum drying processing parameters on the physical properties of dried Saskatoon berries. Open Agric., 2016, 1, 7–17
Mitra P., Kim E.-M., Chang K.S., Optimization of the processing parameters for green banana chips and packaging within polyethylene bags, Food Sci. and Biotechnol., 2007, 16(6), 889-893
Pedreschi F., Moyano P., Effect of pre-drying on texture and oil uptake of potato chips. LWT - Food Sci. Technol., 2005, 38, 599–604
Peleg M., Crunchiness Loss and Moisture Toughening in Puffed Cereals and Snacks. J. Food Sci., 2015, 80, E1988–E1996
Ravindran V., Ravindran G., Sivakanesan R., Rajaguru S.B., Biochemical and nutritional assessment of tubers from 16 cultivars of sweet potato (Ipomoea batatas L.). J. Agric. Food Chem., 1995, 43, 2646–2651
Shyu S.L., Hwang L.S., Process optimization of vacuum fried carrot chips using central composite rotatable design. J. Food Drug Anal., 2011, 19, 324–330
Suda I., Oki T., Masuda M., Kobayashi M., Nishiba Y., Furuta S., Physiological Functionality of Purple-Fleshed Sweet Potatoes Containing Anthocyanins and Their Utilization in Foods. Japan Agric. Res. Q. , 2003, 37, 167–173
Taiwo K.A., Baik O.D., Effects of pre-treatments on the shrinkage and textural properties of fried sweet potatoes, LWT - Food Sci. Technol., 2007, 40, 661–668
Tajner-Czopek A., Figiel A., Carbonell-Barrachina Á.A., Effects of potato strip size and pre-drying method on french fries quality. Eur. Food Res. Technol., 2008, 227, 757–766
Teow C.C., Truong V. Den, McFeeters R.F., Thompson R.L., Pecota K. V., Yencho G.C., Antioxidant activities, phenolic and β-carotene contents of sweet potato genotypes with varying flesh colours. Food Chem., 2007, 103, 829–838
Conflict of interest: Authors declare no conflict of interest.
References Akinpelu O.R., Idowu M.A., Sobukola O.P., Henshaw F., Sanni S.A.,
Bodunde G., et al., Optimization of processing conditions for vacuum frying of high quality fried plantain chips using response surface methodology (RSM), Food Sci. Biotechnol., 2014, 23, 1121–1128
Bengtsson A., Brackmann C., Enejder A., Alminger M.L., Svanberg U., Effects of Thermal Processing on the in Vitro Bioaccessibility and Microstructure of β-Carotene in Orange-Fleshed Sweet Potato, J. Agric. Food Chem., 2010, 58, 11090–11096
Bravo J., Sanjuán N., Clemente G., Mulet A., 2011. Pressure Effect on Deep Fat Frying of Apple Chips, Drying Technol., 2011, 29, 472–477
Dogan H., Kokini L.J., Psychophysical Markers For Crispness And Influence Of Phase Behavior And Structure, J. Texture Stud., 2007, 38, 324–354
Esan T.A., Sobukola O.P., Sanni L.O., Bakare H.A., Munoz L., Process optimization by response surface methodology and quality attributes of vacuum fried yellow fleshed sweetpotato (Ipomoea batatas L.) chips, Food Bioprod. Process, 2015, 95, 27–37
Horwitz W., Latimer G.W.,Official methods of analysis of AOAC International. AOAC International, Gaithersburg, Md., 2005
Kemper T.G., Solvent Extraction, In: Hamm W., Hamilton R.J, Calliauw G. (Eds.), Edible Oil Processing, 2nd ed., John Wiley & Sons, Ltd., Hoboken, 2013
Krokida M.K., Oreopoulou V., Maroulis Z.B., Marinos-Kouris D., 2001. Deep Fat Frying Of Potato Strips—Quality Issues. Drying Technol., 2001, 19, 879–935
Maity T., Shah A., Raju P.S., Bawa A.S., Development of ready-to-fry frozen vegetable snack and its quality evaluation. J. Food Sci. Technol., 2012, 49, 42–49
Figure 4: Graphical optimization (yellow shaded area) of pre-drying time (min), frying temperature (°C) and frying time (min) for the moisture content, water activity, oil content, color (L value and total color difference), hardness and crispness of the sweet potato chips.
Figure 4: Graphical optimization (yellow shaded area) of pre-drying time (min), frying temperature (0C) and frying time (min) for the moisture
content, water activity, oil content, color (L value and total color difference), hardness and crispness of the sweet potato chips