feeder trunk hardening
TRANSCRIPT
FEEDER TRUNKHARDENING A PROGRAM DEVELOPED BY
IDAHO POWER

PRESENTATION
P Vinson Carter
• Background, Method & Scope
Brett Efaw
• Statistical Analysis of Program Benefits
Purpose: Open discussion on distribution feeder hardening ingeneral. We have an interest in benefiting from othersexperience.
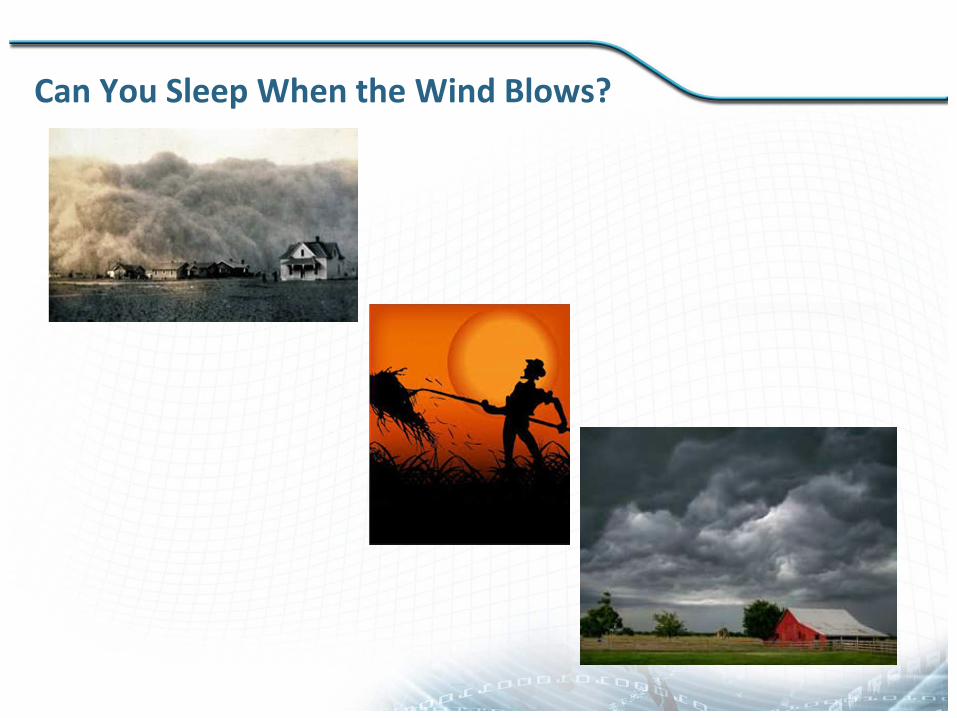
Can You Sleep When the Wind Blows?
Idaho Power Reliability History
In 2006 Idaho Power was deep in the fourth quartile of the IEEEreliability rankings.
We knew that we needed to improve or we could face mandatedreliability quotas.
We after completing some regional projects for a couple of years,we started two company wide projects from a ranked list:
• Exposure Zone Reduction
• Feeder Trunk Hardening
FEEDER TRUNK HARDENING
• Listed 200 feeders with highest number of customer outages
• Created an action plan to eliminate outage causes in the maintrunk or breaker zone of these feeders.
• Began with pilot distribution feeder to get cost and constructionfeed back.
• Expanded to small group of feeders in each of five service areas.
– A lines inspector performed initial inspections and provided valuablefeed back as to the program scope.
• As we came to understand the process and costs we expandedthe project and eventually the scope.
• As the project progressed the Fielding Check list expanded to 26items.
FEEDER TRUNK HARDENING LIST
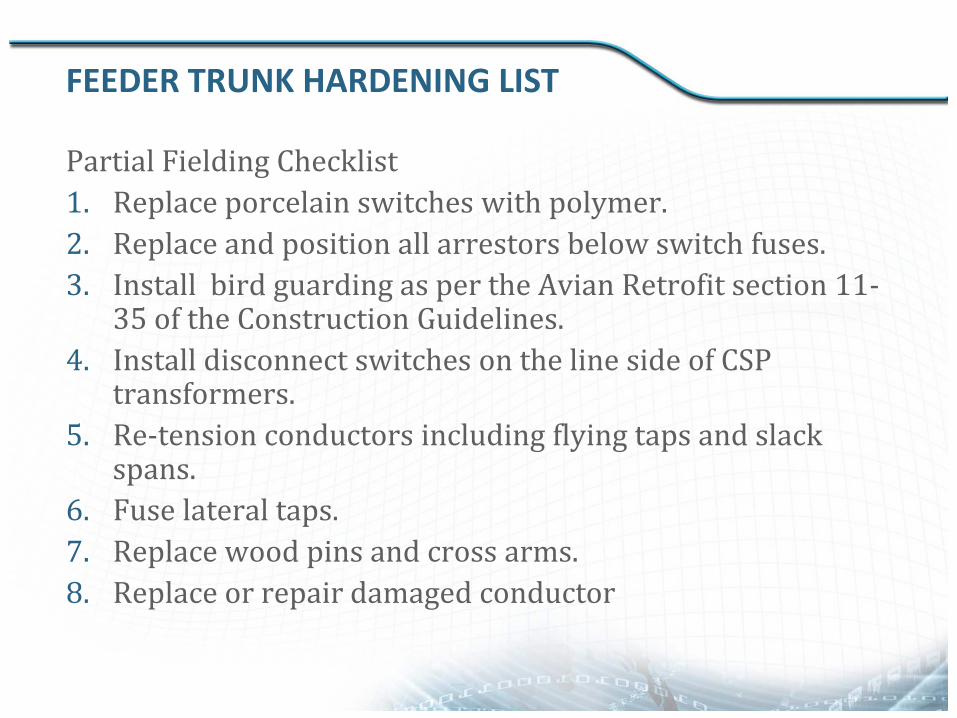
Partial Fielding Checklist
1. Replace porcelain switches with polymer.
2. Replace and position all arrestors below switch fuses.
3. Install bird guarding as per the Avian Retrofit section 11-35 of the Construction Guidelines.
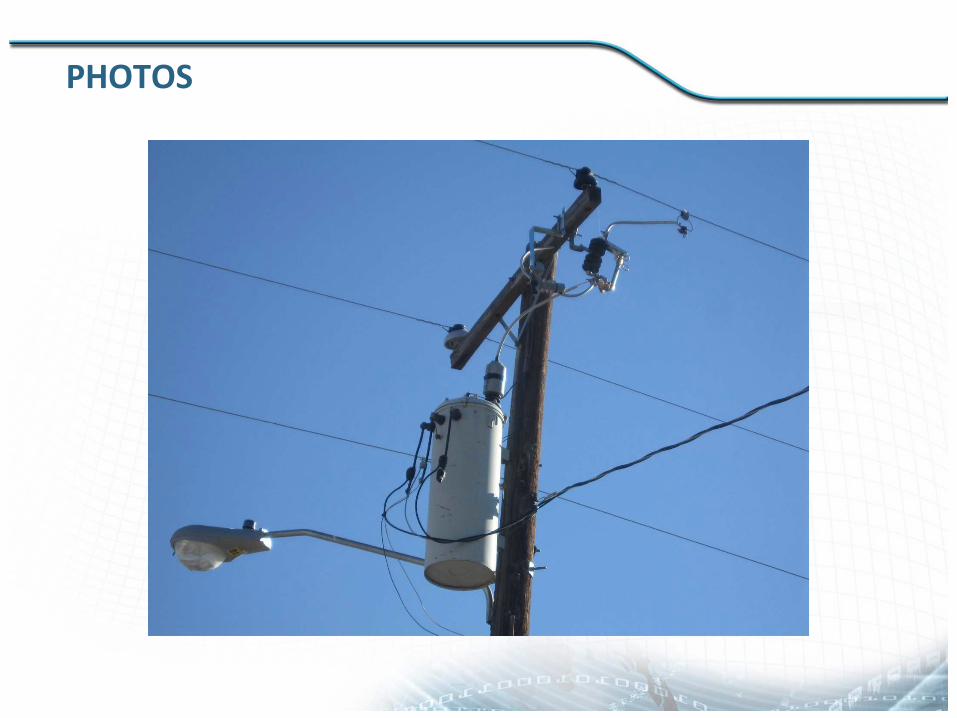
4. Install disconnect switches on the line side of CSPtransformers.
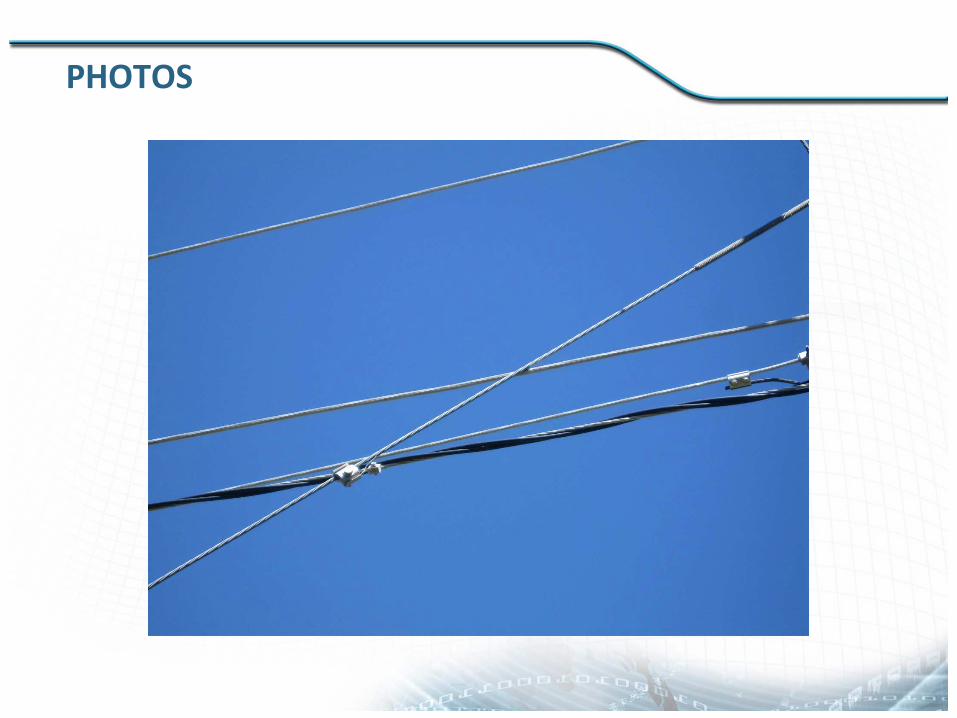
5. Re-tension conductors including flying taps and slackspans.
6. Fuse lateral taps.
7. Replace wood pins and cross arms.
8. Replace or repair damaged conductor
FEEDER TRUNK HARDENING LIST
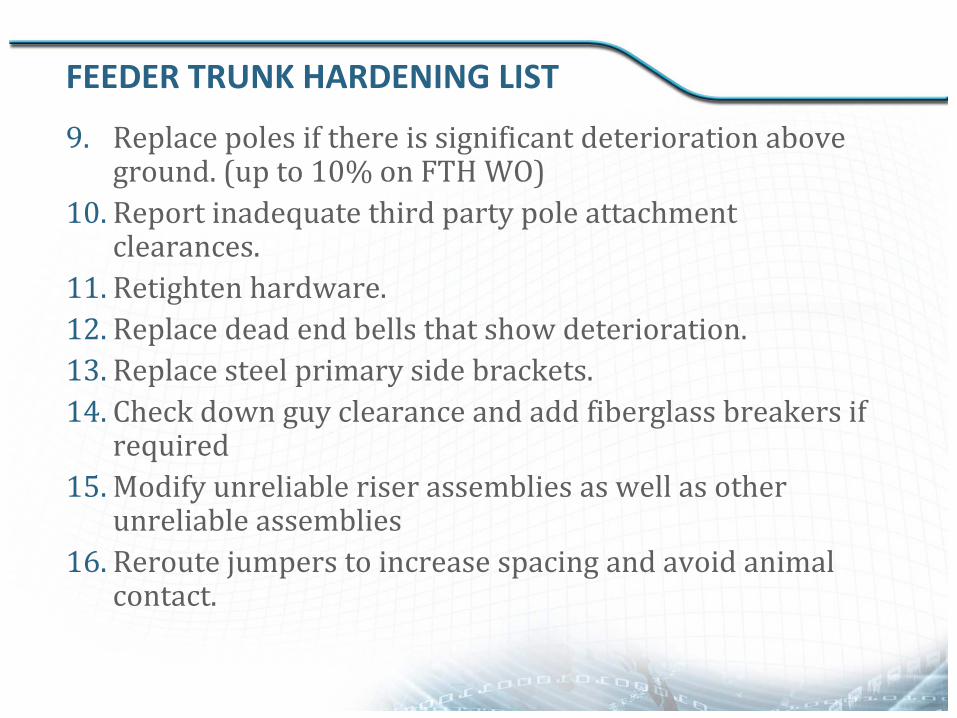
9. Replace poles if there is significant deterioration aboveground. (up to 10% on FTH WO)
10. Report inadequate third party pole attachmentclearances.
11. Retighten hardware.
12. Replace dead end bells that show deterioration.
13. Replace steel primary side brackets.
14. Check down guy clearance and add fiberglass breakers ifrequired
15. Modify unreliable riser assemblies as well as otherunreliable assemblies
16. Reroute jumpers to increase spacing and avoid animalcontact.

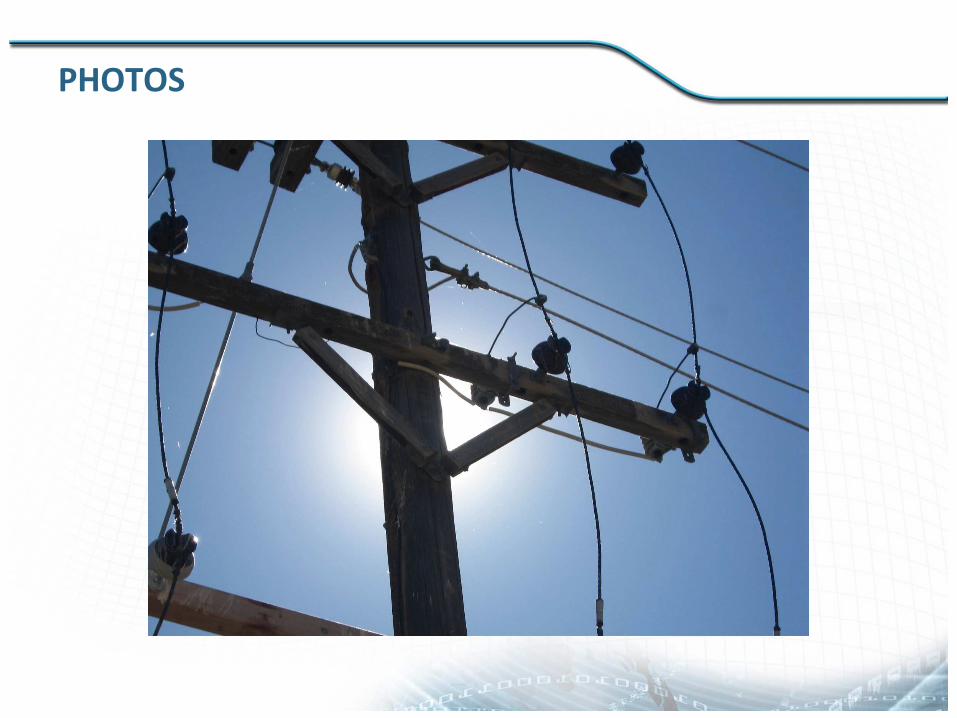
PHOTOS
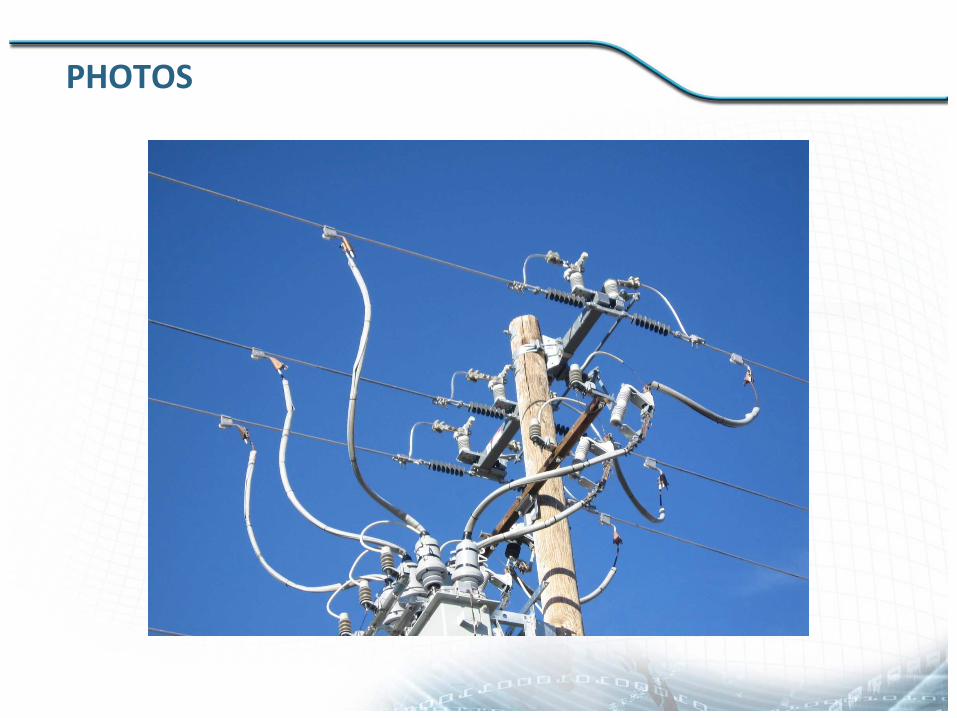
PHOTOS

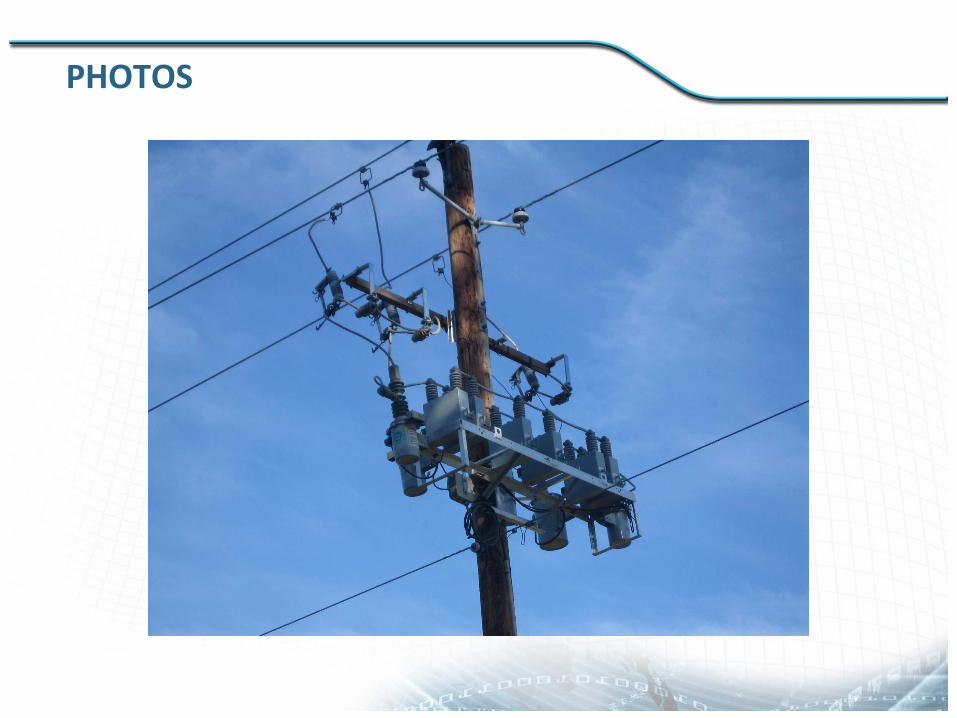
PHOTOS
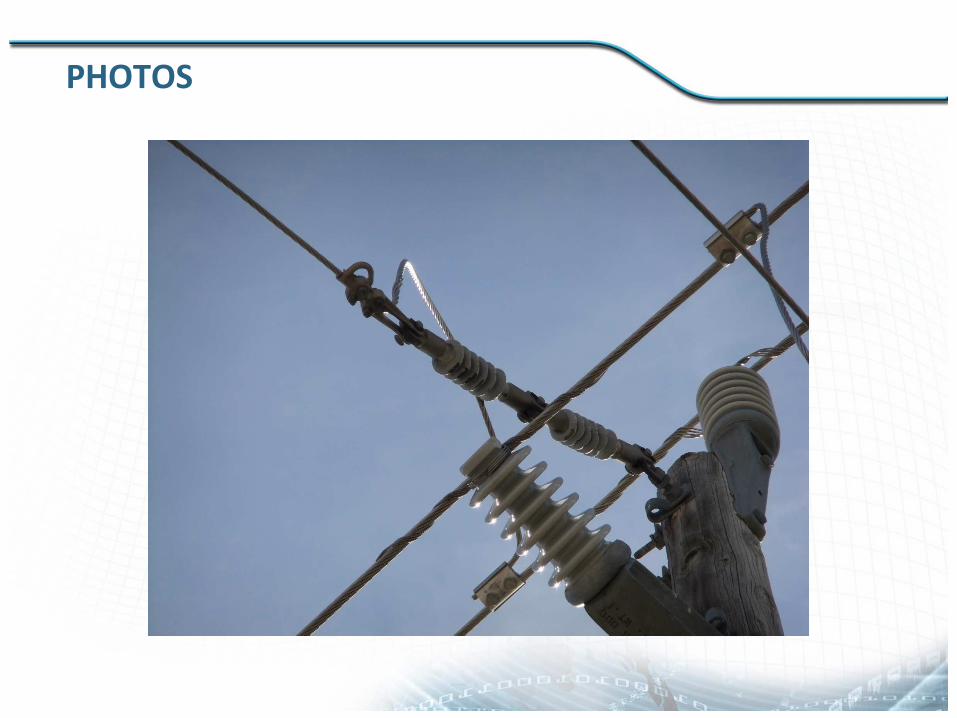
PHOTOS
PHOTOS

PHOTOS
PHOTOS
PHOTOS
PHOTOS
PHOTOS
PHOTOS

PHOTOS
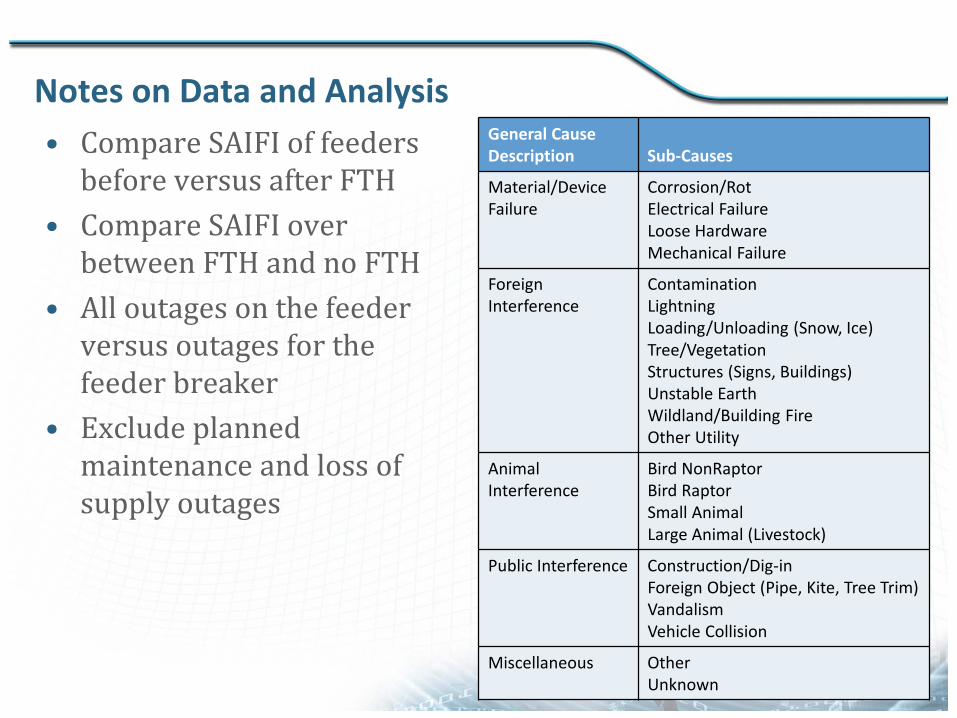
Notes on Data and Analysis
• Compare SAIFI of feedersbefore versus after FTH
• Compare SAIFI overbetween FTH and no FTH
• All outages on the feederversus outages for thefeeder breaker
• Exclude plannedmaintenance and loss ofsupply outages
General CauseDescription Sub-Causes
Material/DeviceFailure
Corrosion/RotElectrical FailureLoose HardwareMechanical Failure
ForeignInterference
ContaminationLightningLoading/Unloading (Snow, Ice)Tree/VegetationStructures (Signs, Buildings)Unstable EarthWildland/Building FireOther Utility
AnimalInterference
Bird NonRaptorBird RaptorSmall AnimalLarge Animal (Livestock)
Public Interference Construction/Dig-inForeign Object (Pipe, Kite, Tree Trim)VandalismVehicle Collision
Miscellaneous OtherUnknown
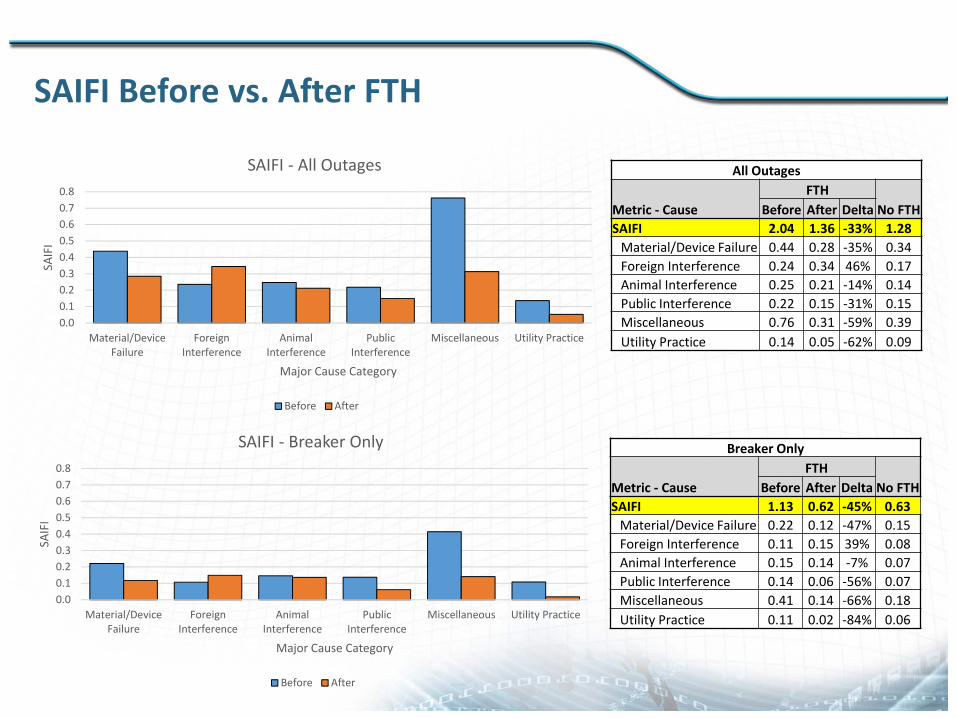
SAIFI Before vs. After FTH
0.0
0.1
0.2
0.3
0.4
0.5
0.6
0.7
0.8
Material/DeviceFailure
ForeignInterference
AnimalInterference
PublicInterference
Miscellaneous Utility Practice
SAIF
I
Major Cause Category
SAIFI - All Outages
Before After
0.0
0.1
0.2
0.3
0.4
0.5
0.6
0.7
0.8
Material/DeviceFailure
ForeignInterference
AnimalInterference
PublicInterference
Miscellaneous Utility Practice
SAIF
I
Major Cause Category
SAIFI - Breaker Only
Before After
All Outages
Metric - Cause
FTH
No FTHBefore After Delta
SAIFI 2.04 1.36 -33% 1.28
Material/Device Failure 0.44 0.28 -35% 0.34
Foreign Interference 0.24 0.34 46% 0.17
Animal Interference 0.25 0.21 -14% 0.14
Public Interference 0.22 0.15 -31% 0.15
Miscellaneous 0.76 0.31 -59% 0.39
Utility Practice 0.14 0.05 -62% 0.09
Breaker Only
Metric - Cause
FTH
No FTHBefore After Delta
SAIFI 1.13 0.62 -45% 0.63
Material/Device Failure 0.22 0.12 -47% 0.15
Foreign Interference 0.11 0.15 39% 0.08
Animal Interference 0.15 0.14 -7% 0.07
Public Interference 0.14 0.06 -56% 0.07
Miscellaneous 0.41 0.14 -66% 0.18
Utility Practice 0.11 0.02 -84% 0.06

SAIFI FTH vs No FTH – All Outages
$-
$500,000
$1,000,000
$1,500,000
$2,000,000
$2,500,000
0.0
0.5
1.0
1.5
2.0
2.5
3.0
2006 2007 2008 2009 2010 2011 2012 2013 2014
Mill
ion
so
fD
olla
rs
SAIF
I
Year
Dollars (M) FTH - All Outages No FTH - All Outages
Average Delta ‘06-’10: 0.76
Average Delta ‘11-’14: 0.23
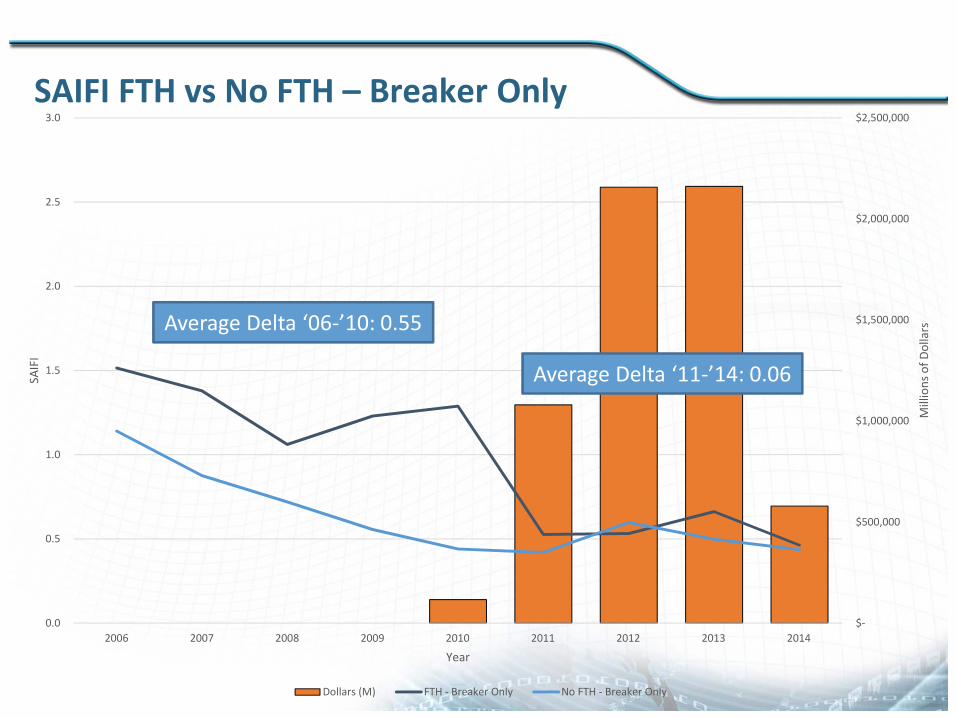
SAIFI FTH vs No FTH – Breaker Only
$-
$500,000
$1,000,000
$1,500,000
$2,000,000
$2,500,000
0.0
0.5
1.0
1.5
2.0
2.5
3.0
2006 2007 2008 2009 2010 2011 2012 2013 2014
Mill
ion
so
fD
olla
rs
SAIF
I
Year
Dollars (M) FTH - Breaker Only No FTH - Breaker Only
Average Delta ‘06-’10: 0.55
Average Delta ‘11-’14: 0.06
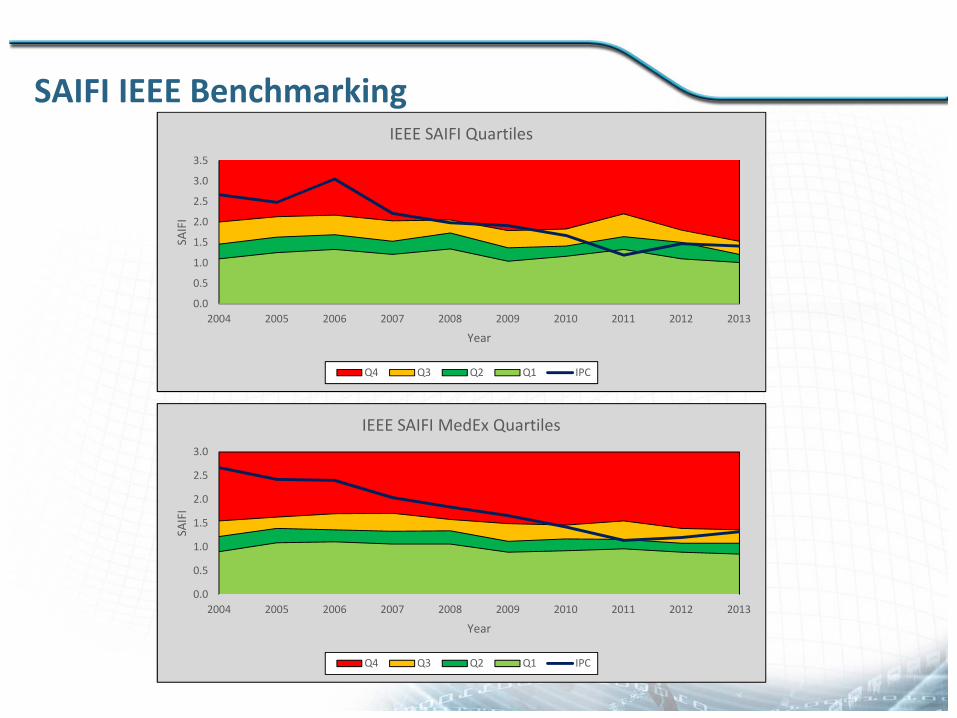
SAIFI IEEE Benchmarking
0.0
0.5
1.0
1.5
2.0
2.5
3.0
3.5
2004 2005 2006 2007 2008 2009 2010 2011 2012 2013
SAIF
I
Year
IEEE SAIFI Quartiles
Q4 Q3 Q2 Q1 IPC
0.0
0.5
1.0
1.5
2.0
2.5
3.0
2004 2005 2006 2007 2008 2009 2010 2011 2012 2013
SAIF
I
Year
IEEE SAIFI MedEx Quartiles
Q4 Q3 Q2 Q1 IPC