small-scale, semi-automated purification of ... - escholarship
TRANSCRIPT
Small-scale, semi-automated purification of eukaryotic proteinsfor structure determination
Ronnie O. Frederick Æ Lai Bergeman Æ Paul G. Blommel Æ Lucas J. Bailey Æ Jason G. McCoy ÆJikui Song Æ Louise Meske Æ Craig A. Bingman Æ Megan Riters Æ Nicholas A. Dillon ÆJohn Kunert Æ Jung Whan Yoon Æ Ahyoung Lim Æ Michael Cassidy Æ Jason Bunge ÆDavid J. Aceti Æ John G. Primm Æ John L. Markley Æ George N. Phillips Jr Æ Brian G. Fox
Received: 7 August 2007 / Accepted: 16 October 2007 / Published online: 6 November 2007
� The Author(s) 2007
Abstract A simple approach that allows cost-effective
automated purification of recombinant proteins in levels
sufficient for functional characterization or structural
studies is described. Studies with four human stem cell
proteins, an engineered version of green fluorescent pro-
tein, and other proteins are included. The method combines
an expression vector (pVP62K) that provides in vivo
cleavage of an initial fusion protein, a factorial designed
auto-induction medium that improves the performance of
small-scale production, and rapid, automated metal affinity
purification of His8-tagged proteins. For initial small-scale
production screening, single colony transformants were
grown overnight in 0.4 ml of auto-induction medium,
produced proteins were purified using the Promega Max-
well 16, and purification results were analyzed by Caliper
LC90 capillary electrophoresis. The yield of purified
[U-15N]-His8-Tcl-1 was 7.5 lg/ml of culture medium, of
purified [U-15N]-His8-GFP was 68 lg/ml, and of purified
selenomethione-labeled AIA–GFP (His8 removed by
treatment with TEV protease) was 172 lg/ml. The yield
information obtained from a successful automated purifi-
cation from 0.4 ml was used to inform the decision to
scale-up for a second meso-scale (10–50 ml) cell growth
and automated purification. 1H–15N NMR HSQC spectra of
His8-Tcl-1 and of His8-GFP prepared from 50 ml cultures
showed excellent chemical shift dispersion, consistent with
well folded states in solution suitable for structure deter-
mination. Moreover, AIA–GFP obtained by proteolytic
removal of the His8 tag was subjected to crystallization
screening, and yielded crystals under several conditions.
Single crystals were subsequently produced and optimized
by the hanging drop method. The structure was solved by
molecular replacement at a resolution of 1.7 A. This
approach provides an efficient way to carry out several key
target screening steps that are essential for successful
operation of proteomics pipelines with eukaryotic proteins:
examination of total expression, determination of proteol-
ysis of fusion tags, quantification of the yield of purified
protein, and suitability for structure determination.
Keywords Eukaryotic protein � Protein production �Protein purification � NMR � X-ray crystallography �Protein Structure Initiative � Maxwell
Introduction
The productivity of high-throughput structural genomics
endeavors is critically dependent on how efficiently the
best target proteins for structure determination can be
identified [1, 2]. This applies to natural proteins as well as
to products of engineering strategies, such as domain
subcloning [3–5], modifications of the N- and C-termini [6,
7], surface entropy reduction [8, 9], and chemical alkyl-
ation of lysines [10]. The pipeline used by most structural
genomic centers defers the evaluation of whether a target
protein is amenable for structure determination until after
the target protein has been successfully produced and
purified in quantities of tens of milligrams. This approach
R. O. Frederick � L. Bergeman � P. G. Blommel �L. J. Bailey � J. G. McCoy � J. Song � L. Meske �C. A. Bingman � M. Riters � N. A. Dillon � J. Kunert �J. W. Yoon � A. Lim � M. Cassidy � J. Bunge �D. J. Aceti � J. G. Primm � J. L. Markley �G. N. Phillips Jr � B. G. Fox (&)
The University of Wisconsin Center for Eukaryotic Structural
Genomics and Department of Biochemistry, University
of Wisconsin, Room 141B, 433 Babcock Drive, Madison,
WI 53706, USA
e-mail: [email protected]
123
J Struct Funct Genomics (2007) 8:153–166
DOI 10.1007/s10969-007-9032-5
is expensive, because many important characteristics that
determine whether a protein is suitable for structure
determination, for example its stability, whether it is well-
folded in solution, and whether it can be crystallized, only
become apparent during 1H–15N HSQC measurements [7,
11, 12] or crystallization screening [13–15], and this is
after considerable labor and resources have been expended.
Ideally, a bioinformatics evaluation would identify
proteins best suited for structure determination [16, 17], but
it is still difficult to significantly improve the output of
protein structures based on this approach alone [18, 19].
Consequently, experimental methods to identify the best
proteins are still required, and obtaining predictive results
as early in the production pipeline as possible and with
minimal labor and resources used has become a focus of
much effort [20–27].
The Center for Eukaryotic Structural Genomics (CESG)
has worked to develop simple, efficient small-scale
screening methods that successfully predict the results of
large-scale protein purification. In previous studies, we
have examined individual steps in the protein production
and structure determination process [28–31]. Recently, we
have begun to combine improvements in expression vector
engineering [32], in vivo fusion proteolysis of fusion pro-
teins [33], and factorial evolution of auto-induction
medium [33] with a bench top, automated method to pre-
pare highly purified proteins required for structural
evaluations. Here we show that this combination enables
rapid production of labeled proteins that can be used
directly in NMR and X-ray studies.
Materials and methods
Chemicals
Unless otherwise stated, bacterial growth reagents, antibi-
otics, routine laboratory chemicals, and disposable lab
supplies were from Sigma-Aldrich (St. Louis, MO), Fisher
(Pittsburgh PA) or other major distributors. L-Selenome-
thionine was from Acros (Morris Plains, NJ); [U-15N]-
NH4Cl (98%) was from Cambridge Isotope Laboratories
(Andover, MA). Preparation of standard laboratory
reagents was as previously described [34]. Deep-well
growth blocks were from Qiagen (Valencia, CA). AeraSeal
gas permeable sealing tape (T-2421-50) was from ISC
Bioexpress (Kaysville, UT).
Plasmids
Genes were cloned into the expression vectors pVP56 and
pVP62 [32, 33] using the Flexi Vector system (Promega,
Madison WI). Vector pVP56 yields a TEV protease
cleavable His8-maltose binding protein (His-MBP) fused
to the N-terminus of the protein target. Vector pVP62
yields an MBP fusion that can undergo in vivo proteolysis
to liberate a His8-tagged target protein. Selection during
cloning was provided by substitution of the gene of interest
for the toxic insert of barnase and chloramphenicol ace-
tyltransferase bounded by the SgfI and PmeI restriction
sites. Plasmids containing the lethal barnase gene must be
propagated in a barnase-resistant strain (e.g., Escherichia
coli BR610, which is available through Technical Services,
Promega Corporation).
Expression vector for in vivo proteolysis
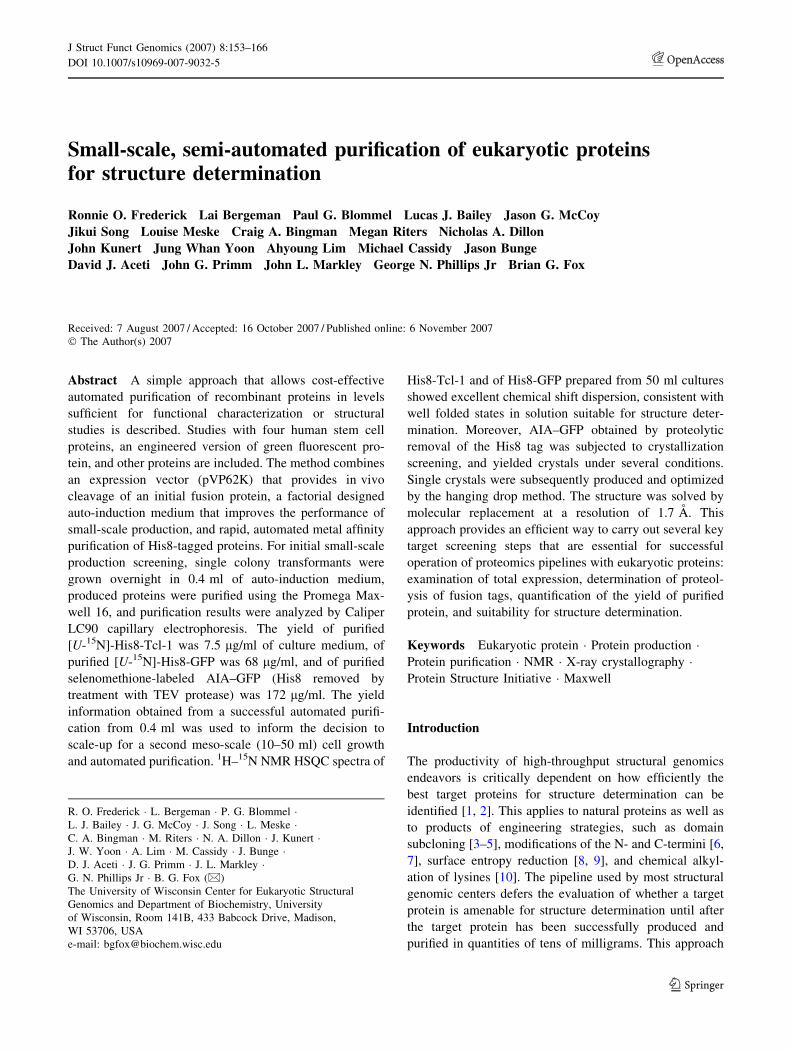
Figure 1 shows a map of the CESG expression vector
pVP62K. The vector produces an MBP-TVMV-His8-TEV-
target fusion, where MBP represents maltose binding pro-
tein, TVMV represents a tobacco vein mottling virus
protease recognition site, and where TEV represents a
tobacco etch virus protease recognition site. Genes are
cloned into the SgfI and PmeI restriction sites that bound
the Bar-CAT cassette. Self-ligation of the vector through
the SgfI and PmeI sites is reduced by the inclusion the 30
homology region [32], which is uniquely bounded by PmeI
and HindIII restriction sites. LacI is expressed from this
vector under control of the natural lac promoter [35]. The
vector reserves the AvrII and BsiWI restriction sites to
define an antibiotic resistance cassette so that the kana-
mycin resistance gene and promoter can be swapped with
other antibiotic resistance genes and promoters. The vector
also provides weak constitutive expression of TVMV
protease under control of the tet promoter [33]. The LacI,
kanamycin nucleotidyltransferase, and TVMV protease
coding regions all have a 30 transcriptional terminator to
inhibit read-through expression.
The pRARE2 plasmid for rare codon supplementation
was isolated from E. coli Rosetta2 cells (EMD Biosci-
ences/Novagen) using a Qiagen miniprep kit.
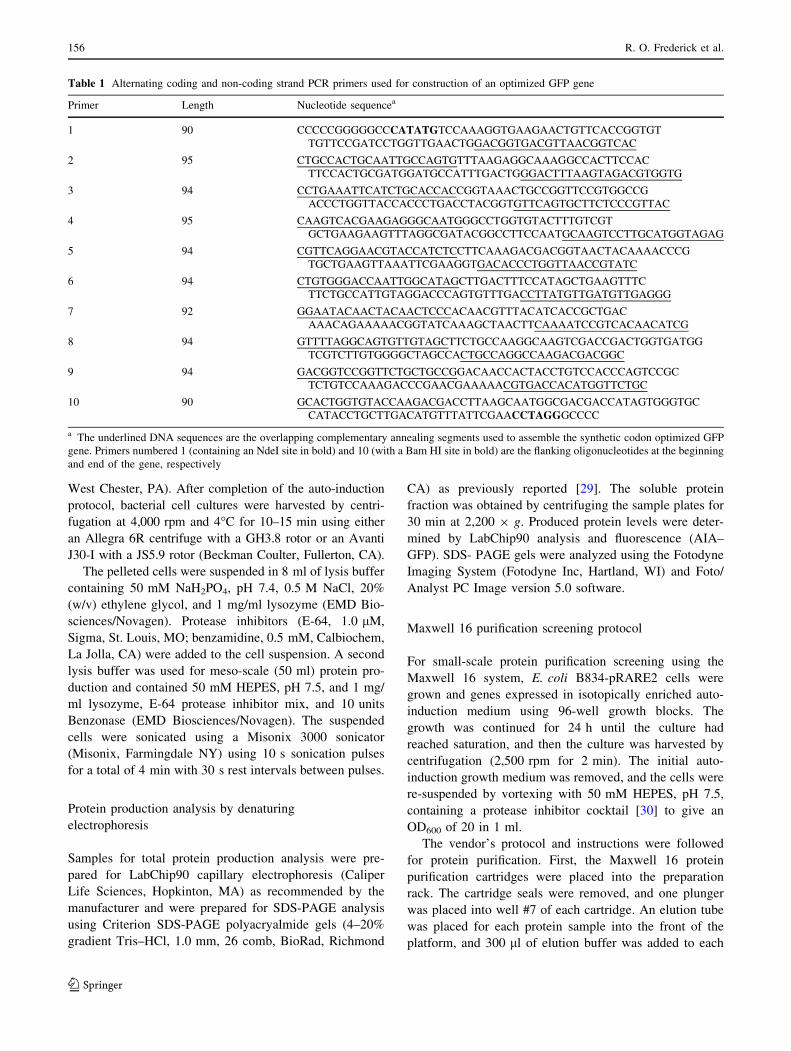
Primer design
The DNA (GCG, Madison, WI) and Lasergene (DNAStar,
Madison, WI) software were used to design and assemble
primers used for PCR and sequencing. Overlap extension
PCR [34] was used to synthesize a gene for green fluo-
rescent protein (GFP) with E. coli codon optimization and
the F64L, S65T, R81Q, F99S, M153T, and V163A muta-
tions [36–38]. ‘‘One pot’’ recursive PCR was used to carry
out de novo synthesis of the GFP gene [39–41]. Ten
ssDNA primers with lengths of 90–95 bases (Table 1)
154 R. O. Frederick et al.
123
were designed based on the coding and non-coding DNA
strands so that *20 bases at their ends overlapped with the
adjacent primers and could be extended during the recur-
sive PCR cycles. The eight internal primers (2–9 in
Table 1) were used at a concentration of 0.25 pM, and each
of the flanking primers (1, 10 in Table 1) were used at
50 pM. The recursive PCR conditions were as follows:
80�C for 5 min; then 30 cycles of 94�C for 45 s, 55�C for
1 min, and 72�C for 1 min; and a final extension step of
72�C for 20 min. PCR was performed using Deep Vent
DNA polymerase (New England Biolabs, Ipswich, MA) on
an MJ Research (Waltham, MA) Peltier Thermal Cycler.
The synthesized gene was purified using a Qiagen PCR
purification kit (Valencia, CA), digested with NdeI (New
England BioLabs) and BamHI (Promega) restriction
enzymes, and ligated into similarly digested pET9a (EMD
Biosciences/Novagen, Madison, WI) using standard
molecular biology techniques [42]. The cloned GFP gene
was subsequently used as a template for PCR amplification
to prepare the GFP gene for Flexi Vector cloning into
pVP62K [32, 33].
Bacterial expression strain
The methionine auxotroph E. coli B834 (genotype F- ompT
hsdSB(rB-mB
-) gal dcm met, [43, 44]) was transformed with
pRARE2 and used for either selenomethionine or 15N
labeling [28, 29].
Proteins investigated
Table 2 summarizes the proteins investigated in this work.
For some proteins, results from studies using a previously
described pipeline are included [29, 30].
Cell growth, protein production, and cell lysis
The methods for bacterial growth, protein production, and
analysis were described elsewhere [28–30]. For the 15N
labeling in the auto-induction medium [28], 15N Celtone
liquid (Spectra Stable Isotopes, Columbia, MD) was added
(5% v/v) to stimulate protein expression.
Target genes were screened for production at the
small-scale (0.4 ml) in 96-well growth blocks using an
auto-induction medium modified from the original [45] to
better match correlation between small- and large-scale
production [33]. Meso-scale cell cultures (10–50 ml) for
structural studies were grown as replicates in the 96-well
growth blocks or in 0.5 l baffled shaking flasks (50 ml of
medium per flask). Cells were grown for 24 h at 25�C
with shaking at *250 rpm on a microplate shaker (VWR,
Fig. 1 Expression vector pVP62K. (a) Linear map showing key
features of the vector and location of the Bar-CAT toxic cassette and
30 homology region (30-hmr) for Flexi Vector cloning. (b) Nucleotide
and encoded protein sequence in the linker region near to the SgfI
cloning site. The TVMV protease site is ETVRFQS, where proteol-
ysis occurs between the Q and S residues. The fusion protein may be
cleaved in the expression host due to the presence of a low level of
TVMV protease produced by constitutive expression from pVP62K.
The TEV protease site is ENLYFQA, where proteolysis occurs
between the Q and A residues. After purification of the His8-tagged
protein, the His8 tag can be removed by treatment with TEV protease
to release an N-terminal AIA-target
Rapid purification of human stem cell proteins 155
123
West Chester, PA). After completion of the auto-induction
protocol, bacterial cell cultures were harvested by centri-
fugation at 4,000 rpm and 4�C for 10–15 min using either
an Allegra 6R centrifuge with a GH3.8 rotor or an Avanti
J30-I with a JS5.9 rotor (Beckman Coulter, Fullerton, CA).
The pelleted cells were suspended in 8 ml of lysis buffer
containing 50 mM NaH2PO4, pH 7.4, 0.5 M NaCl, 20%
(w/v) ethylene glycol, and 1 mg/ml lysozyme (EMD Bio-
sciences/Novagen). Protease inhibitors (E-64, 1.0 lM,
Sigma, St. Louis, MO; benzamidine, 0.5 mM, Calbiochem,
La Jolla, CA) were added to the cell suspension. A second
lysis buffer was used for meso-scale (50 ml) protein pro-
duction and contained 50 mM HEPES, pH 7.5, and 1 mg/
ml lysozyme, E-64 protease inhibitor mix, and 10 units
Benzonase (EMD Biosciences/Novagen). The suspended
cells were sonicated using a Misonix 3000 sonicator
(Misonix, Farmingdale NY) using 10 s sonication pulses
for a total of 4 min with 30 s rest intervals between pulses.
Protein production analysis by denaturing
electrophoresis
Samples for total protein production analysis were pre-
pared for LabChip90 capillary electrophoresis (Caliper
Life Sciences, Hopkinton, MA) as recommended by the
manufacturer and were prepared for SDS-PAGE analysis
using Criterion SDS-PAGE polyacryalmide gels (4–20%
gradient Tris–HCl, 1.0 mm, 26 comb, BioRad, Richmond
CA) as previously reported [29]. The soluble protein
fraction was obtained by centrifuging the sample plates for
30 min at 2,200 9 g. Produced protein levels were deter-
mined by LabChip90 analysis and fluorescence (AIA–
GFP). SDS- PAGE gels were analyzed using the Fotodyne
Imaging System (Fotodyne Inc, Hartland, WI) and Foto/
Analyst PC Image version 5.0 software.
Maxwell 16 purification screening protocol
For small-scale protein purification screening using the
Maxwell 16 system, E. coli B834-pRARE2 cells were
grown and genes expressed in isotopically enriched auto-
induction medium using 96-well growth blocks. The
growth was continued for 24 h until the culture had
reached saturation, and then the culture was harvested by
centrifugation (2,500 rpm for 2 min). The initial auto-
induction growth medium was removed, and the cells were
re-suspended by vortexing with 50 mM HEPES, pH 7.5,
containing a protease inhibitor cocktail [30] to give an
OD600 of 20 in 1 ml.
The vendor’s protocol and instructions were followed
for protein purification. First, the Maxwell 16 protein
purification cartridges were placed into the preparation
rack. The cartridge seals were removed, and one plunger
was placed into well #7 of each cartridge. An elution tube
was placed for each protein sample into the front of the
platform, and 300 ll of elution buffer was added to each
Table 1 Alternating coding and non-coding strand PCR primers used for construction of an optimized GFP gene
Primer Length Nucleotide sequencea
1 90 CCCCCGGGGGCCCATATGTCCAAAGGTGAAGAACTGTTCACCGGTGT
TGTTCCGATCCTGGTTGAACTGGACGGTGACGTTAACGGTCAC
2 95 CTGCCACTGCAATTGCCAGTGTTTAAGAGGCAAAGGCCACTTCCAC
TTCCACTGCGATGGATGCCATTTGACTGGGACTTTAAGTAGACGTGGTG
3 94 CCTGAAATTCATCTGCACCACCGGTAAACTGCCGGTTCCGTGGCCG
ACCCTGGTTACCACCCTGACCTACGGTGTTCAGTGCTTCTCCCGTTAC
4 95 CAAGTCACGAAGAGGGCAATGGGCCTGGTGTACTTTGTCGT
GCTGAAGAAGTTTAGGCGATACGGCCTTCCAATGCAAGTCCTTGCATGGTAGAG
5 94 CGTTCAGGAACGTACCATCTCCTTCAAAGACGACGGTAACTACAAAACCCG
TGCTGAAGTTAAATTCGAAGGTGACACCCTGGTTAACCGTATC
6 94 CTGTGGGACCAATTGGCATAGCTTGACTTTCCATAGCTGAAGTTTC
TTCTGCCATTGTAGGACCCAGTGTTTGACCTTATGTTGATGTTGAGGG
7 92 GGAATACAACTACAACTCCCACAACGTTTACATCACCGCTGAC
AAACAGAAAAACGGTATCAAAGCTAACTTCAAAATCCGTCACAACATCG
8 94 GTTTTAGGCAGTGTTGTAGCTTCTGCCAAGGCAAGTCGACCGACTGGTGATGG
TCGTCTTGTGGGGCTAGCCACTGCCAGGCCAAGACGACGGC
9 94 GACGGTCCGGTTCTGCTGCCGGACAACCACTACCTGTCCACCCAGTCCGC
TCTGTCCAAAGACCCGAACGAAAAACGTGACCACATGGTTCTGC
10 90 GCACTGGTGTACCAAGACGACCTTAAGCAATGGCGACGACCATAGTGGGTGC
CATACCTGCTTGACATGTTTATTCGAACCTAGGGCCCC
a The underlined DNA sequences are the overlapping complementary annealing segments used to assemble the synthetic codon optimized GFP
gene. Primers numbered 1 (containing an NdeI site in bold) and 10 (with a Bam HI site in bold) are the flanking oligonucleotides at the beginning
and end of the gene, respectively
156 R. O. Frederick et al.
123
elution tube. Aliquots of the re-suspended cells were
transferred into well #1 of the Maxwell 16 purification
cartridge, which also contained 109 Promega chemical
lysis buffer, and the purification protocol was started. The
Maxwell 16 system required 45 min to complete the
purification run. The final purified proteins were removed
from the elution cuvettes and analyzed by denaturing SDS-
PAGE using either BioRad Criterion SDS-PAGE gels (4–
20% gradient Tris–HCl) or the Caliper LC90 system.
Purification of Tcl-1 for NMR studies
A 50 ml (meso-scale) overnight culture (OD600 equal 10)
expressing Tcl-1 was harvested by centrifugation, and
re-suspended in *10 ml of 50 mM HEPES pH 7.5, with
protease inhibitor cocktail [30], 10 units of Benzonase
(EMD Biosciences/Novagen) to hydrolyze nucleic acids,
and 1 mg/ml of lysozyme to reduce the viscosity of the
lysate. The cell suspension was sonicated using a Sonic
Dismembrator 550 (Fisher Scientific) programmed to run
10 s sonication pulses for a total of 5 min (with 20 s rest
stops). Aliquots of the unclarified cell lysate (1 ml) were
applied to well #1 of each lane of the Maxwell 16 cartridge,
which also contained the chemical lysis buffer. The Max-
well 16 protocol for His-tagged proteins was run, and the
purified His8-tagged protein samples from each lane were
pooled. The final purified protein was exchanged into NMR
screening buffer (10 mM KHPO4, 50 mM KCl, 0.2%
NaN3, pH 7.0) and concentrated to a final volume of 0.5 ml
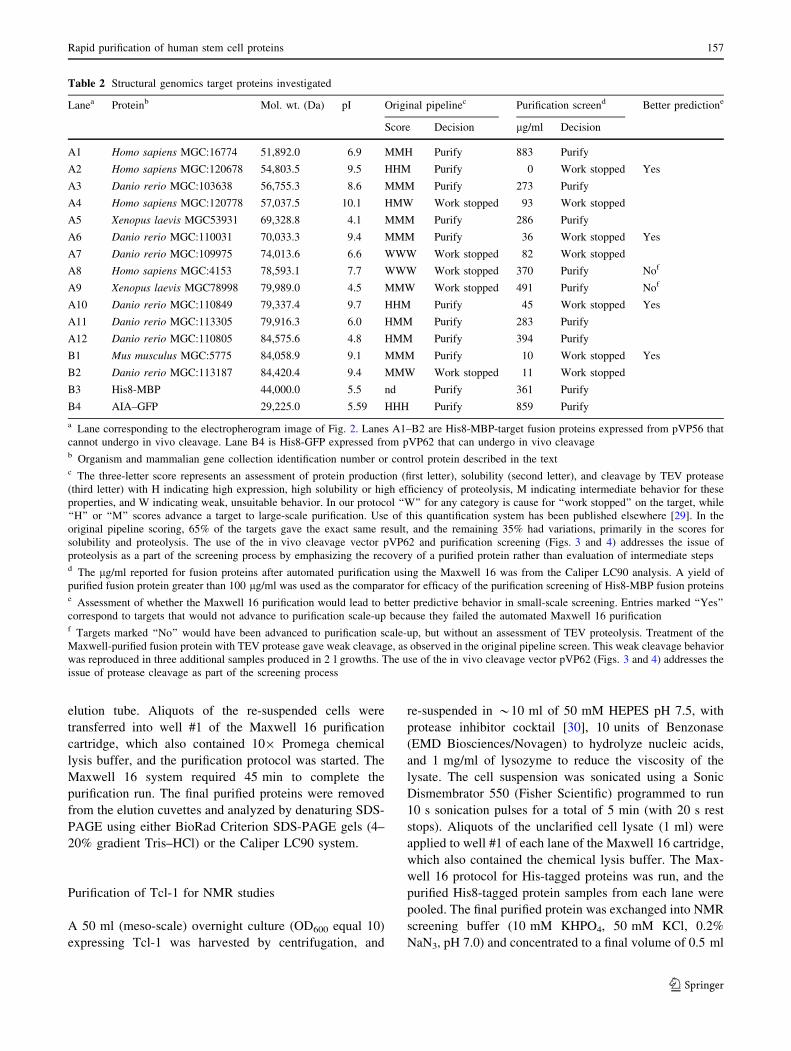
Table 2 Structural genomics target proteins investigated
Lanea Proteinb Mol. wt. (Da) pI Original pipelinec Purification screend Better predictione
Score Decision lg/ml Decision
A1 Homo sapiens MGC:16774 51,892.0 6.9 MMH Purify 883 Purify
A2 Homo sapiens MGC:120678 54,803.5 9.5 HHM Purify 0 Work stopped Yes
A3 Danio rerio MGC:103638 56,755.3 8.6 MMM Purify 273 Purify
A4 Homo sapiens MGC:120778 57,037.5 10.1 HMW Work stopped 93 Work stopped
A5 Xenopus laevis MGC53931 69,328.8 4.1 MMM Purify 286 Purify
A6 Danio rerio MGC:110031 70,033.3 9.4 MMM Purify 36 Work stopped Yes
A7 Danio rerio MGC:109975 74,013.6 6.6 WWW Work stopped 82 Work stopped
A8 Homo sapiens MGC:4153 78,593.1 7.7 WWW Work stopped 370 Purify Nof
A9 Xenopus laevis MGC78998 79,989.0 4.5 MMW Work stopped 491 Purify Nof
A10 Danio rerio MGC:110849 79,337.4 9.7 HHM Purify 45 Work stopped Yes
A11 Danio rerio MGC:113305 79,916.3 6.0 HMM Purify 283 Purify
A12 Danio rerio MGC:110805 84,575.6 4.8 HMM Purify 394 Purify
B1 Mus musculus MGC:5775 84,058.9 9.1 MMM Purify 10 Work stopped Yes
B2 Danio rerio MGC:113187 84,420.4 9.4 MMW Work stopped 11 Work stopped
B3 His8-MBP 44,000.0 5.5 nd Purify 361 Purify
B4 AIA–GFP 29,225.0 5.59 HHH Purify 859 Purify
a Lane corresponding to the electropherogram image of Fig. 2. Lanes A1–B2 are His8-MBP-target fusion proteins expressed from pVP56 that
cannot undergo in vivo cleavage. Lane B4 is His8-GFP expressed from pVP62 that can undergo in vivo cleavageb Organism and mammalian gene collection identification number or control protein described in the textc The three-letter score represents an assessment of protein production (first letter), solubility (second letter), and cleavage by TEV protease
(third letter) with H indicating high expression, high solubility or high efficiency of proteolysis, M indicating intermediate behavior for these
properties, and W indicating weak, unsuitable behavior. In our protocol ‘‘W’’ for any category is cause for ‘‘work stopped’’ on the target, while
‘‘H’’ or ‘‘M’’ scores advance a target to large-scale purification. Use of this quantification system has been published elsewhere [29]. In the
original pipeline scoring, 65% of the targets gave the exact same result, and the remaining 35% had variations, primarily in the scores for
solubility and proteolysis. The use of the in vivo cleavage vector pVP62 and purification screening (Figs. 3 and 4) addresses the issue of
proteolysis as a part of the screening process by emphasizing the recovery of a purified protein rather than evaluation of intermediate stepsd The lg/ml reported for fusion proteins after automated purification using the Maxwell 16 was from the Caliper LC90 analysis. A yield of
purified fusion protein greater than 100 lg/ml was used as the comparator for efficacy of the purification screening of His8-MBP fusion proteinse Assessment of whether the Maxwell 16 purification would lead to better predictive behavior in small-scale screening. Entries marked ‘‘Yes’’
correspond to targets that would not advance to purification scale-up because they failed the automated Maxwell 16 purificationf Targets marked ‘‘No’’ would have been advanced to purification scale-up, but without an assessment of TEV proteolysis. Treatment of the
Maxwell-purified fusion protein with TEV protease gave weak cleavage, as observed in the original pipeline screen. This weak cleavage behavior
was reproduced in three additional samples produced in 2 l growths. The use of the in vivo cleavage vector pVP62 (Figs. 3 and 4) addresses the
issue of protease cleavage as part of the screening process
Rapid purification of human stem cell proteins 157
123
using Millipore Amicon filtration devices. The total yield
of the [U-15N]-Tcl-1 was *0.4 mg.
Purification of GFP for NMR and X-ray studies
A 50 ml cell culture grown with auto-induction for 24 h
(OD600 equal to 10) with the appropriate isotopic label was
harvested by centrifugation, resuspended in 8–12 ml of
50 mM HEPES, pH 7.5, with protease inhibitors, benzon-
ase, and 1 mg/ml of lysozyme, and sonicated as above.
Aliquots (1 ml) of the unclarified cell lysate were applied
to well #1 of eight lanes of the Maxwell 16 cartridge prior
to the purification run. [U-15N]-His8-GFP and [Se-Met]-
labeled His8-GFP purified in this manner were each
exchanged into the appropriate NMR [28] or X-ray [30]
screening buffer, and concentrated to final volumes of
0.5 ml. The yield of the 15N labeled His8-GFP was 3.4 mg
from 50 ml of cell culture. The purified [Se-Met]-His8-
GFP was treated subsequently with TEV protease [46] to
remove the His8 tag; the His8 tag and His8-tagged TEV
protease were removed by treatment with MagneHis par-
ticles; the buffer was exchanged, and the purified protein
was concentrated to a final volume of 0.5 ml. The yield of
selenomethionine labeled AIA–GFP was 2.8 mg.
Protein characterization
Purified proteins were analyzed by denaturing electropho-
resis in the buffer described above. Concentrations were
determined using the Caliper LC90 software and the BCA
method (Pierce, Rockford IL). The masses of the purified
[U-15N]- and [Se-Met]-labeled proteins were determined in
the University of Wisconsin Biotechnology Center by
electrospray ionization mass spectrometry using an
Applied Biosystems/MDS Sciex API 365 LC/MS/MS tri-
ple quadrupole mass spectrometer (Applied Biosystems,
Foster City, CA, USA). The labeling efficiency was cal-
culated from the experimentally determined and calculated
molecular weights of the protein. Protein identification was
carried out by tryptic proteolysis and molecular weight
assignment of generated peptides using a Bruker BIFLEX
III MALDI-TOF spectrometer (Bruker Daltonics, Billerica,
MA, USA).
1H–15N HSQC NMR
2D 1H–15N HSQC spectra were acquired for [U-15N]-
labeled Tcl-1 and [U-15N]-labeled GFP at the National
Magnetic Resonance Facility at Madison (NMRFAM) on
600 and 750 MHz Bruker spectrometers equipped with
cryogenic 1H, 15N, 13C triple-resonance probes. The sam-
ple temperature was regulated at 35�C. The NMR spectra
consisted of 1,024 and 100–110 complex data points,
respectively for 1H and 15N. For each increment, 128 scans
were used for [U-15N]-labeled Tcl-1, and 16 scans were
used for [U-15N]-labeled GFP.
Crystallization of AIA–GFP
AIA–GFP was screened initially using the UW192 screen.
From this screen, crystals were observed within 2 days
from five different conditions. One condition was opti-
mized for structure determination.
AIA–GFP crystals were grown by hanging drop vapor
diffusion. The crystals reached a size of
*0.1 9 0.1 9 1 mm rods in approximately 3 days at
25�C in a mother liquor consisting of 100 mM HEPPS, pH
8.5, 80 mM CaCl2, and 15% PEG 4K. Hanging drops
consisted of 2.5 ll of protein solution and 2.5 ll of mother
liquor. Crystals were soaked in mother liquor containing
increasing amounts of glycerol to a final concentration of
20% and flash cooled in a stream of liquid nitrogen. X-ray
diffraction data were collected on a BrukerAXS PROTE-
UM R (BrukerAXS, Madison, WI) diffractometer at -
180�C using CuKa radiation from a MicroStar (Bruke-
rAXS, Madison, WI) source with a rotating anode
generator operated at 44 kV and 45 mA. The X-ray data
were processed and scaled with PROTEUM 2 (Bruke-
rAXS, Madison, WI). The structure of GFP was solved by
molecular replacement using PDB 2g6e as the rotation
target with MOLREP from the CCP4 suite [47]. The model
was built with alternating cycles of model building and
refinement with COOT [48] and REFMAC [49]. Coordi-
nates and structure factors were deposited in the Protein
Data Bank with accession number 2qu1.
Results
Met auxotrophy in E. coli B834
The strain E. coli B834 is frequently used for selenome-
thionine labeling [50]. It is a conditional methionine
auxotroph that can be complemented by the addition of
vitamin B12. The exact cause of the auxotrophy was not
known, but some believed that MetB was inactive [43],
while others thought that MetE was [45]. To better define
the origin of the auxotrophy, genomic DNA was isolated,
and the regions around the metE gene (GeneBank acces-
sion number DQ267751, encoding vitamin B12-
independent homocysteine transmethylase) and the metH
gene (GeneBank accession number DQ272318, encoding
158 R. O. Frederick et al.
123
vitamin B12-dependent homocysteine transmethylase) were
sequenced.
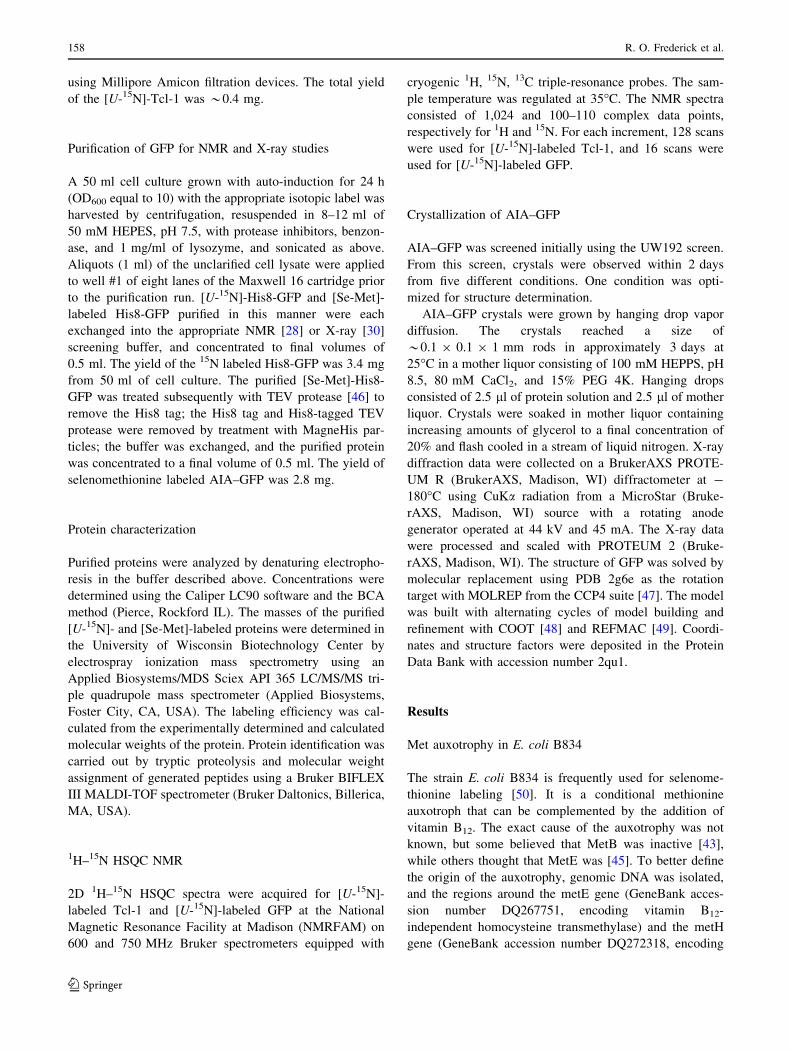
Figure 2 shows the genome arrangement near to the
metE gene in E. coli K12 (capable of growth in the absence
of vitamin B12) and E. coli B834. DNA sequencing
revealed that E. coli B834 metE was truncated from 753
amino acids to an inactive 56-residue peptide by insertion
of a premature stop codon (TGA) and a DNA sequence
with homology to several genes previously identified from
the uropathogen E. coli CFT073 [52]. By contrast, the
sequence of the metH gene in E. coli B834 was intact and
matched (data not shown) the E. coli K12 gene [51]. Thus
methionine auxotrophy in E. coli B834 arises from dis-
ruption of the metE gene.
Proteins studied
Table 1 summarizes the primers used to synthesize the
modified GFP used in these studies. Other genes used in
this work were cloned as previously described [32], and
their properties are summarized in Tables 2 and 3. Results
from small-scale expression screening using a previously
described pipeline [29, 30] are included in Table 2, where
the score is an assessment of expression, solubility of the
fusion protein, and the ability of TEV protease to release
the target from the fusion protein. For example, human
MGC:16774 from lane A1 has a score of MMH for med-
ium protein production, medium solubility, and high
protease cleavage. By this assessment, this protein would
be suitable for purification scale-up. In contrast, human
MGC:120778 from lane A4 has a score HMW for high
production, medium solubility, and weak protease cleav-
age. This protein would not be suitable for purification
scale-up, because according to this protocol as any score of
W leads to ‘‘work stopped’’.
Maxwell 16 purification screening
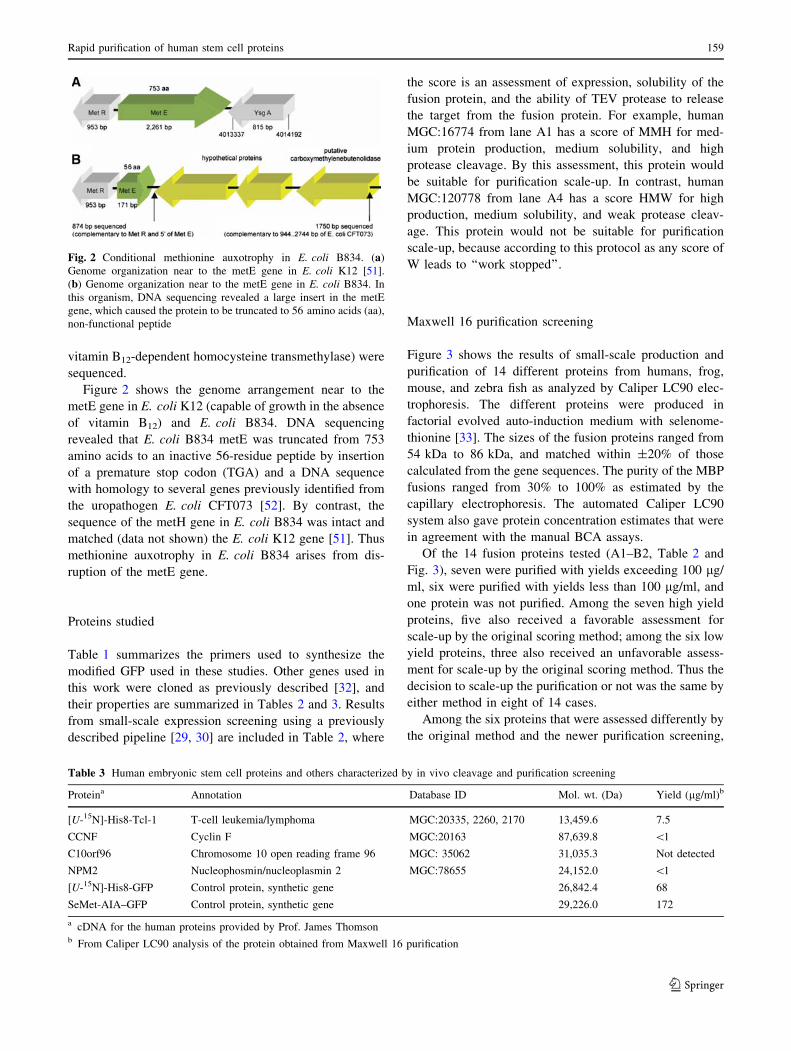
Figure 3 shows the results of small-scale production and
purification of 14 different proteins from humans, frog,
mouse, and zebra fish as analyzed by Caliper LC90 elec-
trophoresis. The different proteins were produced in
factorial evolved auto-induction medium with selenome-
thionine [33]. The sizes of the fusion proteins ranged from
54 kDa to 86 kDa, and matched within ±20% of those
calculated from the gene sequences. The purity of the MBP
fusions ranged from 30% to 100% as estimated by the
capillary electrophoresis. The automated Caliper LC90
system also gave protein concentration estimates that were
in agreement with the manual BCA assays.
Of the 14 fusion proteins tested (A1–B2, Table 2 and
Fig. 3), seven were purified with yields exceeding 100 lg/
ml, six were purified with yields less than 100 lg/ml, and
one protein was not purified. Among the seven high yield
proteins, five also received a favorable assessment for
scale-up by the original scoring method; among the six low
yield proteins, three also received an unfavorable assess-
ment for scale-up by the original scoring method. Thus the
decision to scale-up the purification or not was the same by
either method in eight of 14 cases.
Among the six proteins that were assessed differently by
the original method and the newer purification screening,
Fig. 2 Conditional methionine auxotrophy in E. coli B834. (a)
Genome organization near to the metE gene in E. coli K12 [51].
(b) Genome organization near to the metE gene in E. coli B834. In
this organism, DNA sequencing revealed a large insert in the metE
gene, which caused the protein to be truncated to 56 amino acids (aa),
non-functional peptide
Table 3 Human embryonic stem cell proteins and others characterized by in vivo cleavage and purification screening
Proteina Annotation Database ID Mol. wt. (Da) Yield (lg/ml)b
[U-15N]-His8-Tcl-1 T-cell leukemia/lymphoma MGC:20335, 2260, 2170 13,459.6 7.5
CCNF Cyclin F MGC:20163 87,639.8 \1
C10orf96 Chromosome 10 open reading frame 96 MGC: 35062 31,035.3 Not detected
NPM2 Nucleophosmin/nucleoplasmin 2 MGC:78655 24,152.0 \1
[U-15N]-His8-GFP Control protein, synthetic gene 26,842.4 68
SeMet-AIA–GFP Control protein, synthetic gene 29,226.0 172
a cDNA for the human proteins provided by Prof. James Thomsonb From Caliper LC90 analysis of the protein obtained from Maxwell 16 purification
Rapid purification of human stem cell proteins 159
123
there were two outcomes. One outcome, exemplified by
A2, A6, A10, and B1, were proteins that had a favorable
score by the original method, but that were not purified in
yield [100 lg/ml by the newer purification screening
protocol. Use of purification screening would eliminate
unnecessary scale-up effort for a class of proteins that
ultimately fail in purification. The other outcome, exem-
plified by A8 and A9, was a successful purification of a
large amount of protein when the work would have been
stopped by the original method. Since the results of Fig. 3
with A8 and A9 do not include a proteolysis step, the
original screen provided additional information suggesting
that these targets would ultimately fail in purification
because they had an unsuitable W score for proteolysis.
Indeed, when A8 and A9 obtained from the Maxwell were
treated with TEV protease, neither target was successfully
liberated from the fusion protein.
In order to address this deficiency in the purification
screening, we developed an in vivo cleavage expression
vector to couple with the Maxwell 16 purification system.
The assembly of this vector and results of using this
combination for purification screening of human embry-
onic stem cell proteins is described in the following
sections.
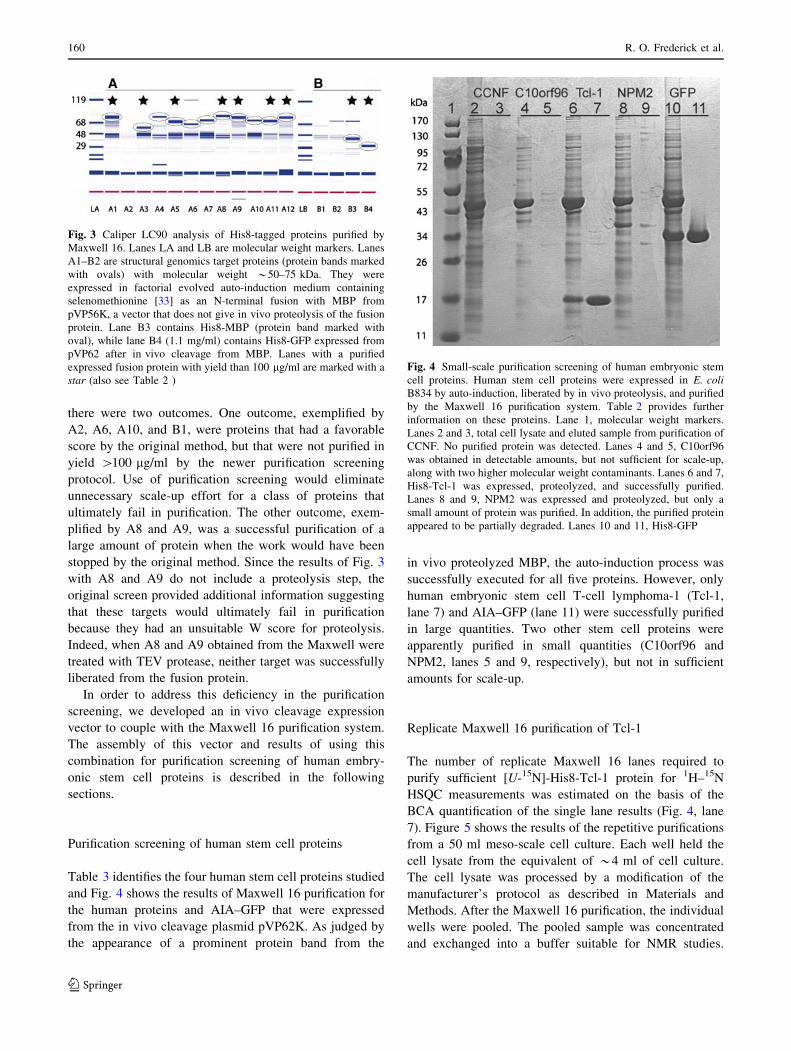
Purification screening of human stem cell proteins
Table 3 identifies the four human stem cell proteins studied
and Fig. 4 shows the results of Maxwell 16 purification for
the human proteins and AIA–GFP that were expressed
from the in vivo cleavage plasmid pVP62K. As judged by
the appearance of a prominent protein band from the
in vivo proteolyzed MBP, the auto-induction process was
successfully executed for all five proteins. However, only
human embryonic stem cell T-cell lymphoma-1 (Tcl-1,
lane 7) and AIA–GFP (lane 11) were successfully purified
in large quantities. Two other stem cell proteins were
apparently purified in small quantities (C10orf96 and
NPM2, lanes 5 and 9, respectively), but not in sufficient
amounts for scale-up.
Replicate Maxwell 16 purification of Tcl-1
The number of replicate Maxwell 16 lanes required to
purify sufficient [U-15N]-His8-Tcl-1 protein for 1H–15N
HSQC measurements was estimated on the basis of the
BCA quantification of the single lane results (Fig. 4, lane
7). Figure 5 shows the results of the repetitive purifications
from a 50 ml meso-scale cell culture. Each well held the
cell lysate from the equivalent of *4 ml of cell culture.
The cell lysate was processed by a modification of the
manufacturer’s protocol as described in Materials and
Methods. After the Maxwell 16 purification, the individual
wells were pooled. The pooled sample was concentrated
and exchanged into a buffer suitable for NMR studies.
Fig. 3 Caliper LC90 analysis of His8-tagged proteins purified by
Maxwell 16. Lanes LA and LB are molecular weight markers. Lanes
A1–B2 are structural genomics target proteins (protein bands marked
with ovals) with molecular weight *50–75 kDa. They were
expressed in factorial evolved auto-induction medium containing
selenomethionine [33] as an N-terminal fusion with MBP from
pVP56K, a vector that does not give in vivo proteolysis of the fusion
protein. Lane B3 contains His8-MBP (protein band marked with
oval), while lane B4 (1.1 mg/ml) contains His8-GFP expressed from
pVP62 after in vivo cleavage from MBP. Lanes with a purified
expressed fusion protein with yield than 100 lg/ml are marked with a
star (also see Table 2 )
Fig. 4 Small-scale purification screening of human embryonic stem
cell proteins. Human stem cell proteins were expressed in E. coliB834 by auto-induction, liberated by in vivo proteolysis, and purified
by the Maxwell 16 purification system. Table 2 provides further
information on these proteins. Lane 1, molecular weight markers.
Lanes 2 and 3, total cell lysate and eluted sample from purification of
CCNF. No purified protein was detected. Lanes 4 and 5, C10orf96
was obtained in detectable amounts, but not sufficient for scale-up,
along with two higher molecular weight contaminants. Lanes 6 and 7,
His8-Tcl-1 was expressed, proteolyzed, and successfully purified.
Lanes 8 and 9, NPM2 was expressed and proteolyzed, but only a
small amount of protein was purified. In addition, the purified protein
appeared to be partially degraded. Lanes 10 and 11, His8-GFP
160 R. O. Frederick et al.
123
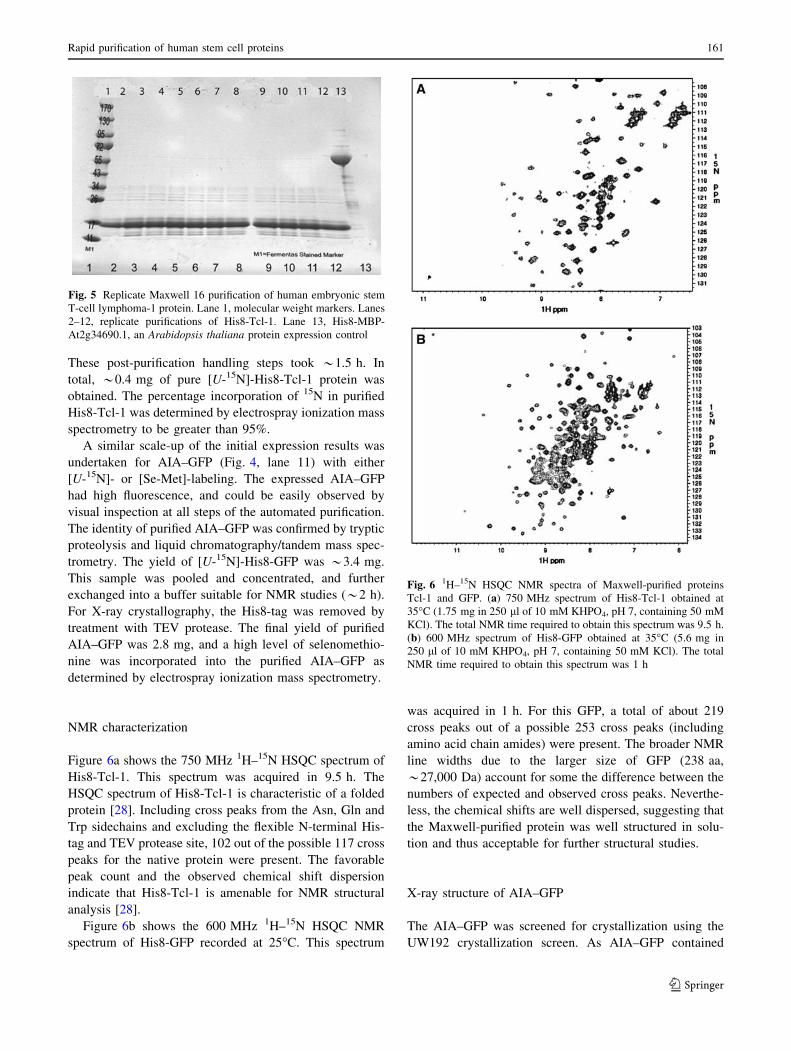
These post-purification handling steps took *1.5 h. In
total, *0.4 mg of pure [U-15N]-His8-Tcl-1 protein was
obtained. The percentage incorporation of 15N in purified
His8-Tcl-1 was determined by electrospray ionization mass
spectrometry to be greater than 95%.
A similar scale-up of the initial expression results was
undertaken for AIA–GFP (Fig. 4, lane 11) with either
[U-15N]- or [Se-Met]-labeling. The expressed AIA–GFP
had high fluorescence, and could be easily observed by
visual inspection at all steps of the automated purification.
The identity of purified AIA–GFP was confirmed by tryptic
proteolysis and liquid chromatography/tandem mass spec-
trometry. The yield of [U-15N]-His8-GFP was *3.4 mg.
This sample was pooled and concentrated, and further
exchanged into a buffer suitable for NMR studies (*2 h).
For X-ray crystallography, the His8-tag was removed by
treatment with TEV protease. The final yield of purified
AIA–GFP was 2.8 mg, and a high level of selenomethio-
nine was incorporated into the purified AIA–GFP as
determined by electrospray ionization mass spectrometry.
NMR characterization
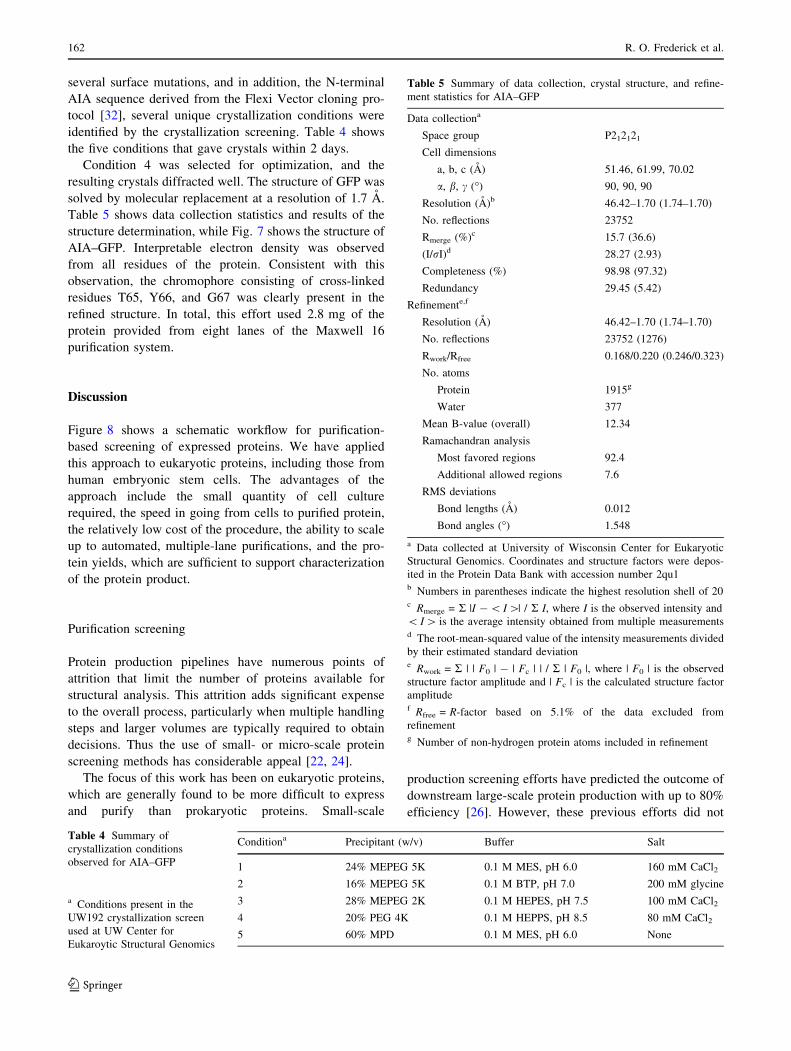
Figure 6a shows the 750 MHz 1H–15N HSQC spectrum of
His8-Tcl-1. This spectrum was acquired in 9.5 h. The
HSQC spectrum of His8-Tcl-1 is characteristic of a folded
protein [28]. Including cross peaks from the Asn, Gln and
Trp sidechains and excluding the flexible N-terminal His-
tag and TEV protease site, 102 out of the possible 117 cross
peaks for the native protein were present. The favorable
peak count and the observed chemical shift dispersion
indicate that His8-Tcl-1 is amenable for NMR structural
analysis [28].
Figure 6b shows the 600 MHz 1H–15N HSQC NMR
spectrum of His8-GFP recorded at 25�C. This spectrum
was acquired in 1 h. For this GFP, a total of about 219
cross peaks out of a possible 253 cross peaks (including
amino acid chain amides) were present. The broader NMR
line widths due to the larger size of GFP (238 aa,
*27,000 Da) account for some the difference between the
numbers of expected and observed cross peaks. Neverthe-
less, the chemical shifts are well dispersed, suggesting that
the Maxwell-purified protein was well structured in solu-
tion and thus acceptable for further structural studies.
X-ray structure of AIA–GFP
The AIA–GFP was screened for crystallization using the
UW192 crystallization screen. As AIA–GFP contained
Fig. 5 Replicate Maxwell 16 purification of human embryonic stem
T-cell lymphoma-1 protein. Lane 1, molecular weight markers. Lanes
2–12, replicate purifications of His8-Tcl-1. Lane 13, His8-MBP-
At2g34690.1, an Arabidopsis thaliana protein expression control
Fig. 6 1H–15N HSQC NMR spectra of Maxwell-purified proteins
Tcl-1 and GFP. (a) 750 MHz spectrum of His8-Tcl-1 obtained at
35�C (1.75 mg in 250 ll of 10 mM KHPO4, pH 7, containing 50 mM
KCl). The total NMR time required to obtain this spectrum was 9.5 h.
(b) 600 MHz spectrum of His8-GFP obtained at 35�C (5.6 mg in
250 ll of 10 mM KHPO4, pH 7, containing 50 mM KCl). The total
NMR time required to obtain this spectrum was 1 h
Rapid purification of human stem cell proteins 161
123
several surface mutations, and in addition, the N-terminal
AIA sequence derived from the Flexi Vector cloning pro-
tocol [32], several unique crystallization conditions were
identified by the crystallization screening. Table 4 shows
the five conditions that gave crystals within 2 days.
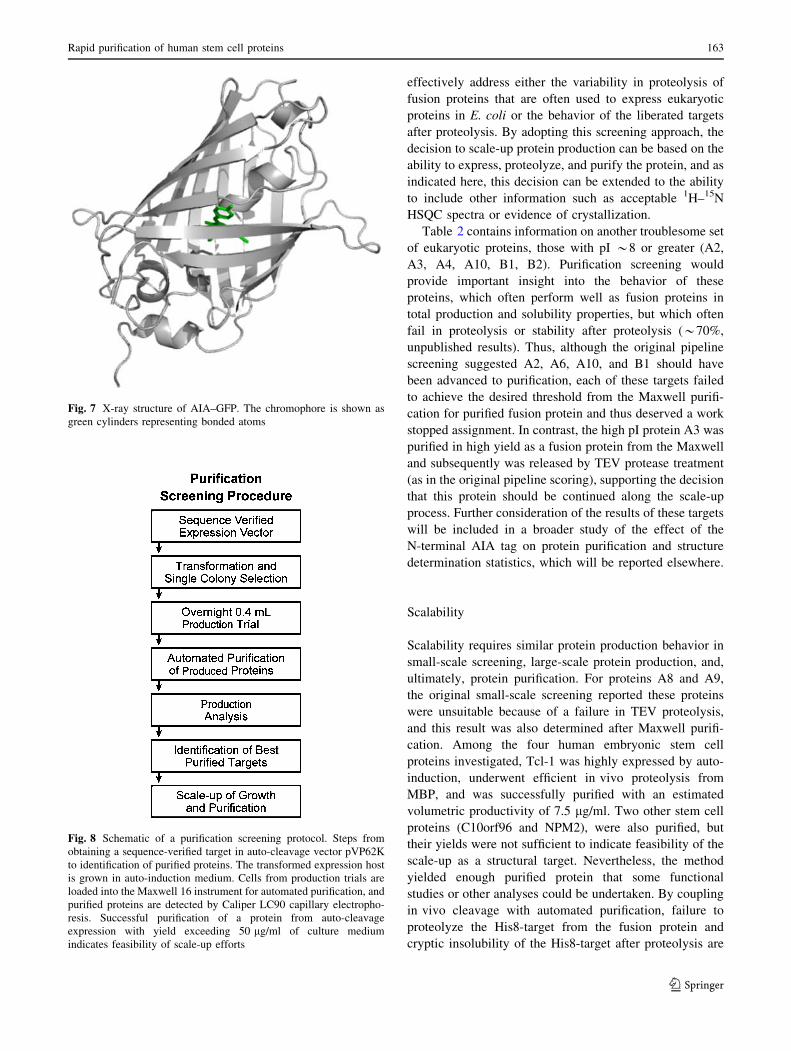
Condition 4 was selected for optimization, and the
resulting crystals diffracted well. The structure of GFP was
solved by molecular replacement at a resolution of 1.7 A.
Table 5 shows data collection statistics and results of the
structure determination, while Fig. 7 shows the structure of
AIA–GFP. Interpretable electron density was observed
from all residues of the protein. Consistent with this
observation, the chromophore consisting of cross-linked
residues T65, Y66, and G67 was clearly present in the
refined structure. In total, this effort used 2.8 mg of the
protein provided from eight lanes of the Maxwell 16
purification system.
Discussion
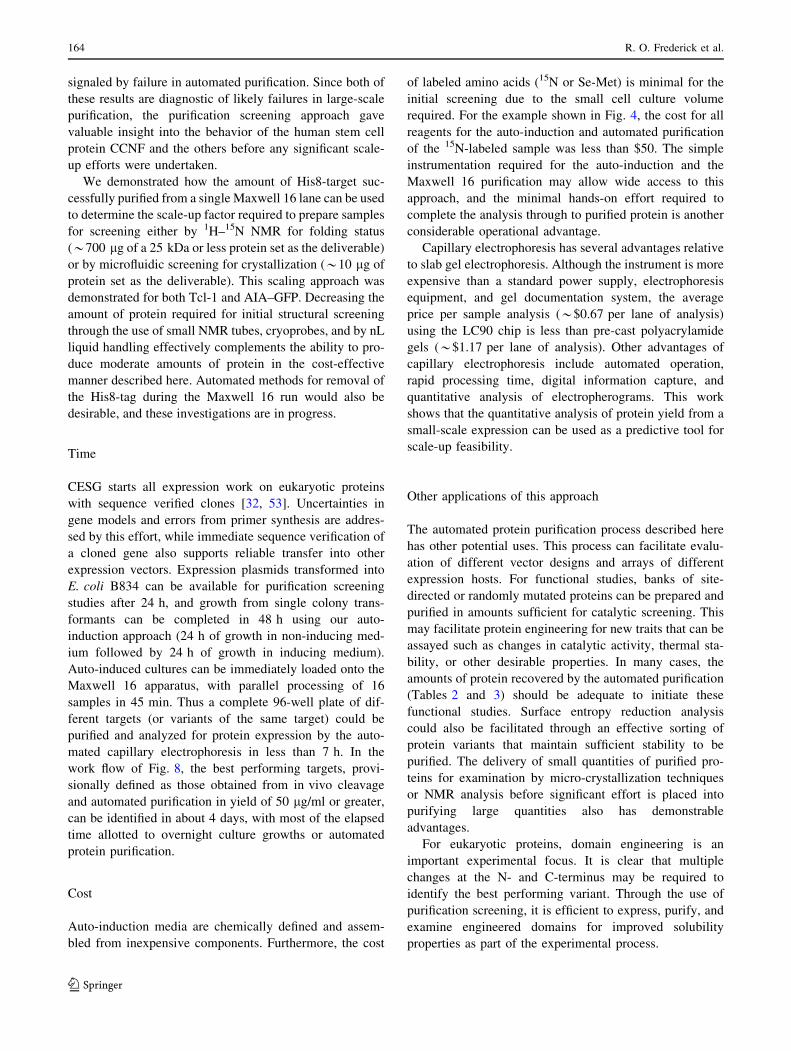
Figure 8 shows a schematic workflow for purification-
based screening of expressed proteins. We have applied
this approach to eukaryotic proteins, including those from
human embryonic stem cells. The advantages of the
approach include the small quantity of cell culture
required, the speed in going from cells to purified protein,
the relatively low cost of the procedure, the ability to scale
up to automated, multiple-lane purifications, and the pro-
tein yields, which are sufficient to support characterization
of the protein product.
Purification screening
Protein production pipelines have numerous points of
attrition that limit the number of proteins available for
structural analysis. This attrition adds significant expense
to the overall process, particularly when multiple handling
steps and larger volumes are typically required to obtain
decisions. Thus the use of small- or micro-scale protein
screening methods has considerable appeal [22, 24].
The focus of this work has been on eukaryotic proteins,
which are generally found to be more difficult to express
and purify than prokaryotic proteins. Small-scale
production screening efforts have predicted the outcome of
downstream large-scale protein production with up to 80%
efficiency [26]. However, these previous efforts did not
Table 4 Summary of
crystallization conditions
observed for AIA–GFP
a Conditions present in the
UW192 crystallization screen
used at UW Center for
Eukaroytic Structural Genomics
Conditiona Precipitant (w/v) Buffer Salt
1 24% MEPEG 5K 0.1 M MES, pH 6.0 160 mM CaCl2
2 16% MEPEG 5K 0.1 M BTP, pH 7.0 200 mM glycine
3 28% MEPEG 2K 0.1 M HEPES, pH 7.5 100 mM CaCl2
4 20% PEG 4K 0.1 M HEPPS, pH 8.5 80 mM CaCl2
5 60% MPD 0.1 M MES, pH 6.0 None
Table 5 Summary of data collection, crystal structure, and refine-
ment statistics for AIA–GFP
Data collectiona
Space group P212121
Cell dimensions
a, b, c (A) 51.46, 61.99, 70.02
a, b, c (�) 90, 90, 90
Resolution (A)b 46.42–1.70 (1.74–1.70)
No. reflections 23752
Rmerge (%)c 15.7 (36.6)
(I/rI)d 28.27 (2.93)
Completeness (%) 98.98 (97.32)
Redundancy 29.45 (5.42)
Refinemente,f
Resolution (A) 46.42–1.70 (1.74–1.70)
No. reflections 23752 (1276)
Rwork/Rfree 0.168/0.220 (0.246/0.323)
No. atoms
Protein 1915g
Water 377
Mean B-value (overall) 12.34
Ramachandran analysis
Most favored regions 92.4
Additional allowed regions 7.6
RMS deviations
Bond lengths (A) 0.012
Bond angles (�) 1.548
a Data collected at University of Wisconsin Center for Eukaryotic
Structural Genomics. Coordinates and structure factors were depos-
ited in the Protein Data Bank with accession number 2qu1b Numbers in parentheses indicate the highest resolution shell of 20c Rmerge = R |I - \ I [| / R I, where I is the observed intensity and
\ I [ is the average intensity obtained from multiple measurementsd The root-mean-squared value of the intensity measurements divided
by their estimated standard deviatione Rwork = R | | F0 | - | Fc | | / R | F0 |, where | F0 | is the observed
structure factor amplitude and | Fc | is the calculated structure factor
amplitudef Rfree = R-factor based on 5.1% of the data excluded from
refinementg Number of non-hydrogen protein atoms included in refinement
162 R. O. Frederick et al.
123
effectively address either the variability in proteolysis of
fusion proteins that are often used to express eukaryotic
proteins in E. coli or the behavior of the liberated targets
after proteolysis. By adopting this screening approach, the
decision to scale-up protein production can be based on the
ability to express, proteolyze, and purify the protein, and as
indicated here, this decision can be extended to the ability
to include other information such as acceptable 1H–15N
HSQC spectra or evidence of crystallization.
Table 2 contains information on another troublesome set
of eukaryotic proteins, those with pI *8 or greater (A2,
A3, A4, A10, B1, B2). Purification screening would
provide important insight into the behavior of these
proteins, which often perform well as fusion proteins in
total production and solubility properties, but which often
fail in proteolysis or stability after proteolysis (*70%,
unpublished results). Thus, although the original pipeline
screening suggested A2, A6, A10, and B1 should have
been advanced to purification, each of these targets failed
to achieve the desired threshold from the Maxwell purifi-
cation for purified fusion protein and thus deserved a work
stopped assignment. In contrast, the high pI protein A3 was
purified in high yield as a fusion protein from the Maxwell
and subsequently was released by TEV protease treatment
(as in the original pipeline scoring), supporting the decision
that this protein should be continued along the scale-up
process. Further consideration of the results of these targets
will be included in a broader study of the effect of the
N-terminal AIA tag on protein purification and structure
determination statistics, which will be reported elsewhere.
Scalability
Scalability requires similar protein production behavior in
small-scale screening, large-scale protein production, and,
ultimately, protein purification. For proteins A8 and A9,
the original small-scale screening reported these proteins
were unsuitable because of a failure in TEV proteolysis,
and this result was also determined after Maxwell purifi-
cation. Among the four human embryonic stem cell
proteins investigated, Tcl-1 was highly expressed by auto-
induction, underwent efficient in vivo proteolysis from
MBP, and was successfully purified with an estimated
volumetric productivity of 7.5 lg/ml. Two other stem cell
proteins (C10orf96 and NPM2), were also purified, but
their yields were not sufficient to indicate feasibility of the
scale-up as a structural target. Nevertheless, the method
yielded enough purified protein that some functional
studies or other analyses could be undertaken. By coupling
in vivo cleavage with automated purification, failure to
proteolyze the His8-target from the fusion protein and
cryptic insolubility of the His8-target after proteolysis are
Fig. 7 X-ray structure of AIA–GFP. The chromophore is shown as
green cylinders representing bonded atoms
Fig. 8 Schematic of a purification screening protocol. Steps from
obtaining a sequence-verified target in auto-cleavage vector pVP62K
to identification of purified proteins. The transformed expression host
is grown in auto-induction medium. Cells from production trials are
loaded into the Maxwell 16 instrument for automated purification, and
purified proteins are detected by Caliper LC90 capillary electropho-
resis. Successful purification of a protein from auto-cleavage
expression with yield exceeding 50 lg/ml of culture medium
indicates feasibility of scale-up efforts
Rapid purification of human stem cell proteins 163
123
signaled by failure in automated purification. Since both of
these results are diagnostic of likely failures in large-scale
purification, the purification screening approach gave
valuable insight into the behavior of the human stem cell
protein CCNF and the others before any significant scale-
up efforts were undertaken.
We demonstrated how the amount of His8-target suc-
cessfully purified from a single Maxwell 16 lane can be used
to determine the scale-up factor required to prepare samples
for screening either by 1H–15N NMR for folding status
(*700 lg of a 25 kDa or less protein set as the deliverable)
or by microfluidic screening for crystallization (*10 lg of
protein set as the deliverable). This scaling approach was
demonstrated for both Tcl-1 and AIA–GFP. Decreasing the
amount of protein required for initial structural screening
through the use of small NMR tubes, cryoprobes, and by nL
liquid handling effectively complements the ability to pro-
duce moderate amounts of protein in the cost-effective
manner described here. Automated methods for removal of
the His8-tag during the Maxwell 16 run would also be
desirable, and these investigations are in progress.
Time
CESG starts all expression work on eukaryotic proteins
with sequence verified clones [32, 53]. Uncertainties in
gene models and errors from primer synthesis are addres-
sed by this effort, while immediate sequence verification of
a cloned gene also supports reliable transfer into other
expression vectors. Expression plasmids transformed into
E. coli B834 can be available for purification screening
studies after 24 h, and growth from single colony trans-
formants can be completed in 48 h using our auto-
induction approach (24 h of growth in non-inducing med-
ium followed by 24 h of growth in inducing medium).
Auto-induced cultures can be immediately loaded onto the
Maxwell 16 apparatus, with parallel processing of 16
samples in 45 min. Thus a complete 96-well plate of dif-
ferent targets (or variants of the same target) could be
purified and analyzed for protein expression by the auto-
mated capillary electrophoresis in less than 7 h. In the
work flow of Fig. 8, the best performing targets, provi-
sionally defined as those obtained from in vivo cleavage
and automated purification in yield of 50 lg/ml or greater,
can be identified in about 4 days, with most of the elapsed
time allotted to overnight culture growths or automated
protein purification.
Cost
Auto-induction media are chemically defined and assem-
bled from inexpensive components. Furthermore, the cost
of labeled amino acids (15N or Se-Met) is minimal for the
initial screening due to the small cell culture volume
required. For the example shown in Fig. 4, the cost for all
reagents for the auto-induction and automated purification
of the 15N-labeled sample was less than $50. The simple
instrumentation required for the auto-induction and the
Maxwell 16 purification may allow wide access to this
approach, and the minimal hands-on effort required to
complete the analysis through to purified protein is another
considerable operational advantage.
Capillary electrophoresis has several advantages relative
to slab gel electrophoresis. Although the instrument is more
expensive than a standard power supply, electrophoresis
equipment, and gel documentation system, the average
price per sample analysis (*$0.67 per lane of analysis)
using the LC90 chip is less than pre-cast polyacrylamide
gels (*$1.17 per lane of analysis). Other advantages of
capillary electrophoresis include automated operation,
rapid processing time, digital information capture, and
quantitative analysis of electropherograms. This work
shows that the quantitative analysis of protein yield from a
small-scale expression can be used as a predictive tool for
scale-up feasibility.
Other applications of this approach
The automated protein purification process described here
has other potential uses. This process can facilitate evalu-
ation of different vector designs and arrays of different
expression hosts. For functional studies, banks of site-
directed or randomly mutated proteins can be prepared and
purified in amounts sufficient for catalytic screening. This
may facilitate protein engineering for new traits that can be
assayed such as changes in catalytic activity, thermal sta-
bility, or other desirable properties. In many cases, the
amounts of protein recovered by the automated purification
(Tables 2 and 3) should be adequate to initiate these
functional studies. Surface entropy reduction analysis
could also be facilitated through an effective sorting of
protein variants that maintain sufficient stability to be
purified. The delivery of small quantities of purified pro-
teins for examination by micro-crystallization techniques
or NMR analysis before significant effort is placed into
purifying large quantities also has demonstrable
advantages.
For eukaryotic proteins, domain engineering is an
important experimental focus. It is clear that multiple
changes at the N- and C-terminus may be required to
identify the best performing variant. Through the use of
purification screening, it is efficient to express, purify, and
examine engineered domains for improved solubility
properties as part of the experimental process.
164 R. O. Frederick et al.
123
Acknowledgements The authors thank other members of the Uni-
versity of Wisconsin-Madison, Center for Eukaryotic Structural
Genomics for their assistance and support. Special thanks are offered
to Michael A. Goren, Karl Nichols, Maggie Harteau, Steve Sarles and
Stuart Ballard. The authors also thank Professor James Thomson
(University of Wisconsin-Madison, Department of Anatomy and
Genome Center) for identification of the human embryonic stem cell
proteins used in this work. This work was supported by the National
Institutes of Health, Protein Structure Initiative grant U54 GM074901
(J.L.M., PI; G.N.P., Co-Investigator; B.G.F.; Co-Investigator) and a
sponsored research agreement from Promega Corporation to B.G.F.
J.G.M. is supported by an NHGRI training grant to the Genomic
Sciences Training Program (5T32HG002760). L.J.B. is supported by
NIH grant GM50853 and National Science Foundation grant MCB-
0316232 to B.G.F.
Open Access This article is distributed under the terms of the
Creative Commons Attribution Noncommercial License which per-
mits any noncommercial use, distribution, and reproduction in any
medium, provided the original author(s) and source are credited.
References
1. Knaust RK, Nordlund P (2001) Screening for soluble expression
of recombinant proteins in a 96-well format. Anal Biochem
297:79–85
2. Stevens RC (2000) Design of high-throughput methods of protein
production for structural biology. Structure 8:R177–185
3. Kawasaki M, Inagaki F (2001) Random PCR-based screening for
soluble domains using green fluorescent protein. Biochem Bio-
phys Res Commun 280:842–844
4. King DA, Hall BE, Iwamoto MA, Win KZ, Chang JF, Ellen-
berger T (2006) Domain structure and protein interactions of the
silent information regulator Sir3 revealed by screening a nested
deletion library of protein fragments. J Biol Chem 281:20107–
20119
5. Reich S, Puckey LH, Cheetham CL, Harris R, Ali AA, Bhatta-
charyya U, Maclagan K, Powell KA, Prodromou C, Pearl LH,
Driscoll PC, Savva R (2006) Combinatorial domain hunting: an
effective approach for the identification of soluble protein
domains adaptable to high-throughput applications. Protein Sci
15:2356–2365
6. Kato A, Maki K, Ebina T, Kuwajima K, Soda K, Kuroda Y
(2007) Mutational analysis of protein solubility enhancement
using short peptide tags. Biopolymers 85:12–18
7. Zhou P, Lugovskoy AA, Wagner G (2001) A solubility-
enhancement tag (SET) for NMR studies of poorly behaving
proteins. J Biomol NMR 20:11–14
8. Garrard SM, Longenecker KL, Lewis ME, Sheffield PJ, Derew-
enda ZS (2001) Expression, purification, and crystallization of the
RGS-like domain from the Rho nucleotide exchange factor, PDZ-
RhoGEF, using the surface entropy reduction approach. Protein
Expr Purif 21:412–416
9. Derewenda ZS, Vekilov PG (2006) Entropy and surface engi-
neering in protein crystallization. Acta Crystallogr D Biol
Crystallogr 62:116–124
10. Rayment I (1997) Reductive alkylation of lysine residues to alter
crystallization properties of proteins. Methods Enzymol 276:171–
179
11. Galvao-Botton LM, Katsuyama AM, Guzzo CR, Almeida FC,
Farah CS, Valente AP (2003) High-throughput screening of
structural proteomics targets using NMR. FEBS Lett 552:207–
213
12. Scheich C, Leitner D, Sievert V, Leidert M, Schlegel B, Simon B,
Letunic I, Bussow K, Diehl A (2004) Fast identification of folded
human protein domains expressed in E. coli suitable for structural
analysis. BMC Struct Biol 4:4
13. Chayen NE, Saridakis E (2002) Protein crystallization for
genomics: towards high-throughput optimization techniques.
Acta Crystallogr D Biol Crystallogr 58:921–927
14. Kimber MS, Vallee F, Houston S, Necakov A, Skarina T, Evd-
okimova E, Beasley S, Christendat D, Savchenko A, Arrowsmith
CH, Vedadi M, Gerstein M, Edwards AM (2003) Data mining
crystallization databases: knowledge-based approaches to opti-
mize protein crystal screens. Proteins 51:562–568
15. Yee AA, Savchenko A, Ignachenko A, Lukin J, Xu X, Skarina T,
Evdokimova E, Liu CS, Semesi A, Guido V, Edwards AM, Ar-
rowsmith CH (2005) NMR and X-ray crystallography,
complementary tools in structural proteomics of small proteins. J
Am Chem Soc 127:16512–16517
16. Brenner SE (2000) Target selection for structural genomics. Nat
Struct Biol 7(Suppl):967–969
17. Smialowski P, Martin-Galiano AJ, Cox J, Frishman D (2007)
Predicting experimental properties of proteins from sequence by
machine learning techniques. Curr Protein Pept Sci 8:121–133
18. Goh CS, Lan N, Douglas SM, Wu B, Echols N, Smith A, Milburn
D, Montelione GT, Zhao H, Gerstein M (2004) Mining the
structural genomics pipeline: identification of protein properties
that affect high-throughput experimental analysis. J Mol Biol
336:115–130
19. Watson JD, Todd AE, Bray J, Laskowski RA, Edwards A, Jo-
achimiak A, Orengo CA, Thornton JM (2003) Target selection
and determination of function in structural genomics. IUBMB
Life 55:249–255
20. Brodsky O, Cronin CN (2006) Economical parallel protein
expression screening and scale-up in Escherichia coli. J Struct
Funct Genomics 7:101–108
21. Canaves JM, Page R, Wilson IA, Stevens RC (2004) Protein
biophysical properties that correlate with crystallization success
in Thermotoga maritima: maximum clustering strategy for
structural genomics. J Mol Biol 344:977–991
22. Nguyen H, Martinez B, Oganesyan N, Kim R (2004) An auto-
mated small-scale protein expression and purification screening
provides beneficial information for protein production. J Struct
Funct Genomics 5:23–27
23. Page R, Moy K, Sims EC, Velasquez J, McManus B, Grittini C,
Clayton TL, Stevens RC (2004) Scalable high-throughput micro-
expression device for recombinant proteins. Biotechniques
37:364, 366, 368 passim
24. Peti W, Page R, Moy K, O’Neil-Johnson M, Wilson IA, Stevens
RC, Wuthrich K (2005) Towards miniaturization of a structural
genomics pipeline using micro-expression and microcoil NMR. J
Struct Funct Genomics 6:259–267
25. Smialowski P, Schmidt T, Cox J, Kirschner A, Frishman D
(2006) Will my protein crystallize? A sequence-based predictor.
Proteins 62:343–355
26. Sugar FJ, Jenney FE Jr, Poole FL 2nd, Brereton PS, Izumi M,
Shah C, Adams MW (2005) Comparison of small- and large-scale
expression of selected Pyrococcus furiosus genes as an aid to
high-throughput protein production. J Struct Funct Genomics
6:149–158
27. Vincentelli R, Bignon C, Gruez A, Canaan S, Sulzenbacher G,
Tegoni M, Campanacci V, Cambillau C (2003) Medium-scale
structural genomics: strategies for protein expression and crys-
tallization. Acc Chem Res 36:165–172
28. Tyler RC, Sreenath HK, Singh S, Aceti DJ, Bingman CA,
Markley JL, Fox BG (2005) Auto-induction medium for the
production of [U-15N]- and [U-13C, U-15N]-labeled proteins for
Rapid purification of human stem cell proteins 165
123
NMR screening and structure determination. Protein Expr Purif
40:268–278
29. Sreenath HK, Bingman CA, Buchan BW, Seder KD, Burns BT,
Geetha HV, Jeon WB, Vojtik FC, Aceti DJ, Frederick RO,
Phillips GN Jr, Fox BG (2005) Protocols for production of
selenomethionine-labeled proteins in 2-l polyethylene tere-
phthalate bottles using auto-induction medium. Protein Expr
Purif 40:256–267
30. Jeon WB, Aceti DJ, Bingman CA, Vojtik FC, Olson AC, Ellefson
JM, McCombs JE, Sreenath HK, Blommel PG, Seder KD, Burns
BT, Geetha HV, Harms AC, Sabat G, Sussman MR, Fox BG,
Phillips GN Jr (2005) High-throughput purification and quality
assurance of Arabidopsis thaliana proteins for eukaryotic struc-
tural genomics. J Struct Funct Genomics 6:143–147
31. Tyler RC, Aceti DJ, Bingman CA, Cornilescu CC, Fox BG, Fred-
erick RO, Jeon WB, Lee MS, Newman CS, Peterson FC, Phillips
GN Jr, Shahan MN, Singh S, Song J, Sreenath HK, Tyler EM,
Ulrich EL, Vinarov DA, Vojtik FC, Volkman BF, Wrobel RL, Zhao
Q, Markley JL (2005) Comparison of cell-based and cell-free
protocols for producing target proteins from the Arabidopsis tha-liana genome for structural studies. Proteins 59:633–643
32. Blommel PG, Martin PA, Wrobel RL, Steffen E, Fox BG (2006)
High efficiency single step production of expression plasmids
from cDNA clones using the flexi vector cloning system. Protein
Expr Purif 47:562–570
33. Blommel PG, Becker KJ, Duvnjak P, Fox BG (2007) Enhanced
bacterial protein expression during auto-induction obtained by
alteration of lac repressor dosage and medium composition.
Biotechnol Prog 23:585–598
34. Sambrook J, Russell DW (2001) Molecular cloning: a laboratory
manual. Cold Spring Harbor Laboratory Press, Cold Spring
Harbor, New York, pp 15.44–15.48
35. Klein RD, Wells RD (1982) Effects of neighboring DNA ho-
mopolymers on the biochemical and physical properties of the
Escherichia coli lactose promoter. I. Cloning and characterization
studies. J Biol Chem 257:12954–12961
36. Patterson GH, Knobel SM, Sharif WD, Kain SR, Piston DW
(1997) Use of the green fluorescent protein and its mutants in
quantitative fluorescence microscopy. Biophys J 73:2782–2790
37. Yang TT, Cheng L, Kain SR (1996) Optimized codon usage and
chromophore mutations provide enhanced sensitivity with the
green fluorescent protein. Nucleic Acids Res 24:4592–4593
38. Crameri A, Whitehorn EA, Tate E, Stemmer WP (1996)
Improved green fluorescent protein by molecular evolution using
DNA shuffling. Nat Biotechnol 14:315–319
39. Prodromou C, Pearl LH (1992) Recursive PCR: a novel technique
for total gene synthesis. Protein Eng 5:827–829
40. Casimiro DR, Toy-Palmer A, Blake RC 2nd, Dyson HJ (1995)
Gene synthesis, high-level expression, and mutagenesis of
Thiobacillus ferrooxidans rusticyanin: his 85 is a ligand to the
blue copper center. Biochemistry 34:6640–6648
41. Casimiro DR, Wright PE, Dyson HJ (1997) PCR-based gene
synthesis and protein NMR spectroscopy. Structure 5:1407–1412
42. Sambrook J, Fritsch EF, Maniatis T (2001) Molecular cloning, a
laboratory manual. Cold Spring Harbor, Cold Spring Harbor
Laboratory Press, New York
43. Wood WB (1966) Host specificity of DNA produced by Esche-richia coli: bacterial mutations affecting the restriction and
modification of DNA. J Mol Biol 16:118–133
44. Arber W (1964) Host specificity of DNA produced by Esche-richia coli. 3. Effects on transduction mediated by lambda Dg.
Virology 23:173–182
45. Studier FW (2005) Protein production by auto-induction in high
density shaking cultures. Protein Expr Purif 41:207–234
46. Blommel PG, Fox BG (2007) A combined approach to improving
large-scale production of tobacco etch virus protease. Protein
Expr Purif 55(1):53–68
47. The CCP4 suite: programs for protein crystallography (1994)
Acta Crystallogr D Biol Crystallogr 50:760–763
48. Emsley P, Cowtan K (2004) Coot: model-building tools for
molecular graphics. Acta Crystallogr D Biol Crystallogr
60:2126–2132
49. Murshudov GN, Vagin AA, Dodson EJ (1997) Refinement of
macromolecular structures by the maximum-likelihood method.
Acta Crystallogr D Biol Crystallogr 53:240–255
50. Leahy DJ, Hendrickson WA, Aukhil I, Erickson HP (1992)
Structure of a fibronectin type III domain from tenascin phased
by MAD analysis of the selenomethionyl protein. Science
258:987–991
51. Blattner FR, Plunkett G 3rd, Bloch CA, Perna NT, Burland V,
Riley M, J. Collado-Vides, Glasner JD, Rode CK, Mayhew GF,
Gregor J, Davis NW, Kirkpatrick HA, Goeden MA, Rose DJ,
Mau B, Shao Y (1997) The complete genome sequence of
Escherichia coli K-12. Science 277:1453–1474
52. Welch RA, Burland V, Plunkett G 3rd, Redford P, Roesch P,
Rasko D, Buckles EL, Liou SR, Boutin A, Hackett J, Stroud D,
Mayhew GF, Rose DJ, Zhou S, Schwartz DC, Perna NT, Mobley
HL, Donnenberg MS, Blattner FR (2002) Extensive mosaic
structure revealed by the complete genome sequence of uro-
pathogenic Escherichia coli. Proc Natl Acad Sci USA 99:17020–
17024
53. Thao S, Zhao Q, Kimball T, Steffen E, Blommel PG, Riters M,
Newman CS, Fox BG, Wrobel RL (2004) Results from high-
throughput DNA cloning of Arabidopsis thaliana target genes
using site-specific recombination. J Struct Funct Genomics
5:267–276
166 R. O. Frederick et al.
123