rice research station - lsu agcenter
TRANSCRIPT

www.lsuagcenter.com
99th AnnuAl ReseARch RepoRt
Crowey, Louisiana2007
Rice Research Station

Female crawfish in an “artificial burrow”
Hedge Hyssop (Gratiola spp.)
Sunny Bottoms and Justin Hensley harvesting rice in the rice weed management program
Cover Photos
Pyricularia oryzae fungal spores, the blast causal organism
Ron Regan and Dustin Harrell drill seeding a nitrogen fertility trial on the Kurt Lounsberry Farm near Lake Arthur, La.

99th Annual Research Report RICE RESEARCH STATION Crowley, Louisiana 2 0 0 7
Louisiana State University Agricultural Center William B. Richardson, Chancellor
Louisiana Agricultural Experiment Station
David J. Boethel, Vice Chancellor and Director
Louisiana Cooperative Extension Service Paul D. Coreil, Vice Chancellor and Director
Southwest Region/Rice Research Station
Steve D. Linscombe, Regional Director/Resident Coordinator
The LSU Agricultural Center is a campus of the LSU System and provides equal opportunities in programs and employment.

i
T A B L E O F C O N T E N T S Page INTRODUCTION .......................................................................................................................................... 1 MONTHLY RAINFALL DATA .................................................................................................................. 2 RICE BREEDING .......................................................................................................................................... 3-82 Genetic Improvement of Rice for Louisiana Production .................................................................... 3-35 Introduction ................................................................................................................................... 3 Cooperative Uniform Regional Rice Nursery (URN).................................................................. 4-11 Commercial-Advanced Yield Trials ............................................................................................. 12-20 Preliminary Yield Trials ............................................................................................................... 21-31 Date of Planting Studies ............................................................................................................... 32-35 Medium-Grain Rice Breeding ............................................................................................................. 36-40 Development of Improved Long-Grain and Special Purpose Rice Varieties for Louisiana .............. 41-54 Rice Genetics and Germplasm Development ...................................................................................... 55-57 Marker-Assisted Breeding and Genetic Improvement of Southern U.S. Rice ................................... 58-72 Induced Mutational Breeding and Enhancement of Nutritional Quality in Rice ............................... 73-82 RICE AGRONOMY ...................................................................................................................................... 83-181 Introduction .......................................................................................................................................... 83-85 Rice Nutrition Research ....................................................................................................................... 86-156 Introduction ................................................................................................................................... 86-88 Rice Variety by Nitrogen Experiments at the Rice Research Station .......................................... 89-94 Rice Variety by Nitrogen Experiments at Vermilion Parish ........................................................ 95-100 Rice Variety by Nitrogen Experiments at Richland Parish .......................................................... 101-106 RiceTec Hybrid by Nitrogen Experiments (Rice Research Station) ........................................... 107-111 RiceTec Hybrid by Nitrogen Experiments (Richland Parish) ..................................................... 112-116 Rice Response to P Fertilization (Rice Research Station) ........................................................... 117-118 Rice Response to P Fertilization (Morehouse Parish) .................................................................. 119-120 Rice Response to Zn Fertilization (Rice Research Station) ......................................................... 121-122 Rice Response to Zn Fertilization (Morehouse Parish) ............................................................... 123-124 Rice Response to Zn Fertilization Rate and Source (Vermilion Parish) ..................................... 125-126 Evaluation of Urea, Agrotain-Treated Urea, and 43G at Two Application Timings .................. 127-128 Evaluation of Two Liquid N Fertilizers for Midseason Application ........................................... 129-130 Rice Response to the Humic Acid Product HydraHume ............................................................. 131-132 Evaluation of Liquid Starter N Fertilizers in a Clearfield System ............................................... 133-135 Evaluating Nondestructive Measurements to Predict Midseason N Needs for Cocodrie Rice .................................................................................................................... 136-137 Ratoon Response of Rice Hybrids to Main-Crop Stubble Manipulation 3.1 .............................. 138-139 Ratoon Response of Rice Varieties to Main-Crop Stubble Manipulation 3.1 ............................ 140-141 Influence of Main-Crop Straw on Ratoon-Crop Nitrogen Efficiency 1.1 ................................... 142-143 Evaluation of N Source, Rate, and Variety on Ratoon Yield ...................................................... 144-146 Ratoon Response of Rice Hybrids to Nitrogen Fertilizer Rates 3.1 ............................................ 147-148 Ratoon Response of Rice Varieties to Nitrogen Fertilizer Rates 3.1 ........................................... 149-150 Ratoon Response to Nitrogen Fertilizer Application Timings 2.1 .............................................. 151-152 Ratoon Response to Phosphorus and Potassium 2.1 .................................................................... 153-154 Evaluate the Influence of Zinc Fertilization on Ratoon Crop ...................................................... 155-156

ii
Page RICE AGRONOMY (continued) ................................................................................................................... 83-181 Cultural Management Research ........................................................................................................... 157-181 Introduction ................................................................................................................................... 157-158 Clearfield Hybrid Yield Comparison 1 (Rice Research Station) ................................................. 159-160 Clearfield Hybrid Yield Comparison 2 (Evangeline Parish) ....................................................... 161-162 Clearfield Hybrid Yield Comparison 3 (Richland Parish) ........................................................... 163-164 Clearfield Hybrid Yield Comparison 4 (Morehouse Parish) ....................................................... 165-166 Clearfield Hybrid Yield Comparison 5 (Vermilion Parish) ......................................................... 167-168 Evaluation of Tillage, Seeding Rate, and N Rate on Jupiter Rice Agronomic Traits ................. 169-171 Evaluation of Tillage, Seeding Rate, and N Rate on Cheniere Rice Agronomic Traits.............. 172-174 Evaluation of Crop Rotation and Tillage Systems in Rice Production – Year 3 ......................... 175-177 Evaluation of Flat vs. Raised Seedbeds for Group IV and Group V Soybeans .......................... 178-179 Evaluation of Sweet Sorghum Varieties as a Potential Biofuel Source, 2007 ............................ 180-181 FOUNDATION SEED RICE PROGRAM ................................................................................................. 182-184 RICE PHYSIOLOGY .................................................................................................................................... 185-216 Introduction .......................................................................................................................................... 185 Seedling Vigor Studies – Seed and Foliar Treatment ......................................................................... 186-201 Gibberellic Acid and Seedling Vigor in Drill-Seeded Rice – March Planting Date ..................... 186-193 Gibberellic Acid and Seedling Vigor in Drill-Seeded Rice – April Planting Date ........................ 194-201 North Unit General Methodology ........................................................................................................ 202 Yield Enhancement Studies – First Crop............................................................................................. 203-205 Actagro Plant Nutrients and Crop Production in Drill-Seeded Rice .............................................. 203 Heading Applications of Gibberellic Acid and Crop Production in Drill-Seeded Rice ................ 204-205 South Unit General Methodology ........................................................................................................ 206 Yield Enhancement Studies – First and Second Crop ......................................................................... 207-214 Plant Growth Regulators Applied to the First Crop and Crop Production in First and Second Crops in Very Early Season, Semidwarf, Long-Grain, Drill-Seeded Rice ................. 207-208 Plant Growth Regulators Applied to the First Crop and Crop Production in First and Second Crops in Very Early Season, Short Stature, Long-Grain, Drill-Seeded Rice ............. 209-210 First Crop Cutting Height and Second Crop Production in Drill-Seeded Rice ............................. 211-213 BioForge and Crop Production in Drill-Seeded Rice ..................................................................... 214 Off-Station General Methodology .......................................................................................................... 215 Yield Enhancement Studies – First Crop............................................................................................. 216 Seedling Applications of Stoller Products, Localized Decline, and Crop Production in Drill-Seeded Rice ................................................................................................................ 216 AQUACULTURE RESEARCH ................................................................................................................... 217-253 Annual Summary of Environmental Conditions and Crawfish Production ....................................... 217-219 Summer Burrow Excavations and Effects of Various Factors on Reproduction in the Laboratory .. 220-228 Winter Burrow Excavations and Subsequent Reproduction in the Laboratory.................................. 229-232 Assessment of Sampling and Harvest Yields When Crawfish Ponds are Populated Only by Stocking Hatchlings ........................................................................................................ 233-246 Evaluations of an Experimental Protocol for Testing Bait Preference of Crawfish in Cool Water under Confinement ............................................................................................... 247-248 Observations for Potential Toxicity of Experimental Rice Insecticides to Crawfish ......................... 249-253

iii
Page RICE DISEASE CONTROL RESEARCH ................................................................................................ 254-286 Rice Disease Control Studies, 2007 ..................................................................................................... 254-278 Introduction ................................................................................................................................... 254-255 2007 Varietal and URN Disease Resistance Evaluation .............................................................. 256-264 2007 Blast and Secondary Disease Nurseries .............................................................................. 265 2007 Sheath Blight Rice CAPS Trial ........................................................................................... 266 2007 Sheath Blight Fungicide Trial ............................................................................................. 267-268 2007 Yield Loss Trial ................................................................................................................... 269-270 2007 Blast Fungicide Trial ........................................................................................................... 271-272 2007 Narrow Brown Leaf Spot Trial ........................................................................................... 273-274 2007 Lake Arthur Fungicide Trial ................................................................................................ 275-276 2007 Fenton Fungicide Trial ........................................................................................................ 277-278 Disease Resistance and Management in Rice ...................................................................................... 279-286 RICE PRODUCTION ECONOMICS RESEARCH ................................................................................ 287-290 RICE INSECTS RESEARCH ............................................................................................................ 291-300 Evaluation of Pre- and Postflood Applications of Granular Dinotefuran for Rice Water Weevil Control ............................................................................................................ 291-292 Evaluation of Insecticides for Control of the Rice Stink Bug, 2007 ............................................ 293-294 Evaluation of Rynaxypyr Seed Treatment against the Rice Water Weevil, 2006-2007 ............... 295-298 Evaluation of Thiomethoxam as a Seed Treatment against the Rice Water Weevil, 2007 ........... 299-300 COASTAL EROSION CONTROL RESEARCH ..................................................................................... 301-309 Molecular Marker Analysis of Smooth Cordgrass .............................................................................. 301-306 Seed-Based Propagation of Smooth Cordgrass ................................................................................... 307-309 LOUISIANA RICE RESEARCH VERIFICATION PROGRAM - 2007.............................................. 310-338 RICE WEED CONTROL ............................................................................................................................. 339-340 STATION PERSONNEL............................................................................................................................... 341-342 COOPERATING PERSONNEL .................................................................................................................. 343-344

1
INTRODUCTION Research at the Rice Research Station, Crowley, Louisiana, is conducted by scientists with the LSU AgCenter’s Louisiana Agricultural Experiment Station. The 2007 rice research program included breeding, biotechnology, variety testing, fertilization, soil and water management, cultural practices, weed control, insect control, disease investigations, rice drying, bird control in rice, and physiology studies. Crops grown in rotation with rice were evaluated relative to increasing the efficiency of land use. The aquaculture research program places emphasis upon production practices, forages, and multi-cropping of crawfish with agronomic crops. Another important area of work is the production and distribution of foundation seed. Although most research work was performed by members of the Rice Station faculty, several staff members from Baton Rouge conducted research at this station. The research activities of this station include both fundamental and applied research, although the latter predominates because of the mission of the Rice Research Station. Research accomplishments and general progress of the Rice Station during 2007 are presented in this report representing the 99th Annual Research Report of the Rice Research Station, Louisiana Agricultural Experiment Station, LSU Agricultural Center. In addition to research responsibilities of the Rice Research Station staff and cooperators, a large number of farmers, extension personnel, and others were trained and otherwise contacted during 2007. Approximately 450 people attended the annual Rice Research Station field day to view plots and participate in discussions of research findings. Field days also were conducted in Evangeline, Jeff Davis, Richland, and Vermilion parishes. In addition, the staff participated in industry meetings, both on and off the station, and worked individually with farmers and others in solving immediate problems. Several thousand people received services from the Rice Research Station during 2007. Projects at this station are conducted under the supervision of research scientists from the Rice Research Station and also by cooperating personnel from certain departments of the Louisiana Agricultural Experiment Station. Following the reports, station personnel and cooperators in 2007 are listed.

MONTHLY RAINFALL DATA RICE RESEARCH STATION - CROWLEY, LA
2007
DATE
JAN
FEB
MAR
APR
MAY
JUNE
JULY
AUG
SEPT
OCT
NOV
DEC
YEAR TOTAL
1 2 3 4 5 6 7 8 9 10 11 12 13 14 15 16 17 18 19 20 21 22 23 24 25 26 27 28 29 30 31
.01
.10 3.00 .01 .13 .70
.06
.03
.57
.16
.04
.48
.31 1.09 .98
.19 .12
.20
1.50
.10
.48
.21
.01
.07
.20
.03
.12
.01
.40
.10
.75
.01
.02
.47
.21
.08
.01
.34
.79 1.15
.45
1.13
.02 1.81 .01
.42
.15
.01
.02
.02
.01
.70 1.70 .03
1.90
.08
.03 1.95 1.07
.90
.03
.23 1.24
.23
.64
.15
.18
.69
1.73 .05 .50 .94 .41
.23
.40
.05
.02
.04
.43
.09 1.95 .47 .18 .37
.15
.23
.38
.08
.01
.05 1.50 .05
1.26 .09
.02 2.08
2.00 .16
.05
.03 2.52 .19
.62 2.19 .92
.17
.04
.20
.10
.28
.02
.87
.03
.75
.02
.05
.11
.05
.14 1.90
1.61 .02 .02 .63
4.72
.03
.01
.04
.41
.17
.45
.40
1.13
.62
.01
MONTH TOTAL
9.78
1.12
1.29
4.63
6.80
7.42
7.86
5.90
9.19
1.95
9.27
3.27
68.48
2006 2.71 4.83 0.68 4.83 2.80 2.32 6.88 4.98 3.66 11.40 1.95 6.67 53.71
2

3
RICE BREEDING
GENETIC IMPROVEMENT OF RICE FOR LOUISIANA PRODUCTION1
S.D. Linscombe, X.Y. Sha, S.B. Blanche, K.F. Bearb, C.A. Conner, B.W. Theunissen, S.J. Theunissen, G.E. Anderson, B.J. Henry, and H.L. Hoffpauir
INTRODUCTION
The primary objective of the Rice Breeding Project is the development of superior varieties for the Louisiana rice industry. The Breeding Project is developing improved genotypes of both long- and medium-grain types, which are both important in the state and region. The project is also placing major emphasis on the development of specialty purpose types. In addition to the primary objective of varietal development, the Breeding Project also conducts other research that may have direct and/or indirect contributions on varietal development. Included here are studies on milling quality, mutation breeding, date of planting, incorporation of herbicide resistance into rice varieties for use in red rice control programs, and development of lines for crawfish forage production. The 2007 rice breeding nursery included 103,500 breeding rows, 708 F1 transplant populations, and 502 space planted F2 populations. About 700 new crosses were made. On- and off-station testing included over 4,700 yield plots. Yield testing included the Cooperative Uniform Regional Rice Nursery, which contained 200 experimental lines and checks (50 Louisiana entries). The commercial-advanced test was conducted at the Rice Research Station and six off-station locations. The preliminary yield testing program evaluated 725 lines (mainly of F5 and F6 generation), most for the first time. In addition to yield testing, these lines were also evaluated for seedling vigor, milling characteristics, quality parameters, and numerous other agronomic characteristics. ______________________________________ 1 This research is supported in part by funding provided by rice producers through the Louisiana Rice Research Board.

4
COOPERATIVE UNIFORM REGIONAL RICE NURSERY
The Uniform Regional Rice Nursery (URN) is a multi-state yield nursery conducted by public rice breeders at research locations in Arkansas, Louisiana, Mississippi, Texas, California, and Missouri to evaluate experimental lines and commercial varieties. Entries are exposed to different environments over a wide, diverse growing region and allow researchers to evaluate their adaptation in a single row. The 2007 URN test included 200 experimental lines and varieties planted in six states. The randomized complete block design was applied, with three replications for Groups 1 to 4 and two replications for Groups 5 to 7. Seeding rates were 90 lb for varieties and 38 lb for hybrids. The 2007 URN results from the Rice Research Station will be reported. All plots were drill seeded on March 13. Groups 1 to 4 were harvested on August 6 and Groups 5 to 7 were harvested on August 7. Tests were conducted using standard agronomic practices (except that no fungicides were applied). Tables 1 to 7 show grain and milling yield and agronomic performance (seedling vigor, days to 50% heading, plant height, and lodging percentage) of entries in the 2007 URN nursery at the Rice Research Station.

Table 1. Grain and milling yield, agronomic performance, and disease ratings† of entries in the 2007 Uniform Regional Rice Nursery, Group 1, Rice Research Station, Crowley, LA.
Entry Source Pedigree Vigor†
Days to 50%
Heading
Plant Height
(in) Grain Yield
(lb/A @ 12%)
Milling Yield (%)
SB‡ BPB‡ RNB‡ NBLS‡Whole Total
011 RU0502022 CPRS/KBNT//9502008-A 4 84 39 9066 61.5 70.4 6.5 5.5 2.8 0.8 004 RU0501096 L201/7402003//KATY/NWBT/3/LGRU 4 86 44 8953 63.2 68.7 4.3 4.5 0.5 0.5 018 RU0202008 TRENASSE 5 78 41 8462 59.7 64.6 7.8 7 4 1 008 RU0602103 KATY/CPRS//JKSN/3/AR1188/CCDR 4 83 40 8037 63.0 71.7 6.5 6 4.8 2.3 002 RU0602085 CCDR/9502008-A 4 82 39 7908 59.7 69.5 6.3 5 4.5 2.5 015 RU0604035 RSMT/KATY 3 83 38 7813 57.6 67.8 6.5 6.5 5 3.5 020 CYBT CYBONNET 4 86 38 7726 66.1 71.6 6 5.3 3.3 1.5 001 RU0301081 NWBT/3/LBNT/9902//LBLE/4/DREW 4 91 46 7477 65.3 71.7 4 4 0.3 0.3 005 RU0602109 9901081/CCDR 5 87 36 7432 63.7 70.1 6.5 6.3 6.5 1.8 007 RU0401087 NWBT/3/LBNT/9902//LBLE/4/LGRU 4 86 41 7424 60.5 72.1 5.3 4.8 4.3 0.3 003 RU0503092 ((NWBT/RU8303181)/RSMT))TX7129/CCDR 5 83 41 7337 64.8 70.4 6.5 5.3 4 2.8 013 RU0601013 LBNT/9902/3/DAWN/...//STBN/4/LGRU/5/WLLS 4 85 40 7261 64.2 71.7 5.8 4.5 3.8 0.5 017 SPRN SPRING 3 77 46 7225 63.3 71.7 5.3 5.3 4.8 1 006 RU0503006 ((NWBT/RU8303181)/RSMT))TX7129/CCDR 5 83 44 7207 62.5 68.9 5.8 5.8 3.5 2.5 012 RU0503012 ((NWBT/RU8303181)/RSMT))TX7129/CCDR 5 86 40 7082 63.7 71.4 6.5 5 4 2 016 RU0604122 TBNT/LA110//LMNT/3/TBNT 4 84 40 6648 59.1 69.1 6 4.8 5.8 3.5 009 RU0503009 ((NWBT/RU8303181)/RSMT))TX7129/CCDR 6 86 36 6549 64.2 71.9 7.5 6.5 4.5 1 014 RU0504083 CPRS/JKSN 5 87 32 6460 66.7 72.8 6.8 7.5 5 4.8 010 RU0601010 DREW/UA99-52 7 88 39 5919 58.1 69.6 6 6 2.3 0 019 PSDO PRESIDIO 6 85 38 5633 64.3 69.5 5 4.8 3.5 0.3
c.v. % 10.0 1.3 3.3 4.7 2.6 0.86 14.0 16.4 24.1 54.4 LSD0.05 0.75 1.8 2.1 577 3.3 1.3 1.2 1.3 1.3 1.3
† Subjective rating 0 to 9, where 0 = excellent, 9 = poor. ‡ Abbreviations: SB=sheath blight, BPB=bacterial panicle blight, RNB=rotten neck blast, NBLS=narrow brown leaf spot.
5

Table 2. Grain and milling yield, agronomic performance, and disease ratings† of entries in the 2007 Uniform Regional Rice Nursery, Group 2, Rice Research Station, Crowley, LA.
Entry Source Pedigree Vigor†
Days to 50%
Heading
Plant Height
(in) Grain Yield
(lb/A @ 12%)
Milling Yield (%)
SB‡ BPB‡ RNB‡ NBLS‡Whole Total
040 FRNS FRANCIS 3 84 42 8792 63.1 71.1 6.8 4 4.5 0 028 RU0402028 BNGL//MERC/RICO/3/MERC/RICO//BNGL 4 86 36 8387 70.1 72.4 4.5 4.8 0.8 0.3 038 BNGL BENGAL 4 86 38 8363 69.7 72.7 5 4.3 3.3 1 031 RU0702031 CCDR/5/MARS/…/6/L202/…/7/CCDR/… 4 80 40 7928 62.9 68.3 5.5 6.8 4.5 1.5 037 JPTR JUPITER 6 86 38 7925 68.1 70.8 3 4 4.5 1.3 036 RU0604156 8902031/NWBT 4 83 35 7600 58.9 69.1 5 5.3 6.8 2.5 039 CL131 CL131 5 85 36 7514 63.9 70.1 7.5 7 3.8 2.8 026 RU0103184 (CPRS/PELDE)/JEFF 6 89 39 7468 68.6 71.1 5.5 6 2 2.3 025 RU0402125 96INT/AHRENT 5 87 40 7406 67.2 70.3 4 4.3 1.5 3 034 RU0702034 JODN/AR1121/7/CCDR/…/6/CCDR/5/MARS/… 4 79 41 7309 64.9 70.6 5 6.8 6 1.3 035 RU0604114 8904186sel919/8803012 4 87 36 7298 57.4 70.2 7.8 6.5 6 0 033 RU0404191 8603006/3/MARS/NWRX//TBNT 4 84 36 7280 64.2 71.5 5 6 6.3 0 021 RU0401084 BRAZ/../3/../..//NTAI/4/BNGL/5/BNGL/RICO 5 86 43 7136 62.6 68.3 7 4.5 0.5 1.3 027 RU0601027 DREW/UA99-52 5 89 40 7111 60.9 68.6 6.5 6 1.5 0.8 023 RU0503095 (CPRS/(KATY//../PCOS))/((CPRS/PELDE)/JEFF)) 5 87 43 7082 65.3 71.2 4 5.5 3 1.5 022 RU0502094 CCDR/5/MARS/M201//MARS… 4 85 39 6934 64.9 69.7 6.5 7.5 2.8 1.8 030 RU0601030 WLLS/UA99-52 5 88 39 6462 59.2 70.8 7 6.5 1 1.3 032 RU0303129 (CPRS/PANDA)/JEFF*2 6 84 40 6184 66.6 71.4 5 6.5 3.8 2.5 024 RU0401136 BRAZ/../3/../..//NTAI/4/BNGL/5/BNGL/RICO 6 87 33 6077 67.8 70.8 6 5.5 5.8 0.3 029 RU0003178 (CPRS/PELDE)/JEFF 9 94 38 2930 62.9 69.4 5 5.3 4 0.3
c.v. % 9.7 1.2 4.3 6.8 2.2 1.5 16.1 15.3 28.4 37.3 LSD0.05 0.80 1.7 2.7 800 2.9 2.2 1.3 1.2 1.5 1.2
† Subjective rating 0 to 9, where 0 = excellent, 9 = poor. ‡ Abbreviations: SB=sheath blight, BPB=bacterial panicle blight, RNB=rotten neck blast, NBLS=narrow brown leaf spot.
6

Table 3. Grain and milling yield, agronomic performance, and disease ratings† of entries in the 2007 Uniform Regional Rice Nursery, Group 3, Rice Research Station, Crowley, LA.
Entry Source Pedigree Vigor†
Days to 50%
Heading
Plant Height
(in) Grain Yield
(lb/A @ 12%)
Milling Yield (%)
SB‡ BPB‡ RNB‡ NBLS‡Whole Total
058 CHNR CHENIERE 5 88 36 7876 63.3 71.5 5.5 6.3 5.5 1 059 CCDR COCODRIE 4 85 38 7712 63.3 70.8 6 7.3 4.5 2.3 054 RU0504196 CPRS/3/L201//TBNT/BLMT 4 87 40 7564 66.9 70.6 7.8 5.8 2.8 1.5 050 RU0301050 LBNT/9902//NWBT/3/KATY/NWBT/4/DREW 4 88 43 7554 64.2 70.8 6.5 6.8 2.8 0.3 051 RU0602183 9502008-A//AR1188/CCDR 4 83 38 7493 62.5 68.7 7 7 3.8 1.8 042 RU0602189 9502008/CPRS 4 88 39 7302 66.2 71.1 7 7.3 2.5 0.8 055 RU0504193 CPRS/3/L201//TBNT/BLMT 4 84 38 7251 68.0 71.8 6.5 6 1 1.5 060 CL171AR CL171AR 4 88 40 7228 68.3 72.4 5.3 6.3 3.3 1.8 048 RU0602174 9502008-A//AR1188/CCDR 4 85 39 7197 61.7 67.7 6 6 3.5 2.3 045 RU0302082 9502008-A/DREW 5 88 37 7070 66.9 72.7 5 6 1.5 0.5 053 RU0504156 CPRS/3/L201//TBNT/BLMT 4 85 38 6891 66.2 70.6 7 6.3 2.5 0.5 049 RU0703049 ((NWBT/RU8303181)/GFMT)/MDSN 4 87 45 6836 70.0 73.2 6 6.3 0.8 2 047 RU0401145 L201//TBNT/BLMT/3/CPRS 6 87 37 6407 66.0 70.1 6.8 6 2.5 1.3 057 PRSC PRISCILLA 4 87 39 6290 64.3 70.5 5.3 4.8 1.8 0 046 RU0703046 (VSTA/..//RSMT)/LMNT//CPRS/(KATY//../PCOS) 5 87 37 6252 67.0 70.4 5.8 5.3 1.5 2.5 044 RU0601044 DREW/UA99-52 6 89 37 5812 63.1 70.2 5 6 1.5 0.3 043 RU0403166 Kaybonnet/Zhongyouzao3 6 90 36 5774 69.5 73.0 6.3 7 3.8 1.8 056 SABR SABER 4 86 41 5704 65.4 68.8 6.8 5.8 2.8 0.3 052 RU0103104 Texmont/TeQing 6 89 35 5536 65.0 71.0 5.8 5.5 2.3 1 041 RU0301041 LMNT//../CICA8/3/DLMT/4/..-(120)/..//BSMT122 5 91 44 4615 65.4 70.3 5 4.3 3 0.3
c.v. % 11.4 1.6 2.7 7.8 1.9 0.96 12.8 12.4 51.5 71.6 LSD0.05 0.86 2.3 1.7 872 2.6 1.4 1.1 1.1 2.0 1.2
† Subjective rating 0 to 9, where 0 = excellent, 9 = poor. ‡ Abbreviations: SB=sheath blight, BPB=bacterial panicle blight, RNB=rotten neck blast, NBLS=narrow brown leaf spot.
7

Table 4. Grain and milling yield, agronomic performance, and disease ratings† of entries in the 2007 Uniform Regional Rice Nursery, Group 4, Rice Research Station, Crowley, LA.
Entry Source Pedigree Vigor†
Days to 50%
Heading
Plant Height
(in) Grain Yield
(lb/A @ 12%)
Milling Yield (%)
SB‡ BPB‡ RNB‡ NBLS‡Whole Total
065 RU0602171 BNGL//MERC/RICO/3/EARL 4 86 36 7998 68.7 72.4 6.8 6 4.8 0.3 068 RU0702068 9502065/3/MERC//MERC/… 5 85 39 7443 70.3 74.0 7.8 5.5 2.8 0.8 079 BNKS BANKS 4 88 45 7387 59.2 68.0 5 5 1 0 076 RU0501102 LGRU-2/DREW 4 85 43 7148 67.8 73.9 6 5.3 2.8 0.8 069 RU0703069 ((VSTA/..//RSMT)/..)/(CPRS/(KATY//../PCOS)) 5 90 40 6701 66.1 70.2 6.5 6.8 1.3 1.3 077 RU0704077 8203035/8401164 4 94 42 6622 54.5 71.4 4.3 4.8 0.8 0.3 064 RU0401182 DREW/5/NWBT/3/../9695//STBN/4/KATY/STBN 4 89 40 6603 65.6 71.5 6.3 5.5 1.8 1.3 061 RU0601061 RU9201176/3/NWBT/KATY//RA73/LMNT 4 88 44 6569 58.4 70.9 5.3 4.3 1 0 072 RU0703072 ((NWBT/RU8303181)/GFMT)/MDSN 5 90 45 6567 68.2 71.7 5.3 5 0.8 2 063 RU0703063 ((VSTA/..//RSMT)/..)/(CPRS/(..//GFMT/PCOS)) 5 88 39 6552 66.6 70.4 6.8 7.5 0.8 0.8 062 RU0602168 BNGL//MERC/RICO/3/MERC/RICO//BNGL 5 86 35 6490 69.9 72.9 7 4.8 5 0.3 080 WLLS WELLS 4 89 42 6480 60.2 71.9 5.3 5 2 0 074 RU0504198 RSMT/KATY 4 86 41 6443 63.1 69.9 5.5 6 6 1 066 RU0703066 (LGRU/..)/(RU8803072/(KATY//GFMT/PCOS)) 5 88 45 6380 65.2 70.8 5.5 5.8 1.3 0.8 067 RU0401067 BRAZ/TBNT/3/../NV66//../4/BNGL/5/BNGL/RICO 5 81 35 5993 67.8 70.9 5.8 6.8 4.3 0.8 071 RU0702071 BNGL/9502065 5 86 38 5775 65.3 69.1 5.5 4.5 5.3 0 073 RU0604186 MBLE//82CAY21/LMNT 5 90 35 5499 65.4 71.5 8 5.8 3.8 3.3 078 RU0403078 PSCL/JEFF 6 85 37 5248 62.9 71.0 6.5 5 5 0.3 075 RU0603075 4483-1693 5 95 43 4824 53.7 67.5 3.8 3.5 0 0 070 RU0701070 ..//KATY/../5/NWBT/..//RA73/../4/LBNT/9902/3/../ 5 92 41 4064 61.8 70.6 5 4.3 4.5 1
c.v. % 8.1 1.4 3.1 8.7 4.5 1.6 11.1 13.4 45.4 86.8 LSD0.05 0.62 2.0 2.1 913 6.1 2.4 0.92 1.0 1.8 0.89
† Subjective rating 0 to 9, where 0 = excellent, 9 = poor. ‡ Abbreviations: SB=sheath blight, BPB=bacterial panicle blight, RNB=rotten neck blast, NBLS=narrow brown leaf spot.
8

Table 5. Grain and milling yield, agronomic performance, and disease ratings† of entries in the 2007 Uniform Regional Rice Nursery, Group 5, Rice Research Station, Crowley, LA.
Entry Source Pedigree Vigor†
Days to 50%
Heading
Plant Height
(in) Grain Yield
(lb/A @ 12%)
Milling Yield (%)
SB‡ BPB‡ RNB‡ NBLS‡Whole Total 087 RU0701087 GP13416/KATY//PI312777 4 85 44 8914 62.7 70.0 6 7.5 6 0 111 RU0701111 FRNS/6/LBNT/9902/3/DAWN/9695//STBN/4/LGRU/5/ 4 88 40 8621 65.1 70.5 5 6 7 0.5 097 RU0702097 CPRS/97T1280DH1/3/CPRS/NWBT//KATY 5 90 43 8143 63.0 70.3 4 4 3.5 0.5 115 RU0702115 KATY/CPRS//NWBT/…/3/9502008/4/CLR9 5 84 36 7841 64.5 70.2 7.5 7 6 0 109 RU0702109 9502008-A//AR1188/CCDR 5 82 39 7754 62.5 68.9 8 6.5 2.5 1 105 RU0701105 LBNT/9902//NWBT/3/KATY/NWBT/5/IR36M4/4/L201/ 4 89 40 7710 64.7 71.3 4 6.5 1 0 117 CCDR COCODRIE 4 84 38 7666 61.5 69.1 7 6 5.5 2.5 112 RU0702112 9502008-A/TACAURI//CFX-18 4 82 39 7591 66.5 71.4 7.5 7 5 1.5 106 RU0702106 CPRS/KBNT/4/9502008/3/CPRS//82CAY21/TBNT 4 87 39 7564 64.9 70.6 6.5 6 4 2 101 RU0703101 MDSN/((NWBT/RU8303181)87:15034/RSMT)TX7129 5 85 42 7463 59.8 71.4 7 5.5 2.5 0 102 RU0701102 91642//KATY/NWBT/5/RU9201176/4/KATY/NWBT/3/ 4 87 36 7451 52.3 69.3 6 8 3 5 085 RU0702085 AR1188/CCDR//9502008/LGRU 4 86 38 7424 63.4 69.9 8 6 4 0 113 RU0703113 CPRS/LGRU 5 90 40 7373 66.7 71.1 6.5 7 1 0.5 081 RU0501081 19991562 4 81 43 7174 63.9 69.4 5 6 3 1 100 RU0704100 IR36/8603006 4 88 41 7166 65.2 70.9 5 5.5 4 2 088 RU0702088 CCDR/9770532DH1//LGRU 4 90 36 7125 61.6 68.1 4.5 5 4.5 1 096 RU0701096 LBNT/9902//NWBT/3/KATY/NWBT/5/IR36M4/4/L201/ 4 87 39 7052 61.3 69.4 4.5 4.5 1 0.5 084 RU0501084 DREW/UA99-52 5 87 40 7039 55.1 67.1 7 6.5 3.5 1 091 RU0702091 CPRS/9901081 5 88 38 7002 65.4 70.3 6 6.5 5.5 0.5 114 RU0704114 DLMT/KATY 4 87 37 6899 65.5 71.7 7 5.5 4.5 0 116 RU0703116 CPRS/LGRU 5 89 38 6766 67.3 70.6 7.5 6.5 2 2.5 086 RU0703086 ((NWBT/RU8303181)/GFMT)/MDSN 5 86 44 6733 66.4 71.2 6.5 6.5 3.5 1.5 099 RU0501099 WLLS/PI584698//ZHE733 5 91 42 6656 61.4 70.3 4 3 2 0.5 103 RU0702103 FRAN/CCDR 5 89 38 6649 63.2 70.1 5.5 7 5 1.5 082 RU0702082 AR1142/JODN/4/NWBT/KATY/3/82CAY21/... 5 90 37 6567 63.1 72.0 6 6 5 1 083 RU0704083 TBNT/LA110//LMNT/3/TBNT 4 86 41 6479 60.2 70.9 6.5 7 6.5 3.5 108 RU0601108 LBNT/9902/3/DAWN/9695//STBN/4/LGRU/5/WLLS 5 91 41 6336 66.5 71.7 4 5.5 1.5 0 104 RU0503178 (GFMT/RU8703196)TX6141/CCDR 5 90 37 6329 65.5 71.3 6 3.5 5 0 094 RU0702094 AR1179/3/CPRS//…/4/WELLS 6 93 38 6053 54.7 67.9 6.5 4 2.5 0 090 RU0601090 LBNT/9902/3/DAWN/9695//STBN/4/LGRU/5/DREW 4 89 42 5874 61.7 69.6 6 7 1 0 118 HDGO HILDAGO 7 86 39 5871 62.8 67.7 7.5 6.5 7 4.5 119 L205 L205 3 80 41 5870 61.5 68.6 8 6 6 1.5 098 RU0703098 CPRS/LGRU 5 89 36 5862 65.5 70.9 6 4.5 4.5 2 093 RU0701093 WLLS/ZHE733 5 88 35 5662 65.5 71.6 4.5 6 3.5 2 107 RU0703107 (RU8803072/(KATY//GFMT/PCOS))/DXBL 6 89 38 5325 65.2 71.9 6.5 5.5 4 0 110 RU0703110 (DF5-68)/TX8946 6 89 39 5303 63.5 68.3 6.5 6.5 5.5 1.5 120 DXBL DIXIEBELLE 6 89 36 4963 61.9 68.6 4 6 5 1 095 RU0603095 Arborio 7 78 49 3993 57.1 69.7 5.5 4 7 3.5 092 RU0703092 (DLMT/(LMNT*3/JSMN))/DF5-68 6 90 41 3688 62.6 67.4 . . . . 089 RU0703089 IAC600 5 75 44 2859 63.5 69.7 7 6.5 3 0.5
c.v. % 11.4 1.3 4.0 8.0 3.9 1.5 13.0 16.2 35.4 51.8 LSD0.05 1.0 2.2 3.2 1066 5.0 2.1 1.6 2.0 2.9 1.3
† Subjective rating 0 to 9, where 0 = excellent, 9 = poor. ‡ Abbreviations: SB=sheath blight, BPB=bacterial panicle blight, RNB=rotten neck blast, NBLS=narrow brown leaf spot.
9

Table 6. Grain and milling yield, agronomic performance, and disease ratings† of entries in the 2007 Uniform Regional Rice Nursery, Group 6, Rice Research Station, Crowley, LA.
Entry Source Pedigree Vigor†
Days to 50%
Heading
Plant Height
(in)Grain Yield
(lb/A @ 12%)
Milling Yield (%)
SB‡ BPB‡ RNB‡ NBLS‡Whole Total
160 FRNS FRANCIS 4 85 42 8440 59.9 66.9 6 8 6 0.5 131 RU0702131 MBLE/ALAN/6/CCDR/5/MARS/…/JAF4 5 83 41 8404 57.4 70.2 5.5 6 6 0.5 138 RU0703138 CPRS/3/CPRS/NWBT/KATY 5 86 40 8181 60.5 69.6 7 4.5 4.5 2 133 RU0501133 KATY/NWBT//L201/7402003/3/WLLS 5 87 42 8171 60.6 70.5 4 5.5 1.5 0 125 RU0702125 MBLE/ALAN/4/L201//…/5/MBLE/…/4/CCDR/… 5 83 41 7986 58.0 69.5 7 7 5.5 2 144 RU0703144 CPRS/CCDR 5 86 39 7839 65.5 71.4 7 6 3 1 141 RU0703141 LCSN/LGRU 5 90 41 7756 64.1 69.8 6.5 5.5 4 1 148 RU0701148 IRGA409/RXMT/5/BRAZ/TBNT/3/164986- 5 87 36 7543 56.6 70.1 6 7 3.5 1.5 142 RU0701142 L-29-079/LGRU 6 90 46 7477 61.0 68.8 5.5 5.5 3.5 0.5 122 RU0704122 IR36/8603006 4 86 41 7457 62.5 69.1 6 5.5 5 1.5 121 RU0601121 RU9901127/GP-2 5 85 34 7408 69.4 71.7 6.5 7.5 1 1 134 RU0702134 CCDR/5/MARS/…/6/CCDR/4/CPRS/… 5 80 41 7313 64.4 69.3 8 7 4.5 2 127 RU0701127 LGRU//KATY/STBN/3/NWBT/KATY 5 89 44 7144 58.7 69.0 6 5.5 3.5 0.5 156 RU0704156 CPRS//NWBT/KATY 5 87 36 6869 60.3 71.4 5.5 5.5 4.5 1 128 RU0702125 9602097/...//JAF4/…/6/CCDR/…/7/JAF4 5 86 38 6866 65.0 70.5 6 5 5 1 149 RU0702149 DLRS//KBNT/JODN 5 87 39 6794 63.3 70.2 6.5 5.5 3 3 137 RU0702137 TXMT/…/5/AR1053/7/CCDR/…/6/CCDR/5/MARS/… 6 87 35 6725 66.1 71.5 5 6 4.5 1 135 RU0703135 (AF5-144-1-2)/(DLMT/(LMNT*3/JSMN)) 6 89 39 6567 58.6 67.1 6.5 7 4.5 1 147 RU0703147 CPRS/CCDR 5 87 38 6470 60.8 68.3 6.5 6.5 3.5 0 136 RU0501136 STG99F5-13-025/MDRK 7 87 35 6219 65.4 72.3 6.5 7.5 1 0 150 RU0503150 ((NWBT/RU8303181)/GFMT))TX7181/CCDR 6 88 39 6131 65.6 71.2 7 5 4 3 123 RU0703123 ((NWBT/RU8303181)/GFMT)/MDSN 6 89 40 6011 68.7 72.4 6.5 6.5 2.5 1.5 140 RU0502177 L202/LEAH//TORO/3/IR67016 5 84 39 5984 57.5 69.9 7.5 5.5 5.5 0 158 DLRS DELLROSE 5 87 44 5965 68.2 72.9 5 5.5 3 0.5 155 RU0602155 05SBYT119 5 88 33 5921 66.9 70.6 5 6 4.5 0 126 RU0503126 ((NWBT/RU8303181)/RSMT))TX7144/JEFF 5 91 40 5917 69.0 72.0 7 5 1 0 154 RU0704154 GFMT/TBNT/LA110 5 90 35 5825 66.7 71.4 6.5 6.5 4 0 151 RU0501151 MDRK/UA99-123 5 87 35 5770 62.1 70.1 5.5 6.5 0 0 146 RU0602146 CPRS/LGRU//97KDMX2-5 5 87 39 5756 67.5 71.4 5.5 7 2.5 0.5 159 SBNE SABINE 5 88 38 5575 67.0 72.1 4.5 6.5 5.5 2 132 RU0703132 (DLMT/(LMNT*3/JSMN))/((CPRS/PELDE)/JEFF) 7 91 41 5378 64.4 69.3 6 5 2.5 0 157 RU0704157 DLMT/KATY 4 89 37 5313 65.3 71.8 5 4.5 4 0 152 RU0702152 06SBYT-67 6 91 38 5299 63.8 68.9 4.5 6 5 0.5 139 RU0501139 SHUFENG121-1655 5 96 43 5229 53.6 67.4 . . 3 0 143 RU0702143 06TT-11 5 87 32 5204 64.0 70.5 4.5 6 5 0.5 124 RU0701124 DREW/UA99-167 6 85 38 5175 60.0 68.0 5 5 2 0 153 RU0703153 L201/SABR 4 83 40 5165 57.7 66.6 7.5 6.5 5 0 129 RU0703129 (DLMT/(LMNT*3/JSMN))/((CPRS/PELDE)/JEFF) 7 91 40 5121 64.8 69.9 6 6 2.5 0 130 RU0601130 WLLS/INIAP-12//ZHE733 7 94 40 3709 58.2 69.0 . . . . 145 RU0501145 PI584720/ZHE733 6 92 41 3588 61.8 68.2 7.5 4.5 2.5 0.5
c.v. % 14.7 1.5 3.9 8.8 3.3 2.7 12.7 13.2 28.2 139 LSD0.05 1.5 2.6 3.0 1139 4.2 2.4 1.6 1.6 2.1 2.2
† Subjective rating 0 to 9, where 0 = excellent, 9 = poor. ‡ Abbreviations: SB=sheath blight, BPB=bacterial panicle blight, RNB=rotten neck blast, NBLS=narrow brown leaf spot.
10

Table 7. Grain and milling yield, agronomic performance, and disease ratings† of entries in the 2007 Uniform Regional Rice Nursery, Group 7, Rice Research Station, Crowley, LA.
Entry Source Pedigree Vigor†
Days to 50%
Heading
Plant Height
(in) Grain Yield
(lb/A @ 12%)
Milling Yield (%)
SB‡ BPB‡ RNB‡ NBLS‡Whole Total 200 XL723 XL723 5 81 47 9530 62.1 71.7 5.5 2 5 0 165 RU0702165 EARL/9902028 4 81 42 9332 67.5 72.1 5.5 7.5 5 1 180 RU0702180 TACAURI/3/CPRS//82CAY21/TBNT/4/CFX-18 5 83 41 8719 62.1 69.0 7.5 5 5 2.5 167 RU0701167 FRNS/6/LBNT/9902/3/DAWN/9695//STBN/4/LGRU/5/ 4 87 43 8620 63.0 70.6 6 7 6 0 177 RU0702177 FRANCIS/CLR13 4 81 40 8454 65.3 72.2 6 5 4 1.5 174 RU0702174 CFX-18//CCDR/9770532DH2 4 83 38 8389 61.8 68.5 8 5.5 5.5 2 195 RU0702195 9502008-A/TACAURI//CFX-18 5 83 39 8264 65.4 71.1 7.5 7 5 2.5 179 RU0701179 LBNT/9902/3/DAWN/9695//STBN/4/LGRU/5/DREW 4 88 43 8124 60.7 70.3 5 5.5 4 1 187 RU0603187 Tesanai2 6 95 47 8069 58.5 67.0 6 6 5 2 188 RU0601188 LGRU//KATY/STBN/5/LGRU//LMNT/RA73/3/LGRU/4 4 89 44 7707 57.9 70.4 5 5.5 5 0 170 RU0601170 LBNT/9902/3/DAWN/9695//STBN/4/LGRU/5/LGRU/MI 5 89 41 7646 63.3 70.4 5 7.5 4 0.5 192 RU0702192 CFX-26/9702128 5 83 37 7604 65.4 70.4 8 7 5 0.5 162 RU0702162 BNGL//MERC/RICO/3/MERC/RICO//BNGL 5 87 36 7526 67.3 70.4 5.5 7 4.5 1 185 RU0601185 RU9201176/4/LBNT/STBN//NWBT/3/MILL/5/WLLS 4 88 45 7490 60.1 69.1 4 5 3 0 181 RU0703181 CPRS/CCDR 5 87 38 7437 61.7 70.7 6 6 3 0.5 173 RU0501173 LBNT/9902/3/DAWN/9695//STBN/4/LGRU/5/WLLS 4 86 39 7397 60.7 71.5 5 7.5 4.5 0 172 RU0703172 CCDR/L202 4 88 50 7375 59.5 68.3 6 4 4.5 0.5 189 RU0702189 DREW/CFX-18 5 88 41 7373 66.2 71.8 7 4 3.5 0 164 RU0401164 LBNT/9902/3/DAWN/9695//STBN/4/LGRU/5/WLLS 5 92 45 7367 58.4 68.4 4 6 3.5 0.5 171 RU0702171 BNGL//MERC/RICO/3/MERC/RICO//BNGL 5 87 35 7335 69.7 71.7 5 7 4.5 0.5 168 RU0702168 EARL/9902028 5 87 36 7107 62.9 69.7 7 6.5 6 0.5 183 RU0702183 CFX-26/9702128 5 90 38 7011 61.0 68.4 6.5 7.5 5.5 0 190 RU0703190 CCDR/L202 6 83 38 6835 63.1 70.6 7 6.5 6 0 197 RU0704197 IR36/8603006 4 87 43 6771 63.9 69.3 6 6.5 5 0.5 196 RU0704196 8904186/sel919/NWBT 4 88 38 6721 59.5 70.1 5 6.5 5 1 175 RU0703175 LCSN/LGRU 6 90 46 6685 62.6 69.1 6 5 3.5 0 199 CPRS CYPRESS 5 88 38 6629 67.3 71.3 7 7 3.5 0.5 184 RU0703184 L201/SABR 4 79 39 6626 64.8 68.5 7 5 5 1 176 RU0701176 LBNT/9902/3/DAWN/9695//STBN/4/LGRU/4/DREW 5 92 43 6552 58.1 66.4 5.5 6.5 2.5 0 161 RU0701161 LGRU/3/LMNT/KATY//LMNT/RA73 3 92 44 6504 58.1 68.1 4.5 4.5 3.5 0 194 RU0704194 88040032/KATY 5 87 40 6373 65.4 70.6 4.5 6.5 3.5 0 191 RU0704191 GFMT/TBNT/LA110 5 89 35 5907 67.6 71.2 6.5 6.5 5 0 182 RU0601182 LBNT/9902/3/DAWN/9695//STBN/4/DLLA/KATY/5/D 5 90 36 5614 60.4 71.2 5 7.5 2.5 0 193 RU0704193 NWBT/C4-63 5 91 44 5580 60.7 68.4 5 4 2 0 186 RU0704186 CPRS//NWBT/KATY 5 90 31 5478 66.5 70.3 6.5 7 3 0 198 RU0704198 9002065/NWBT 4 96 40 5386 61.5 69.1 5.5 4 3.5 0 169 RU0503169 ((NWBT/RU8303181)/GFMT))TX7181/CCDR 7 92 42 5168 62.1 69.7 6.5 6.5 5 1 178 RU0703178 HB-1 9 95 44 4160 70.7 58.4 4 7 0 0 163 RU0503163 ((NWBT/RU8303181)/GFMT))TX7181/CCDR 6 94 39 3932 62.5 70.3 7 6 5 0.5 166 RU0603166 4484-1665 5 95 42 3437 50.1 63.6 3.5 3.5 2.5 0
c.v. % 7.4 1.3 3.3 10.0 3.6 2.1 12.7 11.8 23.5 105.0 LSD0.05 0.70 2.4 2.7 1364 4.6 2.9 1.5 1.4 2.0 1.1
† Subjective rating 0 to 9, where 0 = excellent, 9 = poor. ‡ Abbreviations: SB=sheath blight, BPB=bacterial panicle blight, RNB=rotten neck blast, NBLS=narrow brown leaf spot.
11

12
COMMERCIAL-ADVANCED YIELD TRIALS
The Commercial-Advanced yield trial (CA) is a multi-location test conducted by the Rice Breeding Project in the major rice-growing regions in Louisiana. The objective of this study is to evaluate the adaptation and stability of entries for several important characteristics. Data evaluated includes grain yield, whole and total milling percentages, seedling vigor, maturity, plant height, lodging resistance, ratoon crop potential, and resistance to sheath blight, bacterial panicle blight, rotten neck blast, and narrow brown leaf spot diseases. Entries include commercial varieties, hybrids, and advanced experimental lines. Test locations in 2007 included the Rice Research Station at Crowley (RRS) and four on-farm test sites in Evangeline, Vermilion, Morehouse, and Richland parishes. Each location represents a different environment and allows researchers to evaluate entries with different planting dates, soil types, climatic conditions, management systems, disease pressure, and numerous other variables. Standard agronomic procedures (except that no fungicides were applied) were used at each individual location. Sixty entries were tested in a randomized complete block design with three replications at all locations and plots were 4.66 x 16 ft. Variety and hybrid plots were drill-seeded at 90 and 38 lb/A, respectively. Dr. Don Groth and the Rice Pathology Project provided the sheath blight, rotten neck blast, bacterial panicle blight, and narrow brown leaf spot disease ratings. Planting dates were: RRS, March 19; Evangeline, April 23; Vermilion, March 21; Morehouse, May 2; and Richland, March 28. Harvest dates were: RRS, August 7; Evangeline, August 15; Vermilion, August 3; Morehouse, September 5; and Richland, August 21. Results from these tests are shown in Tables 2 to 6. Table 1. Entry number, pedigree, grain type, and source information for entries in the Commercial- Advanced Trial, 2007.
Entry Pedigree
Grain Type† Source‡
201 CL131 L LAES 202 CL161 L LAES 203 CL151 L LAES 204 CL171 L AAES 205 TRENASSE L LAES 206 SPRING L AAES 207 COCODRIE L LAES 208 CHENIERE L LAES 209 CYPRESS L LAES 210 WELLS L AAES 211 BANKS L AAES 212 CYBONNET L AAES 213 JUPITER M LAES 214 BENGAL M LAES 215 PIROGUE S LAES 216 PRESIDIO L TAES, USDA 217 DELLROSE L(A) LAES 218 CATAHOULA L LAES 219 CLXL729 L RiceTec 220 CLXL730 L RiceTec 221 XL723 L RiceTec 222 XP744 L RiceTec 223 CLXP745 L RiceTec
Continued.

13
Table 1. Continued.
Entry Pedigree
Grain Type† Source‡
224 CCDR/9502008-A L LAES 225 9901081/CCDR L LAES 226 KATY/CPRS//JKSN/3/AR1188/CCDR L LAES 227 CPRS/KBNT//9502008-A L LAES 228 9502008/CPRS L LAES 229 9502008-A//AR1188/CCDR L LAES 230 9502008-A//AR1188/CCDR L LAES 231 AR1142/JODN/4/NWBT/KATY/3/82CAY21/... L LAES 232 AR1188/CCDR//9502008/LGRU L LAES 233 CCDR/9770532DH1//LGRU L LAES 234 CPRS/9901081 L LAES 235 AR1179/3/CPRS//…/4/WELLS L LAES 236 CPRS/97T1280DH1/3/CPRS/NWBT//KATY L LAES 237 CFX-26/9702128 L LAES 238 DREW/CFX-18 L LAES 239 CFX-26/9702128 L LAES 240 CCDR/5/MARS/M201//MARS… L LAES 241 96INT/AHRENT L LAES 242 NEPTUNE M LAES 243 CCDR/5/MARS/…/6/L202/…/7/CCDR/… L LAES 244 JODN/AR1121/7/CCDR/…/6/CCDR/5/MARS/… M LAES 245 TXMT/…/5/AR1053/7/CCDR/…/6/CCDR/5/MARS/… M LAES 246 L202/LEAH//TORO/3/IR67016 L(AE) LAES 247 CPRS/LGRU//97KDMX2-5 L(A) LAES 248 BNGL//MERC/RICO/3/MERC/RICO//BNGL M LAES 249 BNGL//MERC/RICO/3/EARL M LAES 250 9502065/3/MERC//MERC/… M LAES 251 BNGL/9502065 M LAES 252 BNGL//MERC/RICO/3/MERC/RICO//BNGL M LAES 253 YD-4/RSMT L LAES 254 XP723xCLXP730 L LAES 255 XP723xCCDR L LAES 256 XP723xURN152 L LAES 257 CLXP730xCCDR L LAES 258 CLXP730xURN152 L LAES 259 CCDRxURN152 L LAES 260 8603006/3/MARS/NWRX//TBNT L MAFES
† L = Long grain, M = Medium grain, and S = Short grain, (A = Aromatic, E = Elongating). ‡ AAES, Rice Research and Extension Center, Arkansas Agricultural Experiment Station, Stuttgart, AR; LAES, Rice Research Station, Louisiana Agricultural Experiment Station, LSU Agricultural Center, Crowley, LA; MAFES, Delta Research and Extension Center, Mississippi Agricultural and Forestry Experiment Station; TAES, USDA, Texas A&M Research and Education Center, Texas Agricultural Experiment Station, U.S. Department of Agriculture, Beaumont, TX; and RiceTec, RiceTec Inc., Alvin, TX.

14
Table 2. Grain and milling yield and agronomic performance of entries in the 2007 Commercial-Advanced Yield Trial, Rice Research Station, Crowley, LA.
Entry Source Vigor†
Days to 50%
Heading
Plant Height
(in)
Grain Yield (lb/A @ 12%)
Milling Yield (%)
Main 2nd Total
Whole Total
220 CLXL730 5 84 47 9451 2745 12196 58.8 68.6 221 XL723 5 81 46 9328 2601 11929 58.6 70.3 219 CLXL729 5 83 43 9196 2967 12163 61.3 70.4 254 XP723xCLXP730 5 83 47 9104 2714 11818 60.2 72.4 257 CLXP730xCCDR 4 83 47 8988 2343 11330 59.3 68.9 256 XP723xURN152 4 82 43 8933 2505 11438 58.0 68.6 258 CLXP730xURN152 4 83 48 8862 2388 11250 53.8 68.3 223 CLXP745 6 81 46 8783 2265 11047 58.9 72.1 255 XP723xCCDR 4 83 44 8728 2180 10908 60.2 70.7 211 BANKS 4 88 44 8714 2165 10879 61.4 70.3 222 XP744 5 82 45 8694 2347 11041 59.9 72.2 252 RU0702162 4 85 37 8593 2189 10783 67.4 73.8 208 CHENIERE 4 87 37 8572 1517 10088 62.2 72.1 250 RU0702068 4 86 40 8561 1632 10192 69.0 73.9 203 CL151 4 83 38 8438 1953 10391 59.5 67.4 202 CL161 4 87 41 8381 2050 10431 65.2 70.8 236 RU0702097 5 89 41 8370 1920 10290 60.0 68.1 205 TRENASSE 5 79 41 8274 1636 9910 59.0 65.6 213 JUPITER 6 86 38 8239 1471 9710 65.8 71.2 214 BENGAL 4 86 38 8227 1536 9763 69.1 72.0 253 RU0602152 4 84 40 8207 2248 10455 53.1 63.1 231 RU0702082 4 86 36 8121 1847 9968 65.2 70.5 259 CCDRxURN152 3 81 39 8111 1968 10079 60.2 68.0 243 RU0702031 4 81 40 8106 1879 9986 63.1 68.9 201 CL131 4 82 37 8106 1401 9507 64.0 70.0 227 RU0502022 4 83 36 8069 2452 10522 62.5 69.7 249 RU0602171 4 86 37 8033 2153 10186 67.2 71.9 207 COCODRIE 4 84 37 8031 1826 9857 63.5 71.7 232 RU0702085 4 84 37 7978 2025 10003 59.9 68.7 238 RU0702189 4 87 43 7963 2079 10042 66.3 71.7 239 RU0702192 5 82 39 7926 2331 10257 65.9 70.4 228 RU0602189 4 85 36 7900 2393 10293 66.4 71.9 204 CL171 4 87 40 7807 2408 10215 66.6 72.0 224 RU0602085 4 81 37 7794 1493 9287 59.5 68.5 237 RU0702183 4 88 40 7732 2110 9842 57.7 65.8 212 CYBONNET 4 85 38 7702 2126 9829 68.2 72.3 244 RU0702034 4 80 41 7701 1869 9569 62.0 68.9 230 RU0602183 5 83 36 7696 1873 9570 64.0 70.7 251 RU0702071 4 85 38 7670 1559 9229 63.7 68.0 233 RU0702088 4 88 36 7654 2294 9949 64.3 70.8 225 RU0602109 3 82 35 7642 1423 9064 62.2 69.6 240 RU0502094 3 83 41 7638 1874 9512 63.6 69.7 242 NEPTUNE 4 87 36 7630 2145 9775 69.3 72.4 210 WELLS 4 88 41 7603 2111 9714 59.8 71.7 248 RU0602168 5 87 35 7565 2142 9707 68.1 72.2 229 RU0602174 5 82 38 7563 1665 9228 62.4 70.0 209 CYPRESS 5 88 38 7510 1923 9433 66.7 70.6 226 RU0602103 4 82 40 7472 1710 9183 63.5 70.1 206 SPRING 3 78 46 7447 2146 9593 61.6 72.1 234 RU0702091 4 85 39 7352 2433 9785 64.9 71.2 235 RU0702094 4 92 38 7271 1960 9230 56.4 69.6 218 CATAHOULA 5 87 37 7220 2300 9521 67.9 73.6 241 RU0402125 5 88 40 7088 952 8040 55.5 71.1
Continued.
15
Table 2. Continued.
Entry Source Vigor†
Days to 50%
Heading
Plant Height
(in)
Grain Yield (lb/A @ 12%)
Milling Yield (%)
Main 2nd Total
Whole Total
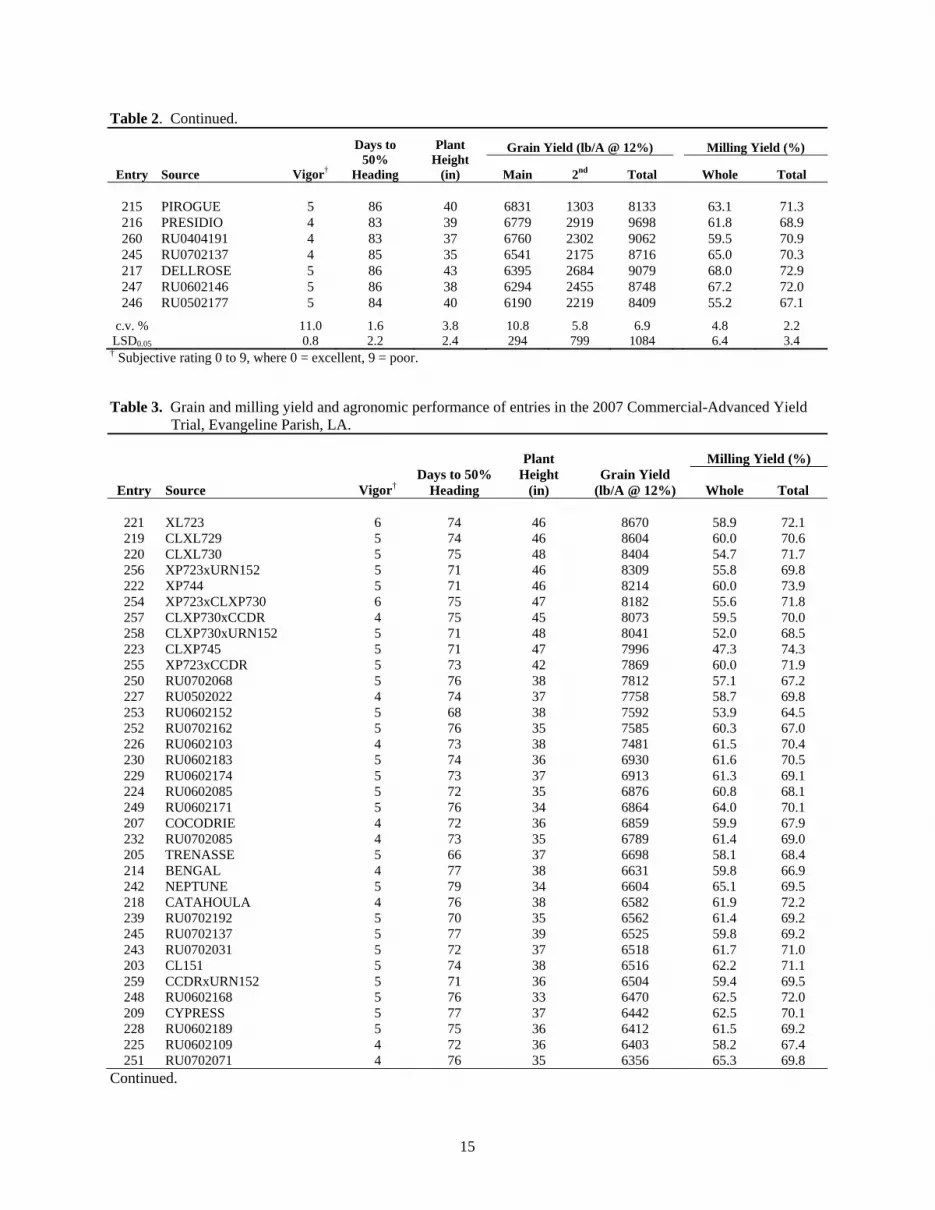
215 PIROGUE 5 86 40 6831 1303 8133 63.1 71.3 216 PRESIDIO 4 83 39 6779 2919 9698 61.8 68.9 260 RU0404191 4 83 37 6760 2302 9062 59.5 70.9 245 RU0702137 4 85 35 6541 2175 8716 65.0 70.3 217 DELLROSE 5 86 43 6395 2684 9079 68.0 72.9 247 RU0602146 5 86 38 6294 2455 8748 67.2 72.0 246 RU0502177 5 84 40 6190 2219 8409 55.2 67.1
c.v. % 11.0 1.6 3.8 10.8 5.8 6.9 4.8 2.2 LSD0.05 0.8 2.2 2.4 294 799 1084 6.4 3.4
† Subjective rating 0 to 9, where 0 = excellent, 9 = poor. Table 3. Grain and milling yield and agronomic performance of entries in the 2007 Commercial-Advanced Yield Trial, Evangeline Parish, LA.
Entry Source Vigor† Days to 50%
Heading
Plant
Height (in)
Grain Yield (lb/A @ 12%)
Milling Yield (%)
Whole Total
221 XL723 6 74 46 8670 58.9 72.1 219 CLXL729 5 74 46 8604 60.0 70.6 220 CLXL730 5 75 48 8404 54.7 71.7 256 XP723xURN152 5 71 46 8309 55.8 69.8 222 XP744 5 71 46 8214 60.0 73.9 254 XP723xCLXP730 6 75 47 8182 55.6 71.8 257 CLXP730xCCDR 4 75 45 8073 59.5 70.0 258 CLXP730xURN152 5 71 48 8041 52.0 68.5 223 CLXP745 5 71 47 7996 47.3 74.3 255 XP723xCCDR 5 73 42 7869 60.0 71.9 250 RU0702068 5 76 38 7812 57.1 67.2 227 RU0502022 4 74 37 7758 58.7 69.8 253 RU0602152 5 68 38 7592 53.9 64.5 252 RU0702162 5 76 35 7585 60.3 67.0 226 RU0602103 4 73 38 7481 61.5 70.4 230 RU0602183 5 74 36 6930 61.6 70.5 229 RU0602174 5 73 37 6913 61.3 69.1 224 RU0602085 5 72 35 6876 60.8 68.1 249 RU0602171 5 76 34 6864 64.0 70.1 207 COCODRIE 4 72 36 6859 59.9 67.9 232 RU0702085 4 73 35 6789 61.4 69.0 205 TRENASSE 5 66 37 6698 58.1 68.4 214 BENGAL 4 77 38 6631 59.8 66.9 242 NEPTUNE 5 79 34 6604 65.1 69.5 218 CATAHOULA 4 76 38 6582 61.9 72.2 239 RU0702192 5 70 35 6562 61.4 69.2 245 RU0702137 5 77 39 6525 59.8 69.2 243 RU0702031 5 72 37 6518 61.7 71.0 203 CL151 5 74 38 6516 62.2 71.1 259 CCDRxURN152 5 71 36 6504 59.4 69.5 248 RU0602168 5 76 33 6470 62.5 72.0 209 CYPRESS 5 77 37 6442 62.5 70.1 228 RU0602189 5 75 36 6412 61.5 69.2 225 RU0602109 4 72 36 6403 58.2 67.4 251 RU0702071 4 76 35 6356 65.3 69.8
Continued.

16
Table 3. Continued.
Entry Source Vigor† Days to 50%
Heading
Plant
Height (in)
Grain Yield (lb/A @ 12%)
Milling Yield (%)
Whole Total
211 BANKS 5 80 42 6329 52.4 65.0 208 CHENIERE 4 76 35 6291 61.1 72.9 240 RU0502094 4 73 37 6290 62.0 70.2 213 JUPITER 6 78 37 6105 59.6 66.2 206 SPRING 5 67 41 6104 62.9 71.8 244 RU0702034 4 70 38 5945 58.8 66.8 202 CL161 4 77 37 5934 62.9 72.2 210 WELLS 4 78 41 5770 54.7 70.6 233 RU0702088 5 77 36 5733 57.8 69.1 231 RU0702082 5 78 35 5623 62.7 71.1 237 RU0702183 4 79 39 5594 57.4 66.6 216 PRESIDIO 4 72 35 5529 61.7 71.3 201 CL131 5 75 32 5505 63.0 71.9 247 RU0602146 6 77 37 5491 57.7 68.3 236 RU0702097 5 81 41 5439 48.9 64.1 212 CYBONNET 5 77 36 5430 65.7 72.9 204 CL171 4 77 39 5366 54.7 69.7 260 RU0404191 5 79 36 5320 55.3 69.8 238 RU0702189 5 79 38 5035 57.8 67.9 246 RU0502177 5 74 39 5031 59.5 71.8 234 RU0702091 5 75 38 4852 44.7 62.2 217 DELLROSE 6 77 38 4804 62.1 70.3 235 RU0702094 5 82 37 4603 47.1 64.7 241 RU0402125 5 78 35 4092 58.6 68.3 215 PIROGUE 6 78 38 3209 49.1 65.1
c.v. % 11.7 1.7 4.4 9.2 6.6 2.8 LSD0.05 0.92 2.0 2.8 956 7.8 3.6
† Subjective rating 0 to 9, where 0 = excellent, 9 = poor. Table 4. Grain and milling yield, agronomic performance, and disease resistance of entries in the 2007 Commercial-Advanced Yield Trial, Vermilion Parish, LA.
Entry Source Vigor†
Days to 50%
Heading
Plant Height
(in) Lodging
Grain Yield (lb/A @
12%)
Milling Yield (%)
SB† BPB† Whole Total
223 CLXP745 8 82 43 3 8771 56.3 69.9 5 2 220 CLXL730 5 84 44 8715 58.1 68.7 6 2 219 CLXL729 6 83 43 8693 56.9 67.9 6 1 222 XP744 7 81 44 8 8607 58.1 70.7 6 2 221 XL723 5 83 45 8496 61.9 70.7 6 2 254 XP723xCLXP730 6 84 46 8473 61.4 71.3 6 2 258 CLXP730xURN152 5 82 45 7192 59.1 68.4 7 3 255 XP723xCCDR 4 84 43 5 6891 60.9 70.7 7 3 256 XP723xURN152 5 82 42 10 6806 57.9 67.9 7 4 257 CLXP730xCCDR 5 85 45 8 6562 58.3 68.1 7 3 253 RU0602152 5 79 40 27 5854 58.7 67.0 7 4 213 JUPITER 6 88 38 5819 56.3 61.7 6 1 252 RU0702162 4 87 36 5648 53.7 59.9 6 4 248 RU0602168 6 88 36 5632 59.9 65.3 5 4 250 RU0702068 5 85 38 5624 56.3 62.3 6 5 242 NEPTUNE 6 88 36 5611 53.4 59.6 5 3 214 BENGAL 5 87 38 5483 52.9 58.6 6 4
Continued.

17
Table 4. Continued.
Entry Source Vigor†
Days to 50%
Heading
Plant Height
(in) Lodging
Grain Yield (lb/A @
12%)
Milling Yield (%)
SB† BPB† Whole Total
211 BANKS 5 83 42 5383 47.0 62.6 6 5 232 RU0702085 5 81 38 7 5363 54.8 65.7 7 4 216 PRESIDIO 4 80 37 5354 61.4 70.0 8 5 215 PIROGUE 6 88 40 5317 56.4 66.4 4 2 236 RU0702097 6 87 43 5308 49.5 63.2 6 5 218 CATAHOULA 6 81 36 32 5226 60.6 69.3 7 4 243 RU0702031 5 81 36 5187 60.7 68.5 7 5 208 CHENIERE 5 84 35 3 5159 59.2 67.5 7 4 241 RU0402125 6 85 41 5157 46.6 59.4 6 4 251 RU0702071 4 85 38 5143 53.4 61.1 6 4 210 WELLS 5 85 44 5102 52.3 65.2 7 6 229 RU0602174 5 80 36 17 5054 57.8 66.3 7 5 249 RU0602171 4 86 36 5003 56.4 63.3 6 5 259 CCDRxURN152 4 82 38 4998 55.8 64.0 7 4 205 TRENASSE 6 76 37 38 4946 61.3 68.3 8 5 247 RU0602146 5 82 36 10 4881 58.7 68.0 6 3 228 RU0602189 6 82 36 4834 53.3 64.6 7 5 203 CL151 5 82 40 3 4779 54.9 65.1 8 6 260 RU0404191 5 81 37 3 4767 54.0 67.3 7 4 245 RU0702137 5 80 35 4748 60.9 64.2 8 5 246 RU0502177 6 82 38 17 4627 56.7 68.8 8 4 225 RU0602109 5 81 34 4627 57.0 66.7 7 5 207 COCODRIE 5 81 36 10 4612 55.0 65.8 8 5 237 RU0702183 6 84 39 4589 47.9 60.4 7 6 244 RU0702034 5 78 39 27 4523 59.1 68.7 8 3 227 RU0502022 5 81 38 42 4486 57.6 67.7 8 4 235 RU0702094 6 89 39 4440 36.6 56.1 6 4 238 RU0702189 6 86 41 3 4427 55.1 65.7 7 5 217 DELLROSE 6 83 39 18 4406 59.5 68.5 7 4 234 RU0702091 6 82 38 4400 53.3 63.1 7 6 206 SPRING 4 77 39 63 4385 57.0 69.9 8 3 201 CL131 5 82 36 12 4274 62.5 69.1 8 5 233 RU0702088 5 85 38 3 4273 47.0 59.0 7 6 239 RU0702192 6 80 36 12 4241 62.8 68.3 8 6 231 RU0702082 5 86 37 4220 51.0 61.5 7 6 240 RU0502094 5 82 38 23 4176 58.9 67.1 8 5 230 RU0602183 6 80 36 8 4135 57.1 67.0 8 6 204 CL171 4 84 40 4018 54.3 64.8 7 5 209 CYPRESS 7 86 39 3908 55.3 64.1 7 6 224 RU0602085 5 80 35 15 3827 61.0 68.7 8 5 226 RU0602103 6 80 39 20 3799 58.8 67.2 8 5 202 CL161 4 86 39 3 3798 58.2 67.3 8 6 212 CYBONNET 5 82 35 3 3794 62.5 69.3 8 6
c.v. % 10.3 1.5 4.6 104 6.7 4.9 2.8 6.4 18.4 LSD0.05 0.9 1.9 2.9 11.8 575 5.5 3.7 0.7 2.0
† Subjective rating 0 to 9, where 0 = excellent, 9 = poor.

18
Table 5. Grain and milling yield and agronomic performance of entries in the 2007 Commercial- Advanced Yield Trial, Morehouse Parish, LA.
Entry Source Days to 50% Heading Plant Height
(in) Grain Yield
(lb/A @ 12%)
219 CLXL729 80 46 9463 220 CLXL730 80 49 9446 213 JUPITER 80 41 9227 223 CLXP745 76 49 9183 254 XP723xCLXP730 80 49 9158 221 XL723 78 48 8999 250 RU0702068 80 40 8753 242 NEPTUNE 81 38 8674 251 RU0702071 78 40 8661 215 PIROGUE 79 42 8640 252 RU0702162 82 41 8553 222 XP744 75 49 8537 205 TRENASSE 74 43 8337 255 XP723xCCDR 78 44 8207 257 CLXP730xCCDR 80 47 8086 258 CLXP730xURN152 73 48 8042 256 XP723xURN152 72 46 7994 248 RU0602168 80 37 7956 214 BENGAL 80 40 7868 236 RU0702097 83 40 7641 226 RU0602103 76 40 7626 249 RU0602171 79 38 7603 232 RU0702085 79 39 7573 227 RU0502022 79 39 7421 229 RU0602174 76 38 7416 224 RU0602085 77 38 7354 260 RU0404191 82 39 7297 203 CL151 80 40 7284 225 RU0602109 77 36 7254 230 RU0602183 78 38 7213 207 COCODRIE 79 38 7157 237 RU0702183 81 37 7155 239 RU0702192 76 38 7039 259 CCDRxURN152 71 40 6990 228 RU0602189 80 38 6912 216 PRESIDIO 78 37 6912 210 WELLS 81 39 6904 243 RU0702031 76 39 6871 245 RU0702137 80 37 6866 241 RU0402125 81 37 6843 244 RU0702034 74 40 6840 234 RU0702091 80 38 6827 208 CHENIERE 79 38 6800 211 BANKS 82 46 6731 253 RU0602152 72 41 6716 201 CL131 79 36 6686 206 SPRING 70 44 6652 233 RU0702088 82 37 6630 246 RU0502177 77 42 6625 204 CL171 82 38 6579 240 RU0502094 80 40 6536 235 RU0702094 86 37 6465 218 CATAHOULA 83 37 6424 202 CL161 83 38 6286
Continued.

19
Table 5. Continued.
Entry Source Days to 50% Heading
Plant Height
(in) Grain Yield
(lb/A @ 12%)
212 CYBONNET 81 37 6240 231 RU0702082 83 24 6213 247 RU0602146 78 40 5910 209 CYPRESS 84 38 5893 217 DELLROSE 79 42 5878 238 RU0702189 85 40 5608
c.v. % 1.1 6.9 3.4 LSD0.05 1.5 1030 2.0
† Subjective rating 0 to 9, where 0 = excellent, 9 = poor. Table 6. Grain and milling yield and agronomic performance of entries in the 2007 Commercial- Advanced Yield Trial, Richland Parish, LA.
Entry Source Days to 50% Heading Plant Height
(in) Grain Yield
(lb/A @ 12%)
223 CLXP745 87 44 7960 254 XP723xCLXP730 90 45 7237 258 CLXP730xURN152 89 44 7231 220 CLXL730 91 44 7157 222 XP744 87 46 7048 221 XL723 90 43 6949 219 CLXL729 90 42 6886 257 CLXP730xCCDR 92 45 6845 213 JUPITER 90 36 6715 255 XP723xCCDR 89 43 6645 256 XP723xURN152 87 44 6359 203 CL151 91 39 6244 259 CCDRxURN152 89 36 6113 250 RU0702068 89 34 5937 202 CL161 95 38 5877 243 RU0702031 91 38 5837 207 COCODRIE 94 36 5757 260 RU0404191 95 36 5747 215 PIROGUE 87 35 5731 232 RU0702085 95 35 5661 249 RU0602171 90 31 5649 224 RU0602085 90 34 5649 237 RU0702183 94 36 5611 227 RU0502022 92 35 5573 251 RU0702071 89 35 5513 205 TRENASSE 86 38 5497 235 RU0702094 101 34 5459 226 RU0602103 93 36 5418 248 RU0602168 90 32 5402 241 RU0402125 94 38 5398 211 BANKS 97 41 5387 242 NEPTUNE 92 33 5383 231 RU0702082 100 34 5371 252 RU0702162 92 34 5365 228 RU0602189 94 35 5277 225 RU0602109 92 34 5250
Continued.

20
Table 6. Continued.
Entry Source Days to 50% Heading
Plant Height
(in) Grain Yield
(lb/A @ 12%)
240 RU0502094 96 38 5178 239 RU0702192 90 35 5174 236 RU0702097 95 38 5157 233 RU0702088 96 34 4994 208 CHENIERE 95 35 4906 234 RU0702091 94 36 4900 212 CYBONNET 94 37 4812 247 RU0602146 90 35 4804 217 DELLROSE 90 39 4781 253 RU0602152 86 38 4775 230 RU0602183 92 35 4712 246 RU0502177 88 39 4707 238 RU0702189 98 39 4700 245 RU0702137 95 32 4696 216 PRESIDIO 91 36 4681 244 RU0702034 90 37 4628 201 CL131 92 33 4559 229 RU0602174 94 36 4504 209 CYPRESS 95 34 4461 210 WELLS 97 37 4404 204 CL171 94 38 4346 214 BENGAL 92 33 4194 218 CATAHOULA 95 34 4185 206 SPRING 87 40 3865
c.v. % 2.4 4.5 17 LSD0.05 3.7 2.7 1884
† Subjective rating 0 to 9, where 0 = excellent, 9 = poor.

21
PRELIMINARY YIELD TRIALS
The preliminary yield trials consist primarily of promising breeding nursery material that is ready to be tested in replicated (PY) or non-replicated (SP) yield trials. The material in these trials was screened for agronomic and grain characteristics in nurseries prior to this phase of testing. Promising experimental lines were evaluated for seedling vigor, maturity, plant height, lodging resistance, grain yield of main and ratoon crops, whole and total milling percentages, and disease resistance. These tests were conducted using standard agronomic practices (except that no fungicide was applied) at the Rice Research Station in Crowley, Louisiana. A randomized complete block design was used for the replicated PY trials, and a completely randomized design was used for the non-replicated SP trials to arrange the test entries. Plots were 4.66 x 16 ft and two replications were used in the PY trials only. Varieties were drill seeded at 90 lb/A on March 19 and harvested on August 8 to 9. Dr. Don Groth and the Rice Pathology Project provided the disease ratings for sheath blight, rotten neck blast, bacterial panicle blight, and narrow brown leaf spot.
Trial Group Entry No. Type
PY 1 501-525 Long grain PY 2 526-550 Long grain PY 3 551-575 Long grain PY 4 576-600 Long grain PY 5 601-625 Long grain PY 6 626-650 Long grain PY 7 651-675 Long grain PY 8 676-700 Long grain PY 9 701-725 Long grain PY 10 726-750 Long grain PY 11 751-775 Long grainPY 12 776-800 Long grainPY 13 801-825 Specialty PY 14 826-850 Medium grain PY 15 851-875 Medium grain SP 1 1-50 Long grain SP 2 51-239 Long grain and Specialty SP 3 251-325 Medium grain
PY Groups 1 to 8 and SP Group 1 will be presented in Tables 1 to 9 in this section. In the “Development of Improved Long-Grain and Special Purpose Rice Varieties for Louisiana” section, PY Groups 9 to 13 are presented on pages 42 to 46 and SP Group 2 is presented on pages 48 to 51. In the “Medium-Grain Rice Breeding” section, PY Groups 14 to 15 and SP Group 3 are presented on pages 37 to 40.

Table 1. Grain and milling yield, agronomic performance, and disease ratings† of entries in the 2007 Preliminary Yield Trial, Group 1, Crowley, LA.
Entry Pedigree Vigor†
Days to 50%
Heading
Plant Height
(in)
Grain Yield (lb/A @ 12%)
Milling Yield (%)
SB‡ BPB‡ RNB‡ NBLS‡ Main 2nd Total
Whole Total
525 TRENASSE 6 88 37 7530 1849 9379 60.4 67.2 5 5 3 1 521 MILL/4/DREW/3/9602103/CPRS//… 4 89 37 7020 2063 9082 64.4 73.3 6 6.5 5.5 2 503 CCDR//AR1188/CCDR 6 91 38 7006 2076 9082 65.2 71.7 8 6.5 5.5 2.5 524 CCDR/3/KATY/CPRS//JKSN 5 90 38 6795 1461 8256 61.0 66.8 7.5 6.5 4 1.5 520 KATY/CPRS//JKSN/3/AR1188/CCDR 5 94 38 6732 1603 8335 64.5 70.9 8 6.5 4 1.5 512 CCDR/LGRU 7 95 40 6633 1271 7904 64.8 70.1 7.5 5.5 5.5 2 510 AR1188/CCDR/4/KBNT/3/CPRS//82CAY21 5 95 40 6632 1632 8264 63.7 70.3 8 5 5 3 518 CCDR/3/KATY/CPRS//JKSN 6 92 39 6540 2201 8742 62.5 67.6 7 6 5 1 523 FRAN/ARNT 5 93 35 6535 1914 8449 62.0 70.5 6 6.5 3 0.5 501 LCSN/CPRS//9502008-A 5 94 39 6459 1976 8435 57.2 69.7 6 5 5.5 1 514 FRAN//9502008/LGRU 5 91 36 6422 2891 9313 65.4 73.3 7 6 5.5 0 513 DREW/WELLS 6 98 40 6316 2200 8515 65.2 70.7 6.5 5.5 4 2.5 517 CPRS/9901081 6 94 35 6236 2016 8252 61.9 73.6 7 6.5 5 0 505 CPRS/NWBT//KATY/3/ARNT 6 96 37 6191 1546 7737 65.7 72.5 6 6 5.5 1.5 502 9502008-A//AR1188/CCDR 5 94 40 6147 1678 7824 63.4 72.1 7.5 6.5 4 1.5 519 KATY/CPRS//NWBT/KATY/3/CPRS 5 98 37 6100 2329 8429 58.5 67.6 6.5 6.5 4.5 3 511 CPRS/CH1 7 98 36 6060 2241 8302 62.9 69.9 7 7 3 1.5 516 LMNT/20001-5/3/LMNT/L-202/4/JKSN/CPRS 6 97 39 6012 3060 9072 60.3 69.4 6 5.5 4.5 0 522 9302065/CPRS 4 95 32 5961 2342 8303 66.3 71.4 6.5 7.5 3.5 2.5 515 248WE16m-7 6 99 36 5712 2693 8405 63.4 71.0 6 5 3 1.5 508 9602065/3/KATY/CPRS//JKSN 6 100 36 5187 2888 8076 63.8 71.6 7.5 6.5 3 1.5 506 NWBT//KATY/EP227/3/9702128 6 99 33 5170 2336 7505 58.6 68.7 6 6.5 3.5 1 509 NWBT/KATY/3/82CAY21/../4/DREW 6 101 35 5166 2028 7194 64.5 70.2 6.5 7 3 2.5 504 CCDR/9901081 6 94 32 4994 2638 7632 59.8 68.8 6.5 6.5 4 0.5 507 9502008-A/DREW//FRAN 6 101 34 4721 2510 7231 56.1 67.1 6.5 6 3.5 0.5
c.v. % 8.3 1.7 5.1 6.5 15.4 6.6 4.3 3.0 12.4 13.0 31.2 57.3 LSD0.05 0.93 3.4 3.9 824 679 1126 5.6 4.4 1.6 1.5 2.7 1.9
† Subjective rating 0 to 9, where 0 = excellent, 9 = poor. ‡ Abbreviations: SB=sheath blight, BPB=bacterial panicle blight, RNB=rotten neck blast, NBLS=narrow brown leaf spot.
22

Table 2. Grain and milling yield, agronomic performance, and disease ratings† of entries in the 2007 Preliminary Yield Trial, Group 2, Crowley, LA.
Entry Pedigree Vigor†
Days to 50%
Heading
Plant Height
(in)
Grain Yield (lb/A @ 12%)
Milling Yield (%)
SB‡ BPB‡ RNB‡ NBLS‡ Main 2nd Total
Whole Total
550 CATAHOULA 5 90 40 7623 2475 10098 65.4 71.4 7.5 6 3 0 542 CCDR/3/KATY/CPRS//JKSN 5 89 40 7553 2270 9823 64.6 69.7 6.5 5.5 5 1.5 526 WELLS/DXBL 5 95 41 7538 2795 10332 59.7 71.9 5.5 5.5 4.5 0 538 WELLS/MBLE 5 91 39 7464 3125 10589 59.8 72.6 5 5 4.5 1 530 LM-1//CPRS/KBNT 5 93 36 7311 3145 10456 59.5 70.2 5.5 5 2 0 527 WELLS//LGRU/CPRS 5 91 38 7308 1450 8758 60.3 69.6 6 6 5.5 2 541 CCDR/3/CPRS/NWBT//KATY 5 90 35 7249 2486 9735 66.4 71.6 6.5 5 4 0.5 546 KATY/CPRS//JKSN/3/AR1188/CCDR 5 89 37 7223 2018 9241 65.1 71.0 6.5 6 4.5 1.5 533 KATY/CPRS//JKSN/3/AR1188/CCDR 5 93 37 6968 1446 8414 65.5 72.0 6 5 4.5 3 536 KATY/CPRS//NWBT/KATY 6 97 35 6901 1582 8484 64.8 70.3 6 6 4.5 3 549 LBNT/9902/3/DAWN/9695//…/4/9502008/3/… 6 91 35 6866 2458 9324 59.0 68.3 6.5 6.5 5.5 0 540 LGRU//CCDR9770532DH2 5 92 37 6655 2636 9291 63.7 71.2 6.5 6 4.5 0.5 534 LGRU/ARNT 5 92 39 6517 2130 8647 65.6 71.5 5.5 7 5 5.5 545 JODN/3/KATY/CPRS//NWBT/KATY 5 93 37 6493 1809 8302 59.3 66.7 6.5 6 5 3 548 CCDR/MBLE 5 92 31 6389 1888 8277 62.3 68.9 7.5 6 6 2.5 544 CPRS/KBNT//9502008-A/DREW 5 99 35 6352 1532 7884 66.4 72.0 6.5 6 3.5 2.5 531 NWBT/KATY//CPRS/3/LCSN 6 101 37 6263 1881 8143 59.9 68.6 5.5 4 5 1 535 LBNT/9902/3/DAWN/9695//…/4/9502008/3/… 5 97 35 6041 1869 7909 61.5 68.7 5.5 5.5 3.5 0 529 CPRS/KBNT/4/9502008/3/CPRS//… 5 97 38 5995 1925 7920 63.3 68.7 4.5 5 3 3 547 LGRU//CPRS/KBNT 5 99 32 5748 2870 8618 62.9 70.6 3.5 4 1.5 0 537 LGRU/ARNT 7 98 39 5687 1897 7584 60.2 68.1 5.5 6.5 3.5 4 539 JEFF/3/9502008//KATY/902207x2 5 98 35 5128 2452 7580 56.3 66.3 5.5 6.5 12 1.5 528 JEFF/3/9502008//KATY/902207x2 5 99 35 5100 2653 7752 66.8 71.7 6 5 3.5 2 543 9302065/LGRU 4 99 34 4804 2759 7563 62.7 70.9 5.5 5.5 4.5 3.5 532 9302065/LGRU 5 100 32 4611 2518 7129 65.9 72.2 5.5 6 3.5 3.5
c.v. % 10.4 2.1 3.5 6.4 19.2 7.7 5.0 3.0 12.4 13.0 31.2 57.3 LSD0.05 1.1 4.0 2.6 850 889 1391 6.5 4.3 1.6 1.5 2.7 1.9
† Subjective rating 0 to 9, where 0 = excellent, 9 = poor. ‡ Abbreviations: SB=sheath blight, BPB=bacterial panicle blight, RNB=rotten neck blast, NBLS=narrow brown leaf spot.
23

Table 3. Grain and milling yield, agronomic performance, and disease ratings† of entries in the 2007 Preliminary Yield Trial, Group 3, Crowley, LA.
Entry Pedigree Vigor†
Days to 50%
Heading
Plant Height
(in)
Grain Yield (lb/A @ 12%)
Milling Yield (%)
SB‡ BPB‡ RNB‡ NBLS‡ Main 2nd Total
Whole Total
575 CL151 6 89 41 7871 1783 9654 63.9 71.0 7 6.5 4 1.5 556 NWBT/KATY//CPRS 5 88 37 7233 1485 8719 62.2 69.2 7 6.5 5 4 555 NWBT/KATY//CPRS/3/FRAN 5 88 35 7020 1714 8733 60.4 68.6 5.5 5.5 4 4 561 WELLS//LGRU/JODN 5 95 35 6906 2530 9435 58.1 70.0 5 6.5 5.5 0 565 MILL/4/DREW/3/9602103/CPRS//… 5 89 34 6755 2555 9309 68.3 72.6 7.5 7 5.5 2 552 MILL//9502008/LGRU 5 91 38 6675 2869 9544 67.0 70.9 7 7 5.5 2.5 566 CCDR/3/KATY/CPRS//JKSN 6 91 38 6427 1682 8109 60.6 66.7 6.5 6 4.5 1 563 SABER/DREW 4 95 38 6390 1767 8157 64.7 70.9 5 6 4.5 3 554 LGRU//CCDR9770532DH2 5 97 33 6385 2084 8469 61.6 70.9 6.5 7 5.5 1 560 9502008-A//AR1188/CCDR 6 92 38 6281 1614 7895 62.0 69.0 7 5.5 5 1.5 557 LM-1//CPRS/KBNT 5 93 35 6236 2103 8339 67.5 74.6 6 6.5 5 2 569 WELLS/EP144 4 94 34 6033 2384 8418 55.9 72.8 6.5 5 2 0 567 9502008-A//AR1188/CCDR 6 91 39 5998 1754 7752 61.4 68.6 5.5 5.5 5 1.5 570 CPRS/KBNT//9502008-A/DREW 5 98 34 5868 1330 7198 64.3 71.2 5.5 5 3 2 559 LM-1//CPRS/KBNT 6 95 31 5675 1742 7417 61.4 69.0 6.5 7 4 1.5 573 CPRS/KBNT//9502008/LGRU 5 100 34 5671 1630 7301 60.1 67.4 7 6 4 3 571 MILL//9502008/MILL 5 94 33 5590 2480 8071 65.0 71.6 6.5 5.5 4 0.5 574 LGRU/EP144 6 93 35 5484 2480 7965 . . 6 7 4.5 0.5 572 LGRU//AR1188/CCDR 6 93 36 5479 2083 7562 57.1 68.0 7.5 6.5 3.5 1 564 JEFF/3/9502008//KATY/902207x2 5 97 35 5173 2115 7288 60.1 69.6 6 5.5 2.5 1 558 CPRS/9901081 6 93 32 4836 2499 7335 64.2 71.3 5 7.5 2 0 553 LGRU//CCDR9770532DH2 6 99 37 4754 2695 7449 62.5 70.8 7 6.5 4 0 551 WELLS/LSCN 6 95 33 4746 2525 7271 64.2 73.9 6.5 6 2.5 0 568 MBLE/CCDR 7 95 33 4342 1900 6242 . . 6.5 6 5.5 4 562 CCDR/LGRU 7 100 34 4216 2384 6600 . . 5.5 5 3.5 1
c.v. % 13.5 1.8 3.3 6.7 16.6 6.4 2.7 2.4 12.4 13.0 31.2 57.3 LSD0.05 1.5 3.5 2.4 821 716 1062 4.2 4.2 1.6 1.5 2.7 1.9
† Subjective rating 0 to 9, where 0 = excellent, 9 = poor. ‡ Abbreviations: SB=sheath blight, BPB=bacterial panicle blight, RNB=rotten neck blast, NBLS=narrow brown leaf spot.
24

Table 4. Grain and milling yield, agronomic performance, and disease ratings† of entries in the 2007 Preliminary Yield Trial, Group 4, Crowley, LA.
Entry Pedigree Vigor†
Days to 50%
Heading
Plant Height
(in)
Grain Yield (lb/A @ 12%)
Milling Yield (%)
SB‡ BPB‡ RNB‡ NBLS‡ Main 2nd Total
Whole Total
600 COCODRIE 5 91 37 7185 1642 8827 62.1 69.0 7 5.5 5.5 1.5 584 WELLS//LGRU/CPRS 6 90 37 6980 1174 8154 61.0 70.4 7.5 6.5 6 0.5 581 MILL//9502008/LGRU 5 88 37 6964 2700 9664 65.7 71.3 7 6.5 5.5 0.5 598 9302065/CCDR 4 91 38 6917 2440 9357 66.1 70.8 6 6 3 1.5 592 KATY/CPRS//NWBT/3/9502008/LGRU 5 92 38 6892 2179 9072 62.6 67.9 7 5 5.5 4 593 9502008-A//AR1188/CCDR 5 89 37 6822 1750 8572 61.8 67.4 6 6 4.5 2.5 579 MILL/JEFF 4 88 32 6802 2820 9622 68.3 73.4 6 6 5 2 590 NWBT/KATY//CPRS 5 88 34 6719 1686 8405 61.8 68.6 7.5 7 5 4.5 585 CCDR/DREW 5 89 37 6664 1833 8498 66.1 70.8 7 7 4.5 1 599 AR1142/JODN/4/NWBT/KATY/3/82CAY21/... 5 91 38 6461 2181 8642 62.9 68.2 7.5 6.5 4 0.5 588 9302065/CCDR 5 94 37 6437 2278 8715 61.8 72.1 6.5 5.5 5.5 1 577 WELLS/MBLE 6 93 36 6402 1611 8013 62.1 67.2 5 7 4.5 0.5 583 KATY/CPRS//NWBT/KATY 5 96 34 6335 1511 7846 64.0 69.8 6 6 5.5 2 595 CCDR/4/CPRS/3/KBNT//AR1188 6 89 38 6278 2335 8613 66.6 71.9 7 7 5.5 2 594 MBLE/CCDR 6 90 37 6183 2204 8387 66.3 71.0 7 5.5 5 0.5 582 CPRS/97T1280DH1/3/CPRS/NWBT//KATY 5 94 35 5962 2989 8951 59.6 71.4 5 6.5 4 3.5 578 LGRU//CCDR9770532DH2 6 98 36 5932 1535 7468 63.7 68.7 5.5 7 5.5 2 587 CCDR/3/CPRS/NWBT//KATY 6 94 34 5865 1760 7625 67.8 70.9 7 7 4 3 591 KATY/CPRS//NWBT/KATY 5 95 34 5830 1444 7274 64.9 70.5 6.5 7 6 2.5 596 CPRS/97T1280DH1//CPRS/LGRU 6 98 37 5307 3486 8793 59.9 68.8 5.5 4.5 3 0 580 CPRS/KBNT//902207X2/LGRU 6 101 38 5282 1714 6995 63.0 69.6 6.5 5.5 2.5 1 586 CCDR/LGRU 6 97 36 5208 2935 8143 . . 6.5 5.5 5 1 589 FRAN/TACAURI 5 95 39 5177 2593 7770 62.6 70.7 6.5 6 3.5 0 576 MBLE/9502008-A 6 99 34 4721 1524 6244 . . 6.5 6.5 4 1.5 597 9302065//9002007x2/LGRU 6 99 32 4059 1950 6010 62.3 69.7 6 5 6 0
c.v. % 8.8 2.2 3.7 7.3 10.3 6.4 4.0 2.2 12.4 13.0 31.2 57.3 LSD0.05 0.93 4.3 2.7 926 445 1079 6.0 3.4 1.6 1.5 2.7 1.9
† Subjective rating 0 to 9, where 0 = excellent, 9 = poor. ‡ Abbreviations: SB=sheath blight, BPB=bacterial panicle blight, RNB=rotten neck blast, NBLS=narrow brown leaf spot.
25

Table 5. Grain and milling yield, agronomic performance, and disease ratings† of entries in the 2007 Preliminary Yield Trial, Group 5, Crowley, LA.
Entry Pedigree Vigor†
Days to 50%
Heading
Plant Height
(in)
Grain Yield (lb/A @ 12%)
Milling Yield (%)
SB‡ BPB‡ RNB‡ NBLS‡ Main 2nd Total
Whole Total
625 CHENIERE 4 91 37 7552 1459 9012 64.9 71.9 5.5 4.5 5.5 1.5 614 LGRU/WELLS 4 92 44 7457 2721 10178 58.1 70.8 5.5 4.5 6 1 620 FRANCIS/4/TACAURI/3/CPRS//82CAY21/TBNT 4 91 40 7434 1973 9407 59.1 67.2 5 6 5.5 0 605 CPRS/KBNT//DREW 5 92 40 7350 2899 10249 65.5 70.6 5 5.5 2 1 606 CCDR/3/KATY/CPRS//JKSN 5 91 38 7197 1466 8663 63.7 68.8 8 6.5 4 1 607 CCDR//AR1188/CCDR 5 90 37 6906 2216 9123 62.8 69.2 7.5 5.5 4.5 1.5 624 9502008-A/DREW/3/NWBT/KATY//9902207x2 6 91 38 6821 1986 8807 67.6 72.4 7 5 4 1 611 MILL/CCDR 5 90 36 6756 2066 8821 66.6 72.1 6.5 7.5 5 3.5 622 CPRS/3/NWBT/KATY//9902207x2 5 91 39 6570 1808 8378 63.7 69.5 7 5 4 2 621 CCDR//9502008-A/TACAURI 6 92 36 6371 2265 8636 63.7 69.3 5 5.5 3 0 604 MBLE/CCDR 5 90 35 6222 1617 7839 65.3 71.1 6 7 4.5 1 623 TACAURI//CPRS/82CAY21/TBNT/3/NWBT/… 5 91 39 6162 1500 7661 61.2 67.8 7 5.5 4.5 3 609 JKSN/CPRS 5 91 35 6118 2887 9005 69.3 72.3 7.5 7 5.5 2 618 LGRU//AR1188/CCDR 6 91 37 6007 2691 8699 66.0 71.2 7 5.5 4 0.5 601 NWBT/KATY//CPRS 6 89 35 5959 756 6715 63.7 69.3 7 6 4 3.5 616 KATY/CPRS//NWBT/KATY 5 97 35 5863 2074 7937 61.8 67.9 6 5.5 5.5 3.5 610 CPRS/3/CPRS/NWBT/KATY 5 95 33 5824 2074 7898 64.9 70.7 7 6.5 5.5 0 619 CPRS/KBNT//DREW 5 97 36 5799 1491 7290 64.5 69.5 6.5 5.5 3.5 4 603 CPRS/KBNT/4/9502008/3/CPRS//… 5 99 32 5643 1607 7250 58.2 65.9 7 6.5 3.5 3 617 MILL/4/9502005/3/CPRS//82CAY21/TBNT 5 91 34 5373 2513 7886 66.7 70.6 7 7 4.5 0.5 612 JKSN/9302065 5 93 34 5355 2363 7718 70.2 73.4 6 5.5 4.5 3.5 608 9302065/CPRS 5 98 33 5076 1919 6994 59.4 68.0 7.5 6.5 3 1.5 615 JKSN/DREW 5 99 33 4292 2346 6638 59.7 67.5 5.5 5.5 3.5 2 613 9302065/4/DREW/3/KBNT//KATY/CPRS 5 100 35 4152 2523 6676 67.3 72.2 5.5 3.5 4.5 3 602 CPRS/97T1280DH1//CPRS/LGRU 5 98 33 4119 1984 6102 58.7 69.6 5 4 2 2.5
c.v. % 8.9 1.5 3.4 10.0 17.8 10.7 3.9 3.1 12.4 13.0 31.2 57.3 LSD0.05 0.89 2.9 2.5 1263 750 1801 6.0 5.2 1.6 1.5 2.7 1.9
† Subjective rating 0 to 9, where 0 = excellent, 9 = poor. ‡ Abbreviations: SB=sheath blight, BPB=bacterial panicle blight, RNB=rotten neck blast, NBLS=narrow brown leaf spot.
26

Table 6. Grain and milling yield, agronomic performance, and disease ratings† of entries in the 2007 Preliminary Yield Trial, Group 6, Crowley, LA.
Entry Pedigree Vigor†
Days to 50%
Heading
Plant Height
(in)
Grain Yield (lb/A @ 12%)
Milling Yield (%)
SB‡ BPB‡ RNB‡ NBLS‡ Main 2nd Total
Whole Total
635 NWBT/KATY//9902207x2/3/9502008-A/DREW 5 87 37 7941 2583 10523 64.6 72.4 7.5 5 4.5 1.5 646 9502008-A/DREW/3/NWBT/KATY//9902207x2 6 89 39 7709 1640 9349 63.7 70.5 6 6 4.5 3.5 631 CPRS/SABER 5 89 38 7193 2086 9279 64.0 69.4 7.5 6.5 4.5 2.5 630 AR1121/3/CPRS//82CAY21/TBNT/4/CCDR 6 89 38 7069 2515 9583 65.4 72.0 6 6 5 1.5 648 9502008-A/DREW/3/NWBT/KATY//9902207x2 5 90 38 7019 1936 8955 64.0 70.2 7 6 5 2 632 CCDR/4/CPRS/3/KBNT//AR1188 5 89 40 6950 2094 9044 65.7 70.4 6.5 6.5 6 3 641 AR1121/3/CPRS//82CAY21/TBNT/4/CPRS 5 92 38 6948 1883 8831 66.2 71.7 6.5 6 4.5 2.5 643 CPRS/3/NWBT/KATY//9902207x2 5 93 37 6794 2568 9362 65.7 70.7 7.5 6 4 1.5 633 FRANCIS/9302065 4 93 35 6750 3035 9785 64.0 72.7 5.5 6 3.5 1 639 9502008//KATY/9902207x2/3/CPRS/DREW 5 91 38 6666 2648 9314 64.2 69.7 7.5 6.5 5 0.5 647 TACAURI//CPRS/82CAY21/TBNT/3/CCDR 6 89 37 6562 1317 7878 64.7 72.2 7 5.5 3 2 649 KATY/CPRS//NWBT/…/3/9502008/4/CCDR 6 94 37 6246 1401 7647 57.7 65.6 7.5 6 5.5 2 628 9502008/AR1121//CPRS/(KATY//GFMT/PCOS) 6 94 37 6213 1530 7742 61.7 68.2 5.5 5.5 2.5 1.5 645 CCDR//9502008-A/TACAURI 6 91 35 6174 1811 7985 63.5 70.4 7.5 6 5.5 0.5 627 TACAURI//CPRS/82CAY21/TBNT/3/CHENIERE 5 92 34 6160 1735 7895 64.4 70.6 6 4.5 2.5 1 642 9502008//KATY/9902207x2/3/CPRS/DREW 6 96 36 6100 1687 7788 . . 6 5.5 4.5 3 626 CCDR/MBLE 7 91 35 5869 1651 7520 70.3 74.4 8 5.5 6 2.5 637 CPRS/LGRU 5 97 39 5857 1566 7423 59.8 67.8 6 5.5 3 3 629 AR1121/3/CPRS//82CAY21/TBNT/4/… 6 90 38 5794 2746 8540 67.6 72.1 6 6 4 1 640 MBLE/CCDR 6 90 35 5663 1569 7232 65.4 71.0 7 6.5 4.5 2 638 TACAURI//CPRS/82CAY21/TBNT/3/CCDR 6 94 37 5655 1817 7472 61.7 68.2 6.5 6 3.5 1 650 CYPRESS 6 96 37 5645 1645 7289 68.2 72.8 6.5 6 2.5 2 636 CCDR/4/CPRS/3/KBNT//AR1188 5 90 35 5630 2050 7680 66.2 71.6 6 4.5 4.5 2 644 AR1121/3/CPRS//82CAY21/TBNT/4/… 6 92 37 5486 2000 7486 62.6 69.7 7 6.5 2 0.5 634 TACAURI/3/CPRS//82CAY21/TBNT/4/CPRS//… 6 93 36 5451 1769 7220 65.3 71.2 6 5.5 4 1.5
c.v. % 9.7 1.5 3.4 8.0 19.9 7.6 4.5 2.8 12.4 13.0 31.2 57.3 LSD0.05 1.0 2.8 2.5 1048 1809 1313 6.8 4.7 1.6 1.5 2.7 1.9
† Subjective rating 0 to 9, where 0 = excellent, 9 = poor. ‡ Abbreviations: SB=sheath blight, BPB=bacterial panicle blight, RNB=rotten neck blast, NBLS=narrow brown leaf spot.
27

Table 7. Grain and milling yield, agronomic performance, and disease ratings† of entries in the 2007 Preliminary Yield Trial, Group 7, Crowley, LA.
Entry Pedigree Vigor†
Days to 50%
Heading
Plant Height
(in)
Grain Yield (lb/A @ 12%)
Milling Yield (%)
SB‡ BPB‡ RNB‡ NBLS‡ Main 2nd Total
Whole Total
675 XP730 5 90 48 8852 2673 11525 62.5 70.2 5 2 3.5 0.5 668 9502008-A/DREW/3/NWBT/KATY//9902207x2 5 89 38 7665 2057 9722 64.9 70.6 7.5 5 5.5 3 672 CPRS/3/NWBT/KATY//9902207x2 5 90 36 7633 1970 9603 64.2 68.9 6.5 6.5 5 1 655 NWBT/KATY//9902207x2/3/CCDR 5 89 39 7532 2349 9881 67.3 73.1 7.5 6 3.5 2 673 NWBT/KATY//9902207x2/3/CPRS 5 88 35 7341 1654 8995 65.9 71.8 7.5 6.5 5.5 1 659 9502008//KATY/9902207x2/3/9502008/CPRS 5 89 37 7266 1912 9178 64.7 69.8 7.5 5 4.5 1 656 TACAURI/3/CPRS//82CAY21/TBNT/4/CCDR 5 89 36 7073 1946 9019 67.3 72.7 6.5 5 3 1.5 653 9502008/CPRS/4/CPRS//82CAY21/TBNT/3/AR11.. 5 89 37 7041 1449 8490 63.7 71.3 6 6.5 6.5 4.5 657 CPRS/LGRU 5 92 37 7008 2081 9088 66.1 71.1 6 6.5 3 2 662 9502008/CPRS/4/CPRS//82CAY21/TBNT/3/AR11. 5 88 39 6980 2897 9878 66.7 71.1 7.5 5 4.5 3.5 664 TACAURI/3/CPRS//82CAY21/TBNT/4/JKSN 5 91 37 6918 1863 8781 61.5 69.7 5.5 6 4.5 3 671 TACAURI//CPRS/82CAY21/TBNT/3/CHENIERE 5 90 39 6854 1777 8631 67.6 71.6 5 5 5 0 661 CHENIERE/4/9502008/3/CPRS//82CAY21/TBNT 5 93 36 6850 2482 9332 62.4 68.0 6 4 3 0 652 NWBT/KATY//9902207x2/3/CPRS 5 92 38 6571 1624 8196 65.7 71.7 8 5.5 5.5 2.5 651 CCDR/4/AR1121/3/CPRS//82CAY21/TBNT 6 90 39 6500 2166 8666 70.7 74.3 7 5.5 6 1 665 9502008-A/DREW/3/NWBT/KATY//9902207x2 5 91 39 6410 1896 8307 65.5 70.5 8 6 4 2 658 TACAURI//CPRS/82CAY21/TBNT/3/CCDR 6 91 36 6110 2343 8454 . . 6 6.5 3 1.5 660 AR1121/3/CPRS//82CAY21/TBNT/4/CCDR 6 90 36 6087 1258 7345 62.2 68.6 6.5 5 5.5 1.5 674 CCDR//9502008-A/TACAURI 5 92 37 5942 1870 7812 66.3 71.7 6.5 6.5 3.5 1.5 670 TACAURI//CPRS/82CAY21/TBNT/3/CCDR 6 92 35 5682 1639 7321 61.8 68.4 6.5 5 2.5 0.5 663 AR1121/3/CPRS//82CAY21/TBNT/4/… 6 92 38 5381 2156 7537 67.4 72.9 5 6.5 3.5 1.5 666 TACAURI/3/CPRS//82CAY21/TBNT/4/CPRS//… 6 95 39 5254 1931 7185 63.2 70.0 6 7 3 2.5 669 9502008//KATY/9902207x2/3/JEFF 5 94 36 5247 1773 7020 64.7 71.0 6.5 4.5 2 1.5 654 AR1121/3/CPRS//82CAY21/TBNT/4/CPRS//… 5 93 38 5112 1778 6890 73.6 79.1 7 6.5 5 4 667 CCDR//9502008-A/TACAURI 6 92 35 4768 1539 6307 65.5 71.8 7.5 6 5 1.5
c.v. % 7.8 1.8 3.7 6.8 16.3 7.3 3.8 2.4 12.4 13.0 31.2 57.3 LSD0.05 0.83 3.0 2.8 925 661 1289 5.6 3.9 1.6 1.5 2.7 1.9
† Subjective rating 0 to 9, where 0 = excellent, 9 = poor. ‡ Abbreviations: SB=sheath blight, BPB=bacterial panicle blight, RNB=rotten neck blast, NBLS=narrow brown leaf spot.
28

Table 8. Grain and milling yield, agronomic performance, and disease ratings† of entries in the 2007 Preliminary Yield Trial, Group 8, Crowley, LA.
Entry Pedigree Vigor†
Days to 50%
Heading
Plant Height
(in)
Grain Yield (lb/A @ 12%)
Milling Yield (%)
SB‡ BPB‡ RNB‡ NBLS‡ Main 2nd Total
Whole Total
700 XP723 5 88 41 8944 3327 12271 64.9 72.3 6 2.5 3 0.5 684 NWBT/KATY//9902207x2/3/CPRS 4 88 38 7744 1982 9726 66.9 72.1 7 6 4.5 1 683 9502008-A/DREW/3/NWBT/KATY//9902207x2 5 90 38 7384 2387 9771 66.1 72.4 8 5 5.5 1 694 CPRS/3/NWBT/KATY//9902207x2 6 89 38 7059 1785 8844 65.7 70.8 7.5 6 4.5 1 677 CHENIERE/3/CPRS//82CAY21/TBNT 7 89 40 7056 1724 8781 62.9 69.2 7.5 5 5 0.5 682 NWBT/KATY//9902207x2/3/9502008-A/DREW 4 90 37 6943 2347 9289 65.0 70.3 7 6.5 5 1.5 699 CCDR/4/CPRS/3/MBLE//LMNT/… 4 88 39 6943 1703 8646 63.6 69.3 7 6.5 5 2 689 9502008-A/DREW/3/NWBT/KATY//9902207x2 5 90 39 6939 1902 8841 64.5 70.1 7 5 5 0.5 680 902207x2/LGRU//CHENIERE 5 89 39 6928 1516 8444 66.0 70.6 7 5.5 5.5 1.5 686 CPRS//82CAY21/TBNT/3/EPAGRI106 6 89 40 6922 2852 9774 61.9 68.9 6.5 5.5 2 0.5 687 9502008-A/DREW//9502008/AR1121 6 91 40 6910 1357 8267 63.0 68.6 6.5 6.5 3.5 0.5 690 9502008-A/DREW//CCDR 5 89 39 6843 1915 8758 64.1 71.3 6.5 5.5 4.5 1.5 679 NWBT/KATY//9902207x2/3/9502008-A/DREW 5 89 38 6830 2511 9340 66.6 72.2 7.5 5.5 5 1 688 CPRS/3/CPRS//82CAY21/TBNT 6 89 39 6778 1754 8531 67.2 72.5 7.5 5 4.5 1.5 681 TACAURI/3/CPRS//82CAY21/TBNT/4/CCDR 6 89 37 6773 1954 8727 66.3 71.9 6 5.5 5 3 678 CPRS/3/CPRS//82CAY21/TBNT 6 88 43 6763 1850 8612 63.8 70.0 8 5.5 4 1.5 696 CHENIERE/4/CPRS/3/KBNT//AR1188 6 91 32 6285 2119 8403 70.0 74.2 6.5 7 4.5 3 693 KATY/CPRS//NWBT/…/3/9502008/4/FRANCIS 6 92 39 6188 3237 9425 66.9 71.5 6.5 5 6 1 685 9502008/LGRU/3/CPRS//82CAY21/TBNT 6 91 38 6152 2865 9017 67.3 71.1 6.5 6.5 6 2.5 692 CPRS/SABER 5 89 37 5896 2643 8540 64.3 68.9 7.5 6.5 1.5 0 695 CHENIERE//9502008-A/DREW 6 92 37 5841 1770 7610 65.3 71.8 8 4.5 5.5 1.5 691 ./3/CPRS//82CAY21/TBNT/4/9502008-A/DREW 6 91 39 5700 2447 8147 70.6 73.8 6 5.5 5 1.5 698 TACAURI/3/CPRS//82CAY21/TBNT/4/JKSN 6 93 35 5543 1865 7408 62.3 68.6 6.5 5.5 4 2 697 9502008-A/TACAURI//CHENIERE 6 96 31 5479 1402 6881 58.7 69.2 7 6.5 5 1 676 TACAURI/3/CPRS//82CAY21/TBNT/4/CPRS// 6 96 36 5181 1437 6618 . . 6 7 3.5 2
c.v. % 9.7 2.1 3.7 9.0 16.7 8.6 3.4 2.4 12.4 13.0 31.2 57.3 LSD0.05 1.1 3.8 2.9 1235 727 1551 5.7 4.4 1.6 1.5 2.7 1.9
† Subjective rating 0 to 9, where 0 = excellent, 9 = poor. ‡ Abbreviations: SB=sheath blight, BPB=bacterial panicle blight, RNB=rotten neck blast, NBLS=narrow brown leaf spot.
29

Table 9. Grain and milling yield, agronomic performance, and disease ratings† of entries in the 2007 Single-Plot Yield Trial, Group 1, Crowley, LA.
Entry Pedigree Vigor†
Days to
50% Heading
Plant Height
(in) Grain Yield
(lb/A @ 12%)
Milling Yield (%)
SB‡ BPB‡ RNB‡ NBLS‡Whole Total
050 CHENIERE 5 93 37 8557 63.6 70.4 6 4.5 5.5 2 022 KATY/CPRS//NWBT/…/3/9502008/4/CCDR 5 88 35 7172 65.5 71.0 6.5 5.5 4.5 2.5 048 CHENIERE//9502008-A/TACAURI 6 90 37 7166 61.4 70.7 6 6 6 0.5 002 DREW/3/KBNT//KATY/CPRS/4/WELLS 4 93 43 7160 53.0 70.6 4 4.5 3 0 047 9502008/LGRU//CCDR 6 93 34 6998 59.8 70.9 5.5 4.5 3.5 3.5 005 CCDR/FRAN 5 89 33 6914 63.3 69.6 6 5.5 5 0 020 KATY/CPRS//NWBT/…/3/9502008/4/CCDR 6 92 37 6870 63.7 69.3 6 6 5 2 021 CPRS//9502008-A/DREW 5 92 35 6806 67.2 71.0 6.5 7 3 0 024 9502008-A/DREW/3/NWBT/KATY//9902207x2 5 94 37 6676 64.3 69.7 5.5 5 5 1 025 CATAHOULA 5 92 37 6549 66.1 72.3 5.5 4.5 2 0 015 AR1121/3/CPRS//82CAY21/TBNT/4/CCDR 5 92 34 6546 60.9 68.8 5 5.5 3 2.5 046 TACAURI/3/CPRS//82CAY21/TBNT/4/CPRS//… 5 92 35 6493 65.3 70.5 4 5.5 6 3 018 TACAURI/3/CPRS//82CAY21/TBNT/4/CCDR 5 90 31 6480 65.3 72.2 6.5 6.5 5 1.5 017 NWBT/KATY//9902207x2/3/9502008-A/DREW 5 89 37 6428 64.1 72.4 7 5 3 1 031 NWBT/KATY//9902207x2/3/CCDR 6 94 36 6357 56.3 64.8 6 6 4.5 2.5 044 9502008-A/DREW/3/NWBT/KATY//9902207x2 5 93 35 6353 65.1 70.1 5.5 6 3.5 1 008 DREW/3/KBNT//KATY/CPRS/4/WELLS 5 94 37 6305 53.4 70.8 4.5 5.5 2 0 013 CCDR/4/CPRS/3/KBNT//AR1188 5 91 39 6186 64.0 69.8 6 6 4.5 4 043 CHENIERE/4/9502008/3/CPRS//82CAY21/TBNT 5 93 36 6170 60.1 67.6 6.5 6 3.5 2.5 003 9302065/CPRS 4 93 35 6125 67.3 71.0 6 6 2 1.5 006 MILL/4/DREW/3/9602103/CPRS//… 5 91 31 6068 61.5 69.6 4.5 6 5 2 004 SABER/LGRU 4 88 33 6027 65.5 71.8 7 6 3.5 0.5 001 JODN/3/NWBT/KATY//LCSN 4 90 36 5991 65.2 71.8 6.5 6 6 3 023 CCDR//9502008-A/TACAURI 5 90 36 5979 64.9 70.4 7 5.5 3 2.5 028 9502008-A/DREW//FRAN 5 95 31 5901 59.6 68.3 6 6 5 2 012 CCDR//9502008-A/TACAURI 6 90 33 5805 64.1 71.2 5 5.5 2 0 049 CPRS/4/RXCL//LABR33/3/RSMT/KATY 5 93 32 5775 62.9 68.5 5 6 4 1.5 011 CPRS9502008-A/TACAURI 5 94 30 5730 63.0 64.1 6 6.5 3 1 033 9502008//KATY/9902207x2/3/9502008/CPRS 6 95 31 5649 62.0 67.9 6.5 6.5 4.5 1.5 032 9502008//KATY/9902207x2/3/CPRS/DREW 6 97 34 5643 60.6 69.3 6 5.5 5 2.5 030 TACAURI/3/CPRS//82CAY21/TBNT/4/CPRS//… 5 96 35 5567 64.4 70.0 4.5 4 3.5 1 016 FRANCIS/4/TACAURI/3/CPRS//82CAY21/TBNT 6 89 36 5455 64.7 71.0 7 5.5 2.5 1 040 9502008/AR1121//CPRS/(KATY//GFMT/PCOS) 6 97 33 5263 66.5 71.5 7 5.5 3.5 3 045 9502008-A/TACAURI//CHENIERE 7 95 31 5261 58.2 68.6 6 5 4 0 014 CPRS9502008-A/TACAURI 5 94 37 5228 66.1 72.4 8 5.5 3.5 0.5 039 NWBT/KATY//9902207x2/3/CCDR 5 97 34 5215 65.7 71.0 7 6.5 4.5 2.5
Continued.
30

Table 9. Continued.
Entry Pedigree Vigor†
Days to 50%
Heading
Plant Height
(in) Grain Yield
(lb/A @ 12%)
Milling Yield (%)
SB‡ BPB‡ RNB‡ NBLS‡Whole Total
041 AR1121/3/CPRS//82CAY21/TBNT/4/TACAURI 5 93 31 5168 60.2 68.3 4 5 3.5 2.5 034 CCDR/4/AR1121/3/CPRS//82CAY21/TBNT 5 94 34 5161 65.5 72.0 5 6 4.5 2.5 019 AR1121/3/CPRS//82CAY21/TBNT/4/CPRS//… 6 91 37 5121 64.4 71.7 5.5 6.5 4 4 007 9502008/CPRS//WELLS 5 93 34 5081 61.6 70.7 7 7 3 0 029 CCDR/4/CPRS/3/KBNT//AR1188 7 99 34 5057 62.0 68.0 5.5 6.5 2 1.5 035 FRANCIS/9302065 6 98 30 4988 59.0 69.2 6.5 6 5 2.5 027 9502008//KATY/9902207x2/3/JKSN 6 96 30 4823 64.3 70.3 7 6.5 3.5 2.5 037 TACAURI//CPRS/82CAY21/TBNT/4/… 7 98 35 4780 62.0 68.1 5.5 5.5 1.5 1.5 026 TACAURI/3/CPRS//82CAY21/TBNT/4/CCDR 5 96 31 4598 64.7 71.4 6 5.5 4.5 2.5 038 9502008/KBNT//CPRS/LGRU 6 100 34 4466 61.2 71.7 5 4 4.5 3.5 010 9502008/KBNT//FRAN 7 94 30 4456 60.3 70.0 5.5 6 5.5 3 036 9502008/KBNT//CPRS/LGRU 6 100 35 4365 62.1 70.3 4 4 2 1.5 009 WELLS/EP144 5 92 39 . 57.3 71.5 4.5 6 3.5 1 042 CHENIERE/3/CPRS//82CAY21/TBNT 5 90 38 . 64.8 71.4 7 5.5 5.5 0.5
† Subjective rating 0 to 9, where 0 = excellent, 9 = poor. ‡ Abbreviations: SB=sheath blight, BPB=bacterial panicle blight, RNB=rotten neck blast, NBLS=narrow brown leaf spot.
31

32
DATE OF PLANTING STUDIES
The purpose of these trials is to determine the grain yield, milling quality, and other agronomic characteristics of major rice varieties, experimental lines, and hybrids planted at various times. The choice of planting date can significantly impact rice growth, development, and yield, and the information generated from these trials is important for understanding the impact on important economic and production characteristics associated with rice production. Experiment: Date of Planting Location: Rice Research Station, Crowley, Louisiana Planting Method: Water-seeded Plot size: 4.66 x 16 ft Planting Dates: March 1, March 15, March 30, April 13, May 1, May 15, June 1 Entries: Catahoula, Cheniere, CL131, CL151, CL161, CL171, Cocodrie, LA0502022,
LA0502177, LA0602109, Neptune, Trenasse, XP723, CLXL729, CLXL730 Experimental Design: Randomized complete block design with three replications Results: Results can be found in Tables 1 to 5, which are arranged across planting dates. Table 1. Grain yields† of 15 rice varieties, experimental lines, and hybrids planted over seven planting dates, 2007, Rice Research Station, Crowley, LA.
Entry
Planting Date
Mean Mar 1 Mar 15 Mar 30 Apr 13 May 1 May 15 June 1 CATAHOULA 1902 2597 7597 3924 8282 6710 3346 5059 CHENIERE 4103 3232 7716 2450 7047 6452 3046 4864 CL131 3159 1208 7694 3808 8088 6335 2620 4552 CL151 5183 3100 7696 3851 8914 7592 3493 5690 CL161 5003 1202 6868 4427 8790 7264 3167 5671 CL171 2336 2116 7822 5388 6897 6243 2333 4734 COCODRIE 4387 2999 7715 2851 6046 8421 3913 5190 LA0502022 4490 1812 8058 5103 7199 7239 2990 5384 LA0502177 3842 3095 5628 3097 5629 6142 4267 4542 LA0602109 3766 2046 5777 3385 6999 6675 2720 4481 NEPTUNE 6433 3886 7709 5107 8916 8901 1937 6048 TRENASSE 1307 3261 7891 4343 5855 7194 3868 4817 XP723 5768 3874 9148 4729 8375 8171 3616 6240 XP729 6393 4380 8811 3436 9194 8745 4000 6423 XP730 7191 3009 9027 5212 9006 7949 3135 6361
Mean 4406 2862 7676 4074 7682 7336 3212 5338
c.v. % 22.8 34.9 9.2 31.4 12.4 6.4 32.3 n/a LSD0.05 1712 1788 1225 2138 1587 786 1798 n/a † Yield is in pounds rough rice per acre at 12% moisture.

33
Table 2. Seedling vigor† of 15 rice varieties, experimental lines, and hybrids planted over seven planting dates, 2007, Rice Research Station, Crowley, LA.
Entry
Planting Date
Mean Mar 1 Mar 15 Mar 30 Apr 13 May 1 May 15 June 1 CATAHOULA 8 4 4 5 6 5 7 6 CHENIERE 6 4 4 6 6 5 8 6 CL131 7 5 5 5 8 5 9 6 CL151 5 4 4 5 5 5 8 5 CL161 5 3 4 4 4 4 7 4 CL171 7 4 4 5 7 4 8 6 COCODRIE 6 4 3 5 7 5 7 5 LA0502022 5 3 5 4 7 4 8 5 LA0502177 5 4 4 5 6 4 7 5 LA0602109 7 4 4 5 6 5 7 5 NEPTUNE 4 3 3 3 4 4 8 4 TRENASSE 8 5 6 6 7 7 8 7 XP723 5 4 6 6 7 7 9 6 XP729 5 5 6 7 6 8 8 6 XP730 4 4 6 6 6 6 8 6
Mean 6 4 4 5 6 5 8 6
c.v. % 12.1 15.3 14.2 21.4 17.9 11.0 10.9 n/a LSD0.05 1.2 1.0 1.1 1.9 1.8 0.98 1.4 n/a
† Subjective rating of 1 to 9 where 1 is the highest seedling vigor and 9 is the lowest seedling vigor. Table 3. Days to 50% heading of 15 rice varieties, experimental lines, and hybrids planted over seven planting dates, 2007, Rice Research Station, Crowley, LA.
Entry
Planting Date
Mean Mar 1 Mar 15 Mar 30 Apr 13 May 1 May 15 June 1 CATAHOULA 103 91 80 87 82 78 74 85 CHENIERE 104 91 82 88 82 78 74 86 CL131 102 95 80 87 81 76 72 85 CL151 102 93 82 89 80 78 74 85 CL161 104 99 88 90 82 79 76 88 CL171 104 92 82 88 85 79 76 86 COCODRIE 101 92 78 89 79 75 71 84 LA0502022 100 95 80 83 80 75 72 83 LA0502177 97 83 77 84 81 76 72 82 LA0602109 99 90 78 85 79 75 71 82 NEPTUNE 99 90 82 90 81 78 74 85 TRENASSE 98 83 75 81 75 71 66 78 XP723 98 88 82 84 77 76 72 83 XP729 99 92 82 85 78 76 74 84 XP730 99 90 84 84 78 78 75 84
Mean 101 91 81 86 80 77 73 84
c.v. % 2.2 2.7 1.3 2.8 2.0 1.4 2.1 n/a LSD0.05 3.7 4.0 1.3 3.7 2.7 1.8 2.5 n/a

34
Table 4. Plant height† of 15 rice varieties, experimental lines, and hybrids planted over seven planting dates, 2007, Rice Research Station, Crowley, LA.
Entry
Planting Date
Mean Mar 1 Mar 15 Mar 30 Apr 13 May 1 May 15 June 1 CATAHOULA 28 30 37 34 38 37 41 35 CHENIERE 32 32 36 34 36 37 38 35 CL131 30 27 35 31 36 34 34 32 CL151 33 31 39 35 38 38 38 36 CL161 32 31 38 36 40 38 40 36 CL171 33 32 40 37 39 39 40 37 COCODRIE 31 31 36 33 37 37 38 35 LA0502022 31 29 36 33 37 36 36 34 LA0502177 32 31 37 35 41 40 35 36 LA0602109 31 29 36 32 36 34 36 34 NEPTUNE 30 28 35 33 37 36 31 33 TRENASSE 28 31 38 35 37 38 36 35 XP723 37 36 42 39 44 43 42 40 XP729 37 34 43 37 44 42 41 40 XP730 39 35 44 41 45 44 44 42
Mean 32 31 38 35 39 38 38 36
c.v. % 6.1 4.6 3.8 4.5 3.0 3.7 4.6 n/a LSD0.05 3.3 2.4 2.4 2.6 2.0 2.4 2.9 n/a
† Plant height in inches from the soil surface to the tip of the main panicle. Table 5. Whole milling percentage† of 15 rice varieties, experimental lines, and hybrids planted over seven planting dates, 2007, Rice Research Station, Crowley, LA.
Entry
Planting Date
Mean Mar 1 Mar 15 Mar 30 Apr 13 May 1 May 15 June 1 CATAHOULA 59.6 63.4 68.0 57.2 65.1 58.9 62.9 62.2 CHENIERE 61.8 60.9 65.3 56.3 61.0 66.3 57.1 61.3 CL131 65.1 66.4 65.5 63.9 63.7 63.1 62.4 64.3 CL151 60.6 59.2 62.0 56.6 62.7 60.1 57.1 59.8 CL161 65.5 54.4 69.1 60.4 64.3 63.6 58.1 62.2 CL171 65.3 65.6 68.0 61.9 64.7 64.4 57.1 63.7 COCODRIE 63.4 63.1 64.8 63.5 57.4 61.4 60.0 61.9 LA0502022 67.5 65.6 65.3 60.4 62.7 57.9 61.0 62.9 LA0502177 63.7 60.4 63.0 48.2 59.8 46.9 46.0 55.4 LA0602109 62.6 63.3 65.5 58.0 58.8 60.0 54.9 60.4 NEPTUNE 67.6 67.7 68.2 69.3 66.3 65.0 57.5 65.9 TRENASSE 64.8 63.1 64.0 58.2 57.8 56.9 61.3 60.6 XP723 65.1 62.7 60.7 55.9 63.3 58.9 57.3 60.6 XP729 59.9 62.6 60.7 53.3 61.7 58.8 52.6 58.5 XP730 62.4 59.5 61.1 53.2 62.8 58.9 58.1 59.4
Mean 63.7 62.4 64.8 58.4 62.1 60.1 57.6 61.3
c.v. % 3.4 5.5 2.4 3.6 3.1 4.1 8.7 n/a LSD0.05 4.7 7.7 3.5 4.5 4.1 5.3 10.8 n/a
† The percentage of unbroken grains after removal of the hulls and broken grains.

35
Table 6. Total milling percentage† of 15 rice varieties, experimental lines, and hybrids planted over seven planting dates, 2007, Rice Research Station, Crowley, LA.
Entry
Planting Date
Mean Mar 1 Mar 15 Mar 30 Apr 13 May 1 May 15 June 1 CATAHOULA 72.0 72.4 74.0 72.1 72.2 70.3 69.1 71.7 CHENIERE 68.6 68.5 71.7 70.4 68.8 71.1 65.6 69.2 CL131 70.9 71.3 71.9 71.2 69.0 70.1 68.0 70.3 CL151 68.2 66.6 70.3 69.2 69.0 68.7 65.1 68.1 CL161 71.1 64.5 73.8 70.1 69.0 67.9 64.9 68.8 CL171 72.5 72.1 73.7 71.8 69.7 70.7 65.7 70.8 COCODRIE 70.1 68.9 72.6 71.7 64.9 68.3 66.5 69.0 LA0502022 72.5 71.3 72.5 71.7 69.3 69.0 67.6 70.6 LA0502177 72.3 70.7 72.9 72.5 68.9 69.6 65.9 70.4 LA0602109 69.7 69.3 71.2 70.0 66.5 69.0 64.3 68.6 NEPTUNE 70.0 70.7 73.3 73.6 69.6 69.7 68.0 70.7 TRENASSE 69.9 69.5 70.4 68.4 65.9 66.5 67.1 68.2 XP723 72.5 71.2 72.1 71.7 71.1 69.5 66.1 70.6 XP729 69.9 71.1 72.5 70.5 69.7 69.0 65.3 69.7 XP730 70.3 68.9 72.2 69.2 70.8 69.6 65.9 69.6
Mean 70.7 69.7 72.3 70.9 69.0 69.3 66.3 69.8
c.v. % 1.5 3.2 1.1 1.6 2.5 1.9 2.4 n/a LSD0.05 2.2 5.0 1.8 2.5 3.7 2.8 3.4 n/a
† The cumulative percentage of broken and unbroken grains after removal of the hulls.

36
MEDIUM-GRAIN RICE BREEDING
S.B. Blanche, S.D. Linscombe, X.Y. Sha, G.A. Anderson, Q.J. Zaunbrecher, K.F. Bearb, C.A. Conner, B.T. Theunissen, S.J. Theunissen, and H.L. Hoffpauir
The objectives of the medium-grain rice breeding project are to develop improved medium-grain rice varieties using traditional and modern breeding techniques. Key goals of the program are to increase yield potential, disease resistance, and milling quality and to select for large, bold grain types with good cooking characteristics. Other traits of interest include short plant stature, lodging resistance, earliness, and stable grain and milling yields. The medium-grain breeding project made 80 unique cross combinations to accomplish the goals of the program. Other activities in 2007 included 70 transplanted F1 populations and 65 space-planted F2 populations. The 2007 medium-grain rice breeding nursery included over 10,000 progeny rows from F3 (early) to F8 (advanced) generations. Eight advanced medium-grain experimental lines (entries 062, 065, 068, 071, 162, 165, 168, and 171) were tested in the 2007 Uniform Regional Rice Nursery (URN). The yield, milling, and agronomic performance of these lines are presented in the URN tables (pages 8 and 11). Five of these lines were tested in the Commercial-Advanced Yield Trial (CA) at five locations throughout the Louisiana rice-growing regions, and these data are presented in the CA tables (pages 14-20). There were 125 advanced medium-grain lines tested in the preliminary yield testing program in 2007. The preliminary yield trials consist primarily of outstanding breeding nursery material that is ready for testing in replicated (PY) or non-replicated (SP) yield trials. The material in these trials was screened for agronomic and grain characteristics in nurseries prior to this phase of testing. Promising experimental lines were evaluated for seedling vigor, maturity, plant height, lodging resistance, grain yield of main and ratoon crops, whole and total milling percentages, and disease resistance. Standard agronomic practices were used for the preliminary yield tests except that no fungicide was applied. Tests were conducted at the Rice Research Station at Crowley, LA, and plot size was 4.66 x 16 ft. Plots were seeded at a rate of 100 lb/A. This test was drill seeded on March 19 and harvested on August 9. Milling samples were taken from each plot at harvest maturity (18 to 20% moisture). Tables 1 to 3 presented in this section report only on the medium-grain entries in the replicated and single-plot preliminary yield test. Dr. Don Groth and the Rice Pathology Project provided the disease ratings for sheath blight, rotten neck blast, bacterial panicle blight, and narrow brown leaf spot.

Table 1. Grain and milling yield, agronomic performance, and disease ratings† of entries in the 2007 Preliminary Yield Trial, Group 14, Crowley, LA.
Entry Pedigree Vigor†
Days to 50%
Heading
Plant Height
(in)
Grain Yield (lb/A @ 12%)
Milling Yield (%)
SB‡ BPB‡ RNB‡ NBLS‡ Main 2nd Total
Whole Total
834 BNGL/SHORTRICO/4/9502065/3/… 5 81 40 8840 2933 11772 67.8 71.5 6 6 3 1 844 BNGL/SHORTRICO/4/ORIN//… 5 78 41 8447 2838 11285 68.0 71.1 5 3.5 2.5 1 850 JUPITER 4 85 39 8402 2135 10536 62.4 66.9 6.5 5 5 1.5 833 BNGL/SHORTRICO/4/ORIN//… 5 75 36 8372 3107 11479 66.1 70.1 6 5.5 2.5 1 831 BNGL/3/BNGL//MERC/RICO 4 86 38 8371 3201 11572 67.4 71.3 4.5 7 2.5 0.5 826 9902028/3/BNGL//MERC/RICO 4 79 39 8226 1730 9955 64.2 68.8 4.5 7 3 0 837 BNGL/SHORTRICO/4/ORIN//… 6 80 40 8210 2985 11195 66.8 70.2 5 4.5 4 1 848 BNGL/SHORTRICO/4/9502065/3/… 5 82 40 8084 1729 9813 69.9 72.6 5.5 6 2.5 0.5 829 BNGL//MERC/RICO/3/EARL 5 82 37 8054 3038 11092 68.3 70.0 4.5 7 5 0 835 BNGL/SHORTRICO//LFTE 4 77 40 8025 2421 10446 68.8 71.9 6 5 4.5 0.5 828 EARL//BNGL/SHORTRICO 4 84 34 7887 2828 10714 65.8 70.7 5 7.5 5 0.5 849 9502065/3/BNGL//MERC/RICO/5/LFTE/4/… 5 82 42 7745 3067 11300 66.2 69.2 7 6 5 0 843 ORIN//MERC/RICO/3/MARS//M201/… 4 78 38 7744 2013 9757 63.6 68.8 5.5 5 4 0.5 836 9865216DH2//BNGL/SHORTRICO 5 79 40 7594 3008 10601 63.6 67.6 6.5 6.5 5 0.5 845 BNGL/SHORTRICO/4/ORIN//… 4 80 38 7591 2784 10375 69.4 71.8 4.5 5 4.5 1.5 846 9902028/3/BNGL//MERC/RICO 4 84 36 7533 2518 10051 67.8 70.4 5 7 3 0.5 840 BNGL/SHORTRICO/4/ORIN//… 6 78 39 7374 2073 9446 68.0 71.0 5.5 5 5 0.5 832 BNGL//MERC/RICO/3/RICO/… 5 85 37 7357 3011 10368 69.0 72.5 6 6 4 0 830 LFTE/4/KATY/CPRS/3/CPRS/LMNT/5/… 5 77 39 7209 2686 9895 68.6 71.0 6.5 5.5 2.5 0 847 9865216DH2//BNGL/SHORTRICO 4 81 38 7068 2492 9561 66.6 69.9 6 6 5.5 0.5 839 BNGL/SHORTRICO/4/9502065/3/… 6 84 36 7034 1784 9132 65.6 69.2 5.5 6 3 0.5 842 9865216DH2//BNGL/SHORTRICO 4 81 40 6853 2489 9343 63.2 67.8 5 5 6 1.5 827 9902028/3/BNGL//MERC/RICO 4 84 39 6826 2719 9545 69.4 71.2 6.5 7 4.5 1 838 9865216DH2/EARL 5 82 40 6734 1816 8550 62.8 68.1 5.5 6 5 1 841 9502065/3/BNGL//MERC/RICO/5/LFTE/4/… 4 82 37 4825 2151 6976 70.4 72.7 7 6 3.5 1.5
c.v. % 21.4 2.0 3.5 7.7 14.7 7.2 2.0 1.1 14.6 13.0 16.4 67.1 LSD0.05 1.9 3.3 2.8 1215 807 1591 2.7 1.6 1.7 1.5 1.5 2.0
† Subjective rating 0 to 9, where 0 = excellent, 9 = poor. ‡ Abbreviations: SB=sheath blight, BPB=bacterial panicle blight, RNB=rotten neck blast, NBLS=narrow brown leaf spot.
37

Table 2. Grain and milling yield, agronomic performance, and disease ratings† of entries in the 2007 Preliminary Yield Trial, Group 15, Crowley, LA.
Entry Pedigree Vigor†
Days to 50%
Heading
Plant Height
(in)
Grain Yield (lb/A @ 12%)
Milling Yield (%)
SB‡ BPB‡ RNB‡ NBLS‡ Main 2nd Total
Whole Total
865 BNGL//MERC/RICO/3/EARL 4 85 37 7471 2858 10330 69.1 71.3 5 5 4 0 868 9865216DH2/EARL 5 82 40 7312 3215 10527 63.6 66.5 5 5 5 1 867 ORIN/3/MERC/CAM9/MARS/4/BNGL 4 83 40 7218 2562 9780 64.4 68.9 5.5 5 3 1 852 BNGL/SHORTRICO/4/9502065/3/… 4 82 37 7074 2245 9319 68.0 71.9 6.5 5 3.5 1.5 870 ORIN//MERC/RICO/3/MARS//M201/… 5 82 38 6935 2658 9593 63.4 67.7 4 5 4.5 0.5 855 BNGL/SHORTRICO//BNGL 5 83 39 6825 2760 9584 64.9 69.3 5.5 6 4.5 0.5 871 EARL/4/ORIN//MERC/RICO/3/… 5 84 38 6805 2667 9472 67.5 71.0 5 5 5.5 0.5 858 9865216DH2//BNGL/SHORTRICO 5 79 38 6791 2343 9134 69.2 71.4 5.5 6 5 0 874 ORIN/3/MERC/CAM9/MARS/4/BNGL 5 82 38 6785 3043 9828 64.5 70.2 4.5 5 3 0 863 LFTE/BNGL 5 81 38 6714 2549 9263 69.0 73.3 4.5 5 4.5 0 851 ORIN/3/MERC/CAM9/MARS/4/BNGL 4 84 37 6645 2712 9357 66.2 68.5 6.5 6 3.5 1 862 9502065/3/MERC//MERC/4/9902028 5 81 37 6612 2927 9539 64.9 68.0 5 5 4.5 0 853 BNGL/SHORTRICO//BNGL 4 86 39 6610 2020 8630 55.9 70.0 6 6.5 2.5 0 866 9502065/3/MERC//MERC/4/BNGL/4/9902028 5 77 42 6455 2426 8881 64.2 67.6 4.5 4 6 0.5 856 BNGL/SHORTRICO//BNGL 5 82 37 6401 1877 8278 64.3 70.5 4 6 3.5 0 857 BNGL/SHORTRICO/4/ORIN//… 6 81 38 6365 2887 9252 68.5 71.1 5 6 2 0 864 BNGL//MERC/RICO/3/EARL 5 84 38 6276 2847 9792 70.0 72.1 3.5 4 4 0 861 EARL/ABSRM154291 5 81 36 6108 2061 8717 64.3 70.6 4.5 6 6 0.5 854 BNGL/SHORTRICO/4/9502065/3/… 5 82 34 5993 2817 8811 68.7 70.9 6.5 5.5 5.5 0 872 BNGL//MERC/RICO/3/MERC/RICO//BNGL 4 84 36 5888 2291 8179 67.3 70.5 4 5.5 2 0.5 875 BENGAL 4 85 39 5729 2398 8128 66.7 70.1 4.5 5 3 0 860 BNGL//MERC/RICO/3/EARL 5 86 35 5664 2976 9120 70.0 72.3 6.5 5.5 4 1.5 873 BNGL//MERC/RICO/3/MERC/RICO//BNGL 5 82 39 5415 2997 8411 69.9 71.9 4.5 5.5 5 0.5 859 BNGL/SHORTRICO//LFTE 5 73 40 5011 1759 6770 70.0 72.3 4.5 4.5 2 0.5 869 BNGL/SHORTRICO//BNGL 5 81 39 4927 2034 6961 65.4 69.9 4.5 5.5 1.5 1
c.v. % 22.1 2.9 2.4 13.2 15.7 10.8 1.8 1.3 14.6 13.0 16.4 67.1 LSD0.05 2.1 4.9 1.8 1739 883 2147 2.6 1.9 1.7 1.5 1.5 2.0
† Subjective rating 0 to 9, where 0 = excellent, 9 = poor. ‡ Abbreviations: SB=sheath blight, BPB=bacterial panicle blight, RNB=rotten neck blast, NBLS=narrow brown leaf spot.
38

Table 3. Grain and milling yield, agronomic performance, and disease ratings† of entries in the 2007 Single-Plot Yield Trial, Group 3, Crowley, LA.
Entry Pedigree Vigor†
Days to 50%
Heading
Plant Height
(in) Grain Yield
(lb/A @ 12%)
Milling Yield (%)
SB‡ BPB‡ RNB‡ NBLS‡Whole Total
284 EARL/9902028 5 88 37 9250 67.7 72.8 3.5 6 4.5 1 303 MARS//M201/MARS/5/STRN//MERC/… 6 80 38 8737 68.2 72.1 4.5 7 3.5 0.5 292 9865216DH2/4/ORIN//… 3 82 44 8519 66.6 71.2 5.5 6 4 1 320 EARL/4/ORIN//MERC/RICO/3/… 3 89 40 8407 67.4 70.2 4.5 5 5 1 305 PY678/MARS 4 84 37 8307 62.7 72.1 4.5 7 2 1 266 ORIN/3/MERC/CAM9/MARS/4/BNGL 4 83 37 8290 68.8 71.6 5.5 4.5 3.5 1 285 BNGL//MERC/RICO/3/EARL 4 84 38 8155 67.5 72.6 4.5 6 5 2 279 ORIN//MERC/RICO//…/3/BNGL/RICO 6 84 40 8090 66.5 70.4 5 6.5 5 1 281 ORIN/3/MERC/CAM9/MARS/4/BNGL 3 84 36 7965 64.4 72.9 5.5 6 2.5 0.5 296 BNGL/SHORTRICO//BNGL 4 85 37 7945 63.2 74.4 6 6 3.5 0.5 316 LFTE/4/KATY/CPRS/3/CPRS/LMNT/6/… 4 79 41 7854 69.2 72.3 7 6 5.5 0.5 277 ORIN/3/MERC/CAM9/MARS/4/BNGL 4 82 38 7801 67.3 73.1 5 5 4 0 315 BNGL/SHORTRICO//MERC 5 85 39 7773 65.9 70.4 5 6.5 4.5 0 312 BNGL//MERC/RICO/4/EARL/3/CPRS/… 6 82 38 7771 67.7 71.4 5 6.5 4 0 276 ORIN/3/MERC/CAM9/MARS/4/BNGL 6 81 37 7719 65.7 69.0 5 6 4 0 254 MARS/4/9502065/3/MERC//MERC 3 82 36 7635 65.1 71.1 5.5 4 4 2 278 ORIN/3/MERC/CAM9/MARS/4/BNGL 6 80 37 7617 70.1 72.5 5 5 4.5 1.5 323 MDRK/EARL 5 86 35 7557 66.6 70.6 5.5 7 6 1 313 BNGL//MERC/RICO/4/EARL/3/CPRS/… 5 86 37 7553 67.5 73.0 4.5 5 4 1 253 PY678/BNGL//MERC/RICO 5 87 40 7550 67.8 70.9 5.5 7 3.5 0 309 9502065/3/BNGL//MERC/RICO/5/LFTE/4/… 3 85 39 7545 64.7 66.9 6 6.5 5.5 0 291 9865216DH2/EARL 5 81 38 7542 58.5 65.8 5 7 6 2.5 274 EARL/9902028 3 86 37 7511 66.2 70.8 5 5 5.5 2.5 256 BNGL//MERC/RICO/3/EARL 5 85 34 7504 68.4 72.4 5.5 8 5.5 1.5 290 9865216DH2/EARL 5 86 39 7470 66.5 70.2 4.5 5 5 0.5 286 BNGL//MERC/RICO/3/EARL 3 86 35 7466 66.1 70.1 5 7 4.5 0.5 295 BNGL/5/LFTE/4/KATY/CPRS/3/… 5 82 38 7460 68.4 71.4 6 7 5 1.5 251 BNGL//MERC/RICO/3/STRN 3 83 36 7456 68.7 72.1 4.5 5.5 3 0.5 319 LFTE/4/KATY/CPRS/3/CPRS/LMNT/5/… 6 83 37 7456 68.8 71.5 6 7 4 2 261 BNGL//MERC/RICO/3/EARL 5 85 34 7450 66.8 70.3 5.5 7.5 4 0.5 301 BNGL/SHORTRICO//LFTE 3 87 40 7447 68.4 71.8 4 5.5 2.5 0.5 252 BNGL/3/BNGL//MERC/RICO 5 86 38 7429 64.2 74.9 4 4.5 3 0.5 283 9502065/3/MERC//MERC/4/BNGL 6 86 41 7295 59.6 72.8 6.5 7 3.5 0 259 MARS/4/9502065/3/MERC//MERC 3 86 39 7288 65.1 70.6 4.5 7 3.5 2 282 ORIN/3/MERC/CAM9/MARS/4/BNGL 5 87 39 7236 60.2 70.2 4 4.5 3 0 308 RICO/BNGL 3 86 34 7210 65.0 69.6 4.5 5.5 4.5 1 299 BNGL/SHORTRICO/4/9502065/3/… 5 84 37 7199 67.4 72.1 5.5 6.5 4.5 0.5 304 MARS//M201/MARS/5/STRN//MERC/… 5 88 37 7184 64.8 69.9 5 4.5 2.5 0
Continued.
39

Table 3. Continued.
Entry Pedigree Vigor†
Days to 50%
Heading
Plant Height
(in) Grain Yield
(lb/A @ 12%)
Milling Yield (%)
SB‡ BPB‡ RNB‡ NBLS‡Whole Total
298 BNGL/SHORTRICO//BNGL 6 87 37 7144 64.2 69.6 5 7 3 0.5 314 BNGL//MERC/RICO/4/EARL/3/CPRS/… 5 87 36 7132 57.3 70.9 4.5 5.5 4 3.5 270 BNGL/3/ORIN//MERC/RICO//… 3 85 38 7129 66.5 70.2 3.5 6 3.5 1.5 318 LFTE/4/KATY/CPRS/3/CPRS/LMNT/5/… 4 86 35 7085 65.4 68.3 7 7.5 4 1 294 BNGL/5/LFTE/4/KATY/CPRS/3/… 4 81 36 7045 71.1 75.0 7 6.5 5 0.5 280 ORIN/3/MERC/CAM9/MARS/4/BNGL 3 90 39 7025 59.9 70.1 4.5 6 3.5 0.5 324 BNGL/3/MEDARK//MERC/SABER 3 87 38 7011 61.5 70.9 4 5 4 0.5 255 9902028/3/BNGL//MERC/RICO 4 85 37 6962 68.0 70.0 6 6.5 3.5 1 310 9502065/3/BNGL//MERC/RICO/5/LFTE/4/… 3 83 39 6928 65.8 70.0 5.5 6 5 1 271 9502065/3/MERC//MERC/4/9902028 3 83 37 6914 62.5 70.7 4 6 4.5 2 321 EARL/4/ORIN//MERC/RICO/3/… 6 86 34 6900 69.6 72.6 5 6 5.5 1 297 BNGL/SHORTRICO//BNGL 4 89 37 6886 66.0 71.1 4 4 4 0.5 300 BENGAL 3 88 38 6881 62.2 70.7 4 6 5 1 273 EARL/9902028 4 86 38 6845 64.3 70.8 4.5 4.5 3 1 265 ORIN/3/MERC/CAM9/MARS/4/BNGL 3 83 37 6745 65.3 71.7 6.5 5.5 5 0.5 288 BNGL/SHORTRICO//MERC 4 87 36 6731 61.8 67.1 5.5 7 5 1 311 9865216DH2//BNGL/SHORTRICO 4 86 37 6704 65.3 69.6 4 6 5.5 1 258 MARS/4/9502065/3/MERC//MERC 4 84 35 6646 61.0 66.3 6.5 7 5 0.5 260 PY678/BNGL 4 84 38 6644 67.0 72.5 3.5 5 2.5 0.5 257 EARL/ABSRM154291 4 86 37 6607 67.7 71.6 5.5 6.5 6 0 307 RICO/BNGL 3 89 35 6568 63.3 69.6 5.5 7 5.5 1 289 PY678/MERC 5 87 40 6476 66.7 72.3 4.5 5.5 2 0.5 267 ORIN/3/MERC/CAM9/MARS/4/BNGL 6 86 36 6458 62.5 71.8 4 4 4.5 2.5 264 BNGL/4/9502065/3/MERC//MERC 4 84 41 6356 63.0 69.0 3.5 4 3 1 306 RICO/BNGL 3 89 40 6323 63.9 70.2 4.5 6.5 5 0.5 302 EARL//BNGL/SHORTRICO 3 89 36 6279 65.9 69.8 5.5 6 2.5 1.5 287 BNGL/FRAN 5 88 36 6275 56.3 67.6 5.5 7.5 5.5 0 275 JUPITER 5 92 37 6210 65.9 72.4 4.5 4 5 1 322 ORIN/BNGL//EARL 5 84 41 6153 65.0 70.0 5 6 4.5 0.5 293 9502065/3/BNGL//MERC/RICO/4/MERC 3 89 38 6145 67.9 73.3 3.5 4.5 5 1 272 9502065/3/MERC//MERC/4/9902028 5 88 38 6131 57.2 69.7 4.5 6 4.5 1.5 317 LFTE/4/KATY/CPRS/3/CPRS/LMNT/5/… 3 88 44 6129 66.7 69.3 5 5.5 5 0.5 263 BNGL//MERC/RICO/3/EARL 5 86 37 6064 55.2 56.9 5 6.5 3.5 2 268 BNGL/3/ORIN//MERC/RICO//… 5 86 37 5677 67.5 70.3 5 6.5 5.5 1 262 BNGL//MERC/RICO/3/EARL 5 86 35 5614 67.6 69.8 4.5 5 4 1 325 ORIN//…/RICO/3/9602135/4/BNGL//GP-2/LFTE 4 92 32 5029 63.4 70.6 5 6 5.5 0.5 269 BNGL/3/ORIN//MERC/RICO//… 4 87 37 4672 50.8 63.2 5 6 6 1
† Subjective rating 0 to 9, where 0 = excellent, 9 = poor. ‡ Abbreviations: SB=sheath blight, BPB=bacterial panicle blight, RNB=rotten neck blast, NBLS=narrow brown leaf spot.
40

41
DEVELOPMENT OF IMPROVED LONG-GRAIN AND SPECIAL PURPOSE RICE VARIETIES FOR LOUISIANA
X.Y. Sha, S.D. Linscombe, S.J. Theunissen, and B.J. Henry
This state project is aimed to develop superior conventional long-grain rice varieties with emphasis on yield
potential, quality (milling, cooking, and processing), disease resistance, lodging resistance, seedling vigor, and early maturity. The other objective is to develop specialty rice varieties adapted to Louisiana and southern U.S. environmental conditions with superior cooking, agronomic, milling, and specific qualities, such as aroma and kernel elongation. The emphasis is being placed on breeding for Jasmine-, Basmati-, and Della-type long-grain rice.
The 2007 field test included 276 transplanted F1s (190 long-grain and 86 specialty), 11 transplanted BC1F1s,
188 space planted specialty F2 populations (101 long-grain and 87 specialty), and 24,000 progeny rows (18,000 long-grain and 6,000 specialty) ranging from F3 to F8. Out of those rows, 588 rows were bulk-harvested for the further evaluation (463 long-grain and 125 specialty). Of the 426 new crosses made in 2007, 188 are long-grain, 87 specialty, and 151 for Dr. Linscombe’s project. A total of 26 backcrosses with up to 100 seeds per cross were made to incorporate the specialty traits of Jasmine rice into elite U.S. long-grain genotypes. Three hundred and thirty breeding lines (220 long-grain and 110 specialty) were included in the preliminary yield test, of those, 148 (124 long-grain and 24 specialty) in replicated test (PY) and 182 (96 long-grain and 86 specialty) in the single plot test (SP). Yield, milling, and agronomic performance of these lines are listed in Tables 1 to 7. Seven advanced long-grain (entries 022, 031, 034, 125, 128, 131, and 134), five specialty (entries 025, 137, 140, 146, and 149), and one medium-grain line (entry 028) were tested in the Uniform Regional Rice Nursery (URN). Test results of these lines are presented in Table 8. Most of these lines were also tested in statewide multi-location Commercial-Advanced (CA) yield trials. CA data are presented in Table 9. The agronomic performance of these advanced lines compared with other conventional lines also can be found in URN Tables 1 to 7 on pages 5 to 11 and in CA Tables 1 to 6 on pages 12 to 20. A separate advanced yield (AY) trial of specialty rice was carried out at the Rice Research Station, as well as at Vermilion and Evangeline parishes. Test results of the AY trial were listed in Tables 10 to 12.
The Puerto Rico winter nursery is critical to this project. In 2007, 5,000 progeny rows of both long-grain and
special purpose types were planted and selected. Most of these were F3s for the generation advancement purpose.
The medium-grain experimental line LA2028 continuously showed superior yield potential, good milling and grain quality and it was officially released by LSU AgCenter as ‘Neptune’ for seed production in 2008. The Jasmine- type line LA0402125 also showed competitive grain and milling yields with specialty attributes (aroma, flavor, amylose content, alkaline spread value, and cooking quality) similar to the imported Thai Jasmine. Foundation seed of LA0402125 will be produced in 2008 for varietal release purpose.

Table 1. Agronomic and milling performance of the 2007 Preliminary Yield Test, Group 9, long-grain entries. Rice Research Station, Crowley, LA.
Entry
Pedigree
Vigor*
Days to 50%
Heading
Plant Height
(inch)
Yield (lb/A)
Milling (%)
Visual Score† Main Ratoon Total Head Total
701 AC627 5 87 35 6862 2326 9188 64.3 69.7 7 702 AC1279 5 92 43 6620 3134 9754 68.0 73.3 3 703 AC1279 5 92 43 6609 2043 8653 59.0 74.6 3 704 AC1398 5 87 37 7466 2355 9821 64.1 70.3 7 705 AC1375 6 90 38 6262 1628 7890 67.5 72.4 7 706 AC899 3 87 36 5775 1436 7212 63.7 70.7 7 707 AC1019 3 91 38 5956 3204 9160 66.0 72.1 5 708 AC638 3 89 39 7018 2041 9059 67.0 72.4 5 709 AC1019 3 90 38 6427 3230 9658 62.2 73.7 5 710 AC1019 3 91 37 6218 3252 9469 66.9 73.3 7 711 AC1019 4 90 40 5790 3706 9496 68.8 73.2 3 712 AC625 5 90 39 6921 1785 8707 60.9 72.7 5 713 AC539 4 89 41 6618 1009 7627 62.4 70.2 5 714 AC625 5 90 39 6664 1816 8480 67.4 73.4 7 715 AC545 4 92 40 7514 3224 10738 63.6 72.8 5 716 AC105 4 90 40 6184 1667 7851 65.4 73.3 5 717 AC105 4 89 40 7097 1095 8192 65.5 72.4 5 718 AC627 6 86 34 6813 1897 8710 62.9 68.5 7 719 AC934 5 93 36 4113 1619 5732 62.4 68.1 7 720 AC358 4 92 39 5299 3036 8335 64.0 71.8 7 721 AC915 4 86 37 6792 2255 9047 66.7 71.4 5 722 AC915 3 90 37 5884 2525 8409 66.4 71.2 5 723 AC917 4 89 37 6311 2305 8616 66.6 72.7 7 724 AC918 3 85 38 5893 1943 7837 63.8 68.6 5 725 RU0502094 3 90 40 6223 1680 7903 63.5 73.2 5 c.v.% 12.3 2.3 3.5 7.9 24.1 8.2 5.7 1.9 LSD0.05 1.0 4.2 2.7 1044 1119 1463 7.8 2.8 * Subjective rating 1 to 9, where 1 = excellent, 9 = stand. † Subjective rating 1 to 9, where 1 = extremely poor, 9 = ideal type.
42

Table 2. Agronomic and milling performance of the 2007 Preliminary Yield Test, Group 10, long-grain entries. Rice Research Station, Crowley, LA.
Entry
Pedigree
Vigor*
Days to 50%
Heading
Plant Height
(inch)
Yield (lb/A)
Milling (%)
Visual Score† Main Ratoon Total Head Total
726 AC918 4 81 38 5670 1650 7319 64.8 69.4 5 727 AC918 4 90 40 5618 1640 7257 64.5 70.4 5 728 AC918 4 91 38 5835 2501 8336 64.3 69.9 7 729 AC918 4 93 36 5197 2064 7261 66.0 71.5 7 730 AC918 3 89 38 6206 1247 7453 70.4 73.9 5 731 AC918 4 89 39 6692 2673 9365 66.7 72.2 5 732 AC918 3 88 38 6351 2498 8849 69.8 72.9 7 733 AC918 4 87 38 6516 1890 8406 66.5 70.8 5 734 AC918 3 88 39 5616 2660 8276 65.9 71.6 3 735 AC918 4 86 40 6753 2250 9003 69.9 73.4 3 736 AC918 5 87 40 6657 2214 8871 69.5 73.2 5 737 AC918 3 89 40 6235 2199 8434 61.2 65.1 5 738 AC918 3 90 39 5608 2473 8080 66.6 71.2 5 739 AC918 4 86 39 6278 2462 8740 70.9 74.6 7 740 AC918 3 89 37 6396 2563 8959 65.4 70.0 7 741 AC920 4 89 39 6337 2711 9048 69.0 72.9 7 742 AC858 4 84 40 6405 2592 8997 65.8 69.1 5 743 AC924 5 86 40 6422 2418 8840 62.0 67.4 3 744 AC981 3 90 39 6408 2340 8748 68.3 72.2 7 745 AC981 4 89 37 5980 2424 8404 70.1 74.2 7 746 AC1012 3 90 37 6108 2949 9057 67.1 72.1 7 747 AC638 4 88 38 7223 1918 9140 66.8 72.7 7 748 AC815 4 94 33 5330 2940 8269 63.4 70.3 7 749 AC815 5 93 32 4368 2208 6576 58.5 68.3 7 750 Cocodrie 5 91 40 6187 1689 7876 64.4 72.4 5
c.v.% 12.3 1.8 3.2 10.5 22.0 10.3 5.3 4.0 LSD0.05 0.9 3.3 2.5 1322 1038 1788 7.3 5.9 * Subjective rating 1 to 9, where 1 = excellent, 9 = stand. † Subjective rating 1 to 9, where 1 = extremely poor, 9 = ideal type.
43

Table 3. Agronomic and milling performance of the 2007 Preliminary Yield Test, Group 11, long-grain entries. Rice Research Station, Crowley, LA.
Entry
Pedigree
Vigor*
Days to 50%
Heading
Plant Height
(inch)
Yield (lb/A)
Milling (%)
Visual Score† Main Ratoon Total Head Total
751 AC815 4 95 32 5340 2760 8100 59.4 69.6 5 752 AC815 5 95 32 4865 2772 7636 59.8 69.4 5 753 AC815 4 94 32 5551 3577 9128 65.6 73.1 5 754 AC815 4 92 34 5846 3543 9389 62.4 72.3 5 755 AC924 4 85 39 6277 2784 9061 62.1 67.3 3 756 AC1019 4 87 37 6217 2453 8671 70.3 73.4 7 757 AC1019 3 89 38 6629 3350 9979 67.5 72.9 7 758 AC1019 4 88 39 7172 2608 9781 63.5 69.9 5 759 AC1019 4 86 38 7859 2738 10597 63.1 73.1 5 760 AC1019 3 88 37 6178 3321 9499 66.2 71.7 5 761 AC1021 4 89 35 6872 2778 9651 68.3 73.3 7 762 AC1021 5 90 41 6784 3360 10144 62.0 69.1 3 763 AC1021 5 92 35 6512 3906 10418 50.3 72.4 5 764 AC1073 5 82 40 7710 2391 10101 64.4 72.2 7 765 AC1075 5 81 42 7824 1673 9497 61.5 68.5 3 766 AC1075 5 81 41 7054 2553 9607 59.5 68.0 5 767 AC1075 4 83 40 6991 2624 9615 64.6 70.3 7 768 AC1075 5 85 37 6423 1656 8080 56.0 66.6 7 769 AC1078 4 81 39 7098 1845 8943 60.3 70.5 7 770 AC1109 4 83 39 5007 2481 7488 58.7 65.4 7 771 AC1055 5 83 38 8198 2003 10201 62.4 72.1 3 772 AC1055 4 85 41 8041 1484 9524 60.7 69.5 3 773 AC1072 5 85 36 7591 1636 9227 64.5 70.2 5 774 AC1070 4 80 40 7566 1930 9497 65.5 71.4 7 775 Wells 4 89 43 7515 3253 10768 61.8 73.3 5
c.v.% 11.1 2.0 3.1 14.9 13.1 12.4 7.3 3.0 LSD0.05 0.9 3.5 2.4 2085 708 2401 9.4 4.4 * Subjective rating 1 to 9, where 1 = excellent, 9 = no stand. † Subjective rating 1 to 9, where 1 = extremely poor, 9 = ideal type.
44

Table 4. Agronomic and milling performance of the 2007 Preliminary Yield Test, Group 12, long-grain entries. Rice Research Station, Crowley, LA.
Entry
Pedigree
Vigor*
Days to 50%
Heading
Plant Height
(inch)
Yield (lb/A)
Milling (%)
Visual Score† Main Ratoon Total Head Total
776 AC1070 4 91 36 6921 1930 8851 60.4 70.6 5 777 AC1402 5 90 37 6505 1790 8295 62.3 71.4 5 778 AC1403 4 83 40 7174 2361 9536 66.6 69.9 3 779 AC1400 5 84 38 6728 2148 8876 65.5 71.2 5 780 AC1400 4 86 40 6544 2504 9048 61.6 68.7 3 781 AC1070 4 83 41 7590 1846 9436 64.1 68.7 3 782 AC1406 4 81 36 7477 2999 10476 65.6 69.8 5 783 AC1398 5 85 40 8618 2630 11248 63.2 70.0 5 784 AC1330 4 86 36 6328 1797 8125 63.8 70.8 7 785 AC1330 4 87 39 7663 1030 8693 62.4 70.2 7 786 AC1341 4 85 39 5941 2767 8708 66.6 70.3 5 787 AC1349 4 88 39 6625 1545 8170 64.1 70.0 3 788 AC1349 4 84 40 7084 1299 8383 62.8 68.3 3 789 AC1349 4 83 41 7976 1481 9457 62.7 70.1 5 790 AC1350 4 85 35 5829 1443 7272 62.5 71.2 3 791 AC1350 3 85 38 6735 2571 9306 66.2 71.1 7 792 AC1350 4 87 40 5909 2176 8085 63.8 69.8 5 793 AC1370 4 86 38 6839 1046 7885 63.1 70.0 3 794 AC1370 3 85 40 6926 1243 8168 66.2 72.0 3 795 AC1402 7 88 36 7043 1377 8421 67.2 71.5 7 796 A-201//JSMN/DLLA 5 90 36 5264 3029 8293 51.4 71.4 5 797 RU0202051//9202168/DLMT 4 81 41 7215 2555 9770 62.5 68.2 7 798 RU0202051//9202168/DLMT 4 85 41 6883 2738 9621 62.2 69.4 5 799 AC1027 4 81 44 7215 3096 10311 68.2 71.1 3 800 Trenasse 5 83 42 7405 2268 9673 61.1 66.5 3 c.v.% 12.3 1.8 3.2 10.5 22.0 10.3 5.3 4.0 LSD0.05 0.9 3.3 2.5 1322 1038 1788 7.3 5.9 * Subjective rating 1 to 9, where 1 = excellent, 9 = no stand. † Subjective rating 1 to 9, where 1 = extremely poor, 9 = ideal type.
45

Table 5. Agronomic and milling performance of the 2007 Preliminary Yield Test, Group 13, specialty entries. Rice Research Station, Crowley, LA.
Entry
Pedigree
Vigor*
Days to 50%
Heading
Plant Height (inch)
Yield (lb/A)
Milling (%)
Visual Score† Main Ratoon Total Head Total
801 CPRS//L-205/DLLA 4 92 38 5008 2379 7387 57.7 67.8 7 802 JSMN/DLLA//96SP287/3/DLMT 7 92 37 6072 2439 8511 64.0 71.1 5 803 9502008//KATY/9902207x2/3/JSMN/DLLA//LEAH/DLLA 5 89 38 6073 2111 8183 66.1 72.4 7 804 DLMT 8462…/4/DMSI/5/RSMT 6 86 41 5827 3348 9176 59.8 73.0 7 805 AC1106 4 85 38 7567 3494 11062 66.6 73.0 7 806 CPRS//L-205/DLLA 4 88 40 7151 3317 10468 65.2 70.2 5 807 A-201/SADRI TYPE//DLRS 3 81 38 7188 3372 10560 64.7 70.5 5 808 A-201/SADRI TYPE//DLRS 4 84 38 6751 3302 10053 69.2 72.6 7 809 CPRS/DLRS 4 85 42 7570 1869 9439 65.1 72.8 7 810 CPRS/LGRU//KAYEEMA 5 85 38 5438 2266 7704 66.3 71.3 7 811 JSMN/DLLA//CCDR/LGRU 6 93 35 5010 2408 7418 46.0 70.3 5 812 00HB126/PI 457917//CCDR 5 91 39 5974 3066 9039 57.4 68.5 3 813 CPRS//L-205/DLLA 4 88 38 5669 2788 8457 62.5 70.0 5 814 DLRS//KBNT/JODN 5 92 36 4738 3162 7900 64.7 71.5 5 815 CPRS//L-205/DLLA 5 86 34 6829 2515 9344 67.5 72.6 5 816 LBLE/L201//MBLE/3/BSMT PAK372A/4/… 4 90 37 5411 3510 8921 65.9 72.8 5 817 9502008/KBNT//DREW/KDM 105 4 85 35 4976 2686 7662 65.1 71.9 5 818 CPRS/KBNT/3/KBNT//DLMT/B8462T3-710 4 88 38 5778 3320 9098 63.2 71.4 7 819 LGRU/A-201 4 92 38 5751 3801 9552 54.1 71.0 5 820 SABER /5/DLMT 88462../4/DMSI 5 85 40 6970 1502 8472 61.8 70.2 3 821 NCHS//JSMN/DLLA 4 90 41 5022 2108 7130 54.1 61.3 3 822 NWBT/KATY//9902207x2/3/JSMN/DLLA//LEAH/DLLA 4 83 36 6233 1595 7828 63.7 71.0 5 823 NWBT/KATY//9902207x2/3/JSMN/DLLA//LEAH/DLLA 4 85 42 6555 1661 8216 64.5 72.5 3 824 9502008-A/DREW/3/JSMN/DLLA//LEAH/DLLA 4 90 40 6142 2240 8382 65.2 64.7 5 825 LA2125 (96 INT/Ahrent) 5 91 42 6236 1685 7921 52.7 64.3 5 c.v.% 12.3 1.8 3.2 10.5 22.0 10.3 5.3 4.0 LSD0.05 0.9 3.3 2.5 1322 1038 1788 7.3 5.9 * Subjective rating 1 to 9, where 1 = excellent, 9 = no stand. † Subjective rating 1 to 9, where 1 = extremely poor, 9 = ideal type.
46

47
Table 6. Agronomic and milling performance of the 2007 Preliminary Yield Test, Group Puerto Rico, long-grain lines, Rice Research Station, Crowley, LA. Entry
Pedigree
Vigor*
Days to 50%
Heading
Height (inch)
Yield (lb/A)
Milling (%)
Head Total
07P3063 AC1012/AC110 5 70 35 6674 52.9 65.8 07P3072 AC1012/AC110 4 66 36 6488 51.6 64.2 07P3074 AC1012/AC110 4 65 35 6656 52.3 64.3 07P3090 AC1012/AC110 4 68 35 7130 57.7 69.3 07P3158 AC110/AC919 4 73 35 6945 62.1 69.5 07P3164 AC110/AC919 4 74 38 6981 61.9 69.0 07P3178 AC110/AC919 4 72 38 7504 59.6 68.1 07P3181 AC110/AC919 4 75 34 6692 61.3 69.2 07P3188 AC110/AC919 4 74 39 6913 58.5 66.8 07P3194 AC110/AC919 3 70 35 7161 53.6 68.8 07P3221 AC110/AC638 3 71 34 7392 62.3 70.2 07P3237 AC110/AC638 4 71 35 7420 61.4 69.7 07P3252 AC625/PRESIDO 4 70 35 6816 64.3 72.6 07P3358 CCDR//CCDR/JEFF 4 71 36 7254 62.3 70.8 07P3393 CCDR//CCDR/JEFF 4 71 35 7897 59.1 69.4 07P3437 CCDR//9502008//AR1188/CCDR 3 69 36 7829 62.4 71.5 07P3496 CCDR/0502085 4 72 36 7887 63.4 71.4 07P3506 CCDR/0502094 4 71 36 7784 60.5 70.4 07P3563 CPRS/3/CPRS/KBNT//9502008 4 71 36 7299 60.4 68.4 07P3569 CPRS/3/CPRS/KBNT//9502008 4 72 36 6984 61.0 68.9 07P3621 0402022/0502094 4 69 37 7705 65.4 72.8 07P3661 0402022/3/9502008//AR1142/MBLE 5 71 36 7735 61.6 70.5 07P3694 0402022/3/9502008//AR1142/MBLE 3 69 34 7238 60.2 68.8 07P3915 9502008//KATY/902207x2/3/0402068 4 70 38 7545 61.1 69.7 07P4059 9502008//AR 1142/MBLE/3/0502091 5 72 35 7650 60.3 68.7 07P4077 9502008//AR 1142/MBLE/3/0502091 5 74 35 7200 58.2 66.2 07P4114 9502008//AR 1142/MBLE/3/0502165 5 70 33 7065 60.2 70.3 07P4254 DREW/CCDR//0302005 5 74 36 6428 56.4 66.4 CCDR Cocodrie 3 71 35 6861 58.3 68.8 TRNS Trenasse 4 64 38 6734 54.7 66.4
c.v.% 15.3 1.1 2.8 4.8 5.4 2.3 LSD0.05 1.2 1.6 2.1 700 6.5 3.2 * Subjective rating 1 to 9, where 1 = excellent, 9 = no stand.

48
Table 7. Agronomic and milling performance of the 2007 Single Plot Test. Long-grain and specialty lines, Rice Research Station, Crowley, LA.
SP
Entry
Pedigree
Vigor*
Days to 50%
Heading
Height (inch)
Yield (lb/A)
Milling (%) Visual Score†Main 2nd Total Head Total
SP051 AC426 4 87 37 6854 1697 8551 59.3 66.1 7 SP052 AC925 4 85 36 6916 2175 9091 67.3 71.6 5 SP053 AC1021 3 88 33 6397 2068 8465 69.8 73.3 5 SP054 AC1075 4 85 35 6913 2040 8953 61.8 69.2 5 SP055 AC899 4 85 32 6079 1955 8034 62.8 69.5 5 SP056 AC1073 3 85 35 8146 1342 9488 61.4 68.8 7 SP057 AC539 4 87 37 6426 1920 8346 62.3 67.3 5 SP058 AC1019 3 88 36 6451 2027 8478 66.4 71.9 5 SP059 AC918 3 88 36 5316 1549 6864 64.4 69.4 5 SP060 AC791 5 87 36 5879 2141 8020 65.1 69.8 3 SP061 AC1055 4 86 37 7868 1608 9476 60.5 68.5 3 SP062 AC625 4 92 36 5740 1457 7197 64.9 70.8 5 SP063 AC1349 5 93 35 5165 1057 6222 60.1 66.5 5 SP064 AC105 5 92 36 5505 869 6374 61.2 69.3 5 SP065 AC105 4 88 37 6683 1632 8315 64.8 69.4 5 SP066 AC1075 4 85 37 6592 1517 8109 68.3 71.7 7 SP067 AC770 4 89 36 5724 2318 8043 59.2 68.5 5 SP068 AC1172 4 87 36 6883 1545 8427 61.4 65.8 5 SP069 AC638 4 89 38 6110 1290 7401 64.2 70.1 5 SP070 AC1025 4 90 39 6326 1802 8128 59.5 64.0 5 SP071 AC1019 4 92 33 5494 2011 7505 66.2 71.8 7 SP072 AC972 4 88 36 7137 1977 9114 68.1 72.6 5 SP073 AC1075 4 85 38 7249 2212 9461 59.0 67.4 3 SP074 AC1359 3 104 37 4551 707 5258 47.2 55.5 5 SP075 LA2082 4 93 36 5487 2018 7505 60.4 69.3 5 SP076 AC1075 4 88 35 5912 1893 7805 63.6 68.5 7 SP077 AC1048 3 84 36 6489 2274 8763 56.9 65.2 7 SP078 AC1194 5 85 39 7594 2079 9673 53.4 67.4 5 SP079 AC1070 4 83 33 7699 1134 8833 64.8 70.4 5 SP080 AC1336 4 86 36 7562 1755 9317 64.1 69.0 7 SP081 AC1119 3 86 37 7561 563 8124 62.7 67.5 7 SP082 AC918 4 84 36 6283 1895 8178 66.3 70.9 5 SP083 AC1081 4 84 34 7697 2013 9710 63.4 67.9 7 SP084 AC1106 4 90 34 5447 1826 7273 60.2 68.0 5 SP085 AC622 4 89 38 7372 744 8116 61.6 67.0 5 SP086 AC1350 3 89 34 5301 1750 7051 66.7 71.3 3 SP087 AC1350 5 93 37 5040 761 5801 59.7 66.8 5 SP088 AC1215 4 89 38 6342 655 6997 61.9 66.6 5 SP089 AC1400 4 88 37 6235 1595 7830 64.5 69.5 5 SP090 AC1013 4 88 35 6374 2191 8564 62.4 67.4 7 SP091 AC1348 4 90 36 6434 1071 7505 61.2 67.6 5 SP092 AC880 5 89 36 5360 1940 7300 62.3 67.2 3 SP093 AC815 4 93 30 5609 2465 8074 62.6 70.5 5 SP094 AC804 5 86 41 7824 2007 9831 57.9 69.0 5 SP095 AC1070 5 84 31 7241 1763 9005 64.2 70.0 5 SP096 AC1406 4 86 34 7585 2489 10073 62.9 71.1 5 Continued.

49
Table 7. Continued.
SP Entry
Pedigree
Vigor*
Days to 50%
Heading
Height (inch)
Yield (lb/A)
Milling (%) Visual Score†Main 2nd Total Head Total
SP097 AC918 3 90 38 5478 2595 8073 58.2 62.5 5 SP098 AC1106 4 89 38 6896 2912 9808 61.5 67.1 5 SP099 AC1349 3 88 38 6318 1157 7474 61.9 68.4 5 SP100 Cypress 4 91 39 7707 2457 10164 60.6 65.6 5 SP101 AC920 4 87 37 6562 2348 8909 69.3 72.3 5 SP102 AC1348 3 87 37 6499 438 6937 62.6 67.1 7 SP103 AC918 3 88 36 6123 2598 8721 68.1 71.3 5 SP104 AC918 3 88 33 5774 2488 8262 69.6 73.0 5 SP105 AC1075 5 81 36 8313 1742 10055 56.5 66.9 7 SP106 AC918 4 90 35 5715 2722 8437 63.9 68.6 5 SP107 AC1073 5 84 37 8142 969 9111 60.8 70.7 7 SP108 AC1268 3 84 40 7810 2086 9896 65.4 71.2 5 SP109 AC1075 6 86 36 7195 2782 9977 58.5 70.7 7 SP110 AC1013 4 89 39 5601 2287 7888 67.0 69.9 5 SP111 AC831 4 86 26 5010 2032 7042 68.9 72.7 5 SP112 AC1055 4 86 38 7769 1522 9292 59.8 68.4 3 SP113 AC1073 4 86 40 7395 808 8202 62.5 67.3 5 SP114 AC918 6 91 36 4258 1573 5831 67.4 71.7 5 SP115 AC105 3 87 39 6812 1949 8761 65.3 70.3 3 SP116 AC924 6 87 38 6145 2222 8367 64.6 68.5 5 SP117 AC924 5 87 38 5929 2190 8119 60.7 66.2 5 SP118 AC918 3 89 39 5454 2067 7521 63.0 69.0 5 SP119 AC1019 4 91 40 6306 1698 8003 64.0 69.5 5 SP120 AC633 5 93 38 4786 2502 7288 59.0 65.6 5 SP121 AC1055 4 86 37 7845 1228 9073 60.3 69.1 5 SP122 AC1330 4 92 35 5330 1064 6394 62.2 68.7 5 SP123 AC1075 5 87 37 7465 2783 10248 65.7 69.9 7 SP124 AC1069 3 87 38 5234 1128 6363 61.6 68.4 5 SP125 Pace 6 93 35 4940 2967 7908 49.1 66.1 5 SP126 AC981 3 89 36 4842 2584 7426 65.1 70.7 5 SP127 AC831 4 84 38 4523 2182 6706 66.0 71.8 5 SP128 AC1081 5 84 35 7483 1877 9361 64.3 69.8 7 SP129 AC915 4 89 37 6079 2413 8492 59.2 68.1 5 SP130 AC1172 4 81 37 7714 1035 8749 65.9 72.6 7 SP131 AC1019 3 84 39 8195 2392 10587 64.7 71.4 5 SP132 AC1218 4 86 35 7934 1468 9402 67.7 72.9 5 SP133 AC1076 4 81 35 8059 1865 9924 64.0 70.2 7 SP134 AC1055 4 86 37 8085 1769 9855 62.7 71.6 3 SP135 AC936 4 88 38 5881 2532 8413 66.4 71.8 3 SP136 AC1365 4 84 37 7777 1556 9333 65.3 70.9 7 SP137 AC1419 7 91 34 5893 1617 7510 60.2 67.6 5 SP138 AC920 3 86 38 6919 1827 8747 63.4 68.6 5 SP139 AC936 4 91 37 5838 2404 8242 63.8 70.4 3 SP140 AC1406 4 87 35 7585 2283 9869 65.3 70.1 5 SP141 AC1415 5 87 32 7416 2305 9720 64.0 69.6 3 SP142 AC1406 7 87 34 7116 2322 9438 65.7 69.5 7 SP143 AC1415 5 86 33 7572 2374 9945 65.7 70.4 5 Continued.

50
Table 7. Continued.
SP Entry
Pedigree
Vigor*
Days to 50%
Heading
Height (inch)
Yield (lb/A)
Milling (%) Visual Score†Main 2nd Total Head Total
SP144 AC1415 6 87 34 7603 2016 9619 61.1 67.1 5 SP145 AC1406 5 87 31 7237 1964 9201 65.4 70.1 7 SP146 AC1406 5 84 30 8102 2029 10131 70.5 75.7 5 SP147 AC1406 6 85 34 6864 2083 8947 69.3 73.4 5 SP148 AC810 5 84 37 7570 2497 10068 60.4 66.9 5 SP149 NCHS//JSMN/DLLA 7 95 33 4917 2841 7758 56.8 62.8 5 SP150 Banks 3 89 45 9633 2629 12262 59.2 68.3 5 SP151 A-201//ADAR/JODN/3/CPRS 4 84 36 7327 3036 10363 51.2 63.2 3 SP152 SABER /5/DLMT 88462../4/DMSI 4 86 38 6577 2453 9030 55.7 68.0 3 SP153 9502008/KBNT/4/DMSI/DLLAX2//… 4 91 32 5194 2727 7921 66.5 70.6 5 SP154 NWBT/KATY//9902207x2/3/JSMN/DLLA//. 3 86 38 6686 2195 8882 59.1 68.9 7 SP155 NCHS//JSMN/DLLA 6 86 35 5569 1848 7417 55.7 63.6 5 SP156 9502008/LGRU/3/JSMN/DLLA//LEAH/. 4 87 35 6636 2228 8864 67.9 72.2 7 SP157 DREW/KDM 105//LGRU 5 86 40 7292 1669 8960 54.2 66.4 5 SP158 DLRS//AR1142/LA2031/3/JSMN/DLLA 6 90 35 6175 2976 9152 58.4 69.2 7 SP159 CPRS/DREW/3/JSMN/DLLA//LEAH/DLLA 5 88 43 6427 2697 9124 64.6 69.0 3 SP160 9502008//KATY/9902207x2/3/JSMN/… 7 88 38 5613 2399 8012 51.5 66.1 5 SP161 9502008/LGRU/3/JSMN/DLLA//LEAH/. 4 88 41 6707 2892 9599 64.1 71.5 5 SP162 LBLE/L201//MBLE/3/BSMT PAK372A/4/… 5 90 34 6987 2383 9370 62.7 70.0 5 SP163 AC107DH1/AC167DH1/4/DMSI/… 4 85 37 7527 2429 9956 60.0 67.3 5 SP164 JSMN/DLLA//CCDR/LGRU 5 92 35 4541 1974 6515 47.3 68.2 5 SP165 CPRS/KBNT/4/DMSI/DLLAX2//… 4 87 35 6983 1737 8721 57.2 65.6 3 SP166 9502008/LGRU/3/JSMN/DLLA//LEAH/. 3 86 39 6075 1615 7689 61.0 68.7 7 SP167 DLRS//AR1142/LA2031/3/JSMN/DLLA 5 89 32 4315 1503 5818 48.6 66.7 5 SP168 9502008/LGRU/3/JSMN/DLLA//LEAH/. 4 84 40 7502 1937 9438 57.9 68.9 5 SP169 9502008/LGRU/3/JSMN/DLLA//LEAH/. 5 85 42 7273 2613 9886 63.7 71.2 3 SP170 LBLE/L201//MBLE/3/BSMT PAK372A/4/… 5 87 37 6786 1928 8714 55.4 69.0 3 SP171 CPRS/KBNT//JSMN/DLLA 4 95 34 4905 2108 7013 61.9 69.8 5 SP172 CPRS/PI 385456//CCDR 5 95 34 5033 1970 7003 54.3 62.3 5 SP173 9502008-A/DREW/3/JSMN/DLLA//LEAH/. 4 87 40 6573 2935 9508 67.7 72.4 5 SP174 CCDR/3/JSMN/DLLA//LEAH/DLLA 4 87 43 6632 1445 8077 59.2 68.4 3 SP175 Dellrose 4 93 40 4782 2628 7410 65.9 72.8 3 SP176 9502008/LGRU/3/JSMN/DLLA//LEAH/. 3 92 37 4766 1915 6682 59.2 67.9 5 SP177 LBLE/L201//MBLE/3/BSMT PAK372A/4/… 4 89 37 6247 3268 9516 60.7 69.1 3 SP178 SABER /5/DLMT 88462../4/DMSI 4 88 42 6118 2438 8556 54.4 69.1 5 SP179 CPRS/KBNT/3/KBNT//DLMT/B8462T3-710 4 88 35 6496 2881 9377 58.8 65.9 5 SP180 9502008-A/DREW/3/JSMN/DLLA//LEAH/. 3 86 40 6025 1112 7137 58.5 72.1 5 SP181 NWBT/KATY/3/82CAY21/LMNT//… 4 88 39 6781 1559 8340 51.4 68.8 7 SP182 NCHS/A-201 5 95 37 5496 2081 7578 63.6 68.1 5 SP183 JSMN/DLLA//96SP287/3/AR 1121/3/CPRS/. 4 86 42 6041 3100 9141 50.1 67.5 3 SP184 DLMT/4/NWBT/KATY/3/82CAY21/… 4 91 39 5590 3088 8678 62.3 69.6 7 SP185 SABER /5/DLMT 88462../4/DMSI 5 89 39 5289 2249 7538 53.7 65.7 7 SP186 LBLE/L201//MBLE/3/BSMT PAK372A/4/… 5 87 36 7379 2374 9753 58.6 68.5 3 SP187 DREW/KDM 105//LGRU 4 89 40 5923 1385 7308 51.9 60.9 5 SP188 SABER /5/DLMT 88462../4/DMSI 4 88 41 6646 3038 9685 48.4 67.9 3 SP189 CPRS/PI 385456//CCDR 6 96 34 4570 2728 7297 53.2 62.3 5 SP190 JSMN/DLLA//96SP287/3/DLMT 5 88 34 5127 2245 7373 55.5 64.0 3 Continued.

51
Table 7. Continued.
SP Entry
Pedigree
Vigor*
Days to 50%
Heading
Height (inch)
Yield (lb/A)
Milling (%)
Visual Score†Main 2nd Total Head Total
SP191 CCDR/3/JSMN/DLLA//LEAH/DLLA 4 88 37 6764 1980 8744 46.3 56.8 5 SP192 SABER /5/DLMT 88462../4/DMSI 4 88 43 7226 2958 10184 54.8 67.4 3 SP193 9502008/LGRU/3/JSMN/DLLA//LEAH/. 4 88 36 6328 2117 8444 58.4 64.1 5 SP194 NWBT/KATY//9902207x2/3/JSMN/… 5 81 36 7567 2308 9875 56.2 66.8 5 SP195 CPRS//L-205/DLLA 5 89 37 7104 1680 8784 56.8 62.7 5 SP196 LGRU/A-201 3 88 43 6682 3853 10535 53.1 69.0 5 SP197 NWBT/KATY/3/82CAY21/LMNT//… 5 85 33 6035 1384 7418 56.7 69.2 7 SP198 9502008-A/DREW/3/JSMN/DLLA//LEAH/. 3 87 38 6567 2756 9323 58.4 67.7 7 SP199 A-201/SADRI TYPE//CCDR 5 89 37 6163 2497 8659 57.4 65.9 5 SP200 LA2146 4 89 38 6658 3532 10190 65.1 70.0 3 SP201 CPRS/DREW/3/JSMN/DLLA//LEAH/DLLA 3 88 44 6870 3104 9974 62.1 68.6 3 SP202 DREW/KDM 105//LGRU 4 86 45 7683 1802 9485 47.5 64.4 7 SP203 9502008-A/DREW/3/JSMN/DLLA//LEAH/. 4 81 33 7281 2261 9542 60.8 68.5 7 SP204 CPRS/KBNT/3/KBNT//DLMT/B8462T3-710 4 85 37 6134 2478 8612 58.7 67.0 7 SP205 9502008-A/DREW/3/JSMN/DLLA//LEAH/. 3 84 35 7301 3611 10912 61.8 67.2 5 SP206 AC107DH1/AC167DH1/4/DMSI/… 5 85 32 6217 2493 8709 66.4 70.6 5 SP207 9502008/KBNT/4/DMSI/DLLAX2//… 5 96 34 4612 3137 7750 63.2 69.3 5 SP208 SABER /5/DLMT 88462../4/DMSI 4 90 37 5082 1162 6244 52.6 66.7 7 SP209 DLMT 8462…/4/DMSI/5/PI 385456 5 88 36 3802 946 4748 50.8 68.4 5 SP210 9502008/LGRU/3/JSMN/DLLA//LEAH/. 5 89 41 6479 2494 8974 62.1 68.8 5 SP211 L-205/BSMT 370 4 87 33 5462 3059 8521 56.1 70.0 5 SP212 DLMT 8462…/4/DMSI/5/RSMT/5/WELLS 5 89 36 5421 1373 6794 58.0 69.0 5 SP213 CCDR/3/JSMN/DLLA//LEAH/DLLA 4 84 36 6519 2093 8612 58.0 68.8 5 SP214 CCDR/3/KBNT//DLMT/B8462T3-710 4 85 36 6668 2514 9182 51.5 64.7 5 SP215 DLRS//AR1142/LA2031/3/JSMN/DLLA 5 90 35 5471 2491 7961 51.9 61.4 5 SP216 9502008-A/DREW/3/JSMN/DLLA//LEAH/. 4 88 37 6346 2942 9289 62.7 69.3 7 SP217 SABER /5/DLMT 88462../4/DMSI 5 85 38 5499 1508 7007 49.3 65.4 3 SP218 9502008-A/DREW/3/JSMN/DLLA//LEAH/. 4 84 38 7917 2046 9963 57.9 68.1 5 SP219 NWBT/KATY//9902207x2/3/JSMN/DLLA//. 4 84 38 7788 1754 9542 59.3 67.6 5 SP220 NCHS/A-201 4 87 44 5392 1713 7105 53.9 64.3 3 SP221 97 KDMX2-1/WELLS 5 88 30 4846 1010 5857 63.0 70.2 5 SP222 9502008/KBNT/4/DMSI/DLLAX2//… 5 95 31 4769 2266 7035 59.5 67.9 5 SP223 CCDR/3/JSMN/DLLA//LEAH/DLLA 4 89 39 5940 1339 7279 61.3 66.7 3 SP224 NWBT/KATY//9902207x2/3/JSMN/DLLA//. 4 90 41 6032 1290 7323 61.6 66.8 3 SP225 LA2177 5 89 37 5526 2405 7931 56.1 69.7 5 SP226 AC107DH1/AC167DH1/4/DMSI/… 5 89 33 5614 1462 7075 60.2 66.6 5 SP227 NWBT/KATY//9902207x2/3/JSMN/DLLA//. 4 88 38 6385 1738 8123 63.7 70.9 3 SP228 CPRS/DREW/3/JSMN/DLLA//LEAH/DLLA 6 95 41 4980 2192 7171 49.6 61.0 5 SP229 CPRS/DREW/3/JSMN/DLLA//LEAH/DLLA 6 95 40 5473 2627 8100 56.8 67.2 5 SP230 JSMN/DLLA//96SP287/3/AR 1121/3/... 4 93 36 5281 1022 6303 48.9 62.6 5 SP231 JSMN/DLLA//96SP287/3/DLMT 4 86 37 6814 2447 9260 54.3 66.4 5 SP232 LGRU/A-201 5 89 38 6669 3246 9916 50.2 63.9 5 SP233 A-201/SADRI TYPE 5 84 35 5951 1693 7644 59.2 66.2 5 SP234 NCHS//JSMN/DLLA 4 87 39 6746 1797 8543 57.5 66.4 3 SP235 JSMN/DLLA//96SP287/3/DLMT 4 85 40 6337 2596 8933 64.0 70.6 5 SP236 NWBT/KATY//9902207x2/3/JSMN/DLLA//. 5 89 39 5317 2517 7834 61.7 67.4 5 SP237 JSMN/TORO-2//DLMT/3/A-201 6 95 34 3796 2532 6328 47.6 61.4 5 SP238 JSMN/DLLA//96SP287/3/DLMT 4 85 42 6484 3005 9489 34.5 66.1 3 SP239 SABER /5/DLMT 88462../4/DMSI 4 87 39 6204 2622 8827 55.5 64.7 5 * Subjective rating 1 to 9, where 1 = excellent, 9 = no stand. † Subjective rating 1 to 9, where 1 = extremely poor, 9 = ideal type.

52
Table 8. Yield, milling, and agronomic performance of 13 experimental long, medium, and aromatic lines and check varieties in the Uniform Regional Rice Nursery (URN), Crowley, 2007.
Entry
RU#
Grain Type
Vigor*
Days to 50%
Heading
Height (inch)
Yield (lb/A)
Milling (%)
Main Ratoon Total Head Total
022 RU0502094 Long 4 85 39 6937 1811 8748 64.9 69.7 025 RU0402125 Jasmine 5 87 40 7411 1629 9040 67.2 70.3 028 RU0402028 Medium 4 86 36 8399 2833 11232 70.1 72.4 031 RU0702031 Long 4 80 40 7929 1843 9772 62.9 68.3 034 RU0702034 Long 4 79 41 7309 1877 9187 64.9 70.6 125 RU0702125 Long 5 83 41 7994 2074 10067 58.0 69.5 128 RU0702128 Long 5 86 38 6872 2568 9440 65.0 70.5 131 RU0702131 Long 5 83 41 8412 1683 10095 57.4 70.2 134 RU0702134 Long 5 80 41 7320 1821 9141 64.4 69.3 137 RU0702137 Toro 6 87 35 6734 2281 9015 66.1 71.5 140 RU0502177 Basmati 5 84 39 5984 2779 8762 57.5 69.9 146 RU0602146 Della 5 87 39 5763 2463 8226 67.5 71.4 149 RU0702149 Della 5 87 39 6802 2191 8993 63.3 70.2 018 Trenasse Long 5 78 41 8469 1992 10461 59.7 64.6 037 Jupiter Medium 6 86 38 7938 1623 9562 68.1 70.8 038 Bengal Medium 4 86 38 8373 1785 10157 69.7 72.7 045 Catahoula Long 5 88 37 7074 2007 9081 66.9 72.7 058 Cheniere Long 5 88 36 7882 1117 8999 63.3 71.5 059 Cocodrie Long 4 85 38 7717 1157 8874 63.3 70.8 158 Dellrose Della 5 87 44 5969 3267 9236 68.2 72.9 * Subjective rating 1 to 9, where 1 = excellent, 9 = no stand.

53
Table 9. Average yield, milling, and agronomic performance of eight experimental long, medium, and aromatic lines and seven check varieties in Commercial-Advanced (CA) trial at four Louisiana locations, 2007. Entry
Source
Grain Type†
Vigor‡
Days to 50%
heading
Plant Height
(inch)
Yield (lb/A)
Milling (%)
Head Total
240 RU0502094 Long 5 80 39 5985 61.9 69.0 241 RU0402125 Jasmine 5 83 38 5876 57.5 66.0 242 RU0402028 Medium 5 83 36 7322 62.9 67.1 243 RU0702031 Long 5 77 38 6626 61.8 69.3 244 RU0702034 Long 4 75 39 6154 61.0 68.7 245 RU0702137 Toro 5 81 36 6218 62.2 68.3 246 RU0502177 Basmati 6 79 39 5567 57.9 70.2 247 RU0602146 Della 5 81 38 5511 61.3 69.2 205 Trenasse Long 5 74 39 7112 59.7 67.1 207 Cocodrie Long 4 79 37 6586 59.4 68.2 208 Cheniere Long 5 82 36 6533 61.2 70.6 213 Jupiter Medium 6 83 39 7272 61.3 66.2 214 Bengal Medium 4 83 39 7089 60.8 66.1 217 Dellrose Della 6 81 40 5264 63.3 70.6 218 Catahoula Long 5 82 37 6327 63.1 71.4 * Subjective rating 1 to 9, where 1 = excellent, 9 = no stand. Table 10. Yield, milling, and agronomic performance of the specialty Advanced Yield trial (AY) tested at the Rice Research Station, Crowley, 2007.
Entry
Pedigree
Grain† Type
Vigor‡
Days to 50%
Heading
Height (inch)
Yield (lb/A)
Milling (%)
Main Ratoon Total Head Total
001 96 INT/AHRENT J 4 90 42 6227 1073 7301 57.1 62.5 002 L202/Leah//Toro/3/IR67016 B 6 86 40 5772 2161 7934 58.0 70.1 003 CPRS/LGRU//97 KDM X2-5 D 4 89 40 5550 2409 7959 64.2 71.1 004 AC1106 T 3 88 36 6192 2229 8421 58.2 64.7 005 Dellrose D 5 91 42 5299 2277 7576 66.8 71.9 006 Dellmati B 6 82 46 4337 1698 6035 35.7 63.6 007 Toro-2 T 4 88 45 6482 1292 7774 65.9 72.1 008 Cocodrie L 4 87 39 7369 1541 8910 63.6 70.7
c.v.% 12.2 0.8 3.5 4.5 10.4 4.6 7.8 4.1 LSD0.05 0.9 1.3 2.6 465 335 621 10.8 6.6 † J = Jasmine-type, B = Basmati-type, D = Della-type, T = Toro type, and L = Long-grain. ‡ Subjective rating 1 to 9, where 1 = excellent, 9 = no stand.

54
Table 11. Yield, milling, and agronomic performance of the specialty Advanced Yield trial (AY) tested at Lake Arthur, Vermilion Parish, 2007. Entry
Source
Grain Type†
Days to 50%
heading
Plant Height
(inch)
Yield (lb/A)
Milling (%)
Head Total
001 96 INT/AHRENT J 84 39 4566 53.1 61.2 002 L202/Leah//Toro/3/IR67016 B 80 37 4179 52.9 67.0 003 CPRS/LGRU//97 KDM X2-5 D 81 37 4830 64.3 70.8 004 AC1106 T 82 37 4718 59.4 65.7 005 Dellrose D 84 37 4018 62.1 68.9 006 Dellmati B 74 43 4235 54.7 71.2 007 Toro-2 T 88 43 4197 47.1 60.0 008 Cocodrie L 81 39 4217 54.6 65.3
c.v.% 1.0 2.4 7.7 6.5 3.4 LSD0.05 1.4 1.6 586 8.6 5.3 Table 12. Yield, milling, and agronomic performance of the specialty Advanced Yield trial (AY) tested at Mamou, Evangeline Parish, 2007. Entry
Source
Grain Type†
Vigor‡
Days to 50%
heading
Plant Height
(inch)
Yield (lb/A)
Milling (%)
Head Total
001 96 INT/AHRENT J 5 79 88 4211 57.7 67.2 002 L202/Leah//Toro/3/IR67016 B 6 76 101 4577 37.7 71.3 003 CPRS/LGRU//97 KDM X2-5 D 6 77 96 6258 62.7 72.0 004 AC1106 T 6 77 100 6805 64.3 70.7 005 Dellrose D 6 79 95 4646 38.4 71.3 006 Dellmati B 7 73 117 4644 52.6 70.1 007 Toro-2 T 5 80 106 4910 65.0 74.5 008 Cocodrie L 6 75 93 7012 60.2 68.5
c.v.% 7.2 1.5 3.4 7.4 19.3 2.8 LSD0.05 0.7 2.1 2.4 699 25.0 4.7

55
RICE GENETICS AND GERMPLASM DEVELOPMENT
J.H. Oard, D.E. Groth, S.D. Linscombe, X. Sha, S. Kadaru, S. Ordonez, and W. Zhang
Summary 1) Genetic and agronomic analyses of red rice-Clearfield hybrids and their progeny showed that resistance to
NewPath herbicide was dominant in all tested F1 hybrids and a small proportion of the F2 progeny exhibited reproductive success equal to or even greater than the Clearfield varieties.
2) We have developed and applied a new DNA-based method to determine if varieties, lines, hybrids, outcrosses,
or seed mixtures contain genes for resistance to the NewPath herbicide. 3) Multi-year field trials were completed for sheath blight resistance and head rice yield that will facilitate
identification of DNA markers associated with these two important traits in the Rice CAP Project. 4) Use of DNA markers appears promising for rapid and efficient introgression of aroma, disease resistance, and
cooking quality traits from exotic germplasm into adapted Louisiana breeding lines. 5) Numerous sheath blight-resistant lines were developed (SB rating ≤ 5) and used as parents for production of 334
hybrid crosses, and 20 new advanced lines were distributed to the Rice Breeding Program at the Rice Research Station, Crowley, LA.
6) More than 100 statistical methods were evaluated for linking DNA markers with economically important traits
in rice breeding lines.
Genetic and Agronomic Analyses of Red Rice-Clearfield Hybrids and Their Progeny Produced from Natural and Controlled Crosses
Clearfield rice technology is a popular method for controlling noxious red rice weeds (Oryza sativa L.) in
commercial rice fields in the southern United States. Previous research has detected red rice-Clearfield variety F1 hybrids at low rates in Louisiana and Arkansas. The first research objective was to determine genetic control of imazethapyr resistance in F1 hybrids and F2 populations derived from natural and controlled hybridizations of red rice and Clearfield rice. The second objective was to characterize and compare agronomic performance of the hybrids and their progeny with Clearfield varieties. Genetic analysis showed that imazethapyr resistance was dominant in all tested F1 hybrids with single and two-gene inheritance observed across composite F2 populations. F1 hybrids exhibited high levels of variation for plant height, heading date, and seven reproductive traits. Heterosis was observed in the hybrids vs. Clearfield varieties for plant height, heading date, seed-bearing tillers, panicle length, and spikelets/panicle. While seed production of the F1 hybrids was generally inferior to that of the commercial varieties, one red rice/CL121 hybrid produced greater seeds/panicle than the CL121 commercial parent. Extensive variation was observed for all measured traits in the F2 populations derived from either natural or controlled crosses. Results from this study indicate that red rice/Clearfield F1 hybrids normally exhibit low reproductive seed capacity, but a small proportion of the subsequent F2 progeny can produce high fecundity levels. Effective stewardship practices are therefore warranted to reduce the occurrence of such hybrids and their offspring to ensure continued success of the Clearfield technology. Results from this study have been accepted for publication in the journal Euphytica.
Development and Application of DNA-Based (PCR) Assays for Genes that Confer Resistance to the Imazethapyr (NewPath) Herbicide in Rice
Outcrossing or cross hybridization is a potential concern in herbicide-resistant crop management strategies such
as in the ClearfieldTM rice system. Recent studies have shown that the mutated acetolactate synthase (ALS) gene that confers resistance to the imazethapyr (NewPath) herbicide can be transferred from Clearfield rice cultivars via cross pollination under field conditions to weedy red rice. Resistance of commercial Clearfield rice cultivars to imazethapyr is due to the presence of two-point mutations in the ALS gene that result in amino acid substitutions from serine to asparagine (S to D) and glycine to glutamic acid (G to E). We have developed a DNA-based method

56
that involves application of allele-specific PCR assays to distinguish herbicide-susceptible and resistant ALS alleles in either homozygous or heterozygous genotypes produced from natural outcrosses between Clearfield varieties CL121, CL141, CL161, and weedy red rice. PCR assays that can distinguish between the homozygous and heterozygous imazethapyr-resistant S653D and G654E SNP alleles of the rice ALS gene were developed and evaluated. A total of 483 individual red rice plants were successfully screened for the presence of S653D SNP and another 145 F2 individuals from natural red rice x CL121 hybridizations were screened for the presence of the G654E SNP. The PCR-based assays produced during this study are simple, rapid, inexpensive, reproducible, and require only standard PCR and electrophoretic instruments that can be applied toward outcrossing evaluation and effective weed management strategies for the Clearfield crop system. Results from this study have been accepted for publication in the journal Euphytica.
Population Development for Sheath Blight Resistance and High Head Rice Yield in the RiceCAP Project
The RiceCAP Project is a USDA-funded cooperative research program consisting of institutions from nine
states, including three USDA research centers in Arkansas, Mississippi, and Texas. The primary objective of RiceCAP is to identify DNA markers for sheath blight resistance and milling quality that will facilitate breeding of superior varieties for the U.S. rice industry. RiceCAP also has an important outreach component to transfer and communicate research progress that will impact stakeholders and inform the general public. The LSU AgCenter Rice Station has played a crucial role in the development of germplasm and completion of field trials over the last three years for the RiceCAP project. In 2007, the Rice Station collected agronomic data for sheath blight resistance, height, and maturity from the SB2 mapping population (Cocodrie x MCR10277). This is the third and final year for this trial. A second mapping population, referred to as MY2, was derived from a cross between Cypress and LaGrue and evaluated for the second and final year in Louisiana to identify DNA markers for high milling yield and other agronomic traits. All results obtained from the RiceCAP project will be made publicly available to breeders, stakeholders, and the general public.
Evaluation and Application of DNA Markers for Aroma, Disease Resistance, and Cooking Quality in Rice
The demand for high quality or special purpose aromatic rice in the United States and elsewhere has increased during the past two decades. The objective of this research is to evaluate DNA markers for introgression of aroma, disease resistance, and cooking quality into elite U.S. breeding lines. We have developed new Single Nucleotide Polymorphism (SNP) markers in exon 7 of the BAD2 gene for marker-assisted identification and introgression of the aroma gene into U.S. southern germplasm. Additional SNP markers developed by USDA researchers for rice blight resistance, amylose content, and gelatinization temperature were used to genotype 7 parents, 30 F2 individuals, and 216 F1/BC plants. A total of 65 individuals were found to carry the highest percentage of desirable genes for aroma and the other traits. All selected lines were used in crosses to CL161 and other varieties. The F1 hybrids are currently being advanced in the greenhouse for additional SNP genotyping and crossing. The ultimate utility of these markers for rapid development of aromatic rice has yet to be determined, but results to date are promising.
Development of Sheath Blight-Resistant Germplasm by Conventional Methods
The primary goal of this research is to develop improved genetic material for sheath blight resistance from both
domestic and foreign sources by crossing to elite Louisiana varieties. A total of 334 crosses were made using multiple sources of sheath blight resistance that were hybridized with various Louisiana varieties and genetic lines. During the field screening of inoculated material, 88 sheath blight-resistant lines (rating ≤ 5) were identified from more than 1,300 F2 – F6 families. Twenty panicle selections with good levels of resistance and acceptable agronomic traits were submitted for evaluation to the Rice Breeding Program. One hundred lines with similar height, maturity, and panicle type as the variety Cocodrie will be evaluated and crossed to elite lines in 2008 field trials.

57
Linking DNA Markers with Agronomic Traits in Rice
The mixed model is a univariate approach for association genetics that has been developed and applied recently to both outcrossed and inbred plant species, but validation of selected markers associated with complex agronomic traits has not been extensively studied. Our research objective was to evaluate the mixed model and a “model selection” approach to identify markers that explain phenotypic variance associated with four agronomic traits in two genetically diverse and narrow germplasm collections of inbred rice. The results showed that kinship estimates incorporated into the mixed model for the narrow germplasm did reduce Type I errors, but this improvement was not sufficient for high phenotypic prediction rates after validation. The model selection approach as implemented in SAS PROC GLMSELECT estimated main and epistatic effects by standard hypothesis testing and Bayesian information criteria in a multivariate format. Evaluation of 172 different selection criteria resulted in selection of models that increased power and enhanced prediction ability of markers evaluated after validation in both diverse and narrow germplasm. The addition of an epistatic component to the procedure improved validation results. We conclude that a model selection approach with epistatic effects coupled with a validation step should be considered for association genetic studies in rice.
58
MARKER-ASSISTED BREEDING AND GENETIC IMPROVEMENT OF SOUTHERN U.S. RICE
H.S. Utomo, J.L. Nash, and S.D. Linscombe
Marker-assisted breeding (MAB) at the Rice Research Station focuses on important traits such as disease resistance, grain quality, fragrance, and protein content. To produce potential breeding lines, MAB is conducted in conjunction with conventional breeding to include other important traits that currently are beyond the scope of marker-assisted selection (MAS) and anther culture to produce double haploid lines. DNA marker approaches are being used to introgress target genes that are currently not present in the U.S. germplasm. Even though newer cultivars show steady yield increases, a narrow U.S. genetic base has posed concerns in regard to the yield potential in the future. Widening the genetic base through inter-specific crosses, however, can disrupt favorable gene complexes important for maintaining high yield potential and quality advantages of the adapted lines. Although wild or exotic germplasm is likely to contain many genes that interfere with favorable gene complexes, a few genes are beneficial. DNA markers provide a surgical tool to work with these few potential genes from the unadapted materials while maintaining the balance of the favorable gene complexes. With a proper introgression design, the effect of these few foreign genes can be analyzed extensively. Once target alleles have been introgressed into the adapted lines, forward crossing and MAB can be applied during cultivar development.
Blast-Resistant Genes
Durable blast-resistant cultivars will help achieve potential yield by minimizing yield loss due to blast outbreak. The Pi-ta2 gene provides resistance that is considered adequate in some rice growing areas such as Arkansas. While Pi-ta2 provides the widest spectrums against rice blast races, it does not provide protection against 10 major U.S. blast races (eight out of 10 major races). Pi-ta2 blast-resistant gene was obtained from Vietnamese cultivar Tetep and was used in developing cultivar Katy that was released in 1981. Similarly, the Pi-b gene was originally not present in the U.S. germplasm. It was obtained from Chinese cultivar TeQing and incorporated into the development of U.S. cultivar Saber. Molecular markers closely associated with Pi-ta2, Pi-b, Pi-z, Pi-kh, and Pi-ks are available to identify these genes in the background of U.S. cultivars.
Increasing durability against blast disease among commercial cultivars will help maintain steady yield under
various disease pressure. Recently, IRRI has developed a set of parental lines composed of monogenic lines for targeting 24 blast-resistant genes Pia, Pib, Pii, Pik-s, Pik, Pik-h, Pik-m, Pik-p, Pish, Pit, Pita (Pi4), Pita-2, Piz, Piz- (Pi2), Piz-t, Pi1, Pi-3, Pi5, Pi7 (t), Pi9, Pi11(t), Pi12 (t), Pi19, and Pi20 in rice. Near isogenic lines carrying 14 blast-resistant genes - Pi-b, Pik-s, Pik, Pik-h, Pik-m, Pik-p, Pish, Pita (Pi4), Pita-2, Piz-5 (Pi2), Piz-t, Pi1, Pi5, and Pi7 (t) has been successfully developed in Indica background. Accumulation of known blast genes into the U.S. background similar to the near isogenic lines developed by IRRI will be a valuable source of resistance genes in breeding programs. Lines containing various combinations of pyramided genes can be used for detailed pathological analysis of blast races found in the United States. Pi-ta2 gene
Resistant spectrum: provide protection against IB-1, B-45, IB49, IB-54, IC17, IE-1, IG-1, and IH-1. Location: in the chromosome 12 near the centromer region. Linked markers: RM 7102, RM 155, and OSM 89. Source of Pi-ta2gene used in crosses: Katy, Kaybonnet, and Drew.
Table 1 shows agronomic characteristic of F5 breeding lines carrying a Pi-ta2 gene. Figure 1 is an example of a gel image to indicate the presence of blast-resistant genes among segregating lines.

59
Figure 1. Example of a gel image as a basis for carrying out marker-assisted selection for blast-resistant genes. In this marker screening, cultivar Katy was used as a control for the Pi-ta2 presence.
Microsatellite markers
Typical PCR reactions are as follows: The PCR mix consisted of 3.13 µl of Sigma Jumpstart™ (Sigma, MO, USA; Cat. # P0982), 1.87 µl DNA template, and 0.63 µl (0.1 µM) each of forward and reverse microsatellite primers. PCR amplification was performed on a PTC 100 thermal cycler (MJ Research, Inc., MA, USA) using a 96-well plate, programmed to initial denaturation at 94oC for 4 min followed by 35 cycles of 45 sec at 94oC, 45 sec at 55oC, and 1 min at 72oC, with a final extension step of 1 min at 72oC for amplification. The PCR product was held at 4oC before analysis. Electrophoresis and band scoring
PCR products were separated on a polyacrylamide gel in a Mega-Gel dual high-throughput vertical electrophoresis unit (C.B.S. Scientific, CA, USA). 100 µl of 10 mg ml-1 ethidium bromide was added to the lower buffer reservoir before pre-running the gel. The PCR product of 6.25 µl volume was loaded into the well and run at 300 volts for 2 hours and 30 minutes. The resulting bands were visualized under 254-nm UV light and the band images were captured on the KODAK EDAS 290. The size of bands was determined using the KODAK EDAS 290 companion software and band images were stored as JPEG file.
10bp
stan
dard
K
aty
cont
rol
07F1
77-2
-2-1
07
F178
-2-1
-1
07F1
79-1
-2-1
07
F179
-3-1
-1
07F1
80-1
-1-1
07
F180
-1-2
-1
07F1
80-2
-1-1
K
aty
cont
rol
07F1
80-2
-2-1
07
F180
-3-1
-1
07F1
80-3
-2-1
07
F181
-1-1
-1
07F1
81-2
-1-1
07
F181
-3-2
-1
07F1
82-1
-1-1
K
aty
cont
rol
07F1
84-2
-2-1
07
F184
-3-1
-1
07F1
84-3
-2-1
07
F186
-1-2
-1
07F1
86-2
-2-1
07
F186
-3-2
-1
07F1
87-2
-1-1
K
aty
cont
rol
07F1
87-3
-1-1
07
F187
-3-2
-1
07F1
88-1
-2-1
07
F188
-2-1
-1
07F1
88-2
-2-1
07
F189
-1-2
-1
07F1
91-3
-1-1
10
bp st
anda
rd

60
Table 1. Field performance of progeny lines carrying Pi-ta2gene.
Plant ID
Seedling
Vigor¶ Panicle
Length (cm)
Grain type‡
Panicle weight (g)
Plant
height (cm)
Row yield
(g)
Heading
date
1 07F397 3
28.8 L 8.29 70 701 85
2 07F374 3
28.4 L
7.14 74 504 84
3 07F479 3
29.2 L
7 80 670 88
4 07F490 3
26.4 L
6.4 82 1202 84
5 07F513 3
28.2 L
6.4 81 899 82
6 07F540 2
28.9 L
6.3 84 930 83
7 07F475 3
30.1 L
6.14 76 1603 84
8 07F437 2
26.1 L
6.1 71 500 88
9 07F345 2
29.7 L
5.98 76 506 83
10 07F440 2
26.7 L
6 86 435 80
11 07F762 3
26.5 L
5.9 76 436 80
12 07F571 3
26.3 L
5.87 75 367 76
13 07F772 3
29.3 L
5.9 76 509 88
14 07F467 3
27.5 L
5.85 75 806 80
15 07F538 3
27.4 L
5.82 87 344 81
16 07F717 3
24.4 L
5.81 81 435 81
17 07F582 3
27 L
5.8 88 367 82
18 07F124 3
26.6 L
5.76 80 390 84
19 07F775 2
27.6 L
5.72 80 566 85
20 07F719 3
27 L
5.66 82 678 85
21 07F511 3
29.4 L
5.65 81 466 86
22 07F515 3
27.5 L
5.64 83 578 83
23 07F533 3
26.7 L
5.6 84 432 83
24 07F282 3
27 L
5.6 83 343 83
25 07F385 3
24.9 L
5.6 82 356 84
26 07F548 3
28.9 L
5.59 82 564 85
27 07F584 3
27.1 L
5.59 82 454 87
28 07F481 3
27.8 L
5.58 81 345 85
29 07F367 3
30.8 L
5.57 79 340 85
30 07F480 3
25.9 L
5.56 77 504 85
31 07F539 3
25.6 L
5.5 81 205 83
32
07F478
3 28.3
L 5.5
84 246 83
¶ Subjective rating 1 to 9 (1 = excellent, 9 = poor). ‡ L = long grain. Puerto Rico Winter nursery: 20 selected F5 carrying Pi-ta2 genes that have promising agronomic traits are being grown in the winter nursery. Seed harvested will be used for preliminary yield trials in the summer of 2008.

61
Marker-Assisted Backcrossing Backcross program and development of progeny lines
Four donor lines were used; Cultivar Katy for Pi-ta2, Saber for Pi-b, Lemont for Pi-kh, and Bengal for Pi-ks gene (Fig. 1). Microsatellite marker RM 7102 was used to tract Pi-ta2 (with a distance of 1.2 cM), RM 208 for Pi-b (0.0 cM), and RM224 for Pi-kh (0.2 cM). Backcrosses were made to introgress an individual target gene into recurrent parent Cocodrie. The second recurrent parent, breeding line MB7006, was used to duplicate the process. Conventional breeding is being conducted among progeny lines derived from pyramided Cocodrie and MB7006 lines. Pi-b gene
Resistance spectrum: provide protection against IB-1, B-45, IB49 (moderate), IC17, IE-1, IG-1, IG-1K, and IH-1
Location: in chromosome 2 Linked markers: Pi-b dom Source of Pi-b gene used in crosses: Saber and Bolivar
Pi-k gene
Resistance spectrum: provide protection against IB-45, IB54, and IG-1 races Location: in chromosome 11 Linked markers: RM 224 and RM 1233 Source of Pi-kh gene used in crosses: Kaybonnet and Lemont
Pi-ks gene
Resistance spectrum: provide protection against IB54 race Location: in chromosome 11 Linked markers: RM 224 and RM 1233 Source of Pi-ks gene used in crosses: M201 and Bengal
Figure 2 shows the backcross and cross schedule used to pyramid target genes. Genome scanning by placing
markers of approximately equal spacing along the 12 rice chromosomes was used to improve the efficiency of backcross transgression. Microsatellite polymorphic parental markers and number of markers per chromosome used in genome scanning are presented in Table 2. An estimate recipient genome recovery (G) was calculated as
G = {(X+0.5Y) X 100}/N Where, N= total number of parental polymorphic markers used X= number of markers showing homozygousity for recurrent parental allele Y = number of markers showing heterozygosity for parental alleles

62
Figure 2. Backcross and cross schedule used to pyramid target genes.
Table 2. Percent of alleles in BC3F2 introgression lines revealed by genome scanning.
Percent Chromosome Whole
BC lines allele 1 2 3 4 5 6 7 8 9 10 11 12 Genome
BC3F2 CCDR 61.2 95.2 70.1 57.4 76.1 100 78.4 90.1 93.3 96 76.2 89.1 82
(75) Heterozygous 20.6 4.8 22.9 19.6 17.9 0 9.6 7.9 2.7 3 21.8 7.9 11.5
Pi-ta2 donor 18.2 0 7 23 6 0 12 2 4 1 2 3 6.5
BC3F2 CCDR 82.3 88.3 76 72.3 77.1 88.3 88 79.8 77.5 95 86 89.1 83.3
(75) Heterozygous 0.7 6.7 16 23.7 8.9 9.7 1.8 16.2 8.5 3 14 8.9 9.8
Pi-b donor 17 5 8 4 14 2 10.2 4 14 2 0 2 6.9
BC3F2 CCDR 87 89.8 77.8 76.4 88.1 78 74.3 88.4 94 100 91.2 100 87
(75) Heterozygous 8 4.2 15.2 15.6 6.5 22 13.7 9.6 2 0 6.8 0 8.6
Pi-kh donor 5 6 7 8 5.4 0 12 2 4 0 2 0 4.4
BC3F2 CCDR 87.2 88.3 89 78.2 77.1 98.2 89.5 92 87.9 87.5 87.4 98 88.3
(75) Heterozygous 5.7 11.7 0.8 15.4 16.8 1.8 8.5 8 8.9 11.5 10.6 2 8.5
Pi-z donor
7.1
0
10.2
6.4
6.1 0 2 0 3.2 1 2
0
3.2
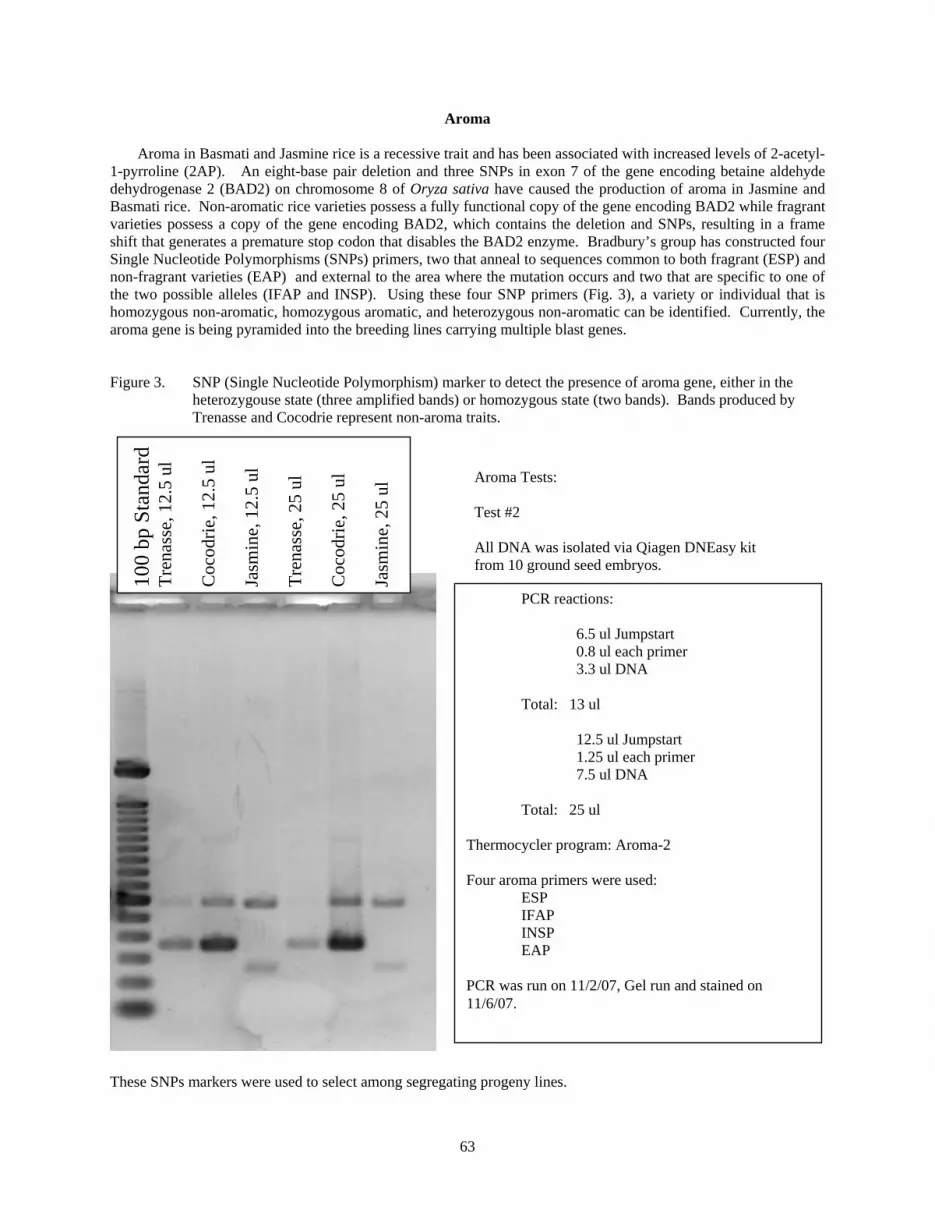
63
Aroma
Aroma in Basmati and Jasmine rice is a recessive trait and has been associated with increased levels of 2-acetyl-1-pyrroline (2AP). An eight-base pair deletion and three SNPs in exon 7 of the gene encoding betaine aldehyde dehydrogenase 2 (BAD2) on chromosome 8 of Oryza sativa have caused the production of aroma in Jasmine and Basmati rice. Non-aromatic rice varieties possess a fully functional copy of the gene encoding BAD2 while fragrant varieties possess a copy of the gene encoding BAD2, which contains the deletion and SNPs, resulting in a frame shift that generates a premature stop codon that disables the BAD2 enzyme. Bradbury’s group has constructed four Single Nucleotide Polymorphisms (SNPs) primers, two that anneal to sequences common to both fragrant (ESP) and non-fragrant varieties (EAP) and external to the area where the mutation occurs and two that are specific to one of the two possible alleles (IFAP and INSP). Using these four SNP primers (Fig. 3), a variety or individual that is homozygous non-aromatic, homozygous aromatic, and heterozygous non-aromatic can be identified. Currently, the aroma gene is being pyramided into the breeding lines carrying multiple blast genes. Figure 3. SNP (Single Nucleotide Polymorphism) marker to detect the presence of aroma gene, either in the
heterozygouse state (three amplified bands) or homozygous state (two bands). Bands produced by Trenasse and Cocodrie represent non-aroma traits.
Aroma Tests: Test #2 All DNA was isolated via Qiagen DNEasy kit from 10 ground seed embryos.
These SNPs markers were used to select among segregating progeny lines.
100
bp S
tand
ard
Tren
asse
, 12.
5 ul
C
ocod
rie, 1
2.5
ul
Jasm
ine,
12.
5 ul
Tr
enas
se, 2
5 ul
C
ocod
rie, 2
5 ul
Ja
smin
e, 2
5 ul
PCR reactions: 6.5 ul Jumpstart 0.8 ul each primer 3.3 ul DNA Total: 13 ul 12.5 ul Jumpstart 1.25 ul each primer 7.5 ul DNA Total: 25 ul Thermocycler program: Aroma-2 Four aroma primers were used: ESP IFAP INSP EAP PCR was run on 11/2/07, Gel run and stained on 11/6/07.

64
Drought Tolerance
A drought-tolerant gene has been mapped recently and known to be located in chromosome 12. Gary Atlin’s group has identified two SSR markers flanking a major QTL region for drought tolerance that correspond to 60% of total variation . Indica rice variety Way Rarem carries the drought-resistant gene. RM28048 and RM511 flank the 10.2 cM QTL region (Fig. 4). The two markers are being used during introgression of qtl 12.1 from Indica Way Rarem into the U.S. germplasm. This introgression process is reminiscence of transferring Pi-ta2 or Pi-b blast gene of foreign origin. Pi-ta2is a major blast-resistant gene introduced into Katy from the Vietnamese landrace Tetep, and Pi-b is another major gene introduced into Saber from Chinese cultivar TeQing. Crosses have been initiated (Table 3). Introgession of qtl 12.1 will be carried out through marker-assisted backcrossing. Figure 4. QTLs associated with drought tolerance based on mapping population from Way Rarem/cross.
Table 3. List of crosses with cv Way Rarem.
Crosses Generation 1 Cocodrie F1 2 Trenasse F1 3 Catahoula F1 4 Cheniere F1 5 Jupiter F1 6 Bengal F1
High Lysine Trait
Lysine is an essential amino acid. Lysine concentration in major grains, including rice, is the lowest among 11 essential amino acids. It is a major nutritional drawback, therefore, nutritional improvement of rice grain will be associated directly with improved lysine content. Lysine belongs to the aspartate family of amino acids and its biosynthesis is regulated by several feedback loops. Dihydrodipicolinate synthase (DHDPS; EC 4.2.1.52), the first enzyme of the lysine specific branch of the aspartate pathway, is strongly feedback inhibited by lysine in most plant species. Thus, de-regulating the metabolic pathway through modification of the allosteric site of DHDPS plays a crucial role in increasing lysine synthesis. A feedback insensitive version of DHDPS has shown to cause elevated amounts of lysine content. For example, the mutant dhdps-r1 gene from Nicotiana sylvestris demonstrates that the gene encoding a feedback insensitive DHDPS is responsible for the elevated level of lysine. A bacterial DHDPS gene, isolated from E. coli, has been shown to be at least 20-fold less sensitive to increases in lysine levels. A portion of this proposed project will be focused on identifying mutation sites in the gene coding for DHDPS in two high lysine rice lines.

65
Molecular markers to tag the genes controlling this trait will be needed to transfer; this trait into popular cultivars and help establish successful breeding methodology. The gene coding for DHDPS, a key enzyme in the lysine synthesis pathway, will be evaluated using two high lysine lines from high protein lines WE07 and WE97 developed at the Rice Research Station. Four low protein lines from the USDA collection will be used as additional controls. A molecular technique, Ecotilling, will be used to identify nucleotide differences in the gene coding for DHDPS enzyme. Molecular information obtained will be used to develop new markers for high lysine content in the rice grain. Isolation of the DHDPS gene and PCR amplification A gene coding for DHDPS from high lysine lines and the cultivar check Wells has been isolated. Specific primers, forward primer D-Probe-1 and reversed primer D-Probe-2, were used to amplify the gene. Figure 5 is the example of amplified DHDPS genes from Cocodrie, Wells, and Cypress. Amplified products of 1141 bp long from two high lysine lines and cultivar Wells were purified from the excised gels. Purified amplified products are currently being sequenced. Sequence information will be used to develop SNPs markers for used in marker-assisted breeding.
Induced Mutation Breeding and Marker for Herbicide Resistance
Induced mutation: Approximately 50 lb of Cypress seed were treated with mutagen ethyl methanesulfonate (EMS). EMS is expected to produce random mutations in genetic material by nucleotide substitution, specifically by guanine alkylation.
Date of treatment: April 30, 2007 EMS treatement: 0.125% EMS for 18 hours. Date of planting: May 3, 2007, on a 0.4-A plot, hand broadcasted followed by mulching. Seeding rate: 4 to 5 seedling/square inch. Mutated M2 seed was harvested last summer and will be planted in the field. Sethoxydim herbicide will be applied
at a recommended rate when the M2 plants reach the 2- to 5-leaf stage to identify mutant(s) resistant to the herbicide.
RiceCap Activities
DNA marker analysis for the SB2 mapping population was conducted using an ABI capillary system (Brian Scheffler’s USDA laboratory in Stoneville, MS). DNA marker data from the ABI outputs were analyzed using the GeneMapper ver. 3.7. Examples of ABI outputs analyzed using the GeneMapper ver. 3.7. to determine allelic status of each SB2 line following the amplification of DNA targets using specific primers that generate polymorphic SSR markers (Fig. 6). An example of DNA fingerprints of SB2 lines based on 11 SSR markers is given in Table 4.

66
Figure 5. PCR amplification of dihydrodipicolinate synthase (DHDPS) (EC 4.2.1.52), a major catalytic enzyme in the production of lysine. DHDPS genes from cultivars Cocodrie, Wells, and Cypress were used as a standard DNA sequence. Probe Tests: Test #1
Coc
odrie
, 12.
5 ul
W
ells
, 12.
5 ul
C
ypre
ss, 1
2.5
ul
Coc
odrie
, 25
ul
Wel
ls, 2
5 ul
C
ypre
ss, 2
5 ul
10
0 bp
Sta
ndar
d
PCR reactions: 6.5 ul Jumpstart 1.25ul each primer 3.75ul DNA Total: 12.5ul 12.5 ul Jumpstart 2.5ul each primer 7.5ul DNA Total: 25ul Thermocycler program: DHDPSCP Primers used: D-Probe-1 D-Probe-2 PCR was run on 11/2/07, Gel run and stained on 11/6/07.

67
Figure 6. Allelic determination of SB2 lines using GeneMapper ver. 3.7.

68
Table 4. Allelic status of 325 sheath blight lines from SB2 mapping population based. RM 3288 RM3912 RM1108 RM1287 RM5575 RM6844 RM3828 RM1352 RM1335 RM233A RM3585
SB2-1 ?
SB2-2 ?
SB2-3
SB2-4 165.1&170.9
SB2-5
SB2-6 192.2&194.3
SB2-7
SB2-8
SB2-9 ? ?
SB2-10
SB2-11
SB2-12
SB2-13 224.53 ? 136.7&167.7
SB2-14
SB2-15
SB2-16
SB2-17 ?
SB2-18 136.7&167.7
SB2-19
SB2-20 192.2&194.3 154.9&168.3
SB2-21
SB2-22 211.9&209.9
SB2-23
SB2-24 121&129 165.1&170.9
SB2-25
SB2-26 192.2&194.3
SB2-27 22.6&212.6 136.7&167.7
SB2-28
SB2-29 154.9&168.3
SB2-30 136.7&167.7 187.5&195.3
SB2-31
SB2-32 136.7&167.7
SB2-33 ? 136.7&167.7 ?
SB2-34
SB2-35
SB2-36
SB2-37
SB2-38 165.1&170.9
SB2-39 ?
SB2-40
SB2-41
SB2-42
SB2-43 136.7&167.7
SB2-44 192.2&194.3 136.7&167.7
SB2-45
SB2-46
SB2-47
SB2-48 136.7&167.7
SB2-49
SB2-50
SB2-51 154.9&168.3
SB2-52
SB2-53
SB2-54
SB2-55
SB2-56 192.2&194.3
SB2-57 211.9&209.9 357.47 (?)
SB2-58
SB2-59 22.6&212.6 192.2&194.3 121&129 211.9&209.9 355.6&361.6
SB2-60
SB2-61 196.33 (?) 158.27(?)
SB2-62
SB2-63
SB2-64 192.2&194.3
SB2-65
Continued.
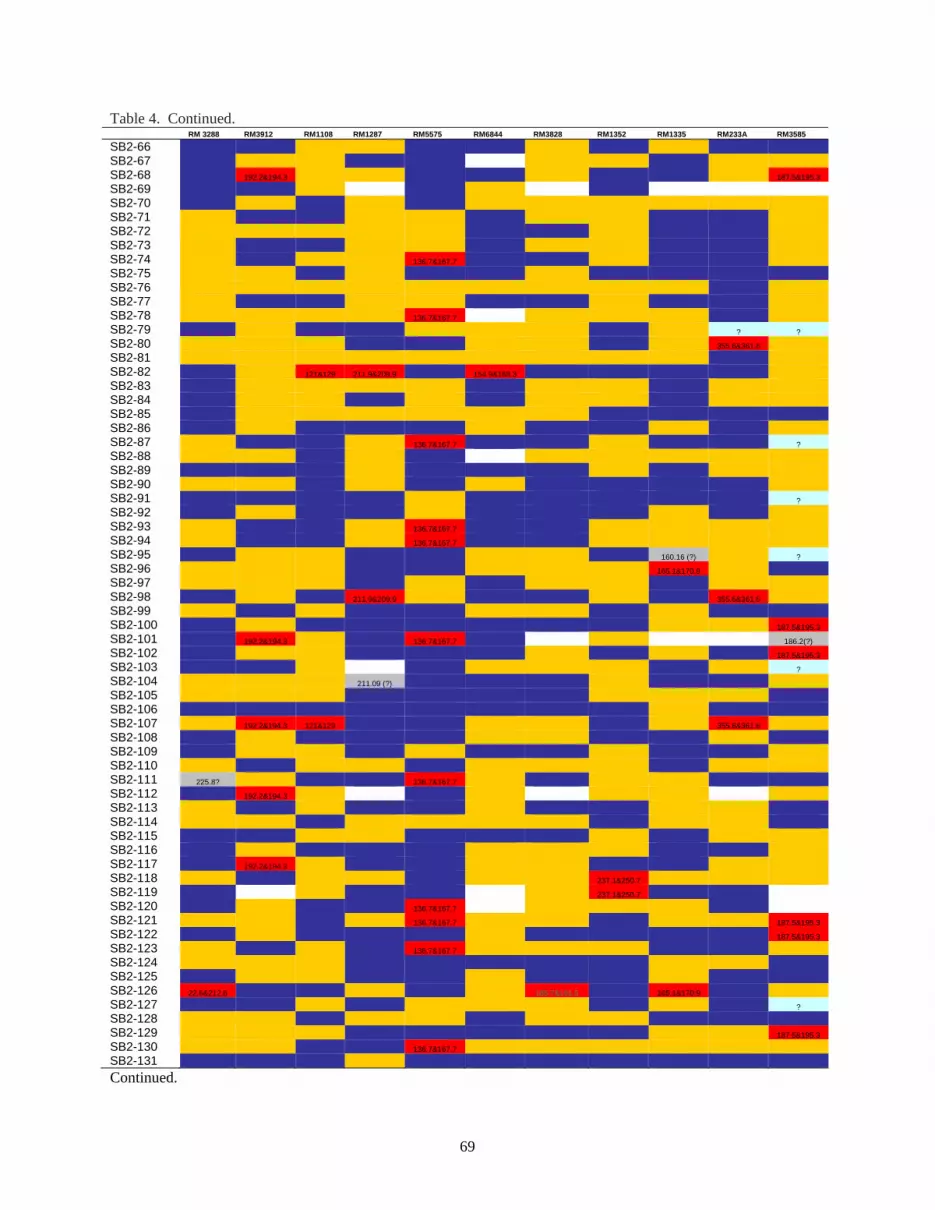
69
Table 4. Continued. RM 3288 RM3912 RM1108 RM1287 RM5575 RM6844 RM3828 RM1352 RM1335 RM233A RM3585
SB2-66
SB2-67
SB2-68 192.2&194.3 187.5&195.3
SB2-69
SB2-70
SB2-71
SB2-72
SB2-73
SB2-74 136.7&167.7
SB2-75
SB2-76
SB2-77
SB2-78 136.7&167.7
SB2-79 ? ?
SB2-80 355.6&361.6
SB2-81
SB2-82 121&129 211.9&209.9 154.9&168.3
SB2-83
SB2-84
SB2-85
SB2-86
SB2-87 136.7&167.7 ?
SB2-88
SB2-89
SB2-90
SB2-91 ?
SB2-92
SB2-93 136.7&167.7
SB2-94 136.7&167.7
SB2-95 160.16 (?) ?
SB2-96 165.1&170.9
SB2-97
SB2-98 211.9&209.9 355.6&361.6
SB2-99
SB2-100 187.5&195.3
SB2-101 192.2&194.3 136.7&167.7 186.2(?)
SB2-102 187.5&195.3
SB2-103 ?
SB2-104 211.09 (?)
SB2-105
SB2-106
SB2-107 192.2&194.3 121&129 355.6&361.6
SB2-108
SB2-109
SB2-110
SB2-111 225.8? 136.7&167.7
SB2-112 192.2&194.3
SB2-113
SB2-114
SB2-115
SB2-116
SB2-117 192.2&194.3
SB2-118 237.1&250.7
SB2-119 237.1&250.7
SB2-120 136.7&167.7
SB2-121 136.7&167.7 187.5&195.3
SB2-122 187.5&195.3
SB2-123 136.7&167.7
SB2-124
SB2-125
SB2-126 22.6&212.6 185.7&191.5 165.1&170.9
SB2-127 ?
SB2-128
SB2-129 187.5&195.3
SB2-130 136.7&167.7
SB2-131
Continued.

70
Table 4. Continued. RM 3288 RM3912 RM1108 RM1287 RM5575 RM6844 RM3828 RM1352 RM1335 RM233A RM3585
SB2-132
SB2-133 136.7&167.7
SB2-134
SB2-135
SB2-136 121&129 211.9&209.9 136.7&167.7 154.9&168.3 185.7&191.5 165.1&170.9
SB2-137 22.6&212.6 211.9&209.9 237.1&250.7
SB2-138 355.6&361.6 187.5&195.3
SB2-139
SB2-140
SB2-141 136.7&167.7
SB2-142 136.7&167.7
SB2-143 ? ?
SB2-144 22.6&212.6 187.5&195.3
SB2-145 136.7&167.7
SB2-146 136.7&167.7
SB2-147
SB2-148 192.2&194.3
SB2-149 165.1&170.9
SB2-150 211.9&209.9 136.7&167.7 357.6 (?)
SB2-151
SB2-152
SB2-153
SB2-154 121&129 355.6&361.6
SB2-155
SB2-156
SB2-157
SB2-158 211.9&209.9
SB2-159
SB2-160
SB2-161 165.1&170.9
SB2-162 165.1&170.9
SB2-163 136.7&167.7 161.25
SB2-164 192.2&194.3 136.7&167.7
SB2-165 192.2&194.3 154.9&168.3 165.1&170.9
SB2-166 22.6&212.6
SB2-167 251(?)
SB2-168
SB2-169
SB2-170
SB2-171 136.7&167.7
SB2-172
SB2-173 187.5&195.3
SB2-174
SB2-175 ? ?
SB2-176
SB2-177
SB2-178
SB2-179
SB2-180 192.2&194.3
SB2-181
SB2-182 ?
SB2-183 ? ? ?
SB2-184 165.1&170.9 ?
SB2-185
SB2-186 187.5&195.3
SB2-187 22.6&212.6
SB2-188 192.2&194.3 187.5&195.3
SB2-189 192.2&194.3 211.9&209.9 154.9&168.3 185.7&191.5 355.6&361.6
SB2-190 ? ? 167.37(?)
SB2-191 136.7&167.7 ?
SB2-192 192.2&194.3
SB2-193 22.6&212.6 192.2&194.3
SB2-194
SB2-195
SB2-196 192.2&194.3
SB2-197 192.2&194.3 136.7&167.7
SB2-198 187.5&195.3
Continued.

71
Table 4. Continued. RM 3288 RM3912 RM1108 RM1287 RM5575 RM6844 RM3828 RM1352 RM1335 RM233A RM3585
SB2-199
SB2-200
SB2-201
SB2-202 121&129 ? 187.5&195.3
SB2-203
SB2-204 192.2&194.3
SB2-205 121&129 211.9&209.9 154.9&168.3 355.6&361.6
SB2-206
SB2-207 192.2&194.3
SB2-208
SB2-209
SB2-210 211.89
SB2-211
SB2-212 192.2&194.3 237.1&250.7
SB2-213 22.6&212.6 192.2&194.3
SB2-214 22.6&212.6 355.6&361.6
SB2-215 192.2&194.3
SB2-216 121&129
SB2-217
SB2-218 22.6&212.6 237.1&250.7 355.6&361.6
SB2-219
SB2-220
SB2-221
SB2-222 136.7&167.7 187.5&195.3
SB2-223
SB2-224 154.9&168.3 165.1&170.9 187.5&195.3
SB2-225 211.9&209.9 154.9&168.3
SB2-226
SB2-227
SB2-228 136.7&167.7 187.5&195.3
SB2-229 192.2&194.3 136.7&167.7 187.5&195.3
SB2-230
SB2-231
SB2-232 192.2&194.3 165.1&170.9
SB2-233
SB2-234
SB2-235 22.6&212.6
SB2-236 ? 211.9&209.9
SB2-237 192.2&194.3
SB2-238 136.7&167.7
SB2-239
SB2-240 192.2&194.3
SB2-241 192.2&194.3
SB2-242 121&129 355.6&361.6
SB2-243 136.7&167.7
SB2-244 208.11 (?) 136.7&167.7
SB2-245
SB2-246
SB2-247
SB2-248
SB2-249 192.2&194.3 237.1&250.7
SB2-250
SB2-251
SB2-252
SB2-253 ? 189.28 (?)
SB2-254
SB2-255 192.2&194.3
SB2-256 136.7&167.7 165.1&170.9
SB2-257 192.2&194.3
SB2-258 121&129
SB2-259 355.6&361.6
SB2-260
SB2-261 192.2&194.3
SB2-262
SB2-263 ? ?
SB2-264 136.7&167.7 165.1&170.9 355.6&361.6
SB2-265 237.1&250.7
Continued.

72
Table 4. Continued. RM 3288 RM3912 RM1108 RM1287 RM5575 RM6844 RM3828 RM1352 RM1335 RM233A RM3585
SB2-266
SB2-267
SB2-268 223.43?
SB2-269 121&129
SB2-270 192.2&194.3 158.04(?)
SB2-271
SB2-272
SB2-273 355.6&361.6
SB2-274 192.2&194.3
SB2-275 222.45? 124.96(?) 136.7&167.7 157.95(?) 165.1&170.9 187.5&195.3
SB2-276 124.92(?) 208.01(?) 242.59 (?)
SB2-277 ? ?
SB2-278
SB2-279 355.6&361.6
SB2-280 139 (?)
SB2-281 355.6&361.6
SB2-282 211.9&209.9 165.1&170.9
SB2-283
SB2-284 185.7&191.5 355.6&361.6
SB2-285 136.7&167.7 ? ?
SB2-286 192.2&194.3 210.79 (?)
SB2-287 192.2&194.3
SB2-288
SB2-289 187.5&195.3
SB2-290 237.1&250.7
SB2-291
SB2-292
SB2-293 192.2&194.3 136.7&167.7 355.6&361.6
SB2-294 208.12 (?) 167.16 (?)
SB2-295 121&129 136.7&167.7 154.9&168.3
SB2-296 187.5&195.3
SB2-297 136.7&167.7
SB2-298 192.2&194.3
SB2-299 355.6&361.6
SB2-300
SB2-301 136.7&167.7
SB2-302 192.2&194.3
SB2-303 192.2&194.3 136.7&167.7
SB2-304 136.7&167.7
SB2-305 211.9&209.9
SB2-306
SB2-307 192.2&194.3 136.7&167.7
SB2-308
SB2-309
SB2-310 121&129 165.1&170.9
SB2-311 192.2&194.3 128.53(?)
SB2-312 136.7&167.7
SB2-313 237.1&250.7 187.5&195.3
SB2-314 192.2&194.3 246.52 (?)
SB2-315
SB2-316
SB2-317 ? 187.5&195.3
SB2-318 192.2&194.3
SB2-319 207.93(?) 165.1&170.9
SB2-320
SB2-321
SB2-322 192.2&194.3
SB2-323 192.2&194.3
SB2-324
SB2-325 136.7&167.7
CCDR 226.6 192.2 192.27 159.52 (?)
CCDR 211.9 136.7&167.7
MCR01277 212.6 194.3 194.41 209.9 136.7 MCR01277
Note: ? = Too much noise Purple = MCR allele Blank = Missing data Yellow = Cocodrie allele Red = Heterozygous Grey = Non parental allele

73
INDUCED MUTATIONAL BREEDING AND ENHANCEMENT OF NUTRITIONAL QUALITY IN RICE
I. Wenefrida, S.D. Linscombe, and H.S. Utomo
Enhancing specific grain properties that will give outstanding health benefits will provide more marketable
products and expand rice grain markets into processing industries. In the recent years, rice protein-based supplements are emerging products in the health-enhancement industry. Delivering high nutritional characteristics into new cultivars will accelerate the development of new markets for rice. 1. Protein content and field performance
Last year, new additional lines (612 lines) were successfully recovered from in vitro screening and other methods that were designed to increase the level of grain protein and/or lysine content in rice. The newly identified lines were evaluated in the field through replicated tests consisting of three replicated rows per entry. The first year of data indicated that 218 lines showed an increase in their total crude protein content, ranging from 5 to 96% of the parental protein content. Further tests will be conducted in the second growing season.
Replicated field trials have been conducted among 56 promising lines that were developed three years ago.
Tables 1 and 2 show the average protein content and field performance of the 56 promising lines, respectively, based on two years of data. Protein quantification: Total crude protein content was measured using brown and milled rice based on the dry combustion method using a Leco N Analyzer. In addition, Bradford’s method and SDS-PAGE were used to reconfirm protein content in a sample of lines.
2. Preliminary yield trials
Replicated field tests were conducted on 635 new lines derived from Cypress, Cocodrie, and Trenasse. Preliminary yield trials were conducted among six promising lines (Table 3). Fertilizers were applied at 280 kg/ha (8-24-24) at preplant and 168 kg/ha (46-0-0) at the 3- to 4-leaf stage (before flooding). Seed samples were collected at maturity, dried in a dryer at 37°C for 3 days, and stored in a walk-in cooler at 2oC. Grain amino acid compositions were determined using amino acid analyzers with post-column, ninhydrin derivatization. N-tests were carried out among 30 lines. Four nitrogen fertilization regimes (112, 140, 168, and 196 kg/ha) were used to evaluate the effects of fertilization regimes on total protein contents in a randomized complete block design in a factorial treatment arrangement with four replications. A total of 30 protein lines were included in this test. Fertilizer was applied at the early stage of vegetative growth before permanent flood. 3. Amino acid quantification
Amino acid analyses were conducted on six selected high protein lines (Table 4) using Zhu and Galili’s method.
Briefly, 100 mg of seeds were ground to a powder in liquid nitrogen followed by hydrolysis in 6 M HCl for 22 h at 115oC. Amino acid analyses were performed by reversed-phase HPLC on a C-18 column (Waters, Milford, MA) using pre-column phenylisothiocyanate derivatization. Some samples were sent to a commercial laboratory for confirmation. The Beckman 6300 Amino Acid Analyzer with post-column, ninhydrin derivatization was used to analyze the 16 amino acids plus hydroxyproline and hydroxylysine, cyst(e)ine as cysteic acid, and tryptophan.

74
Table 1. Average protein content of 56 high protein lines.
No .
Plant ID
Total protein
content No.
Plant ID
Total protein content
No.
Plant ID
Total protein content
1 33493 13.74 21 298436 11.23 41 296627 10.74
2 296195 13.65 22 936454 11.23 42 32615 10.68
3 24505 13.54 23 32154 11.21 43 31249 10.60
4 31495 13.17 24 29835 11.15 44 296433 10.54
5 298437 13.11 25 296594 11.11 45 936192 10.51
6 296504 12.87 26 33408 10.97 46 264499 10.51
7 26503 12.50 27 02629 10.97 47 937188 10.46
8 32494 12.47 28 32572 10.93 48 016547 10.43
9 32566 12.25 29 31406 10.93 49 937590 10.39
10 33247 12.19 30 023506 10.93 50 020023 10.38
11 298253 12.18 31 32480 10.92 51 022541 10.36
12 296432 12.14 32 935593 10.92 52 020142 10.35
13 935456 12.03 33 296141 10.90 53 29834 10.35
14 937461 11.93 34 020509 10.85 54 Francis 8.67
15 296453 11.82 35 298502 10.80 55 Wells 8.76
16 298126 11.60 36 296597 10.79 56 Cypress 7.95
17 32170 11.55 37 021262 10.78
18 02932 11.44 38 32407 10.77
19 296201 11.43 39 298147 10.75
20 3033 11.24 40 296234 10.75

75
Table 2. Field performance of 56 high protein lines.
Plant ID
Grain type and maternal
line
Plant height (cm)
Heading date
Panicle weight
(g)
Panicle Length
(cm)
Row yield
(g)
1 33493 L, WLLS 101 81 4.06 19.5 277.5
2 296195 L, CPRS 97 80 3.77 18.9 306.3
3 24505 L, CPRS 92 81 3.94 19.0 303.2
4 31495 L. WLLS 101 81 6.10 19.6 374.9
5 298437 L, WLLS 101 82 4.40 17.0 396.3
6 296504 L, CPRS 96 82 4.57 22.3 368.7
7 26503 L, CPRS 98 84 4.68 20.3 370.9
8 32494 L, WLLS 101 80 3.67 18.2 478.4
9 32566 L, WLLS 97 80 3.95 22.7 455.6
10 33247 L, WLLS 100 80 3.90 19.2 468.4
11 298253 L, WLLS 98 80 4.03 18.9.2 448.6
12 296432 L, CPRS 97 84 5.27 19.9.3 388.7
13 935456 L, FRNS 96 79 4.46 22.3 440.4
14 937461 L, FRNS 96 80 4.62 21.8 460.3
15 296453 L, CPRS 98 84 4.48 20.3 360.9
16 298126 L, WLLS 97 80 3.95 24.7 465.6
17 32170 L, WLLS 99 80 4.60 19.5 413.5
18 32029 L, WLLS 98 81 4.41 20.1 414.6
19 296201 L, CPRS 95 83 4.09 18.6 385.7
20 3033 L, WLLS 99 81 3.80 17.6 417.1
21 298436 L, WLLS 100 80 4.00 19.4 413.5
22 936454 L, FRNS 99 79 4.10 23.3 394.1
23 32154 L, WLLS 98 81 4.00 20.0 400.2
24 29835 L, WLLS 97 81 6.18 28.0 443.5
25 296594 L, CPRS 92 83 6.10 20.6 386.8
26 33408 L, WLLS 100 80 3.98 19.4 389.2
27 02629 L, CPRS 94 83 3.68 19.3 376.8
28 32572 L, WLLS 98 81 3.40 22.2 446.7
29 31406 L, WLLS 101 80 3.86 19.8 419.6
30 023506 L, CPRS 95 83 6.83 21.2 400.7
31 32480 L, WLLS 100 80 4.34 20.1 402.4
32 935593 L, FRNS 96 79 4.42 19.9 440.4
33 296141 L, CPRS 94 84 5.96 21.0 356.4
34 020509 L, CPRS 94 84 5.16 20.7 406.7
35 298502 L, WLLS 100 80 4.41 20.4 422.2
36 296597 L, CPRS 93 82 4.29 18.2 404.0
Continued.

76
Table 2. Continued.
Plant ID
Grain type and maternal
line
Plant height (cm)
Heading date
Panicle weight
(g)
Panicle Length
(cm)
Row yield
(g)
37 021262 L, CPRS 90 82 3.60 19.5 400.9
38 32407 L, WLLS 101 80 3.56 19.0 449.3
39 298147 L, WLLS 98 80 3.93 23.4 402.2
40 296234 L, CPRS 90 83 3.68 21.0 405.5
41 023506 L, CPRS 94 83 3.68 19.7 389.8
42 296627 L, CPRS 94 83 4.48 20.1 377.6
43 32615 L, WLLS 98 80 4.23 18.5 446.9
44 31249 L, WLLS 99 79 3.55 18.4 412.4
45 296433 L, CPRS 92 83 6.83 29.0 386.9
46 936192 L, FRNS 99 81 4.02 20.3 439.6
47 264499 L, CPRS 96 79 4.24 19.0 420.4
48 937188 L, FRNS 97 81 3.92 19.3 429.8
49 016547 L, CPRS 90 82 4.32 20.4 336.7
50 937590 L, FRNS 101 79 4.40 19.9 421.2
51 020023 L, CPRS 94 84 3.71 24.0 401.2
52 022541 L, CPRS 95 83 5.32 21.4 346.7
53 020142 L, CPRS 94 83 7.20 16.1 396.4
54 29834 L, CPRS 93 82 4.90 19.3 413.5
55 Francis L, FRNS 101 80 4.50 22.0 423.1
56 Wells L, WLLS 100 79 4.31 20.0 432.2
57 Cypress L, CPRS 93 83 3.58 19.3 381.4
Table 3. Preliminary yield trials of six high protein lines.
Plant ID
Vigor
Days Height (cm)
Yield (lb/A)
Milling Whole
Milling Total
1 Wells 3 78 109 5876 59.9 70.2
2 Cocodrie 3 75 96 5847 56.7 64.7
3 Cypress 6 80 99 5562 65.8 70.8
4 58072967 5 80 99 5429 62.4 69.5
5 58072969 5 81 96 4942 64.3 71.1
6 Cheniere 4 77 94 4656 64.2 71.7
7 580729610 6 79 96 3808 62.4 70.0
8 58072961 6 80 94 3613 63.2 69.8
9 58072963 6 80 91 3492 62.9 70.6
10 58072968 7 79 96 3217 59.8 67.6

77
Table 4. Amino acid composition of eight high protein rice lines.
High protein lines
Amino Acid
33493
296195
24505
31495
298437
32494
935456 936192
Threonine 0.44 0.45 0.41 0.40 0.44 0.46 0.39 0.37
Serine 0.63 0.66 0.60 0.74 0.63 0.66 0.57 0.51
Glutamine 2.36 2.39 2.28 2.44 2.32 2.42 1.96 1.98
Proline 0.58 0.30 0.79 0.90 0.31 0.33 0.53 0.45
Glycine 0.57 0.62 0.57 0.62 0.61 0.60 0.51 0.51
Alanine 0.74 0.77 0.80 0.87 0.76 0.79 0.64 0.63
Valine 0.75 0.75 0.75 0.79 0.72 0.76 0.57 0.65
Isoleucine 0.53 0.52 0.52 0.54 0.48 0.52 0.38 0.42
Leucine 1.09 1.09 1.09 1.16 1.06 1.10 0.86 0.87
Tyrosine 0.32 0.30 0.21 0.31 0.34 0.36 0.24 0.29
Phenylalanine 0.66 0.67 0.71 0.76 0.66 0.68 0.54 0.58
Lysine 0.51 0.46 0.42 0.52 0.46 0.48 0.38 0.39
Histidine 0.31 0.31 0.30 0.30 0.30 0.32 0.27 0.26
Arginine 1.05 1.03 0.91 1.03 0.98 1.10 0.83 0.87
Cystine 0.25 0.25 0.24 0.26 0.24 0.25 0.20 0.23
Methionine 0.33 0.35 0.33 0.35 0.33 0.35 0.28 0.30
Tryptophane 0.20 0.23 0.18 0.20 0.20 0.21 0.15 0.17

78
4. Sequence analysis of dihydropicolinate synthase (DHDPS) gene
Dihydrodipicolinate synthase (DHDPS, E.C. 4.2.1.52) catalyzes the first reaction of (S)-lysine biosynthesis in plants by condensing (S)-aspartate-β-semialdehyde ((S)-ASA) and pyruvate (Figure 1). DHDPS is strongly feedback inhibited by lysine in most plant species. Thus, deregulating the metabolic pathway through modification of the allosteric site of DHDPS plays a crucial role in increasing lysine synthesis. Rice lines that have elevated levels of lysine from this study are being used to examine if deregulating the pathway is associated with sequence changes in the gene coding for DHDP leading to less sensitivity to the lysine build-up. Efforts are underway to sequence the DHDPS gene from several high lysine lines. In other plants, a feedback insensitive version of DHDPS has shown to cause elevated amounts of lysine content. For example, the mutant dhdps-r1 gene from Nicotiana sylvestris demonstrates that the gene encoding a feedback insensitive DHDPS is responsible for the elevated level of lysine. A bacterial DHDPS gene, isolated from E. coli, has been shown to be at least 20-fold less sensitive to increases in lysine levels. The gene coding for DHDPS in rice is composed of 1411 bps. A portion of this proposed project was focused on identifying mutational sites in the gene coding for DHDPS in two high lysine rice lines. A portion of DHDPS genes from two sister lines of Cypress-derived lines (Figures 2 and 3), a Francis-derived line (Figure 4), and a Wells-derived line (Figure 5) was sequenced. 5. Development of mapping population
A mapping population is being developed in cooperation with the marker-assisted selection project. The mapping population will be used to identify QTL regions associated with high grain protein content. To obtain high accuracy in QTL mapping, parental lines that demonstrated a wide range of measurable differences possible for protein content were selected and used in the cross. Two most extreme parental lines that have the highest and the lowest protein content were chosen, i.e. CIor 3773-Pulutan that has 2.8% grain protein content and CY504, 12.5%. With this level of differences, progeny lines in the mapping population from a cross between these two lines are expected to exhibit a wide array of grain protein contents. Such a wide difference might provide an opportunity to reduce phenotyping error and subsequently can increase QTL mapping accuracy. Currently, a mapping population derived from a CIor 3773-Pulutan/CY504 cross that is composed of 398 F3 lines has been obtained through a single seed decent. This mapping population will be further advanced to achieve F7 generation before used in gene mapping analyses.

79
Figure 1. Dihydrodipicolinate synthase (DHDPS) and lysine synthesis pathway [Galili et al. (2006)].
Figure 2. Partial sequence DHDPS gene from 506-PR-1-1-G8 (Cypress-derived line).

80
Figure 3. Partial sequence DHDPS gene from 505-PR-1-1-E8 (Cypress-derived line).

81
Figure 4. Partial sequence DHDPS gene from 502-939-506 (Francis-derived line).

82
Figure 5. Partial sequence DHDPS gene from 504-33-26 (Wells-derived line).

83
RICE AGRONOMY1
D.L. Harrell, J.P. Leonards, R.P. Regan, and D.M. Walker
INRODUCTION
The following two sections of the report document research conducted in rice plant nutrition and cultural management. Rice plant nutrition and cultural management studies were conducted at the LSU AgCenter Rice Research Station and multiple off-station locations in an effort to generate agronomic production information representative of all Louisiana rice production areas. Rice nutrition studies were conducted in Acadia Parish at the Rice Research Station and on cooperator farms located in Vermilion, Richland, and Morehouse parishes. Cultural management studies were conducted at the Rice Research Station and on on-farm locations in Evangeline, Morehouse, Richland, and Vermilion parishes.
We would like to express our sincere appreciation to the following off-station cooperators for their assistance in
conducting this research. Our efforts would not be successful without their support: Lounsberry Farms – Vermilion Parish Christian Richard – Vermilion Parish Roland Crymes and Zaunbrecher Farms – Morehouse Parish Woodlands Plantation – Richland Parish Larry and Kody Bieber – Evangeline Parish
Throughout the following sections, multiple abbreviations are used to represent common units of measure and agricultural chemicals. These abbreviations are explained below in Tables 1 and 2, respectively.
1 This research was supported in part by funds provided by rice producers through the Louisiana Rice Research Board.

84
Table 1. Common abbreviations used in agronomic research at the Rice Research Station. Abbreviation Explanation A Acre Ca Calcium COC Crop oil concentrate Cu Copper cwt Hundredweight DAT Days after treatment DPP Days prior to planting Fe Iron ft Feet ft2 Square feet gal/A Gallons product per acre Head Rice Percent unbroken kernels left after milling in Inches lb Pounds lb/A Pounds product per acre LB A/A Pounds active ingredient per acre Ldg-Rate Lodging rate in percent Ldg-Type Lodging type on a scale from 0 to 5 where 0 = no lodging, 1 = slightly lodged (approximately 1 - 23o angle) and 5 = lodged to ground (90o angle) K Potassium Main First rice crop; crop growth stage prior to first harvest Mg Magnesium N Nitrogen Na Sodium NA Information not avaliable/applicable oz/A Ounces product per acre P Phosphorus PD Panicle differentiation PI Panicle initiation pl/m2 Plant densities measures 14 days after seeding emergence by counting the main-stem numbers in a randomly selected area of 1 m2 in each plot Postharvest Application applied immediately following main crop harvest ppm parts per million PRE Application prior to crop emergence PF Preflood application applied 1 to 2 days prior to permanent flood establishment Preplant Preplanting application prior to flooding and seeding pt/A Pints product per acre Ratoon Second rice crop growth after harvest of first (main) crop RRS Rice Research Station, Crowley, LA S Sulfur SB Severity Sheath blight investation on a scale from 1 to 9; Where 1 = no sheath blight and 9 = severe sheath blight infestation Total Mill Percent of rice kernels left after milling Zn Zinc 5% Heading Crop growth stage where 5% of plants within a plot have visiable panicles 50% Heading Number of days from effective seeding date to 50% panicle exertion

85
Table 2. Common crop protection chemicals and formulations used in agronomic research at the Rice Research Station. Trade Name Common Name Formulation Company Herbicides Aim Carfentrazone-ethyl 21.3% FMC Corp. Arrosolo Propanil + molinate 3 lb + 3 lb RiceCo Basagran Bentazon 4 lb BASF Clincher Cyhalofop 2.38 lb Dow Agro Science LLC Command Clomazone 3ME FMC Corp. Duet Propanil + bensulfuron 4 lb + 0.48 oz RiceCo Facet 3,7-dichloro-8-
quinolinecarboxylic acid 75% BASF
Grandstand R Triclopyr 3 lb Dow AgroSciences Grasp Penozsulam 2 lb Dow AgroSciences Honcho Glyphosate 5 lb Monsanto Liberty Glufosinate ammonium 18.19% Bayer CropScience Londax Bensulfuron 60% DF DuPont Newpath Imazethapyr 2 lb BASF Permit Halosulfuron 75% WSG Monsanto Regiment Bispyribac-sodium 80% DF Valent USA Roundup Weatherman Glyphosate 4 lb Monsanto Stam M4 Propanil 4 lb Dow Agro Science LLC Stelth Pendimethalin 3.3 lb Loveland Products Weedar 64 2,4-D 3.8 lb Aventis Insecticides Icon Fipronil 6.2 FS Aventis Karate Z Cyhalothrin 2.08 lb Syngenta Mustang Max Zeta-cypermethrin 0.8 FMC Corp. Steward Indoxacarb 1.25 lb DuPont Trebon 3G Etofenprox Mitsui Chemicals America Fungicides Dithane DF Mancozeb 75% DF Dow Agro Science LLC Quadris Azoxystrobin 2.08 lb Syngenta Quilt Azoxystrobin +
Propiconazole 1.04 + 0.62 lb, respectively
Syngenta
Stratego Propiconazole + Trifloxystrobin
1.04 + 1.04 lb Bayer CropScience
Uppercut Tebuconazole 38.7% DuPont

86
RICE NUTRITION RESEARCH
D.L. Harrell, J.P. Leonards, R.P. Regan, and D.M. Walker Variety/Hybrid by Nitrogen Rate and Application Timing Experiments
Variety and hybrid by nitrogen (N) experiments are conducted yearly throughout Louisiana to establish N requirements for new commercial varieties, advanced experimental lines, and hybrids. Rice varieties and hybrids vary in their response to N rate and timing of application. These varietal N response differences can be attributed to several factors, including such traits as lodging, disease susceptibility, and N uptake efficiency. Environmental influences also impact the N rate needed to produce optimum yields. These include such factors as soil type, weather, disease, and insect pressure. For this reason, trials are conducted not only at the Rice Research Station in Crowley but also at cooperator sites in Vermilion and Richland parishes. Rates of N range from 0 to 210 lb/A utilizing both the single preflood and split applications. The N requirement, days to 50% heading, lodging susceptibility, and plant height are all determined. Ratoon data is also determined for trials in southwest Louisiana. A minimum of three years for each variety are needed before final recommendations are established. These recommendations can be found in Rice Varieties and Management Tips 2008, LAES publication number 2270. Electronic copies of this publication can be accessed from the LSU AgCenter Web site: (http://www.lsuagcenter.com).
Three rice varieties (CL171, Spring, and Trenasse), two advanced experimental lines (LA2082 and LA2028),
and four commercial hybrids (XP744, CLXL729, CLXL730, and CLXL745) were evaluated in both conventional and no-till drill-seeded systems. Yields at the Rice Research Station were greater than those at both Vermilion Parish and Richland Parish sites. The four commercial hybrids generally outyielded all non-hybrid cultivars. All Clearfield hybrid by N trials at all locations received NewPath herbicide prior to permanent flood establishment.
At the Rice Research Station, all variety by N trials were drill seeded into a conventionally tilled seedbed.
Optimum N rates for CL171, Spring, Trenasse, LA2082, CLXL730, and XP744 were 150 lb/A. Hybrids CLXL745 and CLXL729 were optimized at a rate of 120 lb/A. LA2028, the only medium grain tested in the trials, was optimized at the 180 lb N/A rate.
At the Vermilion Parish site, all variety by N trials were drill seeded into a conventionally tilled seedbed. The
site had strong disease pressure throughout the season. This pressure may have contributed to the modest grain yield response from the various N fertilization rates of all cultivar and hybrid by N trials at the location. Determination of an optimum N rate from these trials may be unreliable. Nonetheless, the highest yielding N rate for CL171, Spring, Trenasse, and LA2082 was 90 lb/A. Grain yield for LA2028 was maximized at 120 lb/A.
At the Richland Parish site, all variety by N trials were no-till drill seeded into soybean stubble. When the rice
was at or near the 2- to 3-leaf stage, the field was slightly damaged by glyphosate drift. The Spring trial was affected the most by the drift resulting in a high CV for the trial. The optimum N rate for Trenasse, LA2028, XP744, CLXL729, and CLXL730 was 90 lb/A. LA2082 and CLXL745 were both optimized at 150 lb/A. Nitrogen Source and/or Application Timing Experiments
A study was conducted to evaluate the effectiveness of a slow release granular N fertilizer and urea coated with a urease inhibitor for use in rice production. The slow-release granular fertilizer is marked as Nitamin® 43G and is modified urea coated with a formaldehyde resin. The urease inhibitor is marked as Agrotain®, and is sold as a liquid to be applied onto urea. The active ingredient in Agrotain® is NBPT. Three N sources (Agrotain-treated urea, 43G, and urea) and two application timings [7 days preflood (7DPF) and 1 day preflood (1DPF)] were used in the study. At the 1DPF timing, the rice fertilized with urea had significantly higher grain yields as compared with those fertilized with both Agrotain® and Nitamin 43G®
. The plots fertilized with the Agrotain®-treated urea significantly outyielded both the urea and Nitamin 43G® fertilized plots at the 7 DPF application timing.

87
A study was conducted to evaluate liquid N sources as a potential midseason N source. Two liquid N sources were used in the study, a 30 and 25% N solution. Urea fertilizer was used as the control for the experiment. Initial preflood N was applied at 105 lb/A. Midseason N applications were made at an equivalent rate of 45 lb/A. Rice fertilized with urea significantly out yielded the 25 and 30% N solutions by 819 and 533 lb/A, respectively.
Other Fertility Experiments Two phosphorus (P) fertilizer rate trials were conducted to help in the calibration of the Mehlich3 soil test extraction. One trial was located at the Rice Research Station near Crowley, LA, and the other was located in Morehouse Parish near Jones, LA. The soil at the Jones location is classified as a Perry clay while the soil at the Station is classified as a Crowley silt loam. Triple superphosphate was used as the P fertilizer source and was broadcast on the surface at planting. Rates of P were applied in 20-lb increments, ranging from 0 to 100 lb P2O5/A. Cocodrie was drill seeded to a conventionally tilled seedbed at both locations. Initial soil test P was 30 and 21 ppm at the Rice Research Station and the Jones location, respectively. A significant grain yield response was not observed at either location confirming that the Mehlich3 critical soil test level is below 21 ppm. Future test locations need to be located with lower soil test P levels to continue this research. Three zinc (Zn) fertilization trials were conducted in 2007. The objective of the trials was to help in the calibration of the Melich-3 soil test for Zn. Locations included the Rice Research Station, Morehouse Parish, and Vermilion Parish site near Abbeville, LA. The soils for the Rice Research Station and the Morehouse Parish site are as described above. The soil at the Vermilion Parish site is classified as a Kaplan silt loam series. Initial soil test Zn levels were 6.8, 4, and 0.5 ppm at the Rice Station, Morehouse Parish, and Vermilion Parish sites, respectively. Zn was applied in furrow at planting as Zn sulfate at the Rice Station and Jones Parish sites. Rates of Zn ranged from 0 to 20 lb Zn/A in 5-lb increments. Elemental sulfur (S) was also applied to balance the S contained in the Zn sulfate fertilizer. Zinc sulfate fertilizer was surface broadcast at the Vermilion Parish site prior to permanent flood establishment. A Zn response was not observed at any of the locations in 2007. This was easily explained at the Rice Station and Morehouse Parish sites because initial soil test Zn levels were above the current soil test Zn critical level of 1 ppm. However, a Zn response was expected at the Vermilion Parish site. The lack of response at the Vermilion Parish site may be explained by the P fertilizer source used by the cooperator, which was found to be treated with Zn. Fertilizer Zn levels from the P fertilizer were calculated to be approximately 5 lb Zn/A using this application rate. This study will be repeated in 2008 using untreated P fertilizer. A Zn fertilizer response is expected. A trial was conducted to evaluate the effectiveness of the humic acid product HydraHume in rice production. The trial was located at the Morehouse Parish site near Jones, LA. The study had three rates of HydraHume (0, 10, and 40 lb/A) and two rates of 0-24-24 fertilizer (0 and 250 lb/A). A yield response was not observed for any of the treatments. Two trials were conducted to evaluate the effectiveness of granular and liquid starter fertilizers in a Clearfield system. The first trial evaluated a conventional long-grain variety, CL171, and the second trial evaluated the hybrid CLXL730. Treatments included two granular fertilizer sources, ammonium sulfate (AS) and diammonium phosphate (DAP), and two liquid fertilizer sources, ammonium thiosulfate (ATS) and ammonium polyphosphate (APP), and one untreated control (UTC). Two N rates were used, 10 and 20 lb/A. Both liquid N sources were tank- mixed with NewPath herbicide at 9 oz/A. A statistical plant height difference was observed at the 2- to 3-leaf stage for CL171 when AS was applied at the 20 lb/A N rate over the UTC. DAP applied at both N rates was statistically taller at the 2- to 3-leaf stage compared with the UTC in the CL171 trial. A yield response was not observed for any starter fertilizer in both the CL171 and CLXL730 trials. Ratoon Rice Fertility Experiments Two trials evaluated the ratoon response to main crop stubble manipulation. Stubble manipulation treatments included cutting at standard harvest height, flail mowing, rolling, and harvesting at 12 in. The first trial evaluated the hybrids CLXL729 and XP723. In this trial, days to 50% heading was delayed when flail mowing or rolling as

88
compared with standard cutting height for both hybrids. A ratoon yield response was not observed for either hybrid. The second trial evaluated the varieties Cocodrie and Trenasse. In this trial, days to 50% heading was delayed when flail mowing and rolling as compared with standard cutting heights. A statistical yield advantage was seen for the standard cutting height as compared with rolling for the Trenasse variety. No other significant yield differences were observed. A trial was conducted to evaluate the response of Cocodrie and Trenasse ratoon yields to various N sources and rates. N sources included urea, AS, and a 1:1 N based blend of urea and AS. Rates of N were 45, 90, and 135 lb/A. Both Cocodrie and Trenasse grain yields were optimized at an N rate of 90 lb/A when urea or the AS/urea blend was used. Ratoon grain yields were optimized at an N rate of 135 lb/A when AS was used as the N source. Two rice hybrids, XP723 and CLXL729, were evaluated for their ratoon yield response to four postharvest N rates. Rates were 60, 90, 120, and 150 lb N/A applied as urea immediately after harvest. Ratoon grain yields for XL723 were significantly increased by approximately 590 lb/A between the 60 and 90 lb N/A rates. Higher N rates above 90 lb N/A did not increase ratoon rice yields. Ratoon grain yields for CLXL729 were optimized at 60 lb N/A.
Cocodrie and Trenasse ratoon rice yields were evaluated for their response to various N application rates applied immediately after main crop harvest. Nitrogen rates of 60, 90, 120, and 150 lb/A, applied as urea, were used in the study. The optimum ratoon N rate for both varieties was 60 lb N/A.
Nitrogen application timing for ratoon rice production was evaluated for two rice varieties, Cocodrie and Trenasse. Nitrogen was applied at 90 lb/A at one of six different application timings: 1) main crop heading, 2) 7 days prior to draining, 3) main crop harvest, 4) a 60/30 split between heading and harvest, 5) a 60/30 split between 7 days prior to draining and harvest, or 6) 60/30 split between harvest and 21 days after harvest. Nitrogen applied at main crop harvest provided the highest grain yield for Trenasse, while N applied with a 60/30 split between harvest and 21 days after harvest provided the highest grain yield for Cocodrie. A trial was conducted to evaluate the ratoon yield response to P and K applications after main crop harvest. A factorial arrangement of three K rates (0, 30, and 60 lb/A) and three P rates (0, 30, and 60 lb/A) were used in the experiment. A significant ratoon yield increase was not seen for any of the treatment combinations. Zn fertilization after main crop harvest was evaluated for its responsiveness to ratoon rice yields. Rates of Zn were 0, 5, 10, 15, and 20 lb/A applied as Zn sulfate. Sulfur (S) was applied as elemental S to balance the units of S received by each plot. This was done in an effort to ensure that if a yield response was observed, that it was due to Zn and not S. Nonetheless, a Zn ratoon yield response was not observed in 2007.

89
Rice Variety by Nitrogen Experiments at the Rice Research Station Experiment number .......................... : 07-CM-08 – 07-CM-12 Site and design ................................... : Location/Cooperator .................. : Rice Research Station (Crowley Main) Tillage type .................................. : Conventional Experimental design ................... : Randomized complete block Number of reps ........................... : 4 Plot size ........................................ : 7 x 20 ft Row width/rows per plot ............ : 7 in / 12 Soil type .............................................. : Crowley silt loam % organic matter ........................ : NA pH................................................. : 6.9 Extractable nutrients .................. : Ca-1,171; Cu-1.6; Mg-210; P-13.5; K-71.9; Na-65.2; S-6.3; Zn-6.6 Crop/Variety ...................................... : Rice / CL171AR Planting method/date ................. : Drill seeded / March 20 Seeding rate/depth ...................... : 40 seeds/ft2 / 1 in Emergence date ........................... : March 28 Harvest date ................................ : August 7; Ratoon harvest, October 24 Seed treatment/cwt ............................ : Dithane (fungicide)-114 g Release (gibberellic acid)-10 g Zinche (40.5% Zn)-236 ml Fertilization ........................................ : 195 lb/A 0-24-24-2.5, March 20 1 qt/A Zinc Plus, May 1 90 lb N/A 46-0-0, August 7 Water management ........................... : Flush ............................................ : March 28, April 20 Flood ............................................ : May 3; Ratoon flood, August 8 Drain ............................................ : July 17; Ratoon drain, October 4 Pest management ............................... : Herbicides.................................... : 15 oz/A Clincher, April 23 1 gal/A Arrosolo + .75 oz/A Londax + .5 oz/A Permit, May 1 1 oz/A Londax, May 17 3 pt/A Basagran + 1 pt/A Crop oil + 4 oz/A Interlock, August 7 Insecticides .................................. : 4 oz/A Karate, May10 4 oz/A Mustang Max, July 2 Fungicides ................................... : 21 oz/A Quilt + 6 oz/A Quadris, June 16

90
Table 3. CL171AR Nitrogen Rate Validation 1.1 (Rice Research Station).
Trt Rate Growth ApplNo. Rate Unit Stage Description
1 0 LB A/A 4-5 leaf Preflood 97 b 25 g 1850 e 30 g 1983 a 1990 a2 30 LB A/A 4-5 leaf Preflood 97 b 31 f 3708 d 37 f 2162 a 2175 a3 60 LB A/A 4-5 leaf Preflood 97 b 34 e 5632 c 39 ef 2275 a 2294 a4 90 LB A/A 4-5 leaf Preflood 97 b 36 cde 6927 b 42 cd 2539 a 2563 a5 120 LB A/A 4-5 leaf Preflood 98 b 37 bcd 7716 b 45 bc 1921 a 1948 a6 150 LB A/A 4-5 leaf Preflood 100 a 39 ab 8820 a 46 ab 2427 a 2458 a7 180 LB A/A 4-5 leaf Preflood 101 a 41 a 8703 a 49 a 2347 a 2377 a8 210 LB A/A 4-5 leaf Preflood 102 a 40 a 9243 a 49 a 2282 a 2314 a9 45 LB A/A 4-5 leaf Preflood 97 b 35 de 5768 c 39 def 2090 a 2109 a
45 LB A/A PD Midseason10 75 LB A/A 4-5 leaf Preflood 97 b 37 bcd 7245 b 41 de 2584 a 2609 a
45 LB A/A PD Midseason11 105 LB A/A 4-5 leaf Preflood 98 b 38 abc 8551 a 42 cd 2294 a 2323 a
45 LB A/A PD Midseason12 135 LB A/A 4-5 leaf Preflood 100 a 39 ab 8997 a 46 ab 2206 a 2237 a
45 LB A/A PD Midseason
Means followed by same letter do not significantly differ (P=.05, Student-Newman-Keuls)Mean comparisons performed only when AOV Treatment P(F) is significant at mean comparison OSL.
Rice RiceRating Date 8/6/2007 8/7/2007
Rice RiceCrop Name
50% HeadRating Data Type 50% Head Height
Rice Rice10/24/2007
days lb/A lb/AYield Yield
10/24/2007
Rating Unit days in lb/AYield
1.8
Ratoon TotalMain RatoonCrop Stage Main Main
509.7 510Standard Deviation 1 1.1 478.1
690.4 2.3LSD (P=.05) 1.6
CV 0.98 2.961.3 353 353.2
13.033 4.287
15.62 15.476.9 3.16
0.3341.181 1.175
Replicate Prob(F) 0.0002 0.0268 0.15481.865 13.563Replicate F
50.67Treatment F 11.37 48.4520.0001 0.3319
0.0001 0.2561 0.2341.322 1.367
Treatment Prob(F) 0.0001 0.0001 0.000193.703

91
Table 4. Spring Nitrogen Rate Validation 3.1 (Rice Research Station).
Trt Rate Growth ApplNo.Rate Unit Stage Description
1 0 LB A/A 4-5 leaf Preflood 93 a 25 f 1401 f 28 b 1114 b 2350 e2 30 LB A/A 4-5 leaf Preflood 92 a 31 e 2612 e 28 b 1604 ab 4216 d3 60 LB A/A 4-5 leaf Preflood 92 a 33 e 4627 d 34 a 1851 ab 6478 c4 90 LB A/A 4-5 leaf Preflood 93 a 37 cd 6136 c 37 a 1895 ab 8031 b5 120 LB A/A 4-5 leaf Preflood 93 a 40 ab 7093 b 37 a 2154 a 9247 ab6 150 LB A/A 4-5 leaf Preflood 93 a 39 abc 7845 ab 37 a 2313 a 10158 a7 180 LB A/A 4-5 leaf Preflood 94 a 41 a 7549 ab 37 a 1491 ab 9041 ab8 210 LB A/A 4-5 leaf Preflood 94 a 41 a 8281 a 37 a 2166 a 10447 a9 45 LB A/A 4-5 leaf Preflood 92 a 35 d 4838 d 37 a 1936 ab 6774 c
45 LB A/A PD Midseason10 75 LB A/A 4-5 leaf Preflood 92 a 37 bcd 6309 c 37 a 2116 a 8425 b
45 LB A/A PD Midseason11 105 LB A/A 4-5 leaf Preflood 93 a 39 abc 7268 b 37 a 2008 a 9275 ab
45 LB A/A PD Midseason12 135 LB A/A 4-5 leaf Preflood 93 a 40 a 7523 ab 37 a 1923 ab 9446 ab
45 LB A/A PD Midseason
Means followed by same letter do not significantly differ (P=.05, Student-Newman-Keuls)Mean comparisons performed only when AOV Treatment P(F) is significant at mean comparison OSL.
Rice RiceRating Date 8/6/2007 8/7/2007
Rice RiceCrop Name
50% HeadRating Data Type 50% Head Height
Rice Rice10/24/2007
days lb/A lb/AYield Yield
10/24/2007
Rating Unit days in lb/AYield
2
Ratoon TotalMain RatoonCrop Stage Main Main
537.8 967.3Standard Deviation 0.8 1.2 466.5
673.6 2.6LSD (P=.05) 1.3
CV 0.86 3.231.5 372.5 669.9
2.147 0.06
19.8 8.567.83 4.31
0.32940.51 1.189
Replicate Prob(F) 0.1406 0.9418 0.31421.23 0.881Replicate F
15.789Treatment F 2.817 47.4970.4283 0.6781
0.0001 0.0046 0.00013.239 54.171
Treatment Prob(F) 0.0186 0.0001 0.000187.023

92
Table 5. Trenasse Nitrogen Rate Validation 4.1 (Rice Research Station).
Trt Rate Growth ApplNo. Rate Unit Stage Description
1 0 LB A/A 4-5 leaf Preflood 93 c 27 e 1994 f 20 d 1333 e 3328 g2 30 LB A/A 4-5 leaf Preflood 93 c 30 d 3262 e 20 d 1756 d 5018 f3 60 LB A/A 4-5 leaf Preflood 94 bc 33 c 5406 d 29 c 2028 cd 7434 e4 90 LB A/A 4-5 leaf Preflood 95 abc 35 bc 7396 c 34 ab 2158 bcd 9554 d5 120 LB A/A 4-5 leaf Preflood 96 ab 37 ab 8141 bc 35 ab 2272 bc 10412 cd6 150 LB A/A 4-5 leaf Preflood 96 ab 37 ab 9259 a 36 a 2660 ab 11919 ab7 180 LB A/A 4-5 leaf Preflood 96 abc 38 a 9624 a 35 ab 2337 bc 11962 ab8 210 LB A/A 4-5 leaf Preflood 97 a 39 a 9981 a 35 ab 2824 a 12806 a9 45 LB A/A 4-5 leaf Preflood 94 c 33 c 5780 d 31 bc 2087 cd 7867 e
45 LB A/A PD Midseason10 75 LB A/A 4-5 leaf Preflood 94 bc 35 bc 7503 c 33 ab 2236 bcd 9739 d
45 LB A/A PD Midseason11 105 LB A/A 4-5 leaf Preflood 95 abc 36 ab 8835 ab 35 ab 2362 bc 11196 bc
45 LB A/A PD Midseason12 135 LB A/A 4-5 leaf Preflood 96 abc 36 ab 9720 a 35 ab 2516 abc 12236 ab
45 LB A/A PD Midseason
Means followed by same letter do not significantly differ (P=.05, Student-Newman-Keuls)Mean comparisons performed only when AOV Treatment P(F) is significant at mean comparison OSL.
10/24/2007 10/24/2007Crop Name Rice Rice Rice Rice Rice
Height Yield 50% Head Yield
RiceRating Date 8/6/2007 8/7/2007
YieldRating Unit days in lb/A days lb/A lb/ARating Data Type 50% Head
Ratoon TotalSample Size Unit
1.9 840.5 2.7 343.3
Crop Stage Main Main Main Ratoon
997.7Standard Deviation 0.8 1.1 582.1 1.6 237.8 691LSD (P=.05) 1.4
17.243 15.793
CV 0.89 3.3 8.04 4.95 10.74
0.0608 0.0001 0.007 0.0001
7.31
Replicate F 19.534 3.188 9.598 6.2650.0001
Treatment F 6.477 28.875 81.245 40.918 11.207 75.54Replicate Prob(F) 0.0001
0.0001Treatment Prob(F) 0.0001 0.0001 0.0001 0.0001 0.0001

93
Table 6. Advanced Experimental Line LA2082 Nitrogen Rate Validation 2 (Rice Research Station).
Trt Rate Growth ApplNo.Rate Unit Stage Description
1 0 LB A/A 4-5 leaf Preflood 95 d 27 f 1850 f 24 c 1669 c 3571 f2 30 LB A/A 4-5 leaf Preflood 96 cd 29 ef 3089 e 30 b 2117 b 5206 e3 60 LB A/A 4-5 leaf Preflood 96 cd 31 de 5011 d 36 a 2181 ab 7192 d4 90 LB A/A 4-5 leaf Preflood 97 bcd 34 cd 6339 c 37 a 2445 ab 8784 c5 120 LB A/A 4-5 leaf Preflood 98 bc 36 abc 7460 b 37 a 2437 ab 9898 b6 150 LB A/A 4-5 leaf Preflood 99 b 39 ab 8170 ab 37 a 2521 ab 10691 ab7 180 LB A/A 4-5 leaf Preflood 101 a 39 a 8325 ab 37 a 2626 a 10951 ab8 210 LB A/A 4-5 leaf Preflood 102 a 39 a 8867 a 37 a 2556 ab 11423 a9 45 LB A/A 4-5 leaf Preflood 96 cd 33 cd 5360 d 35 a 2231 ab 7589 d
45 LB A/A PD Midseason10 75 LB A/A 4-5 leaf Preflood 97 bcd 35 bcd 6502 c 37 a 2417 ab 8919 c
45 LB A/A PD Midseason11 105 LB A/A 4-5 leaf Preflood 97 bcd 35 bcd 7534 b 37 a 2519 ab 10053 b
45 LB A/A PD Midseason12 135 LB A/A 4-5 leaf Preflood 99 b 36 abc 8327 ab 37 a 2431 ab 10758 ab
45 LB A/A PD Midseason
Means followed by same letter do not significantly differ (P=.05, Student-Newman-Keuls)Mean comparisons performed only when AOV Treatment P(F) is significant at mean comparison OSL.
75.465Treatment Prob(F) 0.0001 0.0001 0.0001 0.0001 0.0001 0.0001Treatment F 14.912 14.802 87.169 36.39 6.491
5.349Replicate Prob(F) 0.0199 0.407 0.0015 0.1119 0.3874 0.0044Replicate F 4.705 0.937 6.513 2.424 1.043
563.9CV 0.97 4.91 7.39 3.3 8.83 6.44Standard Deviation 0.9 1.7 473.5 1.2 207.1
Total
LSD (P=.05) 1.6 2.9 683.7 2 299 814.2
Crop Stage Main Main Main Ratoon Ratoon
YieldRating Unit days in lb/A days lb/A lb/ARating Data Type 50% Head Height Yield 50% Head Yield
RiceRating Date 8/6/2007 8/7/2007 10/24/2007 10/24/2007Crop Name Rice Rice Rice Rice Rice

94
Table 7. Advanced Experimental Line LA2028 Nitrogen Rate Validation 2.1 (Rice Research Station).
Trt Rate Growth ApplNo.Rate Unit Stage Description
1 90 LB A/A 4-5 leaf Preflood 101 a 33 b 6611 c 40 a 2494 a 9105 c2 120 LB A/A 4-5 leaf Preflood 101 a 34 b 7858 b 41 a 2618 a 10476 b3 150 LB A/A 4-5 leaf Preflood 101 a 34 b 8211 b 41 a 2688 a 10899 ab4 180 LB A/A 4-5 leaf Preflood 101 a 37 a 9257 a 44 a 2766 a 12023 a
Means followed by same letter do not significantly differ (P=.05, Student-Newman-Keuls)Mean comparisons performed only when AOV Treatment P(F) is significant at mean comparison OSL.
10/24/2007 10/24/2007Crop Name Rice Rice Rice Rice Rice
Height Yield 50% Head Yield
RiceRating Date 8/7/2007 8/7/2007
YieldRating Unit Days IN lb/A Days lb/A lb/ARating Data Type 50% Head
493.6 1156.8
Crop Stage Main Main Main Ratoon Ratoon
0.6 562.2 1.5 308.6
Total
LSD (P=.05) 0.6 1.1 899.2 3723.2
CV 0.29 1.61 7.04 3.67 11.68 6.81Standard Deviation 0.3
0.3783 0.1531Replicate F 1 13.364 2.888 0.036 1.157
25 15.074 3.602 0.559
2.238Replicate Prob(F) 0.4219 0.0062 0.0948 0.9647
11.116Treatment Prob(F) 0.4547 0.0009 0.0007 0.0851 0.6555 0.0022Treatment F 1

95
Rice Variety by Nitrogen Experiments at Vermilion Parish Experiment number .......................... : 07-VP-03 – 07-VP-07 Site and design ................................... : Location/Cooperator .................. : Vermilion Parish / Lounsberry Farm Tillage type .................................. : Conventional Experimental design ................... : Randomized complete block Number of reps ........................... : 4 Plot size ........................................ : 7 x 20 ft Row width/rows per plot ............ : 7 in / 12 Soil type .............................................. : Kaplan silt loam % organic matter ........................ : NA pH................................................. : 4.9 Extractable nutrients .................. : Ca-678; Cu-0.7; Mg-103; P-22.4; K-95.2; Na-33.7; S-7.4; Zn-2.2 Crop/Variety ...................................... : Rice / CL171AR Planting method/date ................. : Drill seeded / March 21 Seeding rate/depth ...................... : 40 seeds/ft2 / .75 in Emergence date ........................... : March 27 Harvest date ................................ : August 2 Seed treatment/cwt ............................ : Dithane (fungicide)-114 g Release (gibberellic acid)-10 g Zinche (40.5% Zn)-236 ml Fertilization ........................................ : 195 lb/A 0-24-24-2.5, March 21 Water management ........................... : Flush ............................................ : By rain Flood ............................................ : April 21 Drain ............................................ : July 13 Pest management ............................... : Herbicides.................................... : 3 qt Arrosolo, April 6 3 qt Arrosolo + 2.8 oz Grasp + 1 oz Permit, April 19 Insecticides .................................. : None Fungicides ................................... : 21 oz/A Quilt + 6 oz/A Quadris, June 18

96
Table 8. CL171AR Nitrogen Rate Validation 1.2 (Vermilion Parish).
Trt Treatment RateNo. Name Rate Unit
1 UREA 0 LB A/A 90 c 38 b 5432 ab 2 UREA 30 LB A/A 91 bc 38 b 5443 ab 3 UREA 60 LB A/A 92 abc 39 ab 5398 ab 4 UREA 90 LB A/A 92 abc 40 ab 5715 ab 5 UREA 120 LB A/A 93 ab 41 ab 5653 ab 6 UREA 150 LB A/A 94 a 40 ab 5193 ab 7 UREA 180 LB A/A 95 a 41 ab 5065 b 8 UREA 210 LB A/A 95 a 41 ab 5254 ab 9 UREA 45 LB A/A 92 abc 40 ab 6169 a
UREA 45 LB A/A10 UREA 75 LB A/A 93 abc 39 ab 5636 ab
UREA 45 LB A/A11 UREA 105 LB A/A 94 a 40 ab 5693 ab
UREA 45 LB A/A12 UREA 135 LB A/A 94 a 41 a 5481 ab
UREA 45 LB A/A
Means followed by same letter do not significantly differ (P=.05, Student-Newman-Keuls) Mean comparisons performed only when AOV Treatment P(F) is significant at mean comparison OSL.
Crop Name Rice Rice Rice Rating Date 7/31/2007 8/2/2007 Rating Data Type 50% Head Height YieldRating Unit Days IN lb/ACrop Stage Main Main Main
LSD (P=.05) 1.8 1.9 581Standard Deviation 1.1 1.1 402.4
2.932 2.098
CV 1.14 2.84 7.3
Replicate F 7.604 1.072 5.61
Treatment Prob(F) 0.0001 0.0153 0.0495
Replicate Prob(F) 0.0031 0.3597 0.0032 Treatment F 6.523

97
Table 9. Spring Nitrogen Rate Validation 3.2 (Vermilion Parish).
Trt Treatment RateNo. Name Rate Unit
1 UREA 0 LB A/A 82 a 37 a 4972 b2 UREA 30 LB A/A 81 a 39 a 6107 a3 UREA 60 LB A/A 82 a 40 a 6404 a4 UREA 90 LB A/A 82 a 39 a 7018 a5 UREA 120 LB A/A 82 a 39 a 80 2 6899 a6 UREA 150 LB A/A 82 a 40 a 60 4 6671 a7 UREA 180 LB A/A 82 a 40 a 10 3 6712 a8 UREA 210 LB A/A 83 a 41 a 6623 a9 UREA 45 LB A/A 82 a 40 a 6190 a
UREA 45 LB A/A10 UREA 75 LB A/A 83 a 39 a 6693 a
UREA 45 LB A/A11 UREA 105 LB A/A 83 a 40 a 6579 a
UREA 45 LB A/A12 UREA 135 LB A/A 82 a 40 a 7020 a
UREA 45 LB A/A
Means followed by same letter do not significantly differ (P=.05, Student-Newman-Keuls)Mean comparisons performed only when AOV Treatment P(F) is significant at mean comparison OSL
Crop Name Rice Rice Rice Rice RiceRating Date 7/31/2007 8/2/2007 8/2/2007 8/2/2007Rating Data Type 50% Head Height Ldg-Rate Ldg-Type YieldRating Unit days in % 1-5 lb/ACrop Stage Main Main Main Main Main
LSD (P=.05) 1.1 2 . . 733.2Standard Deviation 0.7 1.2 . . 507.8CV 0.79 3.05 . . 7.82
Replicate F 49.5 1.167 1.88Replicate Prob(F) 0.0001 0.3299 0.1522Treatment F 2.071 2.226 4.831Treatment Prob(F) 0.0703 0.053 0.0002

98
Table 10. Trenasse Nitrogen Rate Validation 4.2 (Vermilion Parish).
Trt Treatment RateNo. Name Rate Unit
1 UREA 0 LB A/A 84 ab 35 a . . 5922 b2 UREA 30 LB A/A 84 b 36 a . . 6874 a3 UREA 60 LB A/A 85 ab 37 a . . 7137 a4 UREA 90 LB A/A 84 ab 37 a 70 3 7569 a5 UREA 120 LB A/A 84 ab 37 a 30 3 7350 a6 UREA 150 LB A/A 86 ab 37 a 60 3 7464 a7 UREA 180 LB A/A 85 ab 37 a . . 7271 a8 UREA 210 LB A/A 87 a 38 a . . 7106 a9 UREA 45 LB A/A 84 ab 36 a . . 7488 a
UREA 45 LB A/A10 UREA 75 LB A/A 85 ab 37 a . . 7425 a
UREA 45 LB A/A11 UREA 105 LB A/A 85 ab 36 a 10 3 7509 a
UREA 45 LB A/A12 UREA 135 LB A/A 86 ab 38 a 20 4 7307 a
UREA 45 LB A/A
Means followed by same letter do not significantly differ (P=.05, Student-Newman-Keuls)Mean comparisons performed only when AOV Treatment P(F) is significant at mean comparison OSL.
Crop Name Rice Rice Rice Rice RiceRating Date 7/31/2007 8/2/2007 8/2/2007 8/2/2007Rating Data Type 50% Head Height Ldg-Rate Ldg-Type YieldRating Unit days in % 1-5 lb/ACrop Stage Main Main Main Main Main
LSD (P=.05) 1.8 1.6 . . 711.2Standard Deviation 1.1 1 . . 492.5CV 1.27 2.61 . . 6.84
Replicate F 66.497 5.274 0.136Replicate Prob(F) 0.0001 0.0135 0.9379Treatment F 2.632 1.6 3.338Treatment Prob(F) 0.0256 0.1675 0.0035

99
Table 11. Advanced Experimental Line LA2082 Nitrogen Rate Validation 2.2 (Vermilion Parish).
Trt Rate Growth ApplNo. Rate Unit Stage Description
1 0 LB A/A 4-5 leaf Preflood 86 d 36 b . . 5028 c2 30 LB A/A 4-5 leaf Preflood 88 c 37 ab . . 6269 b3 60 LB A/A 4-5 leaf Preflood 89 bc 37 ab . . 6857 ab4 90 LB A/A 4-5 leaf Preflood 90 ab 39 ab 5 2 7324 a5 120 LB A/A 4-5 leaf Preflood 91 ab 40 a 10 4 7311 a6 150 LB A/A 4-5 leaf Preflood 91 a 41 a 10 4 7187 a7 180 LB A/A 4-5 leaf Preflood 92 a 39 ab 10 3 7268 a8 210 LB A/A 4-5 leaf Preflood 92 a 40 ab 20 3 7150 a9 45 LB A/A 4-5 leaf Preflood 89 bc 39 ab 10 3 6823 ab
45 LB A/A PD Midseason10 75 LB A/A 4-5 leaf Preflood 90 ab 39 ab 10 2 7261 a
45 LB A/A PD Midseason11 105 LB A/A 4-5 leaf Preflood 91 ab 39 ab 10 3 7270 a
45 LB A/A PD Midseason12 135 LB A/A 4-5 leaf Preflood 92 a 41 a 10 3 7620 a
45 LB A/A PD Midseason
Means followed by same letter do not significantly differ (P=.05, Student-Newman-Keuls)Mean comparisons performed only when AOV Treatment P(F) is significant at mean comparison OSL.
Rating Date 7/31/2007 8/2/2007 8/2/2007Crop Name Rice Rice
Rating Data Type 50% Head Height Ldg-Rate Ldg-Type Yieldin % 1-5
.
Rice8/2/2007
Rice Rice
.
Mainlb/A
Crop Stage Main Main Main MainRating Unit days
2.562
589.4Standard Deviation 0.8 1.4 . .LSD (P=.05) 1.3 2.3
5.88408.2
CV 0.87 3.54 . .
Replicate F 48.804 1.3360.0716
Treatment F 14.739 3.636Replicate Prob(F) 0.0001 0.2833
0.000111.564
Treatment Prob(F) 0.0001 0.0048

100
Table 12. Advanced Experimental Line LA2028 Nitrogen Rate Validation 2.2 (Vermilion Parish).
Trt Rate Growth ApplNo. Rate Unit Stage Description
1 90 LB A/A 4-5 leaf Preflood 97 a 35 a 6349 a2 120 LB A/A 4-5 leaf Preflood 97 a 35 a 6925 a3 150 LB A/A 4-5 leaf Preflood 97 a 36 a 6556 a4 180 LB A/A 4-5 leaf Preflood 97 a 36 a 6732 a
Means followed by same letter do not significantly differ (P=.05, Student-Newman-Keuls)Mean comparisons performed only when AOV Treatment P(F) is significant at mean comparison OSL.
RiceRating Date 7/31/2007 8/2/2007Crop Name Rice Rice
YieldRating Unit days in lb/ARating Data Type 50% Head Height
0.7 1.9
MainCrop Stage Main Main
5.51CV 0.34 2.66
585Standard Deviation 0.3 0.9 365.7LSD (P=.05)
1.498Replicate Prob(F) 0.002 0.3847 0.2803Replicate F 21 1.125
1.807Treatment Prob(F) 0.4547 0.3376 0.2159Treatment F 1 1.375

101
Rice Variety by Nitrogen Experiments at Richland Parish Experiment number .......................... : 07-RP-03 Site and design ................................... : Location/Cooperator .................. : Richland Parish / Marley Oldham Tillage type .................................. : No Till into soybean stubble Experimental design ................... : Randomized complete block Number of reps ........................... : 4 Plot size ........................................ : 7 x 20 ft Row width/rows per plot ............ : 7 in / 12 Soil type .............................................. : Hebert silty clay % organic matter ........................ : NA pH................................................. : 6.1 Extractable nutrients ppm ......... : Ca-2,121; Cu-2.0; Mg-480; P-28.5; K-166.7; Na-91.8; S-25.0; Zn-2.4 Crop/Variety ...................................... : Rice / CL171AR Planting method/date ................. : Drill seeded / March 28 Seeding rate/depth ...................... : 40 seeds/ft2 / .75 in Emergence date ........................... : April 9 Harvest date ................................ : August 21 Seed treatment/cwt ............................ : Dithane (fungicide)-114 g Release (gibberellic acid)-10 g Zinche (40.5% Zn)-236 ml Fertilization ........................................ : None Water management ........................... : Flush ............................................ : Rain March 31 Flood ............................................ : May 14 Drain ............................................ : August 3 Pest management ............................... : Herbicides.................................... : 1 gal/A Arrosolo + 1 oz/A Permit, April 21 1 gal/A Arrosolo + 1 pt/A Grandstand, May 10 13 oz/A Clincher, May 31 15 oz/A Clincher, June 28 Insecticides .................................. : 2 oz/A Karate, June 28 4 oz/A Mustang Max, July 18 Fungicides ................................... : 12 oz/A Quadris, July 18

102
Table 13. CL171AR Nitrogen Rate Validation 1.3 (Richland Parish).
Trt Rate Growth ApplNo. Rate Unit Stage Description
1 0 LB A/A 4-5 leaf Preflood 99 e 35 d 5179 b2 30 LB A/A 4-5 leaf Preflood 101 d 37 c 5703 b3 60 LB A/A 4-5 leaf Preflood 103 bc 38 bc 6828 a4 90 LB A/A 4-5 leaf Preflood 104 bc 40 ab 7012 a5 120 LB A/A 4-5 leaf Preflood 104 bc 41 ab 7112 a6 150 LB A/A 4-5 leaf Preflood 106 a 43 a 7262 a7 180 LB A/A 4-5 leaf Preflood 106 a 42 a 7419 a8 210 LB A/A 4-5 leaf Preflood 106 a 43 a 6969 a9 45 LB A/A 4-5 leaf Preflood 101 d 40 ab 6482 a
45 LB A/A PD Midseason10 75 LB A/A 4-5 leaf Preflood 103 c 40 ab 7236 a
45 LB A/A PD Midseason11 105 LB A/A 4-5 leaf Preflood 104 bc 42 a 7128 a
45 LB A/A PD Midseason12 135 LB A/A 4-5 leaf Preflood 105 ab 42 a 7233 a
45 LB A/A PD Midseason
Means followed by same letter do not significantly differ (P=.05, Student-Newman-Keuls)Mean comparisons performed only when AOV Treatment P(F) is significant at mean comparison OSL.
RiceRating Date 8/21/2007 8/21/2007Crop Name Rice Rice
YieldRating Unit days in lb/ARating Data Type 50% Head Height
LSD (P=.05) 1.2 1.8 712
MainCrop Stage Main Main
493.1CV 0.78 2.67 7.25Standard Deviation 0.8 1.1
0.0001 0.0059Replicate F 20.721 6.542 6.047
0.0001Treatment Prob(F) 0.0001 0.0001
0.0021Treatment F 32.744 14.124 7.758Replicate Prob(F)

103
Table 14. Spring Nitrogen Rate Validation 3.3 (Richland Parish).
Trt Rate Growth ApplNo. Rate Unit Stage Description
1 0 LB A/A 4-5 leaf Preflood 95 cd 34 c 2847 b2 30 LB A/A 4-5 leaf Preflood 96 bcd 37 b 3283 ab3 60 LB A/A 4-5 leaf Preflood 96 bcd 40 ab 4006 ab4 90 LB A/A 4-5 leaf Preflood 98 abc 41 ab 4791 ab5 120 LB A/A 4-5 leaf Preflood 98 abc 41 ab 5015 ab6 150 LB A/A 4-5 leaf Preflood 98 ab 42 a 5245 ab7 180 LB A/A 4-5 leaf Preflood 99 a 43 a 5127 ab8 210 LB A/A 4-5 leaf Preflood 98 ab 43 a 5270 ab9 45 LB A/A 4-5 leaf Preflood 94 d 39 ab 3321 ab
45 LB A/A PD Midseason10 75 LB A/A 4-5 leaf Preflood 96 bcd 40 ab 4162 ab
45 LB A/A PD Midseason11 105 LB A/A 4-5 leaf Preflood 96 bcd 41 ab 4780 ab
45 LB A/A PD Midseason12 135 LB A/A 4-5 leaf Preflood 97 a-d 40 ab 6140 a
45 LB A/A PD Midseason
Means followed by same letter do not significantly differ (P=.05, Student-Newman-Keuls)Mean comparisons performed only when AOV Treatment P(F) is significant at mean comparison OSL.
RiceRating Date 8/21/2007 8/21/2007Crop Name Rice Rice
YieldRating Unit days in lb/ARating Data Type 50% Head Height
LSD (P=.05) 1.9 2.9 1716.5
MainCrop Stage Main Main
1188.8CV 1.33 4.21 26.42Standard Deviation 1.3 1.7
0.0001 0.0079Replicate F 73.685 6.085 7.902
0.0131Treatment Prob(F) 0.0001 0.0001
0.0004Treatment F 5.393 6.556 2.733Replicate Prob(F)

104
Table 15. Trenasse Nitrogen Rate Validation 4.3 (Richland Parish).
Trt Rate Growth ApplNo. Rate Unit Stage Description
1 0 LB A/A 4-5 leaf Preflood 94 b 31 d 3865 c2 30 LB A/A 4-5 leaf Preflood 95 ab 33 c 4707 c3 60 LB A/A 4-5 leaf Preflood 96 ab 36 ab 6007 b4 90 LB A/A 4-5 leaf Preflood 97 ab 38 ab 7183 ab5 120 LB A/A 4-5 leaf Preflood 98 ab 37 ab 7077 ab6 150 LB A/A 4-5 leaf Preflood 98 ab 38 ab 7561 a7 180 LB A/A 4-5 leaf Preflood 99 a 39 a 7629 a8 210 LB A/A 4-5 leaf Preflood 98 ab 39 ab 7511 a9 45 LB A/A 4-5 leaf Preflood 95 ab 35 bc 6054 b
45 LB A/A PD Midseason10 75 LB A/A 4-5 leaf Preflood 97 ab 37 ab 6411 ab
45 LB A/A PD Midseason11 105 LB A/A 4-5 leaf Preflood 98 ab 37 ab 6747 ab
45 LB A/A PD Midseason12 135 LB A/A 4-5 leaf Preflood 98 ab 39 ab 7807 a
45 LB A/A PD Midseason
Means followed by same letter do not significantly differ (P=.05, Student-Newman-Keuls)Mean comparisons performed only when AOV Treatment P(F) is significant at mean comparison OSL.
Rice RiceCrop Name RicePest Type
Height Yield8/21/2007
Rating Data Type 50% HeadRating Date 8/21/2007
2.3 925.2LSD (P=.05) 2.5
lb/ARating Unit days in
640.7CV 1.81Standard Deviation 1.8 1.3
0.325 3.109Replicate F 40.957
3.65 9.79
0.0396Treatment F 2.877Replicate Prob(F) 0.0001 0.726
0.0001Treatment Prob(F) 0.0092 0.000110.333 14.68

105
Table 16. Advanced Experimental Line LA2082 Nitrogen Rate Validation 2.3 (Richland Parish).
Trt Rate Growth ApplNo. Rate Unit Stage Description
1 0 LB A/A 4-5 leaf Preflood 102 e 32 d 3459 e2 30 LB A/A 4-5 leaf Preflood 103 de 33 cd 4088 e3 60 LB A/A 4-5 leaf Preflood 106 bc 35 bc 4975 d4 90 LB A/A 4-5 leaf Preflood 106 abc 36 ab 6314 bc5 120 LB A/A 4-5 leaf Preflood 108 ab 37 ab 6155 c6 150 LB A/A 4-5 leaf Preflood 108 ab 37 ab 6648 abc7 180 LB A/A 4-5 leaf Preflood 108 a 38 ab 7502 a8 210 LB A/A 4-5 leaf Preflood 108 ab 39 a 7462 a9 45 LB A/A 4-5 leaf Preflood 104 de 36 ab 6083 c
45 LB A/A PD Midseason10 75 LB A/A 4-5 leaf Preflood 105 cd 36 ab 6661 abc
45 LB A/A PD Midseason11 105 LB A/A 4-5 leaf Preflood 106 abc 37 ab 7204 ab
45 LB A/A PD Midseason12 135 LB A/A 4-5 leaf Preflood 107 ab 38 ab 7349 a
45 LB A/A PD Midseason
Means followed by same letter do not significantly differ (P=.05, Student-Newman-Keuls)Mean comparisons performed only when AOV Treatment P(F) is significant at mean comparison OSL.
RiceRating Date 8/21/2007 8/21/2007Crop Name Rice Rice
YieldRating Unit days in lb/ARating Data Type 50% Head Height
LSD (P=.05) 1.3 2.2 684.8
MainCrop Stage Main Main
474.3CV 0.88 3.53 7.7Standard Deviation 0.9 1.3
0.0001 0.1045Replicate F 53.322 2.507 76.876
0.0001Treatment Prob(F) 0.0001 0.0001
0.0001Treatment F 19.196 8.428 31.546Replicate Prob(F)

106
Table 17. Advanced Experimental Line LA2028 Nitrogen Rate Validation 2.3 (Richland Parish).
Trt Rate Growth ApplNo. Rate Unit Stage Description
1 90 LB A/A 4-5 leaf Preflood 105 a 35 a 7020 a2 120 LB A/A 4-5 leaf Preflood 105 a 36 a 7729 a3 150 LB A/A 4-5 leaf Preflood 105 a 35 a 7660 a4 180 LB A/A 4-5 leaf Preflood 106 a 36 a 8087 a
Means followed by same letter do not significantly differ (P=.05, Student-Newman-Keuls)Mean comparisons performed only when AOV Treatment P(F) is significant at mean comparison OSL.
RiceRating Date 8/21/2007 8/21/2007Crop Name Rice Rice
YieldRating Unit days in lb/ARating Data Type 50% Head Height
LSD (P=.05) 1 1.1 1216.7
MainCrop Stage Main Main
760.7CV 0.6 1.55 9.98Standard Deviation 0.6 0.6
0.0006 0.7703Replicate F 15.737 0.273 11.965
0.315Treatment Prob(F) 0.0618 0.1059
0.0017Treatment F 3.526 3.182 1.363Replicate Prob(F)

107
RiceTec Hybrid by Nitrogen Experiments (Rice Research Station) Experiment number .......................... : 07-CM-16 – 07-CM-19 Site and design ................................... : Location/Cooperator .................. : Rice Research Station (Crowley Main) Tillage type .................................. : Conventional Experimental design ................... : Randomized complete block Number of reps ........................... : 4 Plot size ........................................ : 7 x 20 ft Row width/rows per plot ............ : 7 in / 12 Soil type .............................................. : Crowley silt loam % organic matter ........................ : NA pH................................................. : 7.0 Extractable nutrients .................. : Ca-1,238; Cu-1.6; Mg-222; P-19.3; K-88.0; Na-91.0; S-6.6; Zn-6.3 Crop/Variety ...................................... : Rice / CLXL730, CL161 Planting method/date ................. : Drill seeded / March 20 Seeding rate/depth ...................... : Hybrid- 14 seeds/ft2, Commercial- 33 seeds/ft2 / 1 in Emergence date ........................... : March 28 Harvest date ................................ : August 6; Ratoon harvest, October 16 Seed treatment/cwt ............................ : Dithane (fungicide)-114 g Release (gibberellic acid)-10 g Zinche (40.5% Zn)-236 ml Fertilization ........................................ : 195 lb/A 0-24-24-2.5, March 20 1 qt /A Zinc Plus, May 1 90 lb N/A 46-0-0, August 7 Water management ........................... : Flush ............................................ : March 28, April 20 Flood ............................................ : May 3; Ratoon flood, August 8 Drain ............................................ : July 17; Ratoon drain, October 4 Pest management ............................... : Herbicides.................................... : 4 oz/A NewPath, April 16 and May 1 15 oz/A Clincher, April 23 1 gal Arrosolo + .75 oz Londax + .5 oz Permit, May 1 1 oz Londax, May 17 Insecticides .................................. : 4 oz/A Karate, May10 4 oz/A Mustang Max, July 2 Fungicides ................................... : 21 oz/A Quilt + 6 oz/A Quadris, June 16

108
Table 18. RiceTec Hybrid CLXL730 Nitrogen Rate Validation (Rice Research Station).
Trt Rate Growth ApplNo. Rate Unit Stage Description
1 0 LB A/A 3-4 leaf Preflood 93 d 33 d 2042 e 66 a 47 b 3047 b 5089 e0 LB A/A PD Midseason0 LB A/A 5% heading Late Season
2 90 LB A/A 3-4 leaf Preflood 96 bc 44 bc 9708 cd 70 a 55 a 3540 a 13248 c0 LB A/A PD Midseason0 LB A/A 5% heading Late Season
3 90 LB A/A 3-4 leaf Preflood 97 bc 45 abc 10930 ab 69 a 55 a 3475 a 14405 b30 LB A/A PD Midseason0 LB A/A 5% heading Late Season
4 90 LB A/A 3-4 leaf Preflood 97 bc 42 c 10011 c 70 a 57 a 4116 a 14127 bc0 LB A/A PD Midseason
30 LB A/A 5% heading Late Season5 120 LB A/A 3-4 leaf Preflood 97 bc 44 bc 10866 ab 69 a 54 a 3650 a 14516 b
0 LB A/A PD Midseason0 LB A/A 5% heading Late Season
6 150 LB A/A 3-4 leaf Preflood 98 b 48 a 11561 a 67 a 54 a 3851 a 15413 a0 LB A/A PD Midseason0 LB A/A 5% heading Late Season
7 90 LB A/A 3-4 leaf Preflood 96 c 48 ab 11059 ab 70 a 56 a 3900 a 14959 ab30 LB A/A PD Midseason30 LB A/A 5% heading Late Season
8 90 LB A/A 3-4 leaf Preflood 96 c 44 bc 9317 cd 70 a 58 a 3930 a 13246 c0 LB A/A PD Midseason
60 LB A/A 5% heading Late Season9 120 LB A/A 3-4 leaf Preflood 97 bc 45 abc 11693 a 68 a 56 a 3851 a 15544 a
30 LB A/A PD Midseason0 LB A/A 5% heading Late Season
10 120 LB A/A 3-4 leaf Preflood 97 bc 45 abc 10643 b 70 a 57 a 3704 a 14347 b0 LB A/A PD Midseason
30 LB A/A 5% heading Late Season11 102 a 41 c 9029 d 68 a 59 a 2663 b 11692 d
120 LB A/A 3-4 leaf Preflood30 LB A/A PD Midseason0 LB A/A 5% heading Late Season
Means followed by same letter do not significantly differ (P=.05, Student-Newman-Keuls)Mean comparisons performed only when AOV Treatment P(F) is significant at mean comparison OSL.
Crop Name Rice Rice Rice Rice Rice Rice RiceRating Date 8/1/2007 8/6/2007 10/16/2007 10/16/2007Rating Data Type 50% Head Height Yield Total Mill Whole Mill Yield YieldRating Unit days in lb/A % % lb/A lb/ACrop Stage Main Main Main Main Main Ratoon Total
LSD (P=.05) 1.3 2.8 600.6 2.1 3.9 402.8 734.7Standard Deviation 0.8 1.7 416 1 1.7 279 508.8CV 0.79 3.79 4.28 1.4 3.15 7.72 3.82
Replicate F 2.539 2.697 0.784 0.303 0.806 6.621 0.831Replicate Prob(F) 0.1041 0.0918 0.512 0.594 0.3904 0.0014 0.4873Treatment F 22.435 19.443 167.341 2.878 6.357 9.28 134.003Treatment Prob(F) 0.0001 0.0001 0.0001 0.0553 0.0036 0.0001 0.0001

109
Table 19. RiceTec Hybrid CLXL745 Nitrogen Rate Validation (Rice Research Station).
Trt Rate Growth ApplNo Rate Unit Stage Description
1 0 LB A/A 3-4 leaf Preflood 92 c 31 c 2446 d 71 ab 54 bc 2643 bc 5089 d0 LB A/A PD Midseason0 LB A/A 5% heading Late Season
2 90 LB A/A 3-4 leaf Preflood 95 b 42 ab 9932 bc 70 ab 49 c 2866 abc 12798 bc0 LB A/A PD Midseason0 LB A/A 5% heading Late Season
3 90 LB A/A 3-4 leaf Preflood 94 b 44 ab 11086 ab 70 ab 54 bc 2728 bc 13814 ab30 LB A/A PD Midseason0 LB A/A 5% heading Late Season
4 90 LB A/A 3-4 leaf Preflood 95 b 43 ab 9819 bc 71 ab 54 bc 2923 abc 12742 bc0 LB A/A PD Midseason
30 LB A/A 5% heading Late Season5 120 LB A/A 3-4 leaf Preflood 95 b 43 ab 10799 ab 71 ab 54 bc 2959 abc 13758 ab
0 LB A/A PD Midseason0 LB A/A 5% heading Late Season
6 150 LB A/A 3-4 leaf Preflood 96 b 45 ab 11733 a 69 b 53 bc 3347 a 15080 a0 LB A/A PD Midseason0 LB A/A 5% heading Late Season
7 90 LB A/A 3-4 leaf Preflood 95 b 43 ab 10804 ab 71 ab 57 abc 2786 abc 13590 ab30 LB A/A PD Midseason30 LB A/A 5% heading Late Season
8 90 LB A/A 3-4 leaf Preflood 95 b 42 ab 9783 bc 72 a 63 a 2874 abc 12657 bc0 LB A/A PD Midseason
60 LB A/A 5% heading Late Season9 120 LB A/A 3-4 leaf Preflood 95 b 45 a 10843 ab 71 ab 56 abc 2936 abc 13780 ab
30 LB A/A PD Midseason0 LB A/A 5% heading Late Season
10 120 LB A/A 3-4 leaf Preflood 95 b 45 a 10934 ab 71 ab 57 abc 3182 ab 14116 ab0 LB A/A PD Midseason
30 LB A/A 5% heading Late Season11 101 a 41 b 9237 c 69 b 59 ab 2441 c 11678 c
120 LB A/A 3-4 leaf Preflood30 LB A/A PD Midseason0 LB A/A 5% heading Late Season
Means followed by same letter do not significantly differ (P=.05, Student-Newman-Keuls)Mean comparisons performed only when AOV Treatment P(F) is significant at mean comparison OSL.
Crop Name Rice Rice Rice Rice Rice Rice RiceRating Date 8/1/2007 8/6/2007 10/16/2007 10/16/2007Rating Data Type 50% Head Height Yield Total Mill Whole Mill Yield YieldRating Unit days in lb/A % % lb/A lb/ACrop Stage Main Main Main Main Main Ratoon Total
LSD (P=.05) 1 2.4 963.7 1.5 5 374.9 1166.7Standard Deviation 0.6 1.4 667.4 0.7 2.3 259.7 808CV 0.63 3.34 6.83 0.96 4.08 9.01 6.39
Replicate F 0.254 1.201 0.496 0 0.004 3.469 1.328Replicate Prob(F) 0.778 0.3218 0.6878 1 0.9486 0.0283 0.2838Treatment F 36.695 22.802 57.627 3.942 4.495 3.572 43.463Treatment Prob(F) 0.0001 0.0001 0.0001 0.0206 0.0131 0.0033 0.0001

110
Table 20. RiceTec Hybrid CLXL729 Nitrogen Rate Validation (Rice Research Station).
Trt Rate Growth ApplNo.Rate Unit Stage Description
1 0 LB A/A 3-4 leaf Preflood 93 d 31 d 2575 d 69 a 55 a 3266 b 5841 e0 LB A/A PD Midseason0 LB A/A 5% heading Late Season
2 90 LB A/A 3-4 leaf Preflood 95 c 41 abc 9539 bc 69 a 53 a 4082 a 13622 bcd0 LB A/A PD Midseason0 LB A/A 5% heading Late Season
3 90 LB A/A 3-4 leaf Preflood 96 bc 41 abc 11143 ab 69 a 56 a 4164 a 15307 ab30 LB A/A PD Midseason
0 LB A/A 5% heading Late Season4 90 LB A/A 3-4 leaf Preflood 95 c 40 bc 9516 bc 70 a 57 a 3819 a 13334 bcd
0 LB A/A PD Midseason30 LB A/A 5% heading Late Season
5 120 LB A/A 3-4 leaf Preflood 96 bc 42 abc 10483 abc 70 a 57 a 4083 a 14566 a-d0 LB A/A PD Midseason0 LB A/A 5% heading Late Season
6 150 LB A/A 3-4 leaf Preflood 97 b 43 ab 11556 a 69 a 56 a 4461 a 16017 a0 LB A/A PD Midseason0 LB A/A 5% heading Late Season
7 90 LB A/A 3-4 leaf Preflood 95 c 42 abc 10463 abc 69 a 55 a 4005 a 14469 a-d30 LB A/A PD Midseason30 LB A/A 5% heading Late Season
8 90 LB A/A 3-4 leaf Preflood 96 bc 40 c 9181 c 70 a 58 a 3798 a 12979 cd0 LB A/A PD Midseason
60 LB A/A 5% heading Late Season9 120 LB A/A 3-4 leaf Preflood 96 bc 44 a 10822 abc 69 a 54 a 4043 a 14865 abc
30 LB A/A PD Midseason0 LB A/A 5% heading Late Season
10 120 LB A/A 3-4 leaf Preflood 96 bc 42 abc 10678 abc 70 a 58 a 3911 a 14588 a-d0 LB A/A PD Midseason
30 LB A/A 5% heading Late Season11 100 a 41 abc 9887 abc 68 a 58 a 2721 c 12608 d
120 LB A/A 3-4 leaf Preflood30 LB A/A PD Midseason
0 LB A/A 5% heading Late Season
Means followed by same letter do not significantly differ (P=.05, Student-Newman-Keuls)Mean comparisons performed only when AOV Treatment P(F) is significant at mean comparison OSL.
Rating Date 8/6/2007Rice RiceCrop Name Rice Rice
10/16/2007 10/16/20078/6/2007Rice Rice Rice
Rating Unit Days INYield Total MillRating Data Type 50% Head Height
% % lb/A lb/Alb/AWhole Mill Yield Yield
Main Ratoon TotalMain MainCrop Stage Main Main
Standard Deviation 0.7 1.11191.7 1.5LSD (P=.05) 1.2 1.9
0.7 1.7 292.1 975.8824.13.8 422.4 1411
3.02 7.59 7.248.57 1CV 0.73 2.78
Replicate Prob(F) 0.0034 0.18881.393 0.142Replicate F 7.654 1.814
0.7139 0.0196 0.0001 0.020.26467.709 11.293 3.83
Treatment Prob(F) 0.0001 0.000135.34 1.69Treatment F 18.037 26.64
0.2105 0.1631 0.0001 0.00010.00011.9 10.615 31.289

111
Table 21. RiceTec Hybrid XP744 Nitrogen Rate Validation (Rice Research Station).
Trt Rate Growth ApplNo.Rate Unit Stage Description
1 0 LB A/A 3-4 leaf Preflood 90 c 32 c 3158 d 71 a 56 a 2327 b 5485 e0 LB A/A PD Midseason0 LB A/A 5% heading Late Season
2 90 LB A/A 3-4 leaf Preflood 94 b 43 a 9535 bc 71 a 47 b 2734 ab 12268 bc0 LB A/A PD Midseason0 LB A/A 5% heading Late Season
3 90 LB A/A 3-4 leaf Preflood 94 b 43 a 9606 bc 71 a 51 ab 2412 ab 12018 bc30 LB A/A PD Midseason0 LB A/A 5% heading Late Season
4 90 LB A/A 3-4 leaf Preflood 94 b 44 a 9297 bc 71 a 50 ab 2939 ab 12235 bc0 LB A/A PD Midseason
30 LB A/A 5% heading Late Season5 120 LB A/A 3-4 leaf Preflood 95 b 44 a 9966 bc 71 a 53 ab 2499 ab 12465 bc
0 LB A/A PD Midseason0 LB A/A 5% heading Late Season
6 150 LB A/A 3-4 leaf Preflood 95 ab 45 a 11656 a 71 a 51 ab 3016 a 14672 a0 LB A/A PD Midseason0 LB A/A 5% heading Late Season
7 90 LB A/A 3-4 leaf Preflood 94 b 45 a 10167 b 71 a 51 ab 2817 ab 12984 bc30 LB A/A PD Midseason30 LB A/A 5% heading Late Season
8 90 LB A/A 3-4 leaf Preflood 94 b 42 a 8651 c 71 a 53 ab 2616 ab 11267 cd0 LB A/A PD Midseason
60 LB A/A 5% heading Late Season9 120 LB A/A 3-4 leaf Preflood 94 b 46 a 10397 b 71 a 53 ab 2929 ab 13326 b
30 LB A/A PD Midseason0 LB A/A 5% heading Late Season
10 120 LB A/A 3-4 leaf Preflood 95 ab 45 a 10216 b 71 a 55 a 2766 ab 12982 bc0 LB A/A PD Midseason
30 LB A/A 5% heading Late Season11 96 a 39 b 8722 c 70 b 56 a 1793 c 10515 d
120 LB A/A 3-4 leaf Preflood30 LB A/A PD Midseason0 LB A/A 5% heading Late Season
Means followed by same letter do not significantly differ (P=.05, Student-Newman-Keuls)Mean comparisons performed only when AOV Treatment P(F) is significant at mean comparison OSL.
Rating Date 8/6/2007Rice RiceCrop Name Rice Rice
10/16/2007 10/16/20078/6/2007Rice Rice Rice
Rating Unit days inYield Total MillRating Data Type 50% Head Height
% % lb/A lb/Alb/AWhole Mill Yield Yield
Main Ratoon TotalMain MainCrop Stage Main Main
Standard Deviation 0.6 1.3932.1 0.8LSD (P=.05) 1 2.2
0.3 2 271.5 790.4645.64.4 392 1141.3
3.8 10.35 6.687.01 0.48CV 0.6 3.07
Replicate Prob(F) 0.0414 0.4147.12 0.331Replicate F 3.75 0.922
0.5777 0.2165 0.0001 0.00010.00091.74 13.697 11.661
Treatment Prob(F) 0.0001 0.000145.434 3.103Treatment F 24.192 27.415
0.0442 0.0218 0.0001 0.00010.00013.872 6.808 35.904

112
RiceTec Hybrid by Nitrogen Experiments (Richland Parish) Experiment number .......................... : 07-RP-08 – 07-RP-11 Site and design ................................... : Location/Cooperator .................. : Richland Parish / Marley Oldham Tillage type .................................. : No Till into soybean stubble Experimental design ................... : Randomized complete block Number of reps ........................... : 4 Plot size ........................................ : 7 x 20 ft Row width/rows per plot ............ : 7 in / 12 Soil type .............................................. : Hebert silty clay % organic matter ........................ : NA pH................................................. : 7.3 Extractable nutrients ppm ......... : Ca-2,402; Cu-2.1; Mg-559; P-17.7; K-164.8; Na-146; S-37.2; Zn-1.4 Crop/Variety ...................................... : Rice / XP744, Wells Planting method/date ................. : Drill seeded / March 28 Seeding rate/depth ...................... : Hybrid- 14 seeds/ft2, Commercial- 40 seeds/ft2 / .75 in Emergence date ........................... : April 10 Harvest date ................................ : August 21 Seed treatment/cwt ............................ : Dithane (fungicide)-114 g Release (gibberellic acid)-10 g Zinche (40.5% Zn)-236 ml Fertilization ........................................ : None Water management ........................... : Flush ............................................ : Rain, March 31 Flood ............................................ : May 14 Drain ............................................ : August 3 Pest management ............................... : Herbicides.................................... : 1 gal/A Arrosolo + 1 oz/A Permit, April 21 1 gal/A Arrosolo + 1 pt/A Grandstand, May 10 13 oz/A Clincher, May 31 15 oz/A Clincher, June 28 Insecticides .................................. : 2 oz/A Karate, June 28 4 oz/A Mustang Max, July 18 Fungicides ................................... : 12 oz/A Quadris, July 18

113
Table 22. RiceTec Hybrid XP744 Nitrogen Rate Validation (Richland Parish).
Trt Rate Growth ApplNo.Rate Unit Stage Description
1 0 LB A/A 3-4 leaf Preflood 98 c 37 c 25 a 3 a 4456 b 70 a 54 a0 LB A/A PD Midseason0 LB A/A 5% heading Late Season
2 90 LB A/A 3-4 leaf Preflood 100 bc 44 a 27 a 2 a 8409 a 71 a 53 a0 LB A/A PD Midseason0 LB A/A 5% heading Late Season
3 90 LB A/A 3-4 leaf Preflood 100 bc 45 a 15 a 2 a 8912 a 71 a 55 a30 LB A/A PD Midseason0 LB A/A 5% heading Late Season
4 90 LB A/A 3-4 leaf Preflood 101 b 44 a 13 a 2 a 7486 a 70 a 54 a0 LB A/A PD Midseason
30 LB A/A 5% heading Late Season5 120 LB A/A 3-4 leaf Preflood 102 b 45 a 18 a 2 a 8014 a 69 a 53 a
0 LB A/A PD Midseason0 LB A/A 5% heading Late Season
6 150 LB A/A 3-4 leaf Preflood 101 b 46 a 12 a 2 a 8933 a 71 a 55 a0 LB A/A PD Midseason0 LB A/A 5% heading Late Season
7 90 LB A/A 3-4 leaf Preflood 100 bc 45 a 15 a 2 a 8567 a 70 a 55 a30 LB A/A PD Midseason30 LB A/A 5% heading Late Season
8 90 LB A/A 3-4 leaf Preflood 100 bc 45 a 13 a 2 a 8609 a 70 a 55 a0 LB A/A PD Midseason
60 LB A/A 5% heading Late Season9 120 LB A/A 3-4 leaf Preflood 101 b 46 a 13 a 1 a 9221 a 70 a 55 a
30 LB A/A PD Midseason0 LB A/A 5% heading Late Season
10 120 LB A/A 3-4 leaf Preflood 100 bc 44 a 17 a 1 a 8872 a 70 a 55 a0 LB A/A PD Midseason
30 LB A/A 5% heading Late Season11 111 a 40 b 4727 b 71 a 52 a
120 LB A/A 3-4 leaf Preflood30 LB A/A PD Midseason0 LB A/A 5% heading Late Season
Means followed by same letter do not significantly differ (P=.05, Student-Newman-Keuls)Mean comparisons performed only when AOV Treatment P(F) is significant at mean comparison OSL.
Rice Rice Rice Rice RiceRating Date 8/21/2007 8/21/2007 8/21/2007
RiceCrop Name Rice
Rating Data Type 50% Head Height Ldg-Rate Ldg-Type8/21/2007
% %Whole Mill
Rating Unit days in % 1-5Yield Total Mill
Crop Stage Main Main Main Mainlb/A
1.9 2.3 16.4 1.4
Main MainMain
749.21.8 4
Standard Deviation 1.3 1.4 9.5 0.81083.4LSD (P=.05)
3.989.56 1.361 2.2
CV 1.3 3.14 56.63 43.09
2.989Replicate F 32.582 1.624 3.145 6.3870.0001 0.101 0.7634
0.278Replicate Prob(F) 0.0001 0.2234 0.0688 0.0085
39.047
19.99Treatment F 29.428 12.8 0.865 1.1530.5008 0.52930.0001
1.006 0.959Treatment Prob(F) 0.0001 0.0001 0.572 0.3818

114
Table 23. RiceTec Hybrid CLXL745 Nitrogen Rate Validation (Richland Parish).
Trt Rate Growth ApplNo.Rate Unit Stage Description
1 0 LB A/A 3-4 leaf Preflood 99 c 38 b 40 a 4 a 5750 d 70 a 53 b0 LB A/A PD Midseason0 LB A/A 5% heading Late Season
2 90 LB A/A 3-4 leaf Preflood 101 b 44 a 20 b 1 b 8972 b 70 a 52 b0 LB A/A PD Midseason0 LB A/A 5% heading Late Season
3 90 LB A/A 3-4 leaf Preflood 101 b 46 a 8 b 1 b 9835 ab 70 a 55 ab30 LB A/A PD Midseason0 LB A/A 5% heading Late Season
4 90 LB A/A 3-4 leaf Preflood 101 b 45 a 8917 b 70 a 54 ab0 LB A/A PD Midseason
30 LB A/A 5% heading Late Season5 120 LB A/A 3-4 leaf Preflood 101 b 45 a 10 b 1 b 9763 ab 70 a 55 ab
0 LB A/A PD Midseason0 LB A/A 5% heading Late Season
6 150 LB A/A 3-4 leaf Preflood 101 b 46 a 5 b 1 b 10660 a 70 a 56 ab0 LB A/A PD Midseason0 LB A/A 5% heading Late Season
7 90 LB A/A 3-4 leaf Preflood 101 b 44 a 20 b 2 b 9738 ab 70 a 56 ab30 LB A/A PD Midseason30 LB A/A 5% heading Late Season
8 90 LB A/A 3-4 leaf Preflood 101 b 44 a 10 b 1 b 8918 b 71 a 58 ab0 LB A/A PD Midseason
60 LB A/A 5% heading Late Season9 120 LB A/A 3-4 leaf Preflood 101 b 45 a 10 b 1 b 10031 ab 70 a 54 ab
30 LB A/A PD Midseason0 LB A/A 5% heading Late Season
10 120 LB A/A 3-4 leaf Preflood 101 b 43 a 10 b 1 b 9347 b 70 a 54 ab0 LB A/A PD Midseason
30 LB A/A 5% heading Late Season11 108 a 40 b 7305 c 71 a 61 a
120 LB A/A 3-4 leaf Preflood30 LB A/A PD Midseason0 LB A/A 5% heading Late Season
Means followed by same letter do not significantly differ (P=.05, Student-Newman-Keuls)Mean comparisons performed only when AOV Treatment P(F) is significant at mean comparison OSL.
Rice Rice Rice Rice RiceRating Date 8/21/2007 8/21/2007 8/21/2007
RiceCrop Name Rice
Rating Data Type 50% Head Height Ldg-Rate Ldg-Type8/21/2007
% %Whole Mill
Rating Unit Days IN % 1-5Yield Total Mill
Crop Stage Main Main Main Mainlb/A
1.2 2 11.7 0.8
Main MainMain
516.71.7 4.3
Standard Deviation 0.8 1.2 6.1 0.4746LSD (P=.05)
3.465.73 1.070.7 1.9
CV 0.82 2.72 41.26 27.55
0.098Replicate F 47.148 2.328 0.056 0.780.0001 0.7608 0.6976
0.16Replicate Prob(F) 0.0001 0.1234 0.9455 0.4999
51.463
28.777Treatment F 31.022 11.487 9.456 18.780.9292 0.04110.00010.379 3.178
Treatment Prob(F) 0.0001 0.0001 0.0039 0.001

115
Table 24. RiceTec Hybrid CLXL729 Nitrogen Rate Validation (Richland Parish).
Trt Rate Growth ApplNo.Rate Unit Stage Description
1 0 LB A/A 3-4 leaf Preflood 101 d 37 c 30 2 5196 c 67 b 49 b0 LB A/A PD Midseason0 LB A/A 5% heading Late Season
2 90 LB A/A 3-4 leaf Preflood 104 b 43 a 10 3 8452 ab 70 a 58 a0 LB A/A PD Midseason0 LB A/A 5% heading Late Season
3 90 LB A/A 3-4 leaf Preflood 104 bc 44 a 9969 a 70 ab 57 a30 LB A/A PD Midseason0 LB A/A 5% heading Late Season
4 90 LB A/A 3-4 leaf Preflood 103 bc 43 a 9032 a 70 ab 57 a0 LB A/A PD Midseason
30 LB A/A 5% heading Late Season5 120 LB A/A 3-4 leaf Preflood 103 bc 43 a 9417 a 70 a 58 a
0 LB A/A PD Midseason0 LB A/A 5% heading Late Season
6 150 LB A/A 3-4 leaf Preflood 104 b 45 a 9866 a 70 a 59 a0 LB A/A PD Midseason0 LB A/A 5% heading Late Season
7 90 LB A/A 3-4 leaf Preflood 104 bc 43 a 10 4 8941 a 71 a 59 a30 LB A/A PD Midseason30 LB A/A 5% heading Late Season
8 90 LB A/A 3-4 leaf Preflood 102 c 44 a 10 4 8830 a 70 a 59 a0 LB A/A PD Midseason
60 LB A/A 5% heading Late Season9 120 LB A/A 3-4 leaf Preflood 103 bc 44 a 20 3 9867 a 70 ab 57 a
30 LB A/A PD Midseason0 LB A/A 5% heading Late Season
10 120 LB A/A 3-4 leaf Preflood 104 b 43 a 8491 ab 69 ab 56 a0 LB A/A PD Midseason
30 LB A/A 5% heading Late Season11 108 a 39 b 7473 b 70 a 59 a
120 LB A/A 3-4 leaf Preflood30 LB A/A PD Midseason0 LB A/A 5% heading Late Season
Means followed by same letter do not significantly differ (P=.05, Student-Newman-Keuls)Mean comparisons performed only when AOV Treatment P(F) is significant at mean comparison OSL.
Rice Rice Rice Rice RiceRating Date 8/21/2007 8/21/2007 8/21/2007
RiceCrop Name Rice
Rating Data Type 50% Head Height Ldg-Rate Ldg-Type8/21/2007
% %Whole Mill
Rating Unit Days IN % 1-5Yield Total Mill
Crop Stage Main Main Main Mainlb/A
1.3 2 . .
Main MainMain
676.21.6 2.5
Standard Deviation 0.9 1.2 . .976.4LSD (P=.05)
1.967.79 10.7 1.1
CV 0.88 2.72 . .
0.616Replicate F 37.473 9.6610.0001 0.4506 0.2945
1.224Replicate Prob(F) 0.0001 0.0012
24.008
16.544Treatment F 15.241 11.3030.0252 0.00030.00013.708 12.014
Treatment Prob(F) 0.0001 0.0001

116
Table 25. RiceTec Hybrid CLXL730 Nitrogen Rate Validation (Richland Parish).
Trt Rate Growth ApplNo.Rate Unit Stage Description
1 0 LB A/A 3-4 leaf Preflood 100 d 40 b 17 a 1 a 5293 c 67 a 53 b0 LB A/A PD Midseason0 LB A/A 5% heading Late Season
2 90 LB A/A 3-4 leaf Preflood 103 c 48 a 45 a 3 a 9166 a 70 a 58 a0 LB A/A PD Midseason0 LB A/A 5% heading Late Season
3 90 LB A/A 3-4 leaf Preflood 104 bc 48 a 45 a 2 a 10453 a 69 a 57 a30 LB A/A PD Midseason0 LB A/A 5% heading Late Season
4 90 LB A/A 3-4 leaf Preflood 104 bc 47 a 30 a 3 a 9275 a 70 a 59 a0 LB A/A PD Midseason
30 LB A/A 5% heading Late Season5 120 LB A/A 3-4 leaf Preflood 104 bc 48 a 20 a 3 a 9906 a 70 a 60 a
0 LB A/A PD Midseason0 LB A/A 5% heading Late Season
6 150 LB A/A 3-4 leaf Preflood 105 bc 49 a 30 a 4 a 10111 a 70 a 58 a0 LB A/A PD Midseason0 LB A/A 5% heading Late Season
7 90 LB A/A 3-4 leaf Preflood 104 bc 48 a 55 a 4 a 9937 a 70 a 57 a30 LB A/A PD Midseason30 LB A/A 5% heading Late Season
8 90 LB A/A 3-4 leaf Preflood 104 bc 47 a 15 a 3 a 9040 a 70 a 58 a0 LB A/A PD Midseason
60 LB A/A 5% heading Late Season9 120 LB A/A 3-4 leaf Preflood 105 bc 48 a 35 a 4 a 10009 a 70 a 57 a
30 LB A/A PD Midseason0 LB A/A 5% heading Late Season
10 120 LB A/A 3-4 leaf Preflood 105 b 49 a 10 a 1 a 9738 a 71 a 58 a0 LB A/A PD Midseason
30 LB A/A 5% heading Late Season11 108 a 40 b 7529 b 70 a 61 a
120 LB A/A 3-4 leaf Preflood30 LB A/A PD Midseason0 LB A/A 5% heading Late Season
Means followed by same letter do not significantly differ (P=.05, Student-Newman-Keuls)Mean comparisons performed only when AOV Treatment P(F) is significant at mean comparison OSL.
Rice Rice Rice Rice RiceRating Date 8/21/2007 8/21/2007 8/21/2007
RiceCrop Name Rice
Rating Data Type 50% Head Height Ldg-Rate Ldg-Type8/21/2007
% %Whole Mill
Rating Unit days in % 1-5Yield Total Mill
Crop Stage Main Main Main Mainlb/A
1 2.1 40.3 2.2
Main MainMain
649.62.2 2.8
Standard Deviation 0.7 1.2 21.4 1.2938LSD (P=.05)
2.167.11 1.391 1.2
CV 0.67 2.59 70.95 43.19
2.688Replicate F 76.331 2.146 0.275 0.1850.0001 0.1321 0.5256
0.433Replicate Prob(F) 0.0001 0.1431 0.7667 0.8343
14.17
21.26Treatment F 30.288 22.725 1.457 2.2880.2353 0.0070.0001
1.6 5.351Treatment Prob(F) 0.0001 0.0001 0.3033 0.1289

117
Rice Response to P Fertilization (Rice Research Station) Experiment number .......................... : 07-CM-13 Site and design ................................... : Location/Cooperator .................. : Rice Research Station (Crowley Main) Tillage type .................................. : Conventional Experimental design ................... : Randomized complete block Number of reps ........................... : 4 Plot size ........................................ : 7 x 20 ft Row width/rows per plot ............ : 7 in / 12 Soil type .............................................. : Crowley silt loam % organic matter ........................ : NA pH................................................. : 7.7 Extractable nutrients .................. : Ca-1,470; Cu-1.7; Mg-227; P-30.6; K-79.8; Na-113; S-9.4; Zn-6.8 Crop/Variety ...................................... : Rice / Cocodrie Planting method/date ................. : Drill seeded / March 20 Seeding rate/depth ...................... : 33 seeds/ft2 / 1 in Emergence date ........................... : March 28 Harvest date ................................ : August 7; Ratoon harvest, October 24 Seed treatment/cwt ............................ : Dithane (fungicide)-114 g Release (gibberellic acid)-10 g Fertilization ........................................ : 5 lb/A ZnSO4, March 20 1 qt/A Zinc Plus, May 1 150 lb N/A 46-0-0, May 2 90 lb N/A 46-0-0, August 7 Water management ........................... : Flush ............................................ : March 28, April 20 Flood ............................................ : May 3; Ratoon flood, August 8 Drain ............................................ : July 17; Ratoon drain, October 4 Pest management ............................... : Herbicides.................................... : 15 oz/A Clincher, April 23 1 gal/A Arrosolo + .75 oz/A Londax + .5 oz/A Permit, May 1 1 oz/A Londax, May 17 3 pt/A Basagran + 1 pt/A Crop oil + 4 oz/A Interlock, August 7 Insecticides .................................. : 4 oz/A Karate, May 10 4 oz/A Mustang Max, July 2 Fungicides ................................... : 21 oz/A Quilt + 6 oz/A Quadris, June 16

118
Table 26. Rice Response to P Fertilization (Rice Research Station).
Trt Treatment Rate GrowthNo.Name Rate Unit Stage
1 Triple Superphosphate 0 LB A/A ATPLAN 98 a 35 a 8197 a 0.23 2279 a 10476 a2 Triple Superphosphate 20 LB A/A ATPLAN 98 a 34 a 8358 a 0.26 2378 a 10735 a3 Triple Superphosphate 40 LB A/A ATPLAN 98 a 36 a 8323 a 0.23 2315 a 10638 a4 Triple Superphosphate 60 LB A/A ATPLAN 98 a 35 a 8301 a 0.25 2402 a 10703 a5 Triple Superphosphate 80 LB A/A ATPLAN 98 a 35 a 8699 a 0.25 2294 a 10993 a6 Triple Superphosphate 100 LB A/A ATPLAN 98 a 35 a 8365 a 0.29 2303 a 10668 a
Means followed by same letter do not significantly differ (P=.05, Student-Newman-Keuls)Mean comparisons performed only when AOV Treatment P(F) is significant at mean comparison OSL.
6.73CV . 1.99 6.68 . 13.15
1085.5Standard Deviation . 0.7 559.5 . 306.3 720.4LSD (P=.05) . 1.3 843.1 . 461.5
lb/ACrop Stage Main Main Main 2-3 leaf Ratoon TotalRating Unit days in lb/A % lb/A
10/24/2007Yield Tissue P Yield Yield
Rating Date 8/6/200750% Head
8/7/2007Rating Data Type Height
Rice Rice
3.812Replicate F 3.182
Crop Name Rice Rice Rice RiceDescription
0.2595 0.0326 0.06412.994
Replicate Prob(F) 0.08521.482
Treatment Prob(F) 0.26060.371Treatment F 1.545
0.9896 0.9490.86050.105 0.219

119
Rice Response to P Fertilization (Morehouse Parish) Experiment number .......................... : 07-MP-02 Site and design ................................... : Location/Cooperator .................. : Morehouse Parish / Don Andrews and Roland Crymes Tillage type .................................. : Spring stale Experimental design ................... : Randomized complete block Number of reps ........................... : 4 Plot size ........................................ : 7 x 20 ft Row width/rows per plot ............ : 7 in / 12 Soil type .............................................. : Perry clay % organic matter ........................ : NA pH................................................. : 6.8 Extractable nutrients .................. : Ca-2,662; Cu-2.8; Mg-821; P-21.3; K-311.9; Na-243; S-19.0; Zn-4.0 Crop/Variety ...................................... : Rice / Cocodrie Planting method/date ................. : Drill seeded / May 2 Seeding rate/depth ...................... : 33 seeds/ft2 / .75 in Emergence date ........................... : May 10 Harvest date ................................ : September 5 Seed treatment/cwt ............................ : Dithane (fungicide)-114 g Release (gibberellic acid)-10 g Zinche (40.5% Zn)-236 ml Fertilization ........................................ : 5 lb Zn/A ZnSO4, May 2 165 lb N/A 46-0-0, May 31 Water management ........................... : Flush ............................................ : May 4, May 24 Flood ............................................ : June 1 Drain ............................................ : August 24 Pest management ............................... : Herbicides.................................... : 1 qt/A Honcho Plus, May 8 4 qt/A Arrosolo + .67 lb/A Facet, May 30 15 oz/A Clincher + 1 qt/A Oil, June 8 Insecticides .................................. : 2 oz/A Karate, June 8 4 oz/A Mustang Max, July 30 Fungicides ................................... : 12 oz/A Quadris, July 30

120
Table 27. Rice Response to P Fertilization (Morehouse Parish).
Trt Treatment Rate GrowthNo. Name Rate Unit Stage
1 Triple Superphosphate 0 LB A/A ATPLAN 91 a 36 a 7665 a 0.320-0-60 Poash 45 LB A/A ATPLAN
2 Triple Superphosphate 20 LB A/A ATPLAN 91 a 37 a 7859 a 0.310-0-60 Poash 45 LB A/A ATPLAN
3 Triple Superphosphate 40 LB A/A ATPLAN 91 a 36 a 8170 a 0.340-0-60 Poash 45 LB A/A ATPLAN
4 Triple Superphosphate 60 LB A/A ATPLAN 90 a 37 a 8380 a 0.330-0-60 Poash 45 LB A/A ATPLAN
5 Triple Superphosphate 80 LB A/A ATPLAN 91 a 36 a 8217 a 0.340-0-60 Poash 45 LB A/A ATPLAN
6 Triple Superphosphate 100 LB A/A ATPLAN 91 a 37 a 8041 a 0.330-0-60 Poash 45 LB A/A ATPLAN
Means followed by same letter do not significantly differ (P=.05, Student-Newman-Keuls)Mean comparisons performed only when AOV Treatment P(F) is significant at mean comparison OSL.
Crop Name Rice Rice9/5/2007
Rating Data Type 50% Head Height
Rice RiceRating Date 9/5/2007
lb/A %Sample Size Unit
Yield Tissue-PRating Unit days in
Main 2-3 leafY-leaf
Crop Stage Main Main
733.3 .Standard Deviation 0.5 0.7LSD (P=.05) 0.7 1.3
Replicate F 1.8 6.489
6.04 .486.6 .
CV 0.5 1.97
0.5453Treatment F 1.32 0.872
0.739Replicate Prob(F) 0.1904 0.0156
0.38461.135
Treatment Prob(F) 0.3081 0.5324
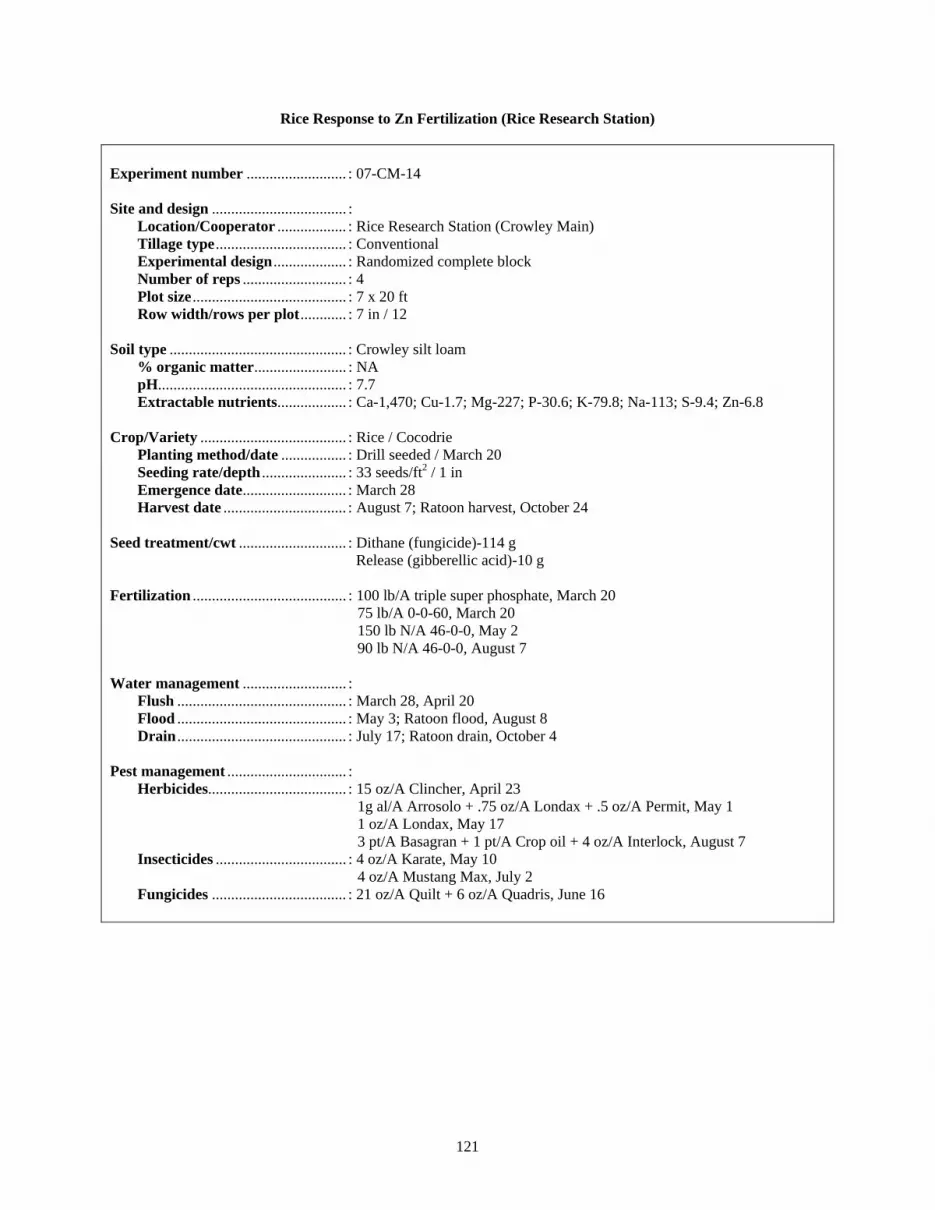
121
Rice Response to Zn Fertilization (Rice Research Station) Experiment number .......................... : 07-CM-14 Site and design ................................... : Location/Cooperator .................. : Rice Research Station (Crowley Main) Tillage type .................................. : Conventional Experimental design ................... : Randomized complete block Number of reps ........................... : 4 Plot size ........................................ : 7 x 20 ft Row width/rows per plot ............ : 7 in / 12 Soil type .............................................. : Crowley silt loam % organic matter ........................ : NA pH................................................. : 7.7 Extractable nutrients .................. : Ca-1,470; Cu-1.7; Mg-227; P-30.6; K-79.8; Na-113; S-9.4; Zn-6.8 Crop/Variety ...................................... : Rice / Cocodrie Planting method/date ................. : Drill seeded / March 20 Seeding rate/depth ...................... : 33 seeds/ft2 / 1 in Emergence date ........................... : March 28 Harvest date ................................ : August 7; Ratoon harvest, October 24 Seed treatment/cwt ............................ : Dithane (fungicide)-114 g Release (gibberellic acid)-10 g Fertilization ........................................ : 100 lb/A triple super phosphate, March 20 75 lb/A 0-0-60, March 20 150 lb N/A 46-0-0, May 2 90 lb N/A 46-0-0, August 7 Water management ........................... : Flush ............................................ : March 28, April 20 Flood ............................................ : May 3; Ratoon flood, August 8 Drain ............................................ : July 17; Ratoon drain, October 4 Pest management ............................... : Herbicides.................................... : 15 oz/A Clincher, April 23 1g al/A Arrosolo + .75 oz/A Londax + .5 oz/A Permit, May 1 1 oz/A Londax, May 17 3 pt/A Basagran + 1 pt/A Crop oil + 4 oz/A Interlock, August 7 Insecticides .................................. : 4 oz/A Karate, May 10 4 oz/A Mustang Max, July 2 Fungicides ................................... : 21 oz/A Quilt + 6 oz/A Quadris, June 16

122
Table 28. Rice Response to Zn Fertilization (Rice Research Station).
Trt Treatment Rate Growth ApplNo.Name Rate Unit Stage Description
1 Zn Sulfate 0 LB A/A ATPLAN Zinc 0.28 35 100 a 36 a 8058 a 2473 a 10530 aSulfur 10 LB A/A ATPLAN Sulfur
2 Zn Sulfate 5 LB A/A ATPLAN Zinc 0.31 52 100 a 36 a 8445 a 2610 a 11054 aSulfur 7.6 LB A/A ATPLAN Sulfur
3 Zn Sulfate 10 LB A/A ATPLAN Zinc 0.28 66 100 a 37 a 8394 a 2511 a 10905 aSulfur 5.2 LB A/A ATPLAN Sulfur
4 Zn Sulfate 15 LB A/A ATPLAN Zinc 0.14 44 101 a 36 a 8740 a 2635 a 11375 aSulfur 2.8 LB A/A ATPLAN Sulfur
5 Zn Sulfate 20 LB A/A ATPLAN Zinc 0.32 115 101 a 36 a 8089 a 2673 a 10762 aSulfur 0.4 LB A/A ATPLAN Sulfur
6 Zn Sulfate 0 LB A/A ATPLAN Zinc 0.3 36 100 a 37 a 8484 a 2689 a 11173 aSulfur 0 LB A/A ATPLAN Sulfur
Means followed by same letter do not significantly differ (P=.05, Student-Newman-Keuls)Mean comparisons performed only when AOV Treatment P(F) is significant at mean comparison OSL.
Crop Name
421.52.82 4.82. . 8.1 3.84
Rating Data TypeRating Date
403. .
Description
Rating Unit
317.2 635.1
Crop Stage Main
1 210.5LSD (P=.05) 1.1 1.9 607.3. .
Main2-3 leafSample Size Unit Y-leaf Y-leaf
Ratoon Total2-3 leaf Main
Yieldin lb/A% mg/kg lb/A lb/Adays
50% Head Height
0.6CV
YieldSulfur Zinc
Standard Deviation
8/6/2007
0.62
Rice Rice
8/7/2007 10/24/2007Yield
Rice RiceRice Rice Rice
7.204 20.047Replicate Prob(F)
0.684 12.677Replicate F 23.2860.0032 0.00010.0002 0.527 0.00020.699 2.042
Treatment Prob(F)0.084 1.638Treatment F 2.886
0.6325 0.13050.0723 0.993 0.2102

123
Rice Response to Zn Fertilization (Morehouse Parish) Experiment number .......................... : 07-MP-03 Site and design ................................... : Location/Cooperator .................. : Morehouse Parish / Don Andrews and Roland Crymes Tillage type .................................. : Spring stale Experimental design ................... : Randomized complete block Number of reps ........................... : 4 Plot size ........................................ : 7 x 20 ft Row width/rows per plot ............ : 7 in / 12 Soil type .............................................. : Perry clay % organic matter ........................ : NA pH................................................. : 6.8 Extractable nutrients .................. : Ca-2,662; Cu-2.8; Mg-821; P-21.3; K-311.9; Na-243; S-19.0; Zn-4.0 Crop/Variety ...................................... : Rice / Cocodrie Planting method/date ................. : Drill seeded / May 2 Seeding rate/depth ...................... : 33 seeds/ft2 / .75 in Emergence date ........................... : May 10 Harvest date ................................ : September 6 Seed treatment/cwt ............................ : Dithane (fungicide)-114 g Release (gibberellic acid)-10 g Zinche (40.5% Zn)-236 ml Fertilization ........................................ : 100 lb/A triple super phosphate, May 2 75 lb/A 0-0-60, May 2 165 lb N/A 46-0-0, May 31 Water management ........................... : Flush ............................................ : May 4, May 24 Flood ............................................ : June 1 Drain ............................................ : August 24 Pest management ............................... : Herbicides.................................... : 1 qt/A Honcho Plus, May 8 4 qt/A Arrosolo + .67 lb/A Facet, May 30 15 oz/A Clincher + 1 qt/A Oil, June 8 Insecticides .................................. : 2 oz/A Karate, June 8 4 oz/A Mustang Max, July 30 Fungicides ................................... : 12 oz/A Quadris, July 30

124
Table 29. Rice Response to Zn Fertilization (Morehouse Parish).
Trt Treatment Rate Growth ApplNo.Name Rate Unit Stage Description
1 Zn Sulfate 0 LB A/A ATPLAN Zinc 91 a 6 c 37 a 8163 a 53Sulfur 10 LB A/A ATPLAN Sulfur
2 Zn Sulfate 5 LB A/A ATPLAN Zinc 90 a 7 b 38 a 8008 a 55Sulfur 7.6 LB A/A ATPLAN Sulfur
3 Zn Sulfate 10 LB A/A ATPLAN Zinc 90 a 7 a 38 a 8127 a 61Sulfur 5.2 LB A/A ATPLAN Sulfur
4 Zn Sulfate 15 LB A/A ATPLAN Zinc 91 a 7 a 38 a 8346 a 124Sulfur 2.8 LB A/A ATPLAN Sulfur
5 Zn Sulfate 20 LB A/A ATPLAN Zinc 90 a 7 a 38 a 8184 a 63Sulfur 0.4 LB A/A ATPLAN Sulfur
6 Zn Sulfate 0 LB A/A ATPLAN Zinc 90 a 6 c 38 a 8327 a 64Sulfur 0 LB A/A ATPLAN Sulfur
Means followed by same letter do not significantly differ (P=.05, Student-Newman-Keuls)Mean comparisons performed only when AOV Treatment P(F) is significant at mean comparison OSL.
Rating Date 5/30/2007 9/5/2007Crop Name Rice Rice Rice
Height Height9/5/2007
Rice Rice
lb/A ppmYield Tissue-Zn
Rating Unit days in inRating Data Type 50% Head
Crop Stage Main 2-3 leaf MainSample Size Unit
0.4 0.9
Main 2-3 leafY-Leaf
376 .566.6 .
Standard Deviation 0.5 0.2 0.5LSD (P=.05) 0.7
4.59 .CV 0.52 3.2 1.34
Replicate Prob(F) 0.1286 0.3875 0.0492Replicate F 2.215 1.044 4.13
22.298 0.7390.6556
0.55
0.79970.46
Treatment Prob(F) 0.135 0.0001 0.6113Treatment F 2.013

125
Rice Response to Zn Fertilization Rate and Source (Vermilion Parish) Experiment number .......................... : C Richard Zn Study 2007 Site and design ................................... : Location/Cooperator .................. : Vermilion Parish / C. Richard Tillage type .................................. : Stale seedbed Experimental design ................... : Randomized complete block Number of reps ........................... : 4 Plot size ........................................ : 10 x 20 ft Row width/rows per plot ............ : 7 in Soil type .............................................. : % organic matter ........................ : NA pH................................................. : 7.6 Extractable nutrients-ppm......... : Ca-2,047; Cu-1.2; Mg-790; P-4.7; K-146.5; Na-174; S-6.4; Zn-0.5 Crop/Variety ...................................... : Rice / RiceTec Clearfield Hybrid Blend Planting method/date ................. : Drill Seeding rate/depth ...................... : approx ¾ in Emergence date ........................... : Harvest date ................................ : August 15 Fertilization ...................................... : 225 lb/A 0-18-36 20 lb/A sulfur 5 lb/A Zn

126
Table 30. Rice Response to Zn Fertilization Rate and Source (Vermilion Parish).
Trt Treatment Rate GrowthNo. Name Rate Unit Stage
1 Zn Sulfate 0 LB A/A 2-leaf 20.31 a 47 a 23 a 1 a 7679 aSulfur 15 LB A/A 2-leaf
2 Zn Sulfate 5 LB A/A 2-leaf 18.44 a 45 a 26 a 3 a 8021 aSulfur 12.6 LB A/A 2-leaf
3 Zn Sulfate 10 LB A/A 2-leaf 19 a 46 a 35 a 3 a 7674 aSulfur 10.2 LB A/A 2-leaf
4 Zn Sulfate 15 LB A/A 2-leaf 19.06 a 46 a 33 a 2 a 8263 aSulfur 7.8 LB A/A 2-leaf
5 Zn Sulfate 20 LB A/A 2-leaf 20.88 a 46 a 9 a 2 a 8234 aSulfur 5.4 LB A/A 2-leaf
6 Zn Sulfate 0 LB A/A 2-leaf 19.69 a 46 a 38 a 3 a 7835 aSulfur 0 LB A/A 2-leaf
7 Lignosulfonate (Ruffin-Tuff) 5 LB A/A 2-leaf 19.69 a 47 a 23 a 2 a 8435 aSulfur 11.5 LB A/A 2-leaf
8 Lignosulfonate (Ruffin-Tuff) 10 LB A/A 2-leaf 19.5 a 47 a 43 a 2 a 8548 aSulfur 8 LB A/A 2-leaf
9 Lignosulfonate (Ruffin-Tuff) 15 LB A/A 2-leaf 19.31 a 47 a 28 a 3 a 7847 aSulfur 4.5 LB A/A 2-leaf
10 Lignosulfonate (Ruffin-Tuff) 20 LB A/A 2-leaf 19.88 a 46 a 28 a 3 a 7611 aSulfur 1 LB A/A 2-leaf
11 Zinc Plus (ZnSO4 Foliar) 0.266 LB A/A 2-leaf 19.63 a 46 a 10 a 1 a 7483 a
Means followed by same letter do not significantly differ (P=.05, Student-Newman-Keuls)Mean comparisons performed only when AOV Treatment P(F) is significant at mean comparison OSL.
Rice RiceRating Date 5/14/2007 8/15/2007 8/15/2007 8/15/2007Crop Name Rice Rice Rice
8/15/2007Rating Data Type height Height Ldg-Rate Ldg-Type YieldRating Unit cm in % 1-5
1.5
Mainlb/A
Crop Stage 2-tiller Main Main Main
799.3Standard Deviation 1.479 1.8 19.4 1LSD (P=.05) 2.136 2.6 28
5.449
6.9549.8
CV 7.56 3.92 72.86 47.6
2.495Replicate Prob(F) 0.0222 0.0009 0.0013 0.0041Replicate F 3.705 7.141 6.707
0.0821Treatment F 0.788 0.511 1.179 2.275
0.13591.693
Treatment Prob(F) 0.6398 0.8685 0.3425 0.04

127
Evaluation of Urea, Agrotain-Treated Urea, and 43G at Two Application Timings Experiment number .......................... : 07-CM-25 Site and design ................................... : Location/Cooperator .................. : Rice Research Station (Crowley Main) Tillage type .................................. : Conventional Experimental design ................... : Randomized complete block Number of reps ........................... : 4 Plot size ........................................ : 7 x 20 ft Row width/rows per plot ............ : 7 in / 12 Soil type .............................................. : Crowley silt loam % organic matter ........................ : NA pH................................................. : 7.7 Extractable nutrients .................. : Ca-1,470; Cu-1.7; Mg-227; P-30.6; K-79.8; Na-113; S-9.4; Zn-6.8 Crop/Variety ...................................... : Rice / Cocodrie Planting method/date ................. : Drill seeded / March 20 Seeding rate/depth ...................... : 75 lb/A / 1 in Emergence date ........................... : March 28 Harvest date ................................ : August 7; Ratoon harvest, October 24 Seed treatment/cwt ............................ : Dithane (fungicide)-114 g Release (gibberellic acid)-10 g Zinche (40.5% Zn)-236 ml Fertilization ........................................ : 195 lb/A 0-24-24-2.5, March 20 1 qt/A Zinc Plus, May 1 90 lb N/A 46-0-0, August 7 Water management ........................... : Flush ............................................ : March 28, April 20 Flood ............................................ : May 3; Ratoon flood, August 8 Drain ............................................ : July 17; Ratoon drain, October 4 Pest management ............................... : Herbicides.................................... : 15 oz/A Clincher, April 23 1 gal/A Arrosolo + .75 oz/A Londax + .5 oz/A Permit, May 1 1 oz/A Londax, May 17 3 pt/A Basagran + 1 pt/A Crop oil + 4 oz/A Interlock, August 7 Insecticides .................................. : 4 oz/A Karate, May 10 4 oz/A Mustang Max, July 2 Fungicides ................................... : 21 oz/A Quilt + 6 oz/A Quadris, June 16
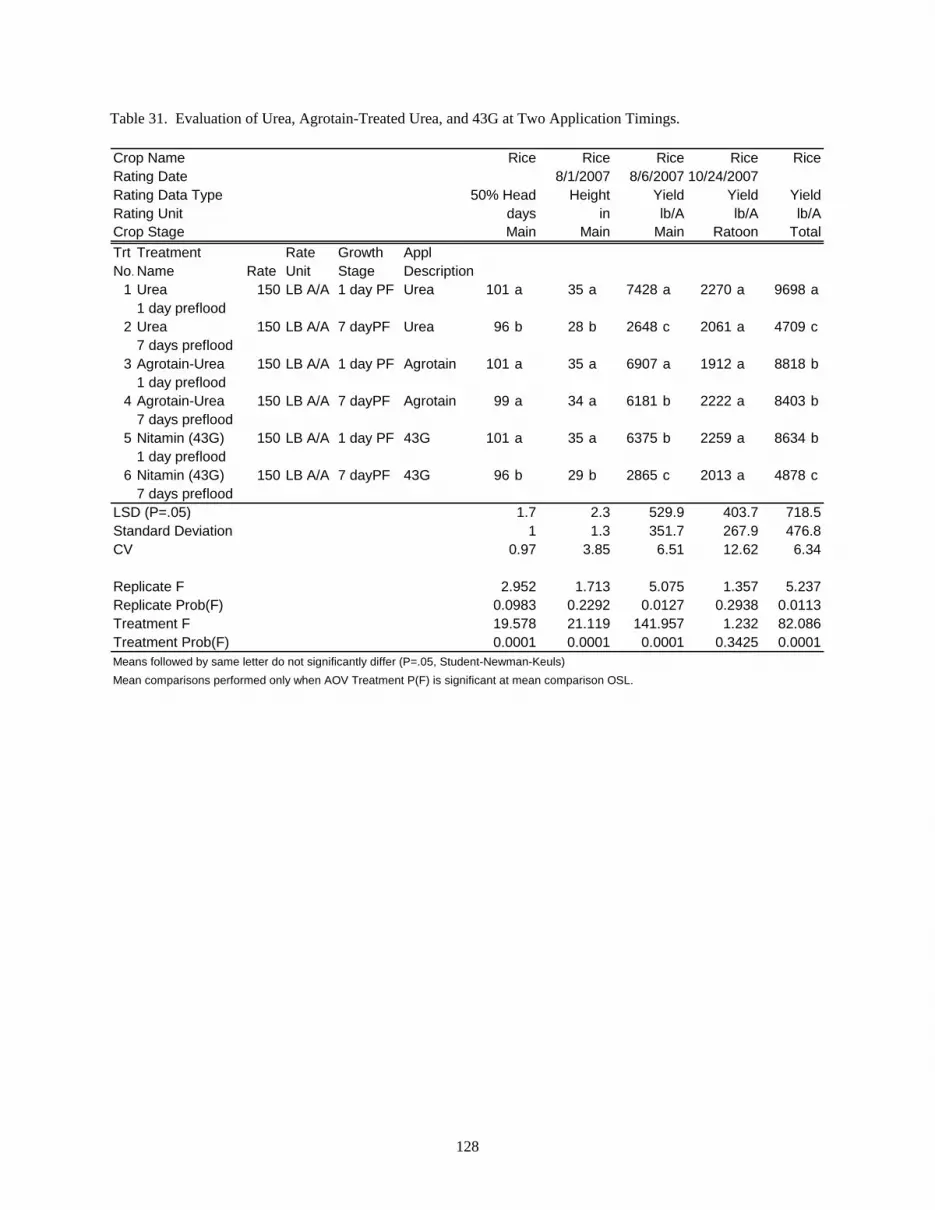
128
Table 31. Evaluation of Urea, Agrotain-Treated Urea, and 43G at Two Application Timings.
Trt Treatment Rate Growth ApplNo.Name Rate Unit Stage Description
1 Urea 150 LB A/A 1 day PF Urea 101 a 35 a 7428 a 2270 a 9698 a1 day preflood
2 Urea 150 LB A/A 7 dayPF Urea 96 b 28 b 2648 c 2061 a 4709 c7 days preflood
3 Agrotain-Urea 150 LB A/A 1 day PF Agrotain 101 a 35 a 6907 a 1912 a 8818 b1 day preflood
4 Agrotain-Urea 150 LB A/A 7 dayPF Agrotain 99 a 34 a 6181 b 2222 a 8403 b7 days preflood
5 Nitamin (43G) 150 LB A/A 1 day PF 43G 101 a 35 a 6375 b 2259 a 8634 b1 day preflood
6 Nitamin (43G) 150 LB A/A 7 dayPF 43G 96 b 29 b 2865 c 2013 a 4878 c7 days preflood
Means followed by same letter do not significantly differ (P=.05, Student-Newman-Keuls)Mean comparisons performed only when AOV Treatment P(F) is significant at mean comparison OSL.
Rice Rice RiceCrop Name Rice Rice8/6/2007 10/24/2007Rating Date 8/1/2007
Yield Yield YieldRating Data Type 50% Head Heightlb/A lb/A lb/ARating Unit days in
Main Ratoon TotalCrop Stage Main Main
529.9 403.7 718.5LSD (P=.05) 1.7 2.3351.7 267.9 476.8Standard Deviation 1 1.36.51 12.62 6.34CV 0.97 3.85
5.075 1.357 5.237Replicate F 2.952 1.7130.0127 0.2938 0.0113Replicate Prob(F) 0.0983 0.2292
141.957 1.232 82.086Treatment F 19.578 21.1190.0001 0.3425 0.0001Treatment Prob(F) 0.0001 0.0001

129
Evaluation of Two Liquid N Fertilizers for Midseason Application Experiment number .......................... : 07-CM-26 Site and design ................................... : Location/Cooperator .................. : Rice Research Station (Crowley Main) Tillage type .................................. : Conventional Experimental design ................... : Randomized complete block Number of reps ........................... : 4 Plot size ........................................ : 7 x 20 ft Row width/rows per plot ............ : 7 in / 12 Soil type .............................................. : Crowley silt loam % organic matter ........................ : NA pH................................................. : 7.7 Extractable nutrients .................. : Ca-1,470; Cu-1.7; Mg-227; P-30.6; K-79.8; Na-113; S-9.4; Zn-6.8 Crop/Variety ...................................... : Rice / Cocodrie Planting method/date ................. : Drill seeded / March 20 Seeding rate/depth ...................... : 75 lb/A / 1 in Emergence date ........................... : March 28 Harvest date ................................ : August 7; Ratoon harvest, October 24 Seed treatment/cwt ............................ : Dithane (fungicide)-114 g Release (gibberellic acid)-10 g Zinche (40.5% Zn)-236 ml Fertilization ........................................ : 195 lb/A 0-24-24-2.5, March 20 1 qt /A Zinc Plus, May 1 90 lb N/A 46-0-0, August 7 Water management ........................... : Flush ............................................ : March 28, April 20 Flood ............................................ : May 3; Ratoon flood, August 8 Drain ............................................ : July 17; Ratoon drain, October 4 Pest management ............................... : Herbicides.................................... : 15oz/A Clincher, April 23 1 gal/A Arrosolo + .75 oz/A Londax + .5 oz/A Permit, May 1 1 oz/A Londax, May 17 3 pt/A Basagran + 1 pt/A Crop oil + 4 oz/A Interlock, August 7 Insecticides .................................. : 4 oz/A Karate, May 10 4 oz/A Mustang Max, July 2 Fungicides ................................... : 21 oz/A Quilt + 6 oz/A Quadris, June 16

130
Table 32. Evaluation of Two Liquid N Fertilizers for Midseason Application.
Trt Treatment Rate Growth ApplNo. Name Rate Unit Stage Description
1 25-0-0 45 LB A/A PD Midseason 99 a 33 a 6410 b 2913 a 9323 bUREA 105 LB A/A 2- to 3-leaf Preflood
2 30-0-0 45 LB A/A PD Midseason 98 a 33 a 6768 b 2841 a 9609 bUREA 105 LB A/A 2- to 3-leaf Preflood
3 Urea 45 LB A/A PD Midseason 98 a 34 a 7523 a 2620 a 10142 aUREA 105 LB A/A 2- to 3-leaf Preflood
Means followed by same letter do not significantly differ (P=.05, Student-Newman-Keuls)Mean comparisons performed only when AOV Treatment P(F) is significant at mean comparison OSL.
Rice Rice RiceCrop Name Rice Rice8/6/2007 10/24/2007Rating Date 8/1/2007
Yield Yield YieldRating Data Type 50% Head Heightlb/A lb/A lb/ARating Unit Days IN
Main Ratoon TotalCrop Stage Main Main
387.7 274.6 440.2LSD (P=.05) 0.8 3.2224.1 158.7 254.4Standard Deviation 0.3 1.43.25 5.69 2.63CV 0.34 4.2
13.347 0.902 10.731Replicate F 16 1.50.0046 0.4934 0.008Replicate Prob(F) 0.0123 0.326525.705 3.722 10.68Treatment F 1 0.50.0011 0.0889 0.0105Treatment Prob(F) 0.4444 0.64

131
Rice Response to the Humic Acid Product HydraHume Experiment number .......................... : 07-MP-04 Site and design ................................... : Location/Cooperator .................. : Morehouse Parish / Don Andrews and Roland Crymes Tillage type .................................. : Spring stale Experimental design ................... : Randomized complete block Number of reps ........................... : 4 Plot size ........................................ : 7 x 20 ft Row width/rows per plot ............ : 7 in / 12 Soil type .............................................. : Perry clay % organic matter ........................ : NA pH................................................. : 6.8 Extractable nutrients .................. : Ca-2,662; Cu-2.8; Mg-821; P-21.3; K-311.9; Na-243; S-19.0; Zn-4.0 Crop/Variety ...................................... : Rice / Cocodrie Planting method/date ................. : Drill seeded / May 2 Seeding rate/depth ...................... : 33 seeds/ft2 / .75 in Emergence date ........................... : May 10 Harvest date ................................ : September 6 Seed treatment/cwt ............................ : Dithane (fungicide)-114 g Release (gibberellic acid)-10 g Zinche (40.5% Zn)-236 ml Fertilization ........................................ : 165 lb N/A 46-0-0, May 31 Water management ........................... : Flush ............................................ : May 4, May 24 Flood ............................................ : June 1 Drain ............................................ : August 24 Pest management ............................... : Herbicides.................................... : 1 qt/A Honcho Plus, May 8 4 qt/A Arrosolo + .67 lb/A Facet, May 30 15 oz/A Clincher + 1 qt/A Oil, June 8 Insecticides .................................. : 2 oz/A Karate, June 8 4 oz/A Mustang Max, July 30 Fungicides ................................... : 12 oz/A Quadris, July 30

132
Table 33. Rice Response to the Humic Acid Product HydraHume.
Trt Treatment Rate GrowthNo. Name Rate Unit Stage
1 0 lb/A HudraHume 0 LB/A ATPLAN 92 a 90 a 37 a 8174 a0 lb/A 0-24-24 0 LB/A ATPLAN
2 0 lb/A HudraHume 0 LB/A ATPLAN 92 a 89 a 38 a 8231 a250 lb/A 0-24-24 250 LB/A ATPLAN
3 10 lb/A HydraHume 10 LB/A ATPLAN 91 a 98 a 38 a 8274 a0 lb/A 0-24-24 0 LB/A ATPLAN
4 10 lb/A HydraHume 10 LB/A ATPLAN 92 a 94 a 38 a 7857 a250 lb/A 0-24-24 250 LB/A ATPLAN
5 40 lb/A HydraHume 40 LB/A ATPLAN 92 a 94 a 37 a 8463 a0 lb/A 0-24-24 0 LB/A ATPLAN
6 40 lb/A HydraHume 40 LB/A ATPLAN 92 a 98 a 38 a 8179 a250 lb/A 0-24-24 250 LB/A ATPLAN
Means followed by same letter do not significantly differ (P=.05, Student-Newman-Keuls)Mean comparisons performed only when AOV Treatment P(F) is significant at mean comparison OSL.
Crop Name Rice Rice Rice9/6/2007
Rating Data Type 50% Head Height Height
RiceRating Date 5/30/2007 9/6/2007
YieldRating Unit days mm in lb/A
LSD (P=.05) 0.7 15.2 1 437.5
MainCrop Stage Main 2-3 leaf Main
3.54290.4
CV 0.54 6.33 1.5Standard Deviation 0.5 5.9 0.6
1.844
5.354Replicate Prob(F) 0.2424 0.4451 0.0035Replicate F 1.552 0.686 10.517
0.1645Treatment Prob(F) 0.6158 0.6266 0.4651
0.0104Treatment F 0.724 0.738 1

133
Evaluation of Liquid Starter N Fertilizers in a Clearfield System Experiment number .......................... : 07-MP-05 and 07-MP-06 Site and design ................................... : Location/Cooperator .................. : Morehouse Parish / Don Andrews and Roland Crymes Tillage type .................................. : Spring stale Experimental design ................... : Randomized complete block Number of reps ........................... : 4 Plot size ........................................ : 7 x 20 ft Row width/rows per plot ............ : 7 in / 12 Soil type .............................................. : Perry clay % organic matter ........................ : NA pH................................................. : 6.8 Extractable nutrients .................. : Ca-2,662; Cu-2.8; Mg-821; P-21.3; K-311.9; Na-243; S-19.0; Zn-4.0 Crop/Variety ...................................... : Rice / CL171AR Planting method/date ................. : Drill seeded / May 2 Seeding rate/depth ...................... : 14 seeds/ft2 / .75 in Emergence date ........................... : May 11 Harvest date ................................ : September 6 Seed treatment/cwt ............................ : NA Fertilization ........................................ : NA Water management ........................... : Flush ............................................ : May 4, May 24 Flood ............................................ : June 1 Drain ............................................ : August 24 Pest management ............................... : Herbicides.................................... : 1 qt/A Honcho Plus, May 8 4 qt/A Arrosolo + .67 lb/A Facet, May 30 15 oz/A Clincher + 1 qt/A Oil, June 8 Insecticides .................................. : 2 oz/A Karate, June 8 4 oz/A Mustang Max, July 30 Fungicides ................................... : 12 oz/A Quadris, July 30

134
Table 34. Evaluation of Liquid Starter N Fertilizers in a Clearfield System – CL171.
Trt Treatment Rate GrowNo.Name Rate Unit Stg
1 Amm. Sulfate-Gr 10 LB A/A planting 177 a 93 a 40 a 6641 aUREA 150 LB A/A PF
2 Amm. Thiosulfate-L 10 LB A/A 1-2 leaf 172 ab 93 a 40 a 6782 aUREA 150 LB A/A PF
3 Amm. Sulfate-Gr 20 LB A/A planting 163 ab 93 a 40 a 6652 aUREA 150 LB A/A PF
4 Amm. Thiosulfate-L 20 LB A/A 1-2 leaf 178 a 93 a 39 a 6883 aUREA 150 LB A/A PF
5 DAP 10 LB A/A planting 180 a 93 a 40 a 6611 aUREA 150 LB A/A PF
6 APS 10 LB A/A 1-2 leaf 150 b 93 a 39 a 6447 aUREA 150 LB A/A PF
7 DAP 20 LB A/A planting 179 a 92 a 39 a 6818 aUREA 150 LB A/A PF
8 APS 20 LB A/A 1-2 leaf 163 ab 93 a 39 a 6617 aUREA 150 LB A/A PF
9 UTC 148 b 93 a 39 a 6463 aUREA 150 LB A/A PF
Means followed by same letter do not significantly differ (P=.05, Student-Newman-Keuls).Mean comparisons performed only when AOV Treatment P(F) is significant at mean comparison OSL.
CL171Rating Data Type 50% HeadHeight HeightCrop Variety CL171CL171 CL171
Yield
514.8
Rating Unit daysmm in lb/A
Main9/6/2007
Crop Stage
LSD (P=.05) 117.7 0.9
MainRating Date 5/30/2007 9/6/2007
2-3 leaf
5.29351.9
CV 0.756.07 1.27Standard Deviation 0.710.2 0.5
1.546Replicate Prob(F) 0.05420.3722 0.039 0.2296Replicate F 2.9461.057 4
0.67090.722
Treatment Prob(F) 0.6790.006 0.2963Treatment F 0.7124.496 1.333

135
Table 35. Evaluation of Liquid Starter N Fertilizers in a Clearfield System-CLXL730.
Trt Treatment Rate GrowNo. Name Rate Unit Stg
1 Amm. Sulfate-Gr 10 LB A/A planting 170 a 93 a 50 a 10484 aUREA 150 LB A/A PF
2 Amm. Thiosulfate-L 10 LB A/A 1-2 leaf 171 a 92 a 49 a 10591 aUREA 150 LB A/A PF
3 Amm. Sulfate-Gr 20 LB A/A planting 164 a 92 a 49 a 10630 aUREA 150 LB A/A PF
4 Amm. Thiosulfate-L 20 LB A/A 1-2 leaf 169 a 92 a 50 a 10470 aUREA 150 LB A/A PF
5 DAP 10 LB A/A planting 170 a 93 a 50 a 10721 aUREA 150 LB A/A PF
6 APS 10 LB A/A 1-2 leaf 157 a 92 a 49 a 10532 aUREA 150 LB A/A PF
7 DAP 20 LB A/A planting 161 a 92 a 50 a 10595 aUREA 150 LB A/A PF
8 APS 20 LB A/A 1-2 leaf 164 a 92 a 49 a 10788 aUREA 150 LB A/A PF
9 UTC 160 a 92 a 50 a 10544 aUREA 150 LB A/A PF
Means followed by same letter do not significantly differ (P=.05, Student-Newman-Keuls).Mean comparisons performed only when AOV Treatment P(F) is significant at mean comparison OSL.
Rating Data Type 50% HeadHeight Height YieldCrop Variety CLXL730 CLXL730 CLXL730 CLXL730
430.8
Rating Unit daysmm in lb/A
Main9/6/2007
Crop Stage
LSD (P=.05) 0.718.5 1.5
MainRating Date 5/30/2007 9/6/2007
2-3 leaf
2.79295.2
CV 0.536.49 1.78Standard Deviation 0.510.7 0.9
13.005Replicate Prob(F) 0.00410.0059 0.5758 0.0001Replicate F 5.7657.182 0.571
0.83460.513
Treatment Prob(F) 0.26630.6973 0.6491Treatment F 1.3530.687 0.75

136
Evaluating Nondestructive Measurements to Predict Midseason N Needs for Cocodrie Rice
Experiment number .......................... : 07-CM-27 Site and design ................................... : Location/Cooperator .................. : Rice Research Station (Crowley Main) Tillage type .................................. : Conventional Experimental design ................... : Randomized complete block Number of reps ........................... : 4 Plot size ........................................ : 7 x 20 ft Row width/rows per plot ............ : 7 in / 12 Soil type .............................................. : Crowley silt loam % organic matter ........................ : NA pH................................................. : 7.1 Extractable nutrients .................. : Ca-1,243; Cu-1.7; Mg-230; P-16.8; K-80.4; Na-89.6; S-6.7; Zn-7.3 Crop/Variety ...................................... : Rice / Cocodrie Planting method/date ................. : Drill seeded / March 20 Seeding rate/depth ...................... : 40 seeds/ft2 / 1 in Emergence date ........................... : March 28 Harvest date ................................ : August 6 Seed treatment/cwt ............................ : Dithane (fungicide)-114 g Release (gibberellic acid)-10 g Zinche (40.5% Zn)-236 ml Fertilization ........................................ : 195 lb/A 0-24-24-2.5, March 20 1 qt /A Zinc Plus, May 1 Water management ........................... : Flush ............................................ : March 28, April 20 Flood ............................................ : May 3 Drain ............................................ : July 17 Pest management ............................... : Herbicides.................................... : 15 oz/A Clincher, April 23 1 gal/A Arrosolo + .75 oz/A Londax + .5 oz/A Permit, May 1 1 oz/A Londax, May 17 Insecticides .................................. : 4 oz/A Karate, May 10 4 oz/A Mustang Max, July 2 Fungicides ................................... : 21 oz/A Quilt + 6 oz/A Quadris, June 16

137
Table 36. Evaluating nondestructive measurements to predict midseason N needs for Cocodrie rice. (Only agronomic response data shown.)
Trt Rate Growth ApplNo. Rate Unit Stage Description
1 0 LB A/A 3- to 4-leaf Preflood N 0.95 e 0.94 b 95 de 28 gh 2129 f0 LB A/A PD Midseason N
2 0 LB A/A 3- to 4-leaf Preflood N 0.98 b 94 ef 27 h 3375 e60 LB A/A PD Midseason N
3 30 LB A/A 3- to 4-leaf Preflood N 1.08 de 0.88 b 94 f 30 g 3765 e0 LB A/A PD Midseason N
4 30 LB A/A 3- to 4-leaf Preflood N 0.86 b 94 ef 32 f 5169 d60 LB A/A PD Midseason N
5 60 LB A/A 3- to 4-leaf Preflood N 1.4 cd 0.89 b 95 de 32 ef 6447 c0 LB A/A PD Midseason N
6 60 LB A/A 3- to 4-leaf Preflood N 0.98 b 96 d 33 def 7099 bc60 LB A/A PD Midseason N
7 90 LB A/A 3- to 4-leaf Preflood N 1.68 bc 0.95 b 96 bcd 33 def 7251 bc0 LB A/A PD Midseason N
8 90 LB A/A 3- to 4-leaf Preflood N 0.96 b 96 cd 35 cd 8026 ab60 LB A/A PD Midseason N
9 120 LB A/A 3- to 4-leaf Preflood N 1.94 ab 1.05 b 97 bcd 34 cde 8191 ab0 LB A/A PD Midseason N
10 120 LB A/A 3- to 4-leaf Preflood N 1.02 b 97 bc 38 ab 9022 a60 LB A/A PD Midseason N
11 150 LB A/A 3- to 4-leaf Preflood N 2.08 a 1.06 b 97 b 36 bc 9031 a0 LB A/A PD Midseason N
12 150 LB A/A 3- to 4-leaf Preflood N 1.27 a 98 a 39 a 8996 a60 LB A/A PD Midseason N
Means followed by same letter do not significantly differ (P=.05, Student-Newman-Keuls)Mean comparisons performed only when AOV Treatment P(F) is significant at mean comparison OSL.
RiceRating Date 6/7/2007
Rice Rice RiceCrop Name Rice8/6/2007
Rating Data Type Tissue-N8/1/2007
lb/A% days inYield
Rating Unit %Tissue-N 50% Head Height
Main50% Head Main MainCrop Stage PD
837.5Standard Deviation 0.211
0.158 0.9 1.8LSD (P=.05) 0.317
8.8711.08 0.56 3.29580
CV 13.850.109 0.5 1.1
1.631Replicate Prob(F) 0.8584
1.691 3.018 2.85Replicate F 0.2520.201
Treatment F 18.9150.1879 0.0695 0.0793
0.00010.001 0.0001 0.000168.328
Treatment Prob(F) 0.00013.997 18.336 33.396

138
Ratoon Response of Rice Hybrids to Main-Crop Stubble Manipulation 3.1 Experiment number .......................... : 07-CM-21 Site and design ................................... : Location/Cooperator .................. : Rice Research Station (Crowley Main) Tillage type .................................. : Conventional Experimental design ................... : Randomized complete block Number of reps ........................... : 4 Plot size ........................................ : 7 x 25 ft Row width/rows per plot ............ : 7 in / 12 Soil type .............................................. : Crowley silt loam % organic matter ........................ : NA pH................................................. : 7.1 Extractable nutrients .................. : Ca-1,102; Cu-1.7; Mg-231; P-11.6; K-82.2; Na-97.8; S-7.4; Zn-7.2 Crop/Variety ...................................... : Rice / CLXL729, XP723 Planting method/date ................. : Drill seeded / March 19 Seeding rate/depth ...................... : 14 seeds/ft2 / 1 in Emergence date ........................... : March 27 Harvest date ................................ : July 26; Ratoon harvest, October 16 Seed treatment/cwt : Fertilization ........................................ : 195 lb/A 0-24-24-2.5, March 19 1 qt/A Zinc Plus, May 1 150 lb N/A 46-0-0, May 2 90 lb N/A 46-0-0, July 26 Water management ........................... : Flush ............................................ : March 29, April 20 Flood ............................................ : May 3; Ratoon flood, July 27 Drain ............................................ : July 12; Ratoon drain, October 4 Pest management ............................... : Herbicides.................................... : 15 oz/A Clincher, April 23 1 gal/A Arrosolo + .75 oz/A Londax + .5 oz/A Permit, May 1 1 oz/A Londax, May 17 3 pt/A Basagran + 1 pt/A Crop oil + 4 oz/A Interlock, July 26 Insecticides .................................. : 4 oz/A Karate, May10 4 oz/A Mustang Max, July 2 Fungicides ................................... : 21 oz/A Quilt + 6 oz/A Quadris, June 16

139
Table 37. Ratoon Response of Rice Hybrids to Main-Crop Stubble Manipulation 3.1.
Trt TreatmentNo.Name
1 Standard Height 97 a 37 a 31 d 4295 aCLXL729
2 12-inch cutting height 97 ab 37 a 32 cd 3753 abCLXL729
3 flail-mowed 96 ab 36 a 36 b 4157 aCLXL729
4 rolled 96 ab 36 a 50 a 3453 abCLXL729
5 Standard Height 96 ab 40 a 31 d 2761 bXP723
6 12-inch cutting height 96 ab 40 a 33 c 3555 abXP723
7 flail-mowed 95 ab 37 a 36 b 3778 abXP723
8 rolled 94 b 36 a 49 a 2845 bXP723
Means followed by same letter do not significantly differ (P=.05, Student-Newman-Keuls)Mean comparisons performed only when AOV Treatment P(F) is significant at mean comparison OSL.
0.01013.688
Treatment Prob(F) 0.0487 0.0224 0.0001Treatment F 2.786 3.482 260.696
0.967Replicate Prob(F) 0.2376 0.614 0.3091 0.4276Replicate F 1.595 0.505 1.278
16.11575.9
CV 1.18 4.08 2.22
849.5Standard Deviation 1.1 1.5 0.8LSD (P=.05) 2 2.7 1.4
RatoonCrop Stage Main Main Ratoon
YieldRating Unit days in days lb/A
10/16/2007Rating Data Type 50% Head Height 50% Head
RiceRating Date 7/23/2007Crop Name Rice Rice Rice

140
Ratoon Response of Rice Varieties to Main-Crop Stubble Manipulation 3.1 Experiment number .......................... : 07-CM-22 Site and design ................................... : Location/Cooperator .................. : Rice Research Station (Crowley Main) Tillage type .................................. : Conventional Experimental design ................... : Randomized complete block Number of reps ........................... : 4 Plot size ........................................ : 7 x 25 ft Row width/rows per plot ............ : 7 in / 12 Soil type .............................................. : Crowley silt loam % organic matter ........................ : NA pH................................................. : 7.1 Extractable nutrients .................. : Ca-1,102; Cu-1.7; Mg-231; P-11.6; K-82.2; Na-97.8; S-7.4; Zn-7.2 Crop/Variety ...................................... : Rice / Cocodrie, Trenasse Planting method/date ................. : Drill seeded / March 19 Seeding rate/depth ...................... : 33 seeds/ft2 / 1 in Emergence date ........................... : Cocodrie, March 26; Trenasse, March 28 Harvest date ................................ : July 26; Ratoon harvest, October 16 Seed treatment/cwt ............................ : Dithane (fungicide)-114 g Release (gibberellic acid)-10 g Zinche (40.5% Zn)-236 ml Fertilization ........................................ : 195 lb/A 0-24-24-2.5, March 19 1 qt/A Zinc Plus, May 1 150 lb N/A 46-0-0, May 2 90 lb N/A 46-0-0, July 26 Water management ........................... : Flush ............................................ : March 29, April 20 Flood ............................................ : May 3; Ratoon flood, July 27 Drain ............................................ : July 12; Ratoon drain, October 4 Pest management ............................... : Herbicides.................................... : 15 oz/A Clincher, April 23 1 gal/A Arrosolo + .75 oz/A Londax + .5 oz/A Permit, May 1 1 oz/A Londax, May 17 3 pt/A Basagran + 1 pt/A Crop oil + 4 oz/A Interlock, July 26 Insecticides .................................. : 4 oz/A Karate, May 10 4 oz/A Mustang Max, July 2 Fungicides ................................... : 21 oz/A Quilt + 6 oz/A Quadris, June 16

141
Table 38. Ratoon Response of Rice Varieties to Main-Crop Stubble Manipulation 3.1.
Trt TreatmentNo. Name
1 Standard Height 95 ab 29 a 36 f 2324 abCocodrie
2 12-inch cutting height 95 a 30 a 40 e 2331 abCocodrie
3 flail-mowed 94 ab 29 a 42 c 2182 abCocodrie
4 rolled 94 ab 27 a 50 a 2052 abCocodrie
5 Standard Height 93 b 29 a 36 f 2708 aTrenasse
6 12-inch cutting height 93 b 30 a 36 f 2251 abTrenasse
7 flail-mowed 93 b 29 a 41 d 2328 abTrenasse
8 rolled 94 ab 30 a 46 b 1710 bTrenasse
Means followed by same letter do not significantly differ (P=.05, Student-Newman-Keuls)Mean comparisons performed only when AOV Treatment P(F) is significant at mean compar
0.01213.494
Treatment Prob(F) 0.0102 0.565 1.0Treatment F 4.262 0.851 0.0
3.058Replicate Prob(F) 0.9346 0.7039 1.0 0.0507Replicate F 0.068 0.36 0.0
13.56303.1
CV 0.83 6.07 0.0
445.8Standard Deviation 0.8 1.8 0.0LSD (P=.05) 1.4 3.1 0.0
RatoonCrop Stage Main Main Ratoon
YieldRating Unit days in days lb/A
10/16/2007Rating Data Type 50% Head Height 50% Head
RiceRating Date 7/23/2007Crop Name Rice Rice Rice
- able.

142
Influence of Main-Crop Straw on Ratoon-Crop Nitrogen Efficiency 1.1 Experiment number .......................... : 07-CM-23 Site and design ................................... : Location/Cooperator .................. : Rice Research Station (Crowley Main) Tillage type .................................. : Conventional Experimental design ................... : Randomized complete block Number of reps ........................... : 4 Plot size ........................................ : 7 x 25 ft Row width/rows per plot ............ : 7 in / 12 Soil type .............................................. : Crowley silt loam % organic matter ........................ : NA pH................................................. : 7.1 Extractable nutrients .................. : Ca-1,102; Cu-1.7; Mg-231; P-11.6; K-82.2; Na-97.8; S-7.4; Zn-7.2 Crop/Variety ...................................... : Rice / Cocodrie Planting method/date ................. : Drill seeded / March 19 Seeding rate/depth ...................... : 33 seeds/ft2 / 1 in Emergence date ........................... : March 26 Harvest date ................................ : July 26; Ratoon harvest, October 16 Seed treatment/cwt ............................ : Dithane (fungicide)-114 g Release (gibberellic acid)-10 g Zinche (40.5% Zn)-236 ml Fertilization ........................................ : 195 lb/A 0-24-24-2.5, March 19 1 qt/A Zinc Plus, May 1 150 lb N/A 46-0-0, May 2 Water management ........................... : Flush ............................................ : March 29, April 20 Flood ............................................ : May 3; Ratoon flood, July 27 Drain ............................................ : July 12; Ratoon drain, October 4 Pest management ............................... : Herbicides.................................... : 15 oz/A Clincher, April 23 1 gal/A Arrosolo + .75 oz/A Londax + .5 oz/A Permit, May 1 1 oz/A Londax, May 17 3 pt/A Basagran + 1 pt/A Crop oil + 4 oz/A Interlock, July 26 Insecticides .................................. : 4 oz/A Karate, May 10 4 oz/A Mustang Max, July 2 Fungicides ................................... : 21 oz/A Quilt + 6 oz/A Quadris, June 16

143
Table 39. Influence of Main-Crop Straw on Ratoon-Crop Nitrogen Efficiency 1.1.
Trt Treatment Rate GrowthNo. Name Rate Unit Stage
1 Urea above straw 40 a 2041 aUrea 45 LB A/A Postharvest
2 Urea above straw 41 a 2364 aUrea 90 LB A/A Postharvest
3 Urea above straw 42 a 2659 aUrea 135 LB A/A Postharvest
4 Urea under straw 42 a 2293 aUrea 45 LB A/A Postharvest
5 Urea under straw 41 a 2281 aUrea 90 LB A/A Postharvest
6 Urea under straw 42 a 2622 aUrea 135 LB A/A Postharvest
7 Urea on bare soil 42 a 2863 aUrea 45 LB A/A Postharvest
8 Urea on bare soil 42 a 2375 aUrea 90 LB A/A Postharvest
9 Urea on bare soil 41 a 2412 aUrea 135 LB A/A Postharvest
Means followed by same letter do not significantly differ (P=.05, Student-Newman-Keuls)Mean comparisons performed only when AOV Treatment P(F) is significant at mean comparison OSL.
0.1073 0.39411.105
Treatment Prob(F)2.038
0.0187 0.4562Treatment F
0.899Replicate Prob(F)
5.154Replicate F
19.081.670.7 464.4
CV
677.8Standard Deviation
1.2LSD (P=.05)
Ratoon RatoonSE DescriptionDays lb/A
YieldRating Unit
50% Head10/16/2007
Rating Data Type
RiceRating Date
RiceCrop Name

144
Evaluation of N source, Rate, and Variety on Ratoon Yield Experiment number .......................... : 07-CM-24 Site and design ................................... : Location/Cooperator .................. : Rice Research Station (Crowley Main) Tillage type .................................. : Conventional Experimental design ................... : Randomized complete block Number of reps ........................... : 4 Plot size ........................................ : 7 x 25 ft Row width/rows per plot ............ : 7 in / 12 Soil type .............................................. : Crowley silt loam % organic matter ........................ : NA pH................................................. : 7.1 Extractable nutrients .................. : Ca-1,102; Cu-1.7; Mg-231; P-11.6; K-82.2; Na-97.8; S-7.4; Zn-7.2 Crop/Variety ...................................... : Rice / Cocodrie, Trenasse Planting method/date ................. : Drill seeded / March 19 Seeding rate/depth ...................... : 33 seeds/ft2 / 1 in Emergence date ........................... : Cocodrie, March 26; Trenasse, March 28 Harvest date ................................ : July 26; Ratoon harvest, October 16 Seed treatment/cwt ............................ : Dithane (fungicide)-114 g Release (gibberellic acid)-10 g Zinche (40.5% Zn)-236 ml Fertilization ........................................ : 195 lb/A 0-24-24-2.5, March 19 1 qt/A Zinc Plus, May 1 150 lb N/A 46-0-0, May 2 Water management ........................... : Flush ............................................ : March 29, April 20 Flood ............................................ : May 3; Ratoon flood, July 27 Drain ............................................ : July 12; Ratoon drain, October 4 Pest management ............................... : Herbicides.................................... : 15 oz/A Clincher, April 23 1 gal/A Arrosolo + .75 oz/A Londax + .5 oz/A Permit, May 1 1 oz/A Londax, May 17 3 pt/A Basagran + 1 pt/A Crop oil + 4 oz/A Interlock, July 26 Insecticides .................................. : 4 oz/A Karate, May 10 4 oz/A Mustang Max, July 2 Fungicides ................................... : 21 oz/A Quilt + 6 oz/A Quadris, June 16

145
Table 40. Evaluation of N Source, Rate, and Variety on Ratoon Yield.
Trt Treatment Rate Growth ApplNo. Name RateUnit Stage Description
1 Rate 45 LB A/A 94 a 29 ab 6126 a 38 a 1582 fSource Harvest UreaCocodrie
2 Rate 90 LB A/A 95 a 32 ab 7233 a 39 a 2206 a-dSource Harvest UreaCocodrie
3 Rate 135 LB A/A 94 a 30 ab 5932 a 38 a 2027 b-fSource Harvest UreaCocodrie
4 Rate 45 LB A/A 93 a 28 b 6225 a 37 a 1608 efSource Harvest Amm SulfateCocodrie
5 Rate 90 LB A/A 94 a 29 ab 6088 a 37 a 1934 c-fSource Harvest Amm SulfateCocodrie
6 Rate 135 LB A/A 94 a 31 ab 6675 a 37 a 2203 a-dSource Harvest Amm SulfateCocodrie
7 Rate 45 LB A/A 95 a 31 ab 6766 a 39 a 1650 defSource Harvest BlendCocodrie
8 Rate 90 LB A/A 94 a 32 ab 6902 a 38 a 2180 a-eSource Harvest BlendCocodrie
9 Rate 135 LB A/A 96 a 31 ab 6885 a 39 a 2163 a-eSource Harvest BlendCocodrie
10 Rate 45 LB A/A 94 a 32 ab 7061 a 35 a 1812 defSource Harvest UreaTrenasse
11 Rate 90 LB A/A 95 a 34 a 7439 a 35 a 2561 abSource Harvest UreaTrenasse
12 Rate 135 LB A/A 93 a 32 ab 7670 a 33 a 2655 aSource Harvest UreaTrenasse
RatoonMaindays lb/A
Crop Stage Main Main
YieldRating Unit days in lb/A
Yield 50% Head10/16/2007
Rating Data Type 50% Head Height
RiceRating Date 7/23/2007 7/26/2007
Rice RiceCrop Name Rice Rice
Continued.

146
Table 40. Continued.
Trt Treatment Rate Growth ApplNo. Name RateUnit Stage Description13 Rate 45 LB A/A 92 a 32 ab 7373 a 32 a 1748 def
Source Harvest Amm SulfateTrenasse
14 Rate 90 LB A/A 92 a 31 ab 7786 a 33 a 2056 b-fSource Harvest Amm SulfateTrenasse
15 Rate 135 LB A/A 94 a 33 ab 7807 a 33 a 2624 aSource Harvest Amm SulfateTrenasse
16 Rate 45 LB A/A 93 a 32 ab 7442 a 32 a 1833 defSource Harvest BlendTrenasse
17 Rate 90 LB A/A 93 a 34 a 8220 a 32 a 2414 abcSource Harvest BlendTrenasse
18 Rate 135 LB A/A 93 a 32 ab 7402 a 32 a 2540 abSource Harvest BlendTrenasse
Means followed by same letter do not significantly differ (P=.05, Student-Newman-Keuls)Mean comparisons performed only when AOV Treatment P(F) is significant at mean comparison OSL.
0.0034 0.00018.349
Treatment Prob(F) 0.2178 0.0172 0.11231.558 2.967
0.0255 0.0001Treatment F 1.358 2.337
13.751Replicate Prob(F) 0.1043 0.0014 0.1214
2.029 4.094Replicate F 2.418 8.058
11.7115 7.772.8 245.9
CV 1.68 5.3
347.8Standard Deviation 1.6 1.7 1058.4
1496.7 4.6LSD (P=.05) 2.6 2.8
Crop Name Rice Rice Rice Rice RiceRating Date 7/23/2007 7/26/2007 10/16/2007Rating Data Type 50% Head Height Yield 50% Head YieldRating Unit days in lb/A days lb/ACrop Stage Main Main Main Ratoon

147
Ratoon Response of Rice Hybrids to Nitrogen Fertilizer Rates 3.1 Experiment number .......................... : 07-CM-01 Site and design ................................... : Location/Cooperator .................. : Rice Research Station (Crowley Main) Tillage type .................................. : Conventional Experimental design ................... : Randomized complete block Number of reps ........................... : 4 Plot size ........................................ : 7 x 25 ft Row width/rows per plot ............ : 7 in / 12 Soil type .............................................. : Crowley silt loam % organic matter ........................ : NA pH................................................. : 7.1 Extractable nutrients ppm.......... : Ca-1,212; Cu-1.7; Mg-232; P-11.5; K-80; Na-81; S-6.8; Zn-5.8 Crop/Variety ...................................... : Rice / XP723, CLXL729 Planting method/date ................. : Drill seeded / March 19 Seeding rate/depth ...................... : 14 seeds/ft2 / 1 in Emergence date ........................... : March 27 Harvest date ................................ : August 6; Ratoon harvest, October 16 Fertilization ........................................ : 195 lb/A 0-24-24-2.5, March 19 1 qt/A Zinc Plus, May 1 150 lb N/A 46-0-0, May 2 Water management ........................... : Flush ............................................ : March 29, April 20 Flood ............................................ : May 3; Ratoon flood, August 8 Drain ............................................ : July 17; Ratoon drain, October 4 Pest management ............................... : Herbicides.................................... : 15 oz/A Clincher, April 23 1 gal/A Arrosolo + .75 oz/A Londax + .5 oz/A Permit, May 1 1 oz/A Londax, May 17 3 pt/A Basagran + 1 pt/A Crop oil + 4 oz/A Interlock, August 7 Insecticides .................................. : 4 oz/A Karate, May 10 4 oz/A Mustang Max, July 2 Fungicides ................................... : 21 oz/A Quilt + 6 oz/A Quadris, June 16

148
Table 41. Ratoon Response of Rice Hybrids to Nitrogen Fertilizer Rates 3.1.
Trt Treatment Rate GrowthNo. Name Rate Unit Stage
1 XP723 97 a 45 a 11308 a 35 a 3700 bUrea 60 LB A/A Postharvest
2 XP723 96 a 46 a 12093 a 35 a 4290 abUrea 90 LB A/A Postharvest
3 XP723 97 a 45 a 11540 a 35 a 4061 abUrea 120 LB A/A Postharvest
4 XP723 97 a 45 a 11899 a 35 a 4498 aUrea 150 LB A/A Postharvest
5 CLXL729 97 a 46 a 12054 a 35 a 4061 abUrea 60 LB A/A Postharvest
6 CLXL729 98 a 45 a 11899 a 35 a 4379 abUrea 90 LB A/A Postharvest
7 CLXL729 98 a 45 a 11799 a 35 a 4354 abUrea 120 LB A/A Postharvest
8 CLXL729 97 a 45 a 11920 a 35 a 4316 abUrea 150 LB A/A Postharvest
Means followed by same letter do not significantly differ (P=.05, Student-Newman-Keuls)Mean comparisons performed only when AOV Treatment P(F) is significant at mean comparison OSL.
RiceRating Date 8/6/2007 8/6/2007
Rice RiceCrop Name Rice Rice
Yield 50% Head10/16/2007
Rating Data Type 50% Head Heightdays lb/A
Crop Stage Main Main
YieldRating Unit days in lb/A
593.7 0LSD (P=.05) 1 3.5
RatoonMain Ratoon
0 318.1CV 0.6 4.39
467.9Standard Deviation 0.6 2 402.5
2.952 0Replicate F 3.807 0.602
7.563.41 0
1 0.0186Treatment F 2.737 0.09
4.15Replicate Prob(F) 0.0478 0.5614 0.0574
1 0.04482.563
Treatment Prob(F) 0.0516 0.9981 0.15691.737 0

149
Ratoon Response of Rice Varieties to Nitrogen Fertilizer Rates 3.1 Experiment number .......................... : 07-CM-02 Site and design ................................... : Location/Cooperator .................. : Rice Research Station (Crowley Main) Tillage type .................................. : Conventional Experimental design ................... : Randomized complete block Number of reps ........................... : 4 Plot size ........................................ : 7 x 25 ft Row width/rows per plot ............ : 7 in / 12 Soil type .............................................. : Crowley silt loam % organic matter ........................ : NA pH................................................. : 7.1 Extractable nutrients ppm.......... : Ca-1,212; Cu-1.7; Mg-232; P-11.5; K-80; Na-81; S-6.8; Zn-5.8 Crop/Variety ...................................... : Rice / Cocodrie, Trenasse Planting method/date ................. : Drill seeded / March 19 Seeding rate/depth ...................... : 33 seeds/ft2 / 1 in Emergence date ........................... : Cocodrie, March 26; Trenasse, March 28 Harvest date ................................ : August 6; Ratoon harvest, October 16 Seed treatment/cwt ............................ : Dithane (fungicide)-114 g Release (gibberellic acid)-10 g Zinche (40.5% Zn)-236 ml Fertilization ........................................ : 195 lb/A 0-24-24-2.5, March 19 1 qt/A Zinc Plus, May 1 150 lb N/A 46-0-0, May 2 Water management ........................... : Flush ............................................ : March 29, April 20 Flood ............................................ : May 3; Ratoon flood, August 8 Drain ............................................ : July 17; Ratoon drain, October 4 Pest management ............................... : Herbicides.................................... : 15 oz/A Clincher, April 23 1 gal/A Arrosolo + .75 oz/A Londax + .5 oz/A Permit, May 1 1 oz/A Londax, May 17 3 pt/A Basagran + 1 pt/A Crop oil + 4 oz/A Interlock, August 7 Insecticides .................................. : 4 oz/A Karate, May 10 4 oz/A Mustang Max, July 2 Fungicides ................................... : 21 oz/A Quilt + 6 oz/A Quadris, June 16

150
Table 42. Ratoon Response of Rice Varieties to Nitrogen Fertilizer Rates 3.1.
Trt Treatment Rate GrowthNo.Name Rate Unit Stage
1 Cocodrie 99 a 35 a 7680 a 37 a 2019 aUrea 60 LB A/A Postharvest
2 Cocodrie 98 a 36 a 7700 a 36 a 2385 aUrea 90 LB A/A Postharvest
3 Cocodrie 99 a 35 a 8287 a 37 a 2370 aUrea 120 LB A/A Postharvest
4 Cocodrie 97 a 34 a 8117 a 34 a 2552 aUrea 150 LB A/A Postharvest
5 Trenasse 97 a 37 a 8034 a 37 a 2349 aUrea 60 LB A/A Postharvest
6 Trenasse 97 a 37 a 8044 a 32 a 2573 aUrea 90 LB A/A Postharvest
7 Trenasse 97 a 36 a 8026 a 36 a 2573 aUrea 120 LB A/A Postharvest
8 Trenasse 96 a 38 a 8334 a 34 a 2841 aUrea 150 LB A/A Postharvest
Means followed by same letter do not significantly differ (P=.05, Student-Newman-Keuls)Mean comparisons performed only when AOV Treatment P(F) is significant at mean comparison OSL.
RiceRating Date 8/6/2007 8/6/2007
Rice RiceCrop Name Rice Rice
Yield 50% Head10/16/2007
Rating Data Type 50% Head Heightdays lb/A
Crop Stage Main Main
YieldRating Unit days in lb/A
1751.1 7.7LSD (P=.05) 2.8 5.3
RatoonMain Ratoon
4.4 310.9CV 1.66 8.41
457.3Standard Deviation 1.6 3 1173.6
1.166 1.256Replicate F 0.016 1.322
12.6514.62 12.53
0.3149 0.0152Treatment F 1.267 0.706
4.385Replicate Prob(F) 0.9842 0.2979 0.3518
0.7323 0.06032.361
Treatment Prob(F) 0.3336 0.6679 0.98910.165 0.619

151
Ratoon Response to Nitrogen Fertilizer Application Timings 2.1 Experiment number .......................... : 07-CM-03 Site and design ................................... : Location/Cooperator .................. : Rice Research Station (Crowley Main) Tillage type .................................. : Conventional Experimental design ................... : Randomized complete block Number of reps ........................... : 4 Plot size ........................................ : 7 x 25 ft Row width/rows per plot ............ : 7 in / 12 Soil type .............................................. : Crowley silt loam % organic matter ........................ : NA pH................................................. : 7.1 Extractable nutrients ppm ........... : Ca-1,212; Cu-1.7; Mg-232; P-11.5; K-80; Na-81; S-6.8; Zn-5.8 Crop/Variety ...................................... : Rice / Cocodrie, Trenasse Planting method/date ................. : Drill seeded / March 19 Seeding rate/depth ...................... : 33 seeds/ft2 / 1 in Emergence date ........................... : Cocodrie, March 26; Trenasse, March 28 Harvest date ................................ : August 6; Ratoon harvest, October 16 Seed treatment/cwt ............................ : Dithane (fungicide)-114 g Release (gibberellic acid)-10 g Zinche (40.5% Zn)-236 ml Fertilization ........................................ : 195 lb/A 0-24-24-2.5, March 19 1 qt/A Zinc Plus, May 1 150 lb N/A 46-0-0, May 2 Water management ........................... : Flush ............................................ : March 29, April 20 Flood ............................................ : May 3, Ratoon flood, August 8 Drain ............................................ : July 17, Ratoon drain, October 4 Pest management ............................... : Herbicides.................................... : 15 oz/A Clincher, April 23 1 gal/A Arrosolo + .75 oz/A Londax + .5 oz/A Permit, May 1 1 oz/A Londax, May 17 3 pt/A Basagran + 1 pt/A Crop oil + 4 oz/A Interlock, August 7 Insecticides .................................. : 4 oz/A Karate, May 10 4 oz/A Mustang Max, July 2 Fungicides ................................... : 21 oz/A Quilt + 6 oz/A Quadris, June 16
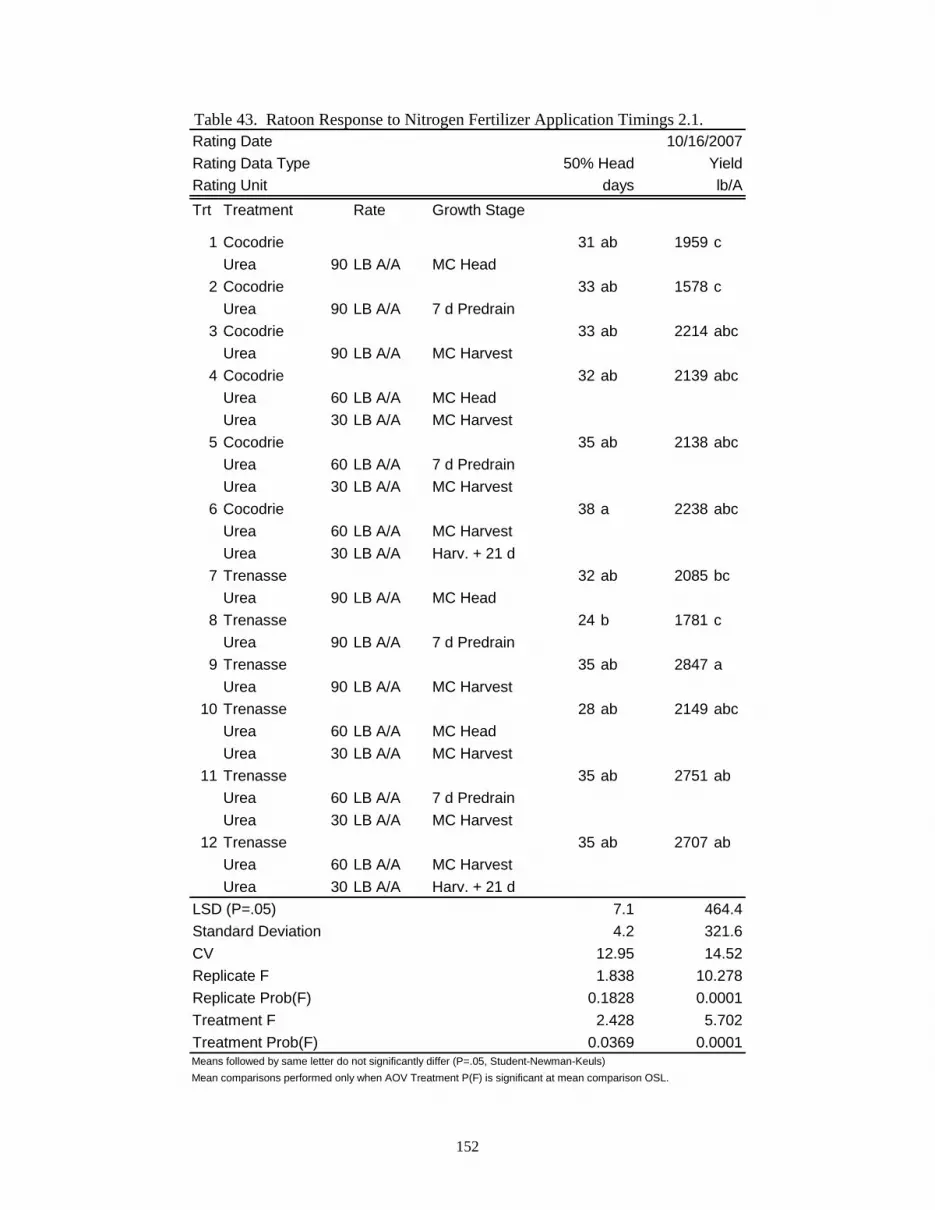
152
Table 43. Ratoon Response to Nitrogen Fertilizer Application Timings 2.1.
Trt Treatment Rate Growth Stage
1 Cocodrie 31 ab 1959 cUrea 90 LB A/A MC Head
2 Cocodrie 33 ab 1578 cUrea 90 LB A/A 7 d Predrain
3 Cocodrie 33 ab 2214 abcUrea 90 LB A/A MC Harvest
4 Cocodrie 32 ab 2139 abcUrea 60 LB A/A MC HeadUrea 30 LB A/A MC Harvest
5 Cocodrie 35 ab 2138 abcUrea 60 LB A/A 7 d PredrainUrea 30 LB A/A MC Harvest
6 Cocodrie 38 a 2238 abcUrea 60 LB A/A MC HarvestUrea 30 LB A/A Harv. + 21 d
7 Trenasse 32 ab 2085 bcUrea 90 LB A/A MC Head
8 Trenasse 24 b 1781 cUrea 90 LB A/A 7 d Predrain
9 Trenasse 35 ab 2847 aUrea 90 LB A/A MC Harvest
10 Trenasse 28 ab 2149 abcUrea 60 LB A/A MC HeadUrea 30 LB A/A MC Harvest
11 Trenasse 35 ab 2751 abUrea 60 LB A/A 7 d PredrainUrea 30 LB A/A MC Harvest
12 Trenasse 35 ab 2707 abUrea 60 LB A/A MC HarvestUrea 30 LB A/A Harv. + 21 d
Means followed by same letter do not significantly differ (P=.05, Student-Newman-Keuls)Mean comparisons performed only when AOV Treatment P(F) is significant at mean comparison OSL.
10/16/2007Rating Data TypeRating Date
days lb/AYield
Rating Unit50% Head
4.2 321.6CV
464.4Standard Deviation
7.1LSD (P=.05)
10.278Replicate Prob(F)
1.838Replicate F14.5212.95
0.0369 0.00015.702
Treatment Prob(F)2.428
0.1828 0.0001Treatment F

153
Ratoon Response to Phosphorus and Potassium 2.1 Experiment number .......................... : 07-CM-04 Site and design ................................... : Location/Cooperator .................. : Rice Research Station (Crowley Main) Tillage type .................................. : Conventional Experimental design ................... : Randomized complete block Number of reps ........................... : 4 Plot size ........................................ : 7 x 25 ft Row width/rows per plot ............ : 7 in / 12 Soil type .............................................. : Crowley silt loam % organic matter ........................ : NA pH................................................. : 7.1 Extractable nutrients ppm.......... : Ca-1,212; Cu-1.7; Mg-232; P-11.5; K-80; Na-81; S-6.8; Zn-5.8 Crop/Variety ...................................... : Rice / Cocodrie Planting method/date ................. : Drill seeded / March 19 Seeding rate/depth ...................... : 33 seeds/ft2 / 1 in Emergence date ........................... : March 26 Harvest date ................................ : August 6; Ratoon harvest, October 16 Seed treatment/cwt ............................ : Dithane (fungicide)-114 g Release (gibberellic acid)-10 g Fertilization ........................................ : 5 lb/A ZnSO4, March 19 1 qt/A Zinc Plus, May 1 150 lb N/A 46-0-0, May 2 90 lb N/A 46-0-0, August 7 Water management ........................... : Flush ............................................ : March 29, April 20 Flood ............................................ : May 3; Ratoon flood, August 8 Drain ............................................ : July 17; Ratoon drain, October 4 Pest management ............................... : Herbicides.................................... : 15 oz/A Clincher, April 23 1 gal/A Arrosolo + .75 oz/A Londax + .5 oz/A Permit, May 1 1 oz/A Londax, May 17 3 pt/A Basagran + 1 pt/A Crop oil + 4 oz/A Interlock, August 7 Insecticides .................................. : 4 oz/A Karate, May 10 4 oz/A Mustang Max, July 2 Fungicides ................................... : 21 oz/A Quilt + 6 oz/A Quadris, June 16

154
Table 44. Ratoon Response to Phosphorus and Potassium 2.1.
Trt Treatment Rate GrowthNo Name Rate Unit Stage
1 Triple superphosphate 0 LB A/A Postharvest 104 a 37 a 7798 a 38 a 2132 aPotassium chloride 0 LB A/A Postharvest
2 Triple superphosphate 0 LB A/A Postharvest 103 a 37 a 7700 a 38 a 2595 aPotassium chloride 30 LB A/A Postharvest
3 Triple superphosphate 0 LB A/A Postharvest 103 a 37 a 7549 a 38 a 2079 aPotassium chloride 60 LB A/A Postharvest
4 Triple superphosphate 30 LB A/A Postharvest 103 a 37 a 7540 a 38 a 2257 aPotassium chloride 0 LB A/A Postharvest
5 Triple superphosphate 30 LB A/A Postharvest 102 a 36 a 7887 a 38 a 2332 aPotassium chloride 30 LB A/A Postharvest
6 Triple superphosphate 30 LB A/A Postharvest 102 a 36 a 7927 a 38 a 2366 aPotassium chloride 60 LB A/A Postharvest
7 Triple superphosphate 60 LB A/A Postharvest 102 a 37 a 7585 a 38 a 2247 aPotassium chloride 0 LB A/A Postharvest
8 Triple superphosphate 60 LB A/A Postharvest 103 a 37 a 7963 a 38 a 2221 aPotassium chloride 30 LB A/A Postharvest
9 Triple superphosphate 60 LB A/A Postharvest 103 a 37 a 7730 a 38 a 2355 aPotassium chloride 60 LB A/A Postharvest
Means followed by same letter do not significantly differ (P=.05, Student-Newman-Keuls)Mean comparisons performed only when AOV Treatment P(F) is significant at mean comparison OSL.
RiceRating Date 8/6/2007 8/6/2007
Rice RiceCrop Name Rice Rice
Yield 50% Head10/16/2007
Rating Data Type 50% Head Heightdays lb/A
Crop Stage Main Main
YieldRating Unit days in lb/A
669.2 .LSD (P=.05) 1.8 2.2
RatoonMain Ratoon
. 339.4CV 1.02 3.5
495.3Standard Deviation 1.1 1.3 458.5
3.733Replicate F 7.063 8.382
14.845.92 .
0.1022Treatment F 1.439 0.579
2.307Replicate Prob(F) 0.0063 0.0032 0.0247
0.6160.79
Treatment Prob(F) 0.2543 0.781 0.84160.504

155
Evaluate the Influence of Zinc Fertilization on Ratoon Crop Experiment number .......................... : 07-CM-05 Site and design ................................... : Location/Cooperator .................. : Rice Research Station (Crowley Main) Tillage type .................................. : Conventional Experimental design ................... : Randomized complete block Number of reps ........................... : 4 Plot size ........................................ : 7 x 25 ft Row width/rows per plot ............ : 7 in / 12 Soil type .............................................. : Crowley silt loam % organic matter ........................ : NA pH................................................. : 7.1 Extractable nutrients ppm.......... : Ca-1,212; Cu-1.7; Mg-232; P-11.5; K-80; Na-81; S-6.8; Zn-5.8 Crop/Variety ...................................... : Rice / Cocodrie Planting method/date ................. : Drill seeded / March 19 Seeding rate/depth ...................... : 33 seeds/ft2 / 1 in Emergence date ........................... : March 26 Harvest date ................................ : August 6; Ratoon harvest, October 16 Seed treatment/cwt ............................ : Dithane (fungicide)-114 g Release (gibberellic acid)-10 g Fertilization ........................................ : 100 lb/A triple super phosphate, March 19 75 lb/A 0-0-60, March 19 150 lb N/A 46-0-0, May 2 90 lb N/A 46-0-0, August 7 Water management ........................... : Flush ............................................ : March 29, April 20 Flood ............................................ : May 3; Ratoon flood, August 8 Drain ............................................ : July 17; Ratoon drain, October 4 Pest management ............................... : Herbicides.................................... : 15 oz/A Clincher, April 23 1 gal/A Arrosolo + .75 oz/A Londax + .5 oz/A Permit, May 1 1 oz/A Londax, May 17 3 pt/A Basagran + 1 pt/A Crop oil + 4 oz/A Interlock, August 7 Insecticides .................................. : 4 oz/A Karate, May 10 4 oz/A Mustang Max, July 2 Fungicides ................................... : 21 oz/A Quilt + 6 oz/A Quadris, June 16

156
Table 45. Evaluate the Influence of Zinc Fertilization on Ratoon Crop.
Trt Treatment Rate Growth ApplNo. Name Rate Unit Stage Description
1 Zinc Sulfate 0 LB A/A Harvest Zinc 36 a 1964 aSulfur 10 LB A/A Harvest Sulfur
2 Zinc Sulfate 5 LB A/A Harvest Zinc 35 a 2288 aSulfur 7.6 LB A/A Harvest Sulfur
3 Zinc Sulfate 10 LB A/A Harvest Zinc 36 a 2182 aSulfur 5.2 LB A/A Harvest Sulfur
4 Zinc Sulfate 15 LB A/A Harvest Zinc 37 a 2320 aSulfur 2.8 LB A/A Harvest Sulfur
5 Zinc Sulfate 20 LB A/A Harvest Zinc 36 a 2206 aSulfur 0.4 LB A/A Harvest Sulfur
6 Check 0 LB A/A Harvest Zinc 36 a 2274 a0 LB A/A Harvest Sulfur
Means followed by same letter do not significantly differ (P=.05, Student-Newman-Keuls)Mean comparisons performed only when AOV Treatment P(F) is significant at mean comparison
10/16/2007Rating Data Type
RiceRating Date
RiceCrop Name
Ratoondays lb/A
Crop Stage
YieldRating Unit
50% Head
1.7 195.7CV
294.8Standard Deviation
3.2LSD (P=.05)
4.551Replicate Prob(F)
0Replicate F
8.874.81
0.8382 0.18511.745
Treatment Prob(F)0.4
1 0.0185Treatment F
OSL.
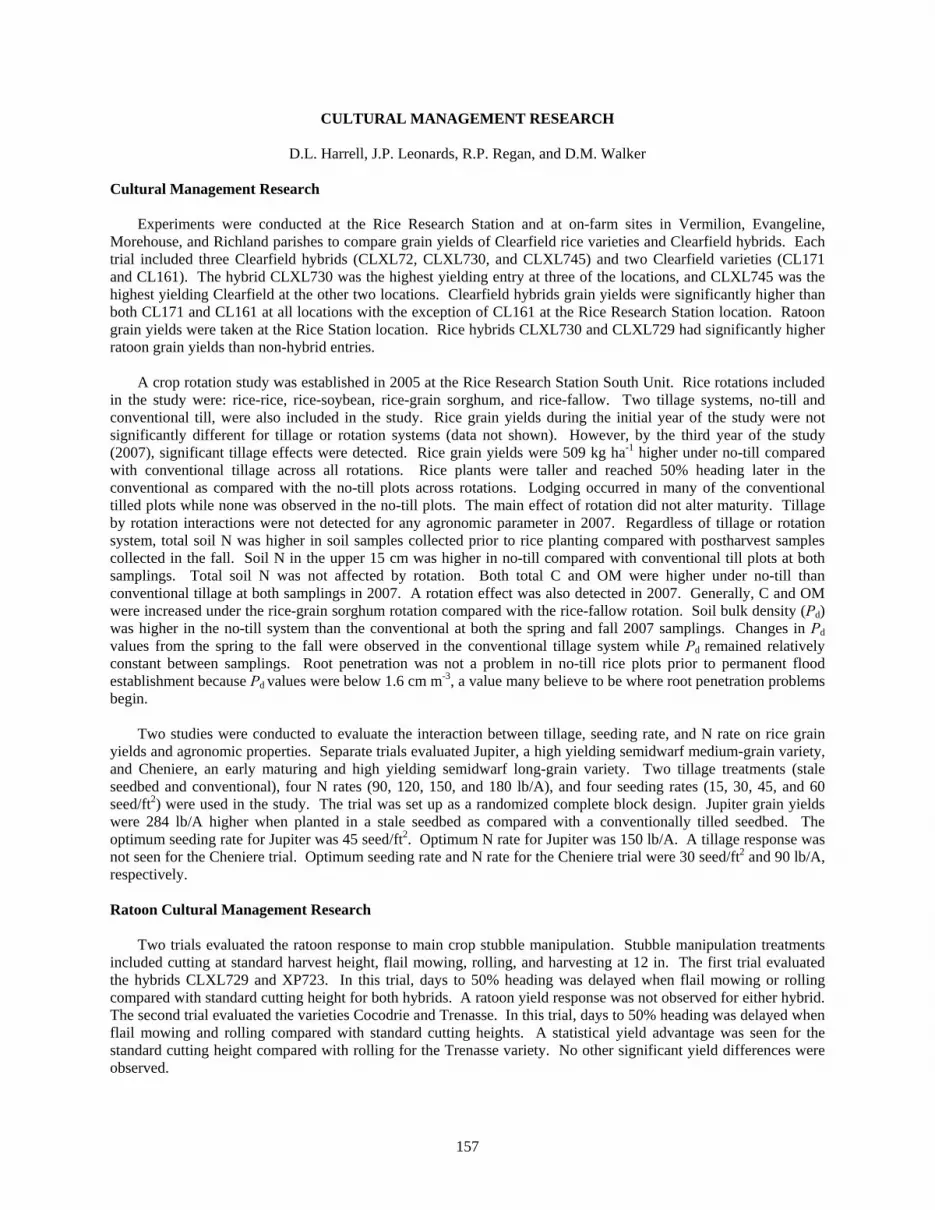
157
CULTURAL MANAGEMENT RESEARCH
D.L. Harrell, J.P. Leonards, R.P. Regan, and D.M. Walker
Cultural Management Research Experiments were conducted at the Rice Research Station and at on-farm sites in Vermilion, Evangeline, Morehouse, and Richland parishes to compare grain yields of Clearfield rice varieties and Clearfield hybrids. Each trial included three Clearfield hybrids (CLXL72, CLXL730, and CLXL745) and two Clearfield varieties (CL171 and CL161). The hybrid CLXL730 was the highest yielding entry at three of the locations, and CLXL745 was the highest yielding Clearfield at the other two locations. Clearfield hybrids grain yields were significantly higher than both CL171 and CL161 at all locations with the exception of CL161 at the Rice Research Station location. Ratoon grain yields were taken at the Rice Station location. Rice hybrids CLXL730 and CLXL729 had significantly higher ratoon grain yields than non-hybrid entries. A crop rotation study was established in 2005 at the Rice Research Station South Unit. Rice rotations included in the study were: rice-rice, rice-soybean, rice-grain sorghum, and rice-fallow. Two tillage systems, no-till and conventional till, were also included in the study. Rice grain yields during the initial year of the study were not significantly different for tillage or rotation systems (data not shown). However, by the third year of the study (2007), significant tillage effects were detected. Rice grain yields were 509 kg ha-1 higher under no-till compared with conventional tillage across all rotations. Rice plants were taller and reached 50% heading later in the conventional as compared with the no-till plots across rotations. Lodging occurred in many of the conventional tilled plots while none was observed in the no-till plots. The main effect of rotation did not alter maturity. Tillage by rotation interactions were not detected for any agronomic parameter in 2007. Regardless of tillage or rotation system, total soil N was higher in soil samples collected prior to rice planting compared with postharvest samples collected in the fall. Soil N in the upper 15 cm was higher in no-till compared with conventional till plots at both samplings. Total soil N was not affected by rotation. Both total C and OM were higher under no-till than conventional tillage at both samplings in 2007. A rotation effect was also detected in 2007. Generally, C and OM were increased under the rice-grain sorghum rotation compared with the rice-fallow rotation. Soil bulk density (Ρd) was higher in the no-till system than the conventional at both the spring and fall 2007 samplings. Changes in Ρd values from the spring to the fall were observed in the conventional tillage system while Ρd remained relatively constant between samplings. Root penetration was not a problem in no-till rice plots prior to permanent flood establishment because Ρd values were below 1.6 cm m-3, a value many believe to be where root penetration problems begin.
Two studies were conducted to evaluate the interaction between tillage, seeding rate, and N rate on rice grain yields and agronomic properties. Separate trials evaluated Jupiter, a high yielding semidwarf medium-grain variety, and Cheniere, an early maturing and high yielding semidwarf long-grain variety. Two tillage treatments (stale seedbed and conventional), four N rates (90, 120, 150, and 180 lb/A), and four seeding rates (15, 30, 45, and 60 seed/ft2) were used in the study. The trial was set up as a randomized complete block design. Jupiter grain yields were 284 lb/A higher when planted in a stale seedbed as compared with a conventionally tilled seedbed. The optimum seeding rate for Jupiter was 45 seed/ft2. Optimum N rate for Jupiter was 150 lb/A. A tillage response was not seen for the Cheniere trial. Optimum seeding rate and N rate for the Cheniere trial were 30 seed/ft2 and 90 lb/A, respectively. Ratoon Cultural Management Research Two trials evaluated the ratoon response to main crop stubble manipulation. Stubble manipulation treatments included cutting at standard harvest height, flail mowing, rolling, and harvesting at 12 in. The first trial evaluated the hybrids CLXL729 and XP723. In this trial, days to 50% heading was delayed when flail mowing or rolling compared with standard cutting height for both hybrids. A ratoon yield response was not observed for either hybrid. The second trial evaluated the varieties Cocodrie and Trenasse. In this trial, days to 50% heading was delayed when flail mowing and rolling compared with standard cutting heights. A statistical yield advantage was seen for the standard cutting height compared with rolling for the Trenasse variety. No other significant yield differences were observed.

158
Rotational Crop Research
A trial was conducted to evaluate the agronomic effects of seedbed selection in soybean production in southwest Louisiana. Two seedbed treatments, raised and flat, were evaluated. One Group IV and four Group V Roundup ready soybean varieties were included in the trial. Actual varieties were 95M30, DG5555RR, DK4753, DPL5634, and TV55R15. Yields were numerically higher in four of the five varieties. When all data were pooled, raised and flat seedbed yields were 59 and 56.5 bu/A, respectively. Plants in raised seedbeds were also generally taller at maturity. Stand counts at maturity indicated that raised seedbeds had at least one more plant per row-foot than those planted to a flat seedbed in four of the five included varieties.
A trial was conducted to evaluate four sweet sorghum varieties for their potential as a biofuel source for southwest Louisiana. Sweet sorghum varieties included Mississippi State University releases Dale, M81-E, Theis, and Topper76-6. Dale was the fastest variety to reach 50% heading (88 days), followed by Theis (105 days), M8-E (111 days), and Topper76-6 (115 days). A rough estimate of fermentable soluble solids indicated that Dale provided the greatest potential for ethanol production in the 2007 trial. Results of the fermentable solids estimate are as follows: Dale (3 ton/A), Topper76-6 (2.5 ton/A), Theis (2.3 ton/A), and M81-E (2.2 ton/A).

159
Clearfield Hybrid Yield Comparison 1 (Rice Research Station) Experiment number .......................... : 07-CM-15 Site and design ................................... : Location/Cooperator .................. : Rice Research Station (Crowley Main) Tillage type .................................. : Conventional Experimental design ................... : Randomized complete block Number of reps ........................... : 4 Plot size ........................................ : 7 x 20 ft Row width/rows per plot ............ : 7 in / 12 Soil type .............................................. : Crowley silt loam % organic matter ........................ : NA pH................................................. : 7.0 Extractable nutrients .................. : Ca-1,238; Cu-1.6; Mg-222; P-19.3; K-88.0; Na-91.0; S-6.6; Zn-6.3 Crop/Variety ...................................... : Rice / See data sheet Planting method/date ................. : Drill seeded / March 20 Seeding rate/depth ...................... : Hybrid- 14 seeds/ft2, Commercial- 33 seeds/ft2 / 1 in Emergence date ........................... : March 28 Harvest date ................................ : August 6; Ratoon harvest, October 16 Seed treatment/cwt ............................ : Dithane (fungicide)-114 g Release (gibberellic acid)-10 g Zinche (40.5% Zn)-236 ml Fertilization ........................................ : 195 lb/A 0-24-24-2.5, March 20 1 qt/A Zinc Plus, May 1 120 lb N/A 46-0-0, May 2 45 lb N/A 46-0-0, June 5 (Commercial variety midseason) 30 lb N/A 46-0-0, June 25 (Hybrid 5% heading) 90 lb N/A 46-0-0, August 8 (ratoon) Water management ........................... : Flush ............................................ : March 28, April 20 Flood ............................................ : May 3; Ratoon flood, August 8 Drain ............................................ : July 17; Ratoon drain, October 4 Pest management ............................... : Herbicides.................................... : 4 oz/A NewPath, April 16 and May 1 15 oz/A Clincher, April 23 1 gal Arrosolo + .75 oz Londax + .5 oz Permit, May 1 1 oz Londax, May 17 Insecticides .................................. : 4 oz Karate, May 10 4 oz Mustang Max, July 2 Fungicides ................................... : 21 oz Quilt + 6 oz Quadris, June 16

160
Table 46. Clearfield Hybrid Yield Comparison 1 (Rice Research Station).
Trt TreatmentNo. Type Name
1 VAR CLXL730 96 b 45 a 10942 a 70 a 59 a 3385 ab2 VAR CLXL729 96 b 41 b 10922 a 70 a 60 a 3715 a3 VAR CLXP745 96 b 42 b 10846 a 72 a 55 a 2930 bc4 VAR CL161 99 a 42 b 10405 a 68 a 59 a 2385 c5 VAR CL171AR 99 a 39 b 8675 b 70 a 62 a 2639 c
Means followed by same letter do not significantly differ (P=.05, Student-Newman-Keuls)Mean comparisons performed only when AOV Treatment P(F) is significant at mean comparison OSL.
0.0010.0014 0.05044.503 9.651
Treatment Prob(F) 0.0002 0.00518.844 6.361
0.6074
0.0871
0.0948Treatment F 23.333 8.726
0.2893 0.9328Replicate Prob(F) 0.2687 0.66781.405 0.008Replicate F 1.556 0.425
11.586.27 1.011.6 348.6
0.31 2.67
CV 0.56 3.28649.7 0.7
4.4
2.68
537.2Standard Deviation 0.5 1.4
1001 2LSD (P=.05) 1 2.6
Main RatoonMain Main% lb/ARating Unit days in
Yield Total Mill
Crop Stage Main Mainlb/A %
Rating Data Type 50% Head Height8/6/2007
YieldWhole Mill
Rice RiceRating Date 8/1/2007
Rice RiceCrop Name Rice Rice

161
Clearfield Hybrid Yield Comparison 2 (Evangeline Parish) Experiment number .......................... : 07-EP-01 Site and design ................................... : Location/Cooperator .................. : Evangeline Parish / Dr. Steve Linscombe Tillage type .................................. : Conventional Experimental design ................... : Randomized complete block Number of reps ........................... : 4 Plot size ........................................ : 5 x 16 ft Row width/rows per plot ............ : 7.5 in / 7 Soil type .............................................. : Crowley -Vidrine silt loam complex % organic matter ........................ : NA pH................................................. : NA Extractable nutrients .................. : NA Crop/Variety ...................................... : Rice / Multiple Planting method/date ................. : Drill seeded / April 23 Seeding rate/depth ...................... : Hybrid- 14 seeds/ft2, Commercial- 33 seeds/ft2 / .75 in Emergence date ........................... : Harvest date ................................ : August 15 Seed treatment/cwt ............................ : NA Fertilization ....................................... : 120 lb N/A 46-0-0, May 22 45 lb N/A 46-0-0, June 26 (commercial varieties) 30 lb N/A 46-0-0, July 12 (hybrid varieties) Pest management ............................... : Herbicides.................................... : 13 oz/A Clincher + 1 qt Crop oil, May 23 8 oz/A NewPath, May 23

162
Table 47. Clearfield Hybrid Yield Comparison 2 (Evangeline Parish).
Trt TreatmentNo.Type Name
1 VAR CLXL730 82 b 46 a 9314 a 69 ab 53 a2 VAR CLXL729 81 b 43 ab 8635 a 70 ab 54 a3 VAR CLXP745 79 c 44 ab 9216 a 71 a 52 a4 VAR CL161 84 a 39 c 6006 b 69 ab 48 a5 VAR CL171AR 84 a 41 b 5792 b 68 b 44 a
Means followed by same letter do not significantly differ (P=.05, Student-Newman-Keuls)Mean comparisons performed only when AOV Treatment P(F) is significant at mean comparison OSL.
Treatment Prob(F) 0.0001 0.002621.961Treatment F
0.18912.498
0.0253 0.84530.00019.547 0.331
2.621Replicate F 0.216 0.444
17.588 10.8210.4787 0.1808
CV 1.13 3.28746.6
Replicate Prob(F) 0.8836 0.65610.88
1.4 2.6
18.689.58 0.870.6 9.3
Crop Stage Main Main
1.7 25.9Standard Deviation 0.9 1.4
1150.4LSD (P=.05)
days inYield Total Mill
Main MainMain
Rating Data Type 50% Head Heightlb/A % %
Whole MillRating Unit
Rice RiceDescription
RiceCrop Name Rice Rice

163
Clearfield Hybrid Yield Comparison 3 (Richland Parish) Experiment number .......................... : 07-RP-12 Site and design ................................... : Location/Cooperator .................. : Richland Parish / Marley Oldham Tillage type .................................. : No Till into soybean stubble Experimental design ................... : Randomized complete block Number of reps ........................... : 4 Plot size ........................................ : 7 x 20 ft Row width/rows per plot ............ : 7 in / 12 Soil type .............................................. : Hebert silty clay % organic matter ........................ : NA pH................................................. : 6.8 Extractable nutrients ppm ......... : Ca-2,356; Cu-2.2; Mg-550; P-18.7; K-158.9; Na-139.7; S-40.2; Zn-1.4 Crop/Variety ...................................... : Rice / Multiple Planting method/date ................. : Drill seeded / March 29 Seeding rate/depth ...................... : Hybrid- 14 seeds/ft2, Commercial- 33 seeds/ft2 / .75 in Emergence date ........................... : See data sheet Harvest date ................................ : August 21 Seed treatment/cwt ............................ : Dithane (fungicide)-114 g Release (gibberellic acid)-10 g Zinche (40.5% Zn)-236 ml Fertilization ........................................ : 120 lb N/A 46-0-0, May 10 45 lb N/A 46-0-0, June 19 (CL171); June 21 (CL161) 30 lb N/A 46-0-0, July 9 (Hybrids) Water management ........................... : Flush ............................................ : Rain, March 31 Flood ............................................ : May 14 Drain ............................................ : August 3 Pest management ............................... : Herbicides.................................... : 1 gal/A Arrosolo + 1 oz/A Permit, April 21 1 gal/A Arrosolo + 1 pt/A Grandstand, May 10 13 oz/A Clincher, May 31 15 oz/A Clincher, June 28 4 oz/A NewPath, May 1 and May 10 Insecticides .................................. : 2 oz/A Karate, June 28 4 oz/A Mustang Max, July 18 Fungicides ................................... : 12 oz/A Quadris, July 18

164
Table 48. Clearfield Hybrid Yield Comparison 3 (Richland Parish).
Trt TreatmentNo. Type Name
1 VAR CLXL730 105 b 47 a 23 3 10603 a 71 a 59 a2 VAR CLXL729 105 b 45 ab 9297 a 71 a 58 a3 VAR CLXP745 102 c 44 ab 10333 a 71 a 56 a4 VAR CL161 109 a 40 b 10 1 7439 b 71 a 62 a5 VAR CL171AR 109 a 43 ab 10 1 7045 b 71 a 63 a
Means followed by same letter do not significantly differ (P=.05, Student-Newman-Keuls)Mean comparisons performed only when AOV Treatment P(F) is significant at mean comparison OSL.
0.9458 0.18150.00020.164 2.679
Treatment Prob(F) 0.0001 0.034313.825Treatment F 21.789 4.4730.0041 0.7053 0.7681
0.1Replicate Prob(F) 0.0003 0.4096
7.604 0.165Replicate F 14.31 1
4.039.83 1.250.9 2.4
CV 1.26 5.07 . .878.8
2.5 6.7Standard Deviation 1.3 2.2 . .
1354LSD (P=.05) 2.1 4.2 . .
Main MainMain
Total Mill
Crop Stage Main Main Main Mainlb/A
8/22/2007
% %Whole Mill
Rating Unit days in % 1-5Yield
RiceCrop Name Rice
Rating Data Type 50% Head Height Ldg-Rate Ldg-Type
Rice Rice Rice Rice RiceRating Date 8/21/2007 8/21/2007 8/21/2007

165
Clearfield Hybrid Yield Comparison 4 (Morehouse Parish) Experiment number .......................... : 07-MP-01 Site and design ................................... : Location/Cooperator .................. : Morehouse Parish / Don Andrews and Roland Crymes Tillage type .................................. : Spring stale Experimental design ................... : Randomized complete block Number of reps ........................... : 4 Plot size ........................................ : 7 x 20 ft Row width/rows per plot ............ : 7 in / 12 Soil type .............................................. : Perry clay % organic matter ........................ : NA pH................................................. : 6.4 Extractable nutrients .................. : Ca-2,561; Cu-2.6; Mg-880; P-18.6; K-333.4; Na-291.7; S-21.0; Zn-4.2 Crop/Variety ...................................... : Rice / Multiple Planting method/date ................. : Drill seeded / May 2 Seeding rate/depth ...................... : Hybrid- 14 seeds/ft2, Commercial- 33 seeds/ft2 / .75 in Emergence date ........................... : May 12 Harvest date ................................ : September 5 Seed treatment/cwt ............................ : NA Fertilization ....................................... : 165 lb N/A 46-0-0, May 31 Water management ........................... : Flush ............................................ : May 4, May 24 Flood ............................................ : June 1 Drain ............................................ : August 24 Pest management ............................... : Herbicides.................................... : 1 qt/A Honcho Plus, May 8 9 oz/A NewPath, May 22 4 qt/A Arrosolo + .67 lb/A Facet, May 30 15 oz/A Clincher + 1 qt/A Oil, June 8 Insecticides .................................. : 2 oz/A Karate, June 8 4 oz/A Mustang Max, July 30 Fungicides ................................... : 12 oz/A Quadris, July 30

166
Table 49. Clearfield Hybrid Yield Comparison 4 (Morehouse Parish).
Trt TreatmentNo. Type Name
1 VAR CLXL730 92 bc 47 a 9587 a 67 b 48 c2 VAR CLXL729 92 c 44 c 9969 a 68 ab 52 b3 VAR CLXP745 89 d 46 b 10315 a 69 ab 53 b4 VAR CL161 95 a 38 d 6215 b 70 a 61 a5 VAR CL171AR 93 b 38 d 6601 b 69 ab 59 a
Means followed by same letter do not significantly differ (P=.05, Student-Newman-Keuls)Mean comparisons performed only when AOV Treatment P(F) is significant at mean comparison OSL.
0.0484 0.001740.839
Treatment Prob(F) 0.0001 0.0001 0.0001103.168 6.519
0.5971 0.6207Treatment F 89.16 151.546
0.287Replicate Prob(F) 0.0853 0.0131 0.548
0.741 0.329Replicate F 2.8 7.818
2.164.53 0.820.6 1.2
CV 0.5 1.42
3.3Standard Deviation 0.5 0.6 387.1
596.4 1.6LSD (P=.05) 0.7 1.1
MainMain Main% %
Crop Stage Main Main
Whole MillRating Unit Days in lb/A
Yield Total MillRating Data Type 50% Head Height
RiceRating Date 9/6/2007 9/6/2007
Rice RiceCrop Name Rice Rice

167
Clearfield Hybrid Yield Comparison 5 (Vermilion Parish) Experiment number .......................... : 07-VP-08 Site and design ................................... : Location/Cooperator .................. : Vermilion Parish / Lounsberry Farm Tillage type .................................. : Conventional Experimental design ................... : Randomized complete block Number of reps ........................... : 4 Plot size ........................................ : 7 x 20 ft Row width/rows per plot ............ : 7 in / 12 Soil type .............................................. : Kaplan silt loam % organic matter ........................ : NA pH................................................. : 5.1 Extractable nutrients .................. : Ca-586; Cu-0.9; Mg-106; P-22.7; K-74.1; Na-39.1; S-7.4; Zn-2.2 Crop/Variety ...................................... : Rice / See data sheet Planting method/date ................. : Drill seeded / March 21 Seeding rate/depth ...................... : Hybrid- 14 seeds/ft2, Commercial- 33 seeds/ft2 / .75 in Emergence date ........................... : March 27 Harvest date ................................ : August 2 Seed treatment/cwt ............................ : Dithane (fungicide)-114 g Release (gibberellic acid)-10 g Zinche (40.5% Zn)-236 ml Fertilization ........................................ : 195 lb/A 0-24-24-2.5, March 21 45 lb N/A 46-0-0 (Commercial midseason), June 1 30 lb N/A 46-0-0 (Hybrid 5% heading), June 19 Water management ........................... : Flush ............................................ : By rain Flood ............................................ : April 21 Drain ............................................ : July 13 Pest management ............................... : Herbicides.................................... : 3 qt Arrosolo, April 6 3 qt Arrosolo + 2.8 oz Grasp + 1 oz Permit, April 19 4 oz NewPath, April 19 Insecticides .................................. : None Fungicides ................................... : 21 oz/A Quilt + 6 oz/A Quadris, June 18

168
Table 50. Clearfield Hybrid Yield Comparison 5 (Vermilion Parish).
Trt TreatmentNo.Type Name
1 VAR CLXL730 93 c 46 a 30 2 9109 b 69 a 57 a2 VAR CLXL729 92 c 44 a . . 9052 b 70 a 60 a3 VAR CLXP745 90 d 45 a . . 9470 a 70 a 56 a4 VAR CL161 95 a 40 b . . 5264 c 65 b 47 b5 VAR CL171AR 94 b 40 b . . 5284 c 69 a 59 a
Means followed by same letter do not significantly differ (P=.05, Student-Newman-Keuls)Mean comparisons performed only when AOV Treatment P(F) is significant at mean comparison OSL.
0.0095 0.00110.000116.396 50.291
Treatment Prob(F) 0.0001 0.0005389.367Treatment F 33.368 17.8520.2273 0.1078 0.2266
2.038Replicate Prob(F) 0.0016 0.4305
1.664 4.264Replicate F 16 0.938
1.832.87 0.980.7 1
CV 0.61 2.69 . .219.1
1.9 2.8Standard Deviation 0.6 1.2 . .
337.6LSD (P=.05) 1.1 2.2 . .
Main MainMain
Total Mill
Crop Stage Main Main Main Mainlb/A
8/2/2007
% %Whole Mill
Rating Unit days in % 1-5Yield
RiceCrop Name Rice
Rating Data Type 50% Head Height Ldg-Rate Ldg-Type
Rice Rice Rice Rice RiceRating Date 7/31/2007 8/2/2007 8/2/2007

169
Evaluation of Tillage, Seeding Rate, and N Rate on Jupiter Rice Agronomic Traits Experiment number .......................... : 07-CS-01-P2 Site and design ................................... : Location/Cooperator .................. : Rice Research Station (South Unit) Tillage type .................................. : Conventional and Fall stale Experimental design ................... : Randomized complete block Number of reps ........................... : 4 Plot size ........................................ : 7 x 20 ft Row width/rows per plot ............ : 7 in / 12 Soil type .............................................. : Crowley silt loam % organic matter ........................ : NA pH................................................. : Extractable nutrients .................. : Crop/Variety ...................................... : Rice / Jupiter Planting method/date ................. : Drill seeded / May 16 Seeding rate/depth ...................... : Variable / .75-1 in Emergence date ........................... : May 31 Harvest date ................................ : September 20 Seed treatment/cwt ............................ : Dithane (fungicide)-114 g Release (gibberellic acid)-10 g Zinche (40.5% Zn)-236 ml Fertilization ........................................ : 195 lb/A 0-24-24-2.5, May 16 Water management ........................... : Flush ............................................ : May 22 Flood ............................................ : July 3 Drain ............................................ : September 10 Pest management ............................... : Herbicides.................................... : 1.5 qt Glyphosate, May 18 4 qt/A Arrosolo + 2.4 pt/A Stelth + 1 oz/A Permit, June 8 5 qt/A Arrosolo + 2.4 pt/A Stelth + 1 oz/A Permit + .75 oz/A Londax, July 2 Insecticides .................................. : 9 lb/A Trebon 3G (preflood), July 3 4 oz/A Mustang Max, August 16 Fungicides ................................... : 21 oz/A Quilt + 6 oz/A Quadris, August 3
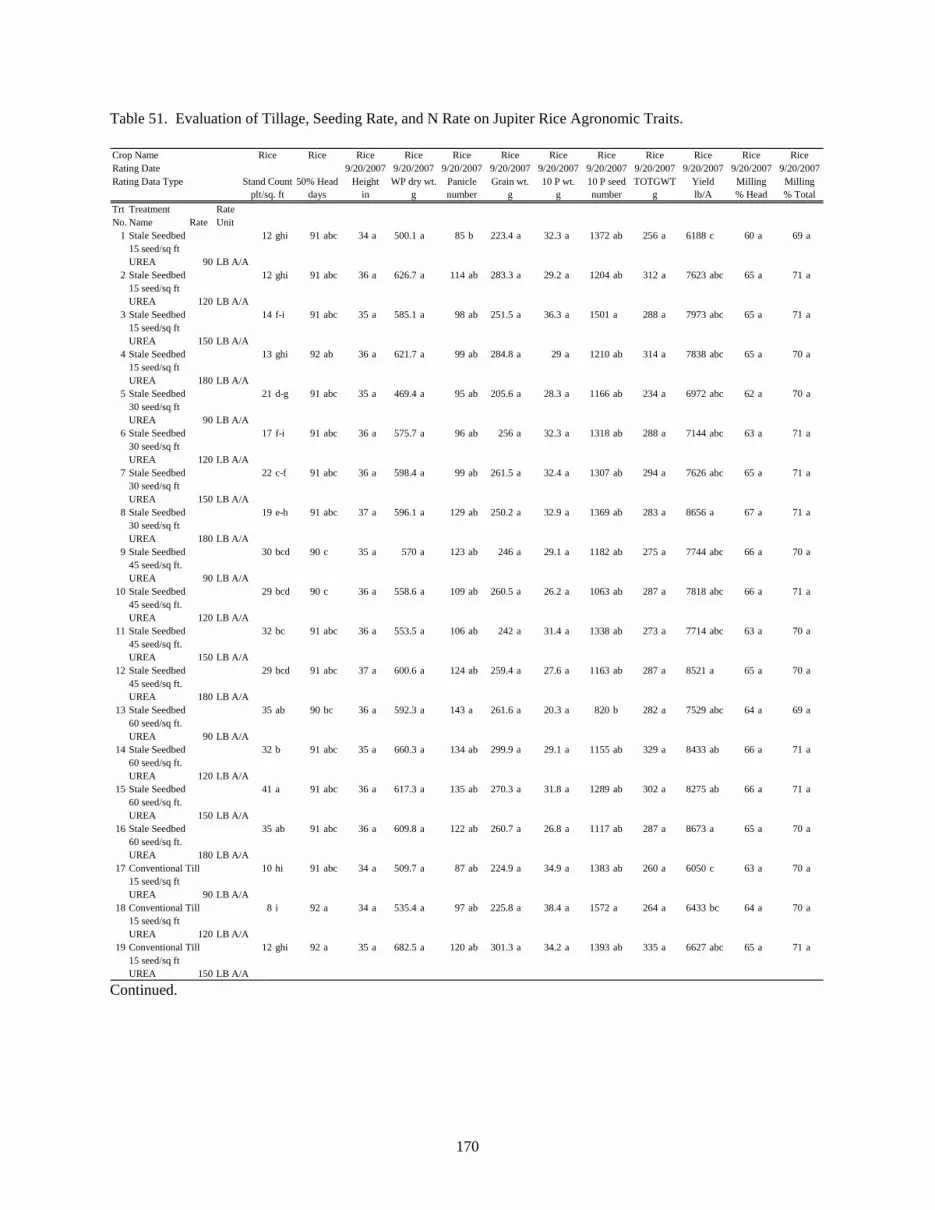
170
Table 51. Evaluation of Tillage, Seeding Rate, and N Rate on Jupiter Rice Agronomic Traits.
Trt Treatment RateNo. Name Rate Unit
1 Stale Seedbed 12 ghi 91 abc 34 a 500.1 a 85 b 223.4 a 32.3 a 1372 ab 256 a 6188 c 60 a 69 a15 seed/sq ftUREA 90 LB A/A
2 Stale Seedbed 12 ghi 91 abc 36 a 626.7 a 114 ab 283.3 a 29.2 a 1204 ab 312 a 7623 abc 65 a 71 a15 seed/sq ftUREA 120 LB A/A
3 Stale Seedbed 14 f-i 91 abc 35 a 585.1 a 98 ab 251.5 a 36.3 a 1501 a 288 a 7973 abc 65 a 71 a15 seed/sq ftUREA 150 LB A/A
4 Stale Seedbed 13 ghi 92 ab 36 a 621.7 a 99 ab 284.8 a 29 a 1210 ab 314 a 7838 abc 65 a 70 a15 seed/sq ftUREA 180 LB A/A
5 Stale Seedbed 21 d-g 91 abc 35 a 469.4 a 95 ab 205.6 a 28.3 a 1166 ab 234 a 6972 abc 62 a 70 a30 seed/sq ftUREA 90 LB A/A
6 Stale Seedbed 17 f-i 91 abc 36 a 575.7 a 96 ab 256 a 32.3 a 1318 ab 288 a 7144 abc 63 a 71 a30 seed/sq ftUREA 120 LB A/A
7 Stale Seedbed 22 c-f 91 abc 36 a 598.4 a 99 ab 261.5 a 32.4 a 1307 ab 294 a 7626 abc 65 a 71 a30 seed/sq ftUREA 150 LB A/A
8 Stale Seedbed 19 e-h 91 abc 37 a 596.1 a 129 ab 250.2 a 32.9 a 1369 ab 283 a 8656 a 67 a 71 a30 seed/sq ftUREA 180 LB A/A
9 Stale Seedbed 30 bcd 90 c 35 a 570 a 123 ab 246 a 29.1 a 1182 ab 275 a 7744 abc 66 a 70 a45 seed/sq ft.UREA 90 LB A/A
10 Stale Seedbed 29 bcd 90 c 36 a 558.6 a 109 ab 260.5 a 26.2 a 1063 ab 287 a 7818 abc 66 a 71 a45 seed/sq ft.UREA 120 LB A/A
11 Stale Seedbed 32 bc 91 abc 36 a 553.5 a 106 ab 242 a 31.4 a 1338 ab 273 a 7714 abc 63 a 70 a45 seed/sq ft.UREA 150 LB A/A
12 Stale Seedbed 29 bcd 91 abc 37 a 600.6 a 124 ab 259.4 a 27.6 a 1163 ab 287 a 8521 a 65 a 70 a45 seed/sq ft.UREA 180 LB A/A
13 Stale Seedbed 35 ab 90 bc 36 a 592.3 a 143 a 261.6 a 20.3 a 820 b 282 a 7529 abc 64 a 69 a60 seed/sq ft.UREA 90 LB A/A
14 Stale Seedbed 32 b 91 abc 35 a 660.3 a 134 ab 299.9 a 29.1 a 1155 ab 329 a 8433 ab 66 a 71 a60 seed/sq ft.UREA 120 LB A/A
15 Stale Seedbed 41 a 91 abc 36 a 617.3 a 135 ab 270.3 a 31.8 a 1289 ab 302 a 8275 ab 66 a 71 a60 seed/sq ft.UREA 150 LB A/A
16 Stale Seedbed 35 ab 91 abc 36 a 609.8 a 122 ab 260.7 a 26.8 a 1117 ab 287 a 8673 a 65 a 70 a60 seed/sq ft.UREA 180 LB A/A
17 Conventional Till 10 hi 91 abc 34 a 509.7 a 87 ab 224.9 a 34.9 a 1383 ab 260 a 6050 c 63 a 70 a15 seed/sq ftUREA 90 LB A/A
18 Conventional Till 8 i 92 a 34 a 535.4 a 97 ab 225.8 a 38.4 a 1572 a 264 a 6433 bc 64 a 70 a15 seed/sq ftUREA 120 LB A/A
19 Conventional Till 12 ghi 92 a 35 a 682.5 a 120 ab 301.3 a 34.2 a 1393 ab 335 a 6627 abc 65 a 71 a15 seed/sq ftUREA 150 LB A/A
Rice Rice RiceCrop Name Rice Rice Rice Rice RiceRating Date
Rice Rice RiceRice
Rating Data Type Stand Count 50% Head9/20/2007 9/20/2007 9/20/20079/20/20079/20/2007 9/20/2007 9/20/2007
10 P wt. 10 P seed9/20/2007 9/20/20079/20/2007
MillingMillingplt/sq. ft days in
TOTGWT YieldHeight WP dry wt. Panicle Grain wt.% Totalg number g g number g lb/A % Head
Continued.

171
Table 51. Continued.
Trt Treatment RateNo. Name Rate Unit20 Conventional Till 9 i 92 ab 36 a 551 a 101 ab 234.2 a 34.1 a 1451 a 268 a 6957 abc 64 a 70 a
15 seed/sq ftUREA 180 LB A/A
21 Conventional Till 17 f-i 91 abc 35 a 613.7 a 110 ab 276.3 a 30.2 a 1176 ab 306 a 7544 abc 62 a 70 a30 seed/sq ftUREA 90 LB A/A
22 Conventional Till 18 f-i 91 abc 36 a 525.8 a 93 ab 230.4 a 28.2 a 1193 ab 259 a 7783 abc 65 a 71 a30 seed/sq ftUREA 120 LB A/A
23 Conventional Till 18 f-i 92 ab 36 a 667.2 a 124 ab 269.8 a 33.6 a 1412 a 303 a 7387 abc 64 a 69 a30 seed/sq ftUREA 150 LB A/A
24 Conventional Till 16 f-i 91 abc 36 a 595.8 a 124 ab 252.1 a 32.1 a 1265 ab 284 a 7596 abc 67 a 71 a30 seed/sq ftUREA 180 LB A/A
25 Conventional Till 28 bcd 91 abc 36 a 591.1 a 116 ab 252.8 a 32.9 a 1327 ab 286 a 7955 abc 60 a 70 a45 seed/sq ft.UREA 90 LB A/A
26 Conventional Till 27 b-e 91 abc 36 a 583 a 113 ab 267.1 a 28.8 a 1143 ab 296 a 8020 abc 63 a 71 a45 seed/sq ft.UREA 120 LB A/A
27 Conventional Till 29 bcd 91 abc 36 a 617.7 a 110 ab 264 a 31.2 a 1267 ab 295 a 7922 abc 65 a 69 a45 seed/sq ft.UREA 150 LB A/A
28 Conventional Till 26 b-e 92 ab 37 a 574.2 a 124 ab 238.1 a 28.5 a 1251 ab 267 a 7978 abc 63 a 69 a45 seed/sq ft.UREA 180 LB A/A
29 Conventional Till 29 bcd 91 abc 37 a 640 a 121 ab 288.2 a 28.4 a 1110 ab 317 a 8511 a 65 a 71 a60 seed/sq ft.UREA 90 LB A/A
30 Conventional Till 27 b-e 91 abc 36 a 632 a 122 ab 279.3 a 32.1 a 1312 ab 311 a 7644 abc 64 a 71 a60 seed/sq ft.UREA 120 LB A/A
31 Conventional Till 33 b 91 abc 36 a 553.8 a 113 ab 241 a 27.7 a 1121 ab 269 a 7719 abc 65 a 71 a60 seed/sq ft.UREA 150 LB A/A
32 Conventional Till 32 bc 91 abc 36 a 577.3 a 142 a 239.1 a 24.4 a 1049 ab 263 a 8046 abc 63 a 70 a60 seed/sq ft.UREA 180 LB A/A
Means followed by same letter do not significantly differ (P=.05, Student-Newman-Keuls)Mean comparisons performed only when AOV Treatment P(F) is significant at mean comparison OSL.
LSD (P=.05) 5.5 0.8 1.9 1111.8 4
Rice Rice
1.8146.92 29.8 77.35 8.15 309.2 78.171.95 14.6 37.88Standard Deviation 3.4 0.5 794.1 2 0.9
CV 14.85 0.513.99 151.4 38.21.1
3.07 1.2212.12 13.33 10.383.22 12.26 12.9 14.78 13.11
0.635 5.044 4.978Replicate F 1.585 13.602 6.902 5.249Replicate Prob(F) 0.2131 0.0001
4.65 6.044 6.0981.049 6.3050.3565 0.0175 0.4317 0.032 0.033 0.0389
1.953 0.7030.0289
Treatment F 21.326 3.665 1.4120.0197 0.0008 0.0133
Treatment Prob(F) 0.0001 0.00012.835 1.465 1.3110.884 2.235 0.722 1.622
0.0918 0.0335 0.83430.1237 0.6327 0.0142 0.8153 0.0001 0.1466 0.2275
Crop Name Rice Rice Rice Rice Rice Rice Rice Rice Rice RiceRating Date 9/20/2007 9/20/2007 9/20/2007 9/20/2007 9/20/2007 9/20/2007 9/20/2007 9/20/2007 9/20/2007 9/20/2007Rating Data Type Stand Count 50% Head Height WP dry wt. Panicle Grain wt. 10 P wt. 10 P seed TOTGWT Yield Milling Milling
plt/sq. ft days in g number % Totalg g number g lb/A % Head

172
Evaluation of Tillage, Seeding Rate, and N Rate on Cheniere Rice Agronomic Traits Experiment number .......................... : 07-CS-02-P2 Site and design ................................... : Location/Cooperator .................. : Rice Research Station (South unit) Tillage type .................................. : Conventional & Fall stale Experimental design ................... : Randomized complete block Number of reps ........................... : 4 Plot size ........................................ : 7 x 20 ft Row width/rows per plot ............ : 7 in / 12 Soil type .............................................. : Crowley silt loam % organic matter ........................ : NA pH................................................. : Extractable nutrients .................. : Crop/Variety ...................................... : Rice / Cheniere Planting method/date ................. : Drill seeded / May 16 Seeding rate/depth ...................... : Variable / .75-1 in Emergence date ........................... : May 31 Harvest date ................................ : September 19 Seed treatment/cwt ............................ : Dithane (fungicide)-114 g Release (gibberellic acid)-10 g Zinche (40.5% Zn)-236 ml Fertilization ........................................ : 195 lb/A 0-24-24-2.5, May 16 Water management ........................... : Flush ............................................ : May 22 Flood ............................................ : July 3 Drain ............................................ : September 10 Pest management ............................... : Herbicides.................................... : 1.5 qt Glyphosate, May 18 4 qt/A Arrosolo + 2.4 pt/A Stelth + 1 oz/A Permit, June 8 5 qt/A Arrosolo + 2.4 pt/A Stelth + 1 oz/A Permit + .75 oz/A Londax, July 2 Insecticides .................................. : 9 lb/A Trebon 3G (preflood), July 3 4 oz/A Mustang Max, August 16 Fungicides ................................... : 21 oz/A Quilt + 6 oz/A Quadris, August 3

173
Table 52. Evaluation of Tillage, Seeding Rate, and N Rate on Cheniere Rice Agronomic Traits.
Trt Treatment RateNo. Name Rate Unit
1 Stale Seedbed 10 ghi 92 a-d 36 a 510.5 a 87 b 214.9 a 33.3 a 1536 a 248 a 6101 a 65 ab 71 ab15 seed/sq ftUREA 90 LB A/A
2 Stale Seedbed 12 f-i 92 a-d 37 a 573.6 a 105 ab 246 a 31.3 a 1468 a 277 a 6355 a 64 ab 71 ab15 seed/sq ftUREA 120 LB A/A
3 Stale Seedbed 12 ghi 92 a-d 37 a 606.8 a 112 ab 262 a 30.8 a 1470 a 293 a 6387 a 62 ab 69 ab15 seed/sq ftUREA 150 LB A/A
4 Stale Seedbed 13 f-i 92 a-d 37 a 680.8 a 126 ab 299.4 a 33.1 a 1599 a 332 a 6709 a 63 ab 70 ab15 seed/sq ftUREA 180 LB A/A
5 Stale Seedbed 22 a-i 90 d 36 a 649.8 a 129 ab 282 a 27.9 a 1225 a 310 a 6989 a 65 ab 71 ab30 seed/sq ftUREA 90 LB A/A
6 Stale Seedbed 24 a-h 91 cd 37 a 549.6 a 111 ab 232.2 a 27.4 a 1237 a 260 a 6897 a 65 ab 72 a30 seed/sq ftUREA 120 LB A/A
7 Stale Seedbed 21 b-i 91 a-d 37 a 620.2 a 129 ab 262.2 a 30.9 a 1447 a 293 a 7347 a 63 ab 70 ab30 seed/sq ftUREA 150 LB A/A
8 Stale Seedbed 27 a-e 92 a-d 38 a 633.1 a 133 ab 263 a 29 a 1381 a 292 a 7252 a 65 ab 71 ab30 seed/sq ftUREA 180 LB A/A
9 Stale Seedbed 28 a-e 90 d 36 a 606.2 a 143 a 248 a 27.7 a 1266 a 276 a 5658 a 65 ab 72 ab45 seed/sq ft.UREA 90 LB A/A
10 Stale Seedbed 28 a-e 91 bcd 37 a 588.1 a 130 ab 251.9 a 27.5 a 1287 a 279 a 7085 a 65 ab 71 ab45 seed/sq ft.UREA 120 LB A/A
11 Stale Seedbed 24 a-g 91 bcd 36 a 616.8 a 137 ab 249.9 a 26.5 a 1288 a 276 a 6775 a 64 ab 71 ab45 seed/sq ft.UREA 150 LB A/A
12 Stale Seedbed 29 a-e 91 cd 36 a 65 3 613.2 a 145 a 238.1 a 24.1 a 1136 a 262 a 6876 a 66 a 72 ab45 seed/sq ft.UREA 180 LB A/A
13 Stale Seedbed 36 ab 90 d 36 a 70 3 565.6 a 127 ab 214.7 a 26.5 a 1213 a 241 a 6527 a 66 a 72 a60 seed/sq ft.UREA 90 LB A/A
14 Stale Seedbed 37 a 90 d 36 a 615.4 a 143 a 230.7 a 28.8 a 1239 a 259 a 6958 a 65 ab 72 a60 seed/sq ft.UREA 120 LB A/A
15 Stale Seedbed 31 a-e 91 cd 37 a 600.7 a 122 ab 233.8 a 27.9 a 1335 a 262 a 6943 a 64 ab 71 ab60 seed/sq ft.UREA 150 LB A/A
16 Stale Seedbed 35 abc 91 a-d 36 a 70 2 597.8 a 140 ab 227.3 a 24.9 a 1185 a 252 a 7319 a 65 ab 71 ab60 seed/sq ft.UREA 180 LB A/A
17 Conventional Till 9 hi 92 a-d 37 a 464.8 a 89 b 194.7 a 32.6 a 1389 a 227 a 5682 a 65 ab 71 ab15 seed/sq ftUREA 90 LB A/A
18 Conventional Till 10 ghi 92 a-d 37 a 537.8 a 99 ab 236.8 a 31.2 a 1427 a 268 a 5544 a 66 a 72 a15 seed/sq ftUREA 120 LB A/A
19 Conventional Till 11 ghi 94 ab 38 a 580.4 a 98 ab 239.3 a 31.6 a 1538 a 271 a 5972 a 64 ab 71 ab15 seed/sq ftUREA 150 LB A/A
Crop Name Rice Rice Rice RiceRating Date 6/12/2007
Rice Rice Rice Rice9/18/2007 9/18/20079/18/2007 9/18/2007 9/18/2007
RiceRice Rice Rice Rice
Rating Data Type Stand count 50% Head9/18/2007
Rice9/18/2007 9/18/20079/18/2007 9/18/2007 9/18/2007 9/18/2007
Rating Unit plt/sq. ft daysPanicle # Grain wt. 10 P wt.Height Ldg-rate Ldg-Type WP dry wt.
in % 1-5Yield Milling Milling10 P seed TOTGWTlb/A Head Totalg number g g number g
Continued.

174
Table 52. Continued.
Trt Treatment RateNo. Name Rate Unit20 Conventional Till 9 i 94 a 36 a 578.1 a 110 ab 228.9 a 31.9 a 1496 a 261 a 5893 a 64 ab 71 ab
15 seed/sq ftUREA 180 LB A/A
21 Conventional Till 18 d-i 92 a-d 38 a 532.1 a 116 ab 248.1 a 27.6 a 1281 a 276 a 6522 a 63 ab 70 ab30 seed/sq ftUREA 90 LB A/A
22 Conventional Till 22 a-i 92 a-d 37 a 633.6 a 126 ab 268.5 a 29.6 a 1378 a 298 a 6769 a 65 ab 71 ab30 seed/sq ftUREA 120 LB A/A
23 Conventional Till 21 c-i 92 a-d 38 a 630.4 a 137 ab 256.5 a 30.6 a 1401 a 287 a 6417 a 64 ab 70 ab30 seed/sq ftUREA 150 LB A/A
24 Conventional Till 16 e-i 94 abc 38 a 40 1 600.8 a 116 ab 243 a 30.4 a 1510 a 273 a 6880 a 63 ab 70 ab30 seed/sq ftUREA 180 LB A/A
25 Conventional Till 28 a-e 91 a-d 36 a 554.2 a 123 ab 211.5 a 31 a 1409 a 242 a 7697 a 65 ab 72 ab45 seed/sq ft.UREA 90 LB A/A
26 Conventional Till 27 a-e 91 a-d 37 a 516.9 a 109 ab 202.8 a 28.3 a 1245 a 231 a 6838 a 64 ab 71 ab45 seed/sq ft.UREA 120 LB A/A
27 Conventional Till 28 a-e 91 bcd 36 a 564.3 a 136 ab 218.2 a 26.1 a 1213 a 244 a 6848 a 66 a 72 ab45 seed/sq ft.UREA 150 LB A/A
28 Conventional Till 26 a-f 92 a-d 37 a 540.4 a 110 ab 208.2 a 28.6 a 1369 a 237 a 6874 a 63 ab 69 ab45 seed/sq ft.UREA 180 LB A/A
29 Conventional Till 30 a-e 91 a-d 36 a 494.7 a 107 ab 195.7 a 26.3 a 1182 a 222 a 6637 a 63 ab 70 ab60 seed/sq ft.UREA 90 LB A/A
30 Conventional Till 34 abc 91 a-d 36 a 618.3 a 131 ab 254.3 a 24 a 1097 a 278 a 6721 a 61 b 69 b60 seed/sq ft.UREA 120 LB A/A
31 Conventional Till 30 a-e 92 a-d 37 a 544.6 a 113 ab 218.2 a 29.9 a 1466 a 248 a 6725 a 63 ab 69 ab60 seed/sq ft.UREA 150 LB A/A
32 Conventional Till 31 a-d 92 a-d 36 a 601 a 124 ab 232.4 a 27.9 a 1361 a 260 a 6493 a 64 ab 70 ab60 seed/sq ft.UREA 180 LB A/A
Means followed by same letter do not significantly differ (P=.05, Student-Newman-Keuls)Mean comparisons performed only when AOV Treatment P(F) is significant at mean comparison OSL.
383.9 58.21.8 . .LSD (P=.05) 8.3 1.7Standard Deviation 5.1 1
1230 2.3 1.8105.89 28.5 56.03 7.87
CV 21.97 1.1114 27.44 3.851.1 . . 51.86
3.03 . .878.5 1.1 0.9188 28.513.22 1.78 1.218.91 11.59 11.53 13.34 13.97 10.68
0.207 3.9183.207Replicate F 3.309 7.991Replicate Prob(F) 0.0431 0.0008
4.364 8.734 7.6958.636 6.597 3.552 1.4870.0059 0.0093
Treatment F 8.943 2.90.0153 0.0689 0.2318 0.652 0.0567
0.949 1.5031.1460.00640.0473 0.0062
Treatment Prob(F) 0.0001 0.00021.329 1.921 2.3851.712 2.478 1.572 0.861
0.6603 0.5576 0.13120.3181 0.0699 0.1497 0.037 0.009
Crop Name Rice Rice Rice Rice
0.0069 0.1068
Rice Rice Rice Rice Rice Rice Rice Rice Rice RiceRating Date 6/12/2007 9/18/2007 9/18/2007 9/18/2007 9/18/2007 9/18/2007 9/18/2007 9/18/2007 9/18/2007 9/18/2007 9/18/2007 9/18/2007 9/18/2007Rating Data Type Stand count 50% Head Height Ldg-rate Ldg-Type WP dry wt. Panicle # Grain wt. 10 P wt. 10 P seed TOTGWT Yield Milling MillingRating Unit plt/sq. ft days in % 1-5 g number Totalg g number g lb/A Head

175
Evaluation of Crop Rotation and Tillage Systems in Rice Production – Year 3 Experiment number .......................... : 07-CS-20 and 07-CS-21 Site and design ................................... : Location/Cooperator .................. : Rice Research Station (South Unit) Tillage type .................................. : No-till Experimental design ................... : Randomized complete block Number of reps ........................... : 4 Plot size ........................................ : 20 x 50 ft Row width/rows per plot ............ : 7 in / 34 Soil type .............................................. : Crowley silt loam % organic matter ........................ : NA pH................................................. : See data sheet Extractable nutrients .................. : See data sheet Crop/Variety ...................................... : Rice / Cheniere Planting method/date ................. : Drill seeded / April 24 Seeding rate/depth ...................... : 75 lb/A / .75 in Emergence date ........................... : April 30 Harvest date ................................ : August 30 Seed treatment/cwt ............................ : Dithane (fungicide)-114 g Release (gibberellic acid)-10 g Zinche (40.5% Zn)-236 ml Fertilization ........................................ : 250 lb/A 8-24-24, May 10 Water management ........................... : Flush ............................................ : Rain Flood ............................................ : June 12 Drain ............................................ : August 14 Pest management ............................... : Herbicides.................................... : 1 qt/A Glyphosate + 1 qt/A 2, 4-D, February 9 1.5 qt/A Glyphosate, April 9 1 qt/A Glyphosate, April 27 1 gal/A Arrosolo + 2.4 pt/A Prowl + 1 oz/A Permit + .75 oz/A Londax, May 15 5 qt/A Arrosolo + 2.4 pt/A Stelth + 1 oz/A Permit, June 8 Insecticides .................................. : None Fungicides ................................... : 19 oz/A Stratego, July 18


Table 55. Main effect results for Mehlich-3 extractable nutrients from a depth of 0 to 6 inches taken during the spring and fall of 2007.
Conventional 52 a 60 b 108 a 111 a 8.5 a 6.8 a 1698 b 1821 a 269 a 285 a 118 a 111 a 1.8 a 0.9 b 6.8 a 10 aNo-Till 60 a 73 a 102 a 106 a 8.6 a 6.4 a 1834 a 1919 a 216 b 245 b 90 b 81 b 1.6 b 1.1 a 6.6 a 15 a
Rice-Rice 54 a 65 a 104 a 107 a 10.2 a 6.5 a 1792 a 1912 a 243 a 280 a 125 a 108 a 1.6 b 1.1 a 6.2 a 12 aRice-Fallow 53 a 65 a 105 a 107 a 8.4 a 6.9 a 1743 a 1891 a 243 a 263 ab 101 b 96 a 1.8 ab 1.0 a 6.0 a 13 aRice-Soybean 62 a 67 a 101 a 104 a 7.4 a 6.3 a 1745 a 1798 a 233 a 250 b 97 b 91 a 1.6 ab 0.9 a 7.1 a 11 aRice-Sorghum 54 a 68 a 111 a 115 a 8.2 a 6.5 a 1786 a 1878 a 250 a 268 ab 92 b 88 a 1.8 a 1.0 a 7.4 a 14 a
SpringNa
FallP† K S Ca Mg
Spring FallCu Zn
Spring Fall Spring Fall Spring Fall
†Means within each column followed by a different letter are significantly different at the P = 0.05 level of confidence as determined by the Duncan post hoc test.
Spring Fall
---------------------------------------------------------------------------------mg kg-1--------------------------------------------------------------------------------
Tillage
Rotation
Spring Fall Spring Fall
177

178
Evaluation of Flat vs. Raised Seedbeds for Group IV and Group V Soybeans
Experiment number .......................... : 07-CS-03 Site and design ................................... : Location/Cooperator .................. : Rice Research Station (South Unit) Tillage type .................................. : Spring stale Experimental design ................... : Randomized complete block Number of reps ........................... : 4 Plot size ........................................ : 10 x 30 ft Row width/rows per plot ............ : 30 in / 4 Soil type .............................................. : Crowley silt loam % organic matter ........................ : NA pH................................................. : NA Extractable nutrients ppm.......... : NA Crop/Variety ...................................... : Soybean / Multiple Planting method/date ................. : Drill seeded / May 25 Seeding rate/depth ...................... : NA / 1.5 inches Emergence date ........................... : Variable Harvest date ................................ : October 26 Seed treatment/cwt ............................ : None Fertilization ........................................ : 250 lb/A 8-24-24, May 10 Water management ........................... : Flush ............................................ : NA Flood ............................................ : NA Drain ............................................ : NA Pest management ............................... : Herbicides.................................... : 1.5 qt/A Glyphosate, May 21, July 12, August 20 1.25 qt/A Glyphosate, June 13, September 21 Insecticides .................................. : 4 oz/A Mustang Max, August 3, September 19 4 oz/A Mustang Max + 8.5 oz/A Steward, August 16 Fungicides ................................... : 10 oz/A Stratego + 2 oz/A Uppercut + 2 oz/A Interlock, July 19

179
Table 56. Evaluation of Flat vs. Raised Seedbeds for Group IV and Group V Soybeans.
Trt TreatmentNo. Type Name
1 VAR 95M30 124 b 24 d 4.2 bc 49 aCULT Flat Seedbed
2 VAR 95M30 128 ab 31 abc 2 a 7 a 52 aCULT Raised Seedbed
3 VAR DG5555RR 132 a 27 bcd 1 a 4.7 abc 61 aCULT Flat Seedbed
4 VAR DG5555RR 132 a 35 a 2 a 6.2 ab 62 aCULT Raised Seedbed
5 VAR DK4753 117 c 29 a-d 1 a 5.1 abc 54 aCULT Flat Seedbed
6 VAR DK4753 117 c 33 ab 1 a 6.5 ab 59 aCULT Raised Seedbed
7 VAR DPL5634 130 a 30 a-d 1 a 5.9 ab 63 aCULT Flat Seedbed
8 VAR DPL5634 133 a 35 a 2 a 6.5 ab 61 aCULT Raised Seedbed
9 VAR TV55R15 132 a 25 cd 3.2 c 55 aCULT Flat Seedbed
10 VAR TV55R15 133 a 32 ab 2 a 4.4 bc 61 aCULT Raised Seedbed
Means followed by same letter do not significantly differ (P=.05, Student-Newman-Keuls)Mean comparisons performed only when AOV Treatment P(F) is significant at mean comparison OSL.
0.0016 0.32485.118 1.254
Treatment Prob(F) 0.0001 0.0001 0.3705Treatment F 20.602 7.617 1.296
0.9593 0.0290.042 4.338
Replicate Prob(F) 0.1551 0.8145 0.6267Replicate F 2.071 0.208 0.5
17.62 12.41CV 1.89 8.37 52.370.94 7.21.62 12.3
Standard Deviation 2.4 2.5 0.8LSD (P=.05) 4.1 4.3 1.5
R8 R8row ft
Crop Stage R8 R8 R8Sample Size Unit
plants bu/AStand Cnt. Yield
Rating Unit days in 1-5Rating Data Type Maturity Height Ldg-Type
10/25/2007 10/25/2007Soybeans Soybeans
Rating Date 10/25/2007 10/25/2007Crop Name Soybeans Soybeans Soybeans

180
Evaluation of Sweet Sorghum Varieties as a Potential Biofuel Source, 2007 Experiment number .......................... : 2007 Sweet Sorghum Trial Site and design ................................... : Location/Cooperator .................. : Rice Research Station (South Unit) Tillage type .................................. : Conventional Experimental design ................... : Randomized complete block Number of reps ........................... : 4 Plot size ........................................ : 10 x 30 ft Row width/rows per plot ............ : 30 in / 4 Soil type .............................................. : Crowley silt loam % organic matter ........................ : pH................................................. : Extractable nutrients .................. : Crop/Variety ...................................... : Sweet Sorghum / Multiple Planting method/date ................. : Drill seeded / April 20 Seeding rate/depth ...................... : 1.5 lb/A / 1-inch depth Emergence date ........................... : April 25 Harvest date ................................ : August 13 Seed treatment/cwt ............................ : None Fertilization ........................................ : 250 lb/A 8-24-24, May 10; 90 lb N/A 46-0-0, May 23 Pest management ............................... : Herbicides.................................... : 1.33 pt Dual Magnum II + 3.5 pt Atrazine, tank mix at 10 GPA, May 9,
cultivated May 23 Insecticides .................................. : 3 oz Mustang Max, May 18 4 oz Mustang Max, July 23 Fungicides ................................... : None

Table 57. Agronomic results of sweet sorghum variety trial for potential biofuel source, 2007.
Trt TreatmentNo. Type Name
1 VAR Dale 138 b 27 a 21 a 16 a 88 d 18 a 53 a 12 a 67 a 153 a 3.0 a2 VAR M81-E 155 a 27 a 21 a 18 a 111 b 13 c 30 b 7 b 53 b 72 b 2.2 a3 VAR Theis 153 a 24 a 18 a 13 a 105 c 16 b 29 b 7 b 42 c 48 c 2.3 a4 VAR Topper 76-6 130 b 28 a 22 a 17 a 115 a 14 c 27 b 6 b 44 c 49 c 2.5 a
† This is a rough estimate of fermentable solids determined by: stalk biomass x BRIX x 0.80
Means followed by same letter do not significantly differ (P=.05, Student-Newman-Keuls).Mean comparisons performed only when AOV Treatment P(F) is significant at mean comparison OSL.
0.0001 0.0001 0.0001 0.0001 0.341355.32 90.39 1.27
Treatment Prob(F) 0.0013 0.8244 0.7883 0.3800 0.0001
0.55Treatment F 12.92 0.30 0.35 1.15 47.70 89.16 89.10
0.02 0.00 0.00 0.00 0.0012.95 13.13 9.16 12.81 0.75
Replicate Prob(F) 0.68 0.22 0.27 0.90
5.88 12.95 23.42
Replicate F 0.53 1.79 1.54 0.19 6.09
0.58CV 4.72 22.25 23.48 25.13 3.77 7.38 7.17
0.6 2.6 0.6 3 10.44.1 0.9 4.9 16.6 0.93
Standard Deviation 6.8 5.9 4.8 4.1
maturity maturity maturity
LSD (P=.05) 10.8 9.4 7.7 6.5 0.9
ton/ACrop Stage maturity maturity maturity maturity maturity maturity maturity maturity
days BRIX POL %Rating Data Type total stalk plantsRating Unit in ton/A ton/A 10row ft
Stalk Stalk Stalk StalkStalk
SolidsPart Rated Stalk Sol. Solids POL Sucrose Purity TRSermentable†Description Plant Ht. Biomass BiomassStand Count 50% Head
181

182
FOUNDATION SEED RICE PROGRAM Lawrence M. White III INTRODUCTION Foundation seed rice has been produced by the LSU AgCenter’s Rice Research Station for distribution to Louisiana farmers since 1949. The Rice Research Station's seed rice program was instituted in response to the critical shortage of pure planting stocks that existed during and after World War II. Since its inception, the program has made available to Louisiana growers more than 155,000 cwt. of pedigreed stock of 37 rice varieties. Concurrent with the distribution of pure seed by the Rice Research Station, an industry was developed in Louisiana composed of independent seed dealers through whom farmers could conduct trade in registered and certified classes of pedigreed rice. Foundation seed rice, the planting stock from which registered and certified seed are produced, is the farmer's link with the work of the plant breeder. It is the product of hybridization and successive generations of selection and testing to establish its value as crop seed and eventually as a commercial commodity. For this reason, foundation seed and the basic stocks from which it is produced must be grown and conditioned in a manner that will ensure that viability is maintained and that it be genetically pure and free from mechanical mixtures or contamination by noxious weeds. Through the Rice Research Station's seed program, Louisiana farmers may obtain seed rice of improved varieties developed through the Rice Research Station’s breeding program and of established commercial varieties originating either at Crowley or at research centers in neighboring states. To fulfill the objectives of the seed program, the Rice Research Station uses the personnel, land, machinery, and other facilities needed to plant, harvest, condition, and store its annual seed rice crop. The production of breeder seed, planting stock for the foundation fields, and the maintenance of purity in commercial rice varieties are functions of the seed program. Breeder seed is sometimes grown within fields of foundation rice or in a special nursery set aside for propagating the Rice Research Station's seed stocks. The nursery also serves as a site for evaluating, purifying, and increasing selections from the Rice Research Station’s breeding program that show promise as new varieties. The distribution of pedigreed seed rice produced by the Rice Research Station is done according to a formula adopted by the Louisiana Seed Rice Growers Association. For each rice-producing parish, the amount of seed allotted is determined by the percentage of the state's total rice acreage grown in that parish during the previous crop year. Personnel of the Louisiana Cooperative Extension Service, in cooperation with parish committees of the Seed Rice Growers Association, assist in the allocation of foundation seed rice. It is at the parish committee level that the allocation of seed to individual growers is decided. The county agents receive applications for seed rice from growers and handle information and publicity for the pure seed program. In this state, the official seed-certifying agency for all crops is the Louisiana Department of Agriculture and Forestry. The rules and regulations pertaining to the certification of agricultural seeds are part of the Louisiana Seed Law. They are formulated by the Louisiana Seed Commission and enforced by the Agronomic Programs Division of the Louisiana Department of Agriculture and Forestry. Personnel of the Agronomic Programs Division, operating from district offices, conduct field inspections of growing rice and sampling of bagged rice for laboratory analyses, which consist of purity determinations and germination tests.

183
PRODUCTION PRACTICES Each year, the Rice Research Station devotes approximately 80 acres of land to the production of foundation seed rice. To eliminate noxious weeds, especially red rice, that can disqualify rice from certification, the fields are fallowed for a 2-year period preceding planting. This also enables the fields to meet the crop history requirements specified in the seed rice regulations. Seedbed preparation of foundation fields are performed in the fall. Burndown herbicides are applied prior to seeding. The foundation fields are planted into a stale seedbed by means of a 24-runner minimum tillage drill. The breeder stock is planted at rates that may vary from 10 to 100 lb/A. The rice receives a preflood application of urea in which the rate of N may vary from 45 to 90 lb/A, as well as basic fertilizer applications based on soil test recommendations. A midseason application of N in rates from 21 to 55 lb/A is also applied. Seedling grasses and weeds are controlled by means of commercially available herbicides applied by airplane or ground rig. Similarly, aerial applications of insecticides are used to protect the fields from outbreaks of harmful insects. Roguing of the rice fields for the removal of off-types, varietal mixtures, and noxious weeds begins at the onset of heading and continues until the rice is harvested. During this interval, the headed rice is inspected by personnel of the Agronomic Programs Division to determine whether it meets minimum field standards of the certifying agency. The rice is harvested with a conventional combine and dried in the Rice Research Station's eight 21-foot diameter grain bins, equipped with vented drying floors and centrifugal fans with temperature-controlled heaters. The rice is dried to a moisture level of approximately 12%. During the storage period between drying and cleaning, the rice is treated with an insecticide to protect it from stored-grain insects. Cleaning of foundation and breeder seed usually commences in late October and continues until late December. The rice first moves through an air-and-screen cleaner that removes chaff, straw, and other foreign material and grades the grain according to width and thickness. It then flows through three length-grading machines that consist of rotating, indented metal cylinders. The first two remove small grains and broken or dehulled kernels of rice. The third one removes stemmy rice, grains that have very long awns that are attached to portions of the panicle. In the next phase of cleaning, the rice moves through a machine that performs precision grading of the grain by means of rotating perforated cylinders. This machine is designed to separate medium-grain and/or red rice from long-grain rice. It is also capable of removing shriveled and other slender kernels from medium-grain rice. In the final phase of cleaning, the rice moves through a machine that aspirates the grain, removing any chaff, straw, and other foreign material from the conditioned product. From the cleaning machines, foundation and breeder seed rice are bagged, assigned lot numbers, and placed in storage in the Rice Research Station's seed rice warehouse where they remain until they are distributed to Louisiana farmers. The field and laboratory purity standards for foundation seed rice are very strict with regard to varietal mixtures and noxious weeds. In all phases of production, therefore, great care must be exercised to prevent these impurities from contaminating the seed stocks. To that end, it is routine procedure at the Rice Research Station to partially disassemble all planting and harvesting equipment and to clean it thoroughly with water and/or compressed air before using it in the field. The dryer and cleaning plant, including all elevators and other conveying equipment, are also subjected to meticulous cleaning and inspection before and after having been used in stubble fields. Therefore, tractors, plows, harrows, and land levelers are carefully washed before they enter land that is in a fallow cycle. These measures, together with the inspection and roguing, which are done during the growing season, help to ensure that foundation seed is genetically pure and free of mechanical mixtures and noxious weed seeds.

184
2007 ACTIVITIES Of the 1,552 cwt. of foundation seed rice sold in 2007, the varieties and quantities were as follows: Cocodrie, 494 cwt.; Trenasse, 301 cwt.; Cheniere, 374 cwt.; Jupiter, 191 cwt.; Bengal, 56 cwt.; Dellrose, 43 cwt.; Pirogue, 40 cwt.; Ecrevisse, 24 cwt; Toro-2, 16 cwt.; and Della, 13 cwt. The Rice Research Station's foundation seed crop in 2007 consisted of 19 acres of Cheniere, 19 acres of Catahoula (a new long-grain variety), 8 acres of Jupiter, 5 acres of Cypress, 4.5 acres of Neptune (a new medium-grain variety), 2 acres of Della, and .5 acre of Ecrevisse. Headrows of Cypress, Jupiter, Cocodrie, Neptune, Cheniere, Trenasse, Catahoula, Bengal, Della, and Ecrevisse were grown for replenishment of breeder seed stock.

185
RICE PHYSIOLOGY
INTRODUCTION
Plant growth regulators (PGRs) have a significant effect on crop production because of their ability to alter plant growth and development. Therefore, studies of PGR modifications to plant growth and development that improve rice production were conducted. In greenhouse and small plot trials, emergence has been improved with PGRs that cause mesocotyl, coleoptile, and leaf elongation. The mesocotyl and coleoptile are short in semidwarf cultivars, and seeding more than 2 inches below the soil surface can result in poor stands. In addition, seedling height of semidwarf rice increases slowly, resulting in poor seedling vigor. Small plot studies were conducted to evaluate the effects of PGRs on seedling vigor of new and existing varieties and experimental lines under different management practices, including early planting, deep planting depth, and conventional drill seeding. Ratoon or second crop production in rice is directly dependent on growth from buds located at the base and at nodes on first crop stubble remaining after harvest. These buds remain dormant during the first crop. Plant growth regulators and stubble management were evaluated to determine their effects on ratoon crop growth and development.
Some PGRs are reported to increase grain yield directly. Several of these were evaluated. To address the objectives of emergence and seedling vigor improvement and yield enhancement in rice, PGRs were tested for their effects on rice growth and development.
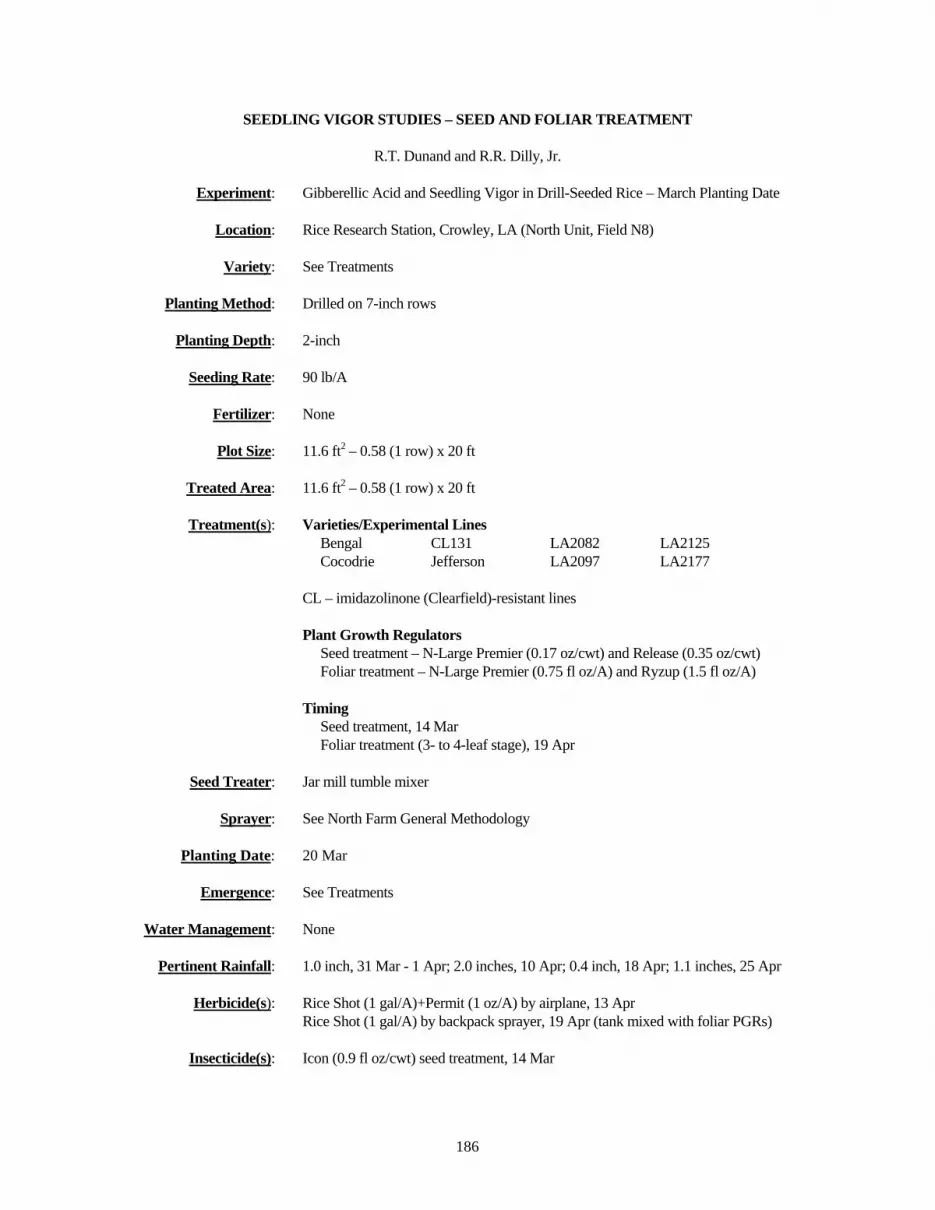
186
SEEDLING VIGOR STUDIES – SEED AND FOLIAR TREATMENT
R.T. Dunand and R.R. Dilly, Jr. Experiment: Gibberellic Acid and Seedling Vigor in Drill-Seeded Rice – March Planting Date Location: Rice Research Station, Crowley, LA (North Unit, Field N8) Variety: See Treatments Planting Method: Drilled on 7-inch rows Planting Depth: 2-inch Seeding Rate: 90 lb/A Fertilizer: None Plot Size: 11.6 ft2 – 0.58 (1 row) x 20 ft Treated Area: 11.6 ft2 – 0.58 (1 row) x 20 ft Treatment(s): Varieties/Experimental Lines Bengal CL131 LA2082 LA2125 Cocodrie Jefferson LA2097 LA2177 CL – imidazolinone (Clearfield)-resistant lines Plant Growth Regulators Seed treatment – N-Large Premier (0.17 oz/cwt) and Release (0.35 oz/cwt) Foliar treatment – N-Large Premier (0.75 fl oz/A) and Ryzup (1.5 fl oz/A) Timing Seed treatment, 14 Mar Foliar treatment (3- to 4-leaf stage), 19 Apr Seed Treater: Jar mill tumble mixer Sprayer: See North Farm General Methodology Planting Date: 20 Mar Emergence: See Treatments Water Management: None Pertinent Rainfall: 1.0 inch, 31 Mar - 1 Apr; 2.0 inches, 10 Apr; 0.4 inch, 18 Apr; 1.1 inches, 25 Apr Herbicide(s): Rice Shot (1 gal/A)+Permit (1 oz/A) by airplane, 13 Apr Rice Shot (1 gal/A) by backpack sprayer, 19 Apr (tank mixed with foliar PGRs) Insecticide(s): Icon (0.9 fl oz/cwt) seed treatment, 14 Mar

187
Fungicide(s): Dithane DF (4 oz/cwt) seed treatment, 14 Mar Plant Growth Regulator(s): See Treatments Harvest Date: Not applicable Harvested Area: Not applicable Experimental Design: Randomized complete block design and four replications. Factorial treatment
arrangement was as follows. A given plot contained a different variety or experimental line in each row. The position of a variety or experimental line within a given plot was constant. Each given plot was planted in triplicate in each replicate. Each given plot contained four or five rows in accommodating four varieties and five experimental lines. Of each triplicate, one plot had untreated seed (no gibberellic acid) and the other two plots had seed treated with N-Large Premier or Release according to the randomization of plots.
Comments: Seedling Vigor – Emergence and Plant Population Density (Stand) Germplasm (varieties/experimental lines) and seed treatment with gibberellic acid had a significant effect on emergence of rice (Table 1). Time to stand, an evaluation of emergence, was the number of days from planting to establishment of an adequate stand (10 plants/ft2). Germplasm, on average, had a moderate emergence rate with a time to stand of 11 to 20 days after planting (DAP). The evaluation period was 28 days. Any germplasm that had not obtained an adequate stand by 28 DAP was assigned a time to stand of 28 DAP. This germplasm was considered unable to reach an adequate stand under the experimental conditions that existed. Germplasm separated into primarily two categories according to time to stand. The earlier emerging category represented by eight entries, Bengal, Cocodrie, CL131, LA2028, LA2082, LA2097, LA2125, and LA2177, had a time to stand of 11 to 14 DAP. The later emerging category had a time to stand of 20 DAP and included only Jefferson. With one exception, the entries had excellent germination (>90%), and Jefferson had 50% germination. Germination was determined by a Petri dish/filter paper process at laboratory temperatures. On average, across all germplasm, time to stand without a gibberellic acid seed treatment occurred 14 DAP, and seed treatment with N-Large Premier and Release resulted in an average time to stand of 12 DAP. CL131 and Jefferson were the most responsive germplasm and had earlier emergence of 6 and 8 days, respectively, with gibberellic acid seed treatments (Table 2). The remainder of the germplasm exhibited little to no response (0 to 2 days earlier emergence). Germplasm (varieties/experimental lines) and seed treatment with gibberellic acid had significant effects on stand, (Table 1). Final stand was measured as number of viable (green) 1-leaf stage or older plants at 28 DAP. Germplasm, on average, exhibited good to excellent seedling vigor with final stands between 9 and 20 plants/ft2 and separated into primarily two categories according to final stand. The category with good vigor had stands of 9 to 13 plants/ft2 and included CL131, Jefferson, LA2097, and LA2125 (10, 9, 12, and 13 plants/ft2, respectively). The category with excellent vigor had stands of 15 to 20 plants/ft2 and included Bengal and LA2082 (15 plants/ft2), Cocodrie (16 plants/ft2), LA2177 (17 plants/ft2), and LA2028 (20 plants/ft2). On average, across germplasm, final stand without gibberellic acid seed treatment was 15 plants/ft2 compared with 13 and 14 plants/ft2 for seed treatment with Release and N-Large Premier, respectively (Table 1). Jefferson was the only entry with an inadequate stand (minimum of 10 plants/ft2) and was only slightly below the cut off with 9 plants/ft2. There were no interactions between germplasm and seed treatment with gibberellic acid (Table 2). The good to excellent levels of seedling vigor noted across the board were related in large measure to adequate soil moisture (timely rain; see Pertinent Rainfall) and moderate temperatures. Temperatures were at or above normal for most of the germination and emergence period following planting (20 Mar) and during the evaluation period for emergence and stand (28 Mar - 17 Apr). Daily average soil temperatures averaged 68ºF and ranged between 57 and 74ºF, and daily average air temperatures averaged 66ºF and ranged between 45 and 76ºF. Cool temperatures (daily

188
average air temperatures at or below 60ºF) occurred during a 5-day period (5 Apr – 9 Apr) about 2 weeks after planting. For soil, daily average temperatures were below 60ºF on 7 Apr and 8 Apr.
Seedling Vigor – Seedling Stature Germplasm (varieties/experimental lines) and foliar treatment with gibberellic acid had a significant effect on seedling height (Table 3). On average, the shortest germplasm was Jefferson (13 cm) and the tallest was Bengal (17 cm). The other germplasm ranged in height from 15 to 16 cm. Overspraying each plot with gibberellic acid at the 3- to 4-leaf stage resulted in a significant increase in seedling height (Table 3), and the effect was relatively constant across germplasm and plant growth regulator (Table 3). The average increase in seedling height (distance from the soil surface to the tip of the longest leaf extended vertically) at 7 days after treatment (DAT) with N-Large Premier and RyzUp was 5 and 6 cm (17 and 18 cm compared with 12 cm for the control), respectively. Daily average air temperature for the 7-day period (20 Apr - 26 Apr) following foliar application of gibberellic acid averaged 71ºF and ranged between 69 and 75ºF. The recommended rate of foliar gibberellic acid at those temperatures is 1.0 to 1.5 g/A, and the rate of 1.5 g/A (0.75 fl oz N-Large Premier/A and 1.5 fl oz RyzUp/A) was used based on weather forecasts at the time.
Table 1. The main effects of germplasm and plant growth regulator seed treatment on seedling vigor of rice drill seeded in March. Rice Research Station, Crowley, LA. 2007. Final Stand Time to (pl./sq. Treatment Fm Grow Stand ft.) Name Ds Rate Stg (days) 28 DAP
TABLE OF GERMPLASM MEANS Bengal 12bc 15bc Cocodrie 11c 16b CL131 14b 10ef Jefferson 20a 9f LA2028 11c 20a LA2082 11c 15bc LA2097 12bc 12de LA2125 13bc 13cd LA2177 11c 17b
TABLE OF PLANT GROWTH REGULATOR MEANS Control 14a 15a N-LargePremier l 0.15 seed 12b 13b Release l 0.30 seed 12b 14ab Within the same table, means followed by the same letter do not differ significantly (Duncan’s multiple range test, P=.05).

189
Table 2. The simple effects of germplasm and plant growth regulator seed treatment on seedling vigor of rice drill seeded in March. Rice Research Station, Crowley, LA. 2007. Final Stand Time to (pl./sq. Treatment Fm Grow Stand ft.) Name Ds Rate Stg (days) 28 DAP Bengal 13c 17a-d Control Bengal 12c 15c-f N-LargePremier l 0.15 seed Bengal 12c 14d-g Release l 0.30 seed Cocodrie 12c 17a-e Control Cocodrie 10c 16b-f N-LargePremier l 0.15 seed Cocodrie 10c 15c-f Release l 0.30 seed CL131 18b 10hij Control CL131 12c 10g-j N-LargePremier l 0.15 seed CL131 12c 11f-j Release l 0.30 seed Jefferson 25a 9j Control Jefferson 17b 10g-j N-LargePremier l 0.15 seed Jefferson 17b 9ij Release l 0.30 seed LA2028 12c 20a Control LA2028 11c 20ab N-LargePremier l 0.15 seed LA2028 11c 19ab Release l 0.30 seed LA2082 12c 17a-d Control LA2082 11c 13d-i N-LargePremier l 0.15 seed Continued.

190
Table 2. Continued. Final Stand Time to (pl./sq. Treatment Fm Grow Stand ft.) Name Ds Rate Stg (days) 28 DAP LA2082 11c 14d-h Release l 0.30 seed LA2097 12c 13d-j Control LA2097 12c 11f-j N-LargePremier l 0.15 seed LA2097 12c 12f-j Release l 0.30 seed LA2125 13c 15c-f Control LA2125 13c 12f-j N-LargePremier l 0.15 seed LA2125 12c 13e-j Release l 0.30 seed LA2177 12c 19abc Control LA2177 11c 15c-f N-LargePremier l 0.15 seed LA2177 10c 17a-d Release l 0.30 seed LSD (.05) = 4 4 Standard Dev. = 2.6897 2.5308 CV = 21.16 17.92 Means followed by same letter do not significantly differ (Duncan's multiple range tests, P=.05).

191
Table 3. The main effects of germplasm and plant growth regulator foliar treatment on seedling vigor of rice drill seeded in March. Rice Research Station, Crowley, LA. 2007. Pl. Ht. Treatment Fm Grow (cm) Name Ds Rate Stg 7 DAT
TABLE OF GERMPLASM MEANS Bengal 17a Cocodrie 16ab CL131 15b Jefferson 13c LA2028 16ab LA2082 15b LA2097 16ab LA2125 15b LA2177 16ab
TABLE OF PLANT GROWTH REGULATOR MEANS Control 12a N-Large Premier 0.75 3-4lf 17b RyzUp 1.5 3-4lf 18b Within the same table, means followed by the same letter do not differ significantly (Duncan’s multiple range test, P=.05).

192
Table 4. The simple effects of germplasm and plant growth regulator foliar treatment on seedling vigor of rice drill seeded in March. Rice Research Station, Crowley, LA. 2007. Pl. Ht. Treatment Fm Grow (cm) Name Ds Rate Stg 7 DAT Bengal 13gh Control Bengal 19abc N-Large Premier 0.75 3-4lf Bengal 19ab RyzUp 1.5 3-4lf Cocodrie 13gh Control Cocodrie 18abc N-Large Premier 0.75 3-4lf Cocodrie 18abc RyzUp 1.5 3-4lf CL131 12h Control CL131 16ef N-Large Premier 0.75 3-4lf CL131 17cde RyzUp 1.5 3-4lf Jefferson 9i Control Jefferson 15fg N-Large Premier 0.75 3-4lf Jefferson 16def RyzUp 1.5 3-4lf LA2028 12h Control LA2028 18bcd N-Large Premier 0.75 3-4lf LA2028 20a RyzUp 1.5 3-4lf LA2082 11h Control LA2082 16def N-Large Premier 0.75 3-4lf LA2082 18abc RyzUp 1.5 3-4lf Continued.

193
Table 4. Continued. Pl. Ht. Treatment Fm Grow (cm) Name Ds Rate Stg 7 DAT LA2097 11h Control LA2097 19abc N-Large Premier 0.75 3-4lf LA2097 19ab RyzUp 1.5 3-4lf LA2125 11h Control LA2125 17b-e N-Large Premier 0.75 3-4lf LA2125 18bcd RyzUp 1.5 3-4lf LA2177 12h Control LA2177 17cde N-Large Premier 0.75 3-4lf LA2177 18abc RyzUp 1.5 3-4lf LSD (.05) = 2 Standard Dev. = 1.1978 CV = 7.72 Means followed by same letter do not significantly differ (Duncan's multiple range test, P=.05).

194
SEEDLING VIGOR STUDIES – SEED AND FOLIAR TREATMENT
R.T. Dunand and R.R. Dilly, Jr. Experiment: Gibberellic Acid and Seedling Vigor in Drill-Seeded Rice – April Planting Date Location: Rice Research Station, Crowley, LA (North Unit, Field N8) Variety: See Treatments Planting Method: Drilled on 7-inch rows Planting Depth: 3-inch Seeding Rate: 90 lb/A Fertilizer: None Plot Size: 11.6 ft2 – 0.58 (1 row) x 20 ft Treated Area: 11.6 ft2 – 0.58 (1 row) x 20 ft Treatment(s): Varieties/Experimental Lines Bengal CL171 LA2082 LA2177 Cocodrie Jefferson LA2097 MS4191 CL131 LA2028 LA2125 CL – imidazolinone (Clearfield)-resistant lines Plant Growth Regulators Seed treatment – N-Large Premier (0.17 oz/cwt) and Release (0.35 oz/cwt) Foliar treatment – N-Large Premier (0.5 fl oz/A) and Ryzup (1.0 fl oz/A) Timing Seed treatment, 14 Mar Foliar treatment (3- to 4-leaf stage), 10 May Seed Treater: Jar mill tumble mixer Sprayer: See North Farm General Methodology Planting Date: 16 Apr Emergence: See Treatments Water Management: None Pertinent Rainfall: 0.4 inch, 18 Apr; 1.1 inches, 25 Apr; 1.8 inches, 3 May; 0.4 inch, 7 May; 0.1 inch, 10
May Herbicide(s): Rice Shot (1 gal/A) by backpack, 7 May Rice Shot (3 qt/A) by backpack sprayer, 10 May (tank mixed with foliar PGRs)

195
Insecticide(s): Icon (0.9 fl oz/cwt) seed treatment, 14 Mar Fungicide(s): Dithane DF (4 oz/cwt) seed treatment, 14 Mar Plant Growth Regulator(s): See Treatments Harvest Date: Not applicable Harvested Area: Not applicable Experimental Design: Randomized complete block design and four replications. Factorial treatment
arrangement was as follows. A given plot contained a different variety or experimental line in each row. The position of a variety or experimental line within a given plot was constant. Each given plot was planted in triplicate in each replicate. Each given plot contained five or six rows in accommodating five varieties and six experimental lines. Of each triplicate, one plot had untreated seed (no gibberellic acid) and the other two plots had seed treated with N-Large Premier or Release according to the randomization of plots.
Comments: Seedling Vigor – Emergence and Plant Population Density (Stand) Germplasm (varieties/experimental lines) and seed treatment with gibberellic acid had a significant effect on emergence of rice (Table 1). Time to stand, an evaluation of emergence, was the number of days from planting to establishment of an adequate stand (10 plants/ft2). Germplasm, on average, had a moderate emergence rate with a time to stand of 12 to 16 days after planting (DAP). The evaluation period was 24 days. Any germplasm that had not obtained an adequate stand by 24 DAP was assigned a time to stand of 24 DAP. This germplasm was considered unable to reach an adequate stand under the experimental conditions that existed. Germplasm separated into primarily two categories according to time to stand. The earlier emerging category represented by 10 entries, Bengal, Cocodrie, CL131, CL171, LA2028, LA2082, LA2097, LA2125, LA2177 and MS4191, had a time to stand of 12 to 14 DAP. The later emerging category had a time to stand of 16 DAP and included only Jefferson. With one exception, the entries had excellent germination (>90%), and Jefferson had 50% germination. Germination was determined by a Petri dish/filter paper process at laboratory temperatures. On average, across all germplasm, time to stand without a gibberellic acid seed treatment occurred 14 DAP, and seed treatment with N-Large Premier and Release resulted in an average time to stand of 12 DAP. There was an interaction between germplasm and plant growth regulator on emergence. MS4191 and LA2177 were the most responsive germplasm and had earlier emergence of 5 and 7 days, respectively, with gibberellic acid seed treatments (Table 2). Jefferson and LA2097 had an intermediate response and emerged 3 days early with the gibberellic acid seed treatment. The remainder of the germplasm exhibited no response (0 days earlier emergence). Germplasm (varieties/experimental lines) and seed treatment with gibberellic acid had significant effects on stand (Table 1). Final stand was measured as number of viable (green) 1-leaf stage or older plants at 24 DAP. Germplasm, on average, exhibited excellent to superior seedling vigor with final stands between 15 and 24 plants/ft2 and separated into primarily two categories according to final stand. The category with excellent vigor had stands of 15 to 20 plants/ft2 and included CL131, CL171, Jefferson, LA2097, LA2177, and MS4191 (17, 19, 15, 18, 18, and 20 plants/ft2, respectively). The category with superior vigor had stands of 21 to 24 plants/ft2 and included Bengal, Cocodrie, and LA2125 (21 plants/ft2), LA2082 (23 plants/ft2), and LA2028 (24 plants/ft2). On average, across germplasm, final stand without gibberellic acid seed treatment was 17 plants/ft2 compared with 20 plants/ft2
for seed treatment with Release and N-Large Premier (Table 1). All entries attained at least an adequate stand (minimum of 10 plants/ft2), and there were no statistical interactions between germplasm and seed treatment with gibberellic acid (Table 2).

196
The excellent to superior levels of seedling vigor noted across the board were related in large measure to adequate soil moisture (timely rain; see Pertinent Rainfall) and warm temperatures. Temperatures were at or above normal for most of the germination and emergence period following planting (16 Apr) and during the evaluation period for emergence and stand (24 Apr – 10 May). Daily average soil temperatures averaged 75ºF and ranged between 68 and 80ºF, and daily average air temperatures averaged 74ºF and ranged between 64 and 80ºF.
Seedling Vigor – Seedling Stature Germplasm (varieties/experimental lines) and foliar treatment with gibberellic acid had a significant effect on seedling height (Table 3). On average, the shortest germplasm was Jefferson (22 cm) and the tallest was Bengal (27 cm). The other germplasm ranged in height from 23 to 26 cm. Overspraying each plot with gibberellic acid at the 3- to 4-leaf stage resulted in a significant increase in seedling height, and the effect was relatively constant across germplasm and plant growth regulator (Table 3). The average increase in seedling height (distance from the soil surface to the tip of the longest leaf extended vertically) at 6 days after treatment (DAT) with N-Large Premier and RyzUp was 6 and 8 cm (26 and 28 cm compared with 20 cm for the control), respectively. Although not statistically different, plant height was increased 4 to 9 cm, depending on formulation and germplasm (Table 4). Daily average air temperature for the 6-day period (11 May - 16 May) following foliar application of gibberellic acid averaged 78ºF and ranged between 76 and 81ºF. The recommended rate of foliar gibberellic acid at those temperatures is 0.5 to 1.0 g/A, and the rate of 1.0 g/A (0.5 fl oz N-Large Premier/A and 1.0 fl oz RyzUp/A) was used based on weather forecasts at the time.
Table 1. The main effects of germplasm and plant growth regulator seed treatment on seedling vigor of rice drill seeded in April. Rice Research Station, Crowley, LA. 2007. Final Stand Time to (pl./sq. Treatment Fm Grow Stand ft.) Name Ds Rate Stg (days) 24 DAP
TABLE OF GERMPLASM MEANS Bengal 12 21bc Cocodrie 12 21bc CL131 12 17de CL171 12 19cd Jefferson 16 15e LA2028 12 24a LA2082 12 23ab LA2097 13 18cd LA2125 12 21bc LA2177 13 18cd MS4191 14 20c
TABLE OF PLANT GROWTH REGULATOR MEANS Control 14 17a N-LargePremier l 0.15 seed 12 21b Release l 0.30 seed 12 20b Within the same table, means followed by the same letter do not differ significantly (Duncan’s multiple range test, P=.05).

197
Table 2. The simple effects of germplasm and plant growth regulator seed treatment on seedling vigor of rice drill seeded in April. Rice Research Station, Crowley, LA. 2007. Final Stand Time to (pl./sq. Treatment Fm Grow Stand ft.) Name Ds Rate Stg (days) 24 DAP Bengal 12cd 17efg Control Bengal 12cd 23abc N-LargePremier l 0.15 seed Bengal 12cd 22a-d Release l 0.30 seed Cocodrie 13cd 17efg Control Cocodrie 12cd 24ab N-LargePremier l 0.15 seed Cocodrie 12cd 23a-d Release l 0.30 seed CL131 13cd 16g Control CL131 12cd 18c-g N-LargePremier l 0.15 seed CL131 12cd 17fg Release l 0.30 seed CL171 13cd 17fg Control CL171 12cd 21a-f N-LargePremier l 0.15 seed CL171 12d 20a-g Release l 0.30 seed Jefferson 23a 10h Control Jefferson 13cd 18c-g N-LargePremier l 0.15 seed Jefferson 13cd 18d-g Release l 0.30 seed LA2028 12cd 24ab Control LA2028 11d 25a N-LargePremier l 0.15 seed Continued.
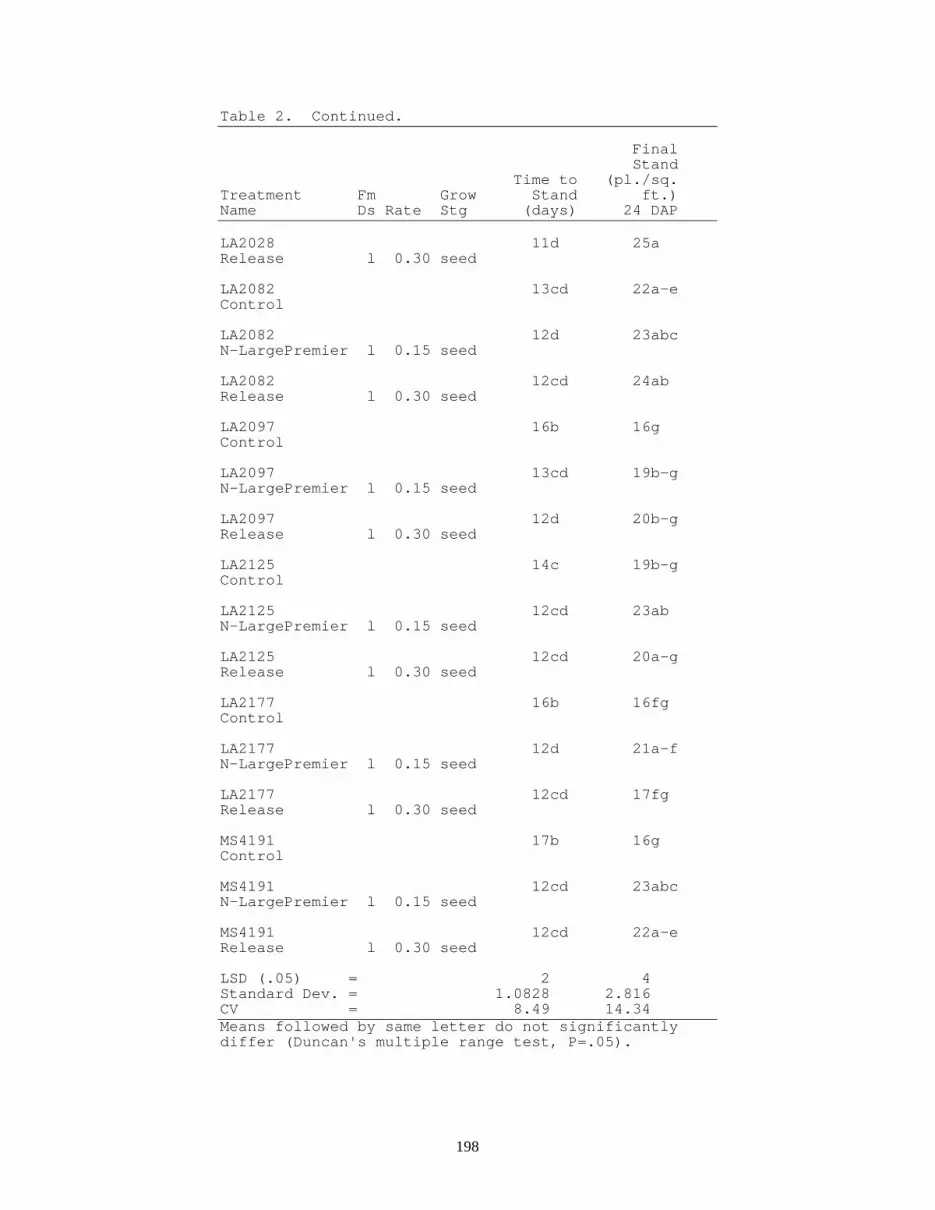
198
Table 2. Continued. Final Stand Time to (pl./sq. Treatment Fm Grow Stand ft.) Name Ds Rate Stg (days) 24 DAP LA2028 11d 25a Release l 0.30 seed LA2082 13cd 22a-e Control LA2082 12d 23abc N-LargePremier l 0.15 seed LA2082 12cd 24ab Release l 0.30 seed LA2097 16b 16g Control LA2097 13cd 19b-g N-LargePremier l 0.15 seed LA2097 12d 20b-g Release l 0.30 seed LA2125 14c 19b-g Control LA2125 12cd 23ab N-LargePremier l 0.15 seed LA2125 12cd 20a-g Release l 0.30 seed LA2177 16b 16fg Control LA2177 12d 21a-f N-LargePremier l 0.15 seed LA2177 12cd 17fg Release l 0.30 seed MS4191 17b 16g Control MS4191 12cd 23abc N-LargePremier l 0.15 seed MS4191 12cd 22a-e Release l 0.30 seed LSD (.05) = 2 4 Standard Dev. = 1.0828 2.816 CV = 8.49 14.34 Means followed by same letter do not significantly differ (Duncan's multiple range test, P=.05).
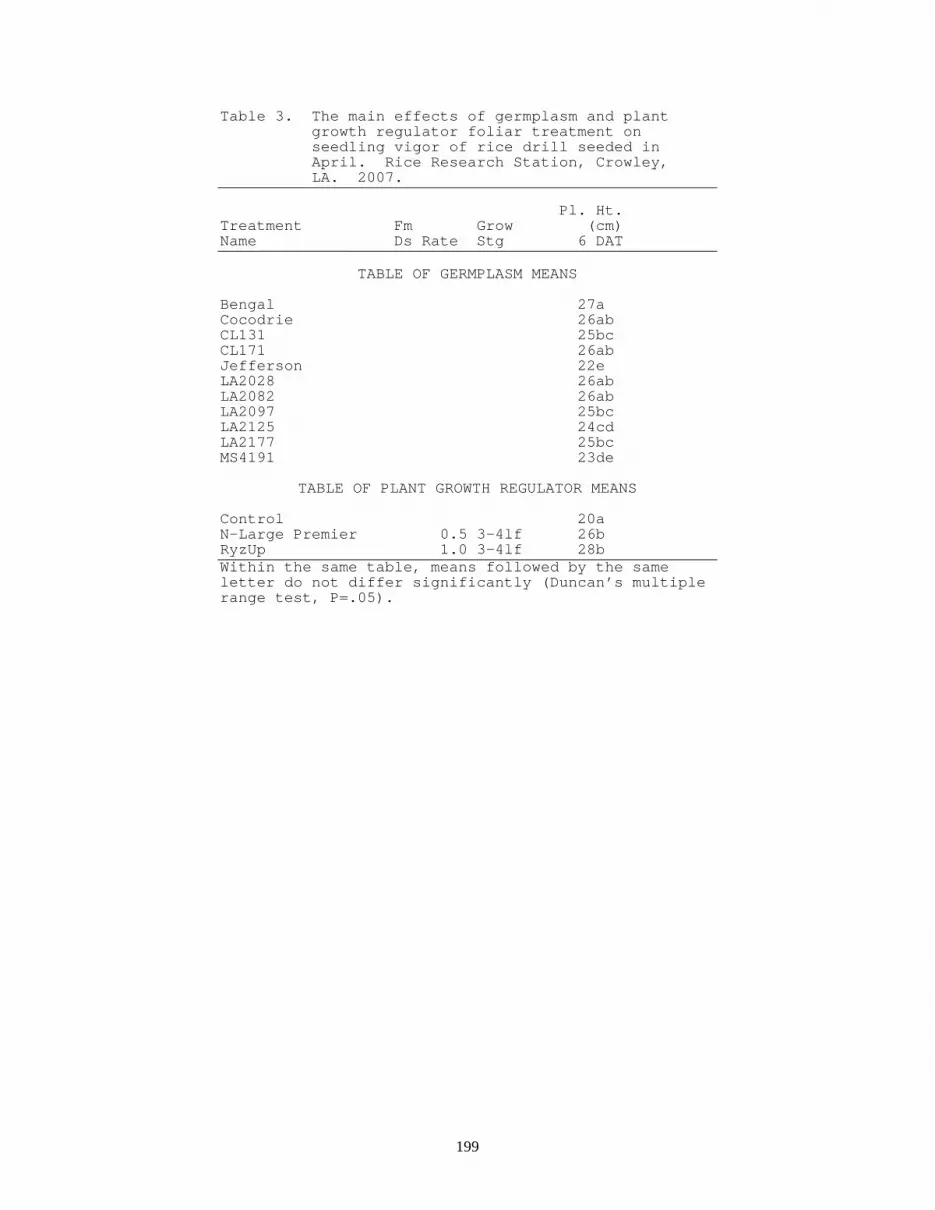
199
Table 3. The main effects of germplasm and plant growth regulator foliar treatment on seedling vigor of rice drill seeded in April. Rice Research Station, Crowley, LA. 2007. Pl. Ht. Treatment Fm Grow (cm) Name Ds Rate Stg 6 DAT
TABLE OF GERMPLASM MEANS Bengal 27a Cocodrie 26ab CL131 25bc CL171 26ab Jefferson 22e LA2028 26ab LA2082 26ab LA2097 25bc LA2125 24cd LA2177 25bc MS4191 23de
TABLE OF PLANT GROWTH REGULATOR MEANS Control 20a N-Large Premier 0.5 3-4lf 26b RyzUp 1.0 3-4lf 28b Within the same table, means followed by the same letter do not differ significantly (Duncan’s multiple range test, P=.05).

200
Table 4. The simple effects of germplasm and plant growth regulator foliar treatment on seedling vigor of rice drill seeded in April. Rice Research Station, Crowley, LA. 2007. Pl. Ht. Treatment Fm Grow (cm) Name Ds Rate Stg 6 DAT Bengal 23i-l Control Bengal 27b-e N-Large Premier 0.5 3-4lf Bengal 31a RyzUp 1.0 3-4lf Cocodrie 22j-m Control Cocodrie 27c-f N-Large Premier 0.5 3-4lf Cocodrie 29a-d RyzUp 1.0 3-4lf CL131 21klm Control CL131 27b-f N-Large Premier 0.5 3-4lf CL131 28b-e RyzUp 1.0 3-4lf CL171 21klm Control CL171 26d-g N-Large Premier 0.5 3-4lf CL171 30abc RyzUp 1.0 3-4lf Jefferson 18n Control Jefferson 24g-j N-Large Premier 0.5 3-4lf Jefferson 24f-i RyzUp 1.0 3-4lf LA2028 22j-m Control LA2028 26d-g N-Large Premier 0.5 3-4lf LA2028 30ab RyzUp 1.0 3-4lf Continued.

201
Table 4. Continued. Pl. Ht. Treatment Fm Grow (cm) Name Ds Rate Stg 6 DAT LA2082 21j-m Control LA2082 26d-g N-Large Premier 0.5 3-4lf LA2082 30abc RyzUp 1.0 3-4lf LA2097 20lmn Control LA2097 27b-e N-Large Premier 0.5 3-4lf LA2097 29a-d RyzUp 1.0 3-4lf LA2125 20lmn Control LA2125 25e-h N-Large Premier 0.5 3-4lf LA2125 26d-g RyzUp 1.0 3-4lf LA2177 20lmn Control LA2177 26d-g N-Large Premier 0.5 3-4lf LA2177 28b-e RyzUp 1.0 3-4lf MS4191 19mn Control MS4191 25e-h N-Large Premier 0.5 3-4lf MS4191 23h-k RyzUp 1.0 3-4lf LSD (.05) = 2 Standard Dev. = 1.6778 CV = 6.78 Means followed by same letter do not significantly differ (Duncan's multiple range test, P=.05).

202
NORTH UNIT GENERAL METHODOLOGY
Location: Rice Research Station, Crowley, LA (North Unit, Field N9A) Seeding Method/Depth/Rate: Drilled on 7-inch rows/2 inches/90 and 120 lb/A Fertilizer: 8-24-24 with 2.8% Zn at 250 lb/A by John Deere drill, 19 Mar Urea (46% N) at 200 lb/A (24 Apr) and 100 lb/A (16 May) by airplane Plot Size/Treated Area: 262.5 ft2 – 8.75 (15 rows) x 30 ft Seed Treater: Cement mixer Sprayer: CO2-driven, backpack, 35 psi, 15 GPA, 8001VS tips, 20-inch nozzle spacings Planting Date: 20 Mar Emergence: 28 Mar (Cocodrie) and 30 Mar (Trenasse) Plant Population: 15 to 20 plants/ft2 at the 3- to 4-leaf stage Water Management: Flushed, 18 Apr; permanent flood (3-inch), 27 Apr; preharvest drain, 5 July Pertinent Rainfall: 1.0 inch, 31 Mar - 1 Apr; 2.0 inches, 10 Apr; 1.1 inches, 25 Apr (collected as a very
shallow flood on the south half of the field); see individual experiments Growth Stage Definitions: Mid Boot (MB), collar of flag leaf first visible First Heading (1st H), <5% of stems with some degree of panicle exsertion 50% Heading (H+3), ~50% of stems with some degree of panicle exsertion, 3 days after first heading 100% Heading (H+6), ~100% of stems with some degree of panicle exsertion, 6 days after first heading Milk Stage (MS or H+9), endosperm is white liquid in uppermost florets, 9 days after first heading Pesticide(s): Dithane DF (4 oz/cwt) seed treatment, 15 Mar Icon (0.9 fl oz/A) seed treatment, 15 Mar Rice Shot (1 gal/A) + Permit (1 oz/A) by airplane, 13 Apr Rice Shot (1 gal/A) + Prowl H2O (2.5 pt/A) by ATV, 24 Apr Clincher (15 fl oz/A) + COC (1 qt/A) by airplane, 7 June Londax (2 oz/A) by airplane, 1 and 10 May Quadris (12 fl oz/A) by airplane, 13 June Plant Growth Regulator(s): Release (0.35 oz/cwt) seed treatment, 15 Mar RyzUp (0.67 fl oz/A) with herbicide, 24 Apr Harvest Date/Area: 23 July/183.75 ft2 - 8.75 (15 rows) x 21 ft

203
YIELD ENHANCEMENT STUDIES – FIRST CROP
R.T. Dunand and R.R. Dilly, Jr. Experiment: Actagro Plant Nutrients and Crop Production in Drill-Seeded Rice General Methodology: See North Unit General Methodology (pg. 202) Variety: Cocodrie Treatment(s): Plant Growth Regulator Librel (0.25 and 1 qt/A), Liquid Humus (2 and 6 qt/A), and Resist (1.5 and 2 qt/A) Timing Early Boot (EB), 8 June Pertinent Rainfall: No significant rain within 8 hr after foliar applications Experimental Design: Randomized complete block and four replications Comments: Crop Production Crop stature, maturity, and production were evaluated at harvest, and none were significantly affected by the applications of Actagro plant nutrients (Table 1). Mature plant height (distance from the soil surface to the tip of the panicle extended vertically) for treatments ranged between 94 and 95 cm (control = 95 cm). Grain moisture (an indicator of crop maturity) for treatments ranged between 18.2 and 18.5% (control = 18.2%). Grain yield (adjusted to 12% moisture) was highest (8,515 lb/A) with the high rate of Librel compared with the control (8,121 lb/A) and other Actagro products that ranged between 8,170 and 8,443 lb/A.
Table 1. The effects of Actagro products on crop growth and production of drill-seeded rice. Rice Research Station, Crowley, LA. 2007. Mature Grain Grain Treatment Fm Grow Pl. Ht. Moisture Yield Name Ds Rate Stg (cm) (%) (lb/A) Control 95a 18.2a 8191a Resist l 64 EB 94a 18.3a 8443a Librel d 32 EB 94a 18.2a 8515a Resist l 48 EB 95a 18.5a 8259a Librel d 8 EB Liquid Humus l 64 EB 94a 18.3a 8170a Liquid Humus l 192 EB 95a 18.5a 8254a LSD (.05) = 1 0.6 490 Standard Dev. = .83499 .37539 325.02 CV = 0.88 2.05 3.91 Means followed by same letter do not significantly differ (Duncan's multiple range test, P=.05).

204
YIELD ENHANCEMENT STUDIES – FIRST CROP
R.T. Dunand and R.R. Dilly, Jr. Experiment: Heading Applications of Gibberellic Acid and Crop Production in Drill-Seeded Rice General Methodology: See North Unit General Methodology (pg. 202) Variety: Trenasse Treatment(s): Plant Growth Regulator RyzUp (4 fl oz/A) + Agri-Dex (1 qt/A) Timing 1st Heading (1stH), 12 June 50% Heading (H+3), 15 June 100% Heading (H+6), 18 June Milk Stage (H+9), 21 June Pertinent Rainfall: No significant rain within 8 hr after foliar applications with one exception. The 100%
heading application was followed 2 hours later with a light drizzle and no recorded rain until 5 hours after application
Experimental Design: Randomized complete block and three replications Comments: Crop Production Crop stature, maturity, and production were evaluated at harvest, and plant height was significantly affected by the heading and early grain filling applications of RyzUp (Table 1). Mature plant height (distance from the soil surface to the tip of the panicle extended vertically) for treatments ranged between 108 and 114 cm (control = 102 cm). Of the RyzUp treatments, plant height (114 cm) was tallest in the first heading and first heading plus 3 days times of application and significantly taller than the first heading plus 6 days (111 cm) and first heading plus 9 days (108 cm) times of application. The first heading plus 6 days and first heading plus 9 days treatments were significantly different. Grain moisture (an indicator of crop maturity) for treatments ranged between 20.3 and 20.6% (control = 20.5%). Grain yield (adjusted to 12% moisture) was highest (9,093 lb/A) with the first heading plus 3 days application compared with the control (8,811 lb/A) and other RyzUp treatments that ranged between 8,716 and 9,081 lb/A. Milling quality was evaluated after harvest, and total and whole milling yields were unaffected by the heading and early grain filling applications of RyzUp (Table 1). Total milling yield (percent of sample remaining after shelling and milling, removal of the hull and bran layers) for treatments ranged between 68 and 70% (control = 70%). Whole milling yield (percent of sample remaining after shelling, milling, and shaking - shaking removes pieces broken during milling) for treatments ranged between 56 and 58% (control = 57%).

205
Table 1. The effects of application of RyzUp during heading on crop growth and production in drill-seeded rice. Rice Research Station, Crowley, LA. 2007. Total Whole Mature Grain Grain Milling Milling Treatment Fm Grow Pl. Ht. Moisture Yield Yield Yield Name Ds Rate Stg (cm) (%) (lb/A) (%) (%) Control 102d 20.5a 8811a 70a 57a RyzUp l 4 1stH 114a 20.3a 8888a 70a 58a RyzUp l 4 H+3 114a 20.6a 9093a 69a 56a RyzUp l 4 H+6 111b 20.3a 9081a 70a 57a RyzUp l 4 H+9 108c 20.5a 8716a 68a 56a LSD (.05) = 2 0.4 594 2 3 Standard Dev. = .93985 .22572 315.7 .87559 1.7701 CV = 0.86 1.10 3.54 1.26 3.11 Means followed by same letter do not significantly differ (Duncan's multiple range test, P=.05).

206
SOUTH UNIT GENERAL METHODOLOGY
First (Main) Crop
Location: Rice Research Station, Crowley, LA (South Unit, Field 7B) Seeding Method/Depth/Rate: Drilled on 7-inch rows/1.5 inches/120 lb/A Fertilizer: 8-24-24 with 2.8% Zn at 250 lb/A by John Deere drill, 26 Mar Urea (46% N) at 200 lb/A (2 May) and 100 lb/A (23 May) by airplane Plot Size/Treated Area: 262.5 ft2 – 8.75 (15 rows) x 33 ft Seed Treater: Cement mixer Sprayer: CO2-driven, backpack, 35 psi, 15 GPA, 8001VS tips, 20-inch nozzle spacings Planting Date: 26 Mar Emergence: 1 Apr (Cocodrie) and 3 Apr (Trenasse) Water Management: Flushed, 18 Apr; permanent flood (3-inch), 3 May; preharvest drain, 13 July Plant Population: 15 to 20 plants/ft2 at the 3- to 4-leaf stage
Pertinent Rainfall/Weather: See individual studies/1.0 inch, 31 Mar - 1 Apr; 1.7 inches, 10 Apr; 0.2 inch, 18 Apr; 1.2 inches, 25 Apr; 0.5 inch, 3 May
Growth Stage Definitions: 3- to 4-Leaf Stage (3/4L), 3 or 4 leaf collars visible Late Boot Stage (LB), 5- to 8-inch panicle inside main stem Dough Stage (DS), endosperm white dough in uppermost florets, ~3 weeks after LB Physiological Maturity (PM), endosperm starting to harden, ~1 week after DS Physiological Maturity plus 1 week (PM+1), 1 week after PM Pesticide(s): Dithane DF (4 oz/cwt) seed treatment, 15 Mar Icon (0.9 fl oz/A) seed treatment, 15 Mar Rice Shot (1 gal/A) + Permit (1 oz/A) by airplane, 13 Apr Rice Shot (1 gal/A) + Londax (0.75 oz/A) + Permit (0.5 oz/A) by airplane, 1 May Londax (2 oz/A) by airplane, 10 May Tilt (6 fl oz/A) by airplane, 13 June Quadris (12 fl oz/A) by airplane, 20 June Plant Growth Regulator(s): Release (0.35 oz/cwt) seed treatment, 15 Mar Harvest Date/Area: 25 July/183.75 ft2 – 8.75 (15 rows) x 21 ft
Second (Ratoon) Crop Fertilizer: Urea (46% N) at 200 lb/A by airplane, 3 Aug
Water Management/Weather: Permanent flood (3-inch), 31 July; preharvest drain, 18 Sept; Hurricane Humberto, 13 Sept
Pertinent Rainfall: 4 inches, 27-31 July; 1.9 inches, 14-17 Aug; 0.9 inch, 24-27 Aug; 3.1 inches, 31 Aug-
4 Sept; 2.7 inches, 12-13 Sept Pesticide(s): Mustang Max (4 fl oz/A), 19 Sept Harvest Date/Area: 3 Oct/266.875 ft2 – 8.75 (15 rows) x 30.5 ft

207
YIELD ENHANCEMENT STUDIES – FIRST AND SECOND CROP
R.T. Dunand and R.R. Dilly, Jr. Experiment: Plant Growth Regulators Applied to the First Crop and Crop Production in First and
Second Crops in Very Early Season, Semidwarf, Long-Grain, Drill-Seeded Rice General Methodology: See South Unit General Methodology (pg. 206) Variety: Cocodrie Treatment(s): Plant Growth Regulator(s) Embark 2S (1 pt/A) Royal MH-30 SG (2.5 lb/A) RyzUp (4 fl oz/A) + Agri-Dex (1 qt/A) Timing Dough Stage (DS), 6 July Physiological Maturity (PM), 13 July Physiological Maturity plus 1 week (PM+1), 19 July Pertinent Rainfall: No rainfall within 8 hours after applications Experimental Design: Randomized complete block and five replications Comments: First (Main) Crop Production Crop stature, maturity, and production were evaluated at harvest, and none were significantly affected by the pre-drain applications of plant growth regulators (Table 1). For the plant growth regulator treatments, mature plant height (distance from the soil surface to the tip of the panicle extended vertically) ranged between 81 and 85 cm (control = 82 cm). Grain moisture (an indicator of crop maturity) ranged between 17.6 and 17.8% (control = 17.8%). Grain yield (adjusted to 12% moisture) ranged between 5,979 and 7,134 lb/A (control = 6,592 lb/A). Although not significantly different from the control, grain yield from the application of Royal MH 30 at dough stage (5,979 lb/A) was significantly lower compared with grain yield from the application of RyzUp at 1-week after physiological maturity. Growth suppressants (Embark 2S and Royal MH 30) and the growth stimulant (RyzUp) had limited effects on the first crop, allowing a relatively unbiased evaluation of the effects on the second crop.
Second (Ratoon) and Total Crop Production Crop stature, maturity, and production were evaluated at harvest, and none were significantly affected by the applications of the plant growth regulators (Table 1). In the second crop treatments, mature plant height ranged between 71 and 72 cm (control=72 cm). Grain moisture ranged between 18.0 and 19.9% (control = 18.41%). In general, the mitotic inhibitors (Embark 2S and Royal MH-30 SG), with the exception of Royal MH-30 SG applied at dough stage (2,592 lb/A), had slightly lower yields (ranged from 2,313 to 2,592 lb/A) compared with the control (2,448 lb/A). The gibberellic acid treatments (RyzUp) showed similar results with a slightly higher yield (2,777 lb/A) with the dough stage application compared with the control and later timings. Although similar results were noted in total grain yield (first plus second crop grain yields), total grain yields of the plant growth regulator treatments (ranged from 8,542 to 9,018 lb/A) were lower compared with the control (9,040 lb/A).

208
Table 1. The effects of pre-drain and post-drain applications of plant growth regulators to the first crop on first and second crop production in very early season, semidwarf, long- grain, drill-seeded rice. Rice Research Station, Crowley, LA. 2007. 1st Crop 1st Crop 2nd Crop 2nd Crop Total 1st Crop Grain Grain 2nd Crop Grain Grain Grain Treatment Fm Grow Pl. Ht. Moisture Yield Pl. Ht. Moisture Yield Yield Name Ds Rate Stg (cm) (%) (lb/A) (cm) (%) (lb/A) (lb/A) Control 82ab 17.8a 6592ab 72a 18.4bc 2448ab 9040ab Embark 2S l 16 DS 83ab 17.6a 6427ab 72ab 18.6bc 2592ab 9018ab Embark 2S l 16 PM 83ab 17.8a 6472ab 72ab 18.8bc 2313ab 8785ab Embark 2S l 16 PM+1 83ab 17.8a 6465ab 71ab 19.3ab 2387ab 8852ab Royal MH 30 d 40 DS 81b 17.6a 5979b 71ab 18.3bc 2426ab 8405b Royal MH 30 d 40 PM 83ab 17.6a 6335ab 71b 19.0abc 2350ab 8685ab Royal MH 30 d 40 PM+1 84ab 17.8a 6591ab 71ab 18.7bc 2342ab 8933ab RyzUp l 4 DS 84ab 17.6a 7071ab 71ab 18.0c 2777a 9848a RyzUp l 4 PM 85a 17.6a 6114ab 71b 18.4bc 2428ab 8542ab RyzUp l 4 PM+1 85a 17.7a 7134a 72ab 19.9a 2253b 9388ab LSD (.05) = 3 0.4 965 1 1.0 410 1171 Standard Dev. = 2.0212 .28422 747.43 .82798 .74077 317.33 906.51 CV = 2.43 1.61 11.47 1.16 3.96 13.05 10.13 Means followed by same letter do not significantly differ (Duncan's multiple range test, P=.05).

209
YIELD ENHANCEMENT STUDIES – FIRST AND SECOND CROP
R.T. Dunand and R.R. Dilly, Jr. Experiment: Plant Growth Regulators Applied to the First Crop and Crop Production in First and
Second Crops in Very Early Season, Short Stature, Long-Grain, Drill-Seeded Rice General Methodology: See South Unit General Methodology (pg. 206) Variety: Trenasse Treatment(s): Plant Growth Regulator(s) Embark 2S (1 pt/A) Royal MH-30 SG (2.5 lb/A) RyzUp (4 fl oz/A) + Agri-Dex (1 qt/A) Timing Dough Stage (DS), 2 July Physiological Maturity (PM), 9 July Physiological Maturity plus 1 week (PM+1), 16 July Pertinent Rainfall: No rainfall within 8 hours after applications with the following exceptions: 0.4 inch at 6
hr after DS treatment and 0.1 inch at 30 min after PM treatment Experimental Design: Randomized complete block and five replications Comments: Crop Production Crop stature, maturity, and production were evaluated at harvest, and none were significantly affected by the pre-drain applications of plant growth regulators (Table 1). For the plant growth regulator treatments, mature plant height (distance from the soil surface to the tip of the panicle extended vertically) ranged between 88 and 91 cm (control = 90 cm). Grain moisture (an indicator of crop maturity) ranged between 18.1 and 19.3% (control = 18.9%). Grain yield (adjusted to 12% moisture) ranged between 6,923 and 7,826 lb/A (control = 7,705 lb/A). Growth suppressants (Embark 2S and Royal MH 30) and growth stimulant (RyzUp) had limited effects on the first crop, allowing a relatively unbiased evaluation of the effects on the second crop.
Second (Ratoon) and Total Crop Production Crop stature, maturity, and production were evaluated at harvest, and none were significantly affected by the applications of the plant growth regulators (Table 1). In the second crop treatments, mature plant height ranged between 73 and 76 cm (control = 75 cm). Grain moisture ranged between 17.9 and 19.0% (control = 19.3%). In general, the mitotic inhibitors (Embark 2S and Royal MH-30 SG) had higher yields (ranged from 1,854 to 2,230 lb/A) compared with the control (1,841 lb/A), and the gibberellic acid treatments (RyzUp) had higher yields (ranged from 1,939 to 2,242 lb/A) compared with the control. Due to slight differences in first crop yields, similar results were not noted in total grain yield (first plus second crop grain yields). Total grain yields of the plant growth regulator treatments (ranged from 9,128 to 9,670 lb/A) were not significantly different from the control (9,546 lb/A).

210
Table 1. The effects of pre-drain and post-drain applications of plant growth regulators to the first crop on first and second crop production in very early season, short stature, long-grain, drill-seeded rice. Rice Research Station, Crowley, LA. 2007. 1st Crop 1st Crop 1st Crop 2nd Crop 2nd Crop Total Mature Grain Grain 2nd Crop Grain Grain Grain Treatment Fm Grow Pl. Ht. Moisture Yield Pl. Ht. Moisture Yield Yield Name Ds Rate Stg (cm) (%) (lb/A) (cm) (%) (lb/A) (lb/A) Control 90a 18.9a 7705a 75ab 19.3a 1841a 9546a Embark 2S l 16 DS 88a 18.7a 7236a 74ab 18.7a 1854a 9090a Embark 2S l 16 PM 91a 19.3a 7623a 76a 17.7a 2047a 9670a Embark 2S l 16 PM+1 89a 18.7a 7826a 74ab 19.0a 1991a 9817a Royal MH 30 d 40 DS 88a 19.2a 7054a 74ab 17.9a 2074a 9128a Royal MH 30 d 40 PM 90a 18.9a 7577a 75ab 18.2a 2144a 9721a Royal MH 30 d 40 PM+1 91a 19.0a 7305a 75ab 18.3a 2230a 9535a RyzUp l 4 DS 91a 18.3a 7679a 75ab 18.2a 2242a 9921a RyzUp l 4 PM 89a 18.1a 6923a 73b 18.3a 2158a 9081a RyzUp l 4 PM+1 91a 18.4a 7464a 75ab 18.5a 1939a 9402a LSD (.05) = 7 1.1 1783 2 1.4 754 2504 Standard Dev. = 5.7109 .87587 1380.5 1.5563 1.1014 583.73 1938.8 CV = 6.35 4.67 18.56 2.09 5.99 28.45 20.43 Means followed by same letter do not significantly differ (Duncan's multiple range test, P=.05).

211
YIELD ENCHANCEMENT STUDIES – SECOND CROP
R.T. Dunand and R.R. Dilly, Jr. Experiment: First Crop Cutting Height and Second Crop Production in Drill-Seeded Rice General Methodology: See South Unit General Methodology (pg. 206) Variety: See Treatments Treatment(s): Variety(s) – Cocodrie and Trenasse First Crop Cutting Height (attempted) – 8 and 16 inches Pertinent Rainfall: Not Applicable Experimental Design: Randomized complete block and two replications with four subplots per replication.
Factorial arrangement of treatments with two varieties and two cutting heights (2x2) for a total of eight treatments.
Comments: First (Main) Crop Status Mature plant height (distance from the soil surface to the tip of the panicle extended vertically) was not evaluated in the first crop. Adjacent experiments with Cocodrie and Trenasse showed mature plant heights averaged 82 and 90 cm in the controls, respectively. Stubble height averaged 9 and 16 inches for the two cutting heights (Table 1). Based on these plant heights, the amount of stubble remaining after harvest relative to mature plant height was estimated to average 40% for Cocodrie and 34% for Trenasse. Amount of stubble remaining as affected by cutting height was estimated to average 27% for the lower than normal cutting height and 47% for the normal cutting height. The effects of variety and cutting height were independent of each other (Table 2). Plots were harvested using a combine with a straw shredder and in one continuous motion without stopping between subplots. This produced an even layer of straw over each subplot and replicate and precluded evaluating grain yield in the first crop. Lodging was absent in all plots.
Second (Ratoon) Crop Growth
The rate of reproductive growth and development, although not significantly different, tended to be affected by variety and first crop cutting height (Table 1). Heading was just beginning at 4 weeks after first crop harvest (WAH), and panicle emergence (panicles completely exserted) was noticeable at 5 WAH. Panicle emergence was slightly earlier and higher for Trenasse compared with Cocodrie. On average, panicle densities were 4, 19, 35, 41, and 42 panicles/ft2 for Trenasse and 3, 13, 24, 29, and 32 panicles/ft2 for Cocodrie at 5, 6, 7, 8, and 9 WAH, respectively. Panicle emergence was slightly earlier and number of panicles was higher with the higher cutting height. On average, panicle densities were 2, 11, 26, 32, and 34 panicles/ft2 with the lower cutting height compared with 5, 21, 33, 39, and 40 panicles/ft2 with the higher cutting height at 5, 6, 7, 8, and 9 WAH, respectively. For the most part, the effects of variety and cutting height were independent (Table 2), and panicle emergence was complete at 9 WAH.
Second (Ratoon) Crop Production Crop stature, maturity, and production were evaluated at harvest, and crop stature and maturity were significantly and independently affected by variety and cutting height (Table 3). Mature plant height (distance from the soil surface to the tip of the panicle extended vertically) averaged 71 and 75 cm for Cocodrie and Trenasse, respectively. On average, mature plant height (73 cm) was not affected when cutting height was reduced from 16 to 9 inches. Grain moisture (an indicator of crop maturity) averaged 19.2 and 19.0% for Cocodrie and Trenasse, respectively.

212
On average, grain moisture increased significantly (18.2% vs. 20.0%) when cutting height decreased. These results, along with the previously discussed panicle emergence results, indicate a trend toward delaying maturity by lowering cutting height. On average, grain yields (adjusted to 12% moisture) were 2,162 and 2,048 lb/A for Cocodrie and Trenasse, respectively, and grain yields were 2,109 and 2,101 lb/A for the 9- and 16-inch stubble heights, respectively. Trenasse had a lower yield (1,938 lb/A) compared with Cocodrie (2,781 lb/A) at the lower stubble height (Table 4). Table 1. The main effects of variety and first (main) crop cutting height on first crop stubble production and second (ratoon) crop heading. Rice Research Station, Crowley, LA. 2007. Heading Heading Heading Heading Heading Heading Pan.Den. Pan.Den. Pan.Den. Pan.Den. Pan.Den. Pan.Den. Stubble (pan./sq (pan./sq (pan./sq (pan./sq (pan./sq (pan./sq Treatment Fm Grow Ht. ft) ft) ft) ft) ft) ft) Name Ds Rate Stg (in.) 04 WAH 05 WAH 06 WAH 07 WAH 08 WAH 09 WAH
TABLE OF VARIETY MEANS Cocodrie 13 0 3 13 24 29 32 Trenasse 12 0 4 19 35 41 42
TABLE OF CUTTING HEIGHT MEANS 8-inch 9 0 2 11 26 32 34 16-inch 16 0 5 21 33 39 40 Within the same table, means followed by the same letter do not differ significantly (Duncan’s multiple range test, P=.05). Table 2. The simple effects of variety and first (main) crop cutting height on first crop stubble production and second (ratoon) crop heading. Rice Research Station, Crowley, LA. 2007. Heading Heading Heading Heading Heading Heading Pan.Den. Pan.Den. Pan.Den. Pan.Den. Pan.Den. Pan.Den. Stubble (pan./sq (pan./sq (pan./sq (pan./sq (pan./sq (pan./sq Treatment Fm Grow Ht. ft) ft) ft) ft) ft) ft) Name Ds Rate Stg (in.) 04 WAH 05 WAH 06 WAH 07 WAH 08 WAH 09 WAH Cocodrie 9b 0b 2b 10b 20a 27a 30a 8-inch Cocodrie 16a 0b 3b 17ab 27a 32a 34a 16-inch Trenasse 8b 0a 2b 12ab 31a 36a 37a 8-inch Trenasse 16a 0b 6a 25a 39a 46a 47a 16-inch LSD (.05) = 1 0 2 15 26 28 27 Standard Dev. = .36443 0 .50775 4.7726 8.1398 8.9108 8.5639 CV = 2.94 0 14.91 30.01 27.80 25.44 23.24 Means followed by same letter do not differ significantly (Duncan's multiple range test, P=.05).

213
Table 3. The main effects of variety and first (main) crop cutting height on second (ratoon) crop production. Rice Research Station, Crowley, LA. 2007. Mature Grain Grain Treatment Fm Grow Pl. Ht. Moisture Yield Name Ds Rate Stg (cm) (%) lb/A)
TABLE OF VARIETY MEANS Cocodrie 71a 19.2 2162 Trenasse 75b 19.0 2048
TABLE OF STUBBLE HEIGHT MEANS 8-inch 73 20.0a 2109 16-inch 73 18.2b 2101 Within the same table, means followed by the same letter do not differ significantly (Duncan’s multiple range test, P=.05). Table 4. The simple effects of variety and first (main) crop cutting height on second (ratoon) crop production. Rice Research Station, Crowley, LA. 2007. Mature Grain Grain Treatment Fm Grow Pl. Ht. Moisture Yield Name Ds Rate Stg (cm) (%) lb/A) Cocodrie 71b 20.4a 2281a 8-inch Cocodrie 71b 18.1b 2044ab 16-inch Trenasse 75a 19.7ab 1938b 8-inch Trenasse 75a 18.4b 2159ab 16-inch LSD (.05) = 3 1.7 253 Standard Dev. = .85847 .54792 79.621 CV = 1.17 2.86 3.78 Means followed by same letter do not differ significantly (Duncan's multiple range test, P=.05).

214
YIELD ENHANCEMENT STUDIES – FIRST CROP
R.T. Dunand and R.R. Dilly, Jr. Experiment: BioForge and Crop Production in Drill-Seeded Rice General Methodology: See South Unit General Methodology (pg. 206) Variety: Trenasse Treatment(s): Plant Growth Regulator BioForge (0.5 and 1.0 pt/A) Timing 3- to 4-Leaf (3/4 LF), 1 May (2 days before flooding) Late Boot (LB), 11 June Pertinent Rainfall: No rainfall within 8 hours after applications Experimental Design: Randomized complete block and four replications Comments: Crop Production Crop stature, maturity, and production were evaluated at harvest, and none were significantly affected by the applications of BioForge (Table 1). Mature plant height (distance from the soil surface to the tip of the panicle extended vertically) for treatments ranged between 86 and 88 cm (control = 85 cm). Grain moisture (an indicator of crop maturity) for treatments ranged between 18.6 and 19.2% (control = 18.6%). Grain yield (adjusted to 12% moisture) for treatments ranged between 6,443 and 6,918 lb/A and were generally lower compared with the control (7,357 lb/A).
Table 1. The effects of early and late season applications of BioForge on crop growth and production in drill-seeded rice. Rice Research Station, Crowley, LA. 2007. Mature Grain Grain Treatment Fm Grow Pl. Ht. Moisture Yield Name Ds Rate Stg (cm) (%) (lb/A) Control 85a 18.6a 7357a BioForge l 8 3/4L 86a 18.9a 6918a BioForge l 16 3/4L 86a 19.2a 6833a BioForge l 8 LB 88a 18.9a 6918a BioForge l 16 LB 86a 18.6a 6443a LSD (.05) = 3 0.6 1143 Standard Dev. = 1.9472 .41251 742.13 CV = 2.26 2.19 10.77 Means followed by same letter do not significantly differ (Duncan's multiple range test, P=.05).

215
OFF-STATION GENERAL METHODOLOGY
Location: Dennis Leonards’ Farm, Crowley, LA
Seeding Method/Depth/Rate: Drilled on 7-inch rows/1 inch/90 - 95 lb/A Fertilizer: Zinc Plus (10 fl oz/cwt) seed treatment, 15 Apr Urea (46%N) at 200 lb/A by airplane, 15 May Urea/Ammonium sulfate (33% N) at 100 lb/A by airplane, 8 and 15 June Plot Size/Treated Area: 6000 ft2 – 30 x 200 ft Seed Treater: G&H Seed Company Sprayer: John Deere mule, air-driven, 10 GPA Planting Date: 31 Apr Emergence: 5 May Water Management: Flooded, 16 - 23 May, then drained due to appearance of ‘Localized Decline’ Flushed, 9 June Flooded, 16 June Preharvest drain, 16 Aug Pertinent Rainfall: Frequent rainfall between planting and permanent flood minimized flushing, and
rainfall during the later part of August delayed harvest by 3 to 5 days Growth Stage Definitions: 3/4 Leaf Stage = 3- to 4-leaf collars visible on majority of seedlings Pesticide(s): Apron XL (0.32 fl oz/cwt) seed treatment, 15 Apr Maxim (0.04 fl oz/cwt) seed treatment, 15 Apr Roundup (1.5 pt/A) by ground sprayer, 9 and 30 Apr Arrosolo (1 gal/A) + Permit (0.25 oz/A) by airplane, 14 May Stratego (17 fl oz/A) by airplane, 7 July Plant Growth Regulator(s): Release LC (1 fl oz/cwt) seed treatment, 15 Apr Harvest Date/Area: 4 Sept/3916 ft2 – 22 (cutter width) x 178 ft
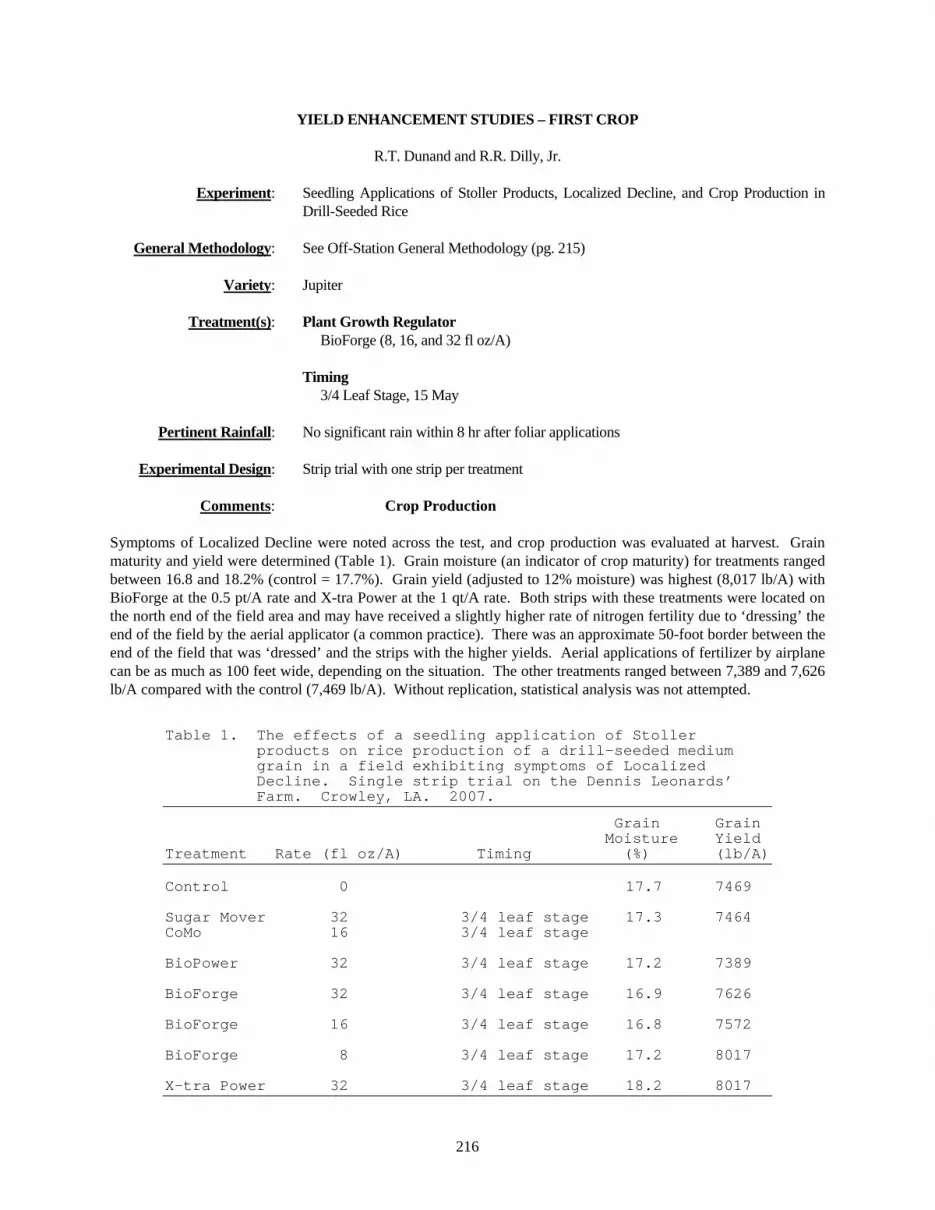
216
YIELD ENHANCEMENT STUDIES – FIRST CROP
R.T. Dunand and R.R. Dilly, Jr. Experiment: Seedling Applications of Stoller Products, Localized Decline, and Crop Production in
Drill-Seeded Rice General Methodology: See Off-Station General Methodology (pg. 215) Variety: Jupiter Treatment(s): Plant Growth Regulator BioForge (8, 16, and 32 fl oz/A) Timing 3/4 Leaf Stage, 15 May Pertinent Rainfall: No significant rain within 8 hr after foliar applications Experimental Design: Strip trial with one strip per treatment Comments: Crop Production Symptoms of Localized Decline were noted across the test, and crop production was evaluated at harvest. Grain maturity and yield were determined (Table 1). Grain moisture (an indicator of crop maturity) for treatments ranged between 16.8 and 18.2% (control = 17.7%). Grain yield (adjusted to 12% moisture) was highest (8,017 lb/A) with BioForge at the 0.5 pt/A rate and X-tra Power at the 1 qt/A rate. Both strips with these treatments were located on the north end of the field area and may have received a slightly higher rate of nitrogen fertility due to ‘dressing’ the end of the field by the aerial applicator (a common practice). There was an approximate 50-foot border between the end of the field that was ‘dressed’ and the strips with the higher yields. Aerial applications of fertilizer by airplane can be as much as 100 feet wide, depending on the situation. The other treatments ranged between 7,389 and 7,626 lb/A compared with the control (7,469 lb/A). Without replication, statistical analysis was not attempted.
Table 1. The effects of a seedling application of Stoller products on rice production of a drill-seeded medium grain in a field exhibiting symptoms of Localized Decline. Single strip trial on the Dennis Leonards’ Farm. Crowley, LA. 2007. Grain Grain Moisture Yield Treatment Rate (fl oz/A) Timing (%) (lb/A) Control 0 17.7 7469 Sugar Mover 32 3/4 leaf stage 17.3 7464 CoMo 16 3/4 leaf stage BioPower 32 3/4 leaf stage 17.2 7389 BioForge 32 3/4 leaf stage 16.9 7626 BioForge 16 3/4 leaf stage 16.8 7572 BioForge 8 3/4 leaf stage 17.2 8017 X-tra Power 32 3/4 leaf stage 18.2 8017

217
AQUACULTURE RESEARCH
ANNUAL SUMMARY OF ENVIRONMENTAL CONDITIONS AND CRAWFISH PRODUCTION
W.R. McClain and J.J. Sonnier
Table 1 contains the average weekly data for environmental conditions and crawfish catch, 2006-2007 season, crawfish research project, Rice Research Station, Crowley, LA. The catch consisted almost exclusively of red swamp crawfish (Procambarus clarkii). The production summary is composed of averages across all experimental plots and treatments. Pond History: Ponds were fallow for a period of 10 months following the previous crawfish season of 2004-2005. Rice crops were planted in Apr and harvested in Sept 2006, and fields were not stocked with brood crawfish. Rather, recruitment was by intentional stocking of hatchlings in the fall of 2006. Soil Type: Crowley silt loam Water Source: Groundwater Pond Area: Twelve 1-acre ponds Forage Crops: Rice, variety ‘Cocodrie,’ was seeded by air on 17 Apr 2006 at 110 lb/A. Grain was harvested by rice combine on 7 Sept 2006, and a ratoon forage crop was managed from the stubble for crawfish production. Permanent Flood Date: 2 Oct 2006 Trap Type: 3-funnel pyramid trap; 0.75-inch square mesh wire Bait Used: Manufactured baits: Cajun World and Early On (Purina Mills, Inc., St. Louis, MO) and Southern Pride (Country Acres Feed, Inc., Brentwood MO) Crawfish Harvest: 16 traps/A, 21 Mar - 26 June 2007 (44 total trapping days resulting in 704 total trap-sets/A). Crawfish Grades: Harvested crawfish were subjected to a grader (passive, water type) and sorted into three size-grade categories as follows: “Large” - <15 count/lb, “Medium” - 15-21 count/lb, and “Small” - > 21 count/lb.

Table 1. Annual environmental conditions and crawfish production (averaged or totaled weekly). Rice Research Station, Crowley, LA. 2006-2007.
Weeks
Soil Temp.1 Min. Max.
Air Temp. Min. Max.
Water Temp. Min. Max.
Avg. D.O.2
Total Rainfall
Large
Crawfish Count
CrawfishHarvest
CrawfishSize
Total Trapsets
--------------------------deg. F-------------------------- (mg/L) (inches) (#/trap) (lb/A) (cnt/lb) (#/A)
June 1-3 78.0 84.3 66.3 86.7 June 4-10 79.0 90.7 68.4 90.4 0.62 June 11-17 81.6 92.7 72.0 91.9 June 18-24 79.3 87.7 73.4 89.6 1.30
June 25-July 1 82.9 94.0 69.1 92.3 July 2-8 80.6 87.1 74.3 88.0 2.27
July 9-15 80.0 89.0 74.7 90.7 2.16 July 16-22 82.6 90.6 74.4 94.4 2.36 July 23-29 80.4 83.6 74.6 86.9 3.50
July 30-Aug 5 82.1 89.3 75.1 92.7 0.66 Aug 6-12 82.0 90.4 74.4 91.7 0.93
Aug 13-19 83.1 92.4 74.3 94.7 1.92 Aug 20-26 82.9 91.6 75.1 91.6 2.02
Aug 27-Sept 2 79.3 88.6 72.4 88.9 3.58 Sept 3-9 79.6 89.4 68.1 89.9
Sept 10-16 78.1 85.1 71.1 87.3 1.12 Sept 17-23 76.0 83.3 70.9 85.1 1.34
Sept 24-30 71.6 80.6 61.9 83.1 0.64 Oct 1-7 76.7 86.0 66.7 89.1
Oct 8-14 70.7 79.3 66.3 83.1 0.10 Oct 15-21 72.7 78.1 64.0 80.3 68.7 74.7 6.15 Oct 22-28 60.9 69.4 51.7 71.6 63.1 70.0 1.07 2.10
Oct 29-Nov 4 60.7 70.0 51.0 73.0 60.8 69.8 0.87 Nov 5-11 61.7 70.0 55.1 76.0 63.1 70.7 1.20 1.80
Nov 12-18 57.1 66.1 45.6 66.7 56.3 63.9 0.40 Nov 19-25 50.9 61.9 37.4 63.4 52.0 59.2
Nov 26-Dec 2 58.0 66.6 51.6 73.3 58.3 65.5 2.20 0.84 Dec 3-9 45.1 53.6 30.7 54.7 43.3 50.0 7.54
Dec 10-16 55.6 59.6 47.9 66.0 55.4 61.0 2.81 0.60 Dec 17-23 60.9 64.6 56.0 68.9 60.3 64.8 1.19 1.21
Continued.
218

Table 1. Continued.
Weeks
Soil Temp.1 Min. Max.
Air Temp. Min. Max.
Water Temp. Min. Max.
Avg. D.O.2
Total Rainfall
Large
Crawfish Count
Crawfish Harvest
Crawfish Size
Total Trapsets
--------------------------deg. F-------------------------- (mg/L) (inches) (#/trap) (lb/A) (cnt/lb) (#/A) Dec 24-30 51.0 56.6 42.3 59.0 51.1 56.7 5.15
Dec 31-Jan 6 55.1 59.0 45.9 62.1 53.4 59.5 3.05 Jan 7-13 55.7 60.6 48.7 66.4 54.9 63.0 3.34 1.05
Jan 14-20 54.0 57.6 45.4 56.3 47.8 54.0 1.50 Jan 21-27 52.0 54.4 42.3 55.4 48.2 53.6 6.80 2.90
Jan 28-Feb 3 49.0 51.3 38.0 49.3 45.5 51.4 7.87 2.10 Feb 4-10 49.1 54.6 41.0 60.4 50.0 60.1 6.50
Feb 11-17 49.9 55.7 36.7 56.3 46.8 58.5 3.41 0.24 Feb 18-24 52.1 59.0 44.3 68.4 56.3 66.7 2.80 0.16
Feb 25-Mar 3 59.9 65.7 50.7 72.9 60.8 72.7 2.29 0.26 Mar 4-10 55.7 63.3 41.0 67.1 56.3 70.7 4.53
Mar 11-17 63.3 68.4 56.4 74.7 64.6 75.7 1.35 1.32 Mar 18-24 63.1 69.7 58.4 74.9 65.5 77.7 0.63 1.7 3.2 17.2 32 Mar 25-31 69.1 74.9 65.6 81.6 69.6 79.0 0.40 2.4 6.1 15.6 40
Apr 1-7 65.1 71.6 57.4 75.6 62.1 73.6 0.80 1.12 2.0 4.7 14.8 35 Apr 8-14 58.4 66.3 51.4 67.3 60.8 75.2 1.73 1.77 2.9 12.5 12.6 55
Apr 15-21 63.3 73.6 53.6 74.4 64.4 79.9 0.31 3.6 9.4 11.6 31 Apr 22-28 69.1 76.4 63.6 80.1 70.3 82.8 1.20 3.5 14.0 11.5 47
Apr 29-May 5 72.3 82.3 66.7 85.3 75.0 87.4 0.52 4.3 19.3 11.3 51 May 6-12 75.4 83.1 68.7 85.9 76.1 90.9 0.10 4.0 17.1 11.1 48
May 13-19 74.3 84.0 64.4 85.0 73.0 87.4 0.09 3.2 13.7 11.1 48 May 20-26 73.9 81.9 64.0 83.4 72.3 84.4 0.28 2.9 13.0 10.8 48
May 27- June 2 74.0 81.4 66.9 84.7 74.7 85.8 4.60 3.2 14.2 10.7 48 June 3-9 75.9 84.0 73.0 88.6 79.3 91.9 1.50 3.5 20.4 10.6 61
June 10-16 79.6 89.7 73.4 92.9 80.6 90.0 2.84 2.8 17.7 10.6 65 June 17 -23 77.1 86.6 74.3 89.7 80.4 91.2 0.80 2.1 12.4 10.7 64 June 24-30 79.9 90.4 74.3 89.9 79.3 89.8 0.24 1.3 4.0 10.8 32
65.34 181.6 704 1 Soil temperature was measured at a depth of 4 inches. 2 Dissolved oxygen readings were taken about 8:00 a.m. 3 Rainfall total is for 1 year only (June 1, 2006 - May 31, 2007) and does not include rainfall occurring in June 2007.
219

220
SUMMER BURROW EXCAVATIONS AND EFFECTS OF VARIOUS FACTORS ON REPRODUCTION IN THE LABORATORY
W.R. McClain and J.J. Sonnier
INTRODUCTION
Crawfish survival and reproduction in summer burrows is thought to be highly variable, largely as a result of
weather patterns, but also may hinge on the health and condition of animals as they enter the burrow. Because crawfish production as practiced in Louisiana relies on natural reproduction, events that happen prior to and during the burrow occupation may significantly influence subsequent production. For example, anecdotal evidence in recent years, backed by limited research, has linked low production to unusually low and/or infrequent rainfall. Soil type, burrow depth, burrow location, and amount of water inside the burrow at the time of initial burrowing may play a role in how well burrowed crawfish respond to prolonged drought conditions. Because very little research exists regarding the burrow ecology of crawfish, especially as it relates to crawfish aquaculture, research at the LSU AgCenter is being focused in this area. This study examined crawfish in natural burrows following pond draining with normal rainfall patterns and also created simulated drought conditions at various times and of varying lengths in a system of artificial burrows. Another factor examined in this study was the use of supplemental feeds and/or the crawfish’s ability to forage following stocking as a means of building energy reserves prior to burrowing. Because ovarian maturation and spawning occur in the burrow after extended stays, where food resources are severely limited, female broodstock must build sufficient energy reserves for reproduction prior to burrowing. Preliminary investigations have shown lower reproduction potential when females enter the burrow with low energy reserves. Short-term supplemental feeding of ponds prior to peak burrowing activity may improve survival and/or reproductive success within the summer burrow. However, it is unknown if supplemental feeding is beneficial when stocked crawfish have ample opportunity to forage in a food-replete rice crop prior to burrowing. The effects of burrowing strategy on reproductive performance were also evaluated. Survival and reproductive success of crawfish that burrowed prior to pond draining were compared with that of crawfish burrowing only after pond draining. Crawfish from each burrowing strategy were excavated during the summer dry period and placed in a system of artificial burrows in the lab for further observance. Burrowing crawfish were also compared to trap-harvested animals that were placed in artificial burrows directly from open water or held for varying lengths of time in ponds prior to placement in artificial burrows. The system of artificial burrows closely mimicked conditions in natural burrows while allowing more precise observations of survival and reproduction. For example, with monthly examinations of each animal, the time of spawning was associated with each treatment factor and time/method of collection. Ponds: Crawfish from experimental 1-acre ponds receiving no supplemental feed, used in the study “Effects of Trap Density on Crawfish Yield in a Rice-Crawfish Field Rotational Management System” in the 97th annual research report, and one experimental pond receiving supplemental feed were used for this study. It is assumed that the experimental trap density treatments in the previous study had no significant effect on the experimental treatments or outcomes of this study. Permanent Flood Date: 26 Sept 2005 Pond Drain Date: 6 June 2006 Feed: A commercial sinking catfish feed (32% crude protein) was offered twice per week, at 40 lb/A, for 4 weeks prior to crawfish collection in the “fed pond.” No supplemental feed was offered in other ponds.

221
Crawfish Collections from Open Water: Mature crawfish (Procambarus clarkii) were collected (via baited traps) from open waters of both fed and non-fed ponds just prior to pond draining. Subsets of the fed and non-fed, trap-harvested crawfish were placed in enclosures within a rice crop for 1, 3, and 5 weeks prior to the transfer of females to artificial burrows. Additional subsets of trap-harvested crawfish were placed in sections of the rice field to roam freely with the intent of subsequent collection by traps. Subsets (n=10) of the trap-harvested crawfish from both fed and non-fed ponds were dissected and assessed for body condition. Other mature females were placed directly in artificial burrows. Enclosures: Cylindrical wire-mesh enclosures (31 inches in diameter by 18 inches tall) constructed of 1/8-inch plastic-coated wire mesh, with a wire mesh bottom, were placed over young rice plants in a newly planted rice field to serve as a confinement under typical field conditions. The enclosures contained a solid aluminum strip of sheeting (3 inches wide) around the inside top perimeter to prevent escapement from crawfish climbing up the wire mesh. Each enclosure was stocked with five mature females and two mature males. Burrows Identified: Prior to pond draining and within the first week following pond draining, sealed (capped) crawfish burrows on the levees and in pond bottoms, for both fed and non-fed ponds, were flagged for later excavation. Crawfish Collections from Burrows: From 10 Aug to 23 Aug 2006, flagged crawfish burrows were hand-excavated and crawfish retrieved. Burrow location, depth, volume of water, and quantity, sex, and maturity of crawfish retrieved from each burrow were noted. Subsets (n=5 to 10) of mature female crawfish retrieved from both pre- and postdrain constructed burrows and for each pond type (fed or non-fed) were dissected for determination of body condition. Remaining mature females were placed directly in artificial burrows for subsequent reproduction under simulated conditions. Artificial Burrow System: Multiple half-gallon plastic containers (with lids) filled with 0.48 L of soil and a similar volume of aged pond water served to simulate conditions inside naturally constructed crawfish burrows. The containers were each stocked with a single female crawfish and housed in an environmentally controlled laboratory. Temperature in the lab was maintained at about 81°F to provide amenities and conditions approaching that of earthen burrows during the typical burrow occupation (reproductive period) of summer/early autumn. Survival/Reproduction Assessment: Artificial burrows were inspected monthly, beginning in July, whereby each female crawfish was examined for survival and spawning. Tissue Analysis: Subsamples of each group where dissected upon collection and non-spawning females of the simulated drought treatments were dissected upon termination (31 Dec 2006) for tissue analysis. Burrow Parameters: Burrow timing, burrow depth, water volume, and number, sex, maturity and survival status of burrow occupants Reproductive Parameters: Survival, spawning status, number of offspring, month spawned, month hatched, and body condition indices for select treatments Experimental Design: With respect to assessment of crawfish survival/reproduction in artificial burrows, a completely randomized design was used for each treatment comparison. Statistical Analysis: General Linear Model analysis, with means separated by Duncan’s multiple range test Support: USDA Special Grants – Aquaculture Conclusions: Over 260 attempts were made to excavate crawfish burrows, and though some were too deep, filled with fresh mud, or contained no sign of live or dead crawfish, 194 burrows containing crawfish (74%) were successfully examined (Figure 1). Of those 194, 36% contained only dead crawfish, 34% contained a single live crawfish, and 30% contained two live crawfish. Of the 184 live crawfish excavated, 61% were female and 98% of those were judged to be sexually mature. It was surprising to observe that 36% of the burrows contained no living crawfish after such a short time following pond draining with the modest rainfall patterns.

222
Based on whether burrows contained live or dead crawfish and whether a burrow was occupied by one or two crawfish, Table 1 contains the average burrow depths, range of water volumes found, and the percentages of burrows per category that contained no measurable free standing water. As with burrow examinations in previous years, dead crawfish were generally associated with shallow burrows and burrows containing no measurable water, and there was a strong positive relationship between the amount of water present and burrow depth. Burrow morphological data is further broken down in Table 2 by timing of burrow construction (in relationship to pond draining) and by burrow depths. As expected, all predrain burrows were constructed near the top of the levee at the water’s edge, while many postdrain burrows were constructed near the confluence of the levee and pond bottom or along boat ruts in the pond bottom. Therefore, it is difficult to separate any influence of timing of burrowing with that of burrow location. There were, however, marked differences due to burrow location/timing in average volume of water present in burrows, the percentages of burrows with no measurable water, and burrows containing live crawfish although the burrow depths were similar. The postdrain burrows contained more water -- often burrows were full of water -- and on average contained about 33% more live crawfish. Though the implication of these findings with regard to burrow location and/or timing is unclear in the Crowley silt loam soil, burrow depth and presence of free water inside the burrow seem to be well correlated to crawfish survival. Water volume was generally greater with increasing burrow depths, as was crawfish survival. Response variables for crawfish excavated from burrows and held in artificial burrows for spawning are presented in Table 3. Although few significant differences were observed, spawning success appeared slightly greater for the postdrain burrowers, but the predrain burrowers spawned slightly earlier on average. The first comparisons in Table 4 show that the response variables with regard to crawfish extracted from natural burrows and placed in artificial burrows were generally better than crawfish collected from traps, whether they were held for a short time prior to placement in artificial burrows or not. Burrow-extracted crawfish had significantly higher survival, greater spawning rate, and yielded more offspring than trap-collected animals. Spawning success was more than doubled over trap harvested crawfish. The reasons for these differences are not clear. Crawfish stocked into the system of artificial burrows directly after trap harvest spawned and hatched young earlier than those trapped and held or those collected from burrows. The reasons for this too are unclear. Feeding of crawfish in ponds for a short period prior to collecting was another treatment factor in this study. This was done to compare the survival and reproduction of crawfish during the burrow stay based on the availability of nutrients and presumably their ability to use these abundant nutrients to build reserves prior to entry into the burrow. Spawning success was greater for those crawfish from fed ponds, possibly indicating inadequate nutrition from forage-based ponds. Few other differences were observed between the fed and non-fed groups when comparing animals under the different protocols. Allowing non-fed crawfish to forage in a somewhat more food-rich environment of a rice field prior to the burrow stay seemed to offer little improvement in spawning success in the short run; although after 5 weeks, the spread between fed and non-fed crawfish was reduced. When comparing non-held non-fed crawfish (that is, crawfish placed directly into artificial burrows following trap harvest) and those non-fed crawfish held for 5 weeks in a rice field, survival in the artificial burrows was 73 and 91%, respectively, and spawning success was 27.5 and 54.5%, respectively. Similarly, spawning success of fed crawfish increased from 41% to only 58%. This indicates that given enough time, crawfish may be able to build reserves and gain the needed energy for the long burrow stay without supplemental feed by feeding in the improved environment of a rice field. The suitable environment of a rice field may also provide an opportunity for stocked broodstock to complete maturation and mate before burrowing. However, the benefits from this perspective may not be separable from those of nutrition, based solely on reproductive success in this study. In previous studies, however, short-term holding seem to positively impact both survival and spawning success. Table 5 provides the relative timing of spawning in artificial burrows based on various factors. Spawning began as early as July in this study and no spawning occurred after October for this particular group of crawfish. Overall, peak spawning occurred during September. In general, more trap-harvested crawfish spawned earlier than crawfish extracted from burrows. Thirty-nine percent of trap-caught crawfish had spawned before September, while only 17% of burrow crawfish had spawned by then. When examined more closely, however, trap-caught crawfish that were held for only 1 week prior to their introduction into the artificial burrows tended to spawn later. The reason is unclear. About 38% of the crawfish from predrained constructed burrows spawned in August, whereas no crawfish from the postdrain burrows spawned before September. Although it was not possible to determine when crawfish

223
constructed predrain burrows in this study, in general, those crawfish collected from traps earlier during the earlier collection dates had a tendency to spawn earlier. Few differences were observed for fed versus non-fed crawfish with regard to timing of spawning. Average response variables for those crawfish subjected to aspects of simulated drought during the burrow occupation are presented in Table 6. Simulated drought treatments negatively impacted crawfish survival and spawning success, and those treatments tended to delay the average time of spawning. Survival was impacted most by the constant drought; however, the August drought resulted in low survival as well. This may have just been an artifact of the lower number of replicates because the multi-month drought treatments did not result in this low survival. Spawning success was generally lowest for the September and October and multi-month drought treatments, likely because these months constitute the peak months for spawning. In general, successful reproduction was the lowest and was delayed the longest with the most severe (longest) drought treatments, although differences were not always statistically significant. The date of collection had some minor impact on average date of spawning (in the absence of a drought treatment) – with crawfish collected after May 2 spawning about 1 month later. The last table (Table 7) provides some comparisons of condition indices for a subsample of crawfish at collection and those non-reproducing crawfish at termination of the simulated drought study. The greatest differences seem to be associated with the hepatopancreas and abdominal or tail muscle of those crawfish at collection compared with those at termination of the study. These differences are typical of changes that occur during the burrow stay. Drought treatments seem to have had little impact on these indices, with the exception of the “all dry” or constant drought treatment. Although there were only two crawfish in this group, these seemed to have on average more advanced ovaries than the initial subset and the condition indices of the hepatopancreas and abdominal muscle fell in between the initial subset and the other treatment groups. Even though these two crawfish experienced the same lengthy burrow stay as those experiencing partial drought environments, it appears they were more “conditioned” to the poor circumstances and were better poised to continue reproduction with improved conditions. This warrants further investigation.

224
Figure 1. Categorizations from crawfish burrow excavations following draining of experimental crawfish ponds. Upper chart is organized by burrow observations then by occupant status, while lower chart is organized by crawfish survival then by sex and maturity status.

225
Table 1. Aspects of burrow ecology relating to crawfish extracted from burrows following pond draining in experimental crawfish production ponds. Total rainfall from pond draining until last burrow excavated was 2.64 inches for four occasions (range = 0.30 - 1.10 inches). Rice Research Station, Crowley, LA. 2007.
Burrows
No.
Average Depth (and Range) of Burrows (inches)
Range of Water Volume (ml)
% of Burrows without Water
With Remnants of Dead 69 28.5 (4-57) 0 - 2250 21.7 Single Occupancy1 - Live 66 33.4 (7-60) 0 - 9000 13.6 Double Occupancy2 - Both Live 59 37.9 (15-55) 0 - 5300 3.4
1 Nine of the 66 burrows contained mature males, one contained an immature female, and one contained an immature male. 2 58 of the 59 burrows contained one mature male and one mature female and one contained a mature male and immature female. Table 2. Characteristics of burrows constructed before and after summer pond drawdown. Rice Research Station, Crowley, LA. 2007.
Depth Group (inches)
(N) (N) as % of Total
Avg. Depth (inches)
% Live Crawfish
Avg. Water Volume2 (ml)
% of Burrows with No Water
Pre-Drain-Constructed Burrows
4 – 10 0 - - - - - 11 – 20 11 10.6 18.0 36.4 27.3 90.9 21 – 30 30 28.8 26.4 43.3 109.8 20.0 31 – 40 33 31.7 35.0 57.6 603.6 12.1 41 – 50 24 23.1 46.4 70.8 969.6 8.3 51 – 60 6 5.8 55.3 83.3 980.8 0
Average (or Total) (104) 34.51 55.81 Post-Drain-Constructed Burrows
4 – 10 4 4.4 6.5 25.0 37.5 50.0 11 – 20 18 20.0 15.8 44.4 - 11.1 21 – 30 17 18.9 26.1 82.4 - 0 31 – 40 29 32.2 35.0 79.3 - 0 41 – 50 22 24.5 47.4 95.5 - 0 51 – 60 0 - - - - -
Average (or Total) (90) 31.21 74.41 1 Averages are weighted averages and not simply grand means from each depth category. 2 Water volume was not obtainable for burrows filled with water and common with nearby surface water sources. Table 3. Average response variables for female crawfish extracted from summer burrows and held in artificial burrows for reproduction. Treatment represents those burrows that were constructed prior to pond draining (Pre-Drain) or following pond draining (Post-Drain). Values within columns with different superscripts were significantly different (P < 0.05), and NS indicates non-significant differences among the treatments within columns. Rice Research Station, Crowley, LA. 2007.
Treatment
No.1
Int. Wt.
%
Surv1
%
Spawned1
%
Spawned2
No.
Young
No. Young/ gram
Month Spawne
d3
Month Hatch3
Pre-Drain 45 41.1B 73.3 71.1 84.2B 465 13.6 8.7B 9.3B Post-Drain 45 53.5A 88.9 86.7 97.5A 513 10.7 9.1A 9.7A
NS NS NS NS 1 Based on initial number of replicates surviving until spawning or termination. 2 Based only on animals surviving through October (the last month of spawning). 3 Based on numerical representation of the months, beginning with 1 for January.

226
Table 4. Average response variables for female crawfish collected with baited traps in open water or extracted from summer burrows and held in artificial burrows for reproduction. Values within columns with the same superscript were not significantly different (P > 0.05), and NS also indicates non-significant differences among treatments within columns, by group. Rice Research Station, Crowley, LA. 2007.
Treatment
No.1
Int. Wt.
%
Surv1
%
Spawned1
%
Spawned2
No.
Young
No. Young/ gram
Month
Spawned3
Month Hatch3
Overall Averages for Summer-Collected Female Broodstock
373 51.5 71.3 42.4 49.5 418 9.5 8.8 9.4 Comparisons among nonFed Females Collected from Traps (Held or not Held post harvest) and from Burrows
Traps (not Held) 109 52.2A 73.4AB 27.5B 31.2B 373B 7.9B 8.3B 8.9B Traps ( Held) 174 53.2A 64.9B 32.8B 39.0B 339B 6.9B 9.1A 9.5A
Burrows 90 47.3B 81.1A 78.9A 91.0A 491A 12.1A 8.9A 9.6A Comparisons between Fed and nonFed Females (All Protocols and All Holding Periods)
Fed 75 46.8B 69.3 41.3A 82.5A 332 7.3 9.1 9.6 nonFed 99 58.2A 61.6 26.3B 73.5B 347 6.4 9.0 9.4
NS NS NS NS NS Comparisons between Fed and nonFed Females by Protocol (All Holding Periods)
Caged (Fed) 16 42.2B 87.5 68.8A 68.8A 425 10.8 9.0 9.6 Caged (nonFed) 21 56.3A 71.4 28.6B 30.0B 587 10.8 8.7 9.0
NS NS NS NS NS Free (Fed) 29 50.6B 69.0 51.7A 71.4A 320 6.3 9.1 9.6
Free (nonFed) 48 60.3A 70.8 27.1B 33.3B 300 5.4 9.0 9.5 NS NS NS NS NS
In Tanks (Fed) 30 45.5B 60.0 16.7 19.2 220 4.2 9.4 9.4 In Tanks (nonFed) 30 56.0A 40.0 23.3 29.2 59 1.3 9.3 9.5
NS NS NS NS NS NS NS Comparisons by Week by Feed (Field Held Only)
Wk1 (Fed) 17 49.5 58.8B 41.2 58.3 286 6.1 9.3 9.6 Wk3 (Fed) 16 45.7 100A 75.0 75.0 426 9.8 8.9 9.5 Wk5 (Fed) 12 47.7 66.7B 58.3 77.8 297 6.3 9.0 9.7
NS NS NS NS NS NS NS Wk1 (nonFed) 37 60.0A 67.6 24.3 27.3 376 6.7 9.1 9.4 Wk3 (nonFed) 21 62.1A 66.7 19.0 25.0 366 6.5 8.8 9.5 Wk5 (nonFed) 11 50.1B 90.9 54.5 60.0 442 8.3 8.7 9.2
NS NS NS NS NS NS NS Comparisons of Field Held Crawfish by Week (Fed and nonFed Combined)
Wk1 54 56.7A 64.8 29.6 35.6 341 6.5 9.2 9.5 Wk3 37 55.0A 81.1 43.2 50.0 410 8.9 8.9 9.5 Wk5 23 48.8B 78.2 56.5 68.4 364 7.2 8.8 9.5
NS NS NS NS NS NS NS 1 Based on initial number of replicates. 2 Based only on animals surviving through October (the last month of spawning). 3 Based on numerical representation of the months, beginning with 1 for January.

227
Table 5. Percentage of spawning crawfish to spawn in artificial burrows by month. Rice Research Station, Crowley, LA. 2007.
Variable N July August September October November
Comparisons between Trap-Caught and Burrow-Excavated Females and Selections within Each Group Trap-Caught 46 15.2 23.9 45.7 15.2 0
Trap-Caught (not Held) 30 23.3 30.0 40.0 6.7 0 Trap-Caught (Held 1 wk) 16 0 12.5 56.3 31.3 0
Burrow Excavations 71 0 16.9 77.5 5.6 0
Pre-Drain 32 0 37.5 56.2 6.3 0 Post-Drain 39 0 0 94.9 5.1 0
Comparisons by Collection Dates for Trap-Caught Females
Collected May 2 (Avg. 7.7) 9 44.4 44.4 11.1 0 0 Collected May 15 (Avg. 8.7) 10 10.0 30.0 40.0 20.0 0 Collected June 1 (Avg. 8.5) 11 18.2 18.2 63.6 0 0 Collected June 7 (Avg. 9.3) 28 0 7.1 60.7 32.1 0 Collected June 21 (Avg. 8.9) 16 6.3 18.7 56.3 18.7 0 Collected July 5 (Avg. 8.8) 13 0 30.8 53.8 15.4 0
Comparisons between Fed and nonFed Trap-Caught Females Harvest the Same Day
Fed 31 0 16.1 58.1 25.8 0 Non-Feed 26 3.8 15.4 57.5 23.1 0
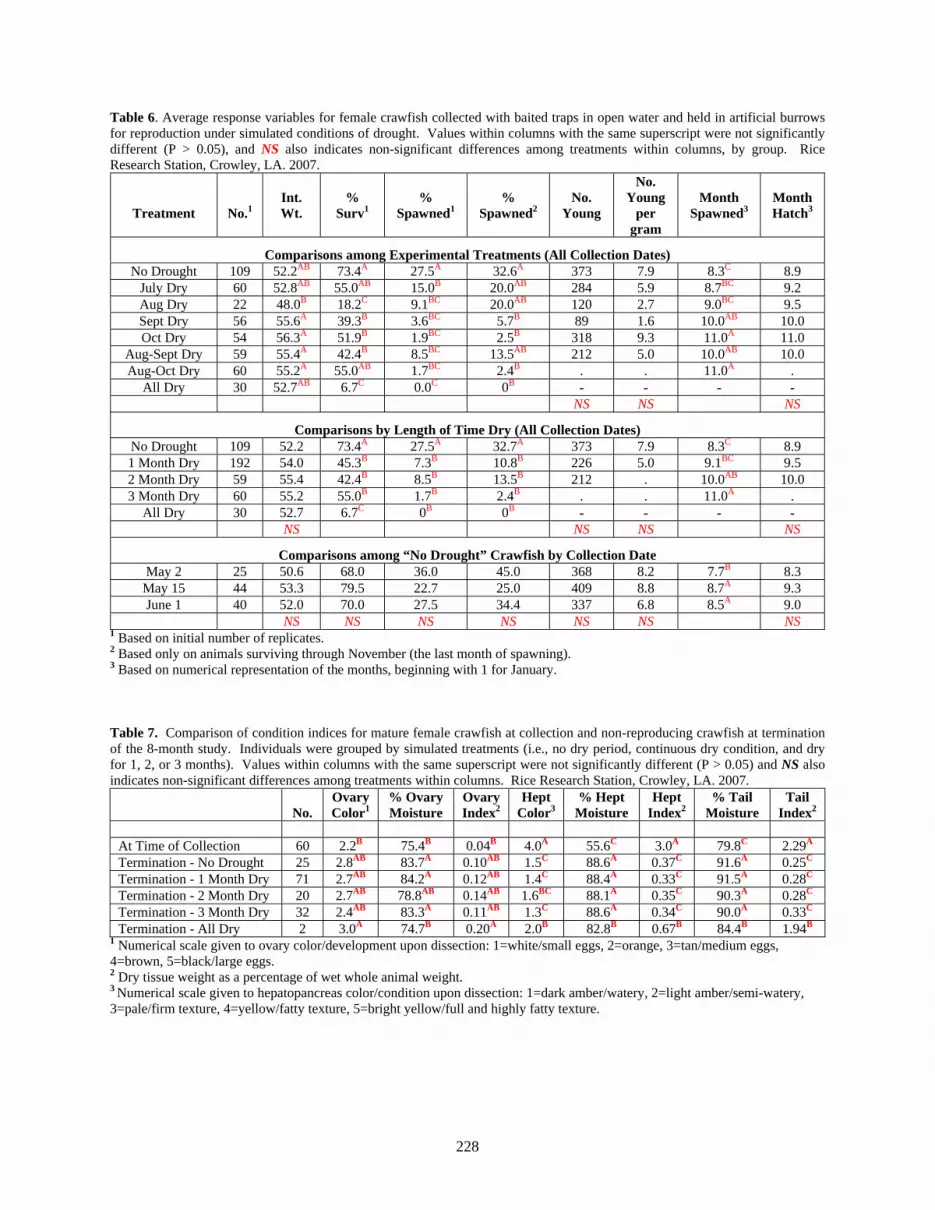
228
Table 6. Average response variables for female crawfish collected with baited traps in open water and held in artificial burrows for reproduction under simulated conditions of drought. Values within columns with the same superscript were not significantly different (P > 0.05), and NS also indicates non-significant differences among treatments within columns, by group. Rice Research Station, Crowley, LA. 2007.
Treatment
No.1
Int. Wt.
%
Surv1
%
Spawned1
%
Spawned2
No.
Young
No. Young
per gram
Month
Spawned3
Month Hatch3
Comparisons among Experimental Treatments (All Collection Dates) No Drought 109 52.2AB 73.4A 27.5A 32.6A 373 7.9 8.3C 8.9
July Dry 60 52.8AB 55.0AB 15.0B 20.0AB 284 5.9 8.7BC 9.2 Aug Dry 22 48.0B 18.2C 9.1BC 20.0AB 120 2.7 9.0BC 9.5 Sept Dry 56 55.6A 39.3B 3.6BC 5.7B 89 1.6 10.0AB 10.0 Oct Dry 54 56.3A 51.9B 1.9BC 2.5B 318 9.3 11.0A 11.0
Aug-Sept Dry 59 55.4A 42.4B 8.5BC 13.5AB 212 5.0 10.0AB 10.0 Aug-Oct Dry 60 55.2A 55.0AB 1.7BC 2.4B . . 11.0A .
All Dry 30 52.7AB 6.7C 0.0C 0B - - - - NS NS NS
Comparisons by Length of Time Dry (All Collection Dates)No Drought 109 52.2 73.4A 27.5A 32.7A 373 7.9 8.3C 8.9 1 Month Dry 192 54.0 45.3B 7.3B 10.8B 226 5.0 9.1BC 9.5 2 Month Dry 59 55.4 42.4B 8.5B 13.5B 212 . 10.0AB 10.0 3 Month Dry 60 55.2 55.0B 1.7B 2.4B . . 11.0A .
All Dry 30 52.7 6.7C 0B 0B - - - - NS NS NS NS
Comparisons among “No Drought” Crawfish by Collection Date May 2 25 50.6 68.0 36.0 45.0 368 8.2 7.7B 8.3 May 15 44 53.3 79.5 22.7 25.0 409 8.8 8.7A 9.3 June 1 40 52.0 70.0 27.5 34.4 337 6.8 8.5A 9.0
NS NS NS NS NS NS NS 1 Based on initial number of replicates. 2 Based only on animals surviving through November (the last month of spawning). 3 Based on numerical representation of the months, beginning with 1 for January. Table 7. Comparison of condition indices for mature female crawfish at collection and non-reproducing crawfish at termination of the 8-month study. Individuals were grouped by simulated treatments (i.e., no dry period, continuous dry condition, and dry for 1, 2, or 3 months). Values within columns with the same superscript were not significantly different (P > 0.05) and NS also indicates non-significant differences among treatments within columns. Rice Research Station, Crowley, LA. 2007.
No.
Ovary Color1
% Ovary Moisture
Ovary Index2
Hept Color3
% Hept Moisture
Hept Index2
% Tail Moisture
Tail Index2
At Time of Collection 60 2.2B 75.4B 0.04B 4.0A 55.6C 3.0A 79.8C 2.29A Termination - No Drought 25 2.8AB 83.7A 0.10AB 1.5C 88.6A 0.37C 91.6A 0.25C Termination - 1 Month Dry 71 2.7AB 84.2A 0.12AB 1.4C 88.4A 0.33C 91.5A 0.28C Termination - 2 Month Dry 20 2.7AB 78.8AB 0.14AB 1.6BC 88.1A 0.35C 90.3A 0.28C Termination - 3 Month Dry 32 2.4AB 83.3A 0.11AB 1.3C 88.6A 0.34C 90.0A 0.33C Termination - All Dry 2 3.0A 74.7B 0.20A 2.0B 82.8B 0.67B 84.4B 1.94B
1 Numerical scale given to ovary color/development upon dissection: 1=white/small eggs, 2=orange, 3=tan/medium eggs, 4=brown, 5=black/large eggs. 2 Dry tissue weight as a percentage of wet whole animal weight. 3 Numerical scale given to hepatopancreas color/condition upon dissection: 1=dark amber/watery, 2=light amber/semi-watery, 3=pale/firm texture, 4=yellow/fatty texture, 5=bright yellow/full and highly fatty texture.
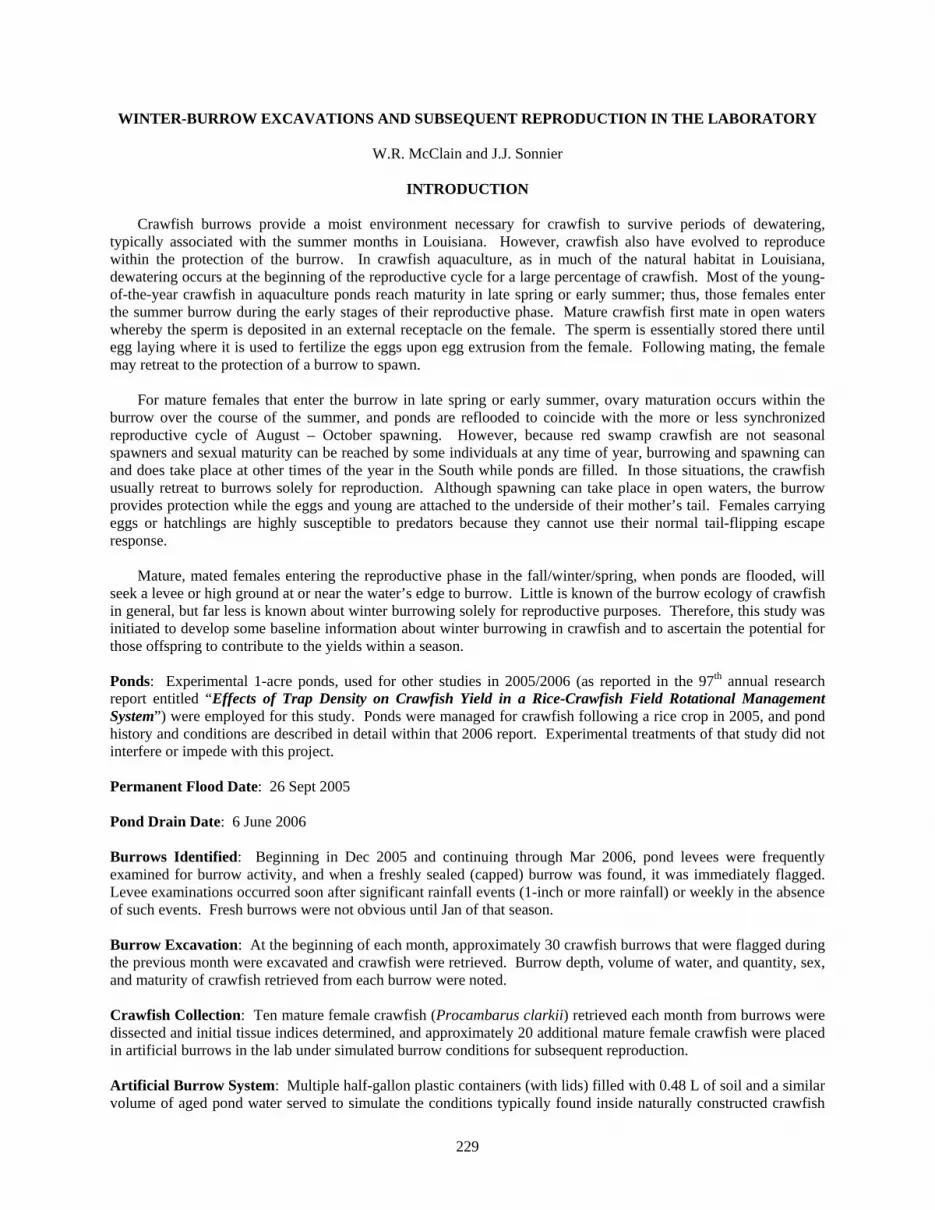
229
WINTER-BURROW EXCAVATIONS AND SUBSEQUENT REPRODUCTION IN THE LABORATORY
W.R. McClain and J.J. Sonnier
INTRODUCTION
Crawfish burrows provide a moist environment necessary for crawfish to survive periods of dewatering, typically associated with the summer months in Louisiana. However, crawfish also have evolved to reproduce within the protection of the burrow. In crawfish aquaculture, as in much of the natural habitat in Louisiana, dewatering occurs at the beginning of the reproductive cycle for a large percentage of crawfish. Most of the young-of-the-year crawfish in aquaculture ponds reach maturity in late spring or early summer; thus, those females enter the summer burrow during the early stages of their reproductive phase. Mature crawfish first mate in open waters whereby the sperm is deposited in an external receptacle on the female. The sperm is essentially stored there until egg laying where it is used to fertilize the eggs upon egg extrusion from the female. Following mating, the female may retreat to the protection of a burrow to spawn.
For mature females that enter the burrow in late spring or early summer, ovary maturation occurs within the burrow over the course of the summer, and ponds are reflooded to coincide with the more or less synchronized reproductive cycle of August – October spawning. However, because red swamp crawfish are not seasonal spawners and sexual maturity can be reached by some individuals at any time of year, burrowing and spawning can and does take place at other times of the year in the South while ponds are filled. In those situations, the crawfish usually retreat to burrows solely for reproduction. Although spawning can take place in open waters, the burrow provides protection while the eggs and young are attached to the underside of their mother’s tail. Females carrying eggs or hatchlings are highly susceptible to predators because they cannot use their normal tail-flipping escape response.
Mature, mated females entering the reproductive phase in the fall/winter/spring, when ponds are flooded, will seek a levee or high ground at or near the water’s edge to burrow. Little is known of the burrow ecology of crawfish in general, but far less is known about winter burrowing solely for reproductive purposes. Therefore, this study was initiated to develop some baseline information about winter burrowing in crawfish and to ascertain the potential for those offspring to contribute to the yields within a season. Ponds: Experimental 1-acre ponds, used for other studies in 2005/2006 (as reported in the 97th annual research report entitled “Effects of Trap Density on Crawfish Yield in a Rice-Crawfish Field Rotational Management System”) were employed for this study. Ponds were managed for crawfish following a rice crop in 2005, and pond history and conditions are described in detail within that 2006 report. Experimental treatments of that study did not interfere or impede with this project. Permanent Flood Date: 26 Sept 2005 Pond Drain Date: 6 June 2006 Burrows Identified: Beginning in Dec 2005 and continuing through Mar 2006, pond levees were frequently examined for burrow activity, and when a freshly sealed (capped) burrow was found, it was immediately flagged. Levee examinations occurred soon after significant rainfall events (1-inch or more rainfall) or weekly in the absence of such events. Fresh burrows were not obvious until Jan of that season. Burrow Excavation: At the beginning of each month, approximately 30 crawfish burrows that were flagged during the previous month were excavated and crawfish were retrieved. Burrow depth, volume of water, and quantity, sex, and maturity of crawfish retrieved from each burrow were noted. Crawfish Collection: Ten mature female crawfish (Procambarus clarkii) retrieved each month from burrows were dissected and initial tissue indices determined, and approximately 20 additional mature female crawfish were placed in artificial burrows in the lab under simulated burrow conditions for subsequent reproduction. Artificial Burrow System: Multiple half-gallon plastic containers (with lids) filled with 0.48 L of soil and a similar volume of aged pond water served to simulate the conditions typically found inside naturally constructed crawfish

230
burrows. The containers were each stocked with a single female crawfish and housed in an environmentally controlled laboratory. Temperature in the lab was maintained at about 81°F. Survival/Reproduction Assessment: Artificial burrows were inspected monthly whereby each crawfish was examined for survival and reproduction. Spawned crawfish were dissected (following release of young) for tissue index and moisture content, and young were counted. Non-reproducing crawfish were dissected for tissue analysis at completion of the study (31 Dec 2006). Parameters: Burrow conditions (month, depth, water volume, occupants, and reproductive status at excavation), subsequent female survival/reproduction, tissue indices, number of young, month spawned and hatched, and weight loss. Statistical Analysis: General Linear Model analysis and means were separated by Duncan’s multiple range test. Support: USDA Special Grants – Aquaculture Comments: The results of burrow excavations are summarized in Table 1. Of the 96 burrows successfully excavated, two contained only males, and 56% of the remainder contained a single female, whereas 44% contained a male and female. Depths of burrows ranged from 4 to 32 inches and all burrows contained free-standing water although volumes varied considerably. Of those burrows containing females, there were few differences associated with month of burrowing (Table 2). Average burrow depth (18.2 inches) was nearly identical among the three groups. Average volume of water recorded per burrow was, however, significantly affected by month of spawning, with March burrows containing the most water and February burrows containing the least. The reason is unclear. It should be noted that there were only three females found at the time of excavation that had spawned, and these were all in the March burrowing group. There were no significant differences among the winter months for average weight of females retrieved, survival and spawning success during the occupation in artificial burrows, number of offspring produced, and average weight loss following spawning (Table 3). There were, however, significant differences associated with month of spawning. Although month of spawning was positively correlated to month of burrowing, only the January females differed significantly in time of spawning from those burrowing in March or April. In general, these observations corroborate similar observations for both winter and summer burrowing – that later burrowing is generally associated with later spawning. Although there were some expected differences in tissue indices between the subsamples dissected immediately after burrow extraction and those that had spawned during the artificial burrow phase, other differences were few (Table 4). Only the average visual scale assigned to hepatopancreas color/condition at time of collection showed significant differences, and these may be explained by food resource quality and quantity and time of year. Hepatopancreas condition in February may reflect warning conditions and abundance food resources, which may dwindle within 30 days or so. Perhaps the most perplexing observation from this effort was that such a large percentage (67%) of crawfish extracted from winter burrows did not reproduce. Of those stocked, only 33% spawned. However, the same low percentage was observed in a previous study. Those that spawned, did so, on average, within about 2 months after collection. Mortality was very high at 67% of those stocked. However, many deaths occurred well after the 2 to 3 months expected for spawning. Therefore, the high mortality percentage does not explain the low reproductive rate. Nonetheless, when one looks at the rate of reproduction from those that ultimately survived, it averaged 73%. The most important finding from this study may be that, based on these results and the assumption that spawning in the lab closely followed spawning in natural burrows, few offspring from winter burrowing crawfish are likely to reach harvest size within the typical season ending in May or early June. Young from January-burrowing females were hatched, on average, in mid-March. Providing adequate food resources remain in the pond until June and overcrowding is not a problem, it may be possible for many of those offspring to reach harvest size by June under favorable conditions. However, for the February- and March-burrowing crawfish, with an average hatchling date of mid-April or later, there is little chance that their offspring will contribute to the annual yield in

231
large numbers unless the season is extended and conditions remain favorable. Though under optimal growing conditions, two months may just be enough time for some percentage of offspring to reach minimal harvest size within the season. It is also possible that spawning dates were advanced somewhat in the lab because of the slightly higher temperatures in the lab when compared with probable temperatures in natural burrows at that time of year. Nonetheless, growing conditions in many commercial ponds during the last two months of the season is typically far from ideal and it seems unreasonable to expect a large percentage of hatchlings spawned during April or later to appear in the harvest. Table 1. Aspects of burrow ecology relating to crawfish extracted from winter burrows. Rice Research Station, Crowley, LA. 2007.
Burrows
No.
Average Depth of Burrows (and Range)
Range of Water Volume (ml)
% of Burrows without Water
Single Occupancy – Males 2 23.5 (18-29) 750-800 0 Single Occupancy – Females 53 18.8 (4-32) 60-2240 0 Double Occupancy – One Female 41 17.5 (8-25) 125-3250 0
Table 2. Burrow and reproductive status of female crawfish at time of winter burrow excavation. Values within columns with a different superscript were significantly different (P < 0.05) and NS also indicates non-significant differences (P > 0.05) among treatments within columns. Rice Research Station, Crowley, LA. 2007.
Month No. Females Avg (and range) of Burrow Depth (in inches)
Avg (and range) of Water Volume (in ml)
% Spawned
Jan 31 18.3 (4-32) 713 (60-2200) C 0 Feb 29 18.3 (10-25) 369 (125-1000) B 0 Mar 33 17.9 (8-28) 1255 (350-3250) A 9.09 NS NS (P=0.06) Overall 93 18.2 (4-32) 800 (60-3250) 3.19

232
Table 3. Average response variables for female crawfish extracted from burrows during winter and held in artificial burrows for reproduction. Values within columns with the same superscript were not significantly different (P > 0.05) and NS also indicates non-significant differences among treatments within columns. Rice Research Station, Crowley, LA. 2007.
Month
No.
Intial Wt.
%
Surv1
%
Spawned1
%
Spawned2
No.
Young
No. Young
per gram
Month
Spawned3
Month Hatch3
% Wt Loss4
Jan 20 25.99 45.0 45.0 64.3 228 11.5 3.4B 3.6B 6.3 Feb 20 25.37 30.0 30.0 71.4 244 9.6 4.7A 4.7A 5.9 Mar 20 28.91 25.0 25.0 83.3 - - 5.2A 5.2A -
NS NS NS NS NS NS NS Overal
l 60 26.76 33.3 33.3 73.0 232 11.0 4.3 4.3 6.2
1 Based on initial number of replicates. 2 Based only on animals surviving through June (the last month of spawning). 3 Based on numerical representation of the months, beginning with 1 for January. 4 For spawning animals only. Table 4. Comparisons of pre- and post-spawning indices for determining body condition, based on a sub sample of crawfish dissected following burrow extraction and those crawfish dissected after spawning. Values within columns with the same superscript were not significantly different (P > 0.05) and NS also indicates non-significant differences among treatments within columns. Rice Research Station, Crowley, LA. 2007.
Pre-Spawning Indices Post-Spawning Indices
Month Ovary Color1
Hept Color2
% Hept Moisture
Ovary Index3
Hept Index3
Tail Index3
Hept Color2
% Hept Moisture
Hept Index3
Tail Index3
Jan 3.8 3.7B 46.6 0.95 3.8 2.4 2.4 77.8 0.88 13.0 Feb 3.4 4.7A 51.7 1.11 3.1 2.2 2.7 74.4 0.91 14.8 Mar 3.7 3.9B 46.6 0.63 3.7 2.4 - - - -
NS NS NS NS NS NS NS NS NS Overall 3.6 4.1 48.3 0.90 3.5 2.3 2.5 76.9 0.90 13.4
1 Numerical scale given to ovary color/development upon dissection: 1=white, 2=orange, 3=tan, 4=brown, 5=black. 2 Numerical scale given to hepatopancreas color/condition upon dissection: 1=dark amber/watery, 2=light amber/semi-watery, 3=pale/firm texture, 4=yellow/fatty texture, 5=bright yellow/full and highly fatty texture. 3 Dry tissue weight as a percentage of wet whole animal weight.

233
ASSESSMENT OF SAMPLING AND HARVEST YIELDS WHEN CRAWFISH PONDS ARE POPULATED ONLY BY STOCKING HATCHLINGS
W.R. McClain, R.P. Romaire, and J.J. Sonnier
INTRODUCTION
Crawfish farming in Louisiana does not rely on a hatchery component for populating grow-out ponds, unlike
many aquaculture enterprises around the world. Rather, dependence is upon indigenous and/or supplemented broodstock to reproduce naturally in subsurface burrows as crawfish in the region have evolved to do. Without the reliance on natural reproduction, crawfish farming would probably be nonprofitable. Although the advantages of natural reproduction are many, there are several drawbacks. Reliance on natural reproduction subjects the grower to great variations in yield and harvest size due to large natural variations in adult survival and reproductive success from year to year and pond to pond. Not only are yield and size variations problematic due to variations in recruitment patterns, but these problems are exacerbated by a lack of predictability and a reliable means of assessing pond inventory. Currently, there is no reliable means of accurately determining the success or failure of young-of-the-year recruitment. Without a means of determining population density and structure prior to initiation of harvesting, economic and business planning and implementation of corrective measures are not viable tools for the producer.
Natural, staggered recruitment and heavily vegetated ponds have limited the development of accurate population assessment techniques in crawfish ponds. Previous efforts to establish population sampling in crawfish ponds as a predictor of yield outcomes, though imprecise, were undertaken mainly in crawfish monocropping systems and were accomplished without the knowledge of actual pond densities. Largely unsuccessful, producers do not routinely attempt precise assessments of population density or structure. Therefore, this project attempted, for the first time, to eliminate natural recruitment and instead accomplish the tasks of populating ponds with stocking of hatchlings at known numbers. This was done so that systematic sampling efforts could be employed with the intent of establishing some kind of relationship between sampling (with different gear) and known populations, and furthermore, to determine if harvest results could be relatively associated with sampling outcomes. Pond History: Ponds were fallow for 10 months following a previous crawfish season. Rice crops were planted in Apr 2006, and fields were not stocked with brood crawfish. Soil Type: Crowley silt loam Pond Area: Twelve 1-acre ponds Forage Crop: Rice (variety ‘Cocodrie’) was aerially seeded at 110 lb/A on 17 Apr 2006. Grain was harvested on 7 Sept 2006, and the ratoon forage crop was managed for crawfish production. Fertilizer: Main Crop: 8-24-24 at 250 lb/A at planting, 46-0-0 at 200 lb/A (topdress) on 25 May, 46-0-0 100 lb/A (topdress) on 22 June; Ratoon Crop: 46-0-0 at 150 lb/A (topdress) on 12 Sept 2006. Herbicide: Arrosolo at 1 gal/A and Prowl at 2.4 pt/A on 3 May Insecticide: None in the main rice crop. A pyrethroid insecticide was subsequently applied to the pond to eliminate any natural recruitment – see below. Stocking Rate: Adults were not stocked into the main rice crop as usual. Instead, hatchlings were stocked after the permanent flood. See treatments. Elimination of Natural Recruits: To eliminate or minimize natural recruitment from indigenous crawfish, the ponds were flooded on 2 Oct 2006, Karate at the rate of 4 oz/A was applied 1 day later, and after 1 week, the ponds were completely drained then reflooded with fresh water beginning 3 days after draining. Permanent Flood Date: 13 - 16 Oct 2006

234
Stocking of Hatchlings: Stocking rate and timing constituted the treatments of this study. The intent was to stock 0, 3, and 7 crawfish hatchlings/m2 from hatchlings spawned in the lab from captive broodstock. Spawning success was less than expected; therefore, actual stocking densities were 0, 2.7 (or 3), and 5.9 (or 7) crawfish/m2 to reflect three treatment densities – 0, high, and low. Stocking timing was accomplished by stocking approximately equal numbers over four dates from 16 Oct to 28 Nov for certain treatments or stocking all at once on the last date for other treatments. Stockings consisted of introducing the hatchlings and adult female (hatchlings clinging to the brood female when possible) to simulate conditions of natural recruitment. Counting: Hatchlings were counted by temporarily separating them from the female and placing them into a shallow (less than 1 cm deep) pool of water, taking a digital photo of the pool, and counting individuals from an enlarged photo on a computer screen at a later time. Hatchlings were subjected to the shallow pool only long enough for a photo to be taken then were reunited with the adult female in a larger volume of water. Treatments: Consisted of low stocking rate one time (Low-1), low stocking rate four times (Low-4), high stocking rate one time (High-1), high stocking rate four times (High-4), and no stocking of hatchlings (0-Stocking). Crawfish densities of 2.7 or 3 crawfish/m2 were considered low densities, and densities of 5.9 or 7 crawfish/m2 were considered high densities for this study. Timing of the multiple stockings occurred every 2 weeks from 16 Oct to 28 Nov 2006. Samplers: Sampling consisted of employing four sampling gear: large mesh traps, consisting of standard 0.75-inch square mesh pyramid traps, small mesh traps, consisting of common 0.25-inch wire mesh minnow traps with 1.25-inch funnel openings at each end, long handle dip nets (3-mm mesh), and specially constructed drop sampling devices (0.5 m2 surface area). The drop sampler consisted of a metal cylinder that was rigged to slide up and down on three legs with a trigger that allowed the unit to be “set” in the up position with 50 feet of rope, whereby the unit could be placed in the pond some distance and triggered from the levee to prevent disturbing of crawfish during sampling. When “dropped,” the sampler formed an enclosure entrapping any crawfish that were captured within the interior of the cylinder. Water was pumped out and crawfish counted and sized. Sampling Protocol: Sampling was accomplished during six weekly periods (11-15 Dec, 8-12 Jan, 22-26 Jan, 5-9 Feb, 19-23 Feb, and 5-9 March). The large- and small-mesh traps were employed with and without bait and were placed both around the pond edge and away from the edge within the interior of the pond (with duplicate traps per pond per location per bait regime). Dip net sweeps were accomplished both around the pond edge and within the pond interior (with 10 random sweeps per pond per location). The drop samplers were operated in the morning (approximately 8:30 am) and afternoon (approximately 4:00 pm). Traps and dip net sweeps were accomplished in duplicate ponds of each treatment, while drop samplers were not duplicated by treatment – occurring in only one rep of each treatment. Crawfish catch, total and by size category, were noted for each sampling effort. Feed: None Trap Type and Density: 3-funnel pyramid trap constructed of ¾-inch square-mesh wire at 16 traps/A. Bait Used: Manufactured baits: Cajun World and Early On (Purina Mills, Inc., St. Louis, MO); Southern Pride (Country Acres Feed, Inc., Brentwood MO). Crawfish Harvest: 21 Mar - 26 June 2007 for a total of 44 baited trapping days (704 total trap-sets/A) Crawfish Grades: Harvested crawfish were subjected to a grader (passive, water type) and sorted into three size-grade categories as follows: “Large” - <15 count/lb, “Medium” - 15-21 count/lb, and “Small” - > 21 count/lb Experimental Design: Completely randomized design (two replicated ponds per treatment except for the 0-stocked treatment, which consisted of four replicated ponds) Parameters: Crawfish sample catches, crawfish harvest. Statistical Analysis: Analysis of variance with means separated by Duncan’s multiple range test

235
Support: USDA–Southern Regional Aquaculture Center (SRAC) and the Louisiana Crawfish Promotion and Research Board Comments: A total of 502 spawns (more than 150,000 hatchlings) were stocked for this study (Table 1). Hatchlings were released with the brood female to more accurately stimulate natural recruitment. Though the number of hatchlings available for this study was limited and stocking density was not in total agreement for one treatment factor, treatments were effectively resolved into a low and high stocking density and into multiple- versus single-stocking occasions. The resulting annual average harvest yields for this study were low, even for typical crawfish production scenarios (Table 2). Overall, annual yields averaged 194 lb/A by weight and 2,216 crawfish/A by number of individuals captured. Highest yielding were those ponds that received multiple introductions of hatchlings at the higher rate, while the lowest yielding ponds consisted of those receiving a single introduction at the low rate, yielding lower even than those ponds that were not intentionally stocked. It is unclear how non-stocked ponds became populated. Perhaps some minimal natural reproduction occurred (even though attempts were made to eliminate that source) and/or some movement of crawfish occurred after stocking. Although rare to see small juveniles traversing across levees between ponds, larger crawfish will sometimes migrate at night, and it is possible that some individuals may have moved between ponds via the water inflow structures by way of a central water supply lateral boarding each pond. The overall capture rate in this study for ponds where crawfish were introduced represents only 12.8% of the total number of crawfish stocked; however, when non-stocked fields are included, the capture rate increases to 16.5% of crawfish stocked (Table 3). This is lower than expected, but it is unknown if this is typical of commercial ponds since no work regarding known populations exist. Recapture rates were greater for the multi-stocking and low stocking density factors. Assuming the residual of remaining crawfish after cessation of all harvests was similar for all ponds, these low retrieval rates indicate greater mortalities at the higher stocking rates and for the single- stocking scenarios. The reason(s) for this is unclear but could possibly be associated with either fish and/or insect predators. Some small sunfish and dragonfly niads were observed during sampling and subsequent harvests but not in uncommon quantities. Recapture rate was especially low for the single stocking factor. This lends credence to the predation theory because later stocking would allow for an increase in fish and insect numbers and size prior to the introduction of crawfish hatchlings, and the later stocking dates would insure that crawfish size remain small for a longer period (due to lower water temperatures), thus facilitating greater predation opportunity. Results of the population sampling were generally low for all gear and all sampling periods, most likely due to the low stocking rates and apparent low survival rates. Given the low numbers caught per sampling gear though, the greatest catch per sampling period for both large- and small-mesh traps occurred in March, while the greatest catch with dip nets occurred in February and with drop samplers in January (Figure 1). With regard to wire mesh sampling traps, it should be noted that small-mesh traps dominated the catch per unit effort early on, with large-mesh traps gaining a slight edge during late February and March. This reflects the relative abundance of individuals by size in the population. As crawfish grew, more were retained by the large-mesh traps. Sampling efficacy was generally greater for edge of pond sampling as opposed to the pond interior; therefore, seasonal pond averages for each sample gear (at edge of pond) are presented in Table 4, as are some corresponding correlation coefficients. Sample trap catches for both large- and small-mesh traps mirror the yield data in terms of relationship by treatment from largest to smallest. Although the two highest yielding treatments also had the highest average catches for both dip net and drop sampling gear, the drop sampler was better correlated to yield data. Correlation coefficient is a measure of how well one group of data corresponds to a second group of data and whether the trend is a positive or negative correspondence. Based on the sampling averages in Table 4, the best predictor of yield (for actual yield data in the table, both for weight and numbers) was the drop sampler. However, this sampling gear did not indicate an exceptional relationship to the number of crawfish stocked. Both small- and large-mesh traps also seemed to show a respectable positive correlation to yield. Interestingly, dip net sweep counts, one of the recommended methods for assessing population early on, did not exhibit an especially strong correlation with yields. Figures 2 through 9 provide additional depictions of the sampling results, by size as well as total counts, for the various gear and sample location or bait where applicable. As previously stated, edge-of-pond sampling was more effective for both test traps and dip net sweeps. Surprisingly, there was little difference between baited and non-baited catches. Likewise, there was not a lot of difference between 24- and 48-hr trap sets, but the 48-hr sets generally caught more crawfish. Regarding the drop samplers, afternoon sampling proved slightly more effective.

236
Due to low numbers and lack of pond replications by treatment, the morning and afternoon data were combined and averaged for Figure 9. In conclusion, although stocking density in this study generally reflected the resulting harvest yields, actual percentage of crawfish retrieved by typical harvesting routines was unexpectedly low. Confounding those results were the single-stocking factor as opposed to multiple-stocking that presumably reflects more natural recruitment conditions. However, additional research is necessary to determine whether relatively low capture rates in comparison to initial population density are the norm in crawfish aquaculture. In addition, the sampling data gathered from late December to early March seemed to more accurately reflect trends in actual yield rather than reflect initial population density at recruitment. Thus, it is apparent that much more work of this nature is necessary before any conclusions can be drawn for the utility of population sampling in crawfish aquaculture. Table 1. Average number of crawfish stocked into each 1-acre pond for each treatment (two replicated ponds were stocked per treatment). Multiple stockings occurred every 2 weeks from 16 October through 28 November 2006. Single stockings occurred on 28 November. Harvesting commenced on 21 March 2007. Rice Research Station, Crowley, LA. 2007.
Treatment
No. Hatchlings
No. Adults
Total Crawfish
Density Stocked (No./m2)
Times Stocked
0-Stocked 0 0 0 0 - Low – 4 10,987 46 11,033 2.7 4 Low – 1 12,159 34 12,193 3.0 1 High - 4 23,761 86 23,847 5.9 4 High - 1 28,416 85 28,501 7.0 1
Total Stocked 150,646 502 151,148 Table 2. Average annual yield of harvested crawfish. Values within columns with the same superscript were not significantly different (P > 0.05). Rice Research Station, Crowley, LA. 2007.
Treatment1
Yield by Wt. (lb/A)
Yield by No. (No./A)
Avg. Individual Weight (g)
Avg. Count (No./lb)
0-Stocked 112.3BC 1,379C 36.9 12.3 Low - 4 220.9B 2,567B 39.1 11.6 Low - 1 98.7C 1,110C 40.3 11.2 High - 4 397.2A 4,354A 41.4 11.0 High - 1 148.1BC 1,670BC 40.3 11.3
Avg.=195.4 Avg.=2,216 1 Stocking treatments consisted of two replicated ponds, while four ponds received no crawfish. Table 3. Average percent recovery of crawfish per treatment (two replicated ponds per treatment) and individual treatment factors. Rice Research Station, Crowley, LA. 2007.
Treatment
No. Crawfish Stocked
No. Recaptured
% Recaptured
Treatment Avg. for 1
time
Treatment Avg. for 4
times
Treatment Avg. for
Low
Treatment Avg. for
High
Low - 4 11,033 2,567 23.3%
7.5%
20.8%
16.2%
12.1% Low - 1 12,193 1,110 9.1% High - 4 23,847 4,354 18.3% High - 1 28,501 1,670 5.86%
Overall 151,148 19,402 12.81% 1 When harvests from 0-stocked ponds are included, the average percent recovery based on total stocked individuals was 16.5%.

237
Figure 1. Average catch with sampling gear by sampling period (December, early January, late January, early February, late February, and early March). Rice Research Station, Crowley, LA. 2007.

238
Table 4. Average yield and sampler catches for edge of pond sampling with baited large- and small-mesh traps, dip nets, and drop samplers. Correlation coefficients are based on these averages by pond. Rice Research Station, Crowley, LA. 2007.
Treatment
Total
Stocked
Yield (lb/A)
Yield (No.)
Large Trap Catch
(No./trap)
Small Trap Catch
(No./trap)
Dip Net Sweep
(No./dip)
Drop Sampler
Catch (No./set)
High - 1 28,485 206.1 2202 0.833 0.500 0 - High - 1 28,517 90.1 1134 0.167 0.208 0.017 0.083 High - 4 23,872 359.0 3983 0.583 2.250 0.050 - High - 4 23,821 435.4 4730 1.250 1.292 0.067 0.667 Low - 1 12,170 133.0 1387 0.042 0.292 0.000 0.000 Low - 1 12,216 64.3 832 0.125 0.125 0.033 - Low - 4 11,020 204.0 2308 0.542 1.000 0.050 0.167 Low - 4 11,045 237.8 2824 0.667 2.208 0.017 - 0 Stocked 0 95.3 1116 0.292 0.375 0.017 - 0 Stocked 0 168.1 1969 0.583 0.500 0.017 - 0 Stocked 0 118.3 1535 0.250 0.042 0 0.167 0 Stocked 0 67.4 897 0.167 0.167 0.050 -
Correlation Coefficient
Yield (lb) to total crawfish stocked 0.27623403 Yield (#) to total crawfish stocked 0.25935273 Large trap catch to total crawfish stocked 0.35249102 Large trap catch to yield (lb) 0.86312414 Large trap catch to yield (#) 0.86078803 Small trap catch to total stocked -0.0749788 Small trap catch to yield (lb) 0.77517418 Small trap catch to yield (#) 0.79616247 Dip net sweep count to total crawfish stocked -0.00662517 Dip net sweep count to yield (lb) 0.51101328 Dip net sweep count to yield (#) 0.51891547 Drop sampler catch to total crawfish stocked 0.35867357 Drop sampler catch to yield (lb) 0.95017711 Drop sampler catch to yield (#) 0.96752626

239
Figure 2. Average catch by size category (and average total catch) per trap lift with large-mesh traps set near the pond edge (top chart) or in the interior of the pond (bottom chart). Rice Research Station, Crowley, LA. 2007.

240
Figure 3. Average catch by size category (and average total catch) per trap lift with large-mesh traps baited (top chart) or non-baited (bottom chart). Rice Research Station, Crowley, LA. 2007.

241
Figure 4. Average catch by size category (and average total catch) per trap lift with large-mesh traps set for 24 hours (top chart) or 48 hours (bottom chart). Rice Research Station, Crowley, LA. 2007.

242
Figure 5. Average catch by size category (and average total catch) per trap lift with small-mesh traps set near the pond edge (top chart) or in the interior of the pond (bottom chart). Rice Research Station, Crowley, LA. 2007.

243
Figure 6. Average catch by size category (and average total catch) per trap lift with small-mesh traps baited (top chart) or non-baited (bottom chart). Rice Research Station, Crowley, LA. 2007.

244
Figure 7. Average catch by size category (and average total catch) per trap lift with small-mesh traps set for 24 hours (top chart) or 48 hours (bottom chart). Rice Research Station, Crowley, LA. 2007.

245
Figure 8. Average catch by size category (and average total catch) per dip-net sweep for edge of pond (top chart) or pond interior (bottom chart) sampling. Rice Research Station, Crowley, LA. 2007.

246
Figure 9. Average catch by size category (and average total catch) per drop sampler. Rice Research Station, Crowley, LA. 2007.
Figure 10. A drop sampler, set and ready to trip with a slight tug on the rope from the levee. Crawfish are retrieved by pumping out the water from the caisson while the cylinder walls are in contact with the mud bottom, exposing any crawfish trapped within. Rice Research Station, Crowley, LA. 2007.

247
EVALUATIONS OF AN EXPERIMENTAL PROTOCOL FOR TESTING BAIT PREFERENCE OF CRAWFISH IN COOL WATER UNDER CONFINEMENT
W.R. McClain and J.J. Sonnier
INTRODUCTION
Crawfish farmers and fishermen use fresh-frozen fish for crawfish bait in cooler water (< 68oF) – not by choice but
by necessity. The low catch with current commercially available formulated baits in cool water generally does not justify their use until waters warm in late spring. Since manufactured crawfish baits were first developed, fish for crawfish bait has become expensive. Price of fish bait has increased 50% in the past four years, and it is often in very short supply, necessitating shipment of fish baits into Louisiana from other states. The price of fish as bait in Louisiana is at least $0.30/lb to $0.34/lb ($600 to $680/ton). Manufactured crawfish baits retail for about $0.16/lb to $0.20/lb ($360 to $400/ton). Trapping crawfish during winter comprises nearly 50 to 60% of the harvest effort (late November through mid-March) in many ponds. Nearly 50% of bait sold annually for trapping crawfish is menhaden and gizzard shad, so the potential market for an effective winter crawfish bait could equal that of formulated baits used in warm water (12,000-14,000 tons) and could approach $6-7 million annually. Numerous chemoattractants and flavoring agents have been tested as chemical feeding stimulants for shrimp and lobsters, but not crawfish. Bait studies conducted by LSU AgCenter scientists in the early 1980s did show some promise for identifying formulated baits that had good catch characteristics in cool water but further studies were not pursued because of the relatively low cost and wide availability of fish baits at that time.
It is difficult to test cold water formulations based solely on pond studies. Most feed mills can only make
minimum batches of a test formulation in 2.5-ton batches, and few companies and universities (including LSU) do not have mills to manufacturer small batches of bait for experimental testing. A more practical, time-efficient, and less costly approach is to screen a large number of potential chemoattractants alone and in mixtures that might have attractive properties to crawfish in cold and cool water in the laboratory to identify those compounds that might have the highest success in a commercial bait formulation, after which experimental cold-water bait formulation can be formulated, manufactured, and evaluated in field trials. However, it is first necessary to develop a protocol for examining various baits and possible attractants for cool water testing in the lab on a small scale. An effective laboratory-scale protocol and specific testing facility that could operate with chilled water would facilitate the testing of possible attractants/baits in low quantities and at target water temperatures year-round with rapid results. This would effectively allow for the prescreening of numerous products/processes, some expensive and/or hard to come by, allowing only the most promising to be followed-up in field tests under more typical conditions. Despite numerous attempts under various conditions of experimentation, it was found that “captive” crawfish would not respond to bait stimuli under laboratory conditions, even at optimal temperatures. Various acclimation and starvation protocols were tried, as were attempts at feed training and utilization of larger pool/troughs, but no effort has thus far been successful in getting captive crawfish to respond predictably to proven baits. Therefore, lab-reared crawfish, accustomed to accepting feed under confinement, was used for this study to test small-scale laboratory protocols for testing known baits. Experimental Systems: Tanks consisted of two 20-gallon aquaria, one small rectangular vat (21 x 18 x 12 inches) with opaque sides, bottom, and lid, and one large rectangular vat (29 x 72 x 24 inches) with opaque sides and bottom. The tanks were filled approximately half full of fresh well water several days prior to each trial. Each unit was equipped with a larger holding area and two small bait chambers fashioned on one end, with supplemental aeration diffused through one “airstone” placed in each bait chamber. Supplemental aeration facilitated water (and scent) movement out of the chambers via the single openings and into the central holding area. The bait chambers consisted of solid walls and were sealed except for one entrance hole equipped with a funnel opening in each chamber. The opening to each chamber was blocked off during the acclimation period. Crawfish: Red swamp crawfish juveniles (38 - 51 mm total length), hatched and reared in the lab, were used. Five crawfish per aquaria, 5 per small vat, and 10 crawfish per large vat were placed within the holding chambers of each vat and allowed to acclimate approximately 12 hours prior to each test. No feed was offered during the acclimation period.

248
Baits: The baits included fresh frozen fish (shad or herring), a winter formulation of a commercial manufactured bait (Purina’s “Early On”), or no bait. Bait, when used, was placed in the bait chambers at 0-hr. Temperature: All tests were conducted only during cool days so that ambient water temperatures were at or below 62oF. Water temperature was recorded at the beginning of each trial. Observations: Experimental systems were isolated from normal activity of the lab, and following introductions of the bait, the systems were observed periodically with minimal disturbance. Response to the bait was indicated by entrance of crawfish into the respected bait chamber. Number of crawfish inside each bait chamber was recorded at each observation interval. Dates: Five trials were accomplished between 9 January and 14 February 2007. Support: Louisiana Crawfish Promotion and Research Board Comments: The time for the first crawfish to enter a bait chamber after introduction of the baits is noted in Table 1, as well as the maximum number of crawfish observed in a bait chamber at any given interval. Bait preference refers to the bait that attracted the most respondents. The results in Table 1 indicate that these experimental systems, regardless of size, appear to be inadequate testing devices for comparing the effectiveness of various bait types in cool water. Like with captive animals, the lab-reared crawfish seemed to respond poorly to proven baits under these conditions. Apparent preference for proven baits was not always discernable and response times were exceedingly long. In conclusion, this protocol for testing the effectiveness of experimental baits in cool water appears ineffective, even with the larger system. In short, more work is needed to devise a protocol that is more sensitive at determining the magnitude of attractability of crawfish to baits or attractants in confinement. Table 1. Results of bait preference observations for lab-reared crawfish in experimental systems under cool water conditions. Rice Research Station, Crowley, LA. 2007.
Bait Test1
Water Temp (oF)
System Type
Bait Preference2 (Max Response)
Maximum Response3 (% of Individuals)
Response Time4 (min)
WM vs Fish
58 Small Vat WM 20% 103 Aquarium #1 WM 20% 23 Aquarium #2 - 0 -
48 Large Vat - 0 -
WM vs None
48 Small Vat WM 40% 1305 Aquarium #1 WM 40% 45 Aquarium #2 - 0 -
35 Large Vat - 0 -
WM vs None
52 Small Vat WM 20% 230 Aquarium #1 WM 20% 1365 Aquarium #2 None 20% 441
Large Vat - 0 -
WM vs None
62 Small Vat WM 20% 105 Aquarium #1 None 60% 175 Aquarium #2 WM 40% 105
58 Large Vat - 0 -
WM vs Fish
54 Small Vat Fish 20% 20 Aquarium #1 - 0 - Aquarium #2 Fish 40% 97
42 Large Vat - 0 - 1Bait comparisons were with a winter formulation of a manufactured commercial crawfish bait (WM) versus fish or no bait. 2Bait preference refers to the bait choice that yielded the greatest number of respondents at any given observation period. 3Maximum response refers to the greatest number of respondents observed at the bait at any given period. 4Response time refers to the time (in minutes) where a crawfish was first observed at either bait.

249
OBSERVATIONS FOR POTENTIAL TOXICITY OF EXPERIMENTAL RICE INSECTICIDES TO CRAWFISH
W.R. McClain, M.J. Stout, and J.J. Sonnier
INTRODUCTION
Crawfish and rice production are well integrated in Louisiana and much of the crawfish are produced in rotational cropping systems where the rice field is subsequently used to produce crawfish. Typically, there is a short overlap in seasons, whereby newly planted rice fields are dispersed among crawfish ponds during the peak crawfish production season. Rice and crawfish ponds are often in close proximity and commonly are separated only by a narrow road or levee. In recent years, numerous incidents have occurred whereby crawfish production was halted or seriously damaged because of pesticide drift from an application to a nearby rice field, at great economic loss to the crawfish producer. The rice water weevil is a major pest in Louisiana and typically requires control with a pesticide for profitable production of rice. Therefore, efforts are underway to investigate alternative rice insecticide compounds and/or alternative methods of application, both to mitigate problems with drift and also for increased efficacy, economical, and resistance concerns in the main rice crop. One compound, Trebon, a granular application, has received a Section 18 use permit and was applied in several commercial fields during 2006 and 2007. Preliminary tests to observe the potential impacts of Trebon application on crawfish were conducted in conjunction with some of these commercial applications. Other rice insecticides, both commercial and experimental were evaluated for potential adverse effects to crawfish in small plot studies at the Rice Research Station. Following are the synopsis of four trials whereby crawfish were exposed to the rice insecticides under commercial or simulated commercial conditions during 2007. Included for each trial is a brief time line and set of experimental conditions, results in tabular format, and a short conclusion. Enclosures constructed of ½-inch mesh galvanized wire, 6 inches wide by 10 inches long by 10 inches high, were used to confine crawfish for observation. Fresh, healthy red swamp crawfish were stocked individually in cages. Similar mixtures of immature subadults and sexually mature adults and mixtures of males and females were employed for each trial. Each plot or field contained several replicates of caged crawfish. Trial 1: Trebon Outfield Tests - 2007
Timeline and Experimental Conditions
April 16, 2007: Commercial fields near Eunice, LA, were treated with Trebon at 6 lb/A, 9 lb/A, and one field (non treated control) was not treated. May 7, 2007: Crawfish were stocked individually in cages (12 reps per field) in each of the three fields near Eunice at 21 days after treatment (DAT). Equal numbers of immature and mature and males and females were stocked per field and assessed for mortality and/or moribundity over 1 week. Dead crawfish were replaced with fresh individuals at time of assessment. May 16, 2007: Cages in the test fields near Eunice were stocked with fresh crawfish (12 per field at 30 DAT) and assessed for mortality/moribundity for 1 week. Equal numbers of immature and mature and males and females were stocked per field and dead crawfish were not replaced. May 10, 2007: Commercial fields near Rayne, LA, were treated with Trebon at 6 lb/A, 9 lb/A, and one field (non treated control) was not treated. June 7, 2007: Crawfish were stocked individually in cages (12 reps per field) in each of the three fields near Rayne at 28 DAT. Equal numbers of immature and mature and males and females were stocked per field and assessed for mortality and/or moribundity over 1 week. Dead crawfish were not replaced.

250
Results
Table 1. Mortality of red swamp crawfish placed individually in enclosures after permanent flood in commercial rice fields treated with Trebon (ai=etofenprox) at the low (6 lb/A) or high rate (9 lb/A). Mortality (number and percentage dead) was assessed at various times after stocking, and results are cumulative. Same location at Eunice, LA, was used for the 21 and 30 DAT trials.
Initial Stocking
Days After Stocking
Untreated Control Etofenprox Low Etofenprox High Min-Max
oF Mortality Min-Max
oF Mortality Min-Max
oF Mortality
Eunice Location
21 DAT 2 70-96 1 (8%) 72-84 1 (8%) 72-90 1 (8%)1 4 69-82 4 (33%) 73-84 4 (33%) 70-94 8 (67%) 7 70-86 4 (33%)2 72-84 4 (33%)2 70-88 8 (67%)2
Eunice Location
30 DAT 2 68-76 1 (8%) 63-79 0 68-76 0 5 63-78 1 (8%) 63-77 0 60-88 0 7 70-79 1 (8%) 66-75 0 70-78 0
Rayne Location
28 DAT 1 79-90 1 (8%) 84-88 1 (8%) 80-92 0 4 79-93 3 (25%) 79-93 1 (8%) 80-99 1 (8%) 7 79-93 3 (25%) 82-91 1 (8%) 78-97 2 (17%)
1 Two additional crawfish were moribund. 2 Four of the 19 replacement crawfish died (two in Control, one each in the other treatments).
Conclusions
At 3 weeks after Trebon application to the rice fields, crawfish mortality in the high-rate treatment was greater than for the non-treated control and low-rate treatments. This suggests that at the higher rate of application and under these experimental conditions, there appears to be some residual toxic activity to crawfish. However, approximately 4 weeks after treatment, in both locations, excessive crawfish mortality was not observed for either treatment rate. These results have been corroborated by similar such studies. It is therefore recommended that until application rate and environmental factors can be further assessed, introductions of crawfish into a rice crop treated with Trebon be postponed until at least 4 weeks after insecticide application. Trial 2: Crawfish Bioassays in Simulated Rice Plots, Rice Research Station - 2007
Timeline and Experimental Conditions – at Permanent Flood
March 22, 2007: Seeded small plots with rice. April 23, 2007: Flooded plots. April 23, 2007: Treatments were applied in duplicate plots as follows: Trebon (ai=Etofenprox) at a low rate of 6 lb/A (200 gm ai/A); Trebon at a high rate of 9 lb/A (300 gm ai/A); Karate at 0.03 lb ai/A; Dinotefuran at 120 gm ai/A; and duplicate plots remained untreated. April 25, 2007: Crawfish were placed individually in small cages (six crawfish per plot) randomly distributed throughout plots to achieve a total of 12 replicated animals per treatment. A mixture of males and females and immature and mature crawfish were used in each plot. April 27-May 2, 2007: Crawfish were assessed after 2, 5, and 7 days for mortality and/or moribundity.

251
Results – at Permanent Flood
Table 2. Mortality of red swamp crawfish placed in enclosures after permanent flood in simulated rice plots treated with various rice insecticides. Mortality (number and percentage dead) was assessed at 2, 5, and 7 days after stocking, and results are cumulative.
Days After Stocking
Min - Max Temp. oC
Untreated Control
Trebon Low Rate
Trebon High Rate
Karate
Dinotefuran
2 64 - 85 1 (8%) 0 02 2 (17%) 1 (8%) 5 62 - 100 2 (17%) 7 (58%)1 9 (75%)1 8 (67%)2 3 (25%) 7 68 - 96 2 (17%) 9 (75%)1 12 (100%) 9 (75%)3 3 (25%)
1 Three additional crawfish were moribund. 2 Two additional crawfish were moribund. 3 One additional crawfish was moribund.
Timeline and Experimental Conditions – after Reflooding
May 18, 2007: Water was drained and plots remained dry for about 10 days. May 29, 2007: Plots reflooded. May 30, 2007: To test for residual chemical activity, fresh crawfish were placed individually in small cages randomly distributed throughout plots. June 1, 2007: Crawfish were assessed for mortality, and only 8% mortality was observed – reflected by one crawfish in each of the previous treatments (including the Untreated Control). June 1, 2007: Those four cages were replenished with fresh crawfish and plots were treated with Karate (0.03 lb ai/A), Valent compound (0.2 lb ai/A), and Dinotefuran (120 gm ai/A), with three replicated plots per treatment. (N=12 crawfish per treatment, representing equal mixtures of male and females, and immature and matures). June 4-8, 2007: Crawfish were assessed after 3, 5, and 7 days for mortality and/or moribundity.
Results – after Reflooding
Table 3. Mortality of red swamp crawfish placed in enclosures after reflooding and retreating with various rice insecticides. Mortality (number and percentage dead) was assessed at 3, 5, and 7 days after stocking, and results are cumulative. Days After Stocking
Min - Max Temp. oC
Untreated Control
Karate
Valent
Dinotefuran
3 72 - 92 5 (42%) 12 (100%) 7 (58%) 5 (42%)1 5 - 5 (42%) 12 (100%) 7 (58%) 6 (50%) 7 - 5 (42%) 12 (100%) 7 (58%) 6 (50%)
1 One additional crawfish was moribund.
Conclusions
Although very preliminary, the results of this trial suggest that Dinotefuran may be less toxic to crawfish than Trebon or Karate when exposure to a treated field occurs shortly after insecticide application. When compared with Karate in a subsequent application, Valent also seems less toxic, but more data is needed before that conclusion can be drawn.
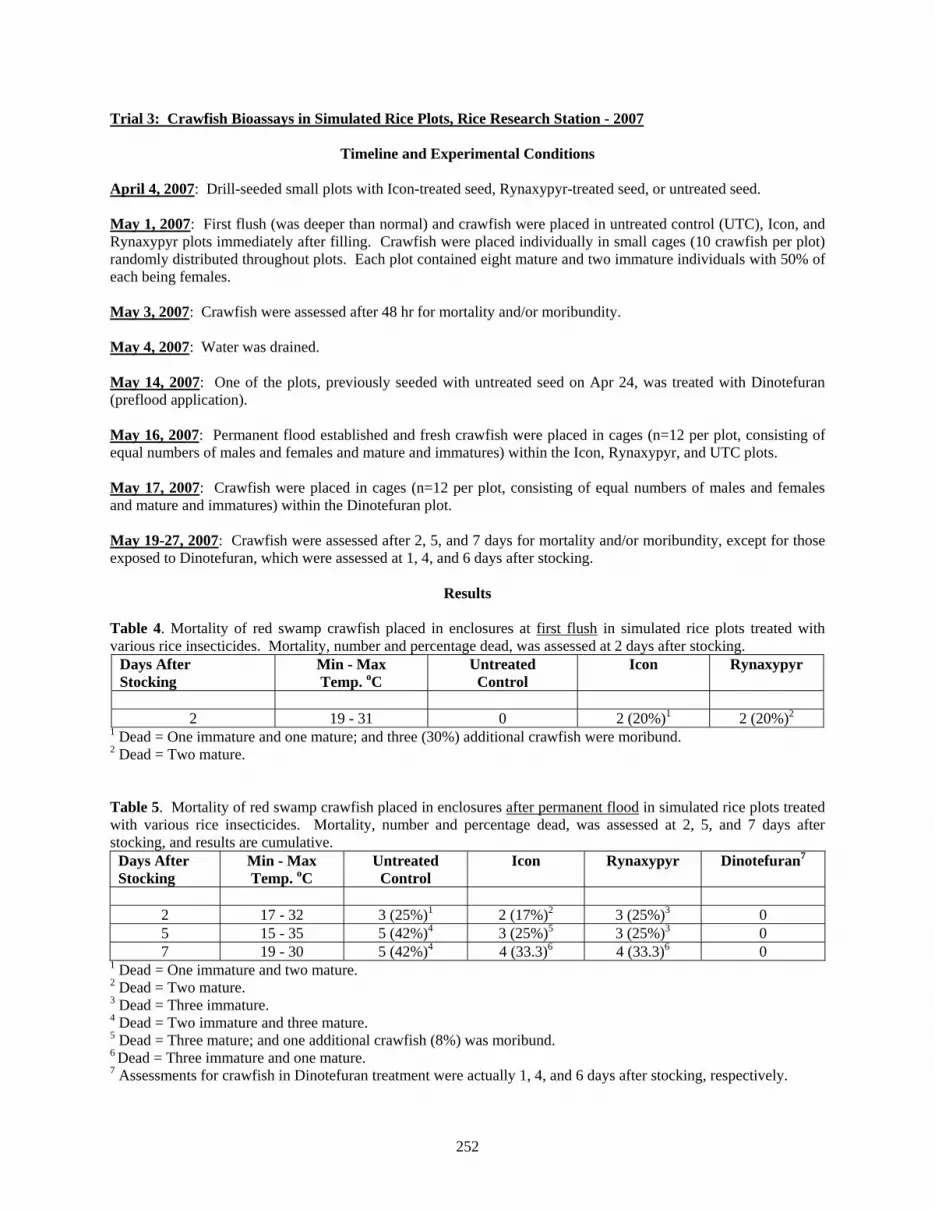
252
Trial 3: Crawfish Bioassays in Simulated Rice Plots, Rice Research Station - 2007
Timeline and Experimental Conditions
April 4, 2007: Drill-seeded small plots with Icon-treated seed, Rynaxypyr-treated seed, or untreated seed. May 1, 2007: First flush (was deeper than normal) and crawfish were placed in untreated control (UTC), Icon, and Rynaxypyr plots immediately after filling. Crawfish were placed individually in small cages (10 crawfish per plot) randomly distributed throughout plots. Each plot contained eight mature and two immature individuals with 50% of each being females. May 3, 2007: Crawfish were assessed after 48 hr for mortality and/or moribundity. May 4, 2007: Water was drained. May 14, 2007: One of the plots, previously seeded with untreated seed on Apr 24, was treated with Dinotefuran (preflood application). May 16, 2007: Permanent flood established and fresh crawfish were placed in cages (n=12 per plot, consisting of equal numbers of males and females and mature and immatures) within the Icon, Rynaxypyr, and UTC plots. May 17, 2007: Crawfish were placed in cages (n=12 per plot, consisting of equal numbers of males and females and mature and immatures) within the Dinotefuran plot. May 19-27, 2007: Crawfish were assessed after 2, 5, and 7 days for mortality and/or moribundity, except for those exposed to Dinotefuran, which were assessed at 1, 4, and 6 days after stocking.
Results
Table 4. Mortality of red swamp crawfish placed in enclosures at first flush in simulated rice plots treated with various rice insecticides. Mortality, number and percentage dead, was assessed at 2 days after stocking.
Days After Stocking
Min - Max Temp. oC
Untreated Control
Icon Rynaxypyr
2 19 - 31 0 2 (20%)1 2 (20%)2
1 Dead = One immature and one mature; and three (30%) additional crawfish were moribund. 2 Dead = Two mature. Table 5. Mortality of red swamp crawfish placed in enclosures after permanent flood in simulated rice plots treated with various rice insecticides. Mortality, number and percentage dead, was assessed at 2, 5, and 7 days after stocking, and results are cumulative.
Days After Stocking
Min - Max Temp. oC
Untreated Control
Icon Rynaxypyr Dinotefuran7
2 17 - 32 3 (25%)1 2 (17%)2 3 (25%)3 0 5 15 - 35 5 (42%)4 3 (25%)5 3 (25%)3 0 7 19 - 30 5 (42%)4 4 (33.3)6 4 (33.3)6 0
1 Dead = One immature and two mature. 2 Dead = Two mature. 3 Dead = Three immature. 4 Dead = Two immature and three mature. 5 Dead = Three mature; and one additional crawfish (8%) was moribund. 6 Dead = Three immature and one mature. 7 Assessments for crawfish in Dinotefuran treatment were actually 1, 4, and 6 days after stocking, respectively.

253
Conclusions
Crawfish mortality associated with insecticide treatments at first flush was not high enough to conclude with any degree of certainty that those deaths were a direct result of the insecticides. Chance mortality associated with handling and/or environmental stress cannot be ruled out. This is corroborated by the observation that mortalities in the treated groups after the permanent flood were lower than non-treated controls. Therefore, further tests are needed to better define the potential (or lack thereof) for crawfish mortality for these products under similar experimental conditions. Trial 4: Crawfish Consumption of Rynaxypyr-treated Rice Seed
Timeline and Experimental Conditions
- Six crawfish were place in each aquarium (three mature males and three mature females). - Two aquaria (reps) were used per treatment. - Crawfish were acclimated to aquaria for 5 days (without feed) prior to treatments. - Seed treatments were: Control (non-treated seed), Rynaxypyr: low treatment rate (0.0125 mg), Rynaxypyr:
high treatment rate (0.05 mg). - 18 whole seeds (avg. = three seeds per crawfish) were placed in aquaria at days 0, 1, 3, and 7. - Average weight per seed was 23.8 mg. - Water temperature ranged between 72 and 80oF during trial. - Crawfish were observed for mortality for 4 weeks and then offered a larger quantity of seed. - Crawfish were fed an average of 12 seeds per crawfish on Day 28. - All seeds were eaten by Day 29 with no additional deaths. - Terminated trial on Day 37.
Results
Table 6: Number of crawfish dead at various days after initiation of feeding and final mortality as a percentage of original number at Day 28 and Day 37.
Days From Initiation of Trial 1 3 7 9 18 21 28 30 37
Control (Rep 1) 0 0 0 0 0 0 0 0 0 Control (Rep 2) 0 0 0 0 0 0 0 0 0
Control (%) 0 0
Low (Rep 1) 0 0 0 1 1 0 0 0 0 Low (Rep 2) 0 0 0 0 0 0 0 0 0
Low (%) 16.7 16.7
High (Rep 1) 0 0 0 0 0 0 0 1 0 High (Rep 2) 0 0 0 0 0 0 0 0 0
High (%) 0 8.3
Conclusions
Although no mortality was observed in the control group (i.e., those fed non-treated seeds), only two of 24 crawfish (or 8.3%) offered treated seed died within the first 4 weeks of the trial, and those two deaths were in one group receiving the low rate of treated seed. Following the subsequent offering of larger quantities of seed at Day 28, only one crawfish died. It was found dead in one replicate of the high treatment rate 2 days after feeding. Therefore, after observing crawfish for 37 days that were offered treated seeds in modest amounts on four occasions and a large amount on one occasion, mortality was observed in only 12.5% of the specimens. Although no mortality was observed in crawfish receiving non-treated seed, this difference is not great enough to conclude with a high degree of confidence that those mortalities were a direct result of toxicity from the treated seed. However, the occurrence of so few deaths in this trial suggests the relative innocuous nature of this compound to crawfish under these conditions, but more work is needed.

254
RICE DISEASE CONTROL RESEARCH
RICE DISEASE CONTROL STUDIES, 20071
D.E. Groth, X.H. Wang, J. Nugent, and M.J. Frey
Sheath blight, bacterial panicle blight, and blast are three of the most important diseases of rice. How a farmer manages these diseases often means the difference between a profit and a loss. A number of factors affect disease development, including varietal resistance, cultural practices, cropping history, and pesticide usage. Environmental conditions also greatly affect disease development but are out of the farmer’s hand. However, knowing which conditions are favorable for disease development allows the producer to initiate the appropriate disease control conditions. Cultural management often plays an important role as evidenced by the fact that sheath blight was a minor disease until the introduction of semidwarf varieties, high N rates, and soybeans as a rotational crop.
Data from research tests suggest that rice diseases annually cause at least an average range of 12 to 15% loss in yield
in the South. With present production costs and the price of rice, this average yield loss translates into an average of 33 to 40% loss in potential net return because of rice diseases. Direct losses to disease include reduction in plant stands, lodging, spotted kernels, fewer and smaller grains per plant, and a general reduction in plant efficiency. Indirect losses include the cost of fungicides used to manage disease, application costs, and reduced yields associated with special cultural practices that reduce disease but may not be conducive to producing maximum yields.
The major diseases of rice in Louisiana are the fungal disease blast, caused by Pyricularia grisea; sheath blight,
caused by Thanatephorus cucumeris (Rhizoctonia solani); stem rot, caused by Magnaporthe salvinii (Sclerotium oryzae); brown spot, caused by Cochiobolus miyabeanus; narrow brown spot, caused by Sphaerulina oryzina (Cercospora janseana); and kernel smut, caused by Neovossia horrida. Seedling diseases caused by species of Achlya and Pythium are also important in water-seeded rice. Bacterial panicle blight has been identified as a major disease and is caused by the bacterium Burkholderia glumae. Minor diseases include crown rot, causal agent unknown; leaf scald, caused by Gerlachia oryzae; leaf smut, caused by Entyloma oryzae; sheath rot, caused by Sarocladium oryzae; stackburn disease, caused by Alternaria padwickii; sheath spot, caused by Rhizoctonia oryzae; crown sheath rot, caused by Gaeumannomyces graminis var. graminis; black kernel, caused by Curvularia lunata; seedling blights, caused by various fungi; false smut, caused by Ustilaginoidea virens; root rots, caused by several fungi; and several miscellaneous leaf, stem, and glume spotting diseases.
Host resistance and fungicides play an important role in limiting these losses. The objective of these studies is to
develop disease management practices that economically reduce rice diseases and increase the yield and quality of rice. This report is on current research evaluating both registered and experimental compounds. It also represents only
one year of data, and multiple years are needed to effectively evaluate agronomic practices. Therefore, no specific recommendation of a product or practice is implied. For specific recommendations and more information, contact your local Cooperative Extension Agent.
The use of a foliar fungicide to reduce rice diseases is often justified under severe disease conditions. Some factors
that favor the use of a fungicide include: 1) history of disease in the field, 2) varietal susceptibility, 3) high yield potential, 4) rice being grown for seed, 5) rice planted late, and 6) rice ratooned. The primary targets for rice fungicide applications are sheath blight and blast. Generally, secondary rice diseases are not severe enough to justify a fungicide application. However, control of these secondary diseases, from sheath blight and blast applications, often contributes to the overall increase in yield and quality.
1 This research is supported in part by funds provided by rice producers through the Louisiana Rice Research Board and various agricultural chemical companies.

255
All of the fungicides tested have benefits and disadvantages. Tilt gives good narrow brown leaf spot and Cercospora sheath blotch and leaf smut control but no control of blast. Moncut had good activity against sheath blight, but it had the narrowest disease control spectrum. Quadris combines excellent sheath blight activity with control of blast but is weak against narrow brown leaf spot and Cercospora sheath blotch.
Many other factors affect fungicide efficacy, including application timing, cultural practices, inoculum levels,
weather, varietal resistance, spray volume, type of adjuvants added to the spray solution, and the application method used. Problems can develop from these factors that limit fungicide activity. One problem occurs when fungicides are applied by air. Most of the material is deposited on the upper third of the canopy. Redistribution by rain and dew is then required to move the fungicide into the lower canopy where most of the disease is present. Redistribution into the lower canopy is necessary since these fungicides are either non-systemic, or if systemic, they are only locally systemic or only move upward in the plant. Weathering associated with redistribution is also detrimental since some fungicidal activity is lost. Other conditions that limit fungicide activity include drift, volatility, and calibration errors. Rainfall immediately after application, before the fungicide can dry on the plant or be absorbed by the plant, can remove significant amounts of fungicides from the foliage and impair yield performance. Normally, a 4-hour drying period is adequate after application.
Since all fungicides labeled are very specific as to the diseases they control, scouting rice is extremely important to determine disease incidence and severity. Fields should be scouted weekly for disease development beginning when the first tillers begin to develop and continuing through heading. Rice should be sampled at several (20 or more) locations throughout the field. The size of the field and the disease distribution will determine the extent of sampling. At each sampling location, 25 to 50 tillers should be examined for disease symptoms (refer to back pages and the Louisiana Agricultural Experiment Station Bulletin No. 828, Rice Diseases and Disorders in Louisiana). Other diseases that require fungicides for control, especially the rice blast disease, must be noted between scouting stops as damaging levels can develop from light infestations that were not detected at the scouting stops. For sheath blight, the percentage of tillers infected at the sampling locations should be averaged to determine the disease incidence for the field. Spraying a fungicide for sheath blight is warranted if an average of 5 to 10% of the tillers (approximately 20-40% positive stops) are infected during joint elongation stages of growth in susceptible varieties. Spraying moderately susceptible varieties are warranted if more than 15% of the tillers are infected (approximately 50% positive stops). Unfortunately, there is no good scouting/prediction system for blast or bacterial panicle blight at this time, and when leaf blast is found, preventative sprays to protect the head are recommended for susceptible varieties. Prevailing temperatures at heading predict bacterial panicle blight. Disease identification is extremely important since several diseases can be confused.
Table 1. List of fungicides tested in 2007.
Common Name Company
Quadris 2.08 SC
Azoxystrobin
Syngenta
Stratego 2.08 EC Trifloxystrobin/Propiconazole Bayer GEM 500 SC Trifloxystrobin Bayer Quilt 1.16 SC Azoxystrobin/Propiconazole Syngenta Moncut 2 SC Flutolanil Gowan Tilt 3.6 EC Propiconazole Syngenta

256
2007 Varietal and URN Disease Resistance Evaluation Location: Rice Research Station, Crowley, LA Soil Type: Crowley silt loam (pH 6.0, Clay 12%, Silt 71%, Sand 17%, CEC 9.4 cmole/kg) Variety/Seed Rate: Various Plot Size: 6-ft rows Planting Method/Date: Drill-seeded, Mar 20 with a Hege 6-row planter Fertilization: Preplant 24-72-72, Mar 19; preflood 46-0-0, Apr 25; topdress 46-0-0, May 16 Experimental Design: Randomized complete block design with two to four replications Water Management: Flooded, Apr 27; drained, May 1; reflooded, May 12
Herbicides: 1 gal Propanil + 1 oz Permit, Apr 13; 3qt Arrosolo, Apr 25; 1 pt Zinc + 1.5 pt Basagran, May 11; 16.5 oz Clincher, June 20 Insecticides: 4 oz Karate + 2 oz Londax, May 10 Fungicides: None Inoculation Dates: Sheath blight, May 30; bacterial panicle blight at early heading, various dates Application Equipment: N/A Application Dates: Growth Stage Date Time Temp Wind RH Clouds Dew N/A Disease Ratings: Various, see tables Drained: July 20 Harvest: N/A Results: See Tables 2-9 Comments. Sheath blight was severe, and plots inoculated with the Burkholderia glumae had severe bacterial panicle blight.

257
Table 2. Disease reaction of various varieties and experimental lines to sheath blight (SB), bacterial panicle blight (BPB), rotten neck blast (RNB), narrow brown leaf spot (NBLS), brown spot (BS), and leaf smut (LS) at the Rice Research Station, Crowley, LA. 2007. (Variety Trial).
Pathogen Code SB BPB RNB NBLS BS LS Rating Data Type Severity Severity severity Severity Severity Severity Rating Unit 0-9 0-9 0-9 0-9 0-9 0-9 Rating Date July 18 July 18 Sept 11 Sept 11 Sept 11 Sept 11 1 Banks 6.0 a-g 5.3 bc 3.0 b-g 0.3 ef 3.7 a-e 0.7 def 2 CL131 7.3 abc 6.7 ab 2.0 d-h 3.7 a 2.7 a-f 1.3 b-f 3 CL151 7.3 abc 6.7 ab 5.0 abc 2.3 a-e 2.7 a-f 3.7 ab 4 CL161 7.0 a-d 5.0 bcd 3.0 b-g 2.0 a-f 1.0 ef 0.7 def 5 CL171 7.0 a-d 6.3 ab 3.0 b-g 2.0 a-f 1.3 def 1.0 c-f 6 Cocodrie 8.0 a 6.7 ab 3.3 b-f 1.7 b-f 2.0 b-f 1.7 b-f 7 Cypress 7.3 abc 7.3 ab 2.0 d-h 1.7 b-f 1.7 c-f 1.7 b-f 8 Cybonnet 7.3 abc 7.0 ab 1.0 fgh 0.3 ef 1.7 c-f 2.0 a-f 9 Cheniere 6.7 a-e 5.3 bc 4.3 a-e 3.0 abc 1.0 ef 4.0 a 10 Dellmati 5.7 b-g 3.7 cde 1.7 e-h 0.7 def 4.0 a-d 0.3 ef 11 Dellrose 5.3 c-h 4.0 cde 1.7 e-h 0.7 def 4.0 a-d 3.3 abc 12 Della 4.3 fgh 3.3 cde 1.7 e-h 0.3 ef 3.0 a-e 1.3 b-f 13 Jefferson 6.3 a-f 5.7 bc 3.7 b-f 3.7 a 2.0 b-f 1.7 b-f 14 Spring 5.7 b-g 5.0 bcd 5.7 ab 2.7 a-d 2.7 a-f 2.0 a-f 15 Trenasse 8.0 a 8.0 a 2.7 c-h 1.3 c-f 4.7 ab 1.7 b-f 16 Wells 5.7 b-g 6.3 ab 5.0 abc 0.0 f 2.0 b-f 1.0 c-f 17 TORO-2 5.0 d-h 6.3 ab 1.0 fgh 0.3 ef 1.7 c-f 1.0 c-f 18 CLXL730 5.3 c-h 2.3 e 1.7 e-h 0.3 ef 4.0 a-d 0.7 def 19 CLXL729 5.0 d-h 3.0 de 1.7 e-h 0.3 ef 3.3 a-e 0.0 f 20 CLXP745 5.0 d-h 2.0 e 2.3 c-h 0.3 ef 4.3 abc 0.3 ef 21 CLXP746 6.7 a-e 2.0 e 2.7 c-h 0.3 ef 3.7 a-e 0.0 f 22 XL723 4.7 e-h 2.0 e 3.3 b-f 0.3 ef 4.3 abc 0.0 f 23 XP744 4.0 gh 2.7 e 2.7 c-h 1.0 def 5.0 a 1.0 c-f 24 Bengal 5.0 d-h 5.7 bc 4.7 a-d 1.0 def 2.7 a-f 2.7 a-e 25 Jupiter 4.3 fgh 3.7 cde 3.3 b-f 0.3 ef 3.0 a-e 1.3 b-f 26 Pirogue 4.0 gh 4.0 cde 2.0 d-h 0.0 f 3.0 a-e 1.0 c-f 27 MS0404191 6.0 a-g 5.3 bc 6.7 a 1.0 def 2.3 a-f 0.0 f 28 LA0302028 7.0 a-d 5.7 bc 2.3 c-h 0.7 def 2.7 a-f 1.7 b-f 29 LA0502177 7.7 ab 5.0 bcd 5.0 abc 0.3 ef 2.3 a-f 1.7 b-f 30 LA0402028 4.0 gh 3.7 cde 0.3 gh 0.0 f 1.7 c-f 1.0 c-f 31 LA0402125 5.0 d-h 5.0 bcd 2.3 c-h 3.3 ab 1.3 def 1.0 c-f 32 Cocodrie Check 7.3 abc 7.0 ab 5.0 abc 2.0 a-f 2.3 a-f 3.0 a-d 33 Purple 3.3 h 3.7 cde 0.0 h 0.0 f 0.0 f 0.0 f LSD (P=.05) 1.23 1.32 1.57 1.16 1.49 1.33 Standard Deviation 0.75 0.81 0.96 0.71 0.92 0.82 CV 12.76 16.55 33.26 61.64 34.45 60.72 Replicate F 1.627 2.606 0.989 0.421 3.412 0.562 Replicate Prob(F) 0.2046 0.0816 0.3776 0.6582 0.0391 0.5730 Treatment F 9.279 13.285 7.989 7.571 5.035 5.025 Treatment Prob(F) 0.0001 0.0001 0.0001 0.0001 0.0001 0.0001 Means followed by same letter do not significantly differ (P=.05, Student-Newman-Keuls).

258
Table 3. Disease reaction of various varieties and experimental lines to sheath blight (SB), bacterial panicle blight (BPB), rotten neck blast (RNB), and narrow brown leaf spot (NBLS) at the Rice Research Station, Crowley, LA. 2007. (URN Group I).
Pathogen Code SB BPB RNB NBLS Rating Data Type Severity Severity Severity Severity Rating Unit 0-9 0-9 0-9 0-9 Rating Date July 18 July 18 Sep 11 Sep 11 1 NWBT/3/LBNT/9902//LB 4.0 d 4.0 d 0.3 e 0.3 ef 2 CCDR/9502008-A 6.3 ab 5.0 bcd 4.5 abc 2.5 bcd 3 ((NWBT/RU8303181)/RS 6.5 ab 5.3 bcd 4.0 bcd 2.8 bc 4 L201/7402003//KATY/N 4.3 cd 4.5 cd 0.5 e 0.5 def 5 9901081/CCDR 6.5 ab 6.3 a-d 6.5 a 1.8 b-f 6 ((NWBT/RU8303181)/RS 5.8 a-d 5.8 a-d 3.5 bcd 2.5 bcd 7 NWBT/3/LBNT/9902//LB 5.3 bcd 4.8 bcd 4.3 bcd 0.3 ef 8 KATY/CPRS//JKSN/3/AR 6.5 ab 6.0 a-d 4.8 abc 2.3 b-e 9 ((NWBT/RU8303181)/RS 7.5 a 6.5 abc 4.5 abc 1.0 c-f 10 DREW/UA99-52 6.0 abc 6.0 a-d 2.3 d 0.0 f 11 CPRS/KBNT//9502008-A 6.5 ab 5.5 a-d 2.8 cd 0.8 c-f 12 ((NWBT/RU8303181)/RS 6.5 ab 5.0 bcd 4.0 bcd 2.0 b-f 13 LBNT/9902/3/DAWN/969 5.8 a-d 4.5 cd 3.8 bcd 0.5 def 14 CPRS/JKSN 6.8 ab 7.5 a 5.0 abc 4.8 a 15 RSMT/KATY 6.5 ab 6.5 abc 5.0 abc 3.5 ab 16 TBNT/LA110//LMNT/3/T 6.0 abc 4.8 bcd 5.8 ab 3.5 ab 17 SPRING 5.3 bcd 5.3 bcd 4.8 abc 1.0 c-f 18 TRENASSE 7.8 a 7.0 ab 4.0 bcd 1.0 c-f 19 PRESIDIO 5.0 bcd 4.8 bcd 3.5 bcd 0.3 ef 20 CYBONNET 6.0 abc 5.3 bcd 3.3 cd 1.5 b-f LSD (P=.05) 1.19 1.27 1.31 1.25 Standard Deviation 0.84 0.90 0.92 0.88 CV 13.96 16.39 24.07 54.4 Replicate F 4.073 4.801 0.054 0.192 Replicate Prob(F) 0.0109 0.0047 0.9834 0.9015 Treatment F 4.978 4.147 10.993 8.872 Treatment Prob(F) 0.0001 0.0001 0.0001 0.0001 Means followed by same letter do not significantly differ (P=.05, Student-Newman-Keuls).

259
Table 4. Disease reaction of various varieties and experimental lines to bacterial panicle blight (BPB), sheath blight (SB), rotten neck blast (RNB), and narrow brown leaf spot (NBLS) at the Rice Research Station, Crowley, LA. 2007. (URN Group II).
Pathogen Code BPB SB RNB NBLS Rating Data Type Severity Severity Severity Severity Rating Unit 0-9 0-9 0-9 0-9 Rating Date July 17 June 17 Sept 11 Sept 11 21 BRAZ/TBNT/3/164986-4 7.0 abc 4.5 de 0.5 i 1.3 a-d 22 CCDR/5/MARS/M201//MA 6.5 a-d 7.5 a 2.8 d-h 1.8 a-d 23 (CPRS/(KATY//GFMT/PC 4.0 ef 5.5 a-e 3.0 d-g 1.5 a-d 24 BRAZ/TBNT/3/164986-4 6.0 a-e 5.5 a-e 5.8 abc 0.3 cd 25 96 INT/AHRENT 4.0 ef 4.3 e 1.5 f-i 3.0 a 26 (CPRS/PELDE)/JEFF 5.5 b-e 6.0 a-e 2.0 e-i 2.3 abc 27 DREW/UA99-52 6.5 a-d 6.0 a-e 1.5 f-i 0.8 bcd 28 BNGL//MERC/RICO/3/ME 4.5 def 4.8 cde 0.8 hi 0.3 cd 29 (CPRS/PELDE)/JEFF 5.0 c-f 5.3 b-e 4.0 b-e 0.3 cd 30 WLLS/UA99-52 7.0 abc 6.5 a-d 1.0 ghi 1.3 a-d 31 CCDR/5/MARS/…/6/L202 5.5 b-e 6.8 abc 4.5 a-d 1.5 a-d 32 (CPRS/PANDA)/JEFF*2 5.0 c-f 6.5 a-d 3.8 c-f 2.5 ab 33 8603006/3/MARS/NWRX/ 5.0 c-f 6.0 a-e 6.3 ab 0.0 34 JODN/AR1121/7/CCDR/… 5.0 c-f 6.8 abc 6.0 abc 1.3 a-d 35 8904186sel919/880301 7.8 a 6.5 a-d 6.0 abc 0.0 d 36 8902031/NWBT 5.0 c-f 5.3 b-e 6.8 a 2.5 ab 37 JUPITER 3.0 f 4.0 e 4.5 a-d 1.3 a-d 38 BENGAL 5.0 c-f 4.3 e 3.3 def 1.0 a-d 39 CL131 7.5 ab 7.0 ab 3.8 c-f 2.8 ab 40 FRANCIS 6.8 abc 4.0 e 4.5 a-d 0.0 d LSD (P=.05) 1.27 1.22 1.45 1.20 Standard Deviation 0.90 0.86 1.02 0.85 CV 16.09 15.28 28.43 67.27 Replicate F 0.684 3.564 1.369 0.526 Replicate Prob(F) 0.5656 0.0196 0.2616 0.6664 Treatment F 7.986 6.256 14.633 5.198 Treatment Prob(F) 0.0001 0.0001 0.0001 0.0001 Means followed by same letter do not significantly differ (P=.05, Student-Newman-Keuls).

260
Table 5. Disease reaction of various varieties and experimental lines to bacterial panicle blight (BPB), sheath blight (SB), rotten neck blast (RNB), and narrow brown leaf spot (NBLS) at the Rice Research Station, Crowley, LA. 2007. (URN Group III).
Pathogen Code BPB SB RNB NBLS Rating Data Type Severity Severity Severity Severity Rating Unit 0-9 0-9 0-9 0-9 Rating Date July 17 July 17 Sept 11 Sept 11 41 LMNT//82CAY21/CICA8/ 5.0 b 4.3 d 3.0 abc 0.3 bc 42 9502008/CPRS 7.0 ab 7.3 a 2.5 abc 0.8 abc 43 Kaybonnet/Zhongyouza 6.3 ab 7.0 ab 3.8 abc 1.8 abc 44 DREW/UA99-52 5.0 b 6.0 a-d 1.5 bc 0.3 bc 45 9502008-A/DREW 5.0 b 6.0 a-d 1.5 bc 0.5 abc 46 (VSTA/LBNT//RSMT)/LM 5.8 b 5.3 bcd 1.5 bc 2.5 a 47 L201//TBNT/BLMT/3/CP 6.8 ab 6.0 a-d 2.5 abc 1.3 abc 48 9502008-A//AR 1188/C 6.0 ab 6.0 a-d 3.5 abc 2.3 ab 49 ((NWBT/RU8303181)/GF 6.0 ab 6.3 abc 0.8 c 2.0 abc 50 LBNT/9902//NWBT/3/KA 6.5 ab 6.8 ab 2.8 abc 0.3 bc 51 9502008-A//AR 1188/C 7.0 ab 7.0 ab 3.8 abc 1.8 abc 52 Texmont/TeQing 5.8 b 5.5 a-d 2.3 abc 1.0 abc 53 CPRS/3/L201//TBNT/BL 7.0 ab 6.3 abc 2.5 abc 0.5 abc 54 CPRS/3/L201//TBNT/BL 7.8 a 5.8 a-d 2.8 abc 1.5 abc 55 CPRS/3/L201//TBNT/BL 6.5 ab 6.0 a-d 1.0 bc 1.5 abc 56 SABER 6.8 ab 5.8 a-d 2.8 abc 0.3 bc 57 PRISCILLA 5.3 b 4.8 cd 1.8 bc 0.0 c 58 CHENIERE 5.5 b 6.3 abc 5.5 a 1.0 abc 59 COCODRIE 6.0 ab 7.3 a 4.5 ab 2.3 ab 60 CL171 AR 5.3 b 6.3 abc 3.3 abc 1.8 abc LSD (P=.05) 1.11 1.07 1.94 1.18 Standard Deviation 0.78 0.75 1.37 0.83 CV 12.83 12.4 51.46 71.62 Replicate F 2.232 2.144 1.196 1.797 Replicate Prob(F) 0.0943 0.1047 0.3194 0.1580 Treatment F 4.143 4.224 2.975 3.617 Treatment Prob(F) 0.0001 0.0001 0.0008 0.0001 Means followed by same letter do not significantly differ (P=.05, Student-Newman-Keuls).

261
Table 6. Disease reaction of various varieties and experimental lines to bacterial panicle blight (BPB), sheath blight (SB), rotten neck blast (RNB), and narrow brown leaf spot (NBLS) at the Rice Research Station, Crowley, LA. 2007. (URN Group IV).
Pathogen Code BPB SB RNB NBLS Rating Data Type Severity Severity Severity Severity Rating Unit 0-9 0-9 0-9 0-9 Rating Date July 17 July 17 Sept 11 Sept 11 61 5.3 def 4.3 cd 1.0 ef 0.0 c 62 7.0 abc 4.8 cd 5.0 ab 0.3 c 63 6.8 a-d 7.5 a 0.8 f 0.8 bc 64 6.3 cde 5.5 bc 1.8 def 1.3 bc 65 6.8 a-d 6.0 bc 4.8 ab 0.3 c 66 5.5 c-f 5.8 bc 1.3 ef 0.8 bc 67 5.8 c-f 6.8 ab 4.3 a-d 0.8 bc 68 7.8 ab 5.5 bc 2.8 b-f 0.8 bc 69 6.5 b-e 6.8 ab 1.3 ef 1.3 bc 70 5.0 ef 4.3 cd 4.5 abc 1.0 bc 71 5.5 c-f 4.5 cd 5.3 ab 0.0 c 72 5.3 def 5.0 cd 0.8 f 2.0 b 73 8.0 a 5.8 bc 3.8 a-e 3.3 a 74 5.5 c-f 6.0 bc 6.0 a 1.0 bc 75 3.8 g 3.5 d 0.0 f 0.0 c 76 6.0 cde 5.3 bc 2.8 b-f 0.8 bc 77 4.3 fg 4.8 cd 0.8 f 0.3 c 78 6.5 b-e 5.0 cd 5.0 ab 0.3 c 79 5.0 ef 5.0 cd 1.0 ef 0.0 c 80 5.3 def 5.0 cd 2.0 c-f 0.0 c LSD (P=.05) 0.92 1.01 1.75 0.89 Standard Deviation 0.65 0.71 1.24 0.63 CV 11.06 13.39 45.35 86.76 Replicate F 5.096 1.721 0.644 2.064 Replicate Prob(F) 0.0034 0.1728 0.5900 0.1151 Treatment F 11.008 7.228 9.510 6.512 Treatment Prob(F) 0.0001 0.0001 0.0001 0.0001 Means followed by same letter do not significantly differ (P=.05, Student-Newman-Keuls).

262
Table 7. Disease reaction of various varieties and experimental lines to sheath blight (SB), bacterial panicle blight (BPB), rotten neck blast (RNB), and narrow brown leaf spot (NBLS) at the Rice Research Station, Crowley, LA. 2007. (URN Group V). Pathogen Code SB BPB RNB NBLS Rating Data Type Severity Severity Severity Severity Rating Unit 0-9 0-9 0-9 0-9 Rating Date July 18 July 18 Sep 11 Sep 11
81 19991562 5.0 bcd 6.0 a-d 3.0 abc 1.0 cd 82 AR 1142/JODN/4/NWBT/ 6.0 a-d 6.0 a-d 5.0 abc 1.0 cd 83 TBNT/LA110//LMNT/3/T 6.5 a-d 7.0 abc 6.5 ab 3.5 ab 84 DREW/UA99-52 7.0 abc 6.5 a-d 3.5 abc 1.0 cd 85 AR 1188/CCDR//950200 8.0 a 6.0 a-d 4.0 abc 0.0 d 86 ((NWBT/RU8303181)/GF 6.5 a-d 6.5 a-d 3.5 abc 1.5 bcd 87 GP13416/KATY//PI3127 6.0 a-d 7.5 ab 6.0 abc 0.0 d 88 CCDR/9770532 DH1//LG 4.5 cd 5.0 a-d 4.5 abc 1.0 cd 89 IAC 600 7.0 abc 6.5 a-d 3.0 abc 0.5 cd 90 LBNT/9902/3/DAWN/969 6.0 a-d 7.0 abc 1.0 c 0.0 d 91 CPRS/9901081 6.0 a-d 6.5 a-d 5.5 abc 0.5 cd 92 (DLMT/(LMNT*3/JSMN)) - - - - 93 WLLS/ZHE733 4.5 cd 6.0 a-d 3.5 abc 2.0 bcd 94 AR 1179/3/CPRS//…/4/ 6.5 a-d 4.0 bcd 2.5 abc 0.0 d 95 Arborio 5.5 a-d 4.0 bcd 7.0 a 3.5 ab 96 LBNT/9902//NWBT/3/KA 4.5 cd 4.5 a-d 1.0 c 0.5 cd 97 CPRS/97T1280 DH1/3/C 4.0 d 4.0 bcd 3.5 abc 0.5 cd 98 CPRS/LGRU 6.0 a-d 4.5 a-d 4.5 abc 2.0 bcd 99 WLLS/PI 584698//ZHE 4.0 d 3.0 d 2.0 abc 0.5 cd 100 IR36/8603006 5.0 bcd 5.5 a-d 4.0 abc 2.0 bcd 101 MDSN/((NWBT/RU830318 7.0 abc 5.5 a-d 2.5 abc 0.0 d 102 91642//KATY/NWBT/5/R 6.0 a-d 8.0 a 3.0 abc 5.0 a 103 FRAN/CCDR 5.5 a-d 7.0 abc 5.0 abc 1.5 bcd 104 (GFMT/RU8703196)TX61 6.0 a-d 3.5 cd 5.0 abc 0.0 d 105 LBNT/9902//NWBT/3/KA 4.0 d 6.5 a-d 1.0 c 0.0 d 106 CPRS/KBNT/4/9502008/ 6.5 a-d 6.0 a-d 4.0 abc 2.0 bcd 107 (RU8803072/(KATY//GF 6.5 a-d 5.5 a-d 4.0 abc 0.0 d 108 LBNT/9902/3/DAWN/969 4.0 d 5.5 a-d 1.5 bc 0.0 d 109 9502008-A//AR 1188/C 8.0 a 6.5 a-d 2.5 abc 1.0 cd 110 (DF5-68)/TX8946 6.5 a-d 6.5 a-d 5.5 abc 1.5 bcd 111 FRNS/6/LBNT/9902/3/D 5.0 bcd 6.0 a-d 7.0 a 0.5 cd 112 9502008-A/TACAURI//C 7.5 ab 7.0 abc 5.0 abc 1.5 bcd 113 CPRS/LGRU 6.5 a-d 7.0 abc 1.0 c 0.5 cd 114 DLMT/KATY 7.0 abc 5.5 a-d 4.5 abc 0.0 d 115 KATY/CPRS//NWBT/…/3/ 7.5 ab 7.0 abc 6.0 abc 0.0 d 116 CPRS/LGRU 7.5 ab 6.5 a-d 2.0 abc 2.5 bc 117 COCODRIE 7.0 abc 6.0 a-d 5.5 abc 2.5 bc 118 HILDAGO 7.5 ab 6.5 a-d 7.0 a 4.5 a 119 L205 8.0 a 6.0 a-d 6.0 abc 1.5 bcd 120 DIXIEBELLE 4.0 d 6.0 a-d 5.0 abc 1.0 cd LSD (P=.05) 1.58 1.93 2.87 1.25 Standard Deviation 0.78 0.95 1.42 0.62 CV 12.95 16.15 35.35 51.79 Replicate F 14.114 20.399 0.516 0.034 Replicate Prob(F) 0.0006 0.0001 0.4769 0.8555 Treatment F 4.963 2.789 3.106 8.533 Treatment Prob(F) 0.0001 0.0010 0.0004 0.0001 Means followed by same letter do not significantly differ (P=.05, Student-Newman-Keuls).

263
Table 8. Disease reaction of various varieties and experimental lines to sheath blight (SB), bacterial panicle blight (BPB), rotten neck blast (RNB), and narrow brown leaf spot (NBLS) at the Rice Research Station, Crowley, LA. 2007. (URN Group VI). Pathogen Code SB BPB RNB NBLS Rating Data Type Severity Severity Severity Severity Rating Unit 0-9 0-9 0-9 0-9 Rating Date July 18 July 18 Sep 11 Sep 11 121 RU9901127/GP-2 6.5 a-d 7.5 ab 1.0 de 1.0 a 122 IR36/8603006 6.0 a-d 5.5 ab 5.0 abc 1.5 a 123 ((NWBT/RU8303181)/GF 6.5 a-d 6.5 ab 2.5 a-e 1.5 a 124 DREW/UA99-167 5.0 bcd 5.0 ab 2.0 b-e 0.0 a 125 MBLE/ALAN/4/L201//…/ 7.0 abc 7.0 ab 5.5 ab 2.0 a 126 ((NWBT/RU8303181)/RS 7.0 abc 5.0 ab 1.0 de 0.0 a 127 LGRU//KATY/STBN/3/NW 6.0 a-d 5.5 ab 3.5 a-e 0.5 a 128 9602097/...//JAF4/…/ 6.0 a-d 5.0 ab 5.0 abc 1.0 a 129 (DLMT/(LMNT*3/JSMN)) 6.0 a-d 6.0 ab 2.5 a-e 0.0 a 130 WLLS/INIAP-12//ZHE 7 - - - - 131 MBLE/ALAN/6/CCDR/5/M 5.5 a-d 6.0 ab 6.0 a 0.5 a 132 (DLMT/(LMNT*3/JSMN)) 6.0 a-d 5.0 ab 2.5 a-e 0.0 a 133 KATY/NWBT//L201/7402 4.0 d 5.5 ab 1.5 cde 0.0 a 134 CCDR/5/MARS/…/6/CCDR 8.0 a 7.0 ab 4.5 a-d 2.0 a 135 (AF5-144-1-2)/(DLMT/ 6.5 a-d 7.0 ab 4.5 a-d 1.0 a 136 STG99F5-13-025/MDRK 6.5 a-d 7.5 ab 1.0 de 0.0 a 137 TXMT/…/5/AR1053/7/CC 5.0 bcd 6.0 ab 4.5 a-d 1.0 a 138 CPRS/3/CPRS/NWBT/KAT 7.0 abc 4.5 b 4.5 a-d 2.0 a 139 SHUFENG 121-1655 - - 3.0 a-e 0.0 a 140 L202/LEAH//TORO/3/IR 7.5 ab 5.5 ab 5.5 ab 0.0 a 141 LCSN/LGRU 6.5 a-d 5.5 ab 4.0 a-d 1.0 a 142 L-29-079/LGRU 5.5 a-d 5.5 ab 3.5 a-e 0.5 a 143 06TT-11 4.5 cd 6.0 ab 5.0 abc 0.5 a 144 CPRS/CCDR 7.0 abc 6.0 ab 3.0 a-e 1.0 a 145 PI 584720/ZHE 733 7.5 ab 4.5 b 2.5 a-e 0.5 a 146 CPRS/LGRU//97 KDM X2 5.5 a-d 7.0 ab 2.5 a-e 0.5 a 147 CPRS/CCDR 6.5 a-d 6.5 ab 3.5 a-e 0.0 a 148 IRGA409/RXMT/5/BRAZ/ 6.0 a-d 7.0 ab 3.5 a-e 1.5 a 149 DLRS//KBNT/JODN 6.5 a-d 5.5 ab 3.0 a-e 3.0 a 150 ((NWBT/RU8303181)/GF 7.0 abc 5.0 ab 4.0 a-d 3.0 a 151 MDRK/UA99-123 5.5 a-d 6.5 ab 0.0 e 0.0 a 152 06SBYT-67 4.5 cd 6.0 ab 5.0 abc 0.5 a 153 L201/SABR 7.5 ab 6.5 ab 5.0 abc 0.0 a 154 GFMT/TBNT/LA110 6.5 a-d 6.5 ab 4.0 a-d 0.0 a 155 05 SBYT 119 5.0 bcd 6.0 ab 4.5 a-d 0.0 a 156 CPRS//NWBT/KATY 5.5 a-d 5.5 ab 4.5 a-d 1.0 a 157 DLMT/KATY 5.0 bcd 4.5 b 4.0 a-d 0.0 a 158 DELLROSE 5.0 bcd 5.5 ab 3.0 a-e 0.5 a 159 SABINE 4.5 cd 6.5 ab 5.5 ab 2.0 a 160 FRANCIS 6.0 a-d 8.0 a 6.0 a 0.5 a LSD (P=.05) 1.56 1.60 2.07 2.16 Standard Deviation 0.77 0.79 1.02 1.07 CV 12.74 13.24 28.19 138.76 Replicate F 2.689 1.345 10.304 1.620 Replicate Prob(F) 0.1095 0.2535 0.0027 0.2110 Treatment F 3.167 2.502 4.293 1.244 Treatment Prob(F) 0.0003 0.0032 0.0001 0.2543 Means followed by same letter do not significantly differ (P=.05, Student-Newman-Keuls).

264
Table 9. Disease reaction of various varieties and experimental lines to sheath blight (SB), bacterial panicle blight (BPB), rotten neck blast (RNB), and narrow brown leaf spot (NBLS) at the Rice Research Station, Crowley, LA. 2007. (URN Group VII).
Pathogen Code SB BPB RNB NBLS Rating Data Type Severity Severity Severity Severity Rating Unit 0-9 0-9 0-9 0-9 Rating Date July 18 July 18 Sep 11 Sep 11 161 LGRU/3/LMNT/KATY//LM 4.5 cde 4.5 bcd 3.5 abc 0.0 b 162 BNGL//MERC/RICO/3/ME 5.5 a-e 7.0 ab 4.5 ab 1.0 ab 163 ((NWBT/RU8303181)/GF 7.0 abc 6.0 a-d 5.0 ab 0.5 ab 164 LBNT/9902/3/DAWN/969 4.0 de 6.0 a-d 3.5 abc 0.5 ab 165 EARL/9902028 5.5 a-e 7.5 a 5.0 ab 1.0 ab 166 4484-1665 3.5 e 3.5 de 2.5 abc 0.0 b 167 FRNS/6/LBNT/9902/3/D 6.0 a-e 7.0 ab 6.0 a 0.0 b 168 EARL/9902028 7.0 abc 6.5 abc 6.0 a 0.5 ab 169 ((NWBT/RU8303181)/GF 6.5 a-d 6.5 abc 5.0 ab 1.0 ab 170 LBNT/9902/3/DAWN/969 5.0 b-e 7.5 a 4.0 ab 0.5 ab 171 BNGL//MERC/RICO/3/ME 5.0 b-e 7.0 ab 4.5 ab 0.5 ab 172 CCDR/L202 6.0 a-e 4.0 cde 4.5 ab 0.5 ab 173 LBNT/9902/3/DAWN/969 5.0 b-e 7.5 a 4.5 ab 0.0 b 174 CFX-18//CCDR/9770532 8.0 a 5.5 a-d 5.5 ab 2.0 ab 175 LCSN/LGRU 6.0 a-e 5.0 a-d 3.5 abc 0.0 b 176 LBNT/9902/3/DAWN/969 5.5 a-e 6.5 abc 2.5 abc 0.0 b 177 FRANCIS/CLR 13 6.0 a-e 5.0 a-d 4.0 ab 1.5 ab 178 HB-1 4.0 de 7.0 ab 0.0 c 0.0 b 179 LBNT/9902/3/DAWN/969 5.0 b-e 5.5 a-d 4.0 ab 1.0 ab 180 TACAURI/3/CPRS//82CA 7.5 ab 5.0 a-d 5.0 ab 2.5 a 181 CPRS/CCDR 6.0 a-e 6.0 a-d 3.0 abc 0.5 ab 182 LBNT/9902/3/DAWN/969 5.0 b-e 7.5 a 2.5 abc 0.0 b 183 CFX-26/9702128 6.5 a-d 7.5 a 5.5 ab 0.0 b 184 L201/SABR 7.0 abc 5.0 a-d 5.0 ab 1.0 ab 185 RU9201176/4/LBNT/STB 4.0 de 5.0 a-d 3.0 abc 0.0 b 186 CPRS//NWBT/KATY 6.5 a-d 7.0 ab 3.0 abc 0.0 b 187 Tesanai 2 6.0 a-e 6.0 a-d 5.0 ab 2.0 ab 188 LGRU//KATY/STBN/5/LG 5.0 b-e 5.5 a-d 5.0 ab 0.0 b 189 DREW/CFX-18 7.0 abc 4.0 cde 3.5 abc 0.0 b 190 CCDR/L202 7.0 abc 6.5 abc 6.0 a 0.0 b 191 GFMT/TBNT/LA110 6.5 a-d 6.5 abc 5.0 ab 0.0 b 192 CFX-26/9702128 8.0 a 7.0 ab 5.0 ab 0.5 ab 193 NWBT/C4-63 5.0 b-e 4.0 cde 2.0 bc 0.0 b 194 88040032/KATY 4.5 cde 6.5 abc 3.5 abc 0.0 b 195 9502008-A/TACAURI//C 7.5 ab 7.0 ab 5.0 ab 2.5 a 196 8904186/sel919/NWBT 5.0 b-e 6.5 abc 5.0 ab 1.0 ab 197 IR36/8603006 6.0 a-e 6.5 abc 5.0 ab 0.5 ab 198 9002065/NWBT 5.5 a-e 4.0 cde 3.5 abc 0.0 b 199 CYPRESS 7.0 abc 7.0 ab 3.5 abc 0.5 ab 200 XL 723 5.5 a-e 2.0 e 5.0 ab 0.0 b LSD (P=.05) 1.49 1.41 1.98 1.14 Standard Deviation 0.74 0.70 0.98 0.56 CV 12.66 11.76 23.5 104.85 Replicate F 18.028 12.451 2.545 0.354 Replicate Prob(F) 0.0001 0.0011 0.1187 0.5552 Treatment F 4.743 7.100 3.237 3.180 Treatment Prob(F) 0.0001 0.0001 0.0002 0.0002 Means followed by same letter do not significantly differ (P=.05, Student-Newman-Keuls).

265
2007 Blast and Secondary Disease Nurseries
Location: Rice Research Station, Crowley, LA Soil Type: Crowley silt loam (pH 6.0, Clay 12%, Silt 71%, Sand 17%, CEC 9.4 cmole/kg) Variety/Seed Rate: Various, ~90 lb/A Plot Size: 6-ft rows Planting Method/Date: Drill-seeded, May 15 Fertilization: Preplant 24-72-72, Mar 19; preflood 120-0-0, June 18 Experimental Design: Randomized complete block with two to four replications Water Management: Flooded, June 18; drained to induce blast, June 29
Herbicides: 3 qt Propanil + 1 oz Permit, June 8; 4 oz Arrosolo + 1 pt Basagran, June 15; 16.5 oz Clincher, June 20 Insecticides: 4 oz Mustang Max, June 25; 4 oz Mustang Max, July 16 Fungicides: None Inoculation Dates: None, all from natural sources Application Equipment: N/A Application Dates: Growth Stage Date Time Temp Wind RH Clouds Dew N/A Disease Ratings: Various, see Tables 2-9 Drained: Aug 22 Harvest: N/A Results: See Tables 2-9 Comments: Blast severity was light, and other diseases were very light and erratic.

266
2007 Sheath Blight Rice CAPS Trial
Location: Rice Research Station, Crowley, LA Soil Type: Crowley silt loam (pH 6.0, Clay 12%, Silt 71%, Sand 17%, CEC 9.4 cmole/kg) Variety/Seed Rate: Various varieties and lines, ~70 lb/A Plot Size: One 6-ft row Planting Method/Date: Hege planter (drill-seeded), Apr 10 Fertilization: Preplant 24-72-22, Mar 14; preflood 90-0-0, May 10; topdress 46-0-0, June 6 Experimental Design: Randomized complete block design with three replications Water Management: Flushed, Apr 12, May 2; permanent flood, May 14 Herbicides: 3 qt Arrosolo, May 3; 3 qt Arrosolo + 1 oz/A Permit, May 11; 15 oz Clincher, May 31 Insecticides: 1 oz Icon preplant, Apr 13; 4 oz Karate Z, May 16; 2.4 pt Prolix, May 3; 4 oz Karate, July 13 Fungicides: None Inoculation Dates: 10 ml/plot of Rhizoctonia solani culture grown on a rice grain: rice hull mixture, June 16 Application Equipment: None Application Dates: Growth Stage Date Time Temp Wind RH Clouds Dew N/A Disease Ratings: Sheath blight severity ratings, July 22-Aug 15 Drained: Field allowed to dry naturally Harvest: Aug 25 and 26 Results: Sheath blight ratings ranged from 2.7 to 8.0. Plant heights ranged from 68 to 109 cm. Heading dates ranged from July 13 to July 30. Data is available on request. Comments: Sheath blight severity was severe.

267
2007 Sheath Blight Fungicide Trial
Location: Rice Research Station, Crowley, LA Soil Type: Crowley silt loam (pH 6.0, Clay 12%, Silt 71%, Sand 17%, CEC 9.4 cmole/kg) Variety/Seed Rate: CL161, 90 lb /A Plot Size: 4 x 16 ft Planting Method/Date: Drill-seeded, Mar 20 Fertilization: Preplant 24-72-72, Mar 19; preflood 46-0-0, Apr 25; topdress 46-0-0, May 16 Experimental Design: Randomized complete block with four replications Water Management: Flooded, Apr 27; drained, May 1
Herbicides: 1 gal Propanil + 1 oz Permit, Apr 13; 3 qt Arrosolo, Apr 25; 1 pt Zinc + 1.5 pt Basagran, May 11; 16.5 oz Clincher, June 20 Insecticides: 4 oz Karate + 2 oz Londax, May 10 Fungicides: Various, Boot spray, June 14 Inoculation Dates: Sheath blight, May 30 Application Equipment: CO2, backpack sprayer, 8002 tips, 15 gal/A Application Dates: Growth Stage Date Time Temp Wind RH Clouds Dew Boot June 14 1:37 pm 91°F 1.6 mph 60% 30% None Disease Ratings: July 16 Drained: July 20 Harvest: Aug 6 Results: See Table 10 Comments: Sheath blight severity was high; other diseases were very light. Milling differences were not very pronounced due to high variability.

Table 10. Effect of various fungicides, rates, and timings on sheath blight (SB) development and yield of Cocodrie rice at the Rice Research Station, Crowley, LA. 2007. Pathogen Code SB SB Yield Milling Milling Rating Data Type Severity Infest Whole Total Rating Unit 0-9 % lb/A % % Rating Date July 16 July 16 Aug 06 Trt Treatment Form Fm Rate Grow No. Name Amt Ds Rate Unit Stg 1 Unsprayed Check 7.3 a 85.5 a 6326 bc 61.9 a 70.5 a 2 Tilt 3.6 EC 10 FL OZ/A B 6.8 ab 75.3 abc 6419 abc 62.5 a 70.0 a 3 Quadris 2.08 SC 9 FL OZ/A B 4.0 ef 29.3 ef 6823 abc 64.3 a 71.2 a 4 Quadris 2.08 SC 12 FL OZ/A B 4.0 ef 23.8 f 7143 ab 63.0 a 70.4 a 5 Stratego 2.08 EC 16 FL OZ/A B 6.5 ab 68.0 bc 6571 abc 62.5 a 70.2 a 6 Gem 25 DF 8 OZ/A B 4.8 def 36.8 ef 7094 ab 63.3 a 70.1 a 7 Moncut 70 DF 1.0 LB/A B 5.5 bcd 53.3 d 6540 abc 60.7 a 69.8 a 8 Quilt 4 SC 28 FL OZ/A B 5.0 c-f 39.5 ef 7468 a 63.6 a 70.3 a 9 Stratego EC 19 FL OZ/A B 6.3 abc 65.3 c 6730 abc 60.9 a 69.8 a 10 Stratego EC 19 FL OZ/A B 5.5 bcd 35.5 ef 6925 abc 62.5 a 70.2 a Gem DF 3 OZ/A B 11 Quilt SC 21 OZ/A B 3.8 f 26.8 f 7002 ab 62.8 a 70.9 a Quadris SC 4 OZ/A B 12 QRD 143 SC 2 QT/A B 6.3 abc 76.0 abc 6134 bc 60.5 a 68.7 a Organosilicone SC 0.25 % V/V B 13 QRD 143 SC 1 QT/A B 7.3 a 84.3 ab 6286 bc 60.0 a 69.5 a Organosilicone SC 0.25 % V/V B 14 QRD 143 SC 1 QT/A B 6.8 ab 72.5 abc 6592 abc 61.8 a 69.6 a Organosilicone SC 0.25 % V/V B Quadris SC 4 OZ/A B 15 QRD 143 SC 2 QT/A B 6.3 abc 73.3 abc 6465 abc 61.1 a 69.4 a Organosilicone SC 0.25 % V/V B Quadris SC 4 OZ/A B 16 QRD 143 SC 2 QT/A B 5.3 b-e 44.3 de 7065 ab 63.3 a 70.2 a Organosilicone SC 0.25 % V/V B Quadris SC 8.5 OZ/A PD 17 Quilt SC 14 OZ/A B 4.0 ef 30.0 ef 7127 ab 60.5 a 70.0 a Quadris SC 6 OZ/A B LSD (P=.05) 0.95 11.31 621.4 3.93 1.56 Standard Deviation 0.66 7.92 439.4 2.38 0.95 CV 12.32 15.37 6.53 3.85 1.35 Replicate F 1.008 0.725 0.711 8.916 11.635 Replicate Prob(F) 0.3975 0.5421 0.5493 0.0007 0.0001 Treatment F 18.490 36.307 3.511 1.115 1.282 Treatment Prob(F) 0.0001 0.0001 0.0001 0.3753 0.2509 Means followed by same letter do not significantly differ (P=.05, Student-Newman-Keuls).
268

269
2007 Yield Loss Trial
Location: Rice Research Station, Crowley, LA Soil Type: Crowley silt loam (pH 6.0, Clay 12%, Silt 71%, Sand 17%, CEC 9.4 cmole/kg) Variety/Seed Rate: CL131, Cheniere, Trenasse, Jupiter, Catahoula, Cybonnet, Spring, 90 lb /A Plot Size: 4 x 16 ft Planting Method/Date: Drill-seeded, Mar 20 Fertilization: Preplant 24-72-72, Mar 19; preflood 46-0-0, Apr 25; topdress 46-0-0, May 16 Experimental Design: Factorial arranged in a randomized complete block with four replications Water Management: Flooded, Apr 27; drained, May 1
Herbicides: 1 gal Propanil + 1 oz Permit, Apr 13; 3 qt Arrosolo, Apr 25; 1 pt Zinc + 1.5 pt Basagran, May 11; 16.5 oz Clincher, June 20 Insecticides: 4 oz Karate + 2 oz Londax, May 10 Fungicides: Quadris at Boot, June 14 Inoculation Dates: Sheath blight, May 30 Application Equipment: CO2, backpack sprayer, 8002 tips, 15 gal/A Application Dates: Growth Stage Date Time Temp Wind RH Clouds Dew Boot 14 June 11:00 am 88°F 4-5 mph 80% 10% None Disease Ratings: July 17 Drained: July 20 Harvest: Aug 6 Results: See Table 11 Comments: Sheath blight severity was high; other diseases were very light. Milling differences were not very pronounced due to high variability.

270
Table 11. Effect of varietal resistance, sheath blight (SB) inoculation, and fungicide applications on sheath blight development and yield of rice at the Rice Research Station, Crowley, LA. 2007. Pathogen Code SB SB Yield Milling Milling Rating Data Type Severity Infest Grain Head Total Rating Unit 0-9 % lb/A % % Rating Date July 17 July 17 Aug 06 Trt Treatment Form Fm Rate Grow No. Name Amt Ds Rate Unit Stg 1 CL131 3.8 fgh 22.3 fgh 6774 a-e 62.0 a 69.6 abc Uninoculated 2 CL131 8.0 a 91.0 a 5530 ef 57.7 abc 68.6 abc Inoculated Unsprayed 3 CL131 4.8 efg 35.8 ef 6935 a-d 59.1 ab 69.9 abc Inoculated Quadris 2.08 SC 9 OZ/A Boot 4 Trenasse 5.0 ef 31.3 efg 7366 abc 55.3 a-d 67.5 abc Uninoculated 5 Trenasse 7.8 ab 82.5 a 5182 f 52.7 b-e 66.7 abc Inoculated Unsprayed 6 Trenasse 5.5 de 51.8 cd 7335 abc 56.1 a-d 67.4 abc Inoculated Quadris 2.08 SC 9 OZ/A Boot 7 Cybonnet 4.0 fgh 20.5 fgh 6007 c-f 61.4 a 70.0 abc Uninoculated 8 Cybonnet 6.8 bc 57.3 bc 5223 f 56.3 a-d 68.8 abc Inoculated Unsprayed 9 Cybonnet 3.8 fgh 24.0 fgh 6313 b-f 59.8 ab 69.6 abc Inoculated Quadris 2.08 SC 9 OZ/A Boot 10 Cheniere 4.3 fg 23.0 fgh 6854 a-e 59.5 ab 69.2 abc Uninoculated 11 Cheniere 6.3 cd 58.8 bc 5854 def 56.6 a-d 68.9 abc Inoculated Unsprayed 12 Cheniere 3.5 gh 23.3 fgh 7214 abc 60.1 ab 70.8 a Inoculated Quadris 2.08 SC 9 OZ/A Boot 13 Spring 4.0 fgh 22.0 fgh 5551 ef 50.5 cde 69.6 abc Uninoculated 14 Spring 6.5 cd 68.5 b 5575 ef 49.5 de 69.5 abc Inoculated Unsprayed 15 Spring 4.0 fgh 22.8 fgh 5796 def 48.2 e 68.0 abc Inoculated Quadris 2.08 SC 9 OZ/A Boot 16 Jupiter 2.8 hi 12.8 gh 6826 a-e 59.9 ab 66.0 c Uninoculated 17 Jupiter 5.5 de 41.3 de 6745 a-e 58.4 ab 66.7 abc Inoculated Unsprayed 18 Jupiter 2.0 i 8.3 h 7637 ab 62.2 a 66.1 bc Inoculated Quadris 2.08 SC 9 OZ/A Boot 19 Catahoula 4.0 fgh 20.8 fgh 7693 a 56.2 a-d 70.8 a Uninoculated 20 Catahoula 7.8 ab 88.0 a 6158 c-f 53.3 b-e 70.3 abc Inoculated Unsprayed 21 Catahoula 3.5 gh 25.0 fgh 7131 a-d 57.5 abc 70.5 ab Inoculated Quadris 2.08 SC 9 OZ/A Boot LSD (P=.05) 0.84 11.70 799.1 4.51 2.41 Standard Deviation 0.59 8.27 565.0 2.73 1.46 CV 12.1 20.92 8.74 4.82 2.12 Replicate F 2.365 0.895 2.090 0.971 11.832 Replicate Prob(F) 0.0799 0.4493 0.1110 0.3873 0.0001 Treatment F 32.583 37.672 8.124 6.460 3.289 Treatment Prob(F) 0.0001 0.0001 0.0001 0.0001 0.0007 Means followed by same letter do not significantly differ (P=.05, Student-Newman-Keuls).

271
2007 Blast Fungicide Trial
Location: Rice Research Station, Crowley, LA Soil Type: Crowley silt loam (pH 6.0, Clay 12%, Silt 71%, Sand 17%, CEC 9.4 cmole/kg) Variety/Seed Rate: Bengal, 90 lb/A Plot Size: 4 x 16 ft Planting Method/Date: Drill-seeded, May 15 Fertilization: Preplant 24-72-72-, Mar 19; Preflood 120-0-0, June 18 Experimental Design: Randomized complete block with four replications Water Management: Flooded, June 18; drained to induce blast, June 29
Herbicides: 3 qt Propanil + 1 oz Permit, June 8; 4 oz Arrosolo + 1 pt Basagran, June 15; 16.5 oz Clincher, June 20 Insecticides: 4 oz Mustang Max, June 25; 4 oz Mustang Max, July 16 Fungicides: Various, see Table 12 Inoculation Dates: None, all from natural sources Application Equipment: CO2, backpack sprayer, 8002 tips, 15 gal/A Application Dates: Growth Stage Date Time Temp Wind RH Clouds Dew Heading Aug 8 9:00 AM 85 F 4 mph 84% 10% Heavy Disease Ratings: Sept 10 Drained: Aug 22 Harvest: Sept 10 Results: See Table 12 Comments: Blast severity was light; other diseases were very light.

272
Table 12. Effect of fungicide applications on blast development and yield of rice at the Rice Research Station, Crowley, LA. 2007. Pathogen Code RNB Yield Milling Milling Rating Data Type Infest Grain Whole Total Rating Unit % lb/A % % Rating Date Sept 10 Sept 10 Trt Treatment Form Fm Rate Grow No. Name Amt Ds Rate Unit Stg 1 Unsprayed Check 15.8 a 6854 a 60.5 a 64.5 a 2 Quadris 2.08 SC 12 OZ/A H 5.3 b 7275 a 62.5 a 65.3 a 3 Quadris 2.08 SC 9 OZ/A H 7.0 b 7054 a 62.8 a 66.0 a 4 Stratego 2.18 EC 16 OZ/A H 5.3 b 7207 a 62.9 a 66.2 a 5 Stratego 2.18 EC 19 OZ/A H 2.8 b 7196 a 62.5 a 65.8 a 6 Quilt 1.04 SC 28 OZ/A H 5.8 b 7084 a 62.1 a 65.1 a 7 Quilt 1.04 SC 32 OZ/A H 5.3 b 7029 a 62.6 a 65.7 a 8 Gem 25 WG 8 OZ WT/A H 2.8 b 7129 a 62.6 a 65.8 a LSD (P=.05) 4.33 743.5 2.97 2.16 Standard Deviation 2.94 505.5 1.25 0.91 CV 47.33 7.12 2.01 1.39 Replicate F 1.514 1.125 0.009 0.374 Replicate Prob(F) 0.2400 0.3615 0.9259 0.5600 Treatment F 7.821 0.268 0.755 0.770 Treatment Prob(F) 0.0001 0.9599 0.6401 0.6304 Means followed by same letter do not significantly differ (P=.05, Student-Newman-Keuls).

273
2007 Narrow Brown Leaf Spot Trial
Location: Rice Research Station, Crowley, LA Soil Type: Crowley silt loam (pH 6.0, Clay 12%, Silt 71%, Sand 17%, CEC 9.4 cmole/kg) Variety/Seed Rate: CL131, 60 lb /A Plot Size: 4 x 16 ft Planting Method/Date: Drill-seeded, Apr 23 Fertilization: Preplant 24-72-72, Apr 23; preflood 46-0-0, June 7; topdress 46-0-0, June 5 Experimental Design: Randomized complete block with four replications Water Management: Flooded, June 8
Herbicides: 3 qt Arrosolo + 1.5 pt Basagran, May 14 Insecticides: 4 oz Karate + 2 oz Londax, May 10 Fungicides: Various, see Table 13 Inoculation Dates: From natural sources Application Equipment: CO2, backpack sprayer, 8002 tips,15 gal/A Application Dates: Growth Stage Date Time Temp Wind RH Clouds Dew Boot Aug 5 2:00 PM 79°F 1.8 mph 89% 80% Heavy Heading Aug 16 1:00 PM 79°F 2.0 mph 90% 70% Light Disease Ratings: Aug 20 Drained: Aug 9 Harvest: Aug 21 Results: See Table 13 Comments: Disease pressure was light; and due to diseases, yield reductions were low.

274
Table 13. Effect of fungicide applications on leaf smut (LS), narrow brown leaf spot (NBLS) development and yield of rice at the Rice Research Station, Crowley, LA. 2007. Pathogen Code LS NBLS Grain Milling Milling Rating Data Type Severity Severity Yield Whole Total Rating Unit 0-9 0-9 lb/A % % Rating Date Aug 20 Aug 20 Aug 21 Trt Treatment Form Fm Rate Grow No. Name Amt Ds Rate Unit Stg 1 Unsprayed Check 5.0 a 4.0 a 5265 a 56.3 a 65.9 a 2 Tilt 3.6 EC 6 OZ/A B 2.0 b 1.8 bc 5689 a 60.2 a 66.5 a 3 Tilt 3.6 EC 6 OZ/A H 1.8 b 1.3 bc 5316 a 54.2 a 66.0 a 4 Stratego SC 19 OZ/A B 2.5 b 2.5 b 5245 a 60.5 a 66.6 a 5 Quilt 1.66 SC 28 OZ/A B 2.0 b 2.0 bc 5250 a 54.9 a 63.9 a 6 Quilt 1.66 SC 21 OZ/A B 2.3 b 2.3 b 5098 a 59.6 a 66.9 a Quadris 2.08 SC 3 OZ/A B 7 Tilt 3.6 EC 4 OZ/A B 3.0 b 2.5 b 4905 a 53.6 a 65.0 a 8 Quadris 2.08 SC 9 OZ/A B 2.8 b 3.5 a 5326 a 58.1 a 66.2 a 9 Quilt 1.66 SC 28 OZ/A H 1.5 b 1.0 c 5347 a 54.9 a 65.6 a 10 Domark 1.9 ME 6 OZ/A B 2.5 b 2.3 b 5556 a 58.8 a 66.4 a LSD (P=.05) 1.21 0.82 576.3 4.82 2.06 Standard Deviation 0.83 0.56 397.2 2.13 0.91 CV 33.03 24.54 7.49 3.73 1.38 Replicate F 3.104 1.465 1.333 0.780 1.357 Replicate Prob(F) 0.0432 0.2462 0.2843 0.4001 0.2739 Treatment F 5.549 10.605 1.194 3.096 1.971 Treatment Prob(F) 0.0002 0.0001 0.3386 0.0538 0.1633 Means followed by same letter do not significantly differ (P=.05, Student-Newman-Keuls).
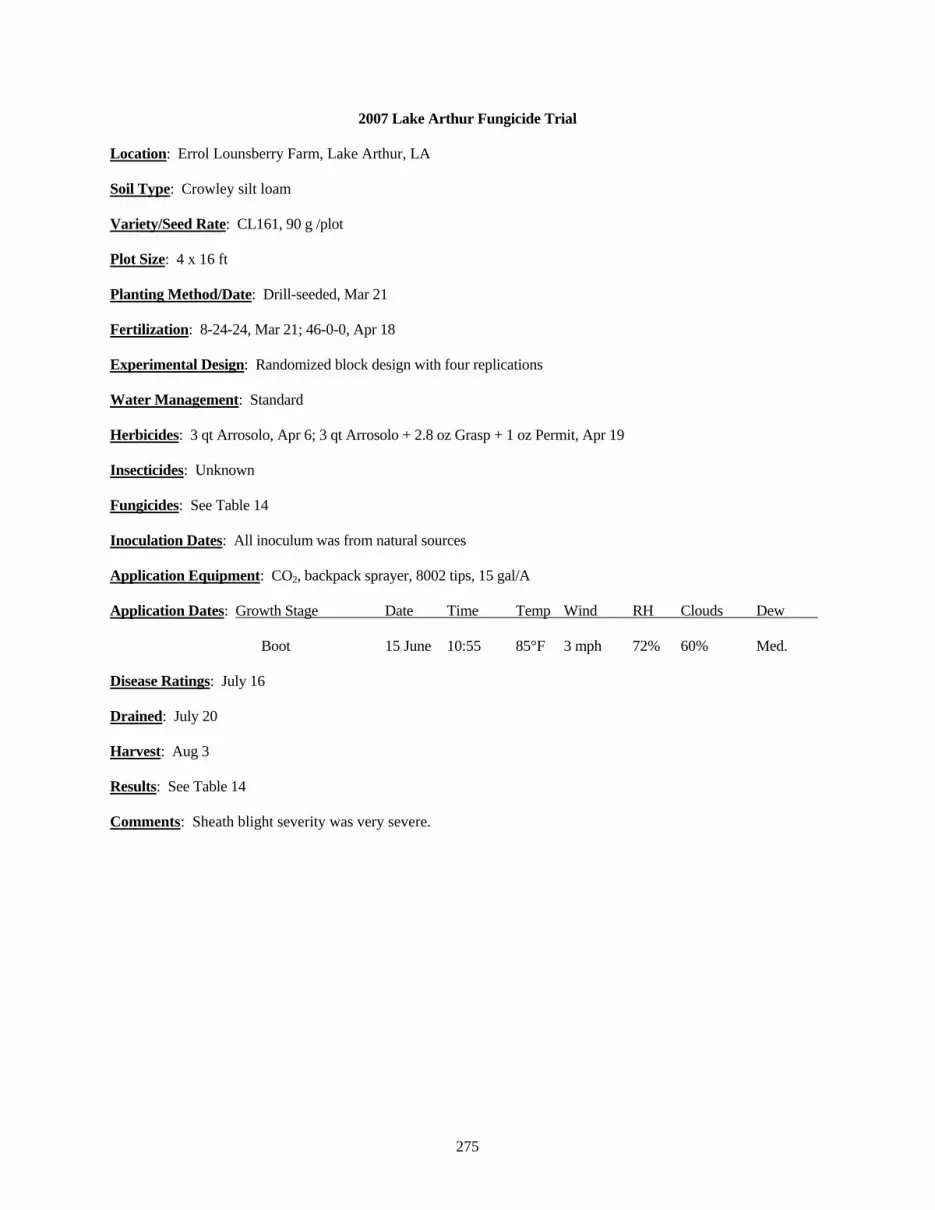
275
2007 Lake Arthur Fungicide Trial
Location: Errol Lounsberry Farm, Lake Arthur, LA Soil Type: Crowley silt loam Variety/Seed Rate: CL161, 90 g /plot Plot Size: 4 x 16 ft Planting Method/Date: Drill-seeded, Mar 21 Fertilization: 8-24-24, Mar 21; 46-0-0, Apr 18 Experimental Design: Randomized block design with four replications Water Management: Standard Herbicides: 3 qt Arrosolo, Apr 6; 3 qt Arrosolo + 2.8 oz Grasp + 1 oz Permit, Apr 19 Insecticides: Unknown Fungicides: See Table 14 Inoculation Dates: All inoculum was from natural sources Application Equipment: CO2, backpack sprayer, 8002 tips, 15 gal/A Application Dates: Growth Stage Date Time Temp Wind RH Clouds Dew Boot 15 June 10:55 85°F 3 mph 72% 60% Med. Disease Ratings: July 16 Drained: July 20 Harvest: Aug 3 Results: See Table 14 Comments: Sheath blight severity was very severe.

276
Table 14. Effect of fungicide applications on sheath blight (SB) development and rice yield and milling at the Lounsberry Farm, Lake Arthur, LA. 2007. Pathogen Code SB SB Yield Milling Milling Rating Data Type Severity Infestation Whole Total Rating Unit 0-9 % lb/A % % Rating Date July 16 July 16 Aug 3 Trt Treatment Form Fm Rate Grow No. Name Amt Ds Rate Unit Stg 1 Unsprayed Check 8.0 a 98.4 a 4636 de 53.9 a 66.3 a 2 Tilt 3.6 EC 10 FL OZ/A B 8.0 a 97.0 a 4421 e 57.0 a 67.7 a 3 Quadris 2.08 SC 9 FL OZ/A B 6.2 c 73.0 b 5923 a 56.2 a 67.1 a 4 Quadris 2.08 SC 12 FL OZ/A B 5.2 d 60.2 c 5722 ab 58.0 a 68.6 a 5 Stratego 2.08 EC 16 FL OZ/A B 7.2 b 92.2 a 4957 cd 53.6 a 65.6 a 6 Gem 25 DF 8 OZ/A B 6.2 c 74.6 b 5622 ab 53.2 a 65.6 a 7 Moncut 70 DF 1.0 LB/A B 6.6 bc 81.6 b 5324 bc 52.2 a 65.8 a 8 Quilt 4 SC 28 FL OZ/A B 7.2 b 90.2 a 5060 cd 55.4 a 66.8 a LSD (P=.05) 0.54 7.68 441.6 6.49 4.66 Standard Deviation 0.41 5.93 341.0 2.74 1.97 CV 6.07 7.11 6.55 4.99 2.96 Replicate F 0.583 0.664 7.817 0.007 0.202 Replicate Prob(F) 0.6773 0.6225 0.0002 0.9362 0.6668 Treatment F 27.146 25.607 12.228 1.111 0.613 Treatment Prob(F) 0.0001 0.0001 0.0001 0.4468 0.7330 Means followed by same letter do not significantly differ (P=.05, Student-Newman-Keuls).

277
2007 Fenton Fungicide Trial
Location: Jimmy Hoppe Farm, Fenton, LA Soil Type: Crowley silt loam Variety/Seed Rate: CL161, 90 g /plot Plot Size: 4 x 16 ft Planting Method/Date: Drill-seeded, Mar 3 Fertilization: 8-24-24, Mar 20; 46-0-0, Apr 13; 46-0-0, May 7 Experimental Design: Randomized complete block design with four replications Water Management: Standard Herbicides: 6 oz Newpath + 1 gal Arrosolo + 1 qt Basagran , Apr 13; 2 qt Basagran +1% surfactant, June 12 Insecticides: Unknown Fungicides: See Table 15 Inoculation Dates: All natural inoculum Application Equipment: CO2, backpack sprayer, 8002 tips, 15 gal/A Application Dates: Growth Stage Date Time Temp Wind RH Clouds Dew Boot 14 June 11:16 am 87°F 2 mph 67% 5% None Disease Ratings: July 17 Drained: July 20 Harvest: July 31 Results: See Table 15 Comments: Sheath blight was severe; other diseases were light.

278
Table 15. Effect of fungicide applications on sheath blight (SB) development rice yield and milling at the Hoppe Farm, Fenton, LA. 2007. Pathogen Code SB SB Yield Milling Milling Rating Data Type Severity Infestation Whole Total Rating Unit 0-9 % lb/A % % Rating Date July 17 July 17 July 31 Trt Treatment Form Fm Rate Grow No. Name Amt Ds Rate Unit Stg 1 Unsprayed Check 8.0 a 87.4 a 5695 b 60.1 b 67.5 a 2 Tilt 3.6 EC 10 FL OZ/A B 7.4 ab 67.8 b 7092 a 63.2 a 70.5 a 3 Quadris 2.08 SC 9 FL OZ/A B 6.6 cd 49.6 c 7258 a 64.0 a 71.5 a 4 Quadris 2.08 SC 12 FL OZ/A B 6.0 cd 39.8 c 7483 a 61.3 ab 70.2 a 5 Stratego 2.08 EC 16 FL OZ/A B 6.8 bc 50.6 c 7235 a 60.0 b 69.0 a 6 Gem 25 DF 8 OZ/A B 5.8 d 34.8 c 7535 a 62.7 ab 70.4 a 7 Moncut 70 DF 1.0 LB/A B 6.0 cd 42.2 c 7127 a 62.6 ab 71.4 a 8 Quilt 4 SC 28 FL OZ/A B 6.0 cd 43.2 c 7189 a 62.6 ab 70.1 a LSD (P=.05) 0.62 12.60 475.2 1.75 2.39 Standard Deviation 0.48 9.73 366.9 0.74 1.01 CV 7.24 18.74 5.18 1.19 1.45 Replicate F 4.024 4.398 9.151 7.720 1.744 Replicate Prob(F) 0.0106 0.0070 0.0001 0.0274 0.2282 Treatment F 13.717 16.062 12.506 7.648 3.330 Treatment Prob(F) 0.0001 0.0001 0.0001 0.0077 0.0675 Means followed by same letter do not significantly differ (P=.05, Student-Newman-Keuls).

279
DISEASE RESISTANCE AND MANAGEMENT IN RICE 1
M.C. Rush, P.A. Bollich, R. Nandakumar, N.P. Nyaupane, X.Y. Sha, D.E. Groth, and S.D. Linscombe
INTRODUCTION
Sheath blight (SB), caused by the fungal pathogen Rhizoctonia solani, is the most serious rice disease in Louisiana because of its endemic, and occasionally epidemic, development each year and also because of the significant yield losses experienced by Louisiana rice growers. Significant losses are also experienced by growers in Texas, Arkansas, and Mississippi, making SB the most consistent and serious disease of rice grown in the southern United States. Bacterial panicle blight (BPB), caused by the bacterial pathogens Burkholderia glumae and Burkholderia gladioli, as identified by our laboratory in 1996, is a seedborne disease of rice that affects the florets in developing panicles and causes linear, bordered sheath lesions. In years of unusually high temperatures at night, the disease can reduce potential yields up to 40%. The use of resistant cultivars, if they were available, would be the best way to control both of these diseases. At this time, only partial resistance is known for both diseases. The sources for SB resistance used in our program have different genes for partial resistance and were crossed with susceptible commercial cultivars, our elite resistant lines, and lines from our progeny row selections. Nurseries to determine the resistance levels of lines and varieties currently being used in the rice breeding program to BPB were conducted by our laboratory for several years. Sources of high-level partial resistance to BPB were identified, including Nipponbare, Teqing, AB649, LM-1, and LR2065 (LR2065 = MCR00-6145 from Cross # MCR 93-143, pedigree = LSBR5/LMNT//H4CODF/NTAI). These materials were used as resistant parents in reciprocal crosses with Cocodrie, a susceptible commercial variety.
Germplasm and all progeny rows for SB and BPB resistance were evaluated in field nurseries at the Rice
Research Station in Crowley, Louisiana, for disease resistance, agronomic characteristics, and yield potential in the 2006 season. Selected progeny rows harvested in 2006 and found to have the grain quality characteristics required by the rice industry were placed in the Rice Breeding/Rice Pathology yield test at the Rice Research Station for yield testing and further disease evaluation in 2007. Progeny rows not cut in 2006 for the 2007 yield test were evaluated for SB and BPB resistance and panicles were selected for further evaluation as panicle rows in 2007. The intent of the current program is to identify resistance sources to SB and BPB, to determine the mode-of-inheritance of high-level partial resistance in newly obtained resistance sources, selected cultivars, and elite lines, and to transfer genes conferring partial resistance to lines typical of American long- and medium-grain varieties. These lines will be further tested in the Rice Breeding Program for use as resistance sources. In 2007, we also conducted tests to determine the control of seedborne Burkholderia spp. on seed presprouted in water treated with antibacterial compounds. Theoretically, uptake of antibacterial solutions by germinating (presprouting) seeds should kill the bacterial pathogens in the seed. 1This research is supported in part by funding provided by rice producers through the Louisiana Rice Research Board.

280
MATERIALS AND METHODS A. Development of SB-Resistant Lines: Resistance sources and crosses - Our SB resistance sources include LSBR-5, LSBR-33, H4/CODF, Taducan, Rice/Grass, Teqing, Jasmine 85, Leah, Katy, Yangdao-4, Yangdao-6, Earl, Bengal, other varieties, and selected lines with combined SB resistance sources from our program. Panicle rows tested in 2007 were derived from crosses made in 1997 through 2004, based on the modified recurrent selection scheme that we have been using for many years. F2 populations from these crosses were evaluated in the field during the 2001-2005 seasons and panicle rows through the F9 generation planted, inoculated, and evaluated in 2007. Inoculation and evaluation for SB resistance - An autoclaved grain:rice hull (1:2) mixture was inoculated with Rhizoctonia solani Kühn (isolate #LR 172) and cultured at room temperature for 48 hours. This grain-rice hull mixture was used as inoculum on all 6-ft panicle rows and yield tests. Each row or plot was inoculated evenly at the late tillering/green ring stages of growth with 50 ml inoculum per 6-ft panicle row or 300 ml per 48 sq ft yield plot by hand. Rows were evaluated for SB resistance at maturity based on the standard SB rating scale (0-9). The cultivar M201, highly susceptible to the rice blast disease, was planted around each set of progeny rows. Naturally occurring blast infected the M201, which served as a source of inoculum to the progeny rows and yield plot tests. All progeny rows and yield test entries were evaluated for blast resistance at green ring and maturity, and all lines showing rice blast infections were discarded. Selection of SB-resistant progeny rows - Lines/plants with both SB and blast resistances, as well as good agronomic characteristics, were selected for advancement in our program or for further testing in the Rice Breeding Program. SB Results – 2007:
A total of 4,600 progeny/panicle rows and control rows were planted and inoculated with Rhizoctonia solani
and/or Burkholderia glumae in 2007 for various disease resistance evaluations, including rice blast, SB, and BPB. Field evaluations of germplasm for SB and blast resistance included 4,061 progeny rows from F2 to F10 generations, 302 F5 progeny rows for BPB resistance, and 439 rows for germplasm increase. In 2007, 63 advanced SB-resistant lines selected in 2006 were planted in harvest-size plots to obtain grain quality and yield data in the joint breeding/pathology yield test in cooperation with Drs. Xueyan Sha and Don Groth. The five check varieties Bengal, Cocodrie, Trenasse, Jupiter, and Wells were planted with the lines for comparison purposes. The experimental lines were grown in yield plots using standard rice production practices and a split plot design with two replicates. In each replicate, one plot (split) was inoculated with R. solani grown on a rice grain:rice hull mixture and one plot was not inoculated (healthy rice) for determination of the effect of SB infection on yield. The lines and varieties were rated for SB development at maturity and agronomic characteristics were evaluated. Due to limited seed, a second yield test with 23 entries and the same five control varieties (two-plot test) was planted with one replicate of split plots. Sixteen lines yielded as high as or higher than the control varieties, except for Jupiter, and had SB ratings ranging from 1 to 7. The control varieties had SB ratings of 4 (Jupiter) to 9 (Trenasse). Many of these lines had agronomic characteristics similar to commercial long-grain varieties. In the two-plot test, six lines yielded with the noninoculated commercial varieties and had SB ratings ranging from 4 to 7 and the agronomic characteristics of commercial varieties (grain quality, milling, days to heading, height, and tillering ability). The control varieties had SB ratings from 4 (Jupiter) to 8 (Trenasse). The lines with acceptable milling characteristics will be further tested in 2008 in cooperation with Drs. X. Sha and Don Groth. Nineteen lines were selected from the 2007 yield test for retesting in 2008 (Table 1).

281
Table 1. Nineteen lines selected from the 2007 yield test for retesting in the 2008 SB yield test.
Plot #
2006 panicle row # Generation Pedigree
SB Rating (0-9)
07-2PL-19 06-3285 F9 IAC202/DREW 3 07SBYT14 06-2745 F10 CPRS//JA85/TQNG/3/LSBR5/LMNT//TQNG 3 07SBYT15 06-2756 F10 CPRS/AZMIL 3 07SBYT16 06-2763 F10 CPRS/AZMIL 3 07SBYT17 06-2799 F9 CPRS/4/LSBR5/LMNT//TQNG/3/H4CODF 5 07SBYT18 06-2855 F9 CPRS/4/LSBR5/LMNT//TQNG/3/H4CODF 3 07SBYT19 06-2858 F9 CPRS/4/LSBR5/LMNT//TQNG/3/H4CODF 2 07SBYT20 06-2862 F9 CPRS/4/LSBR5/LMNT//TQNG/3/H4CODF 5 07SBYT26 06-3200 F9 CPRS//TQNG/CPRS/4/CPRS/3/MBLE//TQNG/MBLE 3 07SBYT27 06-3205 F9 CPRS//TQNG/CPRS/4/CPRS/3/MBLE//TQNG/MBLE 4 07SBYT29 06-3277 F9 IAC202/DREW 5 07SBYT30 06-3283 F9 IAC202/DREW 6 07SBYT43 06-3397 F9 CPRS//TQNG/CPRS/3/LMNT 3 07SBYT45 06-2854 F9 CPRS/4/LSBR5/LMNT//TQNG/3/H4CODF 3
07SBYT49 06SBYT67 F7 (LSBR5/LMNT//TQNG/4/LSBR5/LMNT/3/H4CODF//NTAI(03-10993-11019) 3
07SBYT53 06SBYT66 - MCR02-2215/
CCDR/4/MBLE//TQNG/MBLE/3/MBLE//MBLE/JA85 4 07SBYT54 06SBYT87 F9 CPRS//TQNG/CPRS/4/CPRS/3/MBLE//TQNG/MBLE 3 07SBYT58 06TOL-5 F9 MCR02-6322/TQNG/3/TDCN/SBNT//LSBR5/LMNT 5 07SBYT12 06-2521 - LSBR5/LMNT//GCHW/3/LSBR5/LMNT//H4CODF/NTAI 6
Thirty-seven progeny rows were harvested for the yield test in 2008 to be conducted by Drs. X. Sha and Don Groth (Table 2).

282
Continued.
Table 2. Panicle rows harvested in 2007 for the 2008 SB yield test.
Row #
Seed for SB Yield Test (g) Generation Pedigree
SB Rating (0-9)
07-0507 240 F5 (MCR00-0219) C93-137* KATY/CPRS/JA85/(03-1921) PSCL/4/MBLE//TQNG/MBLE/3/MBLE//MBLE/JA85 4
07-0515 300 F5 (MCR00-0219) C93-137 KATY/CPRS/JA85/(03-1921) PSCL/4/MBLE//TQNG/MBLE/3/MBLE//MBLE/JA85 4
07-0616 300 F5 (MCR00-0219) C93-137 KATY/CPRS/JA85/(03-1974) LSBR5/LMNT//TQNG/3/KATY/CPRS/JA85 2
07-0921 400 F5 (MCR01-0216) C94-180 JODN/3/TDCN/SBNT//LSBR-5/LMNT/(MCR00-0219) C93-137 KATY/CPRS/JA85 4
07-0949 400 F5 (MCR01-0216) C94-180 JODN/3/TDCN/SBNT//LSBR-5/LMNT/(MCR00-0219) C93-137 KATY/CPRS/JA85 3
07-1243 240 F5 (MCR01-0216) C94-180 JODN/3/TDCN/SBNT//LSBR-5/LMNT/(03-7953) C93-139 LSBR5/LMNT//TQNG 5
07-1264 300 F5 (MCR01-0216) C94-180 JODN/3/TDCN/SBNT//LSBR-5/LMNT/(03-7953) C93-139 LSBR5/LMNT//TQNG 3
07-1279 240 F5 (MCR01-0216) C94-180 JODN/3/TDCN/SBNT//LSBR-5/LMNT/(03-7953) C93-139 LSBR5/LMNT//TQNG 5
07-1286 240 F5 (MCR01-0216) C94-180 JODN/3/TDCN/SBNT//LSBR-5/LMNT/(03-7953) C93-139 LSBR5/LMNT//TQNG 4
07-1393 400 F5
(03-1921) C99-1287 PSCL/4/MBLE//TQNG/MBLE/3/MBLE//MBLE/JA85/(MCR00-0219) C93-137 KATY/CPRS/JA85 2
07-1448 240 F5
(MCR00-1216) C94-180 JODN/3/TDCN/SBNT//LSBR5/LMNT/(MCR01-5765) C96-659 CPRS/3/CPRS//TQNG/CPRS 2
07-1452 240 F5
(MCR00-1216) C94-180 JODN/3/TDCN/SBNT//LSBR5/LMNT/(MCR01-5765) C96-659 CPRS/3/CPRS//TQNG/CPRS 2
07-1494 240 F5
(MCR00-1216) C94-180 JODN/3/TDCN/SBNT//LSBR5/LMNT/(MCR01-5765) C96-659 CPRS/3/CPRS//TQNG/CPRS 2
07-1537 240 F7 C00-1803 KBNT/RICE GRASS//TQNG/LSBR5 2 07-1605 240 F7 C00-1615 TQNG/3/TDCN/LSBN//LSBR5/LMNT/4/CPRS/YD-6 2
07-1625 300 F7
(Coo-2173) CPRS/3/LSBR5/LMNT//TQNG/4/YD4/RSMT/5/CPRS//STRN/CR1113/4/LSBR5/LMNT //TQNG/ 3/CPRS//JA85/TQNG 3
07-1631 300 F7
(Coo-2173) CPRS/3/LSBR5/LMNT//TQNG/4/YD4/RSMT/5/CPRS//STRN/CR1113/4/LSBR5/LMNT //TQNG/ 3/CPRS//JA85/TQNG 3
07-1643 400 F7 (Co1-2273) TQNG/3/LSBR5/LMNT//LMNT/4/RSMT/JA85 3
07-1695 300 F7
(Coo-1940) red H4CODF/4/IR8/3/CPRS//S47//SGD5//5/CCDR/RICEGRASS/LMNT/6/KATY/CPRS//JA85/3/CPRS 3
07-1701 300 F7
(Coo-1940) red H4CODF/4/IR8/3/CPRS//S47//SGD5//5/CCDR/RICEGRASS/LMNT/6/KATY/CPRS//JA85/3/CPRS 2
07-1762 240 F10 C98-868 CPRS//JA85/TQNG/3/LSBR5/LMNT//TQNG 3 07-1767 240 F10 C98-868 CPRS//JA85/TQNG/3/LSBR5/LMNT//TQNG 5 07-1779 240 F10 C98-974 CPRS/AZMIL 2 07-1785 240 F10 C98-974 CPRS/AZMIL 2 07-1814 240 F9 C99-1249 CPRS/4/LSBR5/LMNT//TQNG/3/H4CODF 3 07-1928 240 F9 C99-1249 CPRS/4/LSBR5/LMNT//TQNG/3/H4CODF 3 07-1953 240 F9 C98-868 CPRS//JA85/TQNG/3/LSBR5/LMNT//TQNG 1 07-1972 240 F9 C99-1164 LSBR/LMNT//TQNG/3/CCDR/4/JEFF 4

283
Five panicles each were selected from other progeny rows for further testing as progeny rows in 2008. Several
collections were made for our germplasm collection. These were progeny rows with SB ratings at the 1 to 3 level. They will be used in future crosses with susceptible commercial varieties.
The last phase of the SB aspects of this project ran from 2000-2007. During that period, 96,280 progeny rows, including generations from F2 through F9, were planted, inoculated with Rhizoctonia solani, evaluated for SB development, and superior lines were advanced to yield trials. Progeny rows were developed from selections among progeny generated in 1,026 crosses among SB resistance sources, commercial varieties, and breeding lines with different sources of genes for partial resistance and superior agronomic characteristics. Yield tests included 1,931 combine-harvested plots with test lines having comparisons of SB inoculated and noninoculated plots for yield, SB development, lodging, agronomic characteristics, and grain quality characteristics. Lines with yield potential equivalent to or greater than commercial variety controls, SB ratings from moderate to highly resistant, heights and days to heading in the range of commercial varieties, and typical long- or medium-grain quality were advanced to the LSU Agricultural Center rice breeding program conducted at the Rice Research Station. The breeding program has placed three or more lines from our project in the U.S. rice breeders Uniform Rice Nursery (URN) each year of this project. In 2007, three lines were included in the URN, 20 lines in breeding program yield tests, and several lines were used in the breeder’s crossing block as germplasm. Lines with little or no difference in yield between inoculated and noninoculated plots were placed in tolerance yield tests in 2003, 2004, 2005, and 2006 whatever the SB rating. Susceptible lines that did not respond to inoculation with a loss of yield were considered candidates for a type of resistance called "tolerance," which means that the disease did not significantly affect yield components. Several lines were identified as possibly having tolerance.
Our research for developing SB resistance also involved using biotechnology techniques to incorporate disease
resistance PR protein genes for production of beta glucanase and chitinase enzymes and thionin into rice. We transformed 79 Taipei 309 plants with the beta-1, 3-glucanase, chitinase, bar, and hygromycin B resistance genes by cotransformation with the genes in separate plasmids and transplanted these plants to the field, inoculated them with R. solani, and evaluated them for SB resistance. Several of the transformed plants were highly resistant to SB. These plants were crossed with the SB susceptible variety Cocodrie to study inheritance of the resistance and to transfer the resistance to lines with commercial characteristics. Resistant progeny were identified and the presence of the transgenes was demonstrated by PCR and southern blot tests. Several plants appeared to have all four resistance genes. Permits were obtained from USDA, APHIS by submitting Release Notification Letters. None of this material was planted in 2007.
Three years of field trials to study control of rice SB with Liberty herbicide sprays on plants transformed with
the bar gene in our laboratory demonstrated that Liberty was fungicidal and gives control of SB equal to or better than that given by the commercial fungicides Moncut or Quadris when the proper rates and timings of applications were used.
During the term of this project, five new diseases were identified and research conducted.
Table 2 (continued).
Row #
Seed for SB Yield Test (g) Generation Pedigree
SB Rating (0-9)
07-2264 240 F9 C98-988 CPRS/3/LSBR5/LMNT//TQNG 3 07-2288 240 F9 C99-1130 CPRS//TQNG/CPRS/4/CPRS/3/MBLE//TQNG/MBLE 3 07-2485 240 F10 C93-524 KATY/3/RICEGRASS/LSBR5/LMNT 3 07-2545 240 F8 PSCL/CPRS/LSBR5/LMNT/TQNG 2 07-2588 300 F8 LMNT//LMNT/TQNG/3/MGSOMECLONE/MARS 6 07-2884 240 F9 C99-1128 CPRS//TQNG/CPRS/3/LMNT 2 07-2888 240 F9 C99-1166 LSBR5/LMNT//TQNG/3/CCDR/4/PSCL 2 07-2913 300 F9 C99-1166 LSBR5/LMNT//TQNG/3/CCDR/4/PSCL 1 07-3026 240 Re-select MCR03-2114/ LSBR5/LMNT//TQNG/3/CCDR/4/JEFF -

284
B. BPB:
In 1996, our laboratory identified Burkholderia glumae and B. gladioli as causes of BPB in the United States. In this project, numerous screening trials have been conducted searching for resistance to BPB. The varieties and lines Nipponbare, Teqing, LM-I, LR2065 (MCR00-6145), RU0202183, RU0103190, RU0103153, and AB649 were shown to have high levels of partial resistance. Several of these materials were crossed with Cocodrie, a susceptible commercial variety, and the resistances segregated as dominant genes. Taipei 309 plants transformed for thionin production were successfully field tested, with resistant plants crossed to Cocodrie. The resistance segregated as a single dominant gene. A permit was obtained from USDA, APHIS by submitting a Release Notification Letter. Research was conducted to demonstrate the etiological agents for this disease, and PCR, real-time PCR, and ELISA techniques were developed to identify and quantify the pathogens in infected seed-lots. BPB Results – 2007: Screening and selection
Three hundred and three progeny rows in the F5 generation, selected from crosses among and between lines and varieties discovered by our laboratory to have high levels of partial resistance to BPB and the susceptible variety Cocodrie, were grown in the field in 2007, inoculated with B. glumae and R. solani, and reselected for disease resistance (BPB and SB) and desirable agronomic characteristics. Panicle selections were made from 13 rows for continued selection in 2008. These rows had a very high level of partial resistance to BPB and most of them had SB ratings ranging from 3 to 4 (Table 3). This material will be further tested as panicle rows by Dr. Don Groth in 2008.
Eight rows were harvested for yield testing in 2008 (Table 4). These rows were highly resistant to BPB and had SB ratings ranging from 2 to 6 on the 0-9 SB rating scale. These eight lines will be tested in yield-sized plots for disease resistance, yield potential, milling, grain quality characteristics, height, days to heading and other agronomic characteristics in 2008 by Drs. Don Groth and Xueyan Sha. The resistant parents were lines LR 2065, AB647, LM-1, and the variety Nipponbare. Table 3. Panicles collected for planting F6 panicle rows in 2008a.
2007 panicle row # #Panicles
Generation
Pedigree
07-0002 5 F5 NPB/CCDR 07-0004 5 F5 NPB/CCDR 07-0019 5 F5 NPB/CCDR 07-0025 5 F5 NPB/CCDR 07-0032 5 F5 NPB/CCDR 07-0048 10 F5 LM-1/CCDR 07-0062 5 F5 LM-1/CCDR 07-0068 5 F5 LM-1/CCDR 07-0145 5 F5 LR2065/CCDR 07-0165 5 F5 LM-1/CCDR 07-0265 5 F5 CCDR/LR2065 07-0764 5 F5 (MCR01-0216) C94-180 JODN/3/TDCN/SBNT//LSBR-5/LMNT/LR2065 07-0829 5 F5 (MCR01-0216) C94-180 JODN/3/TDCN/SBNT//LSBR-5/LMNT/LR2065 a Lines and panicles were selected for agronomic characters as all were resistant to BPB in several years of inoculated tests, except lines MCR07-0764 and MCR07-0829, which were first tested for BPB resistance in 2007.

285
Table 4. Eight panicle rows resistant to BPB and harvested for use in the 2008 BPB yield test.a
aThese lines will to be planted in 2008 as two replicates of split plots where one plot of each split will be inoculated with B. glumae at the beginning of heading. Determining genes for resistance to BPB
In 2007, we began a study of gene expression analysis in the variety Jupiter that we have shown to have a high
level of partial resistance to BPB in previous studies under this project. It is desirable to identify the molecular basis of partial resistance to efficiently develop resistant varieties. Resistance is due to the expression of certain genes during plant-plant pathogen interactions. Identification of these genes and their products, through use of genomic methods, will help elaborate the basis for high-level partial resistance either directly or indirectly. This research was to identify resistance-related genes at the molecular level using genomic approaches like microarray, using the rice Affymetrix GeneChip which contains probes for 51,279 genes, to contrast partially resistant and susceptible rice cultivars before and after inoculation with the BPB pathogen B. glumae. Results to date indicate that the medium- grain rice variety Jupiter exhibits significant partial resistance with average disease ratings of 3.0 on a 0-9 scale, where susceptible varieties had ratings ranging from 6 to 9 in two field trials conducted during the 2006 season. Rice panicle samples of both the partially resistant variety (Jupiter) and the susceptible variety (Trenasse) were collected in 2006 for microarray analysis. A method for extracting total RNA from rice panicles was standardized. Microarray analysis with panicle samples collected from Trenasse and Jupiter 2 days before and after inoculation with the BPB pathogen indicated that the seed development protein gene clusters (glutelin, prolamin and globulin), defense-related genes, especially defensin and several genes involved in the signal transduction process, were over-expressed several fold in Jupiter rice in response to inoculation with the pathogen. Production of the seed development genes was totally shut down in Trenasse. The cross comparison between Jupiter and Trenasse inoculated plants revealed that over 1340 genes were up regulated in Jupiter compared with Trenasse. Identification and confirmation of over-expressed genes using real-time PCR in Jupiter rice are now in progress. This research will continue as long as Dr. Nandakumar is working in my laboratory (through 2008). BPB toxin studies
Pathogenic B. glumae strains produce a toxin, toxoflavin, which is considered to be the main pathogenicity factor for this bacterium. The genes responsible for this toxin production have been characterized. The non-toxigenic strains obtained from spontaneous mutation, repeated subculturing, or gene knockout studies with toxin producing genes failed to cause disease. This has been demonstrated under greenhouse conditions but has not yet been studied under field conditions. The intent of another project in 2007 was to develop several toxoflavin minus mutants of B. glumae strain and test them under field conditions.
We have developed four toxin minus mutants of wild type B. glumae using site specfic mutagenesis. The
mutants did not produce toxoflavin in culture medium, which was confirmed by mass spectrometry. Two B. glumae mutants along with a natural B. glumae mutant and the wild type strain were tested under field conditions at the LSU AgCenter, Central Research Station, Ben Hur, Baton Rouge, during June-Sept. 2007. Results indicated that the toxin minus mutants are still capable of causing panicle blight symptoms (disease ratings 2-4 on 0-9 scale) under field conditions. However, the mutants were less virulent than the wild type strain (ratings 8-9) in causing BPB
2007 panicle Row # Weight/g
Generation
Pedigree
SB Rating (0-9)
07-0017 400 F5 NPB/CCDR 6 07-0052 240 F5 LM-1/CCDR 3 07-0083 300 F5 LM-1/CCDR 4 07-0115 240 F5 LR2065/CCDR 4 07-0117 240 F5 LR2065/CCDR 3 07-0124 300 F5 LR2065/CCDR 3 07-0184 240 F5 NPB/MCR00-0219// KATY/CPRS/JA85 3 07-0244 240 F5 CCDR/LR2065 2

286
symptoms. These results suggest that other pathogenicity systems in B. glumae can still cause disease in rice when the gene for toxoflavin is removed. Reisolation of mutants from diseased rice seeds, confirming their toxin production, and their effects on rice yield are in progress. We are also identifying microorganisms that can degrade toxoflavin to determine the genes responsible and transfer these genes to rice. This research is ongoing. Controlling BPB with chemical treatment of seeds during pre-sprouting for water-seeding
Studies were initiated in 2007 with a Masters degree student, Mr. Narayan Nyaupane, to develop a method for treating the water used to presprout rice seeds before water seeding with chemicals that would kill the seedborne Burkholderia glumae and B. gladioli pathogens on the seed. Antibacterial compounds, such as, Starner, acids (acetic acid, lactic acid), and copper compounds (Kocide 2000, Copper chloride, Copper sulfate) were used at various concentrations in laboratory tests to determine treatment rates that would not be phytotoxic to rice. Trenasse seed from plots inoculated with B. glumae in 2006 and foundation Trenasse seed were used in this test. Controls included foundation Trenasse, inoculated Trenasse seed, and inoculated seeds that were hot water treated to kill the pathogen. Chemical treatments were on the Trenasse seed from inoculated plots in 2006 and included two rates each of Starner (oxolinic acid), lactic acid, acetic acid, CloroxTM, copper sulfate, copper chloride, and a 5,000 ppm solution of Kocide 2000. The first field test was water seeded with these treatments on May 24, 2007, after presprouting the seed for 30 hours in water or the various antibacterial solutions. Both rates of lactic acid, the high rate of acetic acid and the high rate of copper chloride greatly reduced stands (52-79%), in spite of appearing non-phytotoxic in laboratory tests. Using a 0 to 5 disease rating with 0 = no disease and 5 = severe disease, the lactic acid, acetic acid, CloroxTM, and copper treatments, except for Kocide 2000, had greatly reduced BPB compared with the disease control treatment. The Trenasse plots from foundation seed (very light natural infection) averaged 8,254 lb/A at 12% moisture and the inoculated check seed (diseased) averaged 7,366 lb/A and had a high level of BPB. Plots grown from seed presprouted in 0.1% acetic acid averaged 8,631 lb/A, 3% Starner = 8,372 lb/A, 7.5% CloroxTM = 8,294 lb/A, 1% copper sulfate = 8,294 lb/A, and 0.6% copper chloride = 8,485 lb/A. These treatments had few panicles showing BPB. Kocide 2000 (5,000 ppm) had a mean yield of 7,175 lb/A and many infected panicles. Its active ingredient is copper hydroxide, which has a low solubility in water.
A second planting was made with seed from inoculated and noninoculated plots of the Francis variety in 2006. The same antimicrobial compounds were used with the acid and copper sulfate and copper chloride concentrations reduced to prevent phytotoxicity to seedlings. The results were similar with excellent disease control by presprout treatment with Starner (oxolinic acid), lactic acid, acetic acid, CloroxTM, copper sulfate, and copper chloride. It was clear from the laboratory and two field tests in 2007 that it is possible to significantly decrease the amount of B. glumae in infected seeds by presprouting seed in solutions of weak acids, CloroxTM and Copper solutions and to see these results reflected in increases in yield of rice at maturity. We will pursue this research with Dr. Don Groth in 2008 field tests using antibacterial compounds pre-tested in the laboratory for efficacy and phytotoxicity. Summary of results on BPB research to date:
Among the results from this project to date, we identified B. glumae and B. gladioli as causes of the panicle blight disorder in the United States and carried out extensive studies to confirm the identifications on the pathogens associated with BPB. We determined that the disease was present in Arkansas, Louisiana, Mississippi, and Texas. Extensive chemical control studies were conducted in laboratory and field tests, demonstrating that only Starner gave significant control of this disease using seed treatment or field spraying. We developed several methods for identifying BPB infections using PCR, real-time PCR, the semi-selective medium SP-g, and serology. We developed transgenic rice resistant to BPB. We identified six sources of partial resistance to BPB and have crossed these sources with Cocodrie and each other to develop resistant rice lines and to study the nature of inheritance of the resistance genes involved. We also demonstrated the high–level partial resistance in the variety Jupiter and are conducting studies to identify the genes involved and the pathogenicity systems operating in B. glumae and B. gladioli. A preliminary test in 2007 indicated a high level of probability that the seedborne pathogens causing BPB can be controlled by presprouting seed for water seeding in water solutions of antimicrobial compounds.

287
RICE PRODUCTION ECONOMICS RESEARCH
M.E. Salassi Enterprise budget projections for 2008 were developed in the fall of 2007 for alternative rice production systems. A summary of the enterprise budgeting analysis for rice production systems in Southwest Louisiana is presented in Tables 1 and 2. Values presented represent rice breakeven prices to cover direct (variable) and total estimated rice production costs per hundredweight and per barrel of rice produced for selected yield levels. Direct production costs include expenses for seed, fertilizer, chemicals, fuel, labor, repairs, custom charges, and interest on operating capital. Total specified expenses include direct expenses plus fixed costs on machinery and equipment. These values can also be interpreted as the breakeven price or income per output unit required to cover total production costs. Tenant-operator situations shown in the tables were budgeted for each enterprise with a 70/30 share rent arrangement with the landlord/waterlord paying the irrigation pumping costs. Rice production costs were estimated for the following types of rice production systems: water planted, drill planted, conventional variety, Clearfield variety, conventional tillage, stale seedbed, in rotation, and fallow land. The base yield level for southwest Louisiana was 58.0 cwt/A for water- and drill-planted rice. Variable production costs ranged from $9.84 to $10.71/cwt ($15.93 to $17.34/barrel) for water-planted rice and $8.90 to $9.87/cwt ($14.42 to $15.98/barrel) for drill-planted rice at the base yield level of 58.0 cwt (35.8 barrels)/A. Cost differences were influenced by use of conventional or herbicide-resistant variety, conventional versus stale seedbed tillage system, and rice production in rotation or on fallow land. Total projected rice production costs for 2008 ranged from $10.89 to $12.35/cwt ($17.64 to $20.01/barrel) for water-planted rice and $10.15 to $11.03/cwt ($16.44 to $17.87/ barrel) for drill-planted rice at the base yield level of 58.0 cwt (35.8 barrels)/A. Detailed enterprise budgets and supporting data were published in A.E.A. Information Series Number 252, January 2008 (Dept. of Agricultural Economics and Agribusiness, Louisiana Agricultural Experiment Station, L.S.U. Agricultural Center).
The Projected 2008 Rice Farm Cash Flow Model was developed to assist producers in planning for the 2008 crop year. The model is an Excel spreadsheet which allows rice producers to enter projected acreage, yield, market price, and production cost data for 2008 to estimate net returns above variable production costs and to easily evaluate the impact of changing percent of base planted on net returns. The primary purpose of the model is to evaluate the impact on net returns above variable production costs for alternative rice rental arrangements and percent of base acreage planted. The model also includes entry cells for whole farm fixed expenses to estimate projected returns from rice production over all costs. The model is available on the LSU AgCenter web page (Projected 2008 Rice Farm Cash Flow Model, Dept. of Agricultural Economics and Agribusiness, Louisiana Agricultural Experiment Station, L.S.U. Agricultural Center, Staff Report No. 2008-01, January 2008). A study was conducted to estimate the economic impact of crawfish production on a rice enterprise in a rice/crawfish/rice rotation. Crawfish production in Year 2 of a rice/crawfish/rice production rotation would have three direct impacts in the rice enterprise before and after the crawfish crop. In Year 1, a ratoon rice crop would be prevented due to the flooding of land in preparation for crawfish production. In Year 2, following the crawfish crop, additional field work would be necessary to smooth out boat ruts. In Year 3, additional herbicides would be required to control aquatic weeds. Using a 16 cwt ratoon yield, a $12.80/cwt price, a 70% grower share, and $81.60 variable cost/A, estimated loss of ratoon crop net returns would be $61.76/A. The cost of additional field work in Year 2 was estimated at $26.35/A. An estimation of possible additional herbicide use is shown in Table 3. Additional herbicide cost following crawfish was estimated to range from $11.66/A for conventional rice to $52.07/A for Clearfield rice. A survey was conducted in the summer of 2007 to obtain data in current rice rental arrangements in Louisiana. Five parishes in southwest Louisiana and one parish in northeast Louisiana were surveyed. A 16.5% survey response rate yielded data on 334 share rent tracts and 94 cash rent tracts. Rice cash rent arrangements averaged $79/planted acre. The seven most common share rent arrangements are shown in Figure 1, with an 80/20 arrangement being the most common, followed by a 60/40 arrangement.

288
Table 1. Rice Breakeven Prices to Cover Variable Production Costs for Selected Yield Levels, Southwest Louisiana, 2008. Yield Level (cwt/A) -10% -5% Base +5% +10%
Crop Description 52.2 55.1 58.0 60.9 63.8 --------------------------------------($/cwt)------------------------------------- Southwest Louisiana: (1) Water Planted – Tenant Operator: (a) Conventional Variety: (i) Conventional Tillage: - In Rotation - Fallow Land (ii) Stale Seedbed: - In Rotation - Fallow Land (b) Clearfield Variety: (i) Conventional Tillage: - In Rotation - Fallow Land (ii) Stale Seedbed: - In Rotation - Fallow Land (2) Drill Planted – Tenant Operator: (a) Conventional Variety: (i) Conventional Tillage: - In Rotation (ii) Stale Seedbed: - In Rotation (b) Clearfield Variety: (i) Conventional Tillage: - In Rotation (ii) Stale Seedbed: - In Rotation
11.00 11.34
10.79 11.14
11.41 11.76
11.20 11.55
9.754
10.06
10.37
10.82
10.49 10.81
10.29 10.62
10.88 11.20
10.68 11.01
9.30
9.59
9.89
10.32
10.02 10.33
9.84
10.15
10.40 10.71
10.21 10.52
8.90
9.18
9.45
9.87
9.61 9.90
9.43 9.73
9.96 10.26
9.78
10.08
8.53
8.80
9.06
9.46
9.23 9.51
9.06 9.34
9.57 9.85
9.39 9.68
8.20
8.46
8.71
9.08
Yield Level (barrels/A) -10% -5% Base +5% +10% 32.2 34.0 35.8 37.6 39.4 ----------------------------------($/barrel)---------------------------------- Southwest Louisiana: (1) Water Planted – Tenant Operator: (a) Conventional Variety: (i) Conventional Tillage: - In Rotation - Fallow Land (ii) Stale Seedbed: - In Rotation - Fallow Land (b) Clearfield Variety: (i) Conventional Tillage: - In Rotation - Fallow Land (ii) Stale Seedbed: - In Rotation - Fallow Land (2) Drill Planted – Tenant Operator: (a) Conventional Variety: (i) Conventional Tillage: - In Rotation (ii) Stale Seedbed: - In Rotation (b) Clearfield Variety: (i) Conventional Tillage: - In Rotation (ii) Stale Seedbed: - In Rotation
17.82 18.38
17.48 18.05
18.49 19.05
18.15 18.72
15.79
16.29
16.79
17.53
16.99 17.52
16.66 17.20
17.62 18.15
17.30 17.84
15.07
15.54
16.01
16.72
16.24 16.74
15.93 16.45
16.84 17.34
16.54 17.05
14.42
14.87
15.32
15.98
15.56 16.04
15.27 15.76
16.14 16.62
15.85 16.33
13.83
14.26
14.68
15.32
14.95 15.41
14.67 15.14
15.50 15.95
15.22 15.68
13.29
13.70
14.11
14.72

289
Table 2. Rice Breakeven Prices to Cover Total Specified Production Costs for Selected Yield Levels, Southwest Louisiana, 2008. Yield Level (cwt/A) -10% -5% Base +5% +10% Crop Description 52.2 55.1 58.0 60.9 63.8 -------------------------------------($/cwt)----------------------------------- Southwest Louisiana: (1) Water Planted – Tenant Operator: (a) Conventional Variety: (i) Conventional Tillage: - In Rotation - Fallow Land (ii) Stale Seedbed: - In Rotation - Fallow Land (b) Clearfield Variety: (i) Conventional Tillage: - In Rotation - Fallow Land (ii) Stale Seedbed: - In Rotation - Fallow Land (2) Drill Planted – Tenant Operator: (a) Conventional Variety: (i) Conventional Tillage: - In Rotation (ii) Stale Seedbed: - In Rotation (b) Clearfield Variety: (i) Conventional Tillage: - In Rotation (ii) Stale Seedbed: - In Rotation
12.53 13.17
11.96 12.60
12.94 13.58
12.37 13.02
11.13
11.40
11.58
12.12
11.94 12.54
11.39 12.01
12.33 12.93
11.78 12.40
10.61
10.86
11.04
11.55
11.40 11.98
10.89 11.47
11.77 12.35
11.26 11.84
10.15
10.38
10.55
11.03
10.92 11.47
10.43 10.98
11.27 11.82
10.78 11.34
9.72
9.95
10.11
10.57
10.48 11.00
10.01 10.54
10.82 11.34
10.35 10.88
9.34
9.55
9.70
10.14
Yield Level (barrels/A)
-10% -5% Base +5% +10% 32.2 34.0 35.8 37.6 39.4 ----------------------------------($/barrel)---------------------------------- Southwest Louisiana: (1) Water Planted – Tenant Operator: (a) Conventional Variety: (i) Conventional Tillage: - In Rotation - Fallow Land (ii) Stale Seedbed: - In Rotation - Fallow Land (b) Clearfield Variety: (i) Conventional Tillage: - In Rotation - Fallow Land (ii) Stale Seedbed: - In Rotation - Fallow Land (2) Drill Planted – Tenant Operator: (a) Conventional Variety: (i) Conventional Tillage: - In Rotation (ii) Stale Seedbed: - In Rotation (b) Clearfield Variety: (i) Conventional Tillage: - In Rotation (ii) Stale Seedbed: - In Rotation
20.30 21.34
19.37 20.42
20.97 22.01
20.04 21.09
18.04
18.46
18.76
19.63
19.34 20.32
18.46 19.45
19.97 20.95
19.09 20.09
17.19
17.60
17.88
18.71
18.47 19.41
17.64 18.58
19.07 20.01
18.24 19.18
16.44
16.82
17.09
17.87
17.69 18.58
16.89 17.79
18.26 19.15
17.47 18.37
15.75
16.11
16.37
17.12
16.98 17.83
16.22 17.08
17.53 18.37
16.76 17.62
15.13
15.47
15.72
16.43

290
Table 3. Estimated Cost Differences in Herbicide Programs Before and After Crawfish. Conventional Rice Production
Herbicide Program Before Crawfish
Herbicide Program After Crawfish
Herbicide Rate Herbicide Rate Facet Londax 2,4-D
0.5 lb
1.0 oz 2.5 pt
Command Clincher Permit
12 oz 15 oz
1.0 oz Cost $40.93 Cost $52.59 Clearfield Rice Production
Herbicide Program Before Crawfish
Herbicide Program After Crawfish
Herbicide Rate Herbicide Rate Newpath Aim
8.0 oz 1.6 oz
Newpath Grasp Londax
12.0 oz
2.8 oz 1.6 oz
Cost $38.11 Cost $90.18
Figure 1. Most Common Rice Share Rental Arrangements (percent paid for land and water).
0
5
10
15
20
25
30
35
Percent of Share Rent Tracts Surveyed
16.7% 20.0% 25.0% 30.0% 33.0% 40.0% 50.0%Percent Paid for Land and Water

291
RICE INSECTS RESEARCH
EVALUATION OF PRE- AND POSTFLOOD APPLICATIONS OF GRANULAR DINOTEFURAN FOR RICE WATER WEEVIL CONTROL
M.J. Stout and M.J. Frey
A granular formulation of dinotefuran, a neonicotonoid insecticide (Mitsui Chemicals, Inc.), has been evaluated over the past several years for efficacy against the rice water weevil, and results of these prior trials have been encouraging. Various rates and timings of dinotefuran were again evaluated in a drill-seeded, small-plot experiment in 2007. Location: Rice Research Station, Crowley, LA Variety/Seeding Rate: Cocodrie, ~90 lb/A Plot Size: 4.1 x 18 ft; plots were separated by at least 5 ft in all directions. Planting Method/Date: Drill-seeded, 17 Apr 2007 Fertilization/Weed Control: Standard for drill-seeded rice Water Management: Permanent flood, 10 May Experimental Design: Randomized complete block, seven treatments, four replicates Treatments*:
1. Non-treated control 2. Dinotefuran, granular, 120 gm ai/A preflood + 120 gm ai/A postflood 3. Dinotefuran, granular, 80 gm ai/A preflood 4. Dinotefuran, granular, 120 gm ai/A preflood 5. Dinotefuran, granular, 80 gm ai/A preflood + 80 gm ai/A postflood 6. Dinotefuran, granular, 120 gm ai/A late postflood 7. Dinotefuran, granular, 240 gm ai/A late postflood
* Preflood applications of dinotefuran were made 1 day before flooding; postflood applications were made 10 days after flooding; late postflood applications were made 20 days after flooding
Sampling: Cores/plot: four core samples per plot Sampling Dates: 24 May [14 dpf (days postflood)], 7 June (28 dpf), 13 June (34 dpf) Harvested: 8 Aug Data Analysis: A mean number of larvae per core was calculated for each plot at each sampling date by averaging numbers of larvae from the four core samples at each sampling date. Treatment effects on mean numbers of larvae per core were analyzed by PROC MIXED with treatment as fixed effect and block as random effect (Tukey mean separation). Plot yields in grams per plot were adjusted to 12% moisture and analyzed by mixed-model ANOVA.

292
Results: Densities of rice water weevil larvae and pupae and grain yields in a small-plot test of various rates, timings, and use patterns of dinotefuran.
Treatment Larvae per Core Sample Yield (kg/ha) at 12% Moisture 14 d after flood 28 d after flood 34 d after flood
Untreated 2.3 ± 0.9 32.8 ± 6.3 27.7 ± 1.6 5571.6 ± 84.4 80 preflood 0.6 ± 0.4 8.9 ± 1.4 13.0 ± 3.7 5959.9 ± 182.3 120 preflood 0.3 ± 0.1 18.0 ± 2.1 15.8 ± 4.0 5985.7 ± 106.0 80 pre+post 1.6 ± 1.3 10.0 ± 2.7 17.1 ± 2.5 6012.1 ± 64.9 120 pre+post 3.0 ± 1.1 6.3 ± 1.1 22.1 ± 5.0 5958.8 ± 116.3 120 late post 4.1 ± 2.4 13.4 ± 0.8 22.0 ± 6.0 5692.1 ± 114.2 240 late post 2.5 ± 1.2 16.3 ± 2.5 20.4 ± 2.8 5738.3 ± 111.1
Conclusions: At 28 days postflood, all dinotefuran treatments significantly reduced weevil densities (P < 0.05 for all Tukey comparisons). The magnitude of reduction in larval densities at 28 days after flood ranged from 45 to 81%. The overall effect of treatment on larval densities at 34 days after flood was significant, but the effect of treatment on yield was not significant. In sum, the level of control observed in this experiment was generally lower than observed in previous years. This is perhaps attributable to the high larval pressure in this experiment. Nonetheless, the results of this experiment are consistent with the results of experiments conducted with dinotefuran in prior years. As in previous years, preflood + postflood split applications were generally more effective than other use patterns. The efficacy of postflood applications (either alone or coupled with a preflood application) in this and prior experiments suggests the possibility that granular dinotefuran may possess larvicidal activity. This possibility was confirmed in a greenhouse experiment conducted in 2007. Of all the potential alternatives to pyrethroid insecticides for weevil control currently being tested, granular dinotefuran is the only product that could potentially be used as a “rescue” treatment and is the product most likely to be compatible with a water-seeded cultural system. Further work involving a range of rates and timings in both water- and drill-seeded rice will be conducted in 2008.

293
EVALUATION OF INSECTICIDES FOR CONTROL OF THE RICE STINK BUG, 2007
M.J. Stout and M.J. Frey
In 2007, two new treatments were evaluated against the rice stink bug, the most important late-season pest of rice in Louisiana. The first was a combination of methyl parathion and Prolex, at various rates; the second was dinotefuran, a neonicotinoid insecticide. Location: Rice Research Station, Crowley, LA Variety/Seeding Rate: Cocodrie, ~90 lb/A Plot Size: 4.1 x 18 ft (7 rows at 7-in spacing); untreated plots were present on N, E, and W borders of the field. Planting Method/Date: Drill-seeded, 21 May 2007 Fertilization/Weed Control: Standard for drill-seeded rice Water Management: Permanent flood, 15 June Experimental Design: Randomized complete block, six treatments, four replicates Treatments*:
8. Non-treated control 9. Prolex, 0.0171 lb ai/A 10. Methyl parathion, 0.5 lb ai/A 11. Dinotefuran, 120 gm ai/A 12. Prolex + methyl parathion, 0.25 and 0.009 lb ai/A, respectively 13. Prolex + methyl parathion, 0.5 and 0.0171 lb ai/A, respectively
* All applications were made as foliar sprays on 8 August. Applications were made with a backpack, CO2-powered sprayer with water as a carrier (15 gal/A). Rice was at 50 to 75% heading on 8 Aug.
Sampling: 10 sweep samples per plot using a standard sweep net Sampling Dates: 1, 2, 5, and 6 days after spray applications (9 Aug, 10 Aug, 13 Aug, and 14 Aug) Data Analysis: Numbers of bugs per plot (10 sweeps of a standard sweep net) were analyzed by repeated-measures ANOVA in PROC MIXED with treatment, time, and treatment*time as fixed effects and block and block*treatment as random effects (Tukey mean separation).

294
Results:
Days after spraying (das)
1 das 2 das 3 das 4 das 5 das 6 das
Stin
kbug
s pe
r 10
swee
ps
0
2
4
6
8
10
ProlexDinotefuranMethyl parathionmp + prolex high ratemp + prolex low rateUntreated control
Conclusions: Numbers of stinkbugs per plot were extremely variable, and no significant differences were found among treatments (P = 0.10). Nonetheless, it appears that both dinotefuran and the methyl parathion/Prolex combination treatments hold potential for management of rice stink bug infestations and will be evaluated further in 2008.

295
EVALUATION OF RYNAXYPYR™ SEED TREATMENT AGAINST THE RICE WATER WEEVIL, 2006-2007
M.J. Stout and M.J. Frey
The insecticide Rynaxypyr™ (chlorantraniliprole) is a new insecticide that belongs to a novel class of insecticides, the anthranilic diamides. This insecticide has been tested as a seed treatment over the past 3 years and has provided good to excellent control of the rice water weevil in all 3 years. A Section 18 petition was submitted to the EPA in October 2007 for the use of Rynaxypyr as a seed treatment in 2008. The seed treatment will be marketed under the brand name Dermacor™. Results of Dermacor™ field trials conducted in 2006 and 2007 are presented below.
2006 Trial Location: Rice Research Station, Crowley, LA Variety/Seeding Rate: Cypress, 100 lb/A (all seed supplied by DuPont) Plot Size: 4.1 x 16 ft (7 rows at 7-in spacing) Planting Method/Date: Drill-seeded, 16 May 2006 Agronomic practices: Standard for drill-seeded rice Water Management: Permanent flood, 7 June Experimental Design: Randomized complete block, five treatments, four replicates Treatments (seeds treated by Dupont):
1. Check (untreated control) 2. Icon, 0.1 mg ai/seed* 3. Rynaxypyr low rate, 0.025 mg ai/seed* 4. Rynaxypyr mid rate, 0.05 mg ai/seed * 5. Rynaxypyr high rate, 0.1 mg ai/seed * *mg ai/seed = milligrams of active ingredient per seed*
Sampling: Four root/soil core samples per plot Sampling Dates: June 27 [20 dpf (days postflood)], July 6 (29 dpf), July 12 (35 dpf) Harvested: 5 Sept (interior five rows only harvested) Data Analysis: A mean number of larvae per core sample was calculated for each plot at each sampling date by averaging numbers of larvae from the four core samples at each sampling date. Treatment effects on mean numbers of larvae per core were analyzed by PROC MIXED in SAS with treatment as fixed effect and block as a random effect (Tukey mean separation). Plot yields were converted to lb/A (adjusted to 12% moisture) and analyzed by mixed-model ANOVA.

296
Results: Results of a small-plot evaluation of DermacorTM X-100 conducted at the LSU AgCenter Rice Research Station, Acadia Parish, Louisiana, in 2006.
Treatment
Larvae per Core Sample ± s.e. on:
June 27 July 6 July 12 Untreated control
20.5 ± 3.2
37.1 ± 7.6
30.4 ± 3.2
Rynaxypyr, low rate (0.025 mg ai/seed) 1.1 ± 0.4 * 2.6 ± 0.8 * 4.2 ± 0.8 * Rynaxypyr, mid rate (0.05 mg ai/seed) 0.6 ± 0.3* 2.1 ± 0.5 * 1.3 ± 0.5 * Rynaxypyr, high rate (0.1 mg ai/seed) 0.1 ± 0.1 * 1.4 ± 0.9 * 2.3 ± 0.4 * Icon , 0.1 mg ai/seed 2.1 ± 0.6 * 6.4 ± 0.8 * 9.3 ±0.8 *
Treatment
Adjusted Yields (lb/A) ± s.e.
Untreated control
2430.6 ± 301.2
Rynaxypyr seed treatment, low rate 5116.8 ± 218.7 * Rynaxypyr seed treatment, mid rate 5521.4 ± 111.2 * Rynaxypyr seed treatment, high rate 5340.2 ± 196.9 * Icon 4861.8 ± 140.3 *
An * denotes a mean significantly different from control mean (Tukey, P < 0.05) in the same column.

297
2007 Trial
Location: Rice Research Station, Crowley, LA Variety/Seeding Rate: Cocodrie, ~90 lb/A (75 gm/plot); XL 723 (hybrid), ~30 lb/A (25 gm/plot) (all seed supplied by DuPont) Plot Size: 4.1 x 18 ft (7 rows at 7-in spacing) Planting Method/Date: Drill-seeded, 21 May 2007 Agronomic practices: Standard for drill-seeded rice Water Management: Permanent flood, 15 June (plants at 3- to 4-leaf stage) Experimental Design: Randomized complete block, 10 treatments, four replicates Treatments (seeds treated by Dupont):
Treatment No. Variety Treatment (all seed treatments; rate refers to milligrams active ingredient per seed of Rynaxypyr)
1 Cocodrie 0 mg ai/seed 2 XL 723 0 mg ai/seed 3 Cocodrie 0.0125 mg ai/seed 4 Cocodrie 0.025 mg ai/seed 5 Cocodrie 0.05 mg ai/seed 6 Cocodrie 0.1 mg ai/seed 7 XL 723 0.025 8 XL 723 0.05 9 XL 723 0.1 10 Cocodrie Untreated/0 mg ai/seed (originally intended as a Karate treatment, but
treatment was not made) Sampling: Three to four root/soil core samples per plot Sampling Dates: 3 July [18 dpf (days postflood)], 9 July (24 dpf), 15 July (30 dpf) Harvested: 17 Sept (interior five rows only harvested) Data Analysis: A mean number of larvae per core sample was calculated for each plot at each sampling date by averaging numbers of larvae from the three or four core samples at each sampling date. Treatment effects on mean numbers of larvae per core were analyzed by PROC MIXED in SAS with treatment as a fixed effect and block as a random effect (Tukey mean separation). Plot yields were adjusted to 12% moisture but were not converted to lb/A; yields are expressed as grams of seed per plot.

298
Results of a small-plot evaluation of DermacorTM X-100 conducted at the LSU AgCenter Rice Research Station, Acadia Parish, Louisiana, in 2007, using two varieties of rice, Cocodrie and a hybrid variety.
Treatment Larvae per Core Sample ± s.e. on: Yields (gm/plot) at 12% Moisture 18 d Postflood 25 d Postflood 32 d Postflood
Cocodrie: Untreated control
15.9 ± 4.1
25.6 ± 3.3
10.0 ± 2.3
2877.8 ± 228.4
Rynaxypyr (0.0125 mg ai/seed)
4.0 ± 0.5 3.4 ± 1.9 3.1 ± 1.0 3244.5 ± 64.5
Rynaxypyr (0.025 mg ai/seed)
2.8 ± 0.8 3.9 ± 1.3 2.4 ± 0.7 2897.3 ± 121.9
Rynaxypyr (0.05 mg ai/seed)
2.8 ± 0.8 2.9 ± 0.9 2.4 ± 0.3 2909.8 ± 139.5
Rynaxypyr (0.1 mg ai/seed)
2.2 ± 1.0 2.7 ± 1.7 3.6 ± 1.0 3213.9 ± 76.4
Hybrid:
Untreated control 11.5 ± 2.5 12.6 ± 0.9 7.6 ± 1.4 4158.8 ± 108.1 Rynaxypyr (0.025 mg
ai/seed) 7.0 ± 0.4 5.8 ± 2.0 3.8 ± 0.9 3996.9 ± 117.9
Rynaxypyr (0.05 mg ai/seed)
8.0 ± 1.4 4.9 ± 1.2 3.0 ± 0.8 3921.4 ± 143.0
Rynaxypyr (0.1 mg ai/seed)
6.2 ± 1.9 4.9 ± 1.7 3.0 ± 0.5 3781.7 ± 181.2
Comments: The efficacy of Dermacor™ seed treatment was excellent in 2005 and 2006 (2005 data not shown). Dermacor™ was more effective at reducing weevil densities in 2005 and 2006 than was Icon, even when rates of Dermacor™ were lower than rates of Icon. Efficacy was also good in the 2007 experiment, although the response to the seed treatment was not as dramatic in 2007. In particular, efficacy of Dermacor™ on the hybrid variety was only adequate in 2007, and there was no yield response to seed treatments on Cocodrie or the hybrid in 2007.
If the pending Section 18 petition for Dermacor™ is approved for the 2008 growing season, Dermacor™ will be
registered for use only on dry-seeded rice. The efficacy of Dermacor™ in water-seeded cultural systems has not yet been evaluated. In addition, questions still remain about the most appropriate rate for Dermacor™ in rice fields planted with hybrid rice varieties.

299
EVALUATION OF THIOMETHOXAM AS A SEED TREATMENT AGAINST THE RICE WATER WEEVIL, 2007
M.J. Stout and M.J. Frey
Thiomethoxam is a neonicotinoid insecticide that has been evaluated as a seed treatment (Cruiser®) over the past several years at the Rice Research Station. The efficacy of thiomethoxam in these previous tests was inconsistent. This inconsistency may be attributable to the use of rates that were lower than needed to control the rice water weevil. A drill-seeded experiment was conducted in 2007 to evaluate the effectiveness of a thiomethoxam seed treatment (Cruiser®) at rates higher than had been used previously. Location: Rice Research Station, Crowley, LA Variety/Seeding Rate: Cocodrie, ~ 90 lb/A (seed supplied by Syngenta) Plot Size: 4.1 x 18 ft (7 rows at 7-in spacing) Planting Method/Date: Drill-seeded, 21 May 2007 Agronomic practices: Standard for drill-seeded rice Water Management: Permanent flood, 15 June Experimental Design: Randomized complete block, six treatments, four replicates Treatments (seeds treated by Dupont):
6. Check (untreated control)* 7. Cruiser, 80 gm ai/100 kg seed* 8. Cruiser, 95 gm ai/100 kg seed* 9. Cruiser, 115 gm ai/100 kg seed* 10. Cruiser, 135 gm ai/100 kg seed* 11. Icon, 42 gm ai/100 kg seed* * All seed was treated and supplied by Syngenta; gm ai/100 kg seed = grams of active ingredient per 100 kilograms of seed
Sampling: Four root/soil core samples per plot Sampling Dates: 5 July [20 dpf (days postflood)], 11 July (26 dpf), 18 July (33 dpf) Harvested: 17 Sept (interior five rows only harvested) Data Analysis: A mean number of larvae per core sample was calculated for each plot at each sampling date by averaging numbers of larvae from the four core samples at each sampling date. Treatment effects on mean numbers of larvae per core were analyzed by PROC MIXED in SAS with treatment as fixed effect and block as a random effect (Tukey mean separation). Plot yields were adjusted to 12% moisture but were not converted to lb/A. Yields were analyzed by mixed-model ANOVA.

300
Results:
Treatment Larvae per Core Sample ± s.e. on: Yields (gm/plot) at 12% Moisture 20 d Postflood 26 d Postflood 33 d Postflood
Untreated control
16.2 ± 2.5
17.5 ± 2.9
7.8 ± 3.2
3060.4 ± 162.0
Cruiser 80 3.3 ± 1.0 5.5 ± 1.6 4.1 ± 0.8 3291.0 ± 21.5 Cruiser 95 5.0 ± 2.3 5.9 ± 1.1 3.3 ± 0.7 3147.2 ± 100.0 Cruiser 115 4.0 ± 0.6 4.3 ± 1.2 5.3 ± 0.9 2974.6 ± 200.2 Cruiser 135 2.3 ± 0.5 3.4 ± 0.8 2.2 ± 0.6 3308.3 ± 80.2 Icon 1.7 ± 0.5 3.1 ± 0.6 4.8 ± 1.0 3387.1 ± 72.2
Results: Thiomethoxam seed treatment provided good to very good control of rice water weevil larvae over the first two core sampling dates (P < 0.05 on both dates for effect of treatment). Reduction in larval numbers in thiomethoxam-treated plots ranged from 69 to 86% at 20 days after flooding and ranged from 66 to 81% at 26 days after flooding. Reductions in larval densities at 33 days after flooding were not significant (P = 0.16). The effect of treatment on yields was marginally significant (p = 0.08). The level of control given by thiometoxam at the highest rate was comparable with that given by Icon. Greenhouse experiments with thiomethoxam-treated seeds indicate that the insecticide is transported systemically in the plant from seed to leaves and kills adult weevils when they feed on leaves. Because this insecticide is systemic, it may also provide control of other leaf-feeding pests, such as grape colaspis, thrips, and fall armyworm. Experiments with other insecticides in the neonicotinoid class suggest that they are much less toxic to crawfish than the pyrethroid insecticides that are currently registered. Thiomethoxam is currently being considered for registration in drill-seeded rice only.

301
COASTAL EROSION CONTROL RESEARCH
MOLECULAR MARKER ANALYSIS OF SMOOTH CORDGRASS
H.S. Utomo, M.D. Materne, and S.A. Harrison
Considerable differences in morphological and physiological characteristics have been documented among smooth cordgrass (Spartina alterniflora) ecotypes from Atlantic and Gulf coasts. DNA markers, such as amplified fragment length polymorphism (AFLP) and microsatellite or simple sequence repeats (SSR), can provide a quantitative measurement of genetic diversity among natural populations. A better understanding in genetic diversity coupled with quantification of population structure and natural distribution of gene pools may help establish a better policy to achieve successful habitat restoration. Genetic information from marker analysis can also be used during cultivar development or to select combinations of genotypes that can maximize the ecosystem functionality. The objective of this study was to determine genetic relationship and diversity of S. alterniflora accessions originating from four coastal basins of Louisiana using AFLP markers. Plant materials and DNA Isolation
USDA - Natural Resources Conservation Service (NRCS) accessions collected from four Louisiana coastal basins (18 accessions per basin) were used in this study. A young leaf tissue weighing approximately 0.2 g was used to extract the genomic DNA. The DNA was isolated using the DNeasy kit (QIAGEN, Cat. No.69104). Its quantity and quality were estimated both spectrophotometrically using the NanoDrop and visually by ethidium bromide staining on agarose gels using uncut λ DNA standards.
AFLP Analysis
The AFLP procedure was conducted according to the Vos’s protocol that was supplied by Li-Cor Biosciences with the IRDye™ Fluorescent AFLP® Kit for Large Plant Genome Analysis. The restriction-ligation reactions were carried out using EcoRI and MseI restriction enzymes according to the protocol. The preamplification was done using EcoRI+A and MseI+C primers in a PTC-100™ thermocycler (MJ Research, Watertown, MA) for 20 cycles at 94oC denaturation for 30 seconds, 56oC annealing for 1 minute, 72oC extension for 1 minute, and soak at 4oC. The preamplification product was diluted 40-fold and used for selective amplification reactions. Selective amplification was performed using four primer combinations that consisted of the MseI primer and the IRDye-700 labeled EcoRI primer or IRDye-700 and -800 labeled EcoRI primers for multiplexing. These primers were selected based on the number of informative markers or fragments generated and their reproducibility. When multiplexing was carried out, the concentration of the 800 labeled EcoRI primer and dNTPs was increased 25% more than recommended to produce comparable band intensity with that of IRDye-700 labeled primers. Selective amplification was carried out in a thermocycler using a “touchdown” program: 1 cycle of 90oC for 30 seconds, 65oC for 30 seconds, and 72oC for 1 minute; 12 cycles of subsequently lowering the annealing temperature (65oC) by 0.7oC per cycle while keeping denaturation at 94oC for 30 seconds and extension at 72oC for 1 minute; and 23 cycles of 94oC for 30 seconds, 56oC for 30 seconds, and 72oC for 1 minute, followed by soaking at 4oC (Li-Cor’s manual, PN 984-06248, 05/01). To stop the reaction, 5 µl Blue Stopping Solution (Li-Cor, Lincoln, NE) was added to each sample.
Gel Analysis
The denatured sample of 1.0 µl was loaded with a Hamilton multi-channel pipette (Hamilton, Reno, NV) onto 25-cm gels prepared with 6.5% KB Plus Polyacrylamid Gel Matrix (Li-Cor, Lincoln, NE) with a gel thickness of 0.25 mm. Electrophoresis and detection of AFLP fragments were performed on a Li-Cor IR2 automated DNA sequencer (Li-Cor, Lincoln, NE). After pre-running for 30 min., the electrophoresis conditions were set to 1500 V, 40 W, 40 mA, and 45oC, with a scan speed of 4 for 3 hours. Gel images were saved as TIF (tagged image file format) files for further analysis.

302
Data Analysis
The TIF files containing fragment images from each of the primer sets were scanned into a computer and scored using SagaMX Ver. 3.1, Automated AFLP Analysis Software (Li-Cor, Inc.). Unambiguous AFLP bands were scored as present (1) or absent (0) for each sample and assembled in a data matrix. The data were exported into a spreadsheet and formatted for further analysis.
Both monomorphic and polymorphic bands were included in the binary data set to provide unbiased estimates
of genetic similarity. A pair-wise genetic similarity was calculated using the method of Nei and Li (1979): Sij=2a/(2a+b+c), where Sij is the similarity between two individuals i and j,
a is the number of bands present in both individuals, b is the number of bands present in i and absent in j, and c is the number of bands absent in i and present in j.
For estimates of genetic similarity, the data were arranged in the following groups: all accessions and basin
group. Total gene diversity (Ht) and diversity within four groups were calculated based on Nei’s formula (1973) assuming Hardy-Weinberg equilibrium. The POPGENE software was used and calculations were performed with all markers, both poly- and monomorphic.
Ordination analysis via non-metric multidimensional scaling was used to represent the relationships between the
accessions in three dimensions using MDSCALE module of Rohlf’s NTSYSpc Version 2.1. To evaluate goodness of fit of the ordination analysis to the original distance matrix, the cophenetic correlation was calculated using the MXCOMP function in NTSYSpc. The neighbor joining method was applied to estimate phylogeny from distance (1-Sij) matrix to obtain unrooted tree using NEIGHBOR programs from NTSYSpc. Version 2.1. The matrix correlation between geographic and genetic distance was estimated with Mantel’s test statistic Z, using the MXCOMP procedure of NTSYS.
AMOVA and Bayesian clustering were used to evaluate population subdivision based on coastal basins. The
distance matrices were used to construct an input file for AMOVA using Schneider’s Arlequin 2.0 software. The total variance was partitioned into variance among and within coastal basins.
Results
A total of 250 unambiguous AFLP bands were amplified using four selective primer combinations, with fragment size mostly ranging from 60 to 360 bp (Fig. 1). A small portion of the bands were between 360 to 530 bp. The primers generated an average of 62 bands per primer combination, ranging from 52 to 87 bands. The highest number of polymorphic fragments was produced by the primer combination M-CTT/E-ACC, while M-CTT/E-AGC yielded the fewest polymorphic fragments. Out of these bands, 186 or 74.4% were polymorphic at a species level. Polymorphic levels based on location (at population level) ranged from 55.2 to 62.8%. A good portion of the AFLP bands (61.2%) is common in the four coastal basins and 2% of the bands was considered unique; 0.4% unique to Barataria-Breton, Terrebonne, and Mermentau basin and 0.8% unique to Calcasieu basin. The Shannon’s information index (I) at a population level ranged from 0.28 to 0.32, and Nei’s gene diversity ranged from 0.18 (Mermentau) to 0.21 (Barataria-Breton). The number of migrants (Nm) was estimated at 2.92 migrants per generation. Phenetic Analysis
The Neighbor-Joining analysis showed no tight genetic clustering associated with basin origin (Figure 2). Genetic similarity index ranged from 0.699 to 0.928, with an average value of 0.803. Results from the PCA analysis showed that the 72 accessions were loosely distributed across the three dimensional plains, further corroborate the results from the Neighbor-Joining analysis. Unbiased measures of genetic distance among basins were weak, ranging from 0.0163 (Mermentau-Calcasieu) to 0.0812 (Terrebonne-Barataria), indicating no isolation by distance.

303
Likewise, the unbiased measures of identity among basin groups were high, ranging from 0.9677 (Mermentau-Terrebonne) to 0.9839 (Mermentau-Calcasieu). Coefficient population differentiation (Gst value) was low (0. 0671), suggesting a lack of association between geographical origin and population differentiation. Genetic Diversity
Based on estimated Nei’s parameters associated with genetic diversity, only 6.7% of total variation in allele frequencies was apportioned among basin groups. The average genetic diversity within coastal basins (Hs) was 0.20. Among the four coastal basins evaluated, S. alterniflora from Mermentau had the lowest genetic diversity (Hs=0.18). They also had the lowest polymorphic level. The highest genetic diversity was found among S. alterniflora from Barataria – Breton basin with Hs of 0.22. Habitat Restoration and Breeding Implications Results from this study suggest that maintaining high levels of genetic diversity for habitat restoration can be accomplished through the use of selected genotypes based on their genetic distance indexes. If populations to be developed without genetic data, an adequate number of S. alterniflora samples collected from a large area within each coastal basin will produce population that has a high level of genetic diversity. Should uniform policies regarding the use of planting materials be applied in coastal restoration and habitat restoration projects, the effective number of essential lines needed in a foundation population for planting purposes can directly be determined. For breeding purposes and other plant development, choosing for parental lines from several Louisiana coastal basins will not increase genetic variability among the progeny lines. Table 1. Proportion of AFLP alleles (%) commonly found in four, three, and two coastal Louisiana basins, or unique in one coastal Louisiana basin.
Unique and Common Alleles
Basin Proportion
(%) 1 Barataria-Breton 0.4 2 Terrebonne 0.4 3 Mermentau 0.4 4 Calcasieu 0.8 5 Barataria-Breton and Terrebonne 2.4 6 Barataria-Breton and Mermentau 0.0 7 Barataria-Breton and Calcasieu 2.4 8 Mermentau and Terrebonne 1.2 9 Calcasieu and Terrebonne 0.0 10 Calcasieu and Mermentau 1.2 11 Barataria-Breton, Mermentau, and Terrebonne 0.0 12 Barataria-Breton, Calcasieu, and Mermentau 2.4 13 Barataria-Breton, Calcasieu, and Mermentau 1.2 14 Calcasieu, Mermentau, and Terrebonne 0.4 15 Barataria-Breton, Calcasieu, Mermentau, and Terrebonne 61.2 16 Non-polymorphic alleles 25.6

304
Figure 1. DNA fingerprints of smooth cordgrass accessions from four Louisiana basins. Amplified fragment length polymorphism (AFLP) markers were produced through PCR reaction using a primer combination of E-ACT/M-CTA. Each lane represents one accession. Marker size standards were placed in the first, 8th, 15th, 22nd, 29th, 36th, 43rd, 50th, 57th, and 59th lanes were size standards.
400 364
350
300 255 204 200 145 100
50

305
Figure 2. Neighbor-Joining dendrogram of 72 Spartina alterniflora accessions from four Louisiana coastal basins based on the Nei and Li similarity index estimated from 186 AFLP markers. The scale bar represents Neighbor-Joining distance. (B-B = Barataria-Brenton; Cal = Calcaseau; Trb = Terrebonne; Mrm = Mermentau basin. An accession within a basin is identified by the number following the letters used to identify basin.

306
C
CC
CC
C
CC
C C
C
C
CC
C
CCC
MM
M
MM
M M
MMM
MM
M
M
MMM
M
T
T
T
T
T
T T
T
T
T
T
T
TTT
T
T T
B
B
B
B
BB
BB
B
BBB
B
B
B
BB
B
0.770.77
0.460.46R2R20.150.15
-0.16-0.16
-0.53-0.53-0.47-0.47
-0.32-0.32
-0.24-0.24
-0.05-0.05
0.220.22R1R1
R3R3
0.040.04
0.490.49
0.330.33
0.760.76
0.610.61
Figure 3. Principal coordinate plot of Spartina alterniflora genotypes for the three principal co-ordinates estimated with 250 AFLP markers, using Dice similarity matrix. (B=Barataria-Breton, C=Calcasieu, M=Mermentau, and T=Terrebonne accessions)

307
SEED-BASED PROPAGATION OF SMOOTH CORDGRASS
H.S. Utomo, I. Wenefrida, S. Harrison, and M. Materne
A seed-based Spartina alterniflora propagation method can expedite the establishment of vegetation over a large area quickly and economically. A large production of S. alterniflora seed is a prerequisite of successful aerial seeding. Through aerial seeding, a large-scale coastal marsh restoration and erosion control become possible. Capable of reaching marsh interiors most affected by erosion, the aerial seeding can deliver coastal plant materials to these sites not only for coastal marsh restoration but also for long-term maintenance of Louisiana saltmarsh systems. Current planting practices in the restoration project are both laborious and costly involving hand transplanting of sprigs, plugs, or potted saltmarsh plants. With seed, hundreds of acres can be planted aerially in a day at a fraction of the cost of current planting practices. The objectives of seed-based propagation studies conducted at the Rice Research Station are (1) to evaluate yield potential of a blend population consisting of a mixture of 13 genetically diverse and high seed-producing lines of S. alterniflora and (2) to determine seed production aspects, including germination rate, seed set, and seed storage requirement. Genetic Materials A 250 m2 polycross plot was established by planting a total of 169 plugs from 13 high seed-producing lines, VRES-1, VRES-2, VRES-3, VRES-4, VRES-5, VRES-6, VRES-7, VRES-8, VRES-9, VRES-10, VRES-11, VRES-12, and VRES-13. The plants were arranged randomly in 4- x 4-ft spacings to produce blend seed. These lines have an average seed set of 52%, ranging from 33 to 94%, with an average germination rate of 60%, ranging from 53 to 90%. The soil type was Crowley silt loam. Fertilization was done in the spring and summer using urea (46% N) at 165 lb/A rate. Plants were grown in permanent flood with an occasional drain for weed control. RoundUp (glyphosate) (1 qt/A) and Basagran (bentazon) (1 qt/A) were used to spray around or adjacent to the smooth cordgrass plants to control weeds. To control rust, Benlate (benomyl) was applied at the rate of 1 lb ai/A. Harvest Seed was hand harvested on November 11, 2006, prior to shattering by cutting the panicles. The panicles were stored under room temperature in plastic bags to provide 100% humidity for approximately 1 month to allow all seed to mature and shatter to obtain maximum harvest. The 2007 harvest was done on November 16. The seed is being cold stratified and no germination data has been obtained yet. Seed Treatment Cold stratification to break dormancy was conducted by storing the seed at 2oC in 100% humidity for 1 month. To minimize fungus contamination, seed were placed in a 13- x 18-in Ziploc bag to about 2/3 full, and 200 ml Vitavax solution (5 mg/L) was added to the bag to wet the seed. The excess of the Vitavax solution was removed and each bag was air tightly sealed. The treated seed was stored in the cooler with the temperature set to 2±1oC for 1 month. Seed was checked periodically for contamination. Seed Germination A standard germination test was carried out by placing 50 seeds in a Petri dish containing 8 ml of Vitavax solution (5 mg/L) layered with a filter paper. The seed was harvested in eight batches, and a random sample of 50 seeds from each batch was used in germination tests. The test was repeated three times. The seed was germinated in the incubator at 25oC for 14 days. Germination was recorded when the radicle emerged. Seed germination was determined based on an average value and expressed as percentage.

308
Results Significant seed yield improvement was obtained in 2006 (146.9 lb/A compared with 84.4 lb/A in 2005) (Fig. 1A). This difference was due mainly to the plant density. The population was significantly less dense in the first year of growth (2005) compared with that in the second year (2006). Fertile tiller density was higher in 2006 than in 2005 (Table 1). Both germination rate and percent seed set of blend population were higher for the seed harvested in 2005 (72.1% germination rate and 67.2% seed set) than that harvested in 2006 (60.7% germination rate and 50.4% seed set) (Fig. 1C). Though panicle weight and seed mass per panicle were higher in the first year, it was not significant. Stratified, nondormant seed from 2006 harvest produced visible shoots after 10 hours at 27oC. Initial root germination was visible at least 15 hours later. Time to 50% visible shoot germination was 20 to 25 hr at three temperature regimes of 27, 32, and 37oC. Time to 50% visible root germination was 30 hr at 27 and 32oC but was not observed until after 80 hr at 37oC. Upon 1-month cold stratification, a few seed started to germinate in the cold storage (2oC). As the time went on, more seed germinated in the storage. Seedling establishment of blend seed for both nongerminated and germinated seed remains high for a 6-month period of storage (Fig. 1D). However, its viability becomes rapidly deteriorated thereafter. We have identified a genotype (Line FF23) in which its seedling could be stored for 2 years in a cold storage without losing its viability (Fig. 1D). Line FF23 was transplanted in a bigger plot last year for further studies. Seeds of S. alterniflora can be obtained by harvesting the seeds from the wild. The amount of seeds that can be harvested, however, varies from one year to another depending on the climatic conditions affecting seed production. This study demonstrates that S. alterniflora can be cultivated under a freshwater environment similar to rice. Through cultivation of S. alterniflora, a steady supply of S. alterniflora seed and the size of the operation can easily be adjusted if a large amount of seed is needed. Since genetic materials to produce seed have gone through extensive testing, the performance of the resulting S. alterniflora population will be more predictable than that of the seeds collected from the wild. Compared with rice yield, a production of S. alterniflora seed (number of seeds per area) is about one fifth (Table 2). Table 1. Differences of seed biomass and selected seed components between consecutive growing seasons of S.
alterniflora blend population during fall 2005 and 2006. Reproductive Component
Year Seed biomass (kg/ha)
Fertile tiller density (/m2)
Panicle weight (g)
Seed mass per panicle (mg)
100-seed weight (mg)
2005 94.8** 7.2** 35.1 99.7 47.7*
2006 164.7 13.6 32.4 85.8 45.5
**,* Annual means significantly different at the 0.01 and 0.05 probability level, respectively.

309
Table 2. Seed production comparison between smooth cordgrass (Spartina alterniflora) and rice (Oryza sativa). Yield Area planted
Crop lb/A No. seed (million) Seeding rate (using seed harvested)
Smooth cordgrass 146.9 20.2 16 lb/A (2.2 seeds/A)
9.2 A
Rice 5800.0 106.3 120 lb/A (2.2 seeds/A)
48.3 A
Figure 1A. Seed production of S. alterniflora blend population harvested in 2005 and 2006. B. Composition of full seed, empty seed, and panicle mass based on their fresh weight. C. Average germination rates and seed sets from blend S. alterniflora population. D. Seedling viability of blend population and FF23 genotype in four periods of storage.

310
LOUISIANA RICE RESEARCH VERIFICATION PROGRAM - 20071
J.K. Saichuk and K.J. Landry
Introduction
The Louisiana Rice Research Verification Program (LRRVP) began in 1997 in three parishes: Allen, Calcasieu and Jeff Davis. In 1998, the program was funded and expanded to 10 parishes: Acadia, Avoyelles, Calcasieu, East Carroll, Evangeline, Jeff Davis, Madison, Morehouse, St. Landry and Vermilion. From 1999 to 2006, 81 fields were included in the verification program. In 2007, the program only included seven fields because one cooperator dropped out at the last minute (Figure 1). The fields were visited on at least a weekly basis by a specialist, county agent or the extension associate. Production practice recommendations were made by the specialist or agent. These recommendations included, but were not limited to, fertilization, weed control, disease control, insect control and water management to a limited degree. The fields were followed from planting to harvest. Yield data were collected for each of the fields (Table 1). Yields of the first crop averaged 7,662 lb/A (170 bu/A or 47 bbl/A) at 12 % moisture. This is the highest first crop yield average the program has ever achieved. Second crop was harvested in Jeff Davis and Vermilion parishes adding another 2,057 lb/A to the total for a final average of 7,728 lb/A (172 bu/A or 48 bbl/A). Economic data continue to reveal large production cost differences between growers. It is also clear that more needs to be done to help farmers reduce production costs (Table 2). The program continues to provide an accurate evaluation of current recommendations and provide insight into other areas of research. The educational value of the program to all concerned (farmers, researchers and extension personnel) increases each year.
__________________________________________________
1 This project is supported in part by funding provided by rice producers through their check-off contributions to the Louisiana Rice Research Board.

311
Figure 1. 2007 Louisiana Rice Research Verification Program Parishes.
West Carroll
East Carroll
Concordia
Avoyelles
St. LandryEvangeline
Jeff Davis
Vermilion

Table 1. 2007 Louisiana Rice Research Verification Program Yield Summary.
Parish Acres in
Verification Program
Verification Yield/A @ 12% Moisture
Verification Program Average Parish Yield1
Parish Acreage
Total Parish Production Total
Yield/A 1st Crop
Production Total
Production 1st Crop Alone Second Crop
Avoyelles 40.9 9187 0 9187 375,748 375,748 6966 12,800 89,164,800
Concordia 53.8 8680 0 8680 466,984 466,984 6750 9,805 66,183,750
East Carroll 23.0 7917 0 7917 182,091 182,091 7650 6,002 45,915,300 Evangeline – St. Landry 33.9 8122 0 8122 275,336 275,336 6349 36,475 231,579,775
Jeff Davis 38.9 5630 1821 7451 219,007 289,844 6480 66,500 430,920,000
Vermilion 36.6 6739 2307 9046 246,647 331,084 5832 48,699 284,012,568
West Carroll 40.2 7356 0 7356 295,711 295,711 7650 3,076 23,531,400
TOTAL 267.3 53,631 4128
Verif. Avg. Parish Avg. Difference
Average yield (lb/A) 7712 8293 6501 183,357 1792
312

313
Table 2. 2007 Louisiana Rice Research Verification Program Yield, Milling and Economic Summary.
Parish
Variety
Yield @ 12%
Moisture (cwt/A)1
Milling (% Whole / % Total)
Variable Costs ($/A)2
Cost of Production
($/cwt)2
Return on Variable
Costs ($/A)2,3
Avoyelles Cocodrie 9187 58.2 / 73.2 354.64 4.06 610.00
Concordia Cocodrie 8680 60.4 / 71.2 384.63 4.40 526.77
East Carroll CL171 7917 46.7 / 73.6 400.59 5.05 430.70
Evangeline – St. Landry XP723 8122 63.5 / 72.8 396.23 5.11 456.58
Jeff Davis Cocodrie 7451 62.9 / 71.9 551.27 6.51 231.08
Vermilion CL171 9046 57.0 / 74.6 528.10 5.83 421.73
West Carroll CL161 7356 64.2 / 71.5 346.57 4.70 425.81
1 - Figure includes ratoon crop yield. 2 - Costs captured are from land preparation to getting the crop to the truck. They do not include land rent, transporting, drying, storing or fixed costs. 3 - This value was obtained using a selling price of $10.50/cwt.

314
AVOYELLES PARISH
The field in Avoyelles Parish was laser leveled in 2006 but not put into production that year. This was the first time rice was grown on the field. It was set on zero grade so there were no internal levees in the field. The heavy red clay was plowed and grooved, producing an excellent seedbed into which Cocodrie seed was aerially sown. At about the two-tiller growth stage, symptoms of phosphorus deficiency began to appear. Symptoms were worse in the two adjacent fields, which were in their second year of rice production, than in the verification field. This is a problem first noticed several years before and now considered a regular occurrence on the heavy red clay soils of Avoyelles and Rapides parishes. These soils typically test high in phosphorus content yet require the addition of phosphorus postflood because the nutrient is apparently tied up by high calcium levels. These soils also require sulfur in some situations. When rice reached internode elongation (green ring), some areas in the field exhibited the aforementioned late-season sulfur deficiency symptoms. Instead of using urea as a topdressing we recommended 160 lb/A of a blend of urea and ammonium sulfate (33% N). Even though no sheath blight could be found just prior to split boot, an application of fungicide was made to protect the crop from smut and the sheath rot/narrow brown leaf spot complex experienced in 2006. One application of insecticide was applied when stink bugs remained at about 2/3 threshold for about 3 weeks. This application was based on experience rather than any published recommendation because there are no research data on long-term subthreshold stink bug populations on rice. Even though it is the opinion of the specialist, the application was warranted. A record 9,717 lb/A (60 bbl/A or 216 bu/A) at 16.8% moisture was harvested. When adjusted to 12%, the yield was 9,187 lb/A (56.7 bbl/A or 204 bu/A). The somewhat lower head rice yields were probably associated with the lower than recommended grain moisture at harvest.
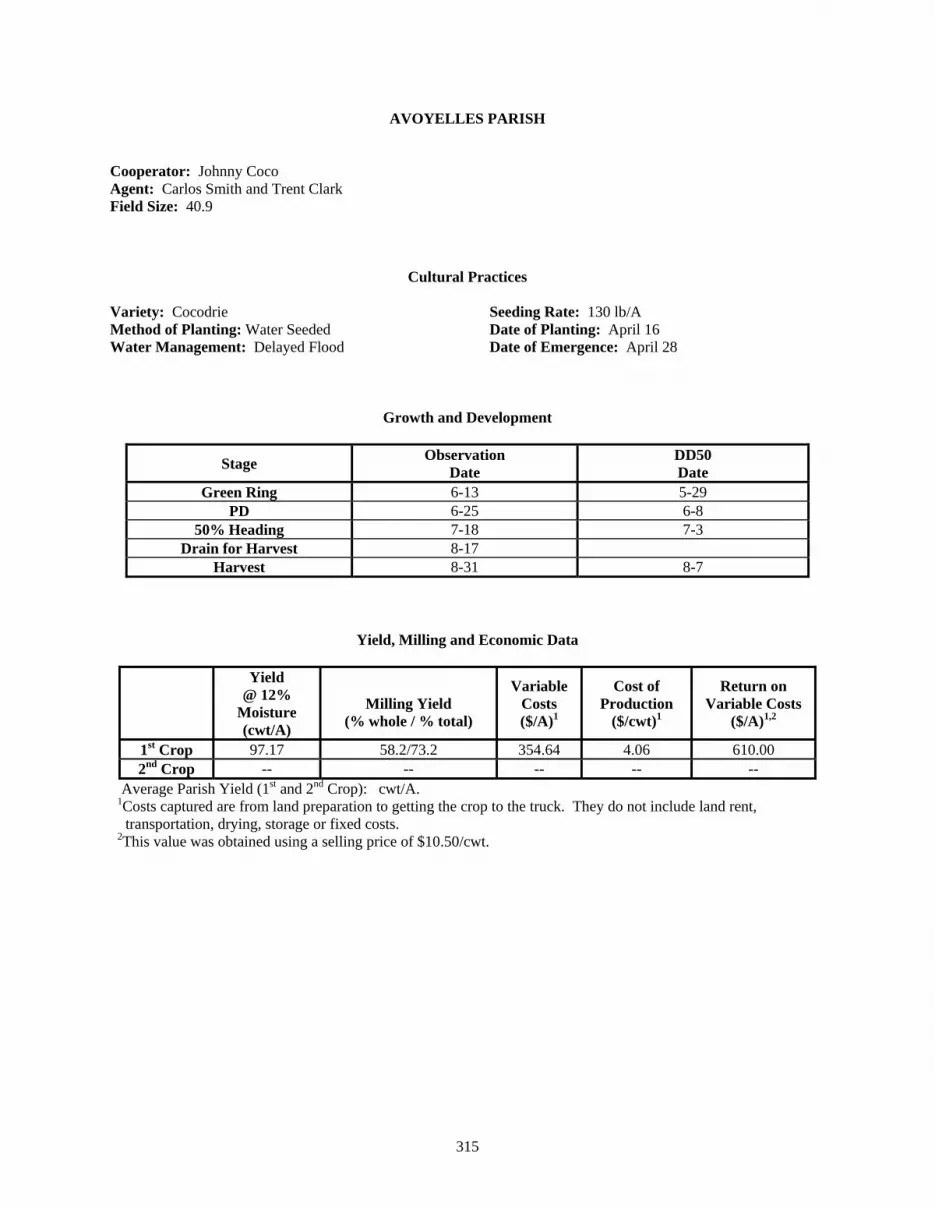
315
AVOYELLES PARISH Cooperator: Johnny Coco Agent: Carlos Smith and Trent Clark Field Size: 40.9
Cultural Practices Variety: Cocodrie Seeding Rate: 130 lb/A Method of Planting: Water Seeded Date of Planting: April 16 Water Management: Delayed Flood Date of Emergence: April 28
Growth and Development
Stage Observation Date
DD50 Date
Green Ring 6-13 5-29 PD 6-25 6-8
50% Heading 7-18 7-3 Drain for Harvest 8-17
Harvest 8-31 8-7
Yield, Milling and Economic Data
Yield
@ 12% Moisture (cwt/A)
Milling Yield
(% whole / % total)
Variable Costs ($/A)1
Cost of Production
($/cwt)1
Return on Variable Costs
($/A)1,2
1st Crop 97.17 58.2/73.2 354.64 4.06 610.00 2nd Crop -- -- -- -- --
Average Parish Yield (1st and 2nd Crop): cwt/A. 1Costs captured are from land preparation to getting the crop to the truck. They do not include land rent, transportation, drying, storage or fixed costs. 2This value was obtained using a selling price of $10.50/cwt.

316
Fertilization
Date
Source
Rate (lb/A)
N (lb/A)
P (lb/A) K (lb/A)
5-22 46-0-0-+ agrotain 200 92 6-1 0-46-0 50 23
6-14 33-0-0-12S 160 53
Total -- -- 145 23
Weed Management
Weeds Present Date of Treatment Decision Recommendation
Pigweed, Sprangletop, Barnyardgrass, Narrowleaf Aster,
Morningglory 5-9 1 gal Propanil
Morningglory, Sprangletop, Pigweed, Johnsongrass,
5-16 1 gal Duet
Disease Management
Diseases Present Date of Treatment
Decision
Recommendation (preventative) 7-5 14 oz Stratego
Insect Management
Insects Present Date of Treatment
Decision
Recommendation Rice Water Weevil 5-26 Karate
Rice Stink Bug 7-24 Karate

317
CONCORDIA PARISH In Concordia Parish, Cocodrie was drilled in a heavy clay soil on a slightly sloping but laser-smoothed field. Levees were pulled following drilling. Plastic irrigation tubing was used to both convey water to the field and flood it via gates installed in the tubing in each paddy. Flushing was not required because of timely rain. Shortly after emergence, Command herbicide injury was observed in the top paddy and, to some extent, in the second paddy as well. Most of this injury, though, obviously was expected to be cosmetic only. When the crop was ready for establishment of the permanent flood, a recommendation of Duet plus Permit to be followed by an application of 250 lb/A of urea and flood establishment was made. Two passes of the wrong herbicide were applied to the top and bottom of the field before the pilot could be alerted. Upon application of the recommended herbicide, the first four passes contained something that injured the crop severely. At harvest, we determined 2.2 acres of the 53.8 acres had been completely killed. Just prior to split boot, a mixture of Quadris and Quilt was applied as a preventative measure for false smut, kernel smut and the sheath rot/narrow brown leaf spot complex. This field is one of the few verification fields since the beginning of the program in 1997 that did not require an insecticide application to control stink bugs. We harvested our second highest yield of 2007 from this field. Yield was 9,029 lb/A (56 bbl/A or 201 bu/A) at 15.4% moisture. This converted to 8,680 lb/A (54 bbl/A or 193 bu/A) at 12% grain moisture. Had the 2.2 acres not been lost, the yield would have been 9,414 lb/A (58 bbl or 209 bu/A) at 15.4% the equivalent of 9,050 lb/A (56 bbl/A or 201 bu/A) at 12%. This would have set our all-time record for the verification program.

318
CONCORDIA PARISH Cooperator: Noble Guedon Agent: Glen Daniels Field Size: 53.8 Acres
Cultural Practices Variety: Cocodrie Seeding Rate: 100 lb/A Method of Planting: No-till Drill Date of Planting: March 30 Water Management: Delayed Flood Date of Emergence: April 9
Growth and Development
Stage Observation Date
DD50 Date
Green Ring 5-30 5-25 PD 6-15 6-5
50% Heading 6-28 6-28 Drain for Harvest 7-25
Harvest 8-22 8-2
Yield, Milling and Economic Data
Yield @ 12%
Moisture (cwt/A)
Milling Yield
(% whole / % total)
Variable Costs ($/A)1
Cost of Production
($/cwt)1
Return on Variable
Costs ($/A)1,2
1st Crop 86.80 60.4/71.2 384.63 4.40 526.77 2nd Crop -- -- -- -- --
Average Parish Yield (1st and 2nd Crop): cwt/A. 1 Costs captured are from land preparation to getting the crop to the truck. They do not include land rent, transportation, drying, storage or fixed costs. 2 This value was obtained using a selling price of $10.50/cwt.

319
Fertilization
Date
Source
Rate (lb/A)
N (lb/A)
P (lb/A)
K (lb/A)
3-7 9-15-27 Zn S 150 13.5 22.5 40.5 5-10 46-0-0 250 115 6-1 46-0-0 100 46
Total -- -- 174.5
Weed Management
Weeds Present Date of Treatment Decision Recommendation
-- 3-3 1 lb Roundup + .4 oz Harmony + Surfactant
-- 3-31 1.13 lb Roundup + 24.1 oz Command
Morningglory, Barnyardgrass, Soybean, Sedge, Johnsongrass,
Sesbania, Crabgrass
5-9 1 gal Duet + .75 Permit
Disease Management
Diseases Present Date of Treatment
Decision Recommendation
Sheath Blight/ Hist. of Smut 6-26 14 oz Quilt + 6 oz Quadris
Insect Management
Insects Present Date of Treatment
Decision Recommendation
Rice Water Weevil 5-17 Karate

320
EAST CARROLL PARISH The verification field in East Carroll Parish was one of two planted to CL171, a variety not yet receiving a recommendation from the LSU AgCenter; but because of its anticipated recommendation and the limited seed availability, we planted it with the intention of being able to give it a “real world” look. The farmer drilled the seed at the rate of 83 lb/A, a rate more than adequate considering the ideal seed bed. Because a cold front brought low temperatures to the state at the time of planting and because the soil was too dry for emergence, we recommended holding off on flushing until temperatures began to rise. A few days later we recommended flushing. A perfect stand resulted. Diammonium phosphate (0-46-0) was applied at the rate of 75 lb/A just ahead of the flush. Early phosphorus deficiency had been noted the year before in surrounding area. The initial application of Newpath plus Prowl was followed by Newpath plus Permit. By the end of the season, the field was still very clean. A hand application of 2,4-D was made to the levees to control hemp sesbania. Mustang Max was used to control rice water weevils shortly after establishment of permanent flood. A week prior to panicle differentiation (PD) sheath blight was picked up. This was the first field in the program in 2007 to show signs of heavy sheath blight pressure. When the crop reached late boot, an application of 14 ounces of Quilt plus 6 ounces of Quadris was made. The lower rate of Quilt and higher rate of Quadris were out of concern for the length of time protection from sheath blight would be needed. At harvest, very little sheath blight had come through the canopy. One application of methyl parathion was made to control stink bugs. The farmer harvested 8,206 lb/A (51 bbl/A or 182 bu/A) at 15.1% moisture, which translated to 7,917 lb/A (49 bbl/A or 176 bu/A) at 12% grain moisture. The disappointing head rice yields were in all likelihood a consequence of the low harvest moisture. This indicates that even though CL161 is one of the parents of this variety, it does not have the milling stability of CL161 at low moisture.

321
EAST CARROLL PARISH Cooperator: Ken Fairchild Agent: Donna Lee Field Size: 22.9 acres
Cultural Practices Variety: CL171 Seeding Rate: 83 lb/A Method of Planting: Drill Date of Planting: April 7 Water Management: Delayed Flood Date of Emergence: April 21
Growth and Development
Stage Observation Date
DD50 Date
Green Ring 6-7 6-1 PD 6-19 6-10
50% Heading 7-15 7-3 Drain for Harvest 8-2
Harvest 8-27 8-7
Yield, Milling and Economic Data
Yield @ 12%
Moisture (cwt/A)
Milling Yield (% whole / % total)
Variable
Costs ($/A)1
Cost of
Production ($/cwt)1
Return on Variable
Costs ($/A)1,2
1st Crop 79.17 46.7/73.6 400.59 5.05 430.70 2nd Crop -- -- -- -- --
Average Parish Yield (1st and 2nd Crop): cwt/A. 1 Costs captured are from land preparation to getting the crop to the truck. They do not include land rent, transportation, drying, storage or fixed costs. 2 This value was obtained using a selling price of $10.50/cwt.

322
Fertilization
Date
Source Rate (lb/A) N
(lb/A) P
(lb/A) K (lb/A)
4-28 18-46-0 75 14 35 5-16 46-0-0 240 110
46-0-0 120 55
Total -- -- 179 35
Weed Management
Weeds Present Date of Treatment Decision Recommendation
Sedge -- New Path 4 oz + Prowl Sesbania, Morningglory 5-15 New Path 4 oz +
1 oz Permit Sesbania 6-18 2,4-D
Disease Management
Diseases Present Date of Treatment
Decision
Recommendation Sheath Blight/Stem Rot 7-21 Quilt 14 oz + Quadris 6 oz
Insect Management
Insects Present Date of Treatment
Decision
Recommendation Rice Water Weevil 5-15 Mustang Max
Rice Stink Bug 7-19 Methyl Parathion

323
EVANGELINE – ST. LANDRY PARISH Dry seed of the hybrid XP723 were flown into a less than ideal seedbed at the rate of 30 lb/A. The specialist should have recommended against this and will in all future similar situations. Under ideal conditions, this method might have been successful, but the conditions were not ideal. This was further complicated by a cold front while trying to flush the field. Eventually, some parts of the field had to be replanted. As expected, the extended period of flushing and replanting compromised weed control. Conventional weeds were controlled with herbicides, but nothing could be done about red rice that emerged during the 2 to 3 weeks of alternately flooding and draining the field. This forced the farmer to abandon his intention of producing a second crop. A nearby recreational fish pond restricted the use of insecticide as a spray to control rice water weevils. Because all of the early-season nitrogen had already been applied, Mustang EW was impregnated on 100 pounds of potassium fertilizer. Potassium was chosen as the carrier because it was the cheapest fertilizer source at the time. Propiconazole fungicide was applied to prevent kernel smut, false smut and the sheath rot/narrow brown leaf spot complex. No sheath blight was observed prior to this fungicide application. Determining drain time on this field proved to be very difficult for several reasons. First, the hybrids in general tended to shatter, making early drain imperative. The tillering ability of the hybrids also spreads out the maturity of panicles within a single plant along with the field in general. Replanting a portion of the field only added more to the mix. Because the best rice was in the area not replanted, drain timing was biased to favor that portion of the field. The farmer harvested a very surprising 8,846 lb/A (55 bbl/A or 197 bu/A) at 19.2% grain moisture or 8,122 lb/A (50 bbl/A or 180 bu/A) at 12% moisture. There was some debate about the yield because of the difficulty encountered in the use of new truck scales. If anything, the yield was higher than we are reporting. Milling yield on this field was an exceptional 63.5/72.8% (head/total), the best in the verification program this year. Clearly, the hybrids must be harvested at high moisture to maximize both yield and milling. One can only wonder “what if” there had been a good stand to begin with and a second crop harvested as well.
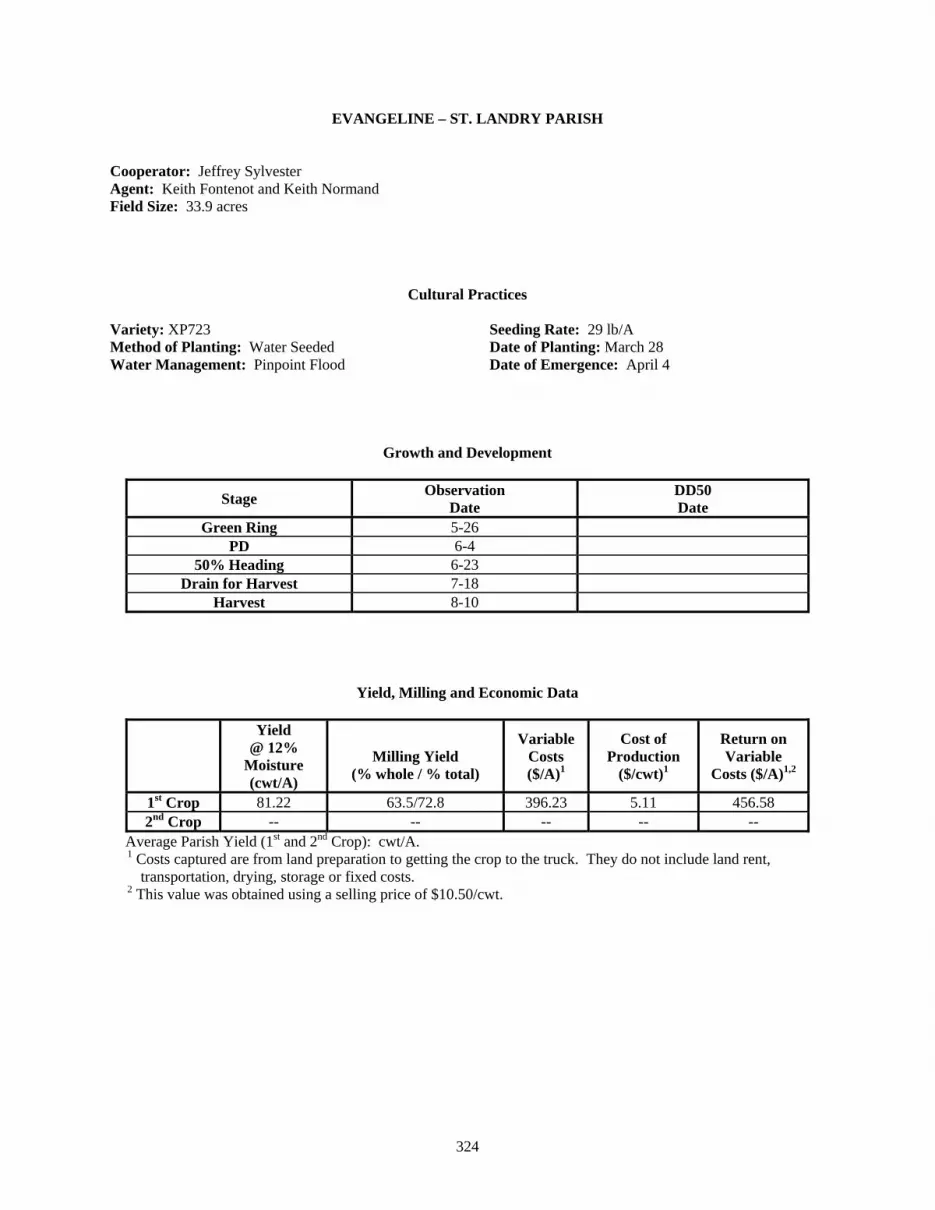
324
EVANGELINE – ST. LANDRY PARISH Cooperator: Jeffrey Sylvester Agent: Keith Fontenot and Keith Normand Field Size: 33.9 acres
Cultural Practices Variety: XP723 Seeding Rate: 29 lb/A Method of Planting: Water Seeded Date of Planting: March 28 Water Management: Pinpoint Flood Date of Emergence: April 4
Growth and Development
Stage Observation Date
DD50 Date
Green Ring 5-26 PD 6-4
50% Heading 6-23 Drain for Harvest 7-18
Harvest 8-10
Yield, Milling and Economic Data
Yield @ 12%
Moisture (cwt/A)
Milling Yield
(% whole / % total)
Variable Costs ($/A)1
Cost of Production
($/cwt)1
Return on Variable
Costs ($/A)1,2
1st Crop 81.22 63.5/72.8 396.23 5.11 456.58 2nd Crop -- -- -- -- --
Average Parish Yield (1st and 2nd Crop): cwt/A. 1 Costs captured are from land preparation to getting the crop to the truck. They do not include land rent, transportation, drying, storage or fixed costs. 2 This value was obtained using a selling price of $10.50/cwt.

325
Fertilization
Date
Source Rate (lb/A) N
(lb/A) P
(lb/A) K (lb/A)
5-8 46-0-0 50 23 5-8 18-46-0 100 18 46 5-12 0-0-60 100 60 6-9 46-0-0 115 53
Total -- -- 94 46 60
Weed Management
Weeds Present Date of Treatment Decision Recommendation
Knotgrass 5-7 15 oz Clincher + 1 pt Crop Oil
Sesbania, Cocklebur, Barnyardgrass, Sedge,
Alligatorweed, Morningglory, Eclipta
5-8 1 oz Londax + .25 oz Permit
Sedge 5-22 1 oz Permit
Disease Management
Diseases Present Date of Treatment
Decision Recommendation
-- 6-21 Propimax
Insect Management
Insects Present Date of Treatment
Decision Recommendation
Rice Water Weevil 5-12 Mustang Max + K20 Rice Stink Bugs 6-26 1 ½ pt Malathion

326
JEFF DAVIS PARISH By the time we visited the field in Jeff Davis Parish that had been chosen to be in the verification program, it was under a deep flood, thus difficult to evaluate in terms of seedbed or potential weed problems. In spite of this, we agreed to the farmer’s intentions of water seeding Cocodrie. It was obvious as soon as the field was drained following seeding that we had made an error. A heavy population of knotgrass, alligatorweed, mannagrass, roundleaf mud plantain and other weeds greeted us. Potential for red rice necessitated careful water management in conjunction with critical decisions concerning herbicides. Clincher was applied when rice was barely one leaf so a flood could be established to suppress red rice. Heavy rain and cold temperatures followed, necessitating an application of zinc chelate and delaying an application of herbicide to control the broadleaf weeds. The first application of nitrogen fertilizer was also applied during the brief drain interval between planting and reflooding. Once the rice had recovered and application of Londax plus Regiment was made. By the following week, excellent herbicide activity was observed on the weeds. Rice water weevils were detected and an insecticide application recommended. The next week the top paddy (in the center of the field with slope in two directions) was low on water while the bottom paddies had too much water in them. Herbicide injury to plants in the two bottom paddies caused us to recommend draining them. It was apparent later that water movement from the top paddy to the bottom paddies carried with it both nitrogen fertilizer and herbicide. We observed no herbicide injury in the top paddies, poorer weed control and nitrogen shortage in comparison with the bottom paddies, which suffered crop injury, excellent weed control and no nitrogen deficit. The uneven maturity, crop injury and nearby sensitive plants prevented a 2,4-D injury to the first crop. Clearly, it would have been beneficial particularly in alligatorweed control. This field had the heaviest stink bug pressure of all of the verification fields. It was sprayed three times to keep the numbers down. A disappointing 5,998 lb/A (37 bbl/A or 133 bu/A) at 17.7% moisture. When adjusted to 12% moisture, the yield was 5,630 lb/A (35 bbl/A or 125 bu/A). The field was immediately fertilized with nitrogen, flooded and 2,4-D was applied to produce a second crop. The second crop produced 1,821 lb/A (11.2 bbl/A or 40 bu/A) at 12% moisture. This brought the total for the field to 7,451 (46.0 bbl/A or 166 bu/A).

327
JEFF DAVIS PARISH Cooperator: Ronnie “Blue” Zaunbrecher Agent: Eddie Eskew Field Size: 38.9 acres
Cultural Practices Variety: Cocodrie Seeding Rate: 120 lb/A Method of Planting: Water Seeded (pre sprout) Date of Planting: March 29 Water Management: Pinpoint Flood Date of Emergence: April 3
Growth and Development
Stage Observation Date
DD50 Date
Green Ring 5-16 5-14 PD 5-23 5-25
50% Heading 6-13 6-19 Drain for Harvest 7-15
Harvest 8-6 7-24
Yield, Milling and Economic Data
Yield
@ 12% Moisture (cwt/A)
Milling Yield
(% whole / % total)
Variable Costs ($/A)1
Cost of Production
($/cwt)1
Return on Variable
Costs ($/A)1,2
1st Crop 56.30 62.9/71.9 464.95 8.26 126.20 2nd Crop 18.21 -- 86.31 4.74 104.90
Average Parish Yield (1st and 2nd Crop): cwt/A. 1 Costs captured are from land preparation to getting the crop to the truck. They do not include land rent, transportation, drying, storage or fixed costs. 2 This value was obtained using a selling price of $10.50/cwt.

328
Fertilization
Date Source Rate (lb/A) N (lb/A)
P (lb/A)
K (lb/A)
4-3 24-0-21 300 72 63 4-18 Zn .75 5-14 46-0-0 150 69
Total -- -- 141 63
Weed Management
Weeds Present Date of Treatment Decision Recommendation
Knotgrass, Alligatorweed, Mannagrass, Roundleaf Mud
Plantain
4-3 Clincher 15 oz/A + 1 qt Crop Oil
Alligatorweed, Roundleaf Mud Plantain
4-22 1 oz Londax + .5 oz Regiment + 2 gal UAN/100+Freeway
Disease Management
Diseases Present Date of Treatment
Decision Recommendation
Sheath Blight 6-15 19 oz Stratego
Insect Management
Insects Present Date of Treatment
Decision Recommendation
Rice Water Weevil 5-4 Mustang Max Rice Stink Bug 6-22 Karate Rice Stink Bug 6-28 Karate Rice Stink Bug 7-12 Karate

329
VERMILION PARISH The verification field in Vermilion Parish is the second of two planted to CL171, a variety not yet receiving a recommendation from the LSU AgCenter; but because of its anticipated recommendation and the limited seed availability, we planted it with the intention of being able to give it a “real world” look. The majority of this fall stale seedbed field did not require an application of burndown herbicide so we elected to omit it all together. Part of the decision was the knowledge that we would be able to apply Newpath herbicide shortly after planting. Only one weed persisted through all herbicide applications; the narrow-leaved aster. It is increasing throughout the rice growing area, especially in reduced tillage fields. Record cold weather moved into the area requiring the application of a shallow flood to the field to provide some protection to the young seedlings. This also delayed some of the herbicide application. Once the weather changed, we were able to complete our herbicide application and make an application of insecticide to control the rice water weevil. From there the crop took off. It looked outstanding. Fungicide was applied as a preventative to the narrow brown leaf spot/sheath rot complex. Insecticide was applied to control rice stink bugs. Frequent rain after draining the field delayed harvest. Percent moisture was checked by hand and found to be in the mid-20s one week and had dropped to 14% by the next week as soon as it stopped raining. This low grain moisture at harvest contributed to the low milling yields. The farmer reported this field had never produced more than 36 bbl/A. Looking at the field before the combines started harvesting we expected a yield in the middle to high 40s (bbl) per acre. Yield was 6,917 lb/A (43 bbl/A or 154 bu/A) at 14.3% moisture or 6,739 lb/A (42 bbl or 150 bu/A) at 12% grain moisture. At the request of the farmer, we agreed to allow him to flail mow the field. It was also fertilized and flooded immediately to produce a second crop. Second crop was harvested in standing water held for crawfish production. The no-till seedbed prevented the typical severe rutting of the field that would normally have been expected. Yield was 1,821 lb/A (11.2 bbl/A or 40 bu/A) at 12% moisture for a total of 7,451 lb/A (46 bbl/A or 166 bu/A). The farmer said this field had never produced more than 5,832 lb/A (36 bbl/A or 130 bu/A) before. Although panicle rice mites were detected in the second crop, there was apparently little effect on yield of the second crop.

330
VERMILION PARISH Cooperator: Christian Richard Agent: Howard Cormier Field Size: 36.6 acres
Cultural Practices Variety: CL171 Seeding Rate: 75 lb/A Method of Planting: No-till Drill Date of Planting: March 23 Water Management: Delayed Flood Date of Emergence: March 31
Growth and Development
Stage Observation Date
DD50 Date
Green Ring 5-17 5-17 PD 6-3 5-26
50% Heading 6-25 6-19 Drain for Harvest 7-13
Harvest 8-6 7-24
Yield, Milling and Economic Data
Yield @ 12 % Moisture (cwt/A)
Milling Yield
(% whole / % total)
Variable Costs ($/A)1
Cost of Production
($/cwt)1
Return on Variable
Costs ($/A)1,2
1st Crop 67.39 57.0/74.6 424.00 6.29 283.67 2nd Crop 23.07 -- 104.41 4.53 137.82
Average Parish Yield (1st and 2nd Crop): cwt/A. 1 Costs captured are from land preparation to getting the crop to the truck. They do not include land rent, transportation, drying, storage or fixed costs. 2 This value was obtained using a selling price of $10.50/cwt.

331
Fertilization
Date Source Rate (lb/A) N (lb/A)
P (lb/A) K (lb/A)
3-9 0-23-34 + S + Zn
250 58 85
4-18 46-0-0 180 83 5-16 46-0-0 125 58 8-8 46-0-0 160 74
Total -- -- 140 58 85
Weed Management
Weeds Present Date of Treatment Decision Recommendation Sedge, Narrow Leaved Aster,
Dock, Gratiola, Barnyardgrass, Broadleaf Signalgrass, Jointvetch
4-2 NewPath 4 oz + NIS
Sedge 4-16 NewPath 4 oz + Permit 1 oz + Londax .25 oz
Disease Management
Diseases Present Date of Treatment Decision Recommendation
(preventative) 6-12 Quilt 21 oz + Quadris 3 oz
Insect Management
Insects Present Date of Treatment Decision Recommendation
Rice Water Weevil 4-25 Mustang Max Rice Water Weevil 5-2 Mustang Max
Rice Stink Bug 6-27 Mustang Max

332
WEST CARROLL PARISH In West Carroll Parish, CL161 was drilled into heavy clay soil at 83 lb/A. Diammonium phosphate (DAP) was applied at the rate of 100 lb/A, and 4 oz of NewPath was sprayed just ahead of flushing. The DAP was applied because it was successful in the area in 2005. These are soils that will test high in phosphorus, but plants will exhibit early-season phosphorus deficiency. Even though it appears to be a transitory situation, the critical need for phosphorus early in the season warrants the application. Prowl herbicide was included in the first NewPath application because of the history of sprangletop. The only other herbicide applied was the second application of NewPath a couple of weeks later. Seventy percent of a total of 155 pounds of nitrogen was applied just ahead of initial flood establishment. Insecticide was applied shortly after flooding to control rice water weevils. A second application of Karate was made about 3 weeks later because rice water weevil adults were detected again. A nearby application of glyphosate to soybeans apparently drifted across the field between permanent flood establishment and green ring. Although it is impossible to estimate its effect on yield, it clearly delayed maturity. An application of fungicide was made to control sheath blight and to prevent both kernel smut and false smut. Rice stink bugs reached threshold values and an appropriate insecticide was applied.
The field produced 8,012 lb/A (50 bbl or 178 bu/A) at 19.2% moisture, which equates to 7,356 lb/A (45 bbl/A or 164 bu/A) at 12% grain moisture. Considering the yield potential of CL161, this was an outstanding yield.

333
WEST CARROLL PARISH Cooperator: Steve Rye Agent: Myrl Sistrunk Field Size: 40.2 acres
Cultural Practices
Variety: CL161 Seeding Rate: 83 lb/A Method of Planting: Drill Date of Planting: March 23 Water Management: Delayed Flood Date of Emergence: April 1
Growth and Development
Stage Observation Date
DD50 Date
Green Ring 5-31 5-27 PD 6-16 6-7
50% Heading 7-7 6-26 Drain for Harvest 7-30 -
Harvest 8-27 7-31
Yield, Milling and Economic Data
Yield @ 12%
Moisture (cwt/A)
Milling Yield
(% whole / % total)
Variable Costs ($/A)1
Cost of Production
($/cwt)1
Return on Variable
Costs ($/A)1,2
1st Crop 80.12 64.2/71.5 346.57 4.70 425.81 2nd Crop -- -- -- -- --
Average Parish Yield (1st and 2nd Crop): cwt/A. 1 Costs captured are from land preparation to getting the crop to the truck. They do not include land rent, transportation, drying, storage or fixed costs. 2 This value was obtained using a selling price of $10.50/cwt.

334
Fertilization
Date Source Rate (lb/A) N (lb/A)
P (lb/A) K (lb/A)
4-13 18-46-0 100 18 46 5-8 46-0-0 235 108 5-31 46-0-0 100 46
Total -- -- 172
Weed Management
Weeds Present Date of Treatment Decision Recommendation -- -- Touchdown
Barnyardgrass, History of Sprangletop
4-12 NewPath 4 oz + Prowl 2 1/3 pt
-- 5-7 NewPath 4 oz + Surfactant
Sesbania 6-14 2,4-D Levees
Disease Management
Diseases Present Date of Treatment Decision Recommendation
Sheath Blight/Hist. of Smut 6-26 Quilt 14 oz + Quadris 5 oz/A
Insect Management
Insects Present Date of Treatment Decision Recommendation
Rice Water Weevil 5-11 Karate Rice Water Weevil 5-24 Karate

335
Table 3. Ten-Year Louisiana Rice Research Verification Summary.
1998 Verification Acres and Yields Yield @ 12% Moisture Parish Acres Barrels/A Bushels/A Pounds/A Acadia* 53.0 32.8 118.1 5314 Avoyelles 32.5 42.9 154.4 6950 Calcasieu* 60.0 34.1 122.8 5524 East Carroll 33.9 41.1 148.0 6658 Evangeline 33.0 42.9 154.4 6950 Jeff Davis* 61.8 37.3 134.3 6043 Madison 36.6 39.0 140.4 6318 Morehouse 63.0 33.8 121.7 5476 St. Landry 37.1 38.2 137.5 6188 Vermilion 16.7 29.4 105.8 4763
TOTALS 427.6 37.2 133.7 6018.4 * Yields include second crop.
1999 Verification Acres and Yields Yield @ 12% Moisture Parish Acres Barrels/A Bushels/A Pounds/A Acadia* 31.1 37.4 134.6 6059 Avoyelles 32.5 46.6 167.8 7549 Calcasieu 49.3 34.6 124.6 5605 Catahoula 30.4 33.4 120.2 5411 East Carroll 36.1 47.0 169.2 7614 Evangeline 22.3 43.1 155.2 6982 Jeff Davis* 26.6 30.8 110.9 4990 Madison 38.1 39.0 140.4 6318 St. Landry 30.1 38.8 139.7 6286 Vermilion 23.8 36.5 131.4 5913
TOTALS 320.3 38.7 139.4 6272.7 * Yields include second crop.
2000 Verification Acres and Yields Yield @ 12% Moisture Parish Acres Barrels/A Bushels/A Pounds/A Acadia 53.3 39.4 141.8 6383 Avoyelles 63.2 36.7 132.1 5945 Calcasieu 22.1 25.1 90.4 4066 Catahoula 39.6 36.4 131.0 5897 East Carroll 45.1 49.1 176.8 7956 Evangeline 19.9 38.2 137.5 6188 Jeff Davis 30.6 26.7 96.1 4325 Morehouse 27.7 28.3 101.9 4585 St. Landry 70.7 39.2 141.1 6350 Vermilion* 21.6 37.7 135.7 6107
TOTALS 393.8 35.7 128.4 5780.2 * Yields include second crop.

336
Table 3. Continued.
2001 Verification Acres and Yields Yield @ 12% Moisture Parish Acres Barrels/A Bushels/A Pounds/A Acadia* 60.6 50.8 182.9 8230 Allen 41.6 35.1 126.4 5686 Avoyelles 63.2 38.1 137.2 6172 Calcasieu* 61.9 39.4 142.0 6388 Concordia 79.6 36.1 130.1 5853 Evangeline* 20.8 52.7 189.7 8538 Jeff Davis* 21.6 57.3 206.4 9289 Richland 65.9 46.0 165.5 7447 St. Landry* 40.6 51.1 184.0 8282 Vermilion* 33.3 52.4 188.7 8493
TOTALS 489.1 45.9 165.3 7437.8 * Yields include second crop.
2002 Verification Acres and Yields Yield @ 12% Moisture Parish Acres Barrels/A Bushels/A Pounds/A Acadia* 38.4 49.8 179.3 8068 Allen* 25.1 46.0 165.6 7452 Avoyelles 37.4 49.9 179.6 8084 Beauregard* 49.5 53.1 191.2 8602 Calcasieu* 41.4 42.4 152.6 6869 Concordia 67.6 48.2 173.5 7808 Evangeline 42.0 37.6 135.4 6091 Jeff Davis* 31.7 45.0 162.0 7290 Richland 35.8 42.1 151.5 6819 St. Landry 32.7 48.8 175.7 7906 Vermilion* 32.0 49.8 179.4 8072
TOTALS 433.6 46.6 167.8 7551.0 * Yields include second crop.
2003 Verification Acres and Yields Yield @ 12% Moisture Parish Acres Barrels/A Bushels/A Pounds/A Acadia 57.2 44.0 158.4 7128 Allen* 35.7 46.1 166.0 7469 Avoyelles 37.4 50.1 180.4 8116 Beauregard* 45.7 48.7 175.2 7884 Concordia 79.5 49.2 177.1 7970 Evangeline* 48.4 44.5 160.2 7209 Jeff Davis* 52.9 28.7 103.3 4649 Richland 40.2 44.7 160.8 7234 St. Landry* 32.7 61.1 220.0 9898 Vermilion* 33.0 40.0 144.0 6480 TOTALS 462.7 45.7 164.5 7403.7 * Yields include second crop.

337
Table 3. Continued.
2004 Verification Acres and Yields Yield @ 12% Moisture Parish Acres Barrels/A Bushels/A Pounds/A Allen* 53.2 40.9 147.1 6620 Avoyelles 33.3 32.8 118.0 5307 Beauregard* 21.8 42.5 153.3 6899 Concordia 82.3 36.0 130.0 5843 East Carroll 54.8 45.8 165.0 7427 Evangeline 30.7 34.8 125.2 5638 Jeff Davis* 42.3 38.5 138.6 6237 Natchitoches 47.2 44.1 158.8 7144 St. Landry* 60.1 65.1 234.3 10543 Vermilion* 30.0 42.1 151.6 6824
TOTALS 455.7 42.3 152.2 6848.2 *Yields include second crop.
2005 Verification Acres and Yields Yield @ 12% Moisture Parish Acres Barrels/A Bushels/A Pounds/A Acadia 28.9 39.6 143.8 6427 Allen 76.7 25.6 92.0 4140 Avoyelles 32.1 35.9 129.3 5819 Calcasieu 49.0 51.0 184.0 8282 Concordia 60.5 43.0 156.0 7003 East Carroll 30.4 47.9 172.7 7771 Evangeline 30.0 37.1 133.6 6014 Jeff Davis 39.2 32.5 117.0 5264 Natchitoches 30.0 43.3 156.0 7022 Richland 47.4 49.2 177.2 7974 St. Landry 61.7 47.5 170.9 7689 Vermilion 52.8 40.9 147.3 6631
TOTALS 538.7 41.1 148.3 6669.7 *Yields include second crop.
2006 Verification Acres and Yields Yield @ 12% Moisture Parish Acres Barrels/A Bushels/A Pounds/A Avoyelles 41.8 43.0 155.0 6972 Concordia 54.7 50.8 183.0 8237 East Carroll 60.4 44.5 150.0 7210 Evangeline 29.4 32.3 116.0 5227 Jeff Davis 21.5 43.8 157.8 6000 St. Landry 40.9 36.8 132.5 5962 Vermilion 29.6 37.0 133.3 7100 West Carroll 50.1 53.1 191.2 8603
TOTALS 328.4 43.4 156.4 7040 *Yields include second crop.

338
2007 Verification Acres and Yields Yield @ 12% Moisture Parish Acres Barrels/A Bushels/A Pounds/A Avoyelles 40.9 56.7 204 9187 Concordia 53.8 53.6 193 8680 East Carroll 23.0 49.0 176 7917 Evangeline – St. Landry 33.9 50.1 180 8122 Jeff Davis* 38.9 55.8 201 9046 Vermilion* 36.6 46.0 166 7451 West Carroll 40.2 45.4 164 7356
TOTALS 267.3 51.2 184 8293 *Yields include second crop
1998 - 2007 Verification Summary Verification Totals Verification Parish Totals
Year Acres Pounds/A Acres Pounds/A Verification - Parish 1998 427.6 6018.4 475,103 5052 966.4 1999 320.3 6272.7 444,015 5502 770.7 2000 393.8 5780.2 385,824 5620 160.2 2001 489.1 7437.8 412,286 5794 1643.8 2002 433.6 7551.0 412,630 5764 1787 2003 462.7 7403.7 327,843 5843 1560.7 2004 455.7 6848.2 311,606 5582 1266.2 2005 538.7 6669.6 402,759 6165 504.6 2006 328.4 7039.5 185,249 5644 1395.5 2007 267.3 8293.3 183,357 6501 1792
Totals 4117.2 6931.4 3,540,672 5746.7 1184.7

339
RICE WEED CONTROL
WEED MANAGEMENT IN HERBICIDE-RESISTANT/TOLERANT AND CONVENTIONAL RICE
E.P. Webster, S.L. Bottoms, J.B. Hensley, and J.S. Atwal
Introduction and Justification Weed control studies were conducted at the Rice Research Station and producer fields in south Louisiana in 2007. A total of 57 studies were established with a total of 3,000 research plots. These studies indicate that weed control in rice will continue to be more effective as new technologies and new herbicides become available to the producers. Many of these studies have been conducted over 2 to 3 years and have been completed. However, several of these studies have 1 year of data and need to be repeated to verify the results over time. This project continues to work on different application methods for products in drill- and water-seeded rice, and it continues to supply data for herbicide development and to aid in the expansion of current herbicide labels. The Use of Permit in Water-Seeded Rice Permit was applied at 0.5, 1.0, and 2.0 oz/A at 14, 7, and 0 days prior to planting (DPP) and 3 and 5 days after planting. The area was conventionally tilled prior to the initial herbicide application (14 DPP) and no other tillage was performed after initial application. The 0 DPP application was applied, and a seeding flood was immediately established. Pregerminated Trenasse rice was hand seeded after flood establishment, and the area was drained 24 hours after planting to allow for seedling establishment. Barnyardgrass, broadleaf signalgrass, and Indian jointvetch control and crop injury were evaluated. This research indicates that broad spectrum weed control was achieved with Permit applied at 0.5, 1.0, and 2.0 oz/A at 14 and 7 DPP. Rice injury was below 20% when Permit was applied at 0.5 and 1.0 oz/A. This research will be used for label support by reducing the plant back interval for Permit. Ducksalad Control in a Rice Production System A study was established to evaluate several broadleaf herbicides for control of ducksalad. The area was conventionally tilled and a seeding flood was established to simulate a water-seeded system. Rice was not seeded to eliminate any competition from rice with ducksalad. The initial flood was removed 48 hours after flooding, and herbicides with residual activity were applied 24 hours later as a preemergence application prior to ducksalad emergence. Two postemergence applications were applied. The first postemergence application was applied to ducksalad in the cotyledon stage, and the second application timing was applied when ducksalad reached the spoon stage. At each timing, the flood was removed to guarantee herbicide coverage. Command was applied as a preemergence application and prevented ducksalad emergence for approximately 2 weeks, and this delay in emergence would allow for rice stand establishment that would compete with ducksalad. Newpath provided control of ducksalad when applied at all timings. V-10142 applied preemergence provided excellent control of ducksalad for approximately 30 days after application. Herbicides that provided excellent postemergence activity were Regiment, Strada, and Grasp. Postemergence Grass Control with Command A study was established to determine the size of barnyardgrass, broadleaf signalgrass, and sprangletop that Command can control when applied postemergence. This research indicates Command applied postemergence at 13 oz/A with 1% v/v crop oil concentrate can control all three grasses evaluated when their stage of growth is in the 1- to 3-leaf stage. Control decreases when all three grasses reach the tillering stage. Rice yields also support the control data observed in this study.

340
Newpath and Beyond Application Rates and Timings for Use in Clearfield Rice This project has conducted over 100 field, greenhouse, and laboratory trials on the Clearfield rice production system. This project has focused on application timing and rate of Newpath, Clearpath, and Beyond to best control red rice and other weeds present in rice fields. With the rate change for Newpath, research was established to evaluate the use of Newpath at 12 oz/A applied over several application timings with or without the addition of 5 oz/A of Beyond. The results from this study indicate the most important factor for red rice control is the timing of Newpath. If the initial and sequential applications of Newpath are applied early to small actively growing red rice, control will approach 100%. However, if the applications of Newpath are delayed and larger red rice is present at the time of application, control will decrease, and this is also true with other weeds such as barnyardgrass, sprangletop, broadleaf signalgrass, etc. This research will continue to be evaluated in the next few years to better refine our recommendations in Louisiana for weed management decisions in a Clearfield rice production system. Evaluation of Herbicide Drift in Rice with Roundup, Ignite, Newpath, and Beyond Four studies were established to evaluate the impact of herbicide drift (Roundup, Ignite, Newpath, and Beyond) on the first crop and ratoon rice. All of the herbicides were applied at 0.125 and 0.0625 of the labeled use rate. The labeled rates for each herbicide were Roundup Weathermax at 22 oz/A, Ignite at 24 oz/A, Newpath at 4 oz/A, and Beyond at 5 oz/A. The application timings were 3-leaf to 1-tiller, panicle differentiation (PD), early boot, and 3 days prior to maturity. Roundup Weathermax (glyphosate): The early application timing resulted in more injury to rice compared with later applications, and 3-leaf rice or younger did not recover from this application. The PD and boot applications resulted in reduced injury; however, yield was reduced compared with the nontreated. These timings also resulted in small multiple heads per tiller and short flag leaves. The maturity application did not injure rice and yield was not reduced. Ignite (glufosinate): Ignite resulted in the least amount of damage from an injury and yield prospective. The injury was usually slight yellowing and some necrosis at the leaf margins. In most cases, within 10 to 14 days, the visual symptoms were no longer present. Newpath (imazethapyr): Observations were very similar to Roundup Weathermax. The early application timing resulted in more injury to rice compared with later applications, and 3-leaf rice or younger did not recover from this application. The PD and boot applications resulted in reduced injury; however, yield was reduced compared with the nontreated. These timings also resulted in small multiple heads per tiller and short flag leaves. The maturity application did not injure rice and yield was not reduced. Beyond (imazamox): Observations were very similar to Roundup Weathermax and Newpath. The early application timing resulted in more injury to rice compared with later applications, and 3-leaf rice or younger did not recover from this timing. The PD and boot applications resulted in reduced injury; however, yield was reduced compared with the nontreated. These timings also resulted in small multiple heads per tiller and short flag leaves. The maturity application did not injure rice and yield was not reduced. Fall Panicum Control A study was conducted off-station to evaluate control of fall panicum in drill-seeded rice. Newpath at 6 oz/A plus Prowl H20 or Command applied early postemergence provided good control of fall panicum for 30 days after treatment. Clincher applied postemergence to rice under a flooded situation also provided excellent control as a salvage treatment. Extension Activities This project is continuing to extend the findings from the weed management research programs in Louisiana to producers, agents, and consultants. An annual report is published every year in a timely manner in order to transfer research findings to the clientele of the state and the region. This project continues to establish research and demonstration projects at on-farm locations throughout the rice growing region. This project has done numerous on-farm calls to aid producers, agents, and consultants by making herbicide recommendations and to identify weeds, consult on herbicide failures, and identify herbicide drift problems. This is a summary of the research that was conducted in 2007. To see the complete weed control annual report, please go to http://www.agronomy.lsu.edu/weedscience/annualreports.asp.

341
S T A T I O N P E R S O N N E L
Steve Linscombe, Professor ------------------------------------------------------------------------------- Resident Coordinator Jodie R. Gautreaux Administrative Coordinator Kimberly G. Guidry Accounting Specialist Carol D. LeDoux Administrative Program Specialist Darlene M. Regan Administrative Coordinator Donna L. Sonnier Custodian S. Brooks Blanche, Assistant Professor/Research -------------------------------------------------------------- Rice Breeding Gabriel Anderson1 Research Associate Quentin J. Zaunbrecher2 Research Associate Michael D. Dronet, Research Farm Maintenance Manager ------------------------------------------------------------- Shop Rayford E. Ancelet Maintenance Repairer I A. Todd Cormier3 Maintenance Repairer I Harold J. Doucet Maintenance Repairer Master Joshua P. Regan4 Maintenance Repairer I Richard T. Dunand5, Professor ----------------------------------------------------------------------------------- Rice Physiology Raymond R. Dilly, Jr. Research Associate Donald E. Groth, Professor/Research Coordinator ----------------------------------------------------------- Rice Pathology Marty J. Frey (25%) Research Associate Joseph Nugent Research Farm Specialist II Xin Hua Wang Research Associate Dustin Harrell, Assistant Professor ------------------------------------------------------ Rice Agronomy/Rotational Crops James P. Leonards Research Associate Ronald P. Regan Research Associate Douglas M. Walker Research Associate William J. Leonards, Jr., Research Associate/Coordinator/Manager ------------------------------ Farm Management Brian D. Broussard Research Farm Specialist II Paul A. Miller6 Research Farm Assistant II Timothy C. Miller Research Farm Supervisor Jimmy D. Pellerin Research Farm Specialist II Ronald J. Pellerin Research Farm Manager I Thomas J. Reed Research Farm Specialist II A. Rashad Shamsie7 Research Farm Specialist II ____________________________________ 1 Resigned 09/30/07. 2 Appointed 09/12/07. 3 Appointed 04/09/07. 4 Appointed 11/12/07. 5 Retired 01/02/08. 6 Appointed 02/19/07. 7 Resigned 02/15/07.

342
S T A T I O N P E R S O N N E L (Continued)
Steven D. Linscombe, Professor ------------------------------------------------------------------------------------ Rice Breeding Karen F. Bearb Research Associate Corey A. Conner Research Associate Herman L. Hoffpauir Research Farm Specialist II Laura E. Leonards8 Research Farm Assistant I Brent W. Theunissen Research Associate Mona M. Meche, Research Associate ------------------------------------------ Rice Anther Culture/Tissue Culture Jennifer Dronet Research Farm Assistant II Xue Jin Research Farm Specialist I Christie Louvier Research Farm Assistant II W. Ray McClain, Professor ------------------------------------------------------------------------------------------- Aquaculture John J. Sonnier Research Farm Specialist II
Ricardo Ramalho9, 10 Visiting Scientist John K. Saichuk, Professor -------------------------------------------------------------------------- Rice Agronomy/Extension Kim Landry11 Extension Associate Xueyan Sha, Assistant Professor ----------------------------------------------------------------------------------- Rice Breeding Blake J. Henry12 Research Farm Specialist II Shane J. Theunissen Research Associate Michael J. Stout (Baton Rouge) --------------------------------------------------------------------------------------- Entomology Marty J. Frey, Research Associate (75%) Herry Utomo, Assistant Professor/Research --------------------- Marker-Assisted Selection Breeding/Biotechnology Anna L. McClain Research Farm Specialist II Jennifer L. Nash13 Research Associate
Sigit Mujiharjo14 Visiting Scientist Ida Wenefrida, Post Doctoral Researcher ----------------------------------------------------------------------- Biotechnology Lawrence M. White, III, Research Associate ---------------------------------------------------------- Foundation Seed Rice The Rice Research Station is especially indebted to the Agricultural Chemistry Division of Louisiana for the chemical analyses of research samples and to the Department of Experimental Statistics for their help in planning of experimental designs and statistical analyses of research data. _____________________________________ 8 Appointed 11/12/07. 9 Appointed 03/22/07. 10 Resigned 06/21/07. 11 Appointed 03/26/07. 12 Appointed 01/02/07. 13 Resigned 01/04/08. 14 Resigned 08/02/07.
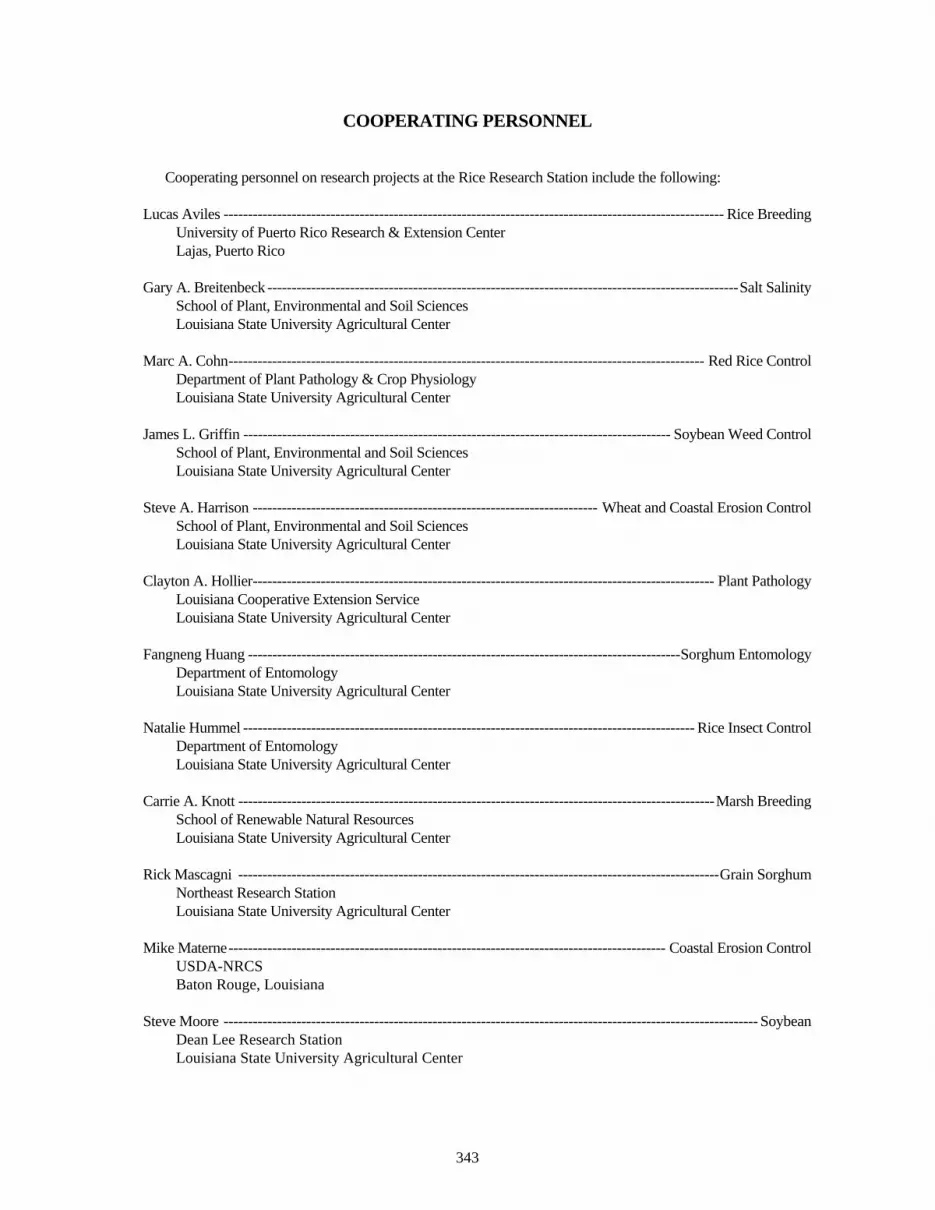
343
COOPERATING PERSONNEL Cooperating personnel on research projects at the Rice Research Station include the following: Lucas Aviles ------------------------------------------------------------------------------------------------------- Rice Breeding University of Puerto Rico Research & Extension Center Lajas, Puerto Rico Gary A. Breitenbeck ------------------------------------------------------------------------------------------------- Salt Salinity School of Plant, Environmental and Soil Sciences Louisiana State University Agricultural Center Marc A. Cohn -------------------------------------------------------------------------------------------------- Red Rice Control Department of Plant Pathology & Crop Physiology Louisiana State University Agricultural Center James L. Griffin ---------------------------------------------------------------------------------------- Soybean Weed Control School of Plant, Environmental and Soil Sciences Louisiana State University Agricultural Center Steve A. Harrison ----------------------------------------------------------------------- Wheat and Coastal Erosion Control School of Plant, Environmental and Soil Sciences Louisiana State University Agricultural Center Clayton A. Hollier ----------------------------------------------------------------------------------------------- Plant Pathology Louisiana Cooperative Extension Service Louisiana State University Agricultural Center Fangneng Huang ----------------------------------------------------------------------------------------- Sorghum Entomology Department of Entomology Louisiana State University Agricultural Center Natalie Hummel --------------------------------------------------------------------------------------------- Rice Insect Control Department of Entomology Louisiana State University Agricultural Center Carrie A. Knott -------------------------------------------------------------------------------------------------- Marsh Breeding School of Renewable Natural Resources Louisiana State University Agricultural Center Rick Mascagni --------------------------------------------------------------------------------------------------- Grain Sorghum Northeast Research Station Louisiana State University Agricultural Center Mike Materne ------------------------------------------------------------------------------------------ Coastal Erosion Control USDA-NRCS Baton Rouge, Louisiana Steve Moore -------------------------------------------------------------------------------------------------------------- Soybean Dean Lee Research Station Louisiana State University Agricultural Center

344
COOPERATING PERSONNEL (Continued)
James H. Oard ------------------------------------------------------------------------------------------------------ Rice Genetics School of Plant, Environmental and Soil Sciences Louisiana State University Agricultural Center Anthony Rivera ---------------------------------------------------------------------------------------------------- Rice Breeding University of Puerto Rico Research & Extension Center Lajas, Puerto Rico Robert Romaire -------------------------------------------------------------------------------------------------------Aquaculture Aquaculture Research Station Louisiana State University Agricultural Center Milton C. Rush ----------------------------------------------------------------------------------------------------- Rice Diseases Department of Plant Pathology & Crop Physiology Louisiana State University Agricultural Center Brian Scheffler --------------------------------------------------------------------------------------------------- Plant Genomics USDA-ARS MSA Genomics Laboratory Stoneville, Mississippi Raymond W. Schneider -------------------------------------------------------------------------------------- Soybean Diseases Department of Plant Pathology & Crop Physiology Louisiana State University Agricultural Center Michael Stout ------------------------------------------------------------------------------------------------ Rice Insect Control Department of Entomology Louisiana State University Agricultural Center Eric Webster ------------------------------------------------------------------------------------------------------- Weed Control School of Plant, Environmental and Soil Sciences Louisiana State University Agricultural Center Bill Williams ------------------------------------------------------------------------------------------------------- Weed Control Northeast Research Station Louisiana State University Agricultural Center E. Allen Wilson ----------------------------------------------------------------------------------------------------- Bird Control USDA Animal Damage Control Crowley, Louisiana