lsu digital commons
TRANSCRIPT
Louisiana State UniversityLSU Digital Commons
LSU Historical Dissertations and Theses Graduate School
2000
The Effects and Mechanism of Action ofCimetidine on Inducible Nitric Oxide SynthaseUsing an Equine Soft-Tissue Inflammation Model.Robert Paul HunterLouisiana State University and Agricultural & Mechanical College
Follow this and additional works at: https://digitalcommons.lsu.edu/gradschool_disstheses
This Dissertation is brought to you for free and open access by the Graduate School at LSU Digital Commons. It has been accepted for inclusion inLSU Historical Dissertations and Theses by an authorized administrator of LSU Digital Commons. For more information, please [email protected].
Recommended CitationHunter, Robert Paul, "The Effects and Mechanism of Action of Cimetidine on Inducible Nitric Oxide Synthase Using an Equine Soft-Tissue Inflammation Model." (2000). LSU Historical Dissertations and Theses. 7201.https://digitalcommons.lsu.edu/gradschool_disstheses/7201
INFORMATION TO USERS
This manuscript has been reproduced from the microfilm master. UMI films the text directly from the original or copy submitted. Thus, some thesis and dissertation copies are in typewriter face, while others may be from any type of computer printer.
The quality of th is reproduction is dependent upon the quality of the copy subm itted. Broken or indistinct print, colored or poor quality illustrations and photographs, print bleedthrough, substandard margins, and improper alignment can adversely affect reproduction.
In the unlikely event that the author did not send UMI a complete manuscript and there are missing pages, these will be noted. Also, if unauthorized copyright material had to be removed, a note will indicate the deletion.
Oversize materials (e.g., maps, drawings, charts) are reproduced by sectioning the original, beginning at the upper left-hand comer and continuing from left to right in equal sections with small overlaps.
Photographs included in the original manuscript have been reproduced xerographically in this copy. Higher quality 6" x 9’ black and white photographic prints are available for any photographs or illustrations appearing in this copy for an additional charge. Contact UMI directly to order.
Bell & Howell Information and Learning 300 North Zeeb Road, Ann Arbor, Ml 48106-1346 USA
800-521-0600
Reproduced with permission of the copyright owner. Further reproduction prohibited without permission.

Reproduced with permission of the copyright owner. Further reproduction prohibited without permission.
THE EFFECTS AND MECHANISM OF ACTION OF CIMETIDINE ON INDUCIBLE NITRIC OXIDE SYNTHASE USING AN EQUINE SOFT-TISSUE INFLAMMATION
MODEL
A Dissertation
Submitted to the Graduate Faculty of the Louisiana State University and
Agricultural and Mechanical College in partial fulfillment o f the
requirements for the degree of Doctor of Philosophy
in
The Interdepartmental Program in Veterinary Medical Sciences through the
Department of Veterinary Physiology, Pharmacology, and Toxicology
byRobert Paul Hunter
B.S., Angelo State University, 1987 M.S., Texas A&M University, 1989
May, 2000
Reproduced with permission of the copyright owner. Further reproduction prohibited without permission.
UMI Number: 9979265
UMIUMI Microform9979265
Copyright 2000 by Bell & Howell Information and Learning Company. All rights reserved. This microform edition is protected against
unauthorized copying under Title 17, United States Code.
Bell & Howell Information and Learning Company 300 North Zeeb Road
P.O. Box 1346 Ann Arbor, Ml 48106-1346
Reproduced with permission of the copyright owner. Further reproduction prohibited without permission.
DEDICATION
I would like to dedicate the following manuscript to the three people who made it
possible. First, my wife Trisha (SB), the woman who has always been there for me and
understood when I was not The two other people are my sons Mark and Brandon. Someday
they may read this and understand a little more about what their Dad was doing while we lived
in Baton Rouge and Gretna.
ii
Reproduced with permission of the copyright owner. Further reproduction prohibited without permission.
ACKNOWLEDGEMENTS
There are many people that gave their time, talents, and assistance to this project and
deserve credit The first is my wife Trisha for supporting and encouraging me to return to
school and also for supporting our family during the last 4 Vi years. I would also like to thank
my sons, Mark and Brandon, for being as understanding as they could be when we just could
not do some things.
I would like to thank Drs. Diana Gala- and Bob Ronfeid of Pfizer Central Research.
They excepted a proposal presented to them in the Summer of 1994 that allowed me to return to
school and pursue a Ph.D. Their financial support o f my education made this dissertation
possible.
My advisor has also been a guiding force during my career here at LSU. I came to the
School of Veterinary Medicine at LSU to work specifically with Dr. Charles R. Short. Even
though our original project idea and plans did not become funded, I feel that we ended up with a
much more interesting set o f studies. Dr. Short, your guidance has been invaluable.
My Graduate committee has also been instrumental in this research project Dr. Steven
Kamerling has provided countless hours of insight and advice about study design and
pharmacology that I greatly needed and will always appreciate. Dr. C.S. Venugopal, alias Dr.
Ven, has also allowed me to increase my knowledge o f pharmacology in an environment that
promoted learning. Dr. Michael Myers, CVM/FDA, provided essential laboratory analysis for
the cytokine assays that would have required an additional dissertation if I had had to develop
these bioassays on my own. I just wish we could have met face to face o n c e before my
general exam. Also, even though he was not a member of my committee, I would like to thank
Dr. Dale Goad for his advise and assistance with the Western Blot experiments.
Ill
Reproduced with permission of the copyright owner. Further reproduction prohibited without permission.
Mike Keowen, the horse man, and Catherine Koch made the animal studies the easiest
they could have been and without their help, much of the data could not and would not, have
been collected. The same applies to Miss Allison Dees, a friend and student worker, who joined
our lab in the Fall of 1998. Her help, library work, and weekend hours made much of the
sample collection and data analysis possible.
Long time friend Lynn Friedlander should also be thanked. She and her husband, Dr.
Tim, provided room and board while I was in Washington, D.C. working at FDA.
iv
Reproduced with permission of the copyright owner. Further reproduction prohibited without permission.
TABLE OF CONTENTS
DEDICATION.................................................................................................................................ii
ACKNOWLEDGMENTS...................................... .-..................................................................... iii
LIST OF TABLES........................................................................................................................vii
LIST OF FIGURES......................................................................................................................viii
ABSTRACT....................................................................................................................................xi
CHAPTER 1. LITERATURE REVIEW...................................................................................... 11.1. Inflammation.................................................................................................................... 2
1.1.a. Cytokines........................................................................................................... 31.1. b. Prostaglandin E2 ................................................................................................ 61.1.c. Histamine......................................................................................................... 101.1.d. Nitric Oxide...................................................................................................... 121.1.e. Models o f inflammation...................................................................................14
1.2. Histamine type 2-receptor antagonists...........................................................................191.3. Nitric Oxide Synthase (NOS)........................................................................................ 26
1.3.a. Inducible NOS................................................................................................. 291.3.b. L-Arginine & NO metabolism.........................................................................301.3.c. Methods of Analysis........................................................................................321.3.d. Similarities between NOS and CY P............................................................... 341.3.e. Inhibition o f N O S............................................................................................35
CHAPTER 2. HYPOTHESES.................................................................................................... 39
CHAPTER 3. CIMETIDINE INHIBITS NITRIC OXIDE ASSOCIATED NITRATEPRODUCTION IN A SOFT-TISSUE INFLAMMATION MODEL IN THE HORSE...............................................................................................................41
3.1. Introduction.................................................................................................................... 413.2. Materials & Methods..................................................................................................... 44
3.2.a. Trial 1 ................................................................................................................443.2.b. Trial 2 ................................................................................................................473.2.c. Assays................................................................................................................ 48
3.3. Results............................................................................................................................. 563.3.a. Trial 1 ................................................................................................................ 563.3.b. Trial 2 ................................................................................................................ 64
3.4. Discussion.......................................................................................................................70
CHAPTER 4. MECHANISM OF CIMETIDINE AND AMINOGUANIDINEINTERACTION WITH HEPATIC MICROSOMES AND EQUINE LEUKOCYTE PROTEIN..................................................................................77
4.1. Introduction.................................................................................................................... 774.2. Materials & Methods..................................................................................................... 79
4.2.a. Experiment 1 .....................................................................................................79
v
Reproduced with permission of the copyright owner. Further reproduction prohibited without permission.
4.2.b. Experiment 2 .....................................................................................................804.2.c. Experiment 3 ..................................................................................................... 804.2.<L Experiment 4 .....................................................................................................824.2.e. Experiment 5 ..................................................................................................... 844.2.f. Experiment 6 ...................................................................................................... 85
4.3. Results............................................................................................................................ 8 64.3.a. Experiment 1 ..................................................................................................... 8 64.3.b. Experiment 2 ..................................................................................................... 874.3.c. Experiment s .....................................................................................................934.3.A Experiment 4 .....................................................................................................964.3.e. Experiment 5 ..................................................................................................... 994.3.f. Experiment 6 ......................................................................................................99
4.4. Discussion.................................................................................................................... 100
CHAPTER 5. SUMMARY CONCLUSIONS......................................................................... 109
REFERENCES............................................................................................................................119
VITA............................................................................................................................................ 153
vi
Reproduced with permission of the copyright owner. Further reproduction prohibited without permission.
LIST OF TABLES
3.1. Concentration o f NO3' at 4, 8 , and 12 h after carrageenan instillation in plasma and TCF from Trial 1 ........................................................................................................................... 58
3.2. Median and range of plasma and TCF N 0 3* AUCs from Trial 1........................................60
3.3. Median and range of leukocyte AUCs in blood and TCF from Trial 1 .............................. 61
3.4. TCF albumin and total protein AUC values from Trial 1................................................... 65
3.5. Median and range of significant TCF IL-1 & IL-6 AUCs.................................................. 65
3.6. TCF concentrations o f PGE2 (ng/mL) after carrageenan instillation from Trial 1........... 69
3.7. AUCs and concentration of N 03‘ after carrageenan instillation in plasma and TCF from Trial 2..................................................................................................................................... 69
vii
Reproduced with permission of the copyright owner. Further reproduction prohibited without permission.
LIST OF FIGURES
1.1. The structure o f several Hz-raceptor antagonists................................................................24
1.2. Reaction o f L-Arg catalyzed by NOS to L-citrulline and N O ............................................28
3.1. Diagram o f relationship between dosing (A) of NaCl, CIM, or AG, instillation of carrageenan into the test chamber (•), and sampling o f TCF and plasma (x) forTrial 1................................................................................................................................... 46
3.2. Mean (± SD) plasma NO3' concentrations following NaCl, CIM, or AG treatment from Trial 1. NaCl, CIM (3 mg/kg), and AG (2S mg/kg) were administered at -I, -0.5 and 0 days.......................................................................................................................................57
3.3. Mean (± SD) TCF NO3' concentrations following NaCl, CIM, or AG treatment from Trial 1. NaCl, CIM (3 mg/kg), or AG (25 mg/kg) were administered at -1, -0.5 and 0 days...................................................................................................................................... 57
3.4. Mean (±SD) TCF neutrophil concentrations following NaCl, CIM, or AG treatment in Trial 1. NaCl, CIM (3 mg/kg), or AG (25 mg/kg) were administered at -1, -0.5 and 0 days...................................................................................................................................... 62
3.5. Mean (±SD) TCF monocyte concentrations following NaCl, CIM, or AG treatment in Trial 1. NaCl, CIM (3 mg/kg), or AG (25 mg/kg) were administered at -1, -0.5 and 0 days...................................................................................................................................... 62
3.6. Mean (±SD) TCF lymphocyte concentrations following NaCl, CIM, or AG treatment in Trial 1. NaCl, CIM (3 mg/kg), or AG (25 mg/kg) were administered at -1, -0.5 and 0 days...................................................................................................................................... 63
3.7. Mean (±SD) TNF-o. activity concentrations in TCF from Trial 1. NaCl, CIM (3 mg/kg),or AG (25 mg/kg) were administered at -1, -0.5 and 0 days.............................................6 6
3.8. Mean (±SD) IL-1 activity concentrations in TCF from Trial 1. NaCl, CIM (3 mg/kg), orAG (25 mg/kg) were administered at -1, -0.5 and 0 days.................................................. 6 6
3.9. Mean (±SD) IL- 6 activity concentrations in TCF from Trial 1. NaCl, CIM (3 mg/kg), orAG (25 m^kg) were administered at -1, -0.5 and 0 days.................................................. 67
3.10. Mean (± SD) plasma and TCF N 03~ concentrations following NaCl and CIM treatment from Trial 2. NaCl or CIM ( 6 mg/kg) were administered every 8 h from -2 to 0 days...67
3.11. Mean (± SD) plasma and TCF AG and CIM concentrations from Trials 1 and 2. CIM (3mg/kgX or AG (25 mg/kg) were administered at -1, -0.5 and 0 days for Trial I and CIM (6 mg/kg) was administered every 8 h from -2 to 0 days in Trial 2 ..................................6 8
viii
Reproduced with permission of the copyright owner. Further reproduction prohibited without permission.
4.1. Structure of 5-riitroso-A/-«cetyl-D,L-penicill*mine (SNAP) and dietfaylamine(DEA/NO)........................................................................................................................... 86
4.2. The Type II difference spectra for concentrations of cimetidine in rat hepatic microsomes......................................................................................................................... 88
4.3. The difference spectra for concentrations o f ranitidine in rat hepatic microsomes..........89
4.4. The difference spectra for concentrations o f zaltidinc in rat hepatic microsomes............89
4.5. The Type II difference spectra for concentrations of histamine in rat hepatic microsomes......................................................................................................................... 90
4.6. The difference spectra for aminoguanidinc in rat hepatic microsomes.............................90
4.7. The difference spectra for hexobarbital in rat hepatic microsomes.................................. 91
4.8. Difference spectra of equine hepatic microsomes with various concentrations of cimetidine............................................................................................................................ 91
4.9. The Type II difference spectra for various concentrations of histamine in equine hepatic microsomes......................................................................................................................... 92
4.10. The Type I difference spectra for various concentrations o f aminoguanidine in equine hepatic microsomes............................................................................................................. 92
4.11. The Type I difference spectra for hexobarbital in equine hepatic microsomes.................93
4.12. Scan o f equine leukocyte preparation before and after reduction with dithionite..............94
4.13. Difference spectra of equine leukocyte preparation reduced with either NADPH or dithionite..............................................................................................................................94
4.14. Difference spectra of an equine leukocyte preparation incubated with cimetidine........... 95
4.15. Difference spectra for histamine in an equine leukocyte preparation................................95
4.16. Difference spectra for aminoguanidine in an equine leukocyte preparation......................96
4.17. Difference spectra for hexobarbital in an equine leukocyte preparation............................96
4.18. Western blot o f equine hepatic microsome and leukocyte preparations, without protease inhibitors, using a murine iNOS antibody. Equine cultured chondrocytes are shown as a positive control following vehicle (veh.) or lipopolysaccharide (LPS) treatment ( tr t) .....98
4.19. Western blot o f equine leukocyte preparations, with protease inhibitors, prior to and 8 h after induction o f inflammation using a murine iNOS antibody. Right blot is equine
ix
Reproduced with permission of the copyright owner. Further reproduction prohibited without permission.
cultured chondrocytes as a positive control following vehicle (veh.) or lipopolysaccharide (LPS) treatment ( tr t) .......................................................................................................... 98
4.20. Western blot o f equine HB and an equine leukocyte preparation, with protease inhibitors, prior to and 4 h following LPS administration using a murine iNOS antibody. Right blot is equine cultured chondrocytes as a positive control following vehicle (veh.) or lipopolysaccharide (LPS) treatment ( tr t) ........................................................................... 99
4.21. The spectra o f equine hemoglobin (0.1 mg/mL) interacting with cimetidine and O2.......101
4.22. The spectra o f equine hemoglobin (1 mg/mL) interacting with cimetidine and O2........ 101
4.23. The difference spectra o f equine hemoglobin interacting with various concentrations of zaltidine.............................................................................................................................. 102
4.24. Nitric oxide production by DEA/NO in die presence o f equine hemoglobin and/or cimetidine........................................................................................................................... 10 2
4.25. Pathways o f Nitric Oxide (NO) metabolism.................................................................... 106
x
Reproduced with permission of the copyright owner. Further reproduction prohibited without permission.
ABSTRACT
Cytochrome P-450 (CYP) and inducible nitric oxide synthase (iNOS) are similar heme
containing enzymes. Cimetidine (CIM) is an H2 antagonist, and since CIM inhibits CYP, it
may also bind to the heme-iron o f iNOS and reduce NO generation.
Six horses each had three tissue chambers inserted subcutaneous!y on either side o f the
neck for Trial 1. Trial 2 also used 6 female Thoroughbred horses implanted with at least two
tissue chambers as in Trial 1. Blood and tissue chamber fluid (TCF) were sampled at -24, 0, 4,
8 , 12 h and at 1,2, 3, S, and 7 days after carrageenan instillation for Trial 1 a similar schedule
was used for Trial 2.
Tissue chamber fluid (TCF) interleukin (IL)-1 concentrations were increased following
NaCl inflamed (NaCl-1), CIM, or aminoguanidine (AG) treatment when compared to non
inflamed chamber TCF. For IL-6 , NaCl-I and CIM were significantly increased when
compared to NaCl non-inflamed (-N). There was no significant difference between the area
under the curve (AUC) of IL-1 or IL-6 in NaCl-I TCF vs. CIM or AG TCF. Cimetidine
significantly decreased N 03' AUCs in plasma. Aminoguanidine and CIM decreased N 03‘
AUCs in TCF in Trials 1 and 2. These results indicate that CIM had an effect on some
inflammatory indices in this model. Surprising is the inhibition o f N 03' formation by CIM.
This could be the result o f direct inhibition of iNOS, direct inhibition of CYP, and/or an
interaction at H2 receptors that have a role in the regulation of iNOS.
For CIM, classical Type II spectra, similar to those previously reported, were obtained
at concentrations sO.l mM in both rat and equine hepatic microsome preparations. Both
hexobarbital and AG produced a Type I difference spectra in rat and equine hepatic microsome
preparations. The interaction o f CIM with a leukocyte preparation resulted in atypical spectra,
but provided evidence for interaction with a chromophore in TCF. Cimetidine also did not
xi
Reproduced with permission of the copyright owner. Further reproduction prohibited without permission.
affect the conversion o f NO to N 03' catalyzed by hemoglobin. Western blot analysis, however,
failed to identify iNOS in the leukocyte preparation.
xii
Reproduced with permission of the copyright owner. Further reproduction prohibited without permission.
CHAPTER 1. LITERATURE REVIEW
Cimetidine (CIM) is a histamine (HIS) type 2-receptor antagonist commonly employed
in racehorses to treat, or reduce the incidence of, stress induced gastric ulceration. Cimetidine
has also been shown to produce several other useful effects. Studies have shown that H2-
receptor antagonists have anti-tumor, anti-infective, and either pro- or anti-inflammatory
properties. Cimetidine and similar compounds have been shown to reduce the size of
melanomas (Goetz, et a l 1990a; Goetz, et al., 1990b; Jenkins, 1991), reduce the severity of
pulmonary cardiovascular effects in a porcine respiratory distress syndrome model (Byrne, et
al., 1990), enhance resistance to pneumonia in calves and swine (Canning, 199S; Canning, et
al., 199S), reduce hyperoxic lung injury in lambs (Hazinski, et al., 1988), and reduce pain
associated with rheumatoid arthritis (Grabowski, et al., 1996). The cytotoxic antitumor and
anti-infective activity may be related to their blockade of H2 receptor mediated suppression of
cytokine generation and macrophage activation. Some of the H^receptor antagonists have also
been shown to act as free radical scavengers, but this could be due to their binding to the iron-
heme of cytochrome P-450 (CYP), retarding superoxide anion generation (Hazinski, et al.,
1988).
Inflammatory and immunological stimuli suppress CYP when immune cells secrete
cytokines. Cytokines are also known to induce nitric oxide synthase (NOS) and it has been
shown that nitric oxide (NO) inhibits CYP medicated metabolism of xenobiotic substrates. It
has recently been shown that inhibitors of NOS prevent cytokine-mediated decreases in CYP
protein (Carlson & Billings, 1996). Also, increased concentrations of NO resulted in decreases
in CYP proteins.
Reproduced with permission of the copyright owner. Further reproduction prohibited without permission.
Inflammation is a fundamentally pathologic process consisting o f a dynamic complex
of cytologic and chemical reactions which occur in affected blood vessels and adjacent tissues
in response to an injury or abnormal stimulation caused by a physical, chemical, or biologic
insult, including: 1) the local reactions and resulting morphologic changes, 2 ) the destruction or
removal of the injurious material, 3) the responses that lead to repair and healing. The signs of
inflammation are: rubor (redness); calor (heat or warmth); tumor (swelling); and dolor (pain); a
fifth sign, functio laesa, meaning inhibited or lost function, is sometimes added. All of the
signs may be observed in certain instances, but not in others. Acute inflammation is an
inflammatory process that has a fairly rapid onset, quickly becomes severe, is usually
manifested for only a few days, may persist for several days or even a few weeks, and could be
defined as the microcirculatory response to injury. A small number o f cases proceed to develop
into chronic and self-perpetuating inflammatory conditions (May, et al., 1987). The number of
known inflammatory mediators continues to grow as research in the area progresses. The
classical pro-inflammatory mediators are HIS, bradykinin, prostanoids (such as prostaglandin
E2), leukotrienes, platelet activating factor, NO, cytokines (some are anti-inflammatory),
endothelin, and oxygen radicals. While this is not a complete list, it serves as a framework for
which to discuss the inflammatory cascade.
Inflammation starts at the transcription level with the binding o f nuclear factor-icB
(NF-kB) to the promoter region of certain pro-inflammatory mediator genes such as
cycloxygenase-2 (COX-2), inducible nitric oxide synthase (iNOS), and several cytokines.
Inhibition of this transcription factor is the mechanism by which glucocorticoids have anti
inflammatory effects and is why that class o f therapeutic agents has so many different effects
on the treated patient (Lee & Burckart, 1998). The inflammatory cascade leads to the
2
Reproduced with permission of the copyright owner. Further reproduction prohibited without permission.
infiltration of various leukocytes, such as neutrophils, lymphocytes, and monocytes, into the
inflammatory site. These infiltrating cells augment the initial production of mediators by
producing more as they, in turn, are stimulated (Kubes, et al., 1991; Osborn, 1990). Within a
few hours after the inflammatory insult, macrophages begin to phagocytize the damaged tissues,
which may lead to increased injury to surrounding tissue. The infiltration of leukocytes results
in a “walling-off” o f the injured area. This is accomplished by fibrin deposition that can lead to
adhesions resulting from leukocyte infiltration. The walled>off areas help keep the
inflammation from spreading, but can also lead to the formation of abscesses (Guyton & Hall,
1996).
Inflammation can also induce the CYP 3A isoform via glucocorticoid dependent and
independent mechanisms. The effects of lipopolysaccharide (LPS) on CYP are thought to be a
direct effect on hepatocytes due to high systemic concentrations of various cytokines. This is in
contrast to other models of inflammation, such as that induced by carrageenan, that produce a
more local inflammation and do not achieve high systemic cytokine concentrations. In the
carrageenan model of inflammation, the expression o f CYP 1A1, 2A1, 2B, 2D, 2EI, 3A, and
4 A are suppressed (Morgan, 1997).
1.1a. Cytokines
Cytokines are an integral part of the complex inflammatory cascade that includes HIS,
eicosanoids, endothelin, and NO. Pro-inflammatory cytokines are cleared more rapidly from
inflamed sites than anti-inflammatory cytokines (Groeneveld, et al., 1997). Cytokines appear to
have a minor role in osteoarthritis, but in inflammatory arthritis, tumor necrosis factor (TNF)-a
is present in high concentration of the synovial lining. The concentrations of interleukin (IL)-1
are also elevated in these patients (Mdchiorri, et al., 1998).
3
Reproduced with permission of the copyright owner. Further reproduction prohibited without permission.
Tumor necrosis factor-a. is typically the first cytokine detected following an
inflammatory insult There are two isoforms of TNF, a and p. The a isoform is predominantly
associated with inflammation and has a molecular weight o f *19 kDa with a >74% amino acid
homology across species. It can be synthesized by several cell types, but mainly by leukocytes,
with NF-kB playing an important role in the transcription o f TNF. The molecule forms a
trimer in order to have biological activity (Myers & Murtaugh, 1995). In bacterial pneumonia,
TNF levels increase rapidly from 1 to 12 hours (h) post induction in bronchial lavage fluid and
then rapidly decrease. Lung tissue continued to release TNF for a considerable time period
after the decrease in lavage fluid (Bergeron, et al., 1998). In bovine mastitis, also an
inflammatory condition, TN F-a can be detected both in the milk and in the serum of infected
animals (Myers & Murtaugh, 1995). In race horses with intra-articular chip fractures,
significant increases in synovial fluid TNF concentrations were observed at 2 and 12 h post
race with detectable concentrations still present at 26 h (May, 1997). In LPS treated horses,
TNF serum concentrations increased over the period of I to 2 h post-LPS (Bueno, et al., 1999).
Interleukin-1 is a pro-inflammatory cytokine which can be secreted from almost every
nucleated cell in the body. This cytokine has a molecular weight o f *30 kDa and is stored in
the cytoplasm ofthe producing cells. There are two isoforms of IL-1, termed a and p. There is
at least 58% amino acid homology between species studied (Lederer & Czuprynski, 1995).
Equine IL -ip has >60% amino acid homology with human and murine IL -ip (Horohov, et al.,
1997). The role of IL-1 in the inflammatory cascade is to activate endothelial cells, in
conjunction with TNF-a, to express cell surface molecules that increase adhesion of circulating
neutrophils. Interleukin-1 is also responsible for increases in collagenase synthesis and
proteoglycan degradation, such as that observed in inflammatory arthritis (Lederer &
Czuprynski, 1995). Interleukin-1 released during the inflammatory process, is believed to be a
4
Reproduced with permission ofthe copyright owner. Further reproduction prohibited without permission.
major mediator of LPS or TNF-a induced inhibition of hepatic CYP (Kudo & Kawano, 1999;
Morgan, 1997; Sewer & Morgan, 1997). This is believed to be both through regulation o f CYP
protein expression and heme pool size (Kudo & Kawano, 1999). It also stimulates the
production o f NO and prostaglandin (PG) E2 in a concentration dependent manner (Attur, et al.,
1998; Jfirvinen, et al., 1996; Lu & Fisc us, 1999). In the horse, the main isoform produced is
IL-1 {3 (May, 1997), which produces an increase in leukocyte infiltration following intra-
articular administration (Simmons, et al., 1999a). In bronchial lavage fluid, IL-1 levels
persisted for at least 3 days following induction of pneumonia in mice (Bergeron, et al., 1998).
Production o f this pro-inflammatory cytokine can be inhibited by treatment with the anti
inflammatory cytokine, IL-11 (Trepicchio, et al., 1996).
Equine IL-6 is a glycosylated polypeptide with a molecular weight of *20 kDa. There
is *70% amino acid similarity between equine and porcine species (Horohov, et al., 1997).
Equine chondrocytes and synovial cells produce IL-6 following stimulation with IL-1 (May,
1997). Formation of IL-6 is regulated by several nuclear factors (NF), but the two main factors
are NF-IL-6 and NF-kB, with production taking place in monocytes and macrophages
(Richards, et al., 199S). Interleukin-6 levels were detectable early in induced murine
pneumonia and were below the detectable limit o f the assay by day 3 of the study (Bergeron, et
al., 1998). Interleukin- 6 kinetics in mouse serum are bi-phasic, with an initial peak at 4 h
followed by a second, larger peak at 48 h (Bergeron, et al., 1998). This kinetic profile is
associated with the pharmacodynamics o f IL-6 . Early in inflammation, IL-6 is anti
inflammatory and chondro-protective, but as inflammation persists, the protective effect is
inhibited via transforming growth factor (TGF>p induction (van de Loo, et al., 1997) or
through inhibition of IL-1 and TNF secretion (Richards, et al., 199S). Interleukin-6 has been
shown to have an inhibitory effect on CYP activity (Monshouwer, et al., 19%). In collagen
5
Reproduced with permission o fthe copyright owner. Further reproduction prohibited without permission.
induced arthritis, serum IL- 6 concentrations peaked at 24 h post induction and were not
detectable on day 7. The pro-inflammatory effects o f IL- 6 can be blocked by the administration
of an IL- 6 receptor antibody (Alonzi, et al., 1998; Takagi, et al., 1998). This cytokine is also
capable of decreasing NO production following LPS stimulation (Trepicchio, et al., 1996) and
ameliorates cartilage proteoglycan destruction (van de Loo, et al., 1997). In horses treated with
IV LPS, IL-6 serum concentrations increased over the period o f 1 to 8 h after administration
(Bueno, et al., 1999). Glucocorticoids are able to inhibit the expression of IL-6 via NF-kB
inhibition (Richards, et al., 199S).
1.1.b. Prostagjaadia E»
The eicosanoids are synthesized from arachidonic acid (AA) via the pathway in which
PGH2 synthase (E.C. 1.14.99.1) catalyzes the first, and rate-limiting, step (Adams, 1995;
Boothe, 1995; Campbell & Halushka, 1996; Stryer, 1995). This enzyme has two catalytic
sites, the first being cyclooxygenase (COX) where AA is changed to PGG2. Cyclooxygenase
catalyzes the formation of a cyclopentane ring and the addition of four O atoms via two
molecules o f O2. The second site is for hydroperoxidase which converts PGG2 to PGH2 via a
two electron reduction o f the 15-hydroperoxy group to a 15-hydroxyl group. Cyclooxygenases
are located in all cells except mature red blood cells. While all tissues have the capacity to
produce cyclooxygenase end products (PG and leukotrienes), the concentration varies with the
type and amount o f the individual isomers.
There are two forms of COX. The constitutive isoform, known as COX-1, has clear
physiological functions, such as the production of prostacyclin which may have a role in the
cytoprotection of the gastric mucosa (Vane, 1996), although this concept has been disputed by
the development of separate COX-1 or COX-2 gene deficient, or “knockout”, mice
(Langenbach, et al., 1995; Morham, et al., 1995). Cyclooxygenase-1 expression appears to be
6
Reproduced with permission o fthe copyright owner. Further reproduction prohibited without permission.
regulated only developmentally (DeWitt, et al., 1996). The second type is an inducible form,
called COX-2 (Xie, et al., 1991; Xie, et al., 1992). It is induced by an array of stimuli, such as
LPS, growth factors, tumor promoters, and cytokines (Crofford, et al., 1994; DeWitt, et al.,
1996). Data suggest that the de novo synthesis o f COX-2 in synovial tissue from rheumatoid
arthritis patients is up-regulated by inflammatory mediators and is suppressed by
corticosteroids and glucocorticoids (Adams, 1995; Campbell & Halushka, 1996; Crofford, et
al., 1994).
Ovine PGH2 synthase-1 is an endoplasmic reticulum membrane bound glycoprotein
(Wilborn, et al., 1995) with a relative subunit molecular mass of *70 kDa. The asymmetric
unit contains two identical monomers related by a non-crystallographic two-fold axis of
symmetry. The two monomers exhibit extensive contacts, in agreement with the proposed
dimeric structure of the detergent-solubilized protein. The dimer is ellipsoidal in shape.
Residues 34-72 are very similar to that of epidermal growth factor. The next region (residues
73-116) consists of four right-handed spiral of a-helices. These helices are highly amphipathic
and create a novel motif for insertion of the enzyme into the lipid bilayer (Garavito, et al.,
1995; Picot, et al., 1994). The membrane-binding motif appears not only to anchor the enzyme
to the cellular membrane but also offers a direct path from the membrane to the COX active
site, avoiding solvation and desolvation o f AA into the membrane.
The catalytic domain is a globular structure containing the COX and peroxidase active
sites. It is comprised of two distinct, but intertwined, lobes of the peptide chain. The larger
lobe is built up around a “V”-shaped structure formed by two helices which grip a third helix
like a pair o f tweezers. Four other helices and their intervening loops pack around this “V*-
shaped structure o f helices to complete the large lobe. The smaller lobe o f the catalytic domain
7
Reproduced with permission o fthe copyright owner. Further reproduction prohibited without permission.
is created by six different helices which form a bundle with their axes being roughly parallel to
each other (Garavho, et al., 1995; Picot, eta l., 1994).
The COX-1 active she consists of a long, narrow channel extending from the outer
surface of the membrane-binding region to the center of the monomer. Tyrosine 385 is found at
the apex of this channel (Garavho, et al., 1995; Picot, et al., 1994). Serine 530, which is the
site of acetylation (and inhibition) by aspirin (Loll, et al., 1995), lies along the wall o f the
channel just below Tyr 385 at a point where the acetylation o f Ser 530 blocks access to the
upper part of the channel (Loll, et al., 1995). Glutamine 524 is located near Arg 120 and these
two residues may form a salt bridge; Arg 120 and Glu 524 are the only polar residues in this
otherwise hydrophobic channel (Picot, et al., 1994).
The COX-1 active crater consists of the upper portion of the channel near Tyr 385 as
deduced from the locations of Ser 530 and 5-flurbiprofen (a potent inhibitor of COX-1). If Tyr
385 is replaced by Phe, the activity of COX-1 is abolished. Due to the interaction o f the
guanidinium group of Arg 120, flurbiprofen sterospecifically binds to COX-1 and is
hypostulated to do so for ketoprofra and carprofra (Picot, et al., 1994).
The COX-2 isoform is a relatively large dimer (=76 kDa). Cyclooxygenase-2 is also a
membrane bound enzyme. The overall structure of ovine COX-1 and human COX-2 are very
similar, which was not unusual given that the amino acid sequences of the two enzymes are
67% identical. The only two residues not conserved (using the ovine COX-1 numbering
system) are lie 523 and His 519, which are Val and Arg, respectively, in COX-2 (Browner,
1996). A transcription factor binding region has been identified in the promoter region o f the
COX-2 gene and is believed to be NF-IL-6 (Sirois & Richards, 1993). The cytokines IL-1,
TNF-a, TGF-P, and IL-6 have the capability to induce COX-2 mRNA expression (Chen, et al.,
1999; Geng, et al., 1995).
8
Reproduced with permission o fthe copyright owner. Further reproduction prohibited without permission.
Two important facts concerning the COX isoforms: I) the NSAID binding site, which
is contained within the catalytic domain, is structurally conserved between the two isozymes
and 2) the X-ray crystal structures of COX-2 showed alternative conformations at the NSAID
binding site, as well as significant movements of the membrane binding and catalytic domains.
This appears to indicate that the substrate passes directly from the COX active site to the
peroxidase active site without having to exit the catalytic domain (Browner, 1996). The
existence of two isoforms at the aspirin-acetylation site may be pharmacologically significant:
aspirin acetylation inactivates COX-1, but aspirin-acetylated COX-2 is still capable of
oxygenating AA, producing 15-hydroxy-eicosatetraenoic acid instead of PGH2 (Loll, et al.,
1995).
Measurements of murine COX activity with varying AA concentrations established that
the Km values of COX-1 and COX-2 for this substrate were essentially the same: 3.0 and 2.5
pM, respectively (Meade, et al., 1993). Human COX-1 and COX-2, however, appear to have
different enzyme kinetics. Purified COX-1 had a specific activity in an O^uptake assay of 18.8
pmol of O^/min/mg protein, with a Km for AA of 13.8 pM and a corresponding of 1519
nmol of O^nmol of protein. Purified COX-2, on the other hand, had a specific activity in the
0 2 assay of 12.2 pmol of Oj/min/mg protein, a Kn for AA of 8.7 pM , and a V—. of 1088 nmol
o f 0 2/nmoI of protein (Gierse, et al., 1995).
In inflammation, the prostaglandins are synthesized as a result of various cytokines
signaling COX-2 transcription. The role of PGE2 in inflammation is the potentiation of edema
formation via its vasodilatory effects (Williams & Peck, 1977). Prostaglandin E2, the main
prostaglandin synthesized during inflammation, is formed via COX mediated catalysis and can
trigger suppression of transcription of another enzyme in the inflammatory cascade, iNOS. In
various models of inflammation, the effect of PGE2 on inflammation appears to be time
9
Reproduced with permission o fthe copyright owner. Further reproduction prohibited without permission.
dependent in that if present prior to induction o f inflammation, iNOS activity is suppressed, but
when administered after inflammation iNOS is not suppressed (Schwacha, et al., 1998). The
effects of PGE2 on NO production are not clear. When concentrations o f pM of PGE2 or
iloprost are added to LPS stimulated macrophages, NO production is significantly suppressed
(Marotta, et al., 1992), but it has been reported to have no effect on NO production when using
a cytokine-induced model of inflammation (J&rvinen, et al., 1996). The cytokine TNF-a can
also be inhibited by PGE2, potentially decreasing the amount of NO produced during
inflammation (Milano, et al., 1995). The COX-2 enzyme can be induced, however, by NO
(Salvemini, 1997) and TNF-a (Chen, et al., 1999). Current research suggests that the effects
of various iNOS inhibitors on COX isozymes are not direct effects, but are a result of the
inhibition o f NO effecting COX-2 induction and production (Salvemini, 1997; Salvemini &
Masferrer, 1996). Cyclooxygenase-2 can also be inhibited at the transcriptional level by
corticoids and glucocorticoids, such as cortisol, dexamethasone, and prednisolone (Crofford, et
al., 1994; Koehler, eta l., 1990; Newman, et al., 1994).
l.l.c . Histamine
Histamine is an endogenous mediator released during allergy and inflammation. It has
a role as a primary neuromodulator, and regulates the formation of many pro-inflamm atory
mediators (Auer, et al., 1991; Izzo, et al., 1998; Rezai, et al., 1990; Vannier, et al., 1991).
The receptors that it stimulates are classified into three distinct types: Hi, H2, & H3. The Hi
receptors are found in a wide variety of mammalian tissues such as smooth muscle, endothelial
cells, heart, central nervous system, and lymphocytes (Hill, et al., 1997). In the CNS they are
located post-synaptically. Histamine type 2 receptors are located in gastric parietal cells
(Cross, 1977; Cross, 1978), vascular smooth muscle, suppressor T-cells, neutrophils,
lymphocytes, blood vessels lining the synovial space, CNS, and the heart They are also located
10
Reproduced with permission o fthe copyright owner. Further reproduction prohibited without permission.
post-synaptically (Grennan, et al., 1975; Hill, et al., 1997; Mannaioni, et al., 1988). The HIS
stimulation of parietal cells in the horse is attributed to H2-receptors and is responsive to
treatment with H2-receptor antagonists (Kitchen, et al., 1998). Histamine type 2 receptors are
also associated with relaxation of smooth muscle (Toda, 1987), but this may also be associated
with Hi and H3 receptors (Beyak & Vanner, 1995). Histamine type 3 receptors are found
mainly in the CNS, but have been identified in peripheral tissues such as the small intestine
(Izzo, et al., 1998) and on brain mast cells (Rozniecki, et al., 1999). They can be located pre-
synaptically where they regulate the release of HIS from nerve endings (Hill, et al., 1997) and
mast cell activation (Rozniecki, et al., 1999).
All three classes of HIS receptors are associated with Ca** channels. The structure of
H2 receptors has been described at the molecular level. There are species differences, but the
residues associated with the active site are highly conserved (Black, 1993). Gantz and
coworkers (1992) have reported that for HIS to bind to the H2-receptor, Asp 98 is essential and
that Asp 186 provides selectivity of H2 agonists and antagonists. Histamine is metabolized by
diamine oxidase. This enzyme is located throughout the gastrointestinal tract and is inhibited
by aminoguanidine (AG), a known inhibitor of iNOS (Bieganski, et al., 1983).
The physiological role of HIS is very diverse. It can bind to H2 receptors and
suppresses human cytolytic T cell function in lymphocytes (Khan, et al., 1989). Histamine
stimulates the adherence of neutrophils and eosinophils to vascular endothelium (Foster &
Cunningham, 1998; Watanabe, et al., 1991). Along with its role as a pro-inflammatory
mediator, these results suggests a very active role for HIS in inflammation. In various models
of inflammation, HIS concentrations in inflammatory exudate peak at *1 h after stimulation
(Capasso, et al., 1975; Di Rosa, et al., 1971). It is of note that HIS concentrations are greater
in the synovial fluid of osteoarthritic patients than in those with rheumatoid arthritis (Renoux, et
11
Reproduced with permission of the copyright owner. Further reproduction prohibited without permission.
al., 1996). Histamine plays an important role in the regulation of various cytokines associated
with inflammation. Histamine alters the expression of IL-6 receptors on various cell types by
decreasing the expression o f this cytokine receptor with a mechanism hypothesized to be linked
to H2-receptors (Mer&ey, et al., 1991), but it apparently does not alter IL- 6 synthesis directly
(Vannier & Dinarello, 1994). Histamine can alter IL-6 synthesis following stimulation by IL-
1P and this synthesis is inhibited by CIM and ranitidine (RAN) via an H2-receptor mechanism
(Vannier & Dinarello, 1994). Nitric oxide, also an important mediator in inflammation, has its
synthesis upregulated by HIS through both Hi (Kelm, et al., 1993) and H2 mechanisms while
H3-receptor agonists reduce this synthesis (Mannaioni, et al., 1997). The lack of anti
inflammatory effect (edema formation) of H (-antagonists in carrageenan or turpentine induced
models o f inflammation indicates that Hi-receptors may only have a role in the early phase (0 -
90 min) o f inflammation (Di Rosa, et al., 1971). Histamine causes the activation o f both NOS
and COX in the conjunctiva of the eye and is associated with the inflammation observed in
allergic conjunctivitis (Meijer, et al., 1996). Histamine type 3 receptor agonists also affect
CNS vascular permeability by inhibiting protein leakage into the CNS, which can be reversed
by H3-receptor antagonists (McLeod, et al., 1998).
l.l.d . N itric Oxide
Nitric oxide has many physiological and pathophysiological functions. It is associated
with the regulation of essential vasodilatory tone, inhibition of platelet aggregation and
adhesion, increased cytotoxicity of macrophages against tumor cells and bacteria, and inhibition
of CYP. It also acts as a neurotransmitter in both the central and peripheral nervous systems
(Feldman, et al., 1993; Fukuto & Chaudhuri, 1995; Guyton & Hall, 1996; Veihelmann, et al.,
1997; Zhang & Snyder, 1995). It is the smallest, lightest, and first gas to be identified as a
biological messenger (Culotta & Koshland, 1992; Nathan, 1992).
12
Reproduced with permission of the copyright owner. Further reproduction prohibited without permission.
The over-production of NO in inflammation alters the physiologic function of inflamed
tissues on which physiologic concentrations of NO have an effect (Las kin, et al., 1994). This is
due to alterations in blood flow resulting from vasodilation, leading to hypotension and
increased leukocyte infiltration (Las kin, et al., 1994; Lu & Fisc us, 1999). However, it should
be noted that NO has been shown to reduce leukocyte adhesion, even with the increase in
leukocyte infiltration associated with inflammation (Granger & Kubes, 1996; Kubes, et al.,
1991).
The inflammation induced by pro-inflammatory cytokines can be inhibited by
overproduction of NO (Bauer, et al., 1997). The anti-inflammatory cytokine IL-11 has been
shown to reduce LPS-induced NO production by at least 50% (Trepicchio, et al., 1996).
Addition of L-Arg into an inflammatory site exacerbates the condition (Laskin, et al., 1994). It
has been reported that there is involvement of a constitutive NOS (cNOS; probably eNOS) very
early in the inflammatory process (within the first 1 to 3 h) with iNOS becoming induced
resulting in increased NO output over the next 3 to 24 h, depending on the species. This may
not be the case for all diseases. In a rat bile duct ligation model for cirrhosis, eNOS mRNA
(not iNOS) and NO*' where significantly increased (Liu, et al., 1999). Increases in NO
production are believed to up-regulate COX-1 and COX-2 and thus increase PGE2 production
(Salvemini, et al., 1996b) and do not appear to require IL-6 (van de Loo, et al., 1996). Others
have suggested that NO is a potent inhibitor of both COX and 12-lipoxygenase, but that the NO
metabolite peroxynitrite (ONOO") does not inhibit either (Fujimoto, et al., 1998). This
inhibitory mechanism does not appear to operate via binding to the iron-heme of COX
(Salvemini, 1997). While the mechanism is unknown, exposure of macrophages to O3 has
resulted in detectable iNOS protein (Pendino, et al., 1993). Synovial fluid concentrations of
N 03’ (a metabolite o f NO) in rheumatoid arthritis patients where higher than the corresponding
13
Reproduced with permission of the copyright owner. Further reproduction prohibited without permission.
plasma samples, suggesting that NO is involved in this disease (Grabowski, et al., 1996). But
in horses, intra-articular administration of IL-10 did not result in a significant increase in iNOS
activity (Simmons, et al., 1999a). Nitric oxide also inhibits the formation o f HIS (Mannaioni,
et al., 1997). This small molecule has been demonstrated to increase the formation of
metalloproteinase, an enzyme associated with inflammation (Trachtman, et al., 1996a).
In horses with small intestinal strangulation, a significant increase in mtrotyrosine
staining, an indication of NO production, was observed in intestinal mucosal leukocytes (Mirza,
et al., 1999a). In horses with naturally acquired strangulating large-colon volvulus, a
significant increase in plasma and abdominal fluid NO}' was observed compared to normal
animals (Mirza, et al., 1999b). It has been noted that platelet activating factor suppresses
eNOS activity in the intestine which leads to the destruction of the mucosal barrier. This leads
to the conclusion that below some concentrations, NO is protective in the intestine, but at
concentrations above this point it is cytotoxic in the GI tract (Hsueh, et al., 1997). The
bacterium, Helicobacter pylori, associated with gastric ulcers, has been demonstrated to induce
iNOS mRNA and associated NO production (Hahm, et al., 1997; Tsuji, et al., 1996; Wilson, et
al., 1996). In horses, N 03‘ concentrations in the urine decreased at 4, 20, and 24 h after LPS
administrations when compared to pre-treatment values (Bueno, et al., 1999). Nitric oxide has
also been identified as a mediator in induced laminitis. Infusion o f L-Arg increased indicators
of pain in lammitic animals as did treatment with NO donors (Hinckley, et al., 1996).
I .l.e M odels o f iaflammatioa
Several different models o f inflammation have been developed. Each has its own
benefits, drawbacks, and assumptions. The three basic types currently in use are irritant,
immunological, and mechanical. Each model investigates different segments of the
inflammation cascade to provide information about the physiology and pathophysiology of the
14
Reproduced with permission of the copyright owner. Further reproduction prohibited without permission.
disease process. Endogenous mediators of the inflammatory cascade, such as cytokines, can
also be used to directly induce certain types o f inflammation, such as that associated with
bacterial infections (Persson, et al., 1996).
The first model involves the use of zymosan as an irritant Inflammation is induced by
placing a zymosan solution into the location to be inflamed, such as a jo in t Zymosan is a cell
wall product derived from the yeast Saccharomyces cerevisiae (Cuzzocrea, et al., 1997; van de
Loo, et al., 1998). This agent activates the complement cascade leading to classical indications
of inflammation. Elevated levels o f corticosterone, N 02", prostaglandins, TNF-a, IL-1, and IL-
6 can be found in inflamed areas following the local administration of zymosan (Ridger, et al.,
1997; van de Loo, et al., 1997; van de Loo, et al., 1998) along with the influx o f neutrophils
into the inflamed area (Boughton-Smith & Ghelani, 199S). The inflammation induced by
zymosan is typically described as acute and local with noticeable edema formation (Ridger, et
al., 1997) and can be exacerbated by the addition o f L-Arg (Cuzzocrea, et al., 1997).
Carrageenan has been widely used as an agent for the induction of inflammation. It is a
sulphated polysaccharide galactan irritant derived from an extract of seaweed. Carrageenan
stimulates the inflammatory cascade by simultaneously initiating leukocyte infiltration, HIS
production, IL-l and TNF-a formation (Capasso, et al., 1975; Salvemini, et al., 1996b), and
increase protein concentrations at the site of inflammation (Sedgwick, et al., 1986). These are
local events not reflected in the systemic circulation when carrageenan is used as the
inflammatory stimulant (Higgins & Lees, 1984). It is of note that the anti-inflammatory
cytokine, IL-10, was not detected in rats following carrageenan-induced inflammation (Ianaro,
et al., 1995). The inflammatory cascade is initiated upon injection of a £2% solution. Within 4
h following instillation into the paw of rats, iNOS mRNA is expressed, NO metabolites (NO^,
N 03', and ONOO) are detected, and edema begins to form (Salvemini, et al., 1996a;
15
Reproduced with permission of the copyright owner. Further reproduction prohibited without permission.
Salvemini, et al., 1996b). The edema associated with carrageenan-induced inflammation is bi-
phasic, with eNOS responsible for the initial phase and iNOS having a significant role in the
extended phase (Salvemini, et al., 1996b). The L-Arg/NO pathway is of primary importance in
this model o f inflammation (Cuzzocrea, et al., 1998). In horses, three models have been used to
evaluate the local inflammatory effects of carrageenan. The first involves the implantation of
carrageenan soaked sponges under the skin. This induces an immediate and pronounced
inflammatory response and can be used to evaluate various types of anti-inflammatory
compounds (Higgins & Lees, 1983; Higgins, et al., 1987a; Lees & Higgins, 1986).
Subcutaneous tissue cages have also been used in horses. One model used polypropylene
practice golf balls implanted in the neck (Higgins, et al., 1984b) and then instilled with
carrageenan. The advantages and disadvantages of these models have been discussed (Higgins,
et al., 1987b), but a brief review is needed here. First, these are models and as such may not
represent clinical disease. Their purpose is to study some components) of inflammation or
specific effects of antiinflammatory agents. Next, these are acute inflammatory lesions o f the
neck and are not anatomically or physiologically identical to lesions seen in other soft tissues, or
in the synovial space. These models do allow for time sequence sampling of an inflamed lesion
and analysis of certain inflammatory mediators, but the areas are volume limited and
sample collection could alter the values of the inflammatory mediators.
A third model also uses subcutaneously implanted tissue chambers, but not of the golf
ball variety. This model uses milled Delrin® thermoplastic covered with silicone rubber to form
a cup into which interstitial fluid collects and into which test substances such as bacteria,
carrageenan, or therapeutic agents can be instilled (Beadle, et al., 1989; Clarke, 1989; Clarke,
et al., 1989a; Clarke, et al., 1989b; Guthrie, et al., 1996). This model allows for longer use of
16
Reproduced with permission of the copyright owner. Further reproduction prohibited without permission.
the chambers with less chance of bacterial contamination during sampling (Guthrie, et al.,
1996).
Turpentine can also be used to induce an inflammatory response. The mechanism of
action is similar to carrageenan in that it acts as an irritant on the surrounding soft tissues
following administration (Turnbull A Rivier, 1996). It is interesting that while a localized
inflammation is developed with this model, systemic IL-6 concentrations increase markedly
after each turpentine injection (Turnbull A Rivier, 1996).
L ipopolysaccharide is a cell wall component o f Gram(-) bacteria, such as Escherichia
coli, as is the peptidoglycan polysaccharide (PG/PS) of group A Streptococcal bacteria. Both
o f these agents can be injected into various species to induce inflammation (Fuseler, et al.,
1997). In rats, the PG/PS model induces a peak inflammatory response at *4 days and returns
to baseline values by day 10 post-inflammation. Upon injection into the synovial space, this
model causes a marked influx of neutrophils. The cytokines TNF-a, IL-1, and IL-6 , early
mediators of equine endotoxic shock (Horohov, et al., 1997), rapidly increased in the systemic
circulation within the first 12 h, but had returned to baseline by day 2. Serum N 03‘ and N(V
kinetics were similar to those of IL-1 A IL-6 , but were detectable in serum until day 7 (Fuseler,
et al., 1997). This model has also been shown to increase COX expression in synovial tissue
culture from humans and rats and could be inhibited by glucocorticoids (Sano, et al., 1992).
The presence of LPS in hepatocyte cell culture increased the production o f NO*\ but this
production was independent of HIS stimulation in LPS or INF-y free culture (Curran, et al.,
1989). Leukocyte infiltration and N 02~ accumulation increased in parallel in the rat after LPS
exposure, with TNF-a peaking and returning to baseline in < 6 h (Kohn A Rung, 1995). The
production of NO can be enhanced in the LPS model by co-administration of interferon (IFN)-y
(Pendino, et al., 1993).
17
Reproduced with permission of the copyright owner. Further reproduction prohibited without permission.
Synovitis is inflammation of the synovial membrane and is generally associated with a
joint It is also a primary indicator of the presence o f osteoarthritis in the horse. Histamine
release begins with the initial insult to the joint, thus starting the inflammatory cascade leading
to the production o f IL-1 and PGE2. This occurs both before and after the infiltration of
neutrophils and macrophages due to the mechanical disruption of the blood-synovial barrier
(Palmer & Bertooe, 1994). This eventually leads to the degradation of the cartilage matrix
(Todhunter & Lust, 1990). Part of the joint deterioration may not be due to inflammatory
mediators, but to the high intra-articular pressures generated during the disease process (Strand,
etal., 1998).
A model has recently been developed to duplicate the osteoarthritis/synovitis in the
horse. Synovitis is induced by transection of the lateral collateral and lateral collateral
sesamoidean ligaments to induce instability leading to inflammation in the metacarpophalangeal
joint of the horse. The progression of disease and post-mortem findings are extremely close to
the actual disease in this species at 8 weeks following induction (Simmons, et al., 1999b). The
model is similar to the anterior cruciate ligament transection model used in dogs (Fernandes, et
al., 1995; Pond & Nuki, 1973). This model has been used to evaluate the gait of affected dogs
(DeCamp, et al., 1996) and as a tool to test the efficacy o f NSAIDs (Fernandes, et al., 1995).
Synovitis in horses can also be induced by using an irritant to inflame the synovial membrane.
Carrageenan induces a consistent response in horses following instillation into the equine
synovial space (Owens, et al., 1996) and models an acute synovitis when compared to the work
done by Simmons, et al. (1999). Induction of synovitis in horses has also been accomplished
by instilling polyvinyl alcohol foam particles into the synovial space (Comelissen, et al., 1998).
This particular model has a serious fault in that it induces a systemic elevation of TNF-a that
corresponds to the induction of inflammation and lasts for several days. All of these models are
18
Reproduced with permission of the copyright owner. Further reproduction prohibited without permission.
important in the evaluation of anti-inflammatory drugs in horses since more anti-inflammatory
agents are prescribed to the horse than any other domestic animal (Higgins, et al., 1984a).
1.2. Histamine type 2-receptor antagonists
Cimetidine and other antagonists have been used for many years to control gastric acid
secretion in man and in domestic species. They are capable of reducing the damage resulting
from iscbemia-reperfusion injury due to acid excretion (Nalcamoto, et al., 1998) and also have
antinociceptive and analgesic properties (Hough, et al., 1997). The H2-receptor antagonists are
reported to improve the function o f the immune system in immunosuppressed subjects
(Anderson, et al., 1985; Canning, et al., 1995; Emau, et al., 1984; White & Ballow, 1985).
Cimetidine has also been shown to be effective in the treatment o f melanomas in horses (Goetz,
et al., 1990a; Goetz, et al., 1990b; Jenkins, 1991), and Kaposi’s sarcoma and colorectal
carcinoma in humans (Kelly, et al., 1999; Vannier & Dinarello, 1994). The mechanism of
action of CIM, and possibly other Hr-antagonists in bacterial infections and cancer therapy is
reported to be the reversal of T-cell-mediated immunesuppression and subsequent enhancement
o f natural killer cell activity (Jenkins, 1991; Ogden & Hill, 1980; White & Ballow, 1985).
More specifically, CIM has been demonstrated to augment mitogen-induced blastogenesis in
normal human lymphocytes to a level approximately equal to that o f the immunostimulant
levamisole (Gifford & Schmidtke, 1979). Upon treatment with H2-receptor antagonists, IL-2
production in lymphocytes is increased (Gifford & Tilberg, 1987). Histamine has been shown
to induce suppression of human lymphocytes by inhibiting their ability to proliferate. Rezai and
coworkers (1990) have suggested that this change in immune function is due to ^antagonist
reversal of the inhibition o f IL-2 gene expression caused by HIS. Interleukin-2 increases the
expression o f H^receptors on lymphocytes and the addition of CIM decreases the cytotoxic
effect of EL-2 (Shibata, et al., 1992). The presence of an H rreceptor antagonist does not
19
Reproduced with permission of the copyright owner. Further reproduction prohibited without permission.
activate lymphocytes; the therapeutic regimen simply keeps the cells from being suppressed.
Canning’s group (Canning, 1995; Canning, et al., 1995) has reported that several H r
antagonists have activity against induced bronchopneumonia in cattle and swine that is not
antibacterial in nature. An explanation may be found in the results reported by Hirasawa, et al.
(1991), in which a carrageenan model of inflammation was used in rats. They reported that
when H2-receptor antagonists were administered after induction of inflammation, neutrophil
numbers increased at the site of inflammation, but did not increase following Hi-receptor
antagonist treatment. In a model of HIS induced edema, Hi-antagonists decreased edema
formation and Hz-antagonists did not However, when NO was added (generated from acidified
NaN02, nitroprusside, or hydroxylamine) to the model, CIM decreased the extent of edema
formation (Oyanagui & Sato, 1993). Similar results were reported by Hirasawa’s group
(1987) in which CIM blocked the inhibitory action o f indomethacin on leukocyte accumulation
but had no effect on edema formation. Cimetidine, but not RAN, has also been shown to reduce
basal cGMP, the secondary messenger involved in NO signaling, levels in culture (Schroder &
Schror, 1990).
The H2 antagonists have other effects on the inflammatory process. Several
compounds have shown the capability to inhibit the production of pro-IL-la via Hrreceptors
(Tasaka, et al., 1993). Histamine increases IL -ip mRNA levels via Hrreceptors. Thus
treatment with an Hr receptor antagonist would decrease IL-lp concentrations (Vannier &
Dinarello, 1993). This is the same mechanism reported for the regulation of granulocyte-
macrophage colony-stimulating factor (GM-CSF) and IL-6 in that HIS stimulates production of
these cytokines and the H2-antagonists decrease their concentrations (Mor, et al., 1995).
Several Hrreceptor antagonists have been demonstrated to dramatically reduce HIS and
carrageenan-induced edema in the rat with CIM being the most potent o f those tested with Hr
20
Reproduced with permission of the copyright owner. Further reproduction prohibited without permission.
receptor antagonists having comparably little or no effect (Al-Haboubi & Zeitlin, 1979; Al-
Haboubi & Zeitlin, 1982; Al-Haboubi & Zeitlin, 1983; Ezeamuzie & Umezurike, 1989;
Kaneta, et al., 1993). These results also indicated that part o f the reduction in edema formation
could not be attributed to an Hrreceptor mechanism (Ezeamuzie A Umezurike, 1989). These
compounds have also suppressed edema formation associated with thermal injury and burns
(Brimblecombe, et al., 1977). Cimetidine treatment also appears to decrease the vascular
permeability associated with carrageenan inflammation in the guinea pig (Woodward, et al.,
1982). Following substance P instillation to induce joint inflammation in rats, production of
HIS is initiated and edema formation ensues. In this model CIM decreased edema formation by
50%, a level similar to that following Hi antagonist treatment (Lam & Ferrell, 1990).
A possible mechanism for the Hrantagonists activity against tumor cells and bacterial
infections is alteration in oxygen free radical (Of-) production. Cimetidine and RAN have
shown activity in several different models associated with O2 • tissue damage (Byrne, et al.,
1990; Hazinski, et al., 1988; Tanaka, et al., 1991). In the study reported by Byrne, et al.
(1990), CIM and RAN showed improvement of the pulmonary microvascular permeability
injury produced by a systemic Pseudomonas aeruginosa infection in swine. All animals were
treated with a combination o f ibuprofen, diphenhydramine, and CIM or RAN. The authors
stated that since the only variable between the two treatment groups was the antagonist used,
the mechanism by which the infection was cleared must be solely due to H2 receptor blockade.
The authors could show no significant difference between the two treatment groups ability to
scavenge (V-.
Another group has used endotoxin and 0 2 to induce pulmonary injury in lambs
(Hazinski, et al., 1988). After inducing the lung injury, CIM or RAN was administered to
prevent the resulting hyperoxia. Cimetidine, but not RAN, decreased respiratory failure and
21
Reproduced with permission of the copyright owner. Further reproduction prohibited without permission.
pulmonary edema in treated lambs. The mechanism hypothesized an increase in pulmonary
CYP activity observed with this model o f lung injury. Since CIM binds to the heme portion of
CYP, it inhibits the formation o f O2'*. The possibility exists, since only 0 2- was monitored in
this study, that the decrease in 0 2- formation could have been due to the reaction o f NO and 0 2‘
• to form ONOO\ Large amounts o f NO would have been formed by iNOS due to induction of
the enzyme by endotoxin (Fukuto & Chaudhuri, 1995). This scenario accounts for CIM’s
effectiveness, but does not explain RAN’s failure.
In the case of severe burns, CIM is reported to increase survival rate. Tanaka and
coworkers (1991) found that CIM suppressed post-burn capillary permeability and minimized
fluid loss in the burned tissue, both of which normally increase after this type o f injury. The
mechanism of this therapeutic approach was originally thought to be Hrreceptor mediated.
But, since RAN showed no effect, it was then hypothesized to occur via hydroxyl radical
scavenging. Hydroxyl radicals are produced by the burned skin and increase vascular
permeability, and it was suggested that CIM removed these radicals and decreased water loss
(Tanaka, et al., 1991). Another possible theory could be that the vascular system underlying
the burned tissue could be traumatized to such an extent that cytokines, such as IL-2 and TNF-
oc, could induce iNOS and cause an increase in vascular permeability with CIM inhibiting
iNOS, suppressing NO formation, and restoring vascular tone. Again, this provides a
mechanism for one of the Hrantagonists, but does not account for the inactivity of another.
Owen, et al., (1980) have suggested that CIM reduces vascular permeability in a HIS model of
acute inflammation via an unexplainable mechanism not associated with Hi or H2 receptors.
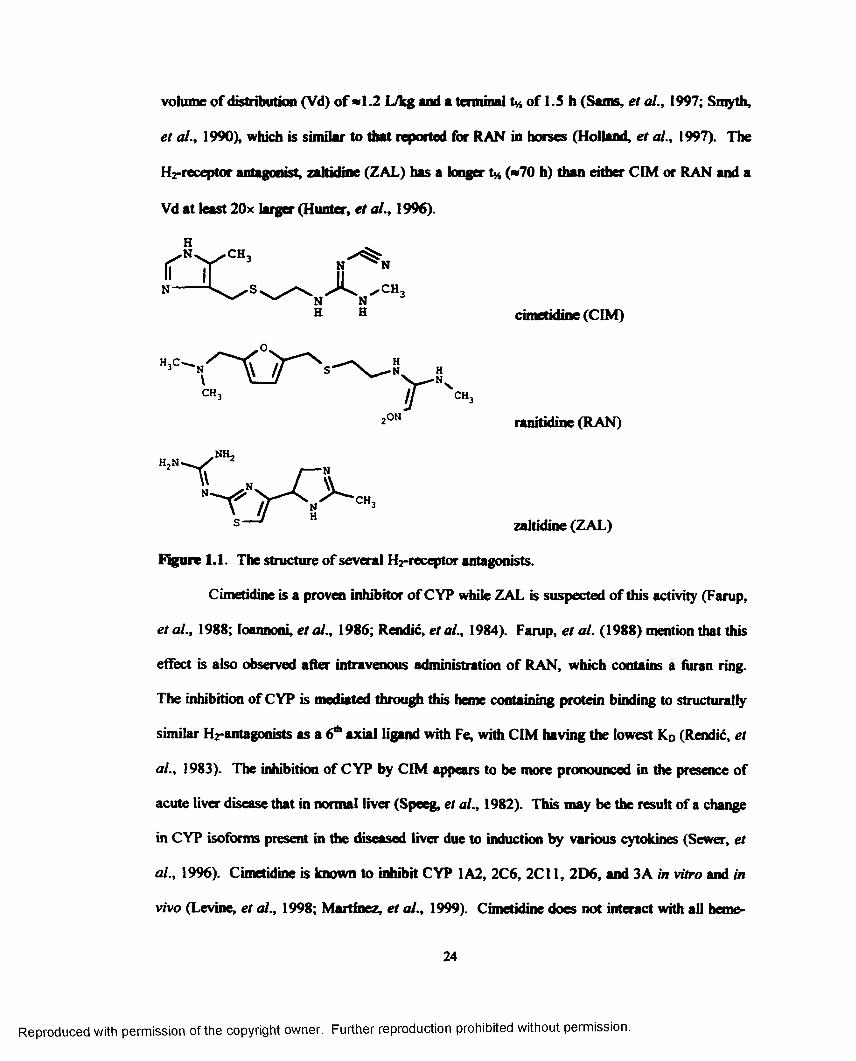
The pharmacology of CIM (Tagamet®; N"-cyano-N-methyl-N'-[2-[(5-methyl-imidazol-
4-yl)methylthio]ethyl]guanidine; Figure 1.1) is well described. It is approved in the United
States for use as a treatment for duodenal ulcers and gastroesophageal reflux disease
22
Reproduced with permission of the copyright owner. Further reproduction prohibited without permission.
(Physicians’ Desk Reference, 1998). Cimetidine’s interaction with the Hrreceptor is
dependent, as with all Hrreceptor antagonists, on the spatial relationship between the
heterocyclic and urea-like moiety and the receptor’s active site (Hoffman, et al., 1983). It
behaves as a base with a pKa of 7.11 ± 0.04 (Bavin, et al., 1984). This compound is rapidly
absorbed and excreted essentially unchanged in the urine o f rats and dogs with a terminal t* of
*1 h, being slightly longer in humans (Brimblecombe, et al., 198S). Plasma protein binding of
CIM ranges from 7 to 27% in rats, dogs, and humans (Taylor, et al., 1978). The major
metabolite is a sulphoxide in all species tested (Brimblecombe, et al., 1983; Taylor, et al.,
1978) and is formed via flavin-containing monooxygenase and not CYP in swine and human
microsomes (Cashman, et al., 1993). The mechanism by which it is removed from the vascular
system is an active process and involves renal tubular secretion. But the clearance o f CIM
from the body cannot be totally accounted for by renal tubular secretion route and p-
glycoprotein transport in the renal brush border has been reported to explain the difference
(Cacini, et al., 1982; Collett, et al., 1999; Pan, et al., 1994; Piyapolrungroj, et al., 1999).
Cimetidine can cross the choroid plexus against a concentration gradient via an active transport
system that is part o f the baso lateral membrane. This transport involves an FT gradient to drive
the system and is associated with a p-glycoprotein (Collett, et al., 1999; Pan, et al., 1994;
Piyapolrungroj, et al., 1999; Whittico, et al., 1990). Cimetidine has an acute LD» >100 mg/kg
in rodents and dogs irrespective of the route o f administration with no treatment related
abnormalities following chronic treatment (Brimblecombe, et al., 1985). One of the adverse
reactions reported for CIM in humans is impotence (Mignon, et al., 1980), which may be a
result of antagonism o f the Hrreceptor mediated effect on NO production or as an inhibitor of
nNOS. A reduction o f at least 23% of liver blood flow has also been shown following single
and multiple therapeutic doses o f CIM in humans (Feety, et al., 1981). In the horse, CIM has a
23
Reproduced with permission of the copyright owner. Further reproduction prohibited without permission.
volume of distribution (Vd) o f «1.2 L/kg and a terminal t* of 1.5 h (Sams, et al., 1997; Smyth,
et al., 1990), which is similar to that reported for RAN in horses (Holland, et al., 1997). The
Hrreceptor antagonist, zakidine (ZAL) has a longer t* (*70 h) than either CIM or RAN and a
Vd at least 20x larger (Hunter, et al., 1996).
rV*N x ^ c h 3
V V N NH H cimetidine (CIM)
*ON ranitidine (RAN)
c h 3
zaltidine (ZAL)
Figure 1.1. The structure of several Hrreceptor antagonists.
Cimetidine is a proven inhibitor of CYP while ZAL is suspected of this activity (Farup,
et al., 1988; loannoni, et al., 1986; Rendic, et al., 1984). Farup, et al. (1988) mention that this
effect is also observed after intravenous administration of RAN, which contains a furan ring.
The inhibition of CYP is mediated through this heme containing protein binding to structurally
similar Hrantagonists as a 6 th axial ligand with Fe, with CIM having the lowest KD (Rendic, et
al., 1983). The inhibition of CYP by CIM appears to be more pronounced in the presence of
acute liver disease that in normal liver (Spceg, et al., 1982). This may be the result of a change
in CYP isoforms present in the diseased liver due to induction by various cytokines (Sewer, et
al., 1996). Cimetidine is known to inhibit CYP 1A2, 2C6, 2C11, 2D6, and 3A in vitro and in
vivo (Levine, et al., 1998; Martinez, et al., 1999). Cimetidine does not interact with all heme-
24
Reproduced with permission of the copyright owner. Further reproduction prohibited without permission.
containing proteins, such as mouse catalase, where it has been shown not to be a 6 th axial ligand
on heme-iron (Baird, et al., 1987).
When a compound produces a Type I difference spectra, this indicates that binding is
taking place at a hydrophobic site in the protein near the heme iron, thus altering the heme
microenvironment of CYP and/or NOS. A Type I difference spectra is the result of shift in the
Fe** spin state from low-spin to high-spin. This shift results in a reduction of the Soret
absorption at *420 nm and a corresponding increase at *390 nm (Lewis, 1990). Classical
Type 1 substrates are hexobarbital, ethylmorphine, and the prostaglandins (Alvares & Pratt,
1990; Lewis, 1996). If a Type II difference spectra is observed, then these ligands are
interacting directly with the heme iron at the 6 th axial position (Alvares & Pratt, 1990). This
spectral change is characterized by a decrease in absorption at *400 nm and an increase at
approximately 430 nm. These absorption changes are a result o f Fe*** low-spin to high-spin
shifts (Lewis, 1996). Typical Type II spectra generators are aniline, imidazole, and NO
(Alvares & Pratt, 1990; Lewis, 1996). The interaction of CIM with CYP results in a Type II
optical difference spectrum (Lin & Lu, 1998; Schenkman, et al., 1967) associated with the
direct binding o f CIM to the heme moiety o f CYP. Ligand formation is both non-competitive
(Chang, et al., 1992; Pelkonen & Puurunen, 1980) and competitive, depending on substrate
concentration (Chang, et al., 1992; Winzor, et al., 1986). Both the cyano and imidazole groups
of CIM have been shown to bind to the heme-iron at the 6 th axial position (Rendic, et al., 1983).
Even the major metabolite of CIM, CIM 5-oxide, produced a Type II spectra, but had a low
binding affinity (Rendic, et al., 1983). The binding of L-Arg to NOS results in a Type I spectra
and is similar to the spectra obtained from CYP after binding of various substrates and suggests
that L-Arg is altering the heme microenvironment o f NOS (Kerwin, et al., 1995).
25
Reproduced with permission of the copyright owner. Further reproduction prohibited without permission.
13. Nitric Oxide Syathaae (NOS)
The nomenclature used for the sections on NOS and all subsequent chapters will reflect
that recommended by the International Union o f Pharmacology (Moncada, et al., 1997). Large
volumes of work have been performed in the past several years investigating the NOS isoforms
(NOSs, EC 1.14.13.39) and their main product, NO. This has resulted in a rapid and
exponential increase in the knowledge base surrounding NOS and NO. The two major classes
of NOS are eNOS and iNOS. The eNOS form has been isolated from endothelial cells, brain,
and neuronal tissue and sub-classified as either eNOS or nNOS. Human and rat neutrophils
have also been shown to contain mRNA for nNOS (Greenberg, et al., 1998). The constitutive
form is responsible for the regulation of essential vasodilator tone, inhibition of platelet
aggregation and adhesion, and it acts as a neurotransmitter in the central and peripheral nervous
systems. This class of NOS is also Caf* dependent. Inducible NOS is predominately
associated with macrophages, but has also been isolated from smooth muscle, hepatocytes,
chondrocytes, microglial cells, and neutrophils (Di Rosa, et al., 1996; Evans, et al., 1996;
Fukuto & Chaudhuri, 199S; McCall, et al., 1989). Neuronal NOS and iNOS are found mainly
in the soluble fraction of cell or tissue homogenates (Griffith & Stuehr, 1995). It is the NO
produced by iNOS that is responsible for the increased cytotoxicity of leukocytes against tumor
cells and bacteria.
It has been shown that the gene encoding for iNOS is found in humans on chromosome
17 (Chartrain, et al., 1994; Marsden, et al., 1994). This differs from eNOS and nNOS, which
are found on chromosomes 7 (the same as CYP 3A) and 12, respectively (Marsden, et al.,
1993; Maurel, 1996). The promoter region for iNOS has been sequenced for rats, mice, dogs,
and humans. There is *80% homology across these species (Nathan & Xie, 1994; Wang, et
al., 1998) and all contain the typical TATA box. The transcriptional factor binding sites for
26
Reproduced with permission of the copyright owner. Further reproduction prohibited without permission.
NF-IL-6 , IFN-y response element, NF-kB, and TNF response element are highly conserved in
all three species (Linn, et al., 1997; Lowenstein, et al., 1993; Niwa, et al., 1997; Xie, et al.,
1993).
The formation of NO in mammalian systems is through the oxidation of the terminal
guanidinium nitrogen of L-Arg, which is catalyzed by NOS (Figure 1.2: Marietta, et al., 1988).
Equimolar amounts o f NO and L-chruUine are formed via the intermediate V-hydroxy-L-Arg
(L-OHArg: Marietta, 1993; Pufahl, et al., 1992; Stuehr, et al., 1991b). All isoforms of NOS
are homodimers with a molecular weight of *300 kDa (Yui, et al., 1991), which contains a
heme-iron protein with binding sites for the following co-substrates/cofactors: O2, nicotinamide
adenine dinucleotide phosphate (NADPH), flavin adenine dinucleotide (FAD), flavin
mononucleotide (FMN; Stuehr & Ikeda-Saito, 1992), L-Arg, and tetrahydrobiopterin (THB: Di
Rosa, et al., 1996; Fukuto & Chaudhuri, 1993; Gross & Levi, 1992).
The heme found in NOS, located in the NH2-terminaI domain, is necessary for the
conversion o f L-OHArg to NO and L-citruIline since L-OHArg appears to bind in the proximity
o f the heme and alters the spin state o f Fe upon binding. This results in a Type I spectra and is
similar to the spectra obtained from CYP after binding of substrates and suggests that L-Arg is
altering the heme microenvironment o f NOS (Kerwin, et al., 1993). It is unclear if the binding
sites for L-Arg and L-OHArg are the same (Pufahl & Marietta, 1993), but the theory has been
suggested (Kerwin, et al., 1995). It has also been hypothesized that in the presence of O2', L-
OHArg can be converted to NO in protein free media (Modolell, et al., 1997), but this reaction
has been shown not to produce L-citrulline (Everett, et al., 1996). The Cys 184 residue in
human eNOS, Cys 415 in rat nNOS, and either Glu 371 or Cys 194 for murine iNOS appear to
be the proximal heme ligand for L-Arg binding in the various isozymes (Chen, et al., 1994;
27
Reproduced with permission of the copyright owner. Further reproduction prohibited without permission.
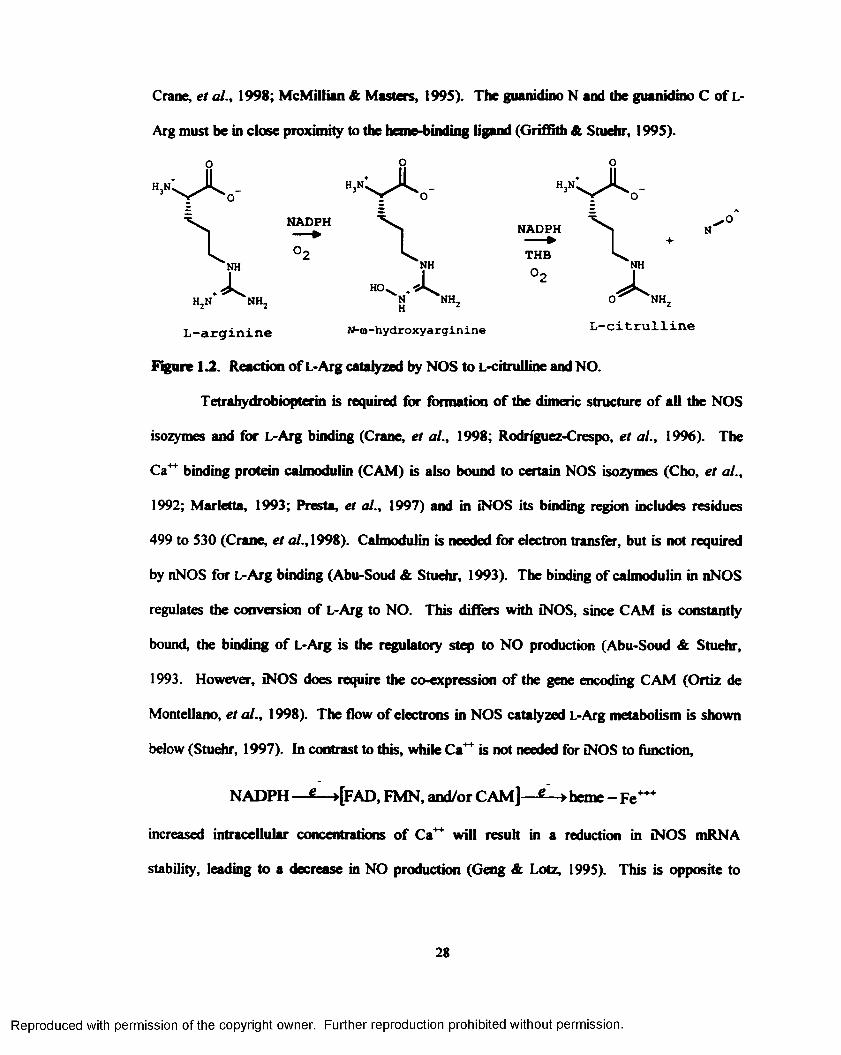
Crane, et al., 1998; McMillian & Masters, 199S). The guanidine* N and the guanidine C of L-
Arg must be in close proximity to the heme-binding ligand (Griffith & Stuehr, 199S).
o o o
■n a „- "■“V'k-NADPH ~ ~
° 2NH
HO,NH.
THBNH
NH.
L-citrulline
NH
Xh 2n n h 2
L-arginine »-a>-hydroxyarginine
Figure U . Reaction of L-Arg catalyzed by NOS to L-citrulline and NO.
Tetrahydrobiopterin is required for formation o f the dimeric structure of all the NOS
isozymes and for L-Arg binding (Crane, et al., 1998; Rodriguez-Crespo, et al., 1996). The
Ca** binding protein calmodulin (CAM) is also bound to certain NOS isozymes (Cho, et al.,
1992; Marietta, 1993; Presta, et al., 1997) and in iNOS its binding region includes residues
499 to 530 (Crane, et al., 1998). Calmodulin is needed for electron transfer, but is not required
by nNOS for L-Arg binding (Abu-Soud & Stuehr, 1993). The binding of calmodulin in nNOS
regulates the conversion of L-Arg to NO. This differs with iNOS, since CAM is constantly
bound, the binding of L-Arg is the regulatory step to NO production (Abu-Soud & Stuehr,
1993. However, iNOS does require the co-expression o f the gene encoding CAM (Ortiz de
Montellano, et al., 1998). The flow of electrons in NOS catalyzed L-Arg metabolism is shown
below (Stuehr, 1997). In contrast to this, while C a^ is not needed for iNOS to function,
NADPH —g- >[FAD, FMN, and/or CAM ]— e—> heme - F e~ +
increased intracellular concentrations o f Ca~ will result in a reduction in iNOS mRNA
stability, leading to a decrease in NO production (Geng & Lotz, 1995). This is opposite to
28
Reproduced with permission of the copyright owner. Further reproduction prohibited without permission.
what has been proposed for eNOS and nNOS, where increases in Ca~ concentrations result in
the synthesis o f cytotoxic amounts of NO (Takada, et al., 1998).
The extracellular concentration of L-Arg is the rate limiting factor regulating iNOS
activity (Cheng, et al., 1996). The normal endogenous concentration of L-Arg is between 100
and 800 mM with the KD o f eNOS <5 mM and the V - *1.3 mmol/min/mg (Bredt & Snyder,
1990; Chin-Dusting, et al., 1996; Stuehr, et al., 1991a) and iNOS having a Km of *17 pM
(Hevel, et al., 1991; Frey, et al., 1994).
l-3.a- IndndbleNOS
Inducible NOS formation is regulated primarily by induction of NOS protein synthesis
at the transcription level via several cytokines, such as TNF-a, INF-y, and IL-ip, but not by
LPS which must first stimulate cytokine production leading to iNOS up-regulation (Adler, et
al., 1995; de Vera, et al., 1996; Geller, et al., 1993; Spink, et al., 1995). In horses, IL -ip
alone does not significantly increase the activity of iNOS in vivo (Simmons, et al., 1999a).
This regulatory mechanism for iNOS is not as rigid as that for eNOS due to the different
physiological functions of the two classes. Once iNOS is up-regulated, NO production can be
continued for several days, depending on the species and type of stimulus (Nathan, 1992). The
regulation of NF-kB and its associated inhibitor, ItcBa, are the main regulators o f the
transcription of iNOS (Peng, et al., 1995; Salzman, et al., 1996; Xie, et al., 1994) and the NF-
kB binding region is only found in the promoter of iNOS. Thus, NF-icB is stimulated by LPS
resulting in the transcription o f iNOS mRNA and protein (Dfaz-Guerra, et al., 1996; Salzman,
et al., 1996; Weisz, et al., 1994; Xie, et al., 1994). This step is blocked by NF-tcB inhibitors
such as pyrrolidine dithiocarbamate (Sherman, et al., 1993), certain NSAIDs (Aeberhard, et
al., 1995) and hymeniaklisine (Badger, et al., 1999). This is also the mechanism by which
hyaluronan fragments stimulate iNOS expression in macrophages (McKee, et al., 1997; Noble,
29
Reproduced with permission of the copyright owner. Further reproduction prohibited without permission.
et al., 1996). A NF-kB binding she has also been identified in the CYP 2C11 promoter region
(Morgan, 1997). A negative feedback mechanism exists in the regulation o f iNOS. Nitric
oxide binds to IicBa and increases its stability, thereby further decreasing activation of NF-tcB
(Casado, et al., 1997). However, this appears to be time dependent, as Hierholzer, et al. (1998)
have shown. Increases in iNOS mRNA and NO lead to up-regulation o f NF-icB and
corresponding increases in IL-6 mRNA expression.
1.3.b. L-Arginine & NO metaboBam
The semi-essential amino acid L-Arg can be metabolized by several different enzyme
classes (Albina, et al., 1990; Andronik-Lion, et al., 1992; Boucher, et al., 1992; Stryer, 199S).
The arginase pathway yields L-omithine and urea and is part of the urea cycle (Stryer, 199S).
The CYPs, mainly the 3A subfamily, can convert L-Arg to NO (Andronik-Lion, et al., 1992;
Boucher, et al., 1992; Schott, et al., 1994) and CYP 3A can be inhibited by CIM (Kuo, et al.,
199S). This is not surprising since the NOSs are a subclass of CYP enzymes (Bredt, et al.,
1991; Lowenstein, et al., 1992; White & Marietta, 1992). The product L-citrulline can be
recycled back to L-Arg via argininosuccinate synthetase, which is co-induced with iNOS in
macrophages (Nussler, et al., 1994; Stryer, 1995), and argininosuccinase (Cendan, et al., 1996;
Stryer, 1995). Species differences can occur with respect to L-Arg synthesis and metabolism.
Cats are unable to produce L-Arg in sufficient quantities to maintain physiological function,
making L-Arg essential in the diet of this species (Rubin, 1996).
Nitric oxide gas has a high diffusion constant o f -3300 pm2/s. This allows NO to
move 0.3-0.4 mm from its site of formation entirely by free diffusion (Lancaster, 1997). The
biological t* o f NO reported in the literature is *100 msec (Kelm & Schrader, 1990). The
presence of iNOS was first hypothesized based on the presence of the NO oxidized metabolites
N02' and N 03~ and the fact that mammals maintained on low N 03' diets excreted more N 03'
30
Reproduced with permission of the copyright owner. Further reproduction prohibited without permission.
than they ingested (Stuehr A Marietta, 198S; Stuehr A Marietta, 1987). In the absence o f O2,
NO dissolves in HzO and is very stable. In air it will react with 0 2 to form NO2. In H2O,
plasma, and venous blood NO is oxidized to NO2', which is stable for several hours. In whole
blood, NO2' and, to a much greater extent NO, are rapidly converted to N Q f via a hemoglobin
(Hb) catalyzed oxidation (Doyle A Hoekstra, 1981; Moncada A Higgs, 1993; Wennmalm, et
al., 1992). As little as 0.2 mM Hb (4% of normal blood concentration) essentially eliminates
the presence of NO in arterial blood (Henry A Singel, 1996; Lancaster, 1997) in <2 sec with
ONOO" and/or nitrosyl Hb serving as possible intermediates (Doyle A Hoekstra, 1981; Henry
& Singel, 1996). The stoichiometry of L-Arg to L-citrulline to the formation of NOx" is 1:1:1
(Pufahl, et al., 1992; Yui, et al., 1991). Nitrate has a terminal tM of 3.8 h in the dog (Zeballos,
et al., 1995) and 4.8 h in ponies (Schneider A Yeary, 1975). Little is known about how N 0 3* is
handled by the kidneys. It has been assumed based on the molecular weights of NO2' and NO3'
that plasma N 03‘ is freely filterable, but it has been postulated that the kidney may synthesize,
release, and/or concentrate N 03‘ (Grisham, et al., 1996). Nitrate is reabsorbed preferentially
over Cl' in the kidney (Greene A Hiatt, 1953; Greene A Hiatt, 1954).
As part of an inflammatory process, both NO and 0 2 '* are generated in relatively close
proximity to each other, and under the proper conditions by the same enzyme system (Pou, et
al., 1992). As a result, ONOO' may be formed (Rubbo, et al., 1994). Peroxynitrite is a very
potent free radical believed to be at least partially responsible for the pro-inflammatory effects
of NO (Huie A Padmaja, 1993; Szab6 , 1996). But, by the same token, this reaction also
decreases the damage caused by O2 - (Rddenas, et al., 1998). It is still unclear, but the theory
beginning to emerge is that the amounts of NO and O2 produced in an inflammatory response
must be balanced since the overproduction of either leads to localized tissue damage (Huie A
Padmaja, 1993; Szab6 , 1996).
31
Reproduced with permission of the copyright owner. Further reproduction prohibited without permission.
At this point, we know that NO can be converted to NO2*, NO3', or ONOO*. But this
occurs very rapidly as NO has a t* of * 1 0 0 ms and NO3' is cleared rapidly from the body
(Schneider & Yeary, 1975). With this in mind, it has been reported that the effect of NO lasts
long beyond what would be expected based 00 its t*. Nitric oxide has been shown to bind to the
free thiol group of circulating proteins in vitro and in vivo (Stamler, et al., 1992a; 1992b). In
vivo, NO forms 5-nitrosoproteins which acts a NO adduct with activity identical to pure NO,
but with a t* of several hours. These adducts are not biologically active as a whole (Hecker, et
al., 1995). The concentrations of ■S’-nitrosoproteins decreased within 15 minutes of the
administration of A^-monomethyl-L-Arg (l-NMMA), indicating that once NOS was inhibited,
S-nitrosoproteins maybe degraded to release NO in order to maintain vascular tone (Stamler, et
al., 1992a). Hecker and coworkers (1995) have proposed that the true adduct is L-OHArg
since it has the same biological activity as NO. These 5-nitroso proteins have shown significant
concentration increases in the serum and synovial fluid of rheumatoid arthritis patients. The
increase in S-nitroso proteins can be correlated with increases in N 03* in these fluids, another
marker for increased NO production, to support a role for S’-nitroso proteins in rheumatoid
arthritis (Hilliquin, et al., 1997). The release process of these circulating 5-nitrosoproteins may
be similar to the metabolism of known S-nitrosoproteins such as S-nitroso-#-acetyl-D,L-
penicillamine (SNAP) and S'-nitrosoglutathione (Askew, et al., 1995).
1-3.C. Methods of Analysis
There are several methods for detection of NO and/or its metabolites. These are gas
chromatography-mass spectrometry (GC-MS), high performance liquid chromatography
(HPLC), Griess assay, capillary electrophoresis, chemiluminescence, and electrochemical
detection, just to name a few (Feelisch & Stamler, 1996). O f these, three are used on a routine
basis for the detection and quantification o f NO, N 02‘ and/or NO3*.
32
Reproduced with permission of the copyright owner. Further reproduction prohibited without permission.
Electrochemical detection is useful in that it allows for direct measurement of NO in
biological fluids. The detection mechanism is based on the oxidation of NO on the electrode
surface, which produces a corresponding change in the electrical conduction o f the electrode. A
Clark probe, similar to that used in O2 detection, is used with a platinum anode and a silver
cathode or with a probe coated with polymeric porphyrin. A constant potential is applied and
the direct current is measured in amperes. This method is specific for NO. The molecules O2,
N2) CO, CO2, NOj , and N 03' will not oxidize on the electrode, but N 0 2 will cause interference
with gas phase measurements. The probes can be calibrated by chemically generating NO
using KNO2 and KI as a catalyst Another useful, and more reliable method at lower
concentrations is the generation of NO from SNAP in a 0.1 M solution o f CuS04. This
analytical technique is very sensitive with a reported limit of quantitation o f *20 nM and an
upper limit of 10 pM (Malinski & Czuchajowski, 1996; Schmidt & Mayer, 1998).
The Griess reaction can be used to quantitate NO2* concentrations and N 03' following
reduction to NO2* via nitrate reductase. The NO2' is detected by reacting with sulfanilamide and
then further derivatized via a reaction with N-{ 1 -napthyl)ethyl-enediamine to yield an azo
product with a X,™, o f 548 nm. This method for the detection of NO2* or total NO,' is used
extensively in NO research because of its ease of use and low cost (Schmidt & Kelm, 1996;
Titheradge, 1998). A modification to this method uses dapsone to replace sulfanilamide. This
change results in a decrease in the limit o f quantitation to 0.2 pM versus 1 to 5 pM for
commercially available N 02' analysis kits. Dapsone can also be used for the detection of S-
nitrosothiols (Marzinzig, et al., 1997).
Another method for the quantitation o f NO metabolites is chemiluminescence. This is
accomplished via the reaction of NO with O3, but the N 02‘ or N 03‘ must first be converted to
NO. The use o f KI as a reducing agent to convert N 02' and NO3* to NO is well documented,
33
Reproduced with permission of the copyright owner. Further reproduction prohibited without permission.
but yields quantitation o f only NOx\ not individual metabolites. By using VCI3 in an acidic
solution, NO, can be specifically detected. The NO produced is then reacted with 0 3 and light
is released in die 640-900 nm range for quantitation. This is a very rapid and complete reaction
and is not affected by NO2 (Hampi, et al., 1996; Michelakis A Archer, 1998). It should be
noted however, that when integrating the response o f the chemiluminescence detector, peak
height is not linear but peak area is, thus peak area o f the standards and samples should be used
to calibrate the assay (O’Neill, et al., 1993).
1-3.<L Similar!tin between NOS and CYP
The reactions catalyzed by iNOS are similar to those o f CYP, but differs in two main
ways: 1) NOS requires THB, whereas CYP does not (Rodriguez-Crespo, et al., 1996), and 2)
one of the two products o f NOS, NO, is an odd-electron free-radical species. Typical products
of CYP oxidation are even, two-electron products (Fulcuto A Chaudhuri, 1995). It should also
be noted that iNOS and CYP are heme-iron containing proteins (McMillan, et al., 1992).
There is *60% amino acid identity between CYP and iNOS (Bredt, et al., 1991; Lowenstein, et
al., 1992; White A Marietta, 1992). More specifically, the 10 amino acid sequence responsible
for heme binding in CYP 3A is highly conserved between this CYP isoform and iNOS. O f
these 10 amino acids, two are exactly the same and three others are functionally identical
(Renaud, et al., 1993). The proximal heme ligand Cys-194 for murine iNOS (McMillian A
Masters, 1995), corresponding to Cys-456 in CYP (Shimizu, et al., 1988), is one of the two
amino acids which is identical in both iNOS and CYP. The similarity of cofactors and binding
locations within the amino acid sequence indicates that the NOS isozymes are CYP reductase-
CYP fused hybrids (Griffith A Stuehr, 1995; Stuehr A Ikeda-Saito, 1992). As mentioned
previously, the CYPs, and specifically the 3A subfamily, can convert L-Arg to NO (Andronik-
Lion, et al., 1992; Boucher, et al., 1992; Renaud, et al., 1993) and the NOSs are a subclass o f
34
Reproduced with permission of the copyright owner. Further reproduction prohibited without permission.
CYP enzymes (Bredt, et al., 1991; Lowenstein, et al., 1992; Stuehr & Ikeda-Saito, 1992;
White & Marietta, 1992). Both iNOS and CYP have been identified in human leukocytes (Di
Rosa, et al., 1996; Fukuto & Chaudhuri, 1995; McCall, et al., 1989; Stlrkel, et al., 1999).
Nitric oxide regulates its own formation through a negative feedback mechanism (Casado, et
al., 1997). Nitric oxide can also inhibit CYP at concentrations >12 pM per 100 pg of CYP
protein. There is both a reversible and an irreversible phase. The reversible phase appears to
be via an enzyme interaction mechanism with NO directly binding to the iron-heme active site
of the enzyme and nitrosylating a Tyr. The irreversible phase appears to be the result of
oxidation of key amino acids in CYP (Quaroni, et al., 1996; Wink, et al., 1993). The
irreversible phase of inhibition by NO has also been reported in other heme-containing enzymes,
such as NADPH oxidase, where NO reduces the generated by this enzyme (Fujii, et al.,
1997).
lJ .e . Inhibition of NOS
The NOS isozymes can be regulated at many levels by several mechanisms. These
consist of, but are not limited to: 1) the inhibition of Ca~ influx or calmodulin binding (eNOS
only), 2) interference with the two NADPH-dependent flavoproteins of NOS, 3) inhibition of
heme-iron protein binding, 4) inhibition o f THB biosynthesis, 5) inhibition of L-Arg transport
into the activated cell (Durante, et al., 1995), and 6 ) inhibition o f L-Arg metabolism with
guanidinium and guanidinium-like containing compounds such as AG (Fukuto & Chaudhuri,
1995). Inducible NOS can be inhibited at both the transcription and enzyme levels.
Dexamethasone, a glucocorticoid with immunosuppressive and anti-inflammatory effects,
inhibits the de novo synthesis of iNOS (Di Rosa, et al., 1996; Fukuto & Chaudhuri, 1995;
Radomski, et al., 1990; Radomski, et al., 1993). This mechanism is controlled by a specific
ligand/receptor interaction which occurs at therapeutic concentrations o f dexamethasone and is
35
Reproduced with permission of the copyright owner. Further reproduction prohibited without permission.

highly correlated with its anti-inflammatory effect This is also the mechanism by which
dexamethasone inhibits the de novo synthesis of COX-2 (Adams, 1995; Campbell A Halushka,
1996; Crofford, et al., 1994), IL-2, IL-3, IL-6 , and TNF-a (Beauparlant A Hiscott, 1996;
Trepicchio, et al., 1996). Asthmatics exhale NO and this NO release can be inhibited by
treatment with glucocorticoids (Curran, 1996). Cyclosporine and FK506 also inhibit
transcription o f iNOS mRNA. They do this by binding to NF-kB and inhibiting NF-kB DNA
binding (Beauparlant A Hiscott, 1996; Kunz, et al., 1995). This appears to be a specific effect
on iNOS and not eNOS (Vaziri, et al., 1998).
Aminoguanidine is reported to be a selective inhibitor of iNOS (Corbett, et al., 1992;
Fukuto A Chaudhuri, 1995; Griffiths, et al., 1993). Aminoguanidine is also reported to be an
inhibitor of CYP 2C11 mRNA expression and an inducer o f CYP 2E1 expression (Sewer A
Morgan, 1998). When AG is administered to animals, the amount of compound given and the
duration of therapy prior to induction of iNOS is correlated to the extent of iNOS inhibition.
Doses required to inhibit iNOS in rodents are 15-45 mg/kg IV and *400 mg/kg/day PO
(Southan & Szabo, 1996). Treatment with AG in a rat skin flap model of ischemia/reperfusion
significantly increased survival by inhibiting NO production from iNOS (Knox, et al., 1994).
Aminoguanidine does not appear to be effective, however, in more chronic models of
inflammation, especially when therapy is started several weeks after the initial insult (Fletcher,
etal., 1998).
Aminoguanidine is a structural analog o f L-Arg and is similar to other Arg analogues
that have been demonstrated to be inhibitors o f NOS. These include V-methyl-L-Arg, L-
OHArg, V-amino-L-Arg, V-nitro-L-Arg, and some imidazole-containing compounds. They are
non-specific inhibitors of NOS in that they inhibit both cNOS and iNOS. These compounds
inhibit NOS via irreversible, competitive, and/or mechanism-based processes (Fukuto A
36
Reproduced with permission of the copyright owner. Further reproduction prohibited without permission.
Chaudhuri, 1995; Kerwin, et al., 1995). These L-Arg analogues can also effect iNOS
production by inhibiting the L-Arg transport carrier system (Closs, et al., 1997). This
mechanism has been exploited and a specific inhibitor of L-Arg transport has been discovered
(Bianchi, et al., 1995). The compound AT'-nhro-L-Arg methyl ester (l-NAME) has been shown
to decrease pain and heat following carrageenan induced knee joint inflammation in rats. This
effect was also shown to be stereospecific (Lawand, et al., 1997). These compounds may not
be classical anti-inflammatory drugs in that some do not reduce leukocyte infiltration and may
actually enhance it (Iuvone, et al., 1997). Mercaptoethylguanidine is also an inhibitor o f NOS,
with selectivity for the iNOS isoform. It inhibits both the activity and expression of iNOS
(Zingarelli, et al., 1998).
Some of the H2-receptor antagonists also contain a guanidine functional group and have
been shown to have several anti-inflammatory properties (Al-Haboubi & Zehlin, 1979; Al-
Haboubi & Zehlin, 1982; Al-Haboubi & Zehlin, 1983; Ezeamuzie & Umezurike, 1989;
Hirasawa, et al., 1987; Hirasawa, et al. 1991; Kaneta, et al., 1993; Oyanagui & Sato, 1993;
Tasaka, et al., 1993). Small molecules resembling the guanidino moiety o f L-Arg are an
important template from which to develop inhibitors of NOS (Hasan, et al., 1993). Some
researchers have suggested that there are potential species differences in the affinity and
specificity of NOS inhibitors (Kerwin, et al., 1995).
Most of the inhibitors discussed are either non-specific for NOS isoforms, such as the
L-Arg analogs, or relatively specific for iNOS (AG and derivatives). Recent reports have
shown that NOS inhibitors with specific binding to nNOS can and have been developed. The
small molecule HMN-1180, a isoquinolinesulfonamide derivative, is competitive inhibitor of
nNOS and competes for the binding she o f L-Arg in this isoform (Nishio, et al., 1998). This
has also been reported for 7-nhro-indazole, but at high doses, this compound has been
37
Reproduced with permission of the copyright owner. Further reproduction prohibited without permission.
demonstrated to inhibit iNOS as well (Handy & Moore, 1998). The compound ibuprofen, a
classical NSAID, has been shown, in vitro, to activate iNOS and inhibit cNOS isoforms. This
is a very interesting result considering its known anti-inflammatory properties and low incidence
o f adverse effects (Menzel & Kolarz, 1997). Even tetracyclines, a very well characterized class
o f antibiotics, have been demonstrated to inhibit iNOS protein synthesis (Trachtman, et al.,
1996b). Two known inhibitors o f CYP, SKF525A and metyrapone, inhibit TNF-ct and
enhance IL- 6 production in response to LPS administration (Morgan, 1997), possibly leading to
effects on NO production.
38
Reproduced with permission of the copyright owner. Further reproduction prohibited without permission.
CHAPTER 2 - HYPOTHESES
My hypotheses are:
Ho: No effect o f CIM or AG treatment on any inflammatory indicator.
Hi: Cimetidine and/or AG treatment will reduce leukocyte infiltration, albumin, and
total protein concentrations in tissue chamber fluid.
H2: Cimetidine and/or AG treatment will change concentrations of inflammatory
mediators (cytokines and PGE2).
H3: Cimetidine and/or AG treatment will result in reduction of NO production in tissue
chamber fluid and plasma.
H*: Inducible NOS will be elicited in equine mononuclear cells by carrageenan and
function by a mechanism similar to that described in rodent and human cells.
The primary objectives are: 1) to determine whether NO concentrations are altered by
CIM, 2) determine if CIM interaction with iNOS is the mechanism by which NO production is
decreased, 3) examine cytokine concentrations, measurement o f cell numbers and types, and
other indices of acute inflammation with comparisons made between the ability of CIM and AG
to affect the inflammatory response. Fourth, to attempt to determine if AG and/or the Hr-
antagonists (CIM, RAN, and/or ZAL) alter the spin state of the Fe in the ironheme protein of
iNOS. Cimetidine has been shown to bind to the ironheme of CYP as a 6* axial ligand due to
its imidazole and cyano moieties (Ioannoni, et al., 1986; Rendid, et al., 1983; Rendic, et al.,
1984). Ranitdine is a weak inhibitor of CYP and has some interaction with the ironheme of
CYP while ZAL is suspected of this type of inhibition with CYP (Farup, et al., 1988).
The approach to addressing these objectives is briefly outlined as follows. Three tissue
chambers will be inserted subcutaneously on both sides o f the neck of six horses. After a 40
39
Reproduced with permission of the copyright owner. Further reproduction prohibited without permission.
day period for stabilization, the test tissue chamber in each animal will be inflamed with
carrageenan. Samples of TCF and plasma will be collected for analysis of NO (as N 031, AG,
and CIM concentrations. Complete cell counts (with differential) and total protein and albumin
concentrations will be measured. TCF and plasma samples will be collected and frozen pending
further analysis of PGE2, TNF-a, IL-1, and IL-6 concentrations.
Additional experiments will be undertaken in the following sequence. The first are to
determine if AG, HIS, L-Arg, and the Hrantagonists (CIM, RAN, and ZAL) alter the spin state
o f the Fe in the ironheme protein o f CYP and iNOS. The method o f McMillan, et al. (1992)
will be used to determine whether Type I or Type II binding spectra are associated with the
binding of CIM, RAN, ZAL, and AG to iNOS in equine leukocytes collected from tissue
chambers. The second set of experiments are intended to determine the interaction of CIM with
equine Hb, another ironheme containing protein, which is involved in the transport and
metabolism of NO.
The potential pitfall is that CIM may not affect the production of NO in this model.
This could be the case if carrageenan does not cause the production of cytokines that regulate
iNOS in equine monocytes, but this is not a likely scenario. Another scenario would be that
carrageenan does not cause the induction of iNOS but induces various isoforms of CYP,
resulting in increased NO via a non-NOS pathway. It is also possible that CIM simply does not
regulate iNOS, either through interference with an H2 receptor on monocytes or through a direct
interaction with iNOS. Another potential pitfall is that none of the proposed mechanisms that
are being studied could be the one that is used by CIM to decrease NO production. This
appears to be unlikely, but it is a possibility.
40
Reproduced with permission of the copyright owner. Further reproduction prohibited without permission.
CHAPTER 3 - CIMETIDINE INHIBITS NITRIC OXIDE ASSOCIATED NITRATE PRODUCTION IN A SOFT-TISSUE INFLAMMATION MODEL IN THE HORSE
3.1. Introduction
Nitric oxide is a volatile, lipid soluble, and reactive molecule which is known to be
involved in many physiologic functions. The formation of NO in mammalian systems is
mediated by NOS, which catalyzes the oxidation o f the terminal guanidinium nitrogen o f L-Arg
(Hibbs, et al., 1988; Iyengar, et al., 1987; Marietta, et al., 1988). The high output iNOS
contains a heme-iron protein with binding sites for five cosubstrates/cofactors: O2, NADPH,
FAD, FMN, and THB (Di Rosa, et al., 1996; Fukuto & Chaudhuri, 1993). This isoform is
predominately associated with macrophages, but has also been isolated from smooth muscle,
hepatocytes, microglial cells, and neutrophils (Di Rosa, et al., 1996; Fukuto & Chaudhuri,
1995; McCall, et al., 1989). It is the NO produced by iNOS that is primarily involved in the
inflammatory response to noxious stimuli and the increased cytotoxicity of macrophages against
tumor cells and bacteria.
Histamine type 2 receptors are located in neutrophils, lymphocytes, and blood vessels
lining the synovial space (Grennan, et al., 1975; Hill, et al., 1997; Mannaioni, et al., 1988).
The suppression o f human cytolytic T cell function in lymphocytes is mediated by HIS through
H2 receptors (Khan, et al., 1989). Histamine plays an important role in the regulation of
various cytokines associated with inflammation. It decreases the expression of IL-6 receptors
on various cell types with a mechanism hypothesized to be linked to precep tors (Merdtey, et
al., 1991). It can alter IL-6 synthesis and this synthesis is inhibited by CIM and RAN via an
H2-receptor mechanism (Vannier & Dinarello, 1994). Histamine increases IL-lp mRNA levels
via H2-receptors and treatment with an Hrreceptor antagonist decreases IL -ip concentrations
(Vannier & Dinarello, 1993). Nitric oxide, also an important mediator in inflammation, has its
41
Reproduced with permission of the copyright owner. Further reproduction prohibited without permission.
synthesis upregulated by HIS through both H( (Kelm, et al., 1993) and H2 mechanisms while
H^receptor agonists reduce this synthesis (Mannaioni, et al., 1997). Several H r receptor
antagonists have been demonstrated to dramatically reduce HIS and carrageenan-induced edema
in the rat with CIM being the most potent of those tested (Al-Haboubi A Zeitlin, 1979; Al-
Haboubi & Zeitlin, 1982; Al-Haboubi A Zeitlin, 1983; Ezeamuzie & Umezurike, 1989;
Kaneta, et al., 1993).
The Hrreceptor antagonists are reported to improve the function of the immune system
in immunosuppressed subjects (Anderson, et al., 1983; Canning, et al., 1993; Email, et al.,
1984; White A Ballow, 1983). Upon treatment with Hrreceptor antagonists, IL-2 production
in lymphocytes is increased (Gifford A Tilberg, 1987). Rezai and coworkers (1990) have
suggested that this change in immune function is due to Hrantagonist reversal of the inhibition
of IL-2 gate expression caused by HIS. Interleukin-2 increases the expression of Hrreceptors
on lymphocytes and the addition o f CIM decreases the cytotoxic effect of IL-2 (Shibata, et al.,
1992). Hirasawa’s group (1991) reported that when Hrreceptor antagonists were administered
after induction of inflammation, neutrophil numbers increased at the site of inflammation, but
did not increase following Hi-receptor antagonist treatment In HIS induced edema, Hi-
antagonists decreased edema formation and Hrantagonists did not However, when NO was
added (generated from NaNOz, nitroprusside, or hydroxylamine) to the model, CIM decreased
the extent of edema formation (Oyanagui & Sato, 1993). Similar results were reported by
Hirasawa’s group (1987) in which CIM blocked the inhibitory action of indomethacin on
leukocyte accumulation but had no effect on edema formation. Cimetidine, but not RAN, has
also been shown to reduce basal cGMP (the secondary messenger involved in NO signaling)
levels in culture (Schrdder A Schrfir, 1990).
42
Reproduced with permission of the copyright owner. Further reproduction prohibited without permission.
Inducible NOS activity can be inhibited directly by compounds with guanidinium and
guanidinium-likc moieties, such as AG (Gross, et al., 1990; Hibbs, et al., 1987; Moore, et al.,
1990). Aminoguanidine (Figure 1.1) is reported to be a relatively selective inhibitor of iNOS
(Griffiths, et al., 1995; Griffiths, et al., 1993; Laszlo, et al., 1995; Misko, et al., 1993). It acts
as a competitive inhibitor of iNOS, not as a substrate leading to NO formation (Griffiths, et al.,
1995; Griffiths, et al., 1993; Laszlo, et al., 1995; Misko, et al., 1993).
Some of the Hrreceptor antagonists also contain a guanidine functional group (Figure
1.1). Cimetidine and other antagonists have been used for many years to control gastric acid
secretion in man and in domestic species. It has been shown that at least two o f the compounds
in this class, CIM and RAN, bind to the heme-iron portion of CYP (Rendi<5, et al., 1984) to
inhibit CYP activity, producing a decrease in the biotransformation o f various xenobiotics
which are metabolized by the CYP monooxygenases Ooannoni, et al., 1986; Rendtf, et al.,
1984). It has recently been demonstrated that iNOS is also an isoform o f CYP (Renaud, et al.,
1993), and it contains a CYP reductase which allows it to be catalytically self-sufficient (White
& Marietta, 1992).
The fact that guanidine containing compounds such as CIM inhibit CYP activity, and
the finding that NOS is also an isoform o f CYP (Renaud, et al., 1993), suggests that CIM
could block the production of NO catalyzed by iNOS. The hypothesis that iNOS activity could
be so inhibited was tested with CIM as the putative blocker and AG as a positive control for
inhibition, using the carrageenan inflammation model in the horse previously described by
Guthrie and coworkers (1996). The effect o f CIM on cytokine and PGE2 production was also
of interest due to Hrreceptor regulation o f these inflammatory mediators. This study was
divided into two trials. Trial 1 was designed to test the effect of CIM (three IV doses at 3
mg/kg) on NO derived N 03', using AG as a positive control. The second trial was designed to
43
Reproduced with permission of the copyright owner. Further reproduction prohibited without permission.
reduce the occurrence o f NO3' from dietary sources in plasma and TCF, and to confirm the
effect of CIM using a higher dose (seven IV doses at 6 mg/kg).
3 J . Materials A Methods
32 j l Trial I
Animals: Six female Thoroughbred horses belonging to the Equine Veterinary
Research Program herd, and ranging in age from 8-16 years and 468-523 kg were used in this
study. All animals were part of a routine health maintenance program and clinically healthy.
They were maintained on Bahia grass pasture supplemented with Bermuda grass hay between
treatments and fed only pelleted feed during the treatments. Water was available ad libitum.
The animals were taken off pasture and placed in a mat-floored stall bam *16 h prior to the day
-1 samplings. The research protocol was approved by the LSU Institutional Animal Care and
Use Committee prior to initiation of the study.
Tissue Chambers: Delrin® AF thermoplastic (Polymer Corporation, Reading, PA) cup
type tissue chambers faced with a reinforced silastic membrane (SIL-TEC class VI USP
sheeting, Technical Products Inc. of GA, USA, Decatur, GA) were implanted subcutaneous!y
under general anesthesia as described by Guthrie, et al., (1996). Anesthetized horses were
placed in lateral recumbency and each horse received three chambers, two on one side o f the
neck and one on the other. Chambers on the same side o f the neck were placed at least 150 mm
apart, horizontally. The chambers were stabilized by suturing to the underlying tissue bed. The
tissue chambers were oriented with the collecting cup holes being most dorsal on the neck so
that fluid would accumulate in the ventral aspect of the cup. Animals were treated orally for 24
h prior to surgery and 10 days post-surgery with 2 g phenylbutazone (Butatabs E, Burns
Veterinary Supply, Carrollton, TX), 2 g trimethoprim, and 10 g sulfadiazine (Tribrisscn®,
44
Reproduced with permission of the copyright owner. Further reproduction prohibited without permission.
Mallinckrodt Veterinary, Mundelein, IL). The subjects were allowed to recover from the
surgical intervention for at least 45 days before commencement of the study.
Experimental design- The study was comprised of three time-sequenced treatments, as
summarized in Figure 3.1. The purpose o f Treatment 1 was to establish each animal’s response
to carrageenan. Physiologic saline (NaCl) was administered as a control for similar intravenous
injections of either CIM or AG. Each o f the six mares received three IV (jugular) injections of
10 mL of NaCl (0.9% sterile saline, USP, Baxter Healthcare Corporation, Deerfield, IL) at 12
h intervals. Coincident with the 3rt dose, one mL of 1% sterile carrageenan (X-carrageenan;
Sigma Chemical Co., S t Louis, MO) was instilled into chamber A. Blood and TCF from
chamber A (inflamed; NaCl-I) and chamber B (non-inflamed control; NaCl-N) were sampled at
-24, 0 (immediately prior to carrageenan instillation), 4, 8 , and 12 h and at 1, 2, 3, 5, and 7
days post-instillation. Blood samples for cell counts were collected into 7 mL evacuated tubes
containing EDTA (Vacutainer®, Becton Dickinson, Rutherford, NJ). Blood for NO (as NOj*),
TNF-oc, IL-1, IL-6 , PGE2, CIM, and AG analysis was collected into 15 mL heparin containing
evacuated tubes. Samples (0.5 to 12 mL) o f TCF were collected under aseptic conditions and
transferred immediately to 7 mL EDTA (1 to 2 mL of sample) and 15 mL heparin containing
evacuated tubes (remaining sample).
The purpose of Treatments 2 and 3 was to compare the effects o f CIM and AG on the
parameters measured in Treatment 1. Treatments 2 and 3 were designed as a 2 x 3 crossover in
which three mares received CIM (3 mg/kg; Tagamet®, SmithKline Beecham Pharmaceuticals,
Philadelphia, PA) and three received AG (25 mg/kg) according to the protocol used in
Treatment 1, but following a four week washout period (Treatment 2). The procedure was
repeated (Treatment 3) following a further four week washout period except that the horses
which received CIM in Treatment 2 received AG, and vice versa. In Treatment 2, chamber B
45
Reproduced with permission of the copyright owner. Further reproduction prohibited without permission.
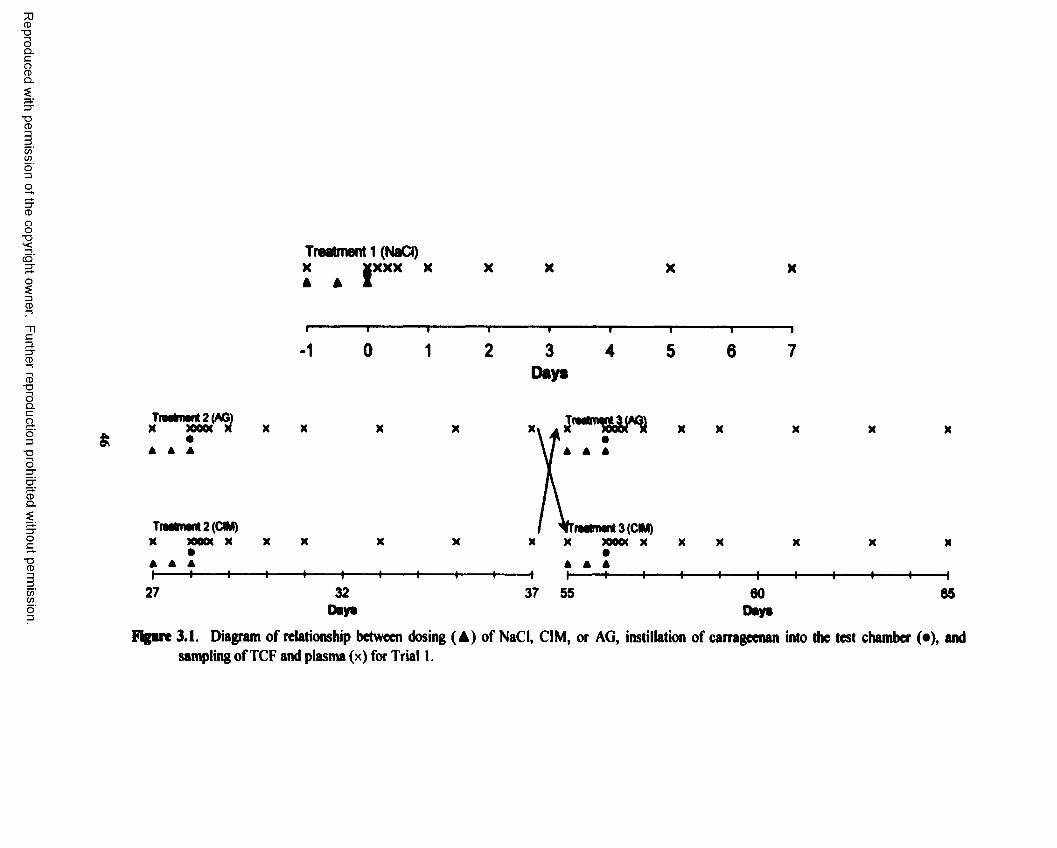
Reproduced
with perm
ission of the
copyright ow
ner. Further
reproduction prohibited
without
permission.
Treatment 1 (NaCl)X X X X X XA A Z
-1 0 1 2 3 4 5 6Days
x x o iH X X X X « .
* x * : \ / x . 2
Tmbn«N2(CIM)X MO M X X X X X X X X M X X X X X
A A AI I 1 I 1 t I 1---------1--------- 1— | > - 4 > <--------------1 |----1---------I---------1---------1---------1
27 32 37 55 60 65Day* Days
Figire 3.1. Diagram of relationship between dosing (A ) of NaCl, CIM, or AG, instillation of carrageenan into the test chamber (a), and sampling of TCF and plasma (x) for Trial 1.
was the test (inflamed) chamber; in Treatment 3 it was chamber C. An uninflamed chamber
(B) was designated as a control chamber and was sampled in Treatment 1; there were no
control chambers designated for Treatments 2 or 3. Each chamber was inflamed once and
chamber B was the only chamber used twice.
The dosage used for CIM was based on the dose recommended for treatment of
gastrointestinal ulcers in horses (Stiles, et al., 1990) and the disposition of CIM in horses
(Smyth, et al., 1990). The dosage regimen for AG was based on the absorption and
distribution parameters described for man and mice (Bowman, et al., 1996; Foote, et al., 1995)
and NO inhibition results reported by Corbett, et al. (1992) and Griffiths, et al. (1993). The
effective molar concentrations reported for AG in the above studies were converted to jig/mL
values, which were then used as target concentrations for calculating a dosage regimen. The
relatively high concentrations needed to produce efficacy in mice were also considered when the
final dose was calculated (Corbett, et al., 1992; Griffiths, et al., 1993).
3.2. b. Trial 2
Animals: Six female Thoroughbred horses (five from Trial 1) belonging to the Equine
Veterinary Research Program herd, and ranging in age from 8-16 years and 455-500 kg were
used in this study. They were fed only pelleted feed during the treatments and for 14 days prior
to the initiation of treatments. Water was available ad libitum.
Experimental Design: Each horse had blood and TCF samples collected and analyzed
for N 03~ prior to initiating treatment Studies commenced when detectable N 03‘ fell below 10
|iM in both plasma and TCF. A randomized complete crossover design was used in which three
of the mares received NaCl first and the other three received CIM first Each of the six mares
received seven IV injections o f either 10 mL of NaCl or CIM ( 6 mg/kg) at 8 h intervals.
Coincident with the 7* dose, one mL o f 1% sterile carrageenan (X-carrageenan; Sigma
47
Reproduced with permission of the copyright owner. Further reproduction prohibited without permission.
Chemical Co., S t Louis, MO) was instilled into chamber A. The crossover was conducted
after a one-week washout period. Blood and TCF from chamber A (inflamed; NaCI-I) and
chamber B (non-inflamed control; NaCl-N) were sampled at -48, 0 (immediately prior to
carrageenan instillation), 4, 8 , 12, and 24 h post-instillation. Blood for NO (as N 03") and CIM
analysis was collected as in Trial I. Samples (0.5 to 7 mL) of TCF were also collected as
previously described. Each chamber was inflamed once and chamber B was the only chamber
used twice.
3.2.C. Assays
Blood samples collected for N 03\ IL-1, IL-6 , TNF-o, PGE2, CIM, and AG analysis
were centrifuged at * 1 0 0 0 xg to obtain plasma, which was aspirated and stored in
polypropylene cryovials at -70°C until assayed. Vials for PGE2 samples contained 10 pg of
BW540C (provided by Dr. Peter Lees, Royal Veterinary College, London, UK) to halt its
continued formation (Higgins, et al., 1987a). Samples of TCF for N 0 3‘ analysis were
transferred without centrifugation where as samples for all other analytes were processed after
centrifugation and stored in the same manner as the corresponding plasma sample.
NOi~ analysis: Quantitative analysis of N 03' was conducted with a chemiluminescent
detector (Sievers Nitric Oxide Analyzer NOA™, Model 280, Sievers Instruments, Inc., Boulder,
CO). The method is based on a gas-phase chemiluminescent reaction between NO and ozone.
In the absence of 0 2, NO dissolves in H2O and is very stable. In air, it will react with 0 2 to
form N 02. In H2O and plasma, NO is oxidized to N 02", which is stable for several hours. In
whole blood, N 02‘ and, to a much greater extent NO, are rapidly converted to N 03‘ via a Hb
catalyzed oxidation (Doyle & Hoelcstra, 1981; Moncada & Higgs, 1993; Wennmalm, et al.,
1992). As little as 0.2 mM Hb (4% o f normal blood concentration) essentially eliminates the
presence of NO in arterial blood (Henry & Singel, 19%; Lancaster, 1997) in <2 sec with
48
Reproduced with permission of the copyright owner. Further reproduction prohibited without permission.
ONOO' and/or nhrosyl Hb serving as a possible intermediates (Doyle & Hoekstra, 1981; Henry
& S ingel, 1996).
The N 03' in plasma and TCF was converted to NO by reduction with a saturated
solution o f VCI3 in In HC1. Samples of either plasma or TCF were removed from -70°C
storage and brought to room temperature (»25°C). Samples (100 jiL) were placed in a 1.5 mL
polypropylene microcentrifuge tube that had been rinsed 3x with HPLC grade H2O.
Trichloroacetic acid (TCA; 10%; 100 |iL) was then added to each sample and the tube was
capped and vortexed. Samples were incubated for 15 min at ambient temperature and then
centrifuged at *2000 xg for S min. A three jiL aliquot was then injected into the reaction
chamber containing the VC13 solution to convert the NOs* in the sample to NO. The NO formed
from this reduction then reacted with ozone in the detector to release chemiluminescent energy
which was recorded by the detector as voltage using an analog scale.
A standard curve (10 to 200 jiM) and quality control (QC) samples (25, 60, and 125
pM) were made in HPLC grade H2O on each day that samples were analyzed. Standards, QC
samples, and unknowns were analyzed in triplicate. Concentrations were quantitated using
peak area of voltage output from the detector and slope/intercept from linear regression analysis
of the standard curve. The limit of quantitation was 10 11M and was defined as the
concentration which gave a signal to noise ratio >5. Intra-day accuracy and precision were £ l 1
and 7.9%, respectively, while inter-day accuracy was £ l 1% and precision £14%. Carrageenan,
heparin, HPLC grade H2O, and TCA samples were analyzed and found to have N0 3~
concentrations of <10 jim . Cimetidine and AG were also assayed across a range o f
concentrations that bracketed those measured in samples collected. For CIM, concentrations of
49
Reproduced with permission of the copyright owner. Further reproduction prohibited without permission.
<50 pg/mL bad <10 pM N 03‘ while AG showed the same level o f N 03‘ for concentrations <200
pg/mL, which is similar to results reported by Greenberg, et al. (1995).
IL-1: Quantitative analysis o f IL-1 was conducted using a bioassay with cell line DIOS
similar to that previously described by Sc hook, et al. (1992). Briefly, a standard curve was
made by diluting the IL-1 standard in assay medium without T-cell growth factor or other
cytokines. Test samples were also prepared with any dilutions being made with assay medium.
Final volume in each well of a 96-well plate was 100 pL. The D10S cells were washed three
times in culture medium (Dulbecco’s-PBS w/ 1% HI-CPSR-2). Prior to the last wash, the cells
were incubated at room temperature for 15-30 min to allow for incorporation of any remaining
surface-bound growth factor. After the final wash, 100 pL of the cell suspension (1 x 10s
cells/mL) was added to each well. The 96-well plates were then incubated at 37°C in an
atmosphere of 5% CO2 for 48 h. At the end of the incubation, proliferation of the cells was
measured by a fluorimetric method 20 h after the addition o f Alamar Blue dye into each well.
The standard curve ranged from 0 to 100 units of activity/mL.
IL-6 : Quantitative analysis of IL- 6 was conducted using a bioassay with cell line
7TD1 as previously described (Myers, et al., 1995; Myers, et al., 1997). Briefly, a standard
curve was made by diluting the IL- 6 standard in assay medium without T-cell growth factor or
other cytokines. Test samples were also prepared with any dilutions being made with assay
medium. Final volume in each well of a 96-well plate was 100 pL. The 7TD1 cells were
washed three times in culture medium (Dulbecco’s-PBS w/ 1% HI-CPSR-2). Prior to the last
wash, the cells were incubated at room temperature for 15-30 min to allow for incorporation of
any remaining surface-bound growth factor. After the final wash, a 100 pL aliquot of the cell
suspension (1 x 10s cells/mL) was added to each well. The 96-well plates were then incubated
at 37°C in an atmosphere of 5% CO2 for 48 h. At the end of the incubation, proliferation of the
50
Reproduced with permission of the copyright owner. Further reproduction prohibited without permission.
cells was measured by a fluorimetric method 20 h after the addition of *lam«r blue dye into
each well. The standard curve ranged from 0 to 100 units of activity/mL.
TNF-q: Quantitative analysis of TNF-a was conducted using a bioassay with cell line
W EHI164 clone as previously described (Myers, et al., 1995; Myers, et al., 1997). Briefly, a
standard curve was made by diluting the TNF-a standard in assay medium without T-cell
growth factor or other cytokines. Test samples were also prepared with any dilutions being
made with assay medium. Final volume in each well of a 96-well plate was 100 pL. The
WEHI cells were washed 3x in culture medium (Dulbecco’s-PBS w/ 1% HI-CPSR-2). Prior to
the last wash, the cells were incubated at room temperature for 15-30 min to allow for
incorporation of any remaining surface-bound growth factor. After the final wash, 100 pL of
the cell suspension (1 x 10s cells/mL) was added to each well. The 96-well plates were then
incubated at 37°C in an atmosphere of 5% CO2 for 48 h. At the end of the incubation, lack of
proliferation of the cells was measured by a fluorimetric method 2 0 h after the addition of
alamar blue dye into each well. The standard curve ranged from 0 to 33 units o f activity/mL.
PGE? analysis: Quantitation of PGE2 was accomplished using a commercially
available (Neogen* Corporation, Lexington, KY) enzyme-linked immunosorbent assay (ELISA)
kit. Samples (0.5 mL) were acidified with 100 pL o f In HC1 and then extracted with 4.5 mL of
ethyl acetate (EA). The EA layer was separated by placing the samples in an acetone/dry ice
bath and decanting the EA layer into a clean tube. The resulting samples were evaporated
under a N2 stream at room temperature. The residue was then stored at -7°C for *12 h prior to
PGE2 analysis.
The ELISA kit contained a known standard for making spiked PGE2 plasma standards
over the range of 0.1 to 10 ng/mL. Extracted samples were removed from the freezer and
warmed to room temperature. The samples were then reconstituted in 0.5 mL of manufacturers
SI
Reproduced with permission of the copyright owner. Further reproduction prohibited without permission.
extraction buffer and vortexed. A fifty pL aliquot of each sample was placed in a well of the
96-well plate which contained the antibody. Samples were assayed in duplicate and a standard
curve was assayed with each plate. A 50 pL aliquot of enzyme conjugate was then added to
each well, and the plate was gently shaken to mix contents and covered for 1 h at *25°C. After
incubation, each well of the plate was washed 3x with 300 pL of commercial wash buffer
provided with the kit. Finally, 130 pL of enzyme substrate was added to each well and the
plate was covered and incubated for 30 min. After the second incubation, the plate was read on
a microplate reader using a >.=630 nm.
To calculate the standard curve, a PGE2 naTve sample was assayed as part of the
standard curve. The average of each standard and unknown was determined with the 0 ng/mL
standard designated Bo. The average of each standard was the divided by Bo to obtain %
maximal binding, which was plotted against concentration and a curve fitted to the data. This
curve was used to calculate the concentrations of the unknowns.
CIM analysis: Quantitative analysis for CIM in plasma and TCF samples in both
experiments was conducted using HPLC with ultraviolet (UV) detection similar to that reported
by Sams, et al. (1997). The HPLC system consisted o f two pumps (Model SOI, Waters
Chromatography, Milford, MA), an automated sample injector (WISP, Waters
Chromatography, Milford, MA), and a variable wave length UV detector (Model 484, Waters
Chromatography, Milford, MA) which were attached via a System Interface Module (Waters
Chromatography, Milford, MA) to a personal computer which controlled sample collection and
integration (Baseline* Waters Chromatography, Milford, MA). The column was a 15 cm x 3
mm C ig reverse phase column (Phenomenex, Torrence, CA) immediately preceded by a 2 p
column frit. The mobile phase used was 0.033% HjP04:HPLC grade methanol (MeOH; 90:10)
52
Reproduced with permission of the copyright owner. Further reproduction prohibited without permission.
with a flow rate of 0.2 mL/min after being filtered and degassed. The detection was
accomplished using a X=228 nm.
Plasma standards were prepared by adding an appropriate amount of CIM standard
solution to CIM naive equine plasma to produce concentrations of 0.1 to 10 pg/mL. Plasma
standards were prepared and analyzed on each day that unknown samples were assayed.
Quality control (QC) samples (0.25, 1.2, and 6 pg/mL) were prepared at the start of the
analysis, aliquoted, and frozen to be thawed in pairs on each day that unknowns were analyzed.
CIM was extracted from plasma and TCF samples using solid phase extraction (SPE)
columns containing a C,g bonded sorbent (Bakerbond, J.T. Baker, Phillipsburg, NJ). The
cartridges were prepared, after being placed on a vacuum manifold (Supelco, Bellefonte, PA)
maintained at <5 mmHg, for use by washing with one mL of HPLC grade MeOH, followed by
one mL HPLC grade H2O. The SPE column was not allowed to reach dryness. One mL of
sample, after having 50 pL of 100 pg/mL RAN (internal standard) added, was placed onto the
column and allowed to flow through. The column was then washed with one mL of H2O (2 x)
and air dried for at least 3 min. The column was eluted with 250 pL of MeOH (3x) and dried
under N2. The sample was reconstituted with 150 pL o f mobile phase and vortexed. This
volume was transferred to autosampler vials and 20 pL was injected onto the HPLC system.
Concentrations o f CIM were determined from integrated peak height ratios of CIM and
an internal standard for each standard and unknown sample. The peak height ratio of each
standard was plotted against the corresponding known concentration o f CIM. Linear regression
analysis was performed to obtain a regression equation using a weighting factor of
[concentration]'1. All standards, QCs, and unknowns were assayed in duplicate and the mean of
the pair of determinations was reported. Samples found to contain CIM at a concentration
greater than the upper limit of the standard curve were reassayed using a smaller aliquot of
53
Reproduced with permission of the copyright owner. Further reproduction prohibited without permission.
sample and an appropriate amount o f CIM naive plasma. Recovery was >80% across the
range of the standard curve and for the internal standard. Inter- and intra-day accuracy was
<±15% with precision <±15%.
AG analysis: Quantitative analysis for AG in plasma and TCF samples was conducted
using HPLC with UV detection similar to the derivatizatkm procedure reported by Foote, et al.
(1995). The column was a 15 cm x 3 mm CN reverse phase column (Phenomenex, Torrence,
CA) immediately preceded by a 2 n column frit. The mobile phase used was
MeOH:acetonitrile:0.01M 1 -heptanesulfonic acid and NaH2P04 (10:10:80) with a flow rate of
0.4 mL/min after being filtered and degassed. The detector was set at >.=313 nm.
Plasma standards were prepared by adding an appropriate amount of AG standard
solution to AG naive equine plasma to produce concentrations of 0.05 to 10 pg/mL. Plasma
standards were prepared and analyzed each day that unknowns were assayed. Quality control
samples (0.25, 0.75, and 7.5 yig/mL) were prepared at the start of the analysis, aliquoted, and
frozen to be thawed in pairs on each day unknowns were analyzed.
For analysis, 0.5 mL of 7.5% TCA was added to 0.5 mL o f sample, vortexed, and
centrifuged at * 2 0 0 0 x g for 2 min. The supernatant was decanted into a disposable glass
culture tube to which 1 0 0 pL o f the derivatizing reagent was then added (6 -methyl-2 -pyridine-
carboxaldehyde; Sigma Chemical Co., S t Louis, MO). The samples were then placed in an
oven for 10 min at *95°C and subsequently transferred to autosampler vials. The injection
volume was 200 pL.
Concentrations o f AG were determined from integrated peak heights of AG for each
standard, QC, and unknown sample. The peak heights o f each standard were plotted against
the corresponding known concentration of AG. Linear regression analysis was performed on
the standards to obtain a regression equation using a weighting factor of [concentration]'1. All
54
Reproduced with permission of the copyright owner. Further reproduction prohibited without permission.
standards, QCs, and unknowns were assayed in duplicate and the mean of the pair of
determinations was reported. Samples found to contain AG at a concentration greater than the
upper limit of the standard curve were re-assayed using a smaller aliquot o f sample and an
appropriate amount of AG naive plasma.
Analysis of Results: Plasma and TCF leukocyte, cytokine, albumin, total protein, and
NCV concentrations were evaluated for significant differences by comparing area under the
curve (AUC) values (Al-Haboubi & Zeitlin, 1982; Al-Haboubi & Zeitlin, 1983; Lesser, et al,
1980) and time of maximal response (T— ) values (cytokines only). The AUC’s were
calculated as AUCi* using the trapezoidal rule (Gibaldi & Perrier, 1982) with the non-
compartmental model of WinNonlin (Scientific Consulting Inc., Apex, NC) for the periods of
- 1—>1, - 1—>3, and -1-V7 days for leukocyte and NO3' data (-2-»l for Trial 2). For cytokines,
the periods o f -1—>0.5, -1—>1, -1—>2, and -l->3 days were evaluated, as appropriate. It was
also determined a priori that the 4, 8 , and 12 h NO3' concentrations in plasma and TCF would
be compared. Statistical analyses o f the data were performed using the nonparametric
Friedman Test was used to evaluate the significance of AUC, T»_. and N 03' concentrations and
is the equivalent of an Analysis of Variance Test (ANOVA) for parametric data. The Wilcoxon
Sign Rank Test was employed for NO3* concentrations in Trial 1 and is similar to ANOVA for
repeated measures, but does not have an exact equivalent parametric test. Nonparametric tests
were used because the assumption of a normal distribution could not be met due to the sample
size in the trials. Comparisons were made using ranked values, for each time period, within
each animal for NaCI-I, NaCl-N, CIM, and AG. If a significant difference (p £ 0.05) was
found, Tukey’s multiple-comparison test (p £ 0.05; Daniel, 1990) was performed to determine
which treatments were significantly different. Estimates of the pharmacokinetic parameters for
55
Reproduced with permission of the copyright owner. Further reproduction prohibited without permission.
plasma CIM and AG were determined for each individual animal using non-compartmental
analysis (Gibaidi & Perrier, 1982).
33. Resalts
3J.a. Trial I
Nitric Oxide: Mean NO3' concentrations in plasma increased markedly during the first
12 h following instillation of carrageenan into the test chamber, but returned to baseline values
by 24 h (Figure 3.2). Mean values remained low but variable from day 1 through day 7. The
same pattern was observed for TCF following test chamber inflammation (Figure 3.3).
Comparison o f concentrations of NO3' in plasma and TCF for the first 12 h after instillation of
carrageenan into the test chamber showed that peak ( 1 2 h) values in that chamber approximated
those in both plasma and the control chamber (Table 3.1). It is also apparent that neither CIM
nor AG had an effect on N 03* concentration, in either plasma or TCF, at 4 or 8 h post
inflammation. At 12 h, however, both agents produced absolute values which were
significantly lower than those observed when NaCl was used as the treatment
Analysis of the NO3' concentrations at 4, 8 and 12 h after carrageenan instillation was
conducted using the Wilcoxon Sign Rank Test to detect changes in N 03‘ concentrations in
plasma and TCF. Instillation of carrageenan into the test chamber significantly increased the
concentration of NO3* in plasma and the control chamber in parallel with the rise in NO3'
concentration in the test chamber following NaCl treatment over the period of 4 to 12 h, but not
following AG or CIM treatment when measured over the same period. In fact, the values for
concentrations at each time point were nearly identical in the three sets of samples.
Analysis of the data using Friedman’s test with multiple comparison (Table 3.2)
showed that median NO3' concentrations in plasma were significantly (p < 0.03) lowered by
both CIM and AG treatments at 12 h. The same was true for NO3' concentrations in TCF.
56
Reproduced with permission of the copyright owner. Further reproduction prohibited without permission.
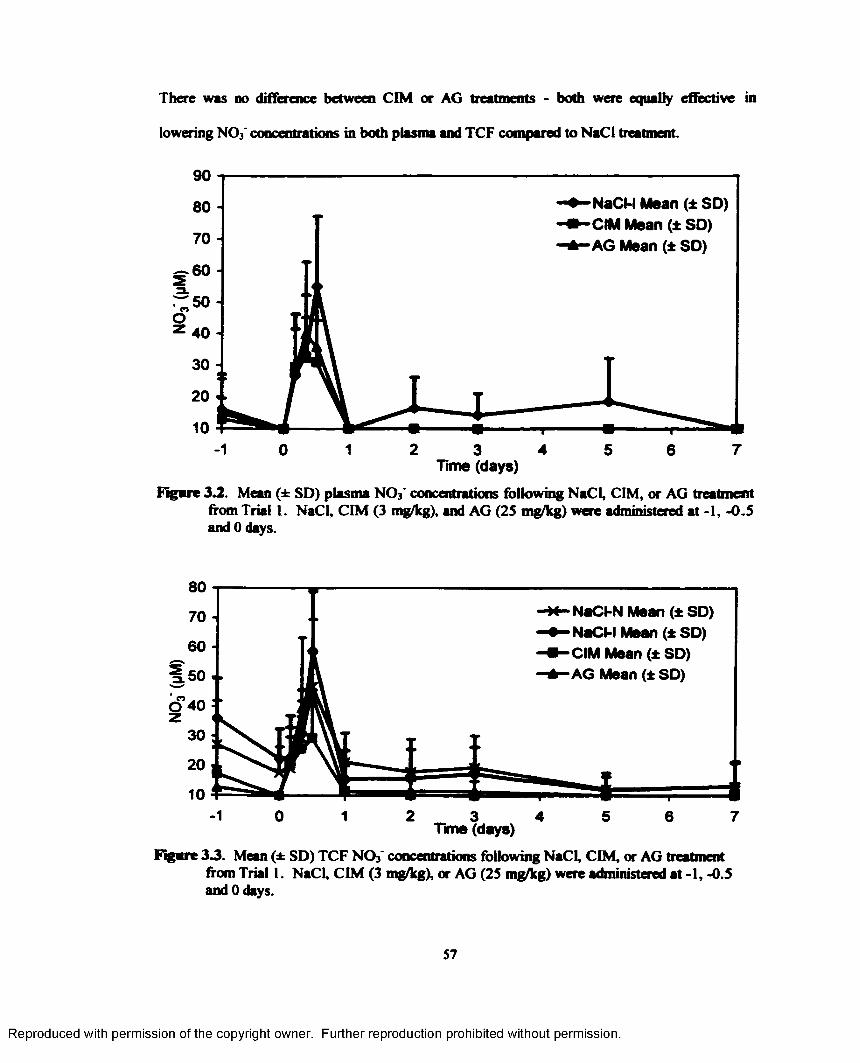
There was no difference between CIM or AG treatments - both were equally effective in
lowering N 03‘ concentrations in both plasma and TCF compared to NaCl treatment.
90
NaCM Mean (± SD) CIM Mean (± SD) AG Mean (± SD)
80
70
60
^ 5 0Oz 40
30
20
101 20 1 5 6 73 4
Time (days)
Figure 3.2. Mean (± SD) plasma N 03* concentrations following NaCl, CIM, or AG treatment from Trial I. NaCl, CIM (3 mg/kg), and AG (25 mg/kg) were administered at -1, -0.5 and 0 days.
80NaCI-N Mean (± SD) NaCM Mean (± SD) CIM Mean (± SD)AG Mean (± SD)
70
60
% 5 0 * n . _
O 40
30
20
101 20 1 3 5 764
Time (days)
Figure 3 3 . Mean (± SD) TCF N 03' concentrations following NaCl, CIM, or AG treatment from Trial 1. NaCl, CIM (3 mg/kg), or AG (25 mg/kg) were administered at -1, -0.5 and 0 days.
57
Reproduced with permission of the copyright owner. Further reproduction prohibited without permission.
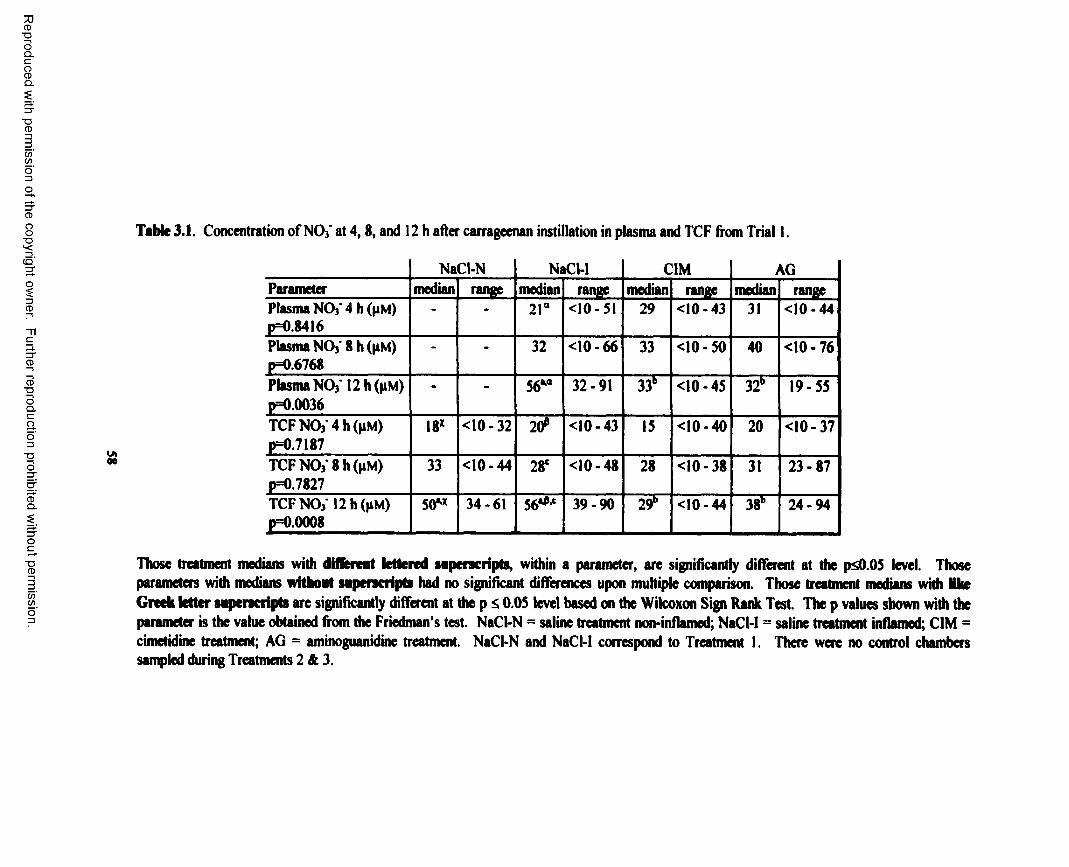
Reproduced
with perm
ission of the
copyright ow
ner. Further
reproduction prohibited
without
permission.
Tabic 3.1. Concentration of N03' at 4 ,8 , and 12 h after carrageenan instillation in plasma and TCF from Trial 1.
NaCI-N NaCI-1 CIM AGParameter median range median range median range median rangePlasma N03‘ 4 h (pM) p=0.8416
- * 21“ <10-51 29 <10-43 31 <10-44
Plasma NO)' 8 h (pM) p=0.6768
- - 32 <1 0 - 6 6 33 <10-50 40 <10-76
Plasma NO)' 12h(pM) p=0.0036
- • 56*’“ 32-91 33b <10-45 32b 19-55
TCF NO)' 4 h (pM) p=0.7187
18* <10-32 2 0 *̂ <10-43 15 <10-40 2 0 <10-37
TCF NOj* 8 h (pM) p=0.7827
33 <10-44 28* <10-48 28 <10-38 31 23-87
TCF NO)' 12h(pM)p=0.0008
50*1* 34-61 56*** 39-90 29b <10-44 38b 24-94
Those treatment medians with different lettered superscripts, within a parameter, are significantly different at the p^O.05 level. Those parameters with medians wftboat sapencripts had no significant differences upon multiple comparison. Those treatment medians with Hhe Greek letter sapencripts are significantly different at the p £ 0.0S level based on the Wilcoxon Sign Rank Test. The p values shown with the parameter is the value obtained from the Friedman’s test. NaCI-N = saline treatment non-inflamed; NaCI-I = saline treatment inflamed; CIM = cimetidine treatment; AG = aminoguanidine treatment. NaCI-N and NaCI-I correspond to Treatment I. There were no control chambers sampled during Treatments 2 & 3.
Data were also analyzed as AUC of NQf concentrations from -1 day to either 1, 3, or 7
days (Table 3.2). Data in Table 3.2 represent only those values which were significant (p £
0.05) using Friedman's test for ranked AUC values. Multiple comparison analysis revealed
significant differences in plasma AUC values (AUC.i_i, AUC.1-,3, and AUC.t_»7) for CIM
compared to NaCl treatment In addition, all three AUC values for TCF data were significantly
lowered by both CIM and AG treatment compared to NaCl. Again, there was no difference in
the effectiveness of CIM vs. AG treatments. It is also notable that there was no difference in
N O 3' values for the test vs. control chamber in NaCl treated animals.
Leukocyte response: Neutrophil (Figure 3.4), basophil, eosinophil, monocyte (Figure 3.S), and
lymphocyte (Figure 3.6) concentrations were measured in venous blood and in TCF as AUC
values, in the same manner as the N 03* data. The data in Table 3.3, which contains only values
for which significance (p £ 0.03) was indicated by Friedman’s test, clearly show that TCF
concentrations of neutrophils increased from days -1 to 3, compared to the control chamber.
When the data were expressed as the percent of cells*day (%«day) which were neutrophils,
there was also a difference between inflamed and non-inflamed chamber for AUC.i-** but not
for AUC.1-,7. Thus, while the numbers of neutrophils infiltrating the test chamber in response
to carrageenan increased, the percent of total cells which were neutrophils increased
significantly over the short term only, and not over the full 8 day term of the study.
Treatment with neither CIM nor AG produced a significant reduction in neutrophil
concentrations in the test chamber compared to NaCl treatment. This was also true for the
percentage of cells which were neutrophils. Lymphocyte concentrations in the control, NaCl
treated test chamber and CIM treated test chamber were not different, though the numbers in
the test chamber following AG treatment were somewhat higher than in the others. There were
no differences in the percentage of cells which were lymphocytes in TCF related to any
59
Reproduced with permission of the copyright owner. Further reproduction prohibited without permission.
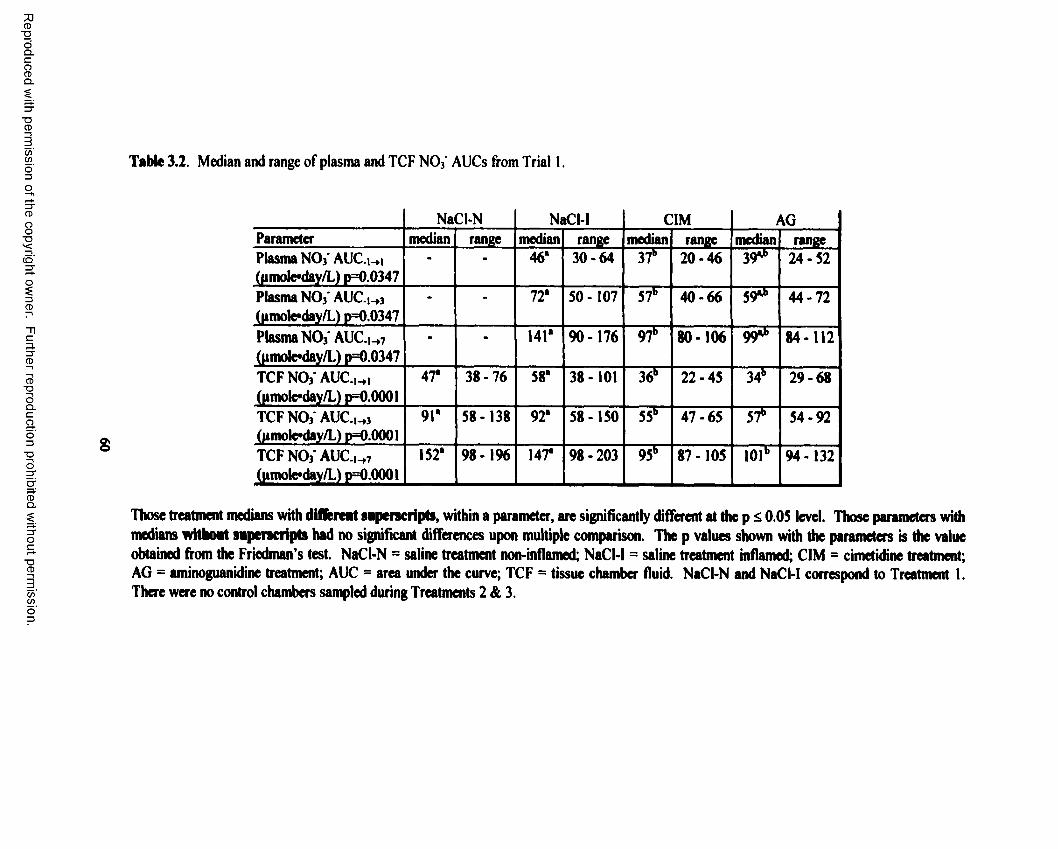
Reproduced
with perm
ission of the
copyright ow
ner. Further
reproduction prohibited
without
permission.
Table 3.2. Median and range of plasma and TCF N03‘ AUCs from Trial I.
NaCl-N NaCM CIM AGParameter median range median range median range median rangePlasma NO3' AUC.i_*i (|imole*day/L) p=0.0347
• - 46* 30-64 37b 20-46 39%b 24-52
Plasma NO/AUC.,-* (pmole*day/L) p=0.0347
- - 72* 50 -107 57b 40-66 59*h 44-72
Plasma NOj AUC.t_,7
(pmole»day/L) p=0.0347• • 141* 90-176 9 7b 80-106 99*b 84-112
TCFNOj’AUC.,.,, (pmole*day/L) p=0 .0001
47* 38-76 58* 38-101 36b 22-45 34b 29-68
TCFNO3 AUC.,_j (fimole*day/L) p=0.0001
91“ 58-138 92* 58-150 55b 47-65 57b 54-92
TCF NOj' AUC.,^7
(pmole*day/L) p=0 .0001
152' 98-196 147* 98 - 203 95b 87 -105 101b 94-132
Those treatment medians with different sapencripts, within a parameter, are significantly different at the p £ 0.0S level. Those parameters with medians witboat sapencripts had no significant differences upon multiple comparison. The p values shown with the parameters is the value obtained from the Friedman's test. NaCI-N = saline treatment non-inflamed; NaCI-I = saline treatment inflamed; CIM = cimetidine treatment; AG = aminoguanidine treatment; AUC - area under the curve; TCF = tissue chamber fluid. NaCI-N and NaCI-I correspond to Treatment 1. There were no control chambers sampled during Treatments 2 & 3.
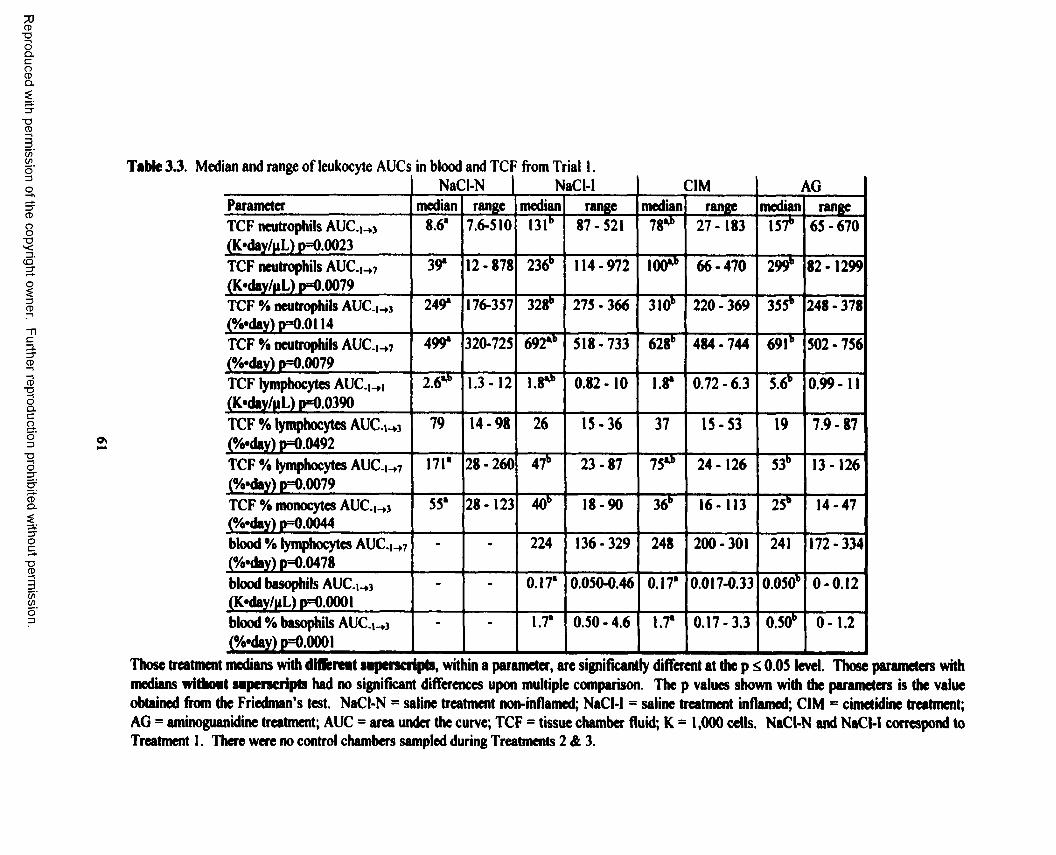
Reproduced
with perm
ission of the
copyright ow
ner. Further
reproduction prohibited
without
permission.
NaCI-N 1 NaCl-1 C1M AGParameter median range median range median range median rangeTCF neutrophils AUC.|_»j (K*day/|iL) p=0.0023
8 .6 * 7.6-510 I31b 87-521 781,b 27-183 157b 65-670
TCF neutrophils AUC.|_ ,7
(K*day/|iL) p=0.0079
39 . 12-878 236b 114-972 100*b 66-470 2991 82- 1299
TCF % neutrophils AUC.i-o (%»day) p=0.0114
249* 176-357 328b 275 - 366 310b 220 - 369 355b 248 - 378
TCF % neutrophils AUC.i_»7 (%*day) p=0.0079
499* 320-725 692*b 518-733 628b 484 - 744 691b 502-756
TCF lymphocytes AUC.|_»i (K*day/pL) p=0.0390
2 .6*’l> 1.3-12 1.8^ 0.82 - 1 0 1.8* 0.72-6.3 5.6b 0.99-11
TCF % lymphocytes AUC.j_»j (%«day) p=0.0492
79 14-98 26 15-36 37 15-53 19 7.9-87
TCF % lymphocytes AUC.|_ ,7
(%»day) p=0.0079171* 28-260 47b 23-87 75** 24-126 53b 13-126
TCF % monocytes AUC.,_o (%»day) p=0.0044
55* 28-123 40b 18-90 36b 16-113 25k 14-47
blood % lymphocytes AUC. |_ ,7
(%«day) p=0.0478• • 224 136-329 248 200 - 301 241 172-334
blood basophils AUC.i_,3 (K*day/pL) p=0.0001
- - 0.17* 0.050-0.46 0.17* 0.017-0.33 0.050b 0 - 0 .1 2
blood % basophils AUC.1^3
(%«day) p=0 .0001
• • 1.7* 0.50-4.6 1.7* 0.17-3.3 0.50b 0 - 1.2
Those treatment medians with different saperscripts, within a parameter, are significantly different at the p £ 0.0S level. Those parameters with medians withont saperscripts had no significant differences upon multiple comparison. The p values shown with the parameters is the value obtained from the Friedman’s test. NaCl-N = saline treatment non-inflamed; NaCI-I = saline treatment inflamed; C1M = cimetidine treatment; AG = aminoguanidine treatment; AUC = area under the curve; TCF = tissue chamber fluid; K = 1,000 cells. NaCI-N and NaCI-I correspond to Treatment 1. There were no control chambers sampled during Treatments 2 & 3.
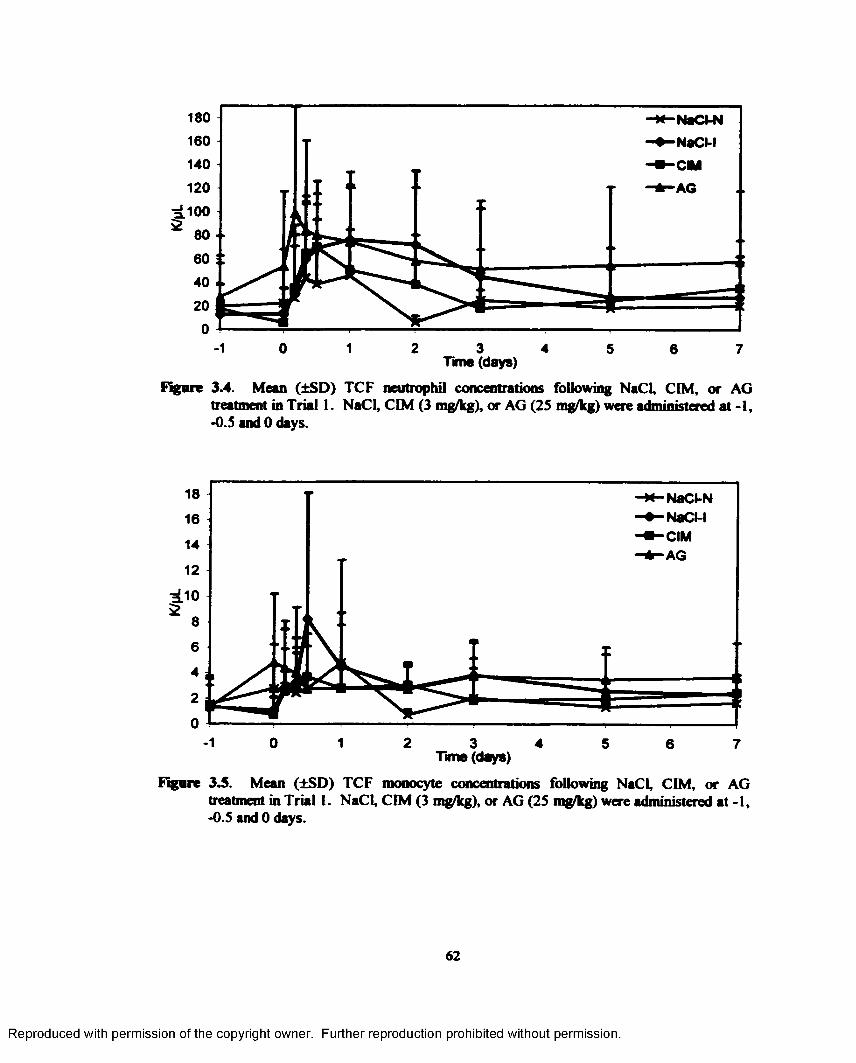
18016014012010080604020
0
1 0 1 2 3 4 5 6 7Time (days)
Figure 3.4. Mean (±SD) TCF neutrophil concentrations following NaCL, CIM, or AG treatment in Trial 1. NaCl, CIM (3 mg/kg), or AG (25 mg/kg) were administered at -1, -0.5 and 0 days.
18 -w-NaCFN-•-N aCM-•-C IM—• —AG
16
14
12
10
8
6
4
2
0
1 0 21 3 54 6 7
FigureTana (days)
3.5. Mean (±SD) TCF monocyte concentrations following NaCl, CIM, or AG treatment in Trial 1. NaCl, CIM (3 mg/kg), or AG (25 mg/lcg) were administered at -1, •0.5 and 0 days.
62
Reproduced with permission of the copyright owner. Further reproduction prohibited without permission.
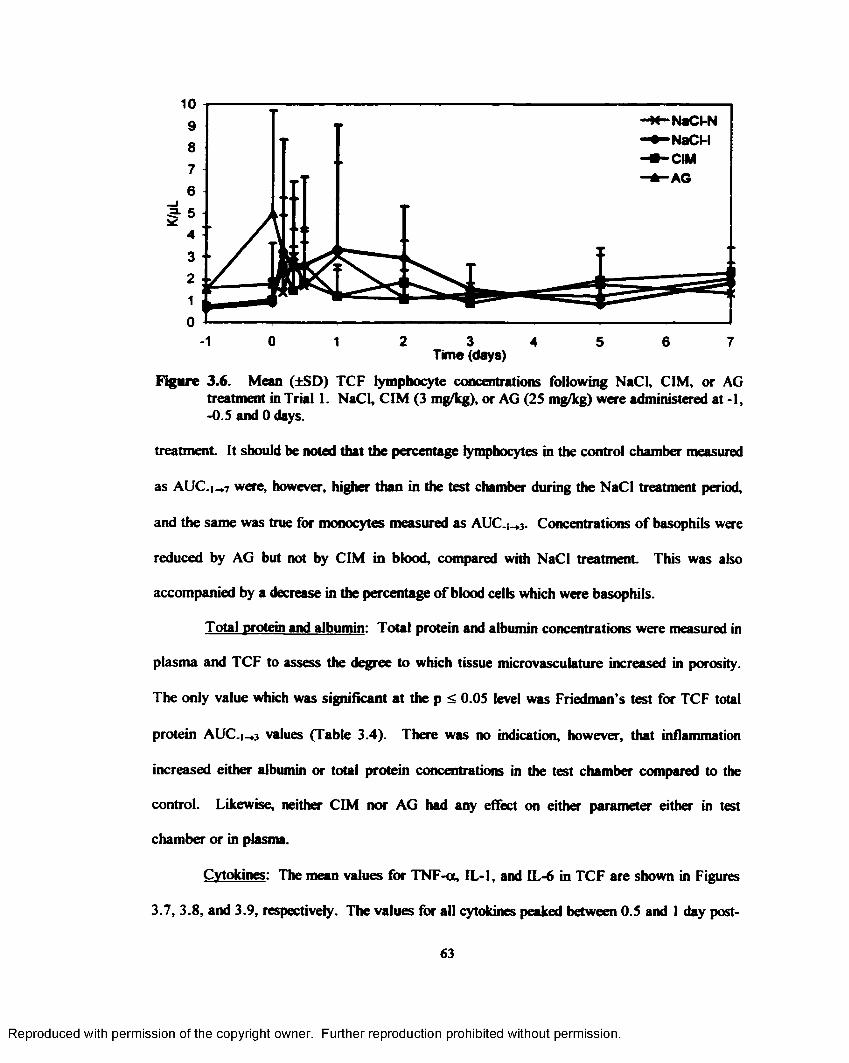
01 2 3 61 5 74Time (days)
Figure 3.6. Mean (±SD) TCF lymphocyte concentrations following NaCl, CIM, or AG treatment in Trial 1. NaCl, CIM (3 mg/kg), or AG (25 mg/kg) were administered at -1, -0.5 and 0 days.
treatment It should be noted that the percentage lymphocytes in the control chamber measured
as AUC. , - 7 were, however, higher than in the test chamber during the NaCl treatment period,
and the same was true for monocytes measured as AUC.[_3. Concentrations of basophils were
reduced by AG but not by CIM in blood, compared with NaCl treatment This was also
accompanied by a decrease in the percentage of blood cells which were basophils.
Total protein and albumin: Total protein and albumin concentrations were measured in
plasma and TCF to assess the degree to which tissue microvasculature increased in porosity.
The only value which was significant at the p < 0.05 level was Friedman’s test for TCF total
protein AUC-i_»3 values (Table 3.4). There was no indication, however, that inflammation
increased either albumin or total protein concentrations in the test chamber compared to the
control. Likewise, neither CIM nor AG had any effect on either parameter either in test
chamber or in plasma.
Cytokines: The mean values for TNF-ct, IL-1, and IL-6 in TCF are shown in Figures
3.7, 3.8, and 3.9, respectively. The values for all cytokines peaked between 0.5 and 1 day post-
63
Reproduced with permission of the copyright owner. Further reproduction prohibited without permission.
inflammation in TCF. Cimetidine treatment appeared to have a greater response than the NaCl-
I treatment There were no significant differences between values in any of the cytokines
following treatment None of the cytokines were detected in plasma at any time point in any of
the treatment groups. Interleukin-1 activity peaked twice in inflamed TCF following NaCl
treatment (Figure 3.8). Following inflammation in the NaCI-I group, IL- 6 activity also had a
double peak (Figure 3.9). The secondary increase appears to follow the infiltration of
leukocytes into the inflamed chambers with the primary response associated with resident
leukocytes (Figures 3.4, 5, and 6 ).
Data were also analyzed as AUC of TNF-a, IL-1, & IL- 6 concentrations from -1 day
to either 0.5, 1, 2 or 3 days. Those AUCs which showed a trend (0.10 £ p £ 0.05) or were
significant following the Friedman test are shown in Table 3.5. Lack o f significance at the
earlier time points for IL-1 and 6 may be due to a lack o f sample for cytokine analysis which
resulted in missing data points, this being especially true for the CIM treatment
PGE->: Tissue chamber fluid concentrations of PGE2 are shown in Table 3.6. Due to
the lack of available TCF samples, statistical analysis was not conducted. There were no
detectable PGE2 concentrations in plasma from any animal in any treatment group. This is
consistent with results reported by Higgins & Lees (1984).
3 3 .b . Trial 2
Nitric Oxide: Mean N 03' concentrations in plasma and TCF increased markedly
during the first 8 h following instillation of carrageenan into the test chamber, but returned to
baseline values by 24 h (Figure 3.10). Mean values were low and variable, but less variable
than in Trial 1, on days -2 and 1. As in Trial 1, plasma N 0 3" values paralleled those observed
for TCF following test chamber inflammation (Table 3.7 and Figure 3.10). Comparison of N 03‘
64
Reproduced with permission of the copyright owner. Further reproduction prohibited without permission.
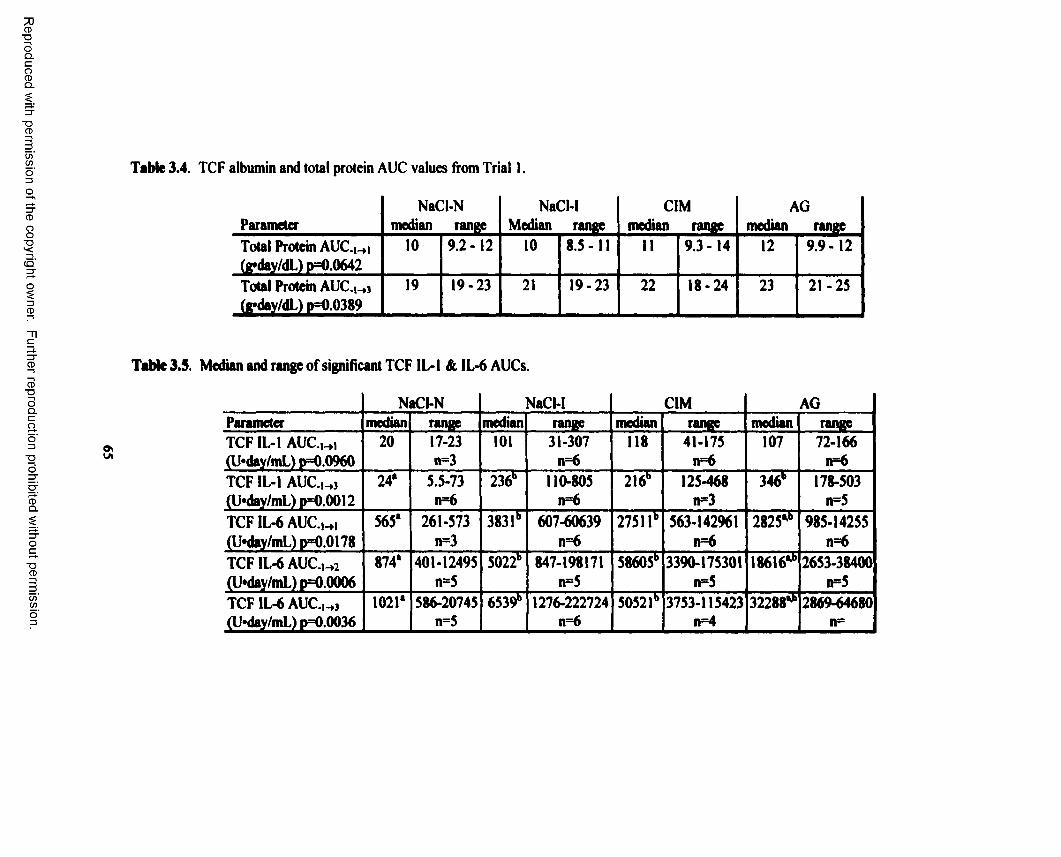
Reproduced
with perm
ission of the
copyright ow
ner. Further
reproduction prohibited
without
permission.
Table 3.4. TCF albumin and total protein AUC values from Trial I .
ParameterNaCI-N
median rangeNaCI-I
Median rangeCIM
median rangeAG
median rangeTotal Protein AUC.,-, (g*day/dL) p=0.0642
10 9.2-12 10 8.5 -11 11 9.3 -14 12 9.9-12
Total Protein AUC.1-3
(g*day/dL) p=0.038919 19-23 21 19-23 22 18-24 23 21-25
Table 3.5. Median and range of significant TCF IL-1 & IL-6 AUCs.
NaCI-N NaCI-I CIM AGParameter median range median range median range median rangeTCF IL-1 AUC.,-, (U*day/mL) p=0.0960
20 17-23n=3
101 31-307n= 6
118 41-175n= 6
107 72-166n= 6
TCF IL-1 AUC.,-, (U*day/mL) p=0.0012
24* 5.5-73n= 6
236b 110-805n= 6
216b 125-468n=3
346b 178-503n=5
TCF IL-6 AUC.,-1
(U»day/mL) p=0.0178565* 261-573
n=3383 lb 607-60639
n= 6
27511" 563-142961n= 6
2825*" 985-14255n= 6
TCF IL-6 AUC. , - 2
(U*day/mL) p=0.0006874* 401-12495
n=55022b 847-198171
n=558605b 3390-175301
n=518616*" 2653-38400
n=5TCF IL-6 AUC.,-, (U*day/mL) p=0.0036
1021* 586-20745n=5
6539** 1276-222724n= 6
5052lb 3753-115423n=4
32288*** 2869-64680n=
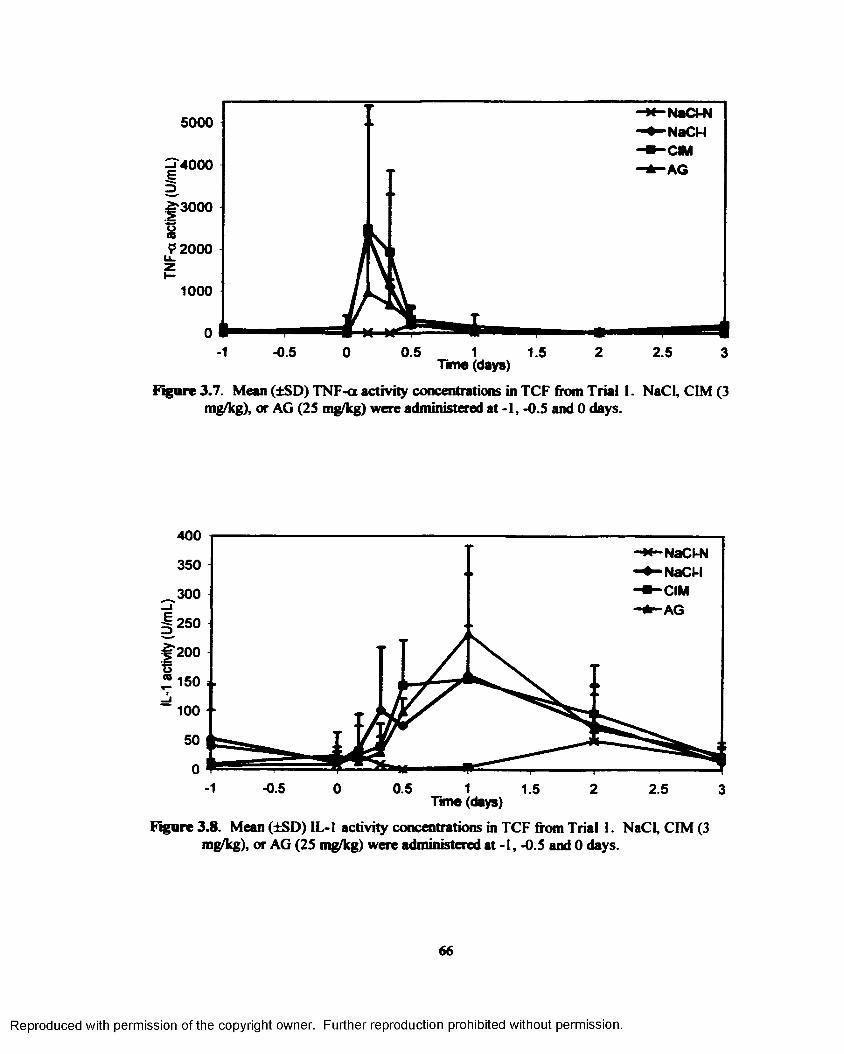
NaCI-NNaCMCIMAG
5000
9 2000
1000
-1 -0.5 0.5 1 2 2.50 1.5 3Time (days)
Figure 3.7. Mean (±SD) TNF-a activity concentrations in TCF from Trial 1. NaCl, CIM (3 mg/kg), or AG (25 mg/kg) were administered at -1, -0.5 and 0 days.
400NaCI-NNaCMCIMAG
350
300
250
200
150
~ 100
-0.5-1 0 0.5 1 2 2.51.5 3Time (days)
Figure 3.8. Mean (±SD) IL-1 activity concentrations in TCF from Trial 1. NaCl, CIM (3 mg/kg), or AG (25 mg/kg) were administered at -I, -0.5 and 0 days.
66
Reproduced with permission of the copyright owner. Further reproduction prohibited without permission.
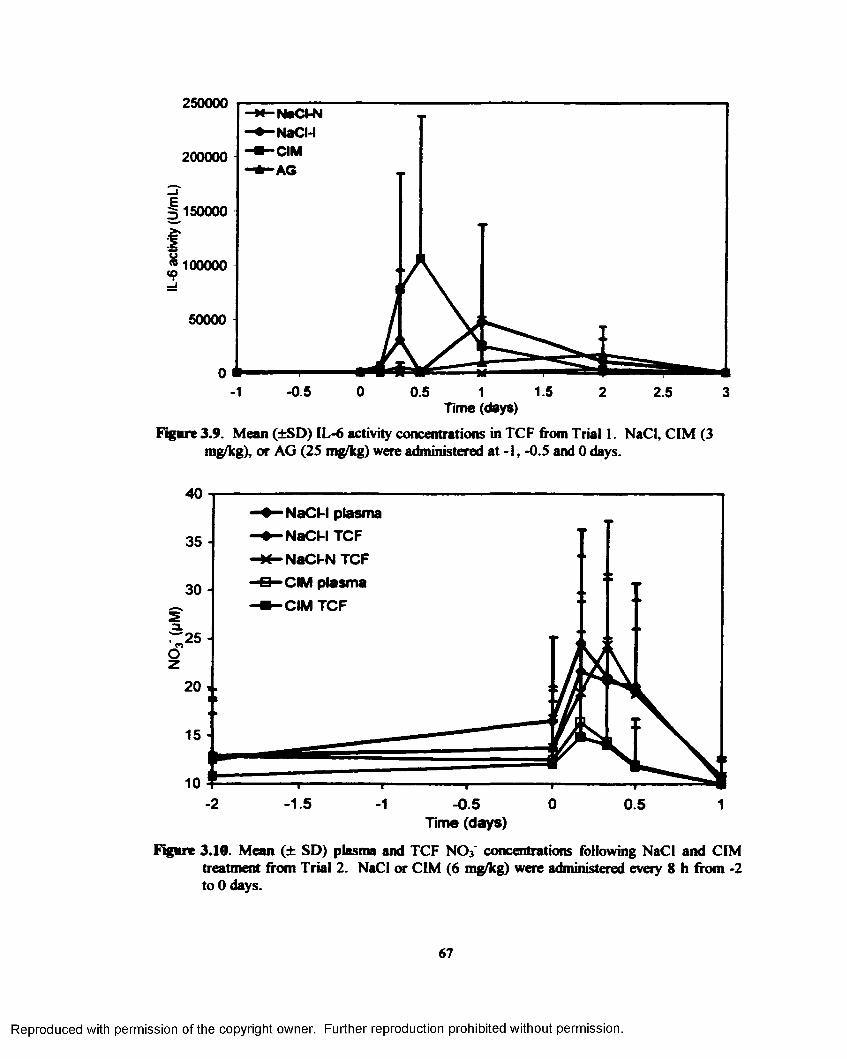
2S0000
200000
150000
■ 100000
50000
0 *-1 -0.5 0 1.50.5 1 2.5 32
Time (days)Figure 3.9. Mean (±SD) IL- 6 activity concentrations in TCF from Trial 1. NaCl, CIM (3
mg/kg), or AG (25 mg/kg) were administered at -1, -0.5 and 0 days.
40NaCI-I plasma NaCH TCF NaCI-N TCF CIM plasma CIM TCF
20
1.52 01 -0.5 0.5 1Time (days)
Figure 3.10. Mean (± SD) plasma and TCF NO3' concentrations following NaCl and CIM treatment from Trial 2. NaCl or CIM ( 6 mg/kg) were administered every 8 h from -2 to 0 days.
67
Reproduced with permission of the copyright owner. Further reproduction prohibited without permission.
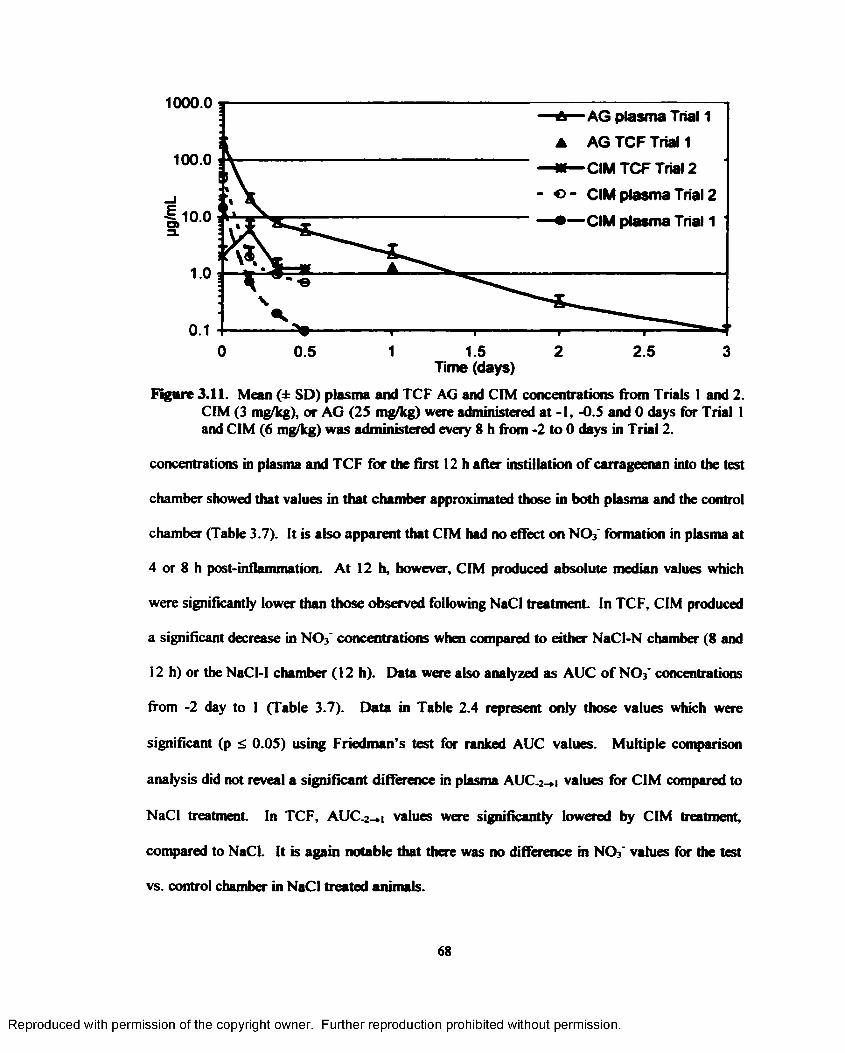
1000.0•A— AG plasma Trial 1 ▲ AG TCF Trial 1
100.0 i — * — CIM TCF Trial 2
- o - CIM plasma Trial 2 — • — CIM plasma Trial 1 '
1.0
0.10 0.5 1 1.5 2 2.5 3
Time (days)Figure 3.11. Mean (± SD) plasma and TCF AG and CIM concentrations from Trials 1 and 2.
CIM (3 mg/kg), or AG (25 mg/kg) were administered at -1, -0.5 and 0 days for Trial 1 and CIM (6 mg/kg) was administered every 8 h from -2 to 0 days in Trial 2.
concentrations in plasma and TCF for the first 12 h after instillation o f carrageenan into the test
chamber showed that values in that chamber approximated those in both plasma and the control
chamber (Table 3.7). It is also apparent that CIM had no effect on N 0 3' formation in plasma at
4 or 8 h post-inflammation. At 12 h, however, CIM produced absolute median values which
were significantly lower than those observed following NaCl treatment. In TCF, CIM produced
a significant decrease in N 03‘ concentrations when compared to either NaCI-N chamber ( 8 and
12 h) or the NaCI-I chamber (12 h). Data were also analyzed as AUC o f N 0 3' concentrations
from -2 day to 1 (Table 3.7). Data in Table 2.4 represent only those values which were
significant (p < 0.05) using Friedman’s test for ranked AUC values. Multiple comparison
analysis did not reveal a significant difference in plasma AUC.2_»i values for CIM compared to
NaCl treatment. In TCF, AUC.2-*i values were significantly lowered by CIM treatment,
compared to NaCl. It is again notable that there was no difference in N 03* values for the test
vs. control chamber in NaCl treated animals.
68
Reproduced with permission of the copyright owner. Further reproduction prohibited without permission.
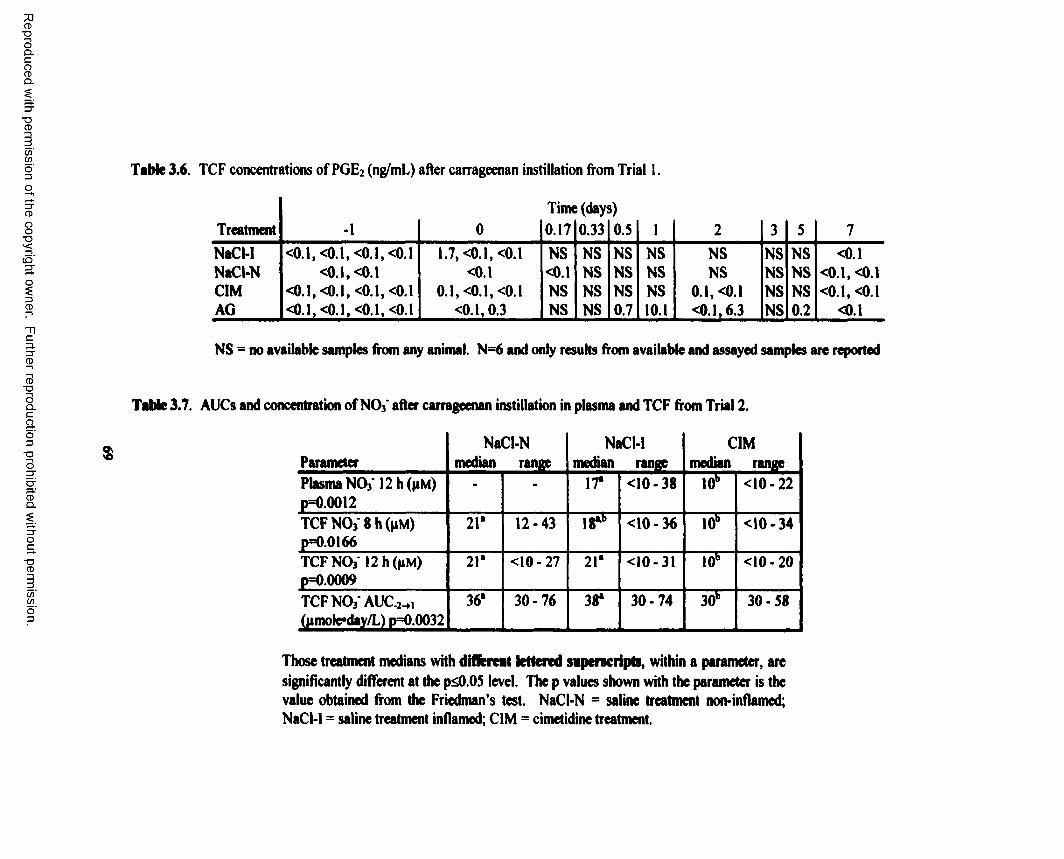
Reproduced
with perm
ission of the
copyright ow
ner. Further
reproduction prohibited
without
permission.
Table 3.6. TCF concentrations of PGE2 (ng/mL) after carrageenan instillation from Trial 1.
Time (days)Treatment -1 0 0.17 0.33 0.5 1 2 3 5 7NaCI-I <0 .1, <0 .1, <0 .1, <0.1 1.7, <0.1, <0.1 NS NS NS NS NS NS NS <0.1NaCI-N <0 .1, <0.1 <0.1 <0.1 NS NS NS NS NS NS <0 .1, <0.1CIM <0 .1, <0 .1, <0 .1, <0.1 0 .1, <0 .1, <0.1 NS NS NS NS 0 .1, <0.1 NS NS <0 .1, <0.1AG <0 .1, <0 .1, <0 .1, <0.1 <0.1,0.3 NS NS 0.7 10.1 <0.1,6.3 NS 0 .2 <0.1
NS = no available samples from any animal. N= 6 and only results from available and assayed samples are reported
Table 3.7. AUCs and concentration ofNOj' after carrageenan instillation in plasma and TCF from Trial 2.
ParameterNaCI-N
median rangeNaCI-l
median rangeCIM
median rangePlasma NO}' 12 h (pM)p=0 .0 0 1 2
- - 17* <10-38 10b <1 0 - 2 2
TCF NOj 8 h (pM)p=0.0166
2 1* 12-43 18*b <10-36 10b <10-34
TCFNOj 12h(pM) p=0.0009
21* <10-27 21* <10-31 10b <1 0 - 2 0
TCF NO}' AUC.2-H (pmole*day/L) p=0.0032
36* 30-76 38* 30-74 30b 30-58
Those treatment medians with different lettered saperscripts, within a parameter, are significantly different at the p̂ O.OS level. The p values shown with the parameter is the value obtained from the Friedman’s test. NaCI-N = saline treatment non-inflamed; NaCI-I = saline treatment inflamed; CIM = cimetidine treatment.
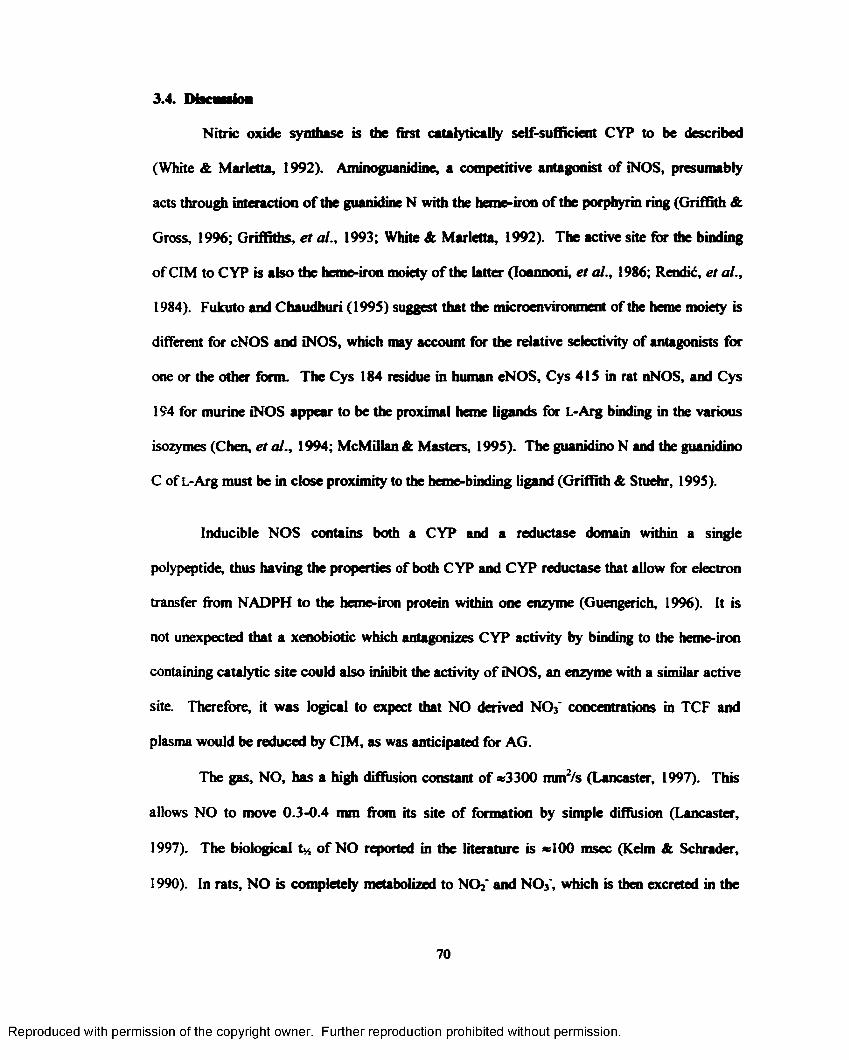
3.4. DfaoMfcHi
Nitric oxide synthase is the first catalytically self-sufficient CYP to be described
(White & Marietta, 1992). Aminoguanidine, a competitive antagonist of iNOS, presumably
acts through interaction o f the guanidine N with the heme-iron of the porphyrin ring (Griffith &
Gross, 1996; Griffiths, et al., 1993; White & Marietta, 1992). The active site for the binding
of CIM to CYP is also the heme-iron moiety of the latter (Ioannoni, et al., 1986; Rendic, et al.,
1984). Fukuto and Chaudhuri (199S) suggest that the microenvironment of the heme moiety is
different for cNOS and iNOS, which may account for the relative selectivity of antagonists for
one or the other form. The Cys 184 residue in human eNOS, Cys 41S in rat nNOS, and Cys
194 for murine iNOS appear to be the proximal heme ligands for L-Arg binding in the various
isozymes (Chen, et al., 1994; McMillan & Masters, 199S). The guanidino N and the guanidino
C of L-Arg must be in close proximity to the heme-binding ligand (Griffith & Stuehr, 199S).
Inducible NOS contains both a CYP and a reductase domain within a single
polypeptide, thus having the properties of both CYP and CYP reductase that allow for electron
transfer from NADPH to the heme-iron protein within one enzyme (Guengerich, 1996). It is
not unexpected that a xenobiotic which antagonizes CYP activity by binding to the heme-iron
containing catalytic site could also inhibit the activity o f iNOS, an enzyme with a similar active
site. Therefore, it was logical to expect that NO derived N 03' concentrations in TCF and
plasma would be reduced by CIM, as was anticipated for AG.
The gas, NO, has a high diffusion constant of *3300 mm2/s (Lancaster, 1997). This
allows NO to move 0.3-0.4 mm from its site of formation by simple diffusion (Lancaster,
1997). The biological t% of NO reported in the literature is *100 msec (Kelm & Schrader,
1990). In rats, NO is completely metabolized to NO2' and N 03\ which is then excreted in the
70
Reproduced with permission of the copyright owner. Further reproduction prohibited without permission.
urine (Kelm Sc Yoshida, 1996). The major metabolite is N 03\ accounting for *90% of the
excreted N following [1SN]0 administration (Kelm Sc Yoshida, 1996). Based on the molecular
weights of N O / and NO/, it could be assumed that they are freely filtered by the kidneys and, if
not reabsorbed, elimination would parallel glomerular filtration rate (Guyton Sc Hall, 1996).
The finding that NO/ concentrations in plasma and control chamber TCF paralleled those in
test chamber TCF suggests that NO was rapidly converted to N 03\ and that N O/, in turn,
rapidly attained equilibrium between plasma and TCF. The nearly identical median
concentrations of control chamber TCF and plasma were also probably the result of
equilibration of NO3* between plasma and fluid of that chamber.
In the absence of 0 2, NO dissolves in H2O and is very stable. In air it will react with
0 2 to form NO2. In HjO and plasma, NO is oxidized to NO/, which is stable for several hours.
In whole blood, N O / and, to a much greater extent NO, are rapidly converted to N O / via a Hb
catalyzed oxidation (Doyle & Hoekstra, 1981; Moncada & Higgs, 1993; Wennmalm, et al.,
1992). As little as 0.2 mM Hb (4% o f normal blood concentration) essentially eliminates the
presence of NO in arterial blood (Henry Sc Singel, 19%; Lancaster, 1997) in <2 sec with
peroxynitrite (ONOO") and/or nitrosyl Hb serving as a possible intermediates (Doyle &
Hoekstra, 1981; Henry & Singel, 1996). The stoichiometry of L-Arg to L-citrulline to the
formation of NO,' is 1:1:1 (Pufahl, et al., 1992; Yui, et al., 1991). Nitrate has a terminal t* of
3.8 h in the dog (Zeballos, et al., 1995) and 4.8 h in ponies (Schneider Sc Yeary, 1975). Little
is known about how N 03' is handled by the kidneys. It has been assumed based on the
molecular weights of N O / and NO3' that plasma NO3* is freely filterable, but it has been
postulated that the kidney may synthesize, release, and/or concentrate N O / (Grisham, et al.,
1996). Nitrate is reabsorbed preferentially over Cl' in the kidney (Greene Sc Hiatt, 1953;
Greene & Hiatt, 1954).
71
Reproduced with permission of the copyright owner. Further reproduction prohibited without permission.
Both CIM and AG treatment resulted in a failure of N 03' concentrations in plasma or
test chamber to rise significantly between 4 and 12 h post-carrageenan instillation.
Additionally, die plasma concentrations were similar to TCF concentrations at each o f the three
time points, even though the values at 12 h were substantially lower than for either chamber
during NaCl treatment This supports the above interpretation that NO, measured as N 03\
equilibrates fairly rapidly between vascular and non-vascular compartments.
It is clear from this study, and others, that carrageenan stimulates the production of NO
in inflamed tissues (Ianaro, et al., 1994; Koga, et al., 1995; Salvemini, et al., 1995; Tracey, et
al., 1995). The above referenced reports also suggest that the increase in NO production can be
attributed to the infiltration of leukocytes, mainly neutrophils and tissue macrophages, that
subsequently become activated at the inflammatory site, resulting in an increase in NO
production. Adler, et al., (1996) reported that activated macrophages are those in which iNOS
has been induced and production of NO within the cell has increased. This increase is believed
to be partly due to NO itself as it can act both as an inhibitor and activator of COX (Di Rosa,
et al., 1996; Imai, et al., 1993; Salvemini, et al., 1993; Salvemini, et al., 1995). A product of
COX, PGE2, can in turn act as a stimulator o f iNOS synthesis. This also applies to various
pro-inflammatory cytokines, such as IL-1 (3 and TNF-cl These compounds can be formed as
part of an inflammatory response and start a pro-inflammatory cytokine cascade, which also
stimulates the production of NO (Ianaro, et al., 1994). These three pro-inflammatory agents
are known to both induce and inhibit various isoforms of CYP (Kudo & Kawano, 1999;
Morgan, 1997; Sewer, et al., 1996; Sewer & Morgan, 1997). These CYP proteins may be
metabolizing L-Arg to NO and L-chrulline in this carrageenan inflammation model. It is
unknown if the concentrations of PGE2, TNF-a, IL-1, and IL-6 produced in the TCF o f this
72
Reproduced with permission of the copyright owner. Further reproduction prohibited without permission.
study are sufficient to induce CYP isofbnns, but this possibility cannot be discarded as a
possible explanation of the source of N 03‘ and the reduction o f N 03' be CIM and AG.
The presence of membrane bound Hr receptors on leukocytes has been previously
reported (Tasaka, et al., 1992; Vaimier, et al., 1991). It is possible that iNOS could be coupled
to membrane bound Hrreceptors on leukocytes, similar to the mechanism by which IL-6
synthesis and receptor expression is altered (Mer&ey, et al., 1991; Vannier & Dinarello, 1994)
or increases IL-13 mRNA levels (Vannier & Dinarello, 1993). If NO production were
regulated by an Hrreceptor mechanism, then administration o f HIS would cause an increase in
NO production or iNOS mRNA synthesis. Histamine regulates the formation of many pro-
inflammatory mediators (Auer, et al., 1991; Rezai, et al., 1990; Vannier, et al., 1991), so it
would not be surprising if it had a role in regulating NO production (Kelm, et al., 1993;
Mannaioni, et al., 1997).
There is no documented interaction of either L-Arg or AG with Hrreceptors. It is
possible, however, to hypothesize that since CIM binds to these receptors (Brimblecombe, et
al., 1978), a similar guanidine-like compound such as AG could also interact. If so, then it
could also be possible for AG or CIM to be internalized through interaction with the receptor,
allowing for transport of the compound across the membrane and into the cytosolic space,
where it could interact with iNOS.
The NO produced in response to carrageenan is attributed mainly to neutrophils and
macrophages (Ianaro, et al., 1994; Koga, et al., 199S; Salvemini, et al., 1995; Tracey, et al.,
1995). In all o f these studies, the production of NO or the induction of iNOS mRNA reached
maximum levels at 12 h post stimulation. One study that employed immunohistochemical
staining for iNOS, showed that most o f the activity was associated with tissue macrophages
73
Reproduced with permission of the copyright owner. Further reproduction prohibited without permission.
(Salvemini, et al., 1995). In Trial 1, the increase in N 03* production paralleled the influx of
neutrophils into the chamber (Tables 3.2 & 3.3).
The presence o f high NCV concentrations on day -1 in Trial I was unexpected. The
treatment portion of this study was begun in the month of October. The Bahia grass pasture
that the animals were held in immediately prior to the first treatment was still growing, and at
approximately two weeks before the start o f the study it had been fertilized with 91 kg/acre of
urea. Urea is known to be taken up by plants and converted to N H / and then to N 03‘ for
storage and later use as a N source (Pilbeam & Kirkby, 1990). Since all animals received the
NaCl treatment first and closest in time to the urea treatment of the grass, it is possible that
elevated concentrations of N 03‘ on day -1 are due to N 03' concentrations in the grass. As the
study progressed and less fresh grass was available, the -1 day N 03' concentrations decreased,
coincident with AG and CIM treatment This is the only time a N source was applied to the
pasture during the course of the study and offers a plausible explanation of the results observed
on day -1. Additionally, the animals were maintained in a stall bam and fed only pelleted feed
during the treatment and sampling period. The plasma t<* of N 03' following IV administration
of NaN02 has been estimated at *4.8 h in pomes (Schneider & Yeary, 1975). Thus it would
not be surprising to find that while N 03' concentrations were variable and somewhat high at day
-1, they declined substantially by day 0 in both plasma and TCF. This problem was avoided in
the design of Trial 2 by holding the animals in non-bedded stalls and feeding only pelleted feed
for two weeks before initiation of the study.
It is possible that the lack of a parallel reduction in TNF-a, IL-1, & IL-6 production
with N 03‘ prior to day 3 of the study may be due to the regulation of iNOS. For induction of
iNOS, pro-inflammatory cytokines must first be produced. Once this takes place and results in
increased NO production, the resulting increase in NO causes a positive feedback to increase
74
Reproduced with permission of the copyright owner. Further reproduction prohibited without permission.
TNF-a, IL-1, & IL-6 production. Even with CIM and AG pretreatment, the resulting decrease
in NO production appears to be too late to decrease the early cytokine response. However, it
may assist in preventing the NO-induced up-regulation of p ro inflammatory cytokine
production.
The expected result of CIM treatment decreasing IL-1 and IL-6 production (Vannier &
Dinarello, 1993; Vannier & Dinarello, 1994) was not observed in this study. While there was
no significant difference between the AUCs of IL-1 or IL-6 in NaCI-N TCF vs. CIM TCF, the
CIM treatment was also not different from the inflamed TCF. It is possible that this is a result
of the dosage regimen used in Trial 1. This could have resulted in sub-efficacious
concentrations o f CIM present in TCF and the inability of CIM to inhibit IL-1 and IL-6
production to a level that would be statistically significant
In conclusion, CIM, an H2-receptor antagonist used to treat and prevent gastric
ulceration, is effective in inhibiting inflammation generated NO associated NO3' concentrations.
This could occur via the same mechanism of heme-iron binding that CIM employs to inhibit
CYP mediated metabolism. The effect could also be at least partially attributed to an
interaction at H2-receptors on leukocytes or macrophages. This finding brings focus to; 1) the
potential effect o f similar H2-receptor antagonists on inflammation related NO production; 2)
the possibility that other guanidine moiety containing substances may affect NO production; 3)
the question of whether CIM or other H2-receptor antagonists inhibit constitutive NOS isoforms
and therefore affect physiologic processes other than inflammation, and finally 4) the possibility
that the reduction in gastric acid production produced by p recep to r antagonists is in fact
mediated partially through a reduction in local NO production.
Reproduced with permission of the copyright owner. Further reproduction prohibited without permission.
may assist in preventing the NO-induced up-regulation of pro-inflammatory cytokine
production.
The expected result o f CIM treatment decreasing IL-1 and IL- 6 production (Vannier &
Dinarello, 1993; Vannier & Dinarello, 1994) was not observed in this study. While there was
no significant difference between the AUCs o f IL-1 or IL-6 in NaCI-N TCF vs. CIM TCF, the
CIM treatment was also not different from the inflamed TCF. It is possible that this is a result
o f the dosage regimen used in Trial 1. This could have resulted in sub-efficacious
concentrations of CIM present in TCF and the inability o f CIM to inhibit IL-1 and IL-6
production to a level that would be statistically significant
In conclusion, CIM, an Hr-receptor antagonist used to treat and prevent gastric
ulceration, is effective in inhibiting inflammation generated NO associated N 03' concentrations.
This could occur via the same mechanism of heme-iron binding that CIM employs to inhibit
CYP mediated metabolism. The effect could also be at least partially attributed to an
interaction at Hrreceptors on leukocytes or macrophages. This finding brings focus to; 1) the
potential effect o f similar H^receptor antagonists on inflammation related NO production; 2)
the possibility that other guanidine moiety containing substances may affect NO production; 3)
the question o f whether CIM or other Hz-receptor antagonists inhibit constitutive NOS isoforms
and therefore affect physiologic processes other than inflammation, and finally 4) the possibility
that the reduction in gastric acid production produced by Hz-receptor antagonists is in fact
mediated partially through a reduction in local NO production.
76
Reproduced with permission of the copyright owner. Further reproduction prohibited without permission.
CHAPTER 4 - MECHANISM OF CIMETTDINE AND AM INOGUANIDINE INTERACTION W ITH HEPATIC M ICROSOM ES AND EQUINE LEUKOCYTE
PROTEIN
4.1. Iutrod action
All isoforms of NOS are homodimcrs with a molecular weight of *300 kDa (Yui, et
al., 1991), which contain a heme-iron protein with binding sites for the following co
substrates/cofactors: O2, NADPH, FAD, FMN, (Stuehr A Ikeda-Saito, 1992), L-Arg, and
THB (Di Rosa, et al., 1996; Fukuto A Chaudhuri, 1993; Gross A Levi, 1992). The normal
endogenous concentration of L-Arg is between 100 and 800 mM with iNOS having a Kn, o f *17
HM (HeveL, et al., 1991; Frey, etal., 1994). Inducible NOS formation is regulated primarily by
induction of NOS protein synthesis at the transcription level via several cytokines, such as
TNF-a, INF-y, and IL-13 (Adler, et al., 1995; de Vera, et al., 1996; Geller, et al., 1993;
Spink, etal., 1995).
Cimetidine is a proven inhibitor o f CYP (Ioannoni, et al., 1986; Rendic, et al., 1984).
Farup, et al. (1988) mentions that this effect is also observed after IV administration o f RAN.
The inhibition o f CYP is mediated through this heme containing protein by binding to
structurally similar H2-antagonists as a 6 * axial ligand with Fe, and CIM having the lowest KD
(Rendic, et al., 1983). This binding results in a Type II optical difference spectrum (Lin A Lu,
1998; Schenkman, et al., 1967) associated with the direct binding of CIM to the heme moiety of
CYP. Both the cyano and imidazole groups of CIM have been shown to bind to the heme-iron
at the 6 th axial position (Rendic, et al., 1983). Cimetidine is known to inhibit CYP 2C6 and
2C11 in vitro and in vivo (Levine, et al., 1998). Cimetidine does not interact with all heme-
containing proteins as it has been shown not to form a 6 * axial ligand on the heme-iron of
mouse catalase (Baird, et al., 1987).
77
Reproduced with permission of the copyright owner. Further reproduction prohibited without permission.
Several different experiments were undertaken in the following sequence. The first
group of experiments were conducted to determine if AG, HIS, and the Hrantagonists (CIM,
RAN, or ZAL) alter the spin state of the Fe in the heme-iron proteins CYP and iNOS.
Cimetidine binding to CYP results in a Type fi optical difference spectrum (Lin & Lu, 1998;
Schenkman, et al., 1967) associated with the direct binding o f CIM to the heme moiety of CYP.
The binding of L-Arg to NOS results in a Type I spectra and is similar to the spectra obtained
from CYP after binding o f various substrates and suggests that L-Arg is altering the heme
microenvironment of NOS (Kerwin, et al., 199S). The method o f McMillan, et al. (1992) was
used to determine whether Type I or Type II binding spectra were associated with the binding of
CIM, RAN, ZAL, HIS, and AG to iNOS in equine leukocytes collected from tissue chambers.
If any of these compounds produce a Type I difference spectra, this would indicate that binding
was taking place at a hydrophobic site in the protein near the heme iron, thus altering the heme
microenvironment of CYP and/or NOS. If a Type II difference spectra is observed, then these
ligands are interacting directly with the heme iron at the 6 * axial position (Alvares & Pratt,
1990). Additional experiments were conducted to determine if spectral changes occurred with
CIM in the presence of equine Hb, and the effect of CIM on the conversion of NO to N0 3\
This was done in an attempt to specifically determine where in the metabolism of L-Arg to N 03'
CIM was inhibiting the formation of N 03‘. Hemoglobin is necessary for the conversion of NO
to N 03‘ (Doyle & Hoekstra, 1981; Moncada & Higgs, 1993; Wennmalm, et al., 1992) and as a
heme-containing protein, may be bound by CIM resulting in decreases in N 03' production. The
following spectral studies were conducted in order to confirm that CIM would produce a Type
II binding spectra when added to hepatic microsomes, and to provide basic data about the
difference spectra produced by RAN, ZAL, HIS, and AG with hepatic microsomes.
78
Reproduced with permission of the copyright owner. Further reproduction prohibited without permission.
4.2. Materials & Methods
4.2 .a. Experiment 1
Two male rats from the LSU Department of Laboratory Animal Medicine was
euthanized with C 02. The livers were immediately removed and flushed with *200 mL of
chilled (*4°C) physiological buffered NaCl (PBS). They were homogenized using a chilled
(*4°C) teflon pestle and glass tube in 2 volumes (*40 mL) of 0.5 M K2H P04 (pH 7.2). The
resulting suspension was then centrifuged at 9,000 xg for 20 min (S°C). The supernatant was
then centrifuged for one h at 110,000 xg (S°C). The supernatant was removed and the pellet
resuspended in an equal volume of 0.1 M 4-(2-hydroxyethyl)-1 -piperazine-ethanesulfonic acid
(HEPES) buffer (pH 7.2) using a one mL syringe with a 25 gauge needle. The suspension was
again centrifuged for one h at 110,000 xg (5°C), the supernatant removed and the pellet
resuspended in 0.1 M HEPES as above.
Total protein was determined using a commercially available assay (Micro Protein
Determination, Sigma Diagnostics, St. Louis, MO). Fifty pL of standard or sample was added
to 2.5 mL o f diluted (1:4) protein dye reagent (Coomassie blue) and incubated for 2 min. The
samples were then placed in a spectrophotometer (U-3010, Hitachi Instruments, Ltd., Tokyo,
Japan), and absorbance was measured at X=595 nm. Linear regression analysis was performed
on the standards to obtain a regression equation and quantitate unknowns. All standards and
unknowns were assayed in duplicate.
Carbon monoxide (CO) difference spectra were also obtained as described by Omura &
Sato (1964). Three mL of hepatic microsome suspension had CO bubbled through for 30 sec.
One mL disposable cuvettes were used for all scans. A one mL sample was then scanned using
a UV/VTS scanning spectrophotometer over the range of 350-500 nm, in triplicate. Dithionite
was added and the scan repeated. The resulting scans were subtracted from each other to yield
79
Reproduced with permission of the copyright owner. Further reproduction prohibited without permission.
a difference spectra with a peak at 4S0 nm. The absorbance o f this peak was used to calculated
the amount of CYP in the sample (Omura St Sato, 1964).
Difference spectra were obtained using a 1 mg/mL suspension of the rat hepatic
microsome preparation for CIM, RAN, ZAL, HIS, AG, L-Arg, and hexobarbital (HEX) at 0,
0.05, 0.1, 0.2, 0.5, 1.0, and 1.5 mM. Samples were scanned over the range of 390 - 500 nm,
except AG and HEX which were scanned from 350 - 500 nm.
4.2.b F.th>Hm « » 2
A second, similar, experiment was conducted on equine hepatic microsomes. These
studies were used to verify that equine hepatic microsomes produce difference spectra similar to
those produce by the rat and to also allow tor comparison between equine CYP difference
spectra and equine iNOS difference spectra. One pony from the LSU herd was euthanized by
electrocution and exsanguinetion. The liver was immediately removed and an *200 g piece was
cut and flushed with *1.5 L of PBS (*4°C). The tissue was then cut into *20 g pieces and
further minced for homogenization and centrifugation as described in Experiment 1. Upon
completion of the second 1 1 0 ,0 0 0 xg centrifugation, the supernatant was removed and a layer
o f glycerol was placed over the pellet and frozen at -70°C until needed.
Total protein and CYP content were determined as described above. Difference spectra
were obtained using a 1 mg/mL (protein) equine hepatic microsome suspension for CIM (0,
0.05, 0.1, 0.2, 0.5, 1.0, and 1.5 mM), RAN (1, 2, 5, 7.5, and 10 mM), HIS (0.5, 1.0, 2.0, 5.0,
and 10 mM), AG (0.5, 1.0, 2.0, 5.0, and 10 mM), and HEX at 0, 0.05, 0.1, 0.2, 0.5, 1.0, and
1.5 mM.
4.2.C ExgfriqK Tt?
To demonstrate that CIM was possibly inhibiting iNOS by a mechanism similar to that
by which CIM inhibits CYP, difference spectra were
80
Reproduced with permission of the copyright owner. Further reproduction prohibited without permission.
obtained in the following experiment from leukocytes following carrageenan-induced
inflammation.
Animals: Six female Thoroughbred horses belonging to the Equine Veterinary
Research Program herd, and ranging in age from 10-18 years and 468-523 kg, were used in this
study. All animals were part of a routine health maintenance program and were clinically
healthy. They were fed only pelleted feed, and water was available ad libitum. The research
protocol was approved by the LSU Institutional Animal Care and Use Committee prior to
initiation o f the study. These were the same horses as those used in the previous studies
(Chapter 3).
Inflammation and sample collection: To induce inflammation, one mL of 1% sterile
carrageenan (X-carrageenan; Sigma Chemical Co., S t Louis, MO) was instilled into a chamber.
Tissue chamber fluid from the inflamed chamber was collected at 8 h post-instillation. Samples
(10 to 20 mL) o f TCF were collected under aseptic conditions and transferred immediately to 7
mL EDTA containing evacuated tubes, and placed on ice. The leukocytes were then separated
using a gradient technique (Leukocyte separation, Sigma Diagnostics, S t Louis, MO). Briefly,
3 mL of a 1.119 g/mL solution of polysucrose and Na diatrizoate (Histoplaque*-l 119, Sigma
Diagnostics, S t Louis, MO) was placed in a 15 mL conical centrifuge tube. Next, 3 mL o f a
1.077 g/mL solution of polysucrose and Na diatrizoate (Histoplaque®-1077, Sigma
Diagnostics, S t Louis, MO) was placed on top o f the previous solution in a manner such that
little or no mixing occurred. Six mL o f TCF was then pipetted onto these solutions and the tube
was centrifuged at 700 xg for 30 min (*25°C). The tubes were then removed and the two
separate layers o f mononuclear cells and granulocyte cells were aspirated and transferred to a
single clean tube. Ten mL o f PBS was then added to each tube and centrifuged for 10 min at
81
Reproduced with permission of the copyright owner. Further reproduction prohibited without permission.
200 xg («2S°C). The supernatant was decanted and the leukocytes were stored in one volume
o f 0.1 M HEPES at -70°C until needed.
Cells were homogenized using a rapid decompression method (Short, et al., 1972). The
sample, in a SO mL conical centrifuge tube, was placed in a cell disruption bomb (Parr
Instruments). Using N& 5200 kPa was applied for S min. The outlet valve was then opened
and the sample collected into a clean centrifuge tube. The sample was centrifuged for 1 h at
110,000 xg. The resulting supernatant was used for all subsequent studies.
Carbon monoxide difference spectra were conducted using both dithionite and NADPH
as the reducing agents. Total protein was determined as previously described. Difference
spectra were obtained using a 1 mg/mL (protein) equine leukocyte (LEUK) suspension for CIM
(0, 0.05, 0.1, 0.2, 0.5, 1.0, and l.S mM), HIS (0.5, 1.0, 2.0, 5.0, and 10 mM), AG (0.5, 1.0,
2.0, 5.0, and 10 mM), and HEX at 0, 0.05, 0.1, 0.2, 0.5, 1.0, and 1.5 mM.
4.2.d. f i ’ al 1
Using an aliquot of the preparations made in Experiments 2, 3, and a preparation from
leukocytes collected from horses injected with LPS, electrophoresis and Western blots were
conducted to confirm the presence o f iNOS in equine leukocytes and determine if iNOS was
present in the equine hepatic microsome preparation.
Sodium dodecylsulfate (SDS) separating gels, 7.5%, were used under denaturing
conditions. The separating gel consisted of 7.5 mL deionized HiO, 3.75 mL of 1.5 m
tris(hydroxymethyl)aminomethane (Tris) buffer (pH 8 .8 ), 3.75 mL of 30 % acrylamide, and
150 pL of 10% SDS. This solution was gently mixed and degassed. Ten pL o f N,N,N',N'-
tetramethyl-ethylenediamine (TEMED) and 50 pL o f 10% ammonium persulfate (APS) were
added to the solution which was then covered with 100 pL butanol. The stacking gel was as
follows: 3 mL of deionized H2 0 , 1.25 mL 0.5 M Tris buffer (pH 6 .8), 650 pL 30% acrylamide,
82
Reproduced with permission of the copyright owner. Further reproduction prohibited without permission.
and SO 10% SDS. The solution was mixed and degassed Five |JL of TEMED and 25 pL
of 10% APS were added to the solution and the gel was poured.
For analysis, 24 pL o f Sigma molecular weight standards were placed in lanes 1 and 10
of the gel. One pL of murine iNOS standard (Cayman Chemical Co., Ann Arbor, Michigan),
19 pL of buffer (SO mM Tris, 1S.S mM NaCl), and 4 pL of 6 x loading buffer were placed in
lanes 2 and 9. Twenty pL of the iNOS preparation (Experiment 3) were added to lane 3 along
with 4 pL o f 6 x loading buffer. Lane 4 was used for the equine hepatic mkrosome preparation
from Experiment 2. Twenty pL of the equine hepatic mkrosome prep were placed in lane 4
along with 4 pL o f 6 x loading buffer. All samples had been boiled at 100°C for S min prior to
loading on to the gel. The gel was nm for 2 h at 100 mV. Gels were transferred using a wet
transfer technique (BioRad Electroblot, BioRad, Hercules, CA) at 4°C. The gel was stained
with rapid Coomassie blue for 20 min in a 25% isopropanol/10% acetk acid solution. It
appeared that the molecular weight markers completely transferred.
Western blots were conducted using a PVDF transfer membrane (Hybond P,
Amersham Life Sciences, Arlington Heights, IL). The membrane was rinsed in Tris buffered
NaCl (TBS-T; 2.43 g Tris, 8.0 g NaCl, 3.8 mL 1.0 M HC1, 0.1 % Tween"* 20, and HjO to one
L) and the transfer was done in the presence of TBS-T with 5% dry milk added. The membrane
was then rinsed again for 2 min (2x). The blot was incubated for 1 h with the primary
antibody, which is a mouse monoclonal to the C-terminus region (amino acids 961 - 1144) of
the murine iNOS monomer (Transduction Laboratories, Franklin Lakes, NJ) using a dilution of
1200,000 of the stock 2S0 pg/pL solution. The membrane was then washed for S min (9x)
with TBS-T using 60 mL/rinse. The membrane was incubated with the secondary antibody
complexed to horseradish peroxidase (donkey anti-rabbit, Amersham Pharmacia, Arlington
Heights, Illinois) for 1 h and then washed for S min (9 x) with TBS-T using 60 mL/rinse. The
83
Reproduced with permission of the copyright owner. Further reproduction prohibited without permission.
iNOS protein was detected using a chemilumincscent system (ECL+Plus, Amersham Pharmacia
Biotech, Arlington Heights, IL). Detection was accomplished following the instructions
accompanying the kit at «2S°C with incubation o f membrane and detection reagents for S min.
A second blot, based on the results o f the first, was also run. This blot was run in the
presence of the protease inhibitors dithioreitol, leupeptin, and phenyhnethylsulphonyl fluoride at
final concentrations o f 1 mM, 10 pg/mL, and 10 mg/mL, respectively (Knowles & Salter, 1998)
to reduce the possibility o f enzyme degradation in the samples. These were added immediately
prior to cell homogenization and the homogenate was frozen at -70°C until needed. Three
horses were used, and cells collected from all available chambers prior to inflammation. The
next day, one chamber in each horse was inflamed with 1 mL of 1% carrageenan and TCF was
collected at 8 h post inflammation. All analysis conditions were the same as above.
A third blot was also performed. This blot was done using circulating leukocytes
collected from a horse at 0 and 4 h after a single, 30 minute infusion o f LPS (35 ng/kg). The
cells were separated and prepared, in the presence of protease inhibitors, as described in
Experiment 3. The cell homogenate was frozen at -70°C until needed. All analysis conditions
were the same as above.
4.2.e. Experiments
This experiment was conducted to determine if spectral changes occurred with CIM in
the presence o f equine Hb. Hemoglobin is necessary for the conversion o f NO to N 03' (Doyle
& Hoekstra, 1981; Moncada & Higgs, 1993; Wennmalm, et al., 1992) and as a heme-
containing protein, may bind to CIM and result in decreases in N 03‘ production. This
experiment was conducted using die methods described in Experiments 1 - 3 . Equine Hb
(Sigma Chemical Company, S t Louis, MO) was used at concentrations o f 0.1 and 1 mg/mL in
PBS. Cimetidine was added to the sample cuvette to yield final concentrations o f 0, 0.1, 0.5,
84
Reproduced with permission of the copyright owner. Further reproduction prohibited without permission.
and 1.0 mM. Zahidine interaction was also investigated at concentrations of 0, 1, 5, and 10
mM.
4.2. fl Ftnt riant n l 6
This study was conducted in an attempt to specifically determine where in the
metabolism of L-Arg to N O / CIM was inhibiting the formation of N 03\ Hemoglobin is
necessary for the conversion o f NO to NOa' (Doyle A Hoekstra, 1981; Moncada A Higgs,
1993; Wennmalm, et al., 1992) and as a heme-containing protein, may bind to CIM and result
in decreases in NO3' production. Based on the results o f Experiment 5, studies were conducted
to evaluate the ability o f CIM to inhibit the conversion o f NO to N O /. The effect of CIM on
the conversion o f NO to N O / catalyzed tty Hb was investigated using a carbon fiber
microsensor to detect NO (ISO-NOP30, World Precision Instruments, Inc., Sarasota, FL).
The microsensor was connected to an isolated NO meter (ISO-NO, World Precision
Instruments, Inc., Sarasota, FL) which was serially connected to a personal computer using an
18-bit data recording system (Duo* 18™, World Precision Instruments, Inc., Sarasota, FL). All
studies were conducted at 37°C. The microsensor was calibrated using SNAP (Figure 4.1). A
stock solution o f SNAP was prepared each day that studies were conducted. Fifty mg of EDTA
was added to 250 mL o f H2O (pH 9.0). Approximately 5 mg o f SNAP was added to the EDTA
solution and the molarity o f SNAP calculated. Next, 10 mL of 0.1 M CUSO4 (pH 4.0) was
pipetted into a 20 mL scintillation vial and placed in a H2O bath. The microsensor was placed
in the solution and allowed to equilibrate. A baseline reading was obtained and then 10, 20, 40,
and 80 pL of the SNAP solution was added and the current (pA) recorded after each addition.
This was repeated twice to obtain a standard curve for NO determination.
Since SNAP requires sub-physiological pH (*4) and CuS04 as a catalyst to produce
NO, it was not appropriate for generating NO at physiological conditions. For these reasons
85
Reproduced with permission of the copyright owner. Further reproduction prohibited without permission.
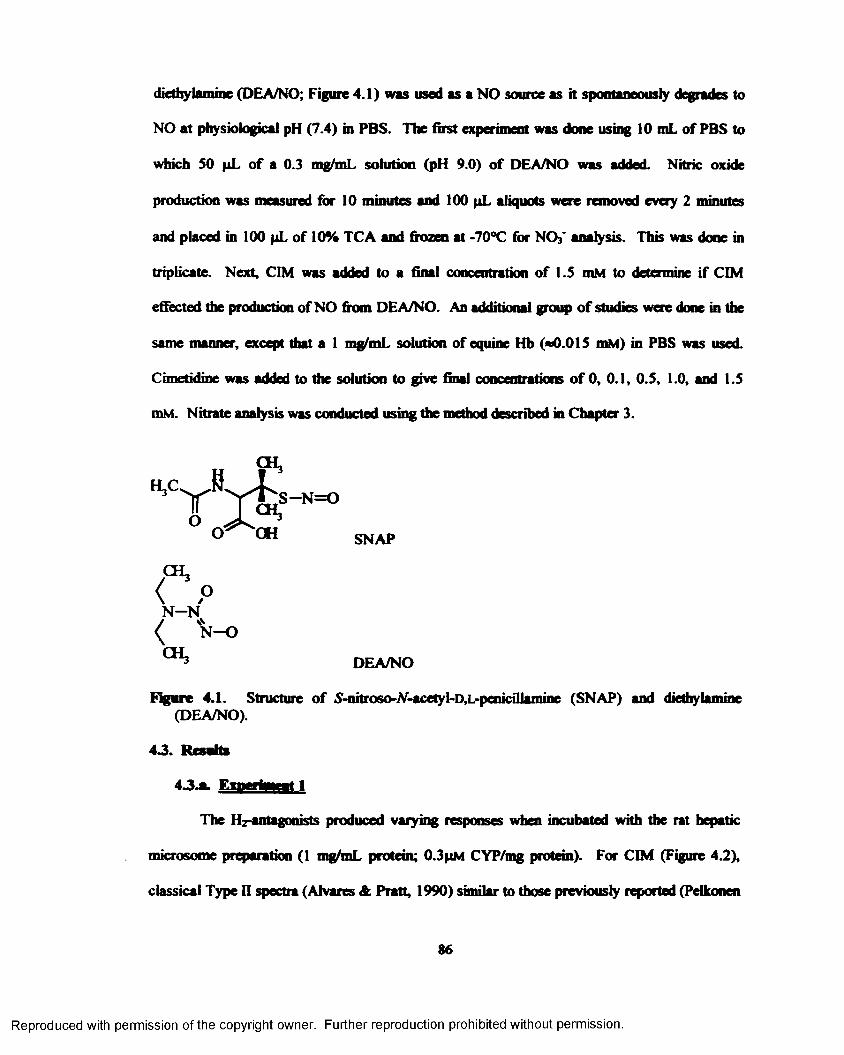
diethylamine (DEA/NO; Figure 4.1) was used as a NO source as it spontaneously degrades to
NO at physiological pH (7.4) in PBS. The first experiment was done using 10 mL of PBS to
which 50 pL of a 0.3 mg/mL solution (pH 9.0) o f DEA/NO was added. Nitric oxide
production was measured for 10 minutes and 100 pL aliquots were removed every 2 minutes
and placed in 100 pL of 10% TCA and frozen at -70°C for N 03~ analysis. This was done in
triplicate. Next, CIM was added to a final concentration of 1.5 mM to determine if CIM
effected the production of NO from DEA/NO. An additional group o f studies were done in the
same manner, except that a 1 mg/mL solution of equine Hb (*0.015 mM) in PBS was used.
Cimetidine was added to the solution to give final concentrations o f 0, 0.1, 0.5, 1.0, and 1.5
mM. Nitrate analysis was conducted using the method described in Chapter 3.
Figure 4.1. Structure o f S-nitroso-W -acetyl-D .L-penicillam ine (SNAP) and diethylamine(DEA/NO).
43 . Results
4J jl Experiment 1
The Hz-antagonists produced varying responses when incubated with the rat hepatic
microsome preparation (1 mg/mL protein; 0.3pM CYP/mg protein). For CIM (Figure 4.2),
classical Type II spectra (Alvares & Pratt, 1990) similar to those previously reported (Pelkonen
SNAP
N -NN -O
0*3 DEA/NO
8 6
Reproduced with permission of the copyright owner. Further reproduction prohibited without permission.
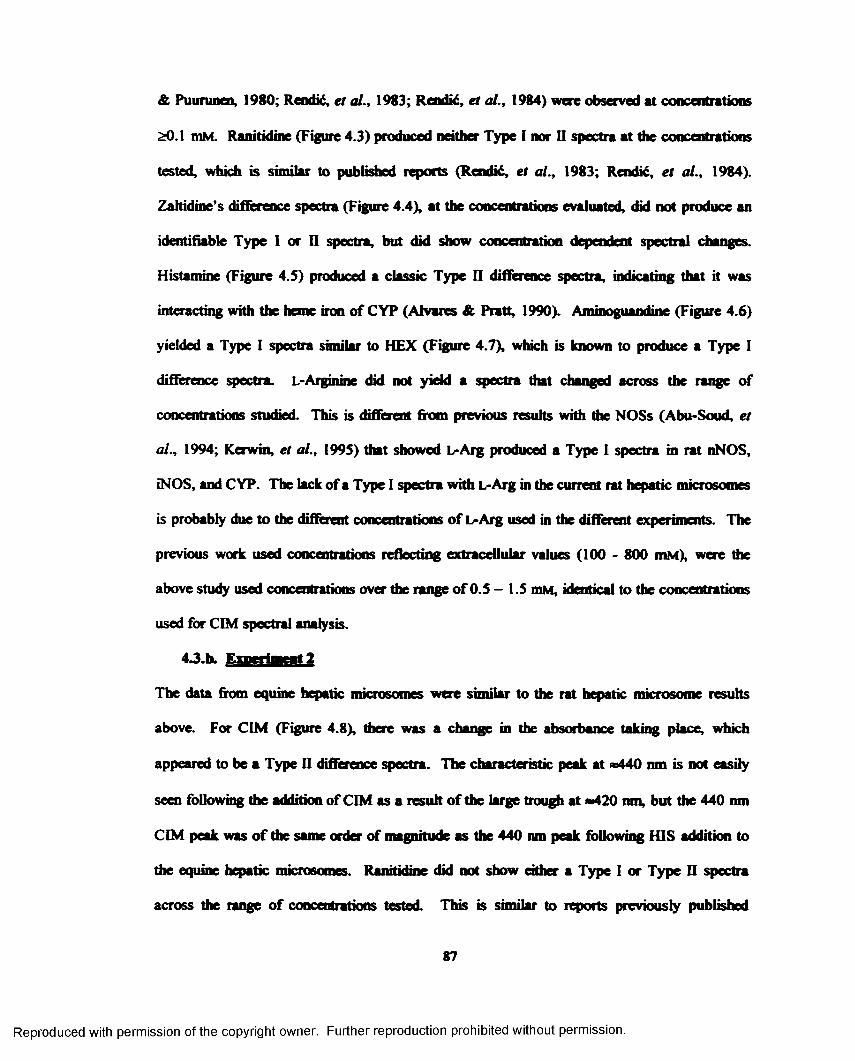
& Puurunen, 1980; Rendk, et al., 1983; Rendk, et al., 1984) were observed at concentrations
sO.l mM. Ranitidine (Figure 4.3) produced neither Type I nor II spectra at the concentrations
tested, which is similar to published reports (Rendk, et al., 1983; Rendk, et al., 1984).
Zahidine’s difference spectra (Figure 4.4), at the concentrations evaluated, did not produce an
identifiable Type I or II spectra, but did show concentration dependent spectral changes.
Histamine (Figure 4.S) produced a classic Type II difference spectra, indicating that it was
interacting with the heme iron of CYP (Alvares & Pratt, 1990). Aminoguandine (Figure 4.6)
yielded a Type I spectra similar to HEX (Figure 4.7), which is known to produce a Type I
difference spectra. L-Arginine did not yield a spectra that changed across the range of
concentrations studied. This is different from previous results with the NOSs (Abu-Soud, et
al., 1994; Kerwin, et al., 1995) that showed L-Arg produced a Type I spectra in rat nNOS,
iNOS, and CYP. The lack of a Type I spectra with L-Arg in the current rat hepatic mkrosomes
is probably due to the different concentrations o f L-Arg used in the different experiments. The
previous work used concentrations reflecting extracellular values (100 - 800 mM), were the
above study used concentrations over the range o f 0.5 - 1.5 mM, identical to the concentrations
used for CIM spectral analysis.
4_3.b. Experiment 2
The data from equine hepatic mkrosomes were similar to die rat hepatk mkrosome results
above. For CIM (Figure 4.8), there was a change in the absorbance taking place, which
appeared to be a Type II difference spectra. The characteristk peak at *440 ran is not easily
seen following the addition of CIM as a result of the large trough at *420 nm, but the 440 ran
CIM peak was o f the same order of magnitude as the 440 nm peak following HIS addition to
the equine hepatk mkrosomes. Ranitidine did not show either a Type I or Type II spectra
across the range of concentrations tested. This is similar to reports previously published
87
Reproduced with permission of the copyright owner. Further reproduction prohibited without permission.
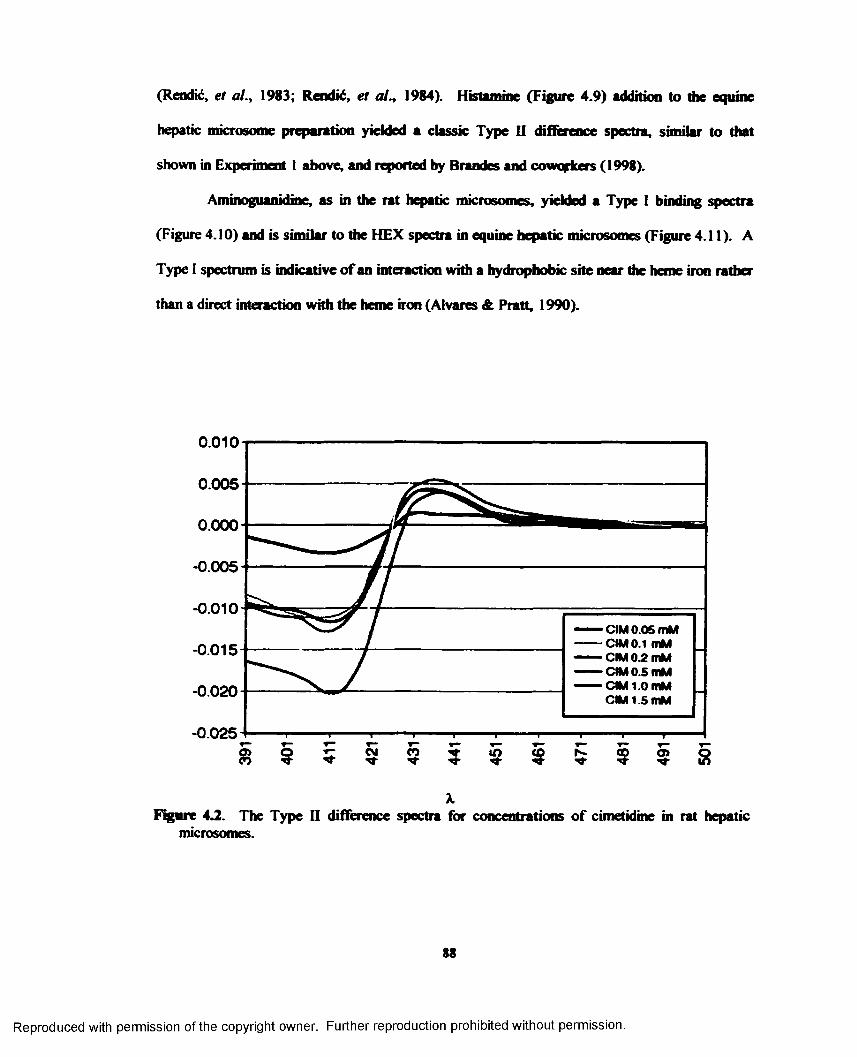
(Rendk, et al., 1983; Rendk, et al., 1984). Histamine (Figure 4.9) addition to the equine
hepatic microsome preparation yielded a classic Type II difference spectra, similar to that
shown in Experiment 1 above, and reported by Brandes and cowcfkers (1998).
Aminoguanidine, as in the rat hepatic mkrosomes, yielded a Type I binding spectra
(Figure 4.10) and is similar to the HEX spectra in equine hepatk mkrosomes (Figure 4.11). A
Type I spectrum is indicative o f an interaction with a hydrophobk she near the heme iron rather
than a direct interaction with the heme iron (Alvares & Pratt, 1990).
0.010
0.005
0 .0 0 0
-0.005
- 0.010CIM 0.06 mM CIM 0.1 mM CIM 0.2 mM CIM 0.5 mM CIM 1.0 mM CIM 1.5 mM
-0.015
- 0.020
-0.025
Figure 4.2. The Type II difference spectra for concentrations o f cimetidine in rat hepatic mkrosomes.
88
Reproduced with permission of the copyright owner. Further reproduction prohibited without permission.
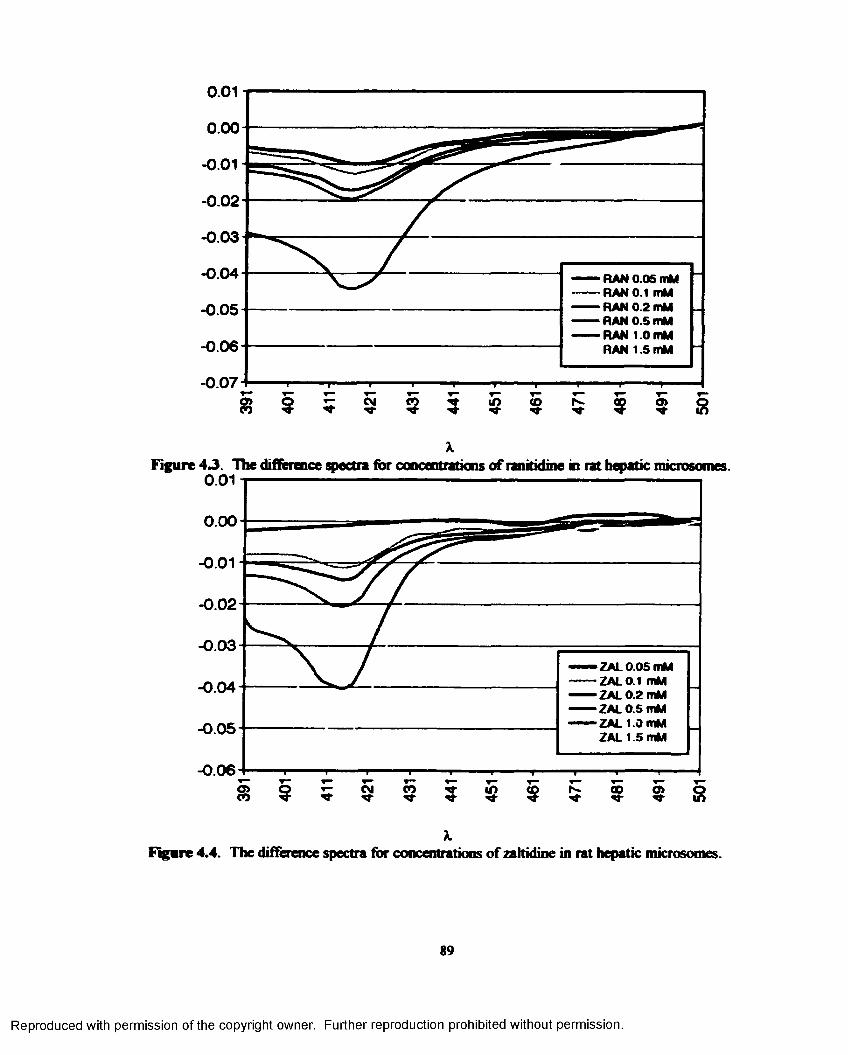
-0.03
-0.04 RAN 0.05 mM RAN 0.1 mM RAN 0.2 mM RAN 0.5 mM RAN 1.0 mM RAN 1.5 mM
-0.05
-0.06
-0.07 H
Figure 43 . The difference spectra for concentrations of ranitidine in rat hepatic microsomes. 0.01
- 0.01
- 0.02
-0.03ZAL 0.05 mM ZAL0.1 mM ZAL 0.2 mM ZAL 0.5 mM ZAL 1.0 mM ZAL 1.5 mM
-0 .04
-0.05
-0.06
Figure 4.4. The difference spectra for concentrations of zattidine in rat hepatic microsomes.
89
Reproduced with permission of the copyright owner. Further reproduction prohibited without permission.
0.010
0.005
0 .0 0 0
-0.005
- 0.010 HIS 0.05 mM HIS 0.1 mM HIS 0.2 mM HIS 0.5 mM HB 1.0 mM HB 1.5 mM
-0.015
0.020
9
-0.025
Figure 4.5. The Type II difference spectra for concentrations of histamine in rat hepatic microsomes.
0.02
0.01
0.00
- 0.01
- 0.02
-0 .03
-0.04
-0.05
AG 0.05 AG 0.1 AG 0 2 AG 0 5 AG 1.0 AG I S
S S g S S g S S i S S S S S S S«•> n rt rt ^ ^ ^ ^ t ^ ^ ^Figure 4.6. The difference spectra for aminoguanidine in rat hepatic microsomes.
90
Reproduced with permission of the copyright owner. Further reproduction prohibited without permission.
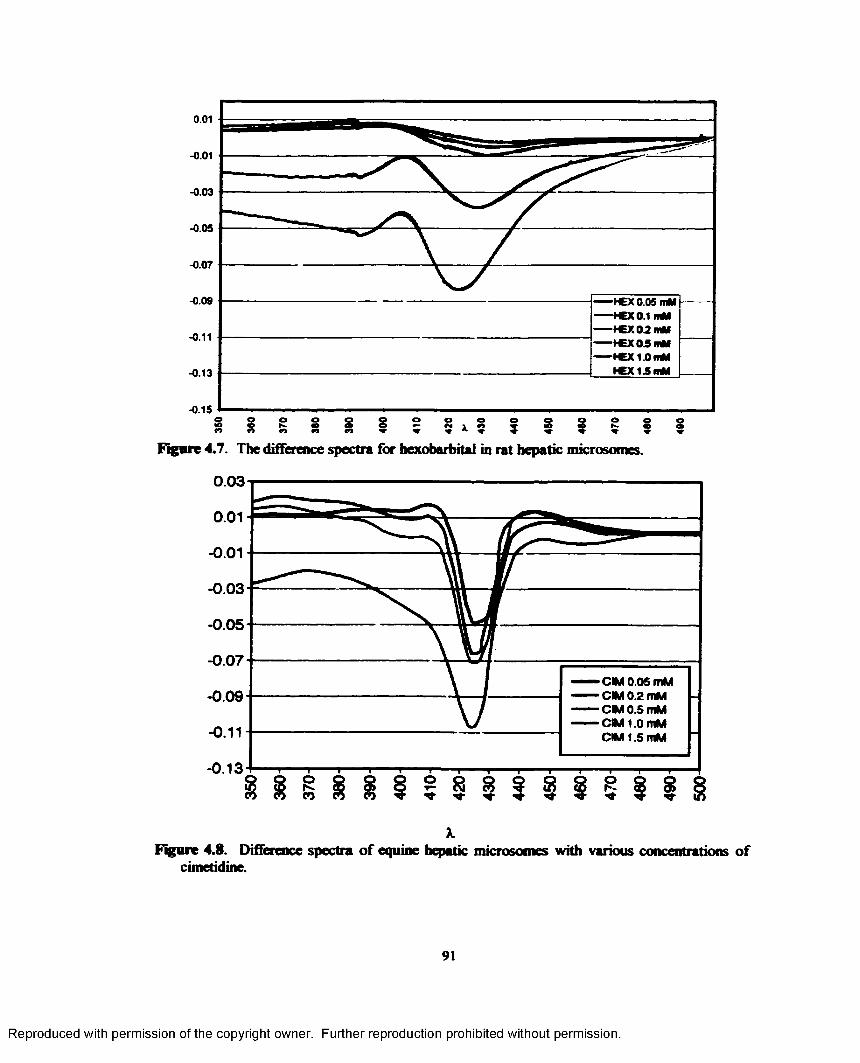
HEX 0.05 mMtC X O .1 mM fCXO^mM K X 0 5 m M * C X 1 .0 m M K C X 1 3 m M-0.13
-0.15 3 f s s s s sFigure 4.7. The difference spectra for hexobarbitai in rat hepatic microsomes.
0.03
-0.03
-0.05
-0.07CM 0.05 mM CM 0.2 mM CM 0.5 mM CM 1.0 mM CM 1.5 mM
Figure 4.8. Difference spectra o f equine hepatic mkrosomes with various concentrations of cimetidine.
91
Reproduced with permission of the copyright owner. Further reproduction prohibited without permission.
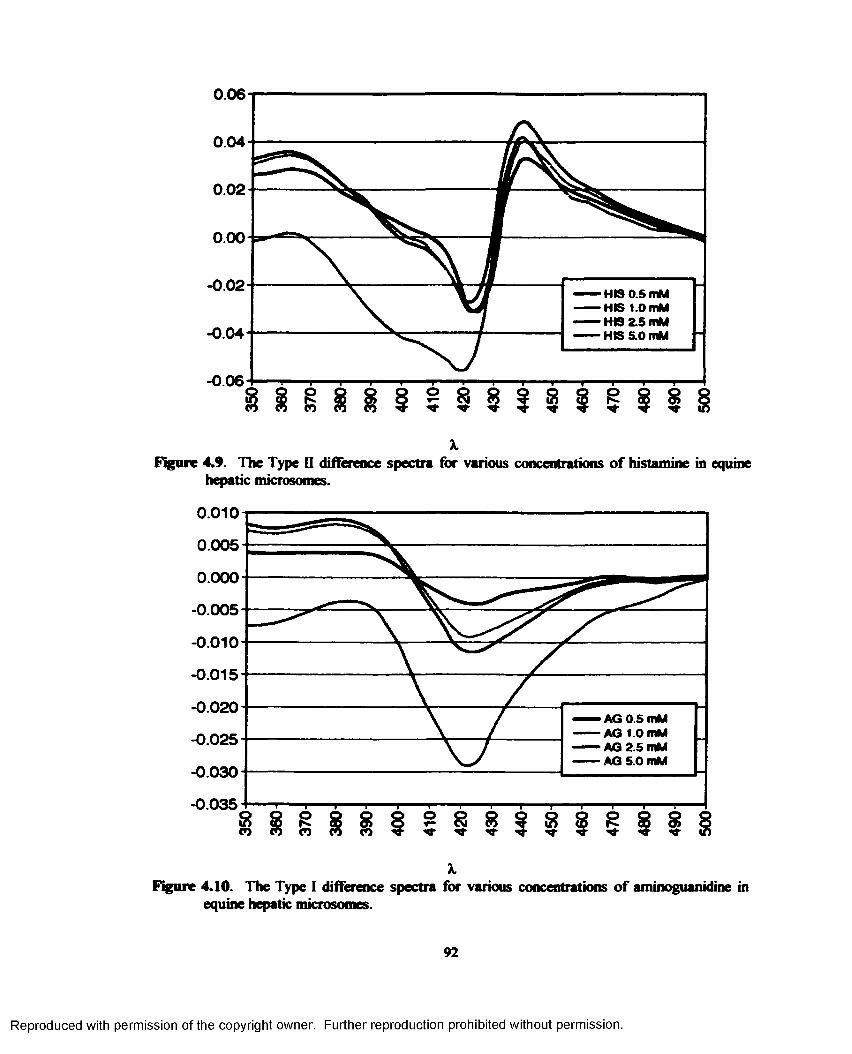
0.06
0.04
0.02
0.00
- 0.02 HIS 0.5 mM HIS 1.0 mM HIS 2.5 mM HIS 5.0 mM-0.04
-0.06 o o
Figure 4.9. The Type II difference spectra for various concentrations o f histamine in equine hepatic microsomes.
0.0101
0.005
0.000
-0.005
- 0.010
-0.015
-0.020AG 0.5 mM AG 1.0 mM AG 2.5 mM AG 5.0 mM
-0.025
-0.030
-0.035 oc5co co
Figure 4.10. The Type I difference spectra for various concentrations o f aminoguanidine in equine hepatic microsomes.
92
Reproduced with permission of the copyright owner. Further reproduction prohibited without permission.
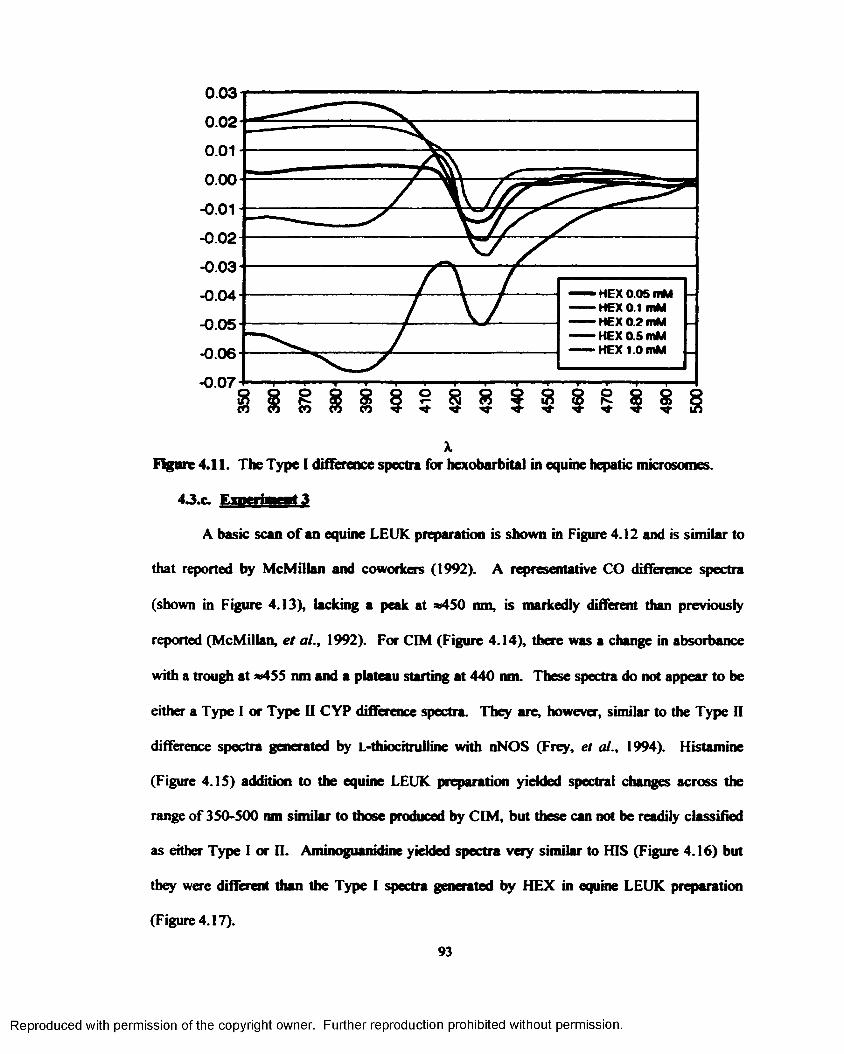
0.03
0.02
0.01
0.00
- 0.01
- 0.02
-0.03— HEX 0.05 mM HEX 0.1 mM HEX 0.2 mM HEX 0.5 mM HEX 1.0 mM
-0.04
-0.05
-0.06
-0.07-1
XFigure 4.11. The Type I difference spectra for hexobarbital in equine hepatic microsomes.
4.3.C. F.«wtfhM it3
A basic scan o f an equine LEUK preparation is shown in Figure 4.12 and is similar to
that reported by McMillan and coworkers (1992). A representative CO difference spectra
(shown in Figure 4.13), lacking a peak at *450 nm, is markedly different than previously
reported (McMillan, et al., 1992). For CIM (Figure 4.14), there was a change in absorbance
with a trough at *455 nm and a plateau starting at 440 nm. These spectra do not appear to be
either a Type I or Type II CYP difference spectra. They are, however, similar to the Type II
difference spectra generated by L-thiochrulline with nNOS (Frey, et al., 1994). Histamine
(Figure 4.15) addition to the equine LEUK preparation yielded spectral changes across the
range of 350-500 nm similar to those produced by CIM, but these can not be readily classified
as either Type I or II. Aminoguanidine yielded spectra very similar to HIS (Figure 4.16) but
they were different than the Type I spectra generated by HEX in equine LEUK preparation
(Figure 4.17).
93
Reproduced with permission of the copyright owner. Further reproduction prohibited without permission.
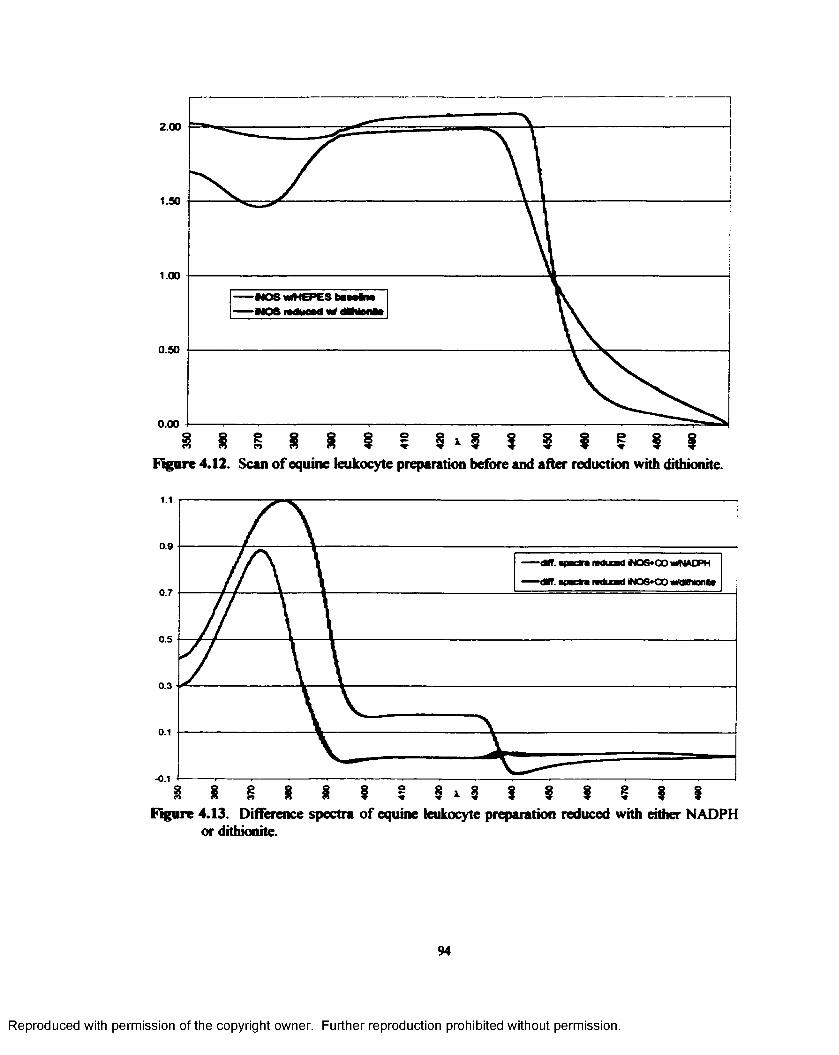
2.00
1 .50
1.00
0 .5 0
0.00
8 § 8 8 IO
8 xFigure 4.12. Scan of equine leukocyte preparation before and after reduction with dithionite.
0.9
iN0S»00«*NA0PH
MQ6+CO wMIMonte0.7
0.5
0.3
0.1
-0.1o § x 8 I 3 3
Figure 4.13. Difference spectra of equine leukocyte preparation reduced with either NADPH or dithionite.
94
Reproduced with permission of the copyright owner. Further reproduction prohibited without permission.
0.05
0.00
-0.05
CM 0.05
- 0.10 CM 0.1
CM 0.2 rail
CM 1.0-0.15-—CM 1.5 mM
- 0.20
I for - i
Figure 4.14. Difference spectra of an equine leukocyte preparation incubated with cimetidine.
HIS 0.5 mM HBI.OmM HB 2.0 mM H6 5.0 mM HB 10 mM
- 0.1
- 0.2
-0.3
Figure 4.15. Difference spectra for histamine in an equine leukocyte preparation.
95
Reproduced with permission of the copyright owner. Further reproduction prohibited without permission.
0 .1 5
0.10
0 .0 5
0.00
-0 .0 5
- 0.10
-0 .1 5
- 0.20
•AG 0.5 mM •AG 1.0 mM •AG 2.0 mM -AG 5.0 mM -AG 10 mM
3 3 3 3 3 3 3 3 3 1 3 3Figure 4.16. Difference spectra for aminoguanidine in an equine leukocyte preparation.
-0.1
- 0.2
-0.3
-0.4
HEX 0 .0 5 mM KEX 0.1 mM KEX 0 .2 mM KEX 0 .5 mM KEX 1 .0 mM KEX 1 .5 mM
350 37 0 3 9 0 4 1 0 X 4 3 0 45 0 47 0 4 9 0
Figure 4.17. Difference spectra for hexobarbital in an equine leukocyte preparation.
4 J.d . Em r ia u a t 4
Scans of the two Western blots are shown in Figures 4.18 and 4.19. In the first blot
(Figure 4.18), no detectable band was seen for the equine hepatic tnicrosome preparation, but
96
Reproduced with permission of the copyright owner. Further reproduction prohibited without permission.
there were detectable bands in the equine LEUK preparations. These bands were not at the
same position as the murine iNOS standard. This could be due to: 1) degradation of the iNOS
protein by proteases and subsequent detection of iNOS protein degradation products, or 2)
recognition of a different protein than iNOS, such as CYP or Hb. The detection of CYP is not
likely, based on the lack o f detection o f protein in the equine hepatic mkrosome preparation in
the lane next to the LEUK preparation. Finally, 3) it is possible that the murine iNOS antibody
detected a different isoform of equine NOS, but this explanation is unlikely.
For the above reasons, two additional studies were conducted. The first was done in
the presence of protease inhibitors to determine if the detected bands were degradation products.
As seen in Figure 4.19, there was no band corresponding to the murine iNOS standard, but
several smaller molecular weight bands were again present These were present in the samples
taken before and after inflammation o f the chambers. These bands could be degradation
products of iNOS, since the protease inhibitors were not added to the collected TCF until * 2 h
after collection - after the leukocytes had been removed from the chamber and separated. It is
also possible that they may be other unidentified proteins for which the murine iNOS antibody
has affinity. Other possibilities are that this antibody does not have affinity for the iNOS
isoform expressed in this equine model.
The third study was performed to determine if the method o f induction was the factor
affecting the identification o f iNOS in equine leukocytes and if equine Hb could be detected by
the murine iNOS antibody. Figure 4.19 indicates that following LPS treatment, equine iNOS
could not be identified using this detection system. The murine iNOS antibody also failed to
indicated binding to the equine Hb sample.
97
Reproduced with permission of the copyright owner. Further reproduction prohibited without permission.
Figure 4.18. Western blot of equine hepatic microtome and leukocyte preparations, without protease inhibitors, using a murine iNOS antibody. Equine cultured chondrocytes are shown as a positive control following vehicle (veh.) or lipopolysaccharide (LPS) treatment (trt).
To?--v eril ■'
i f -
Figure 4.19. Western blot of equine leukocyte preparations (left blot), with protease inhibitors, prior to and 8 h after induction of inflammation using a murine iNOS antibody. Right blot is equine cultured chondrocytes as a positive control following vehicle (veh.) or lipopoly saccharide (LPS) treatment (trt)
98
Reproduced with permission of the copyright owner. Further reproduction prohibited without permission.
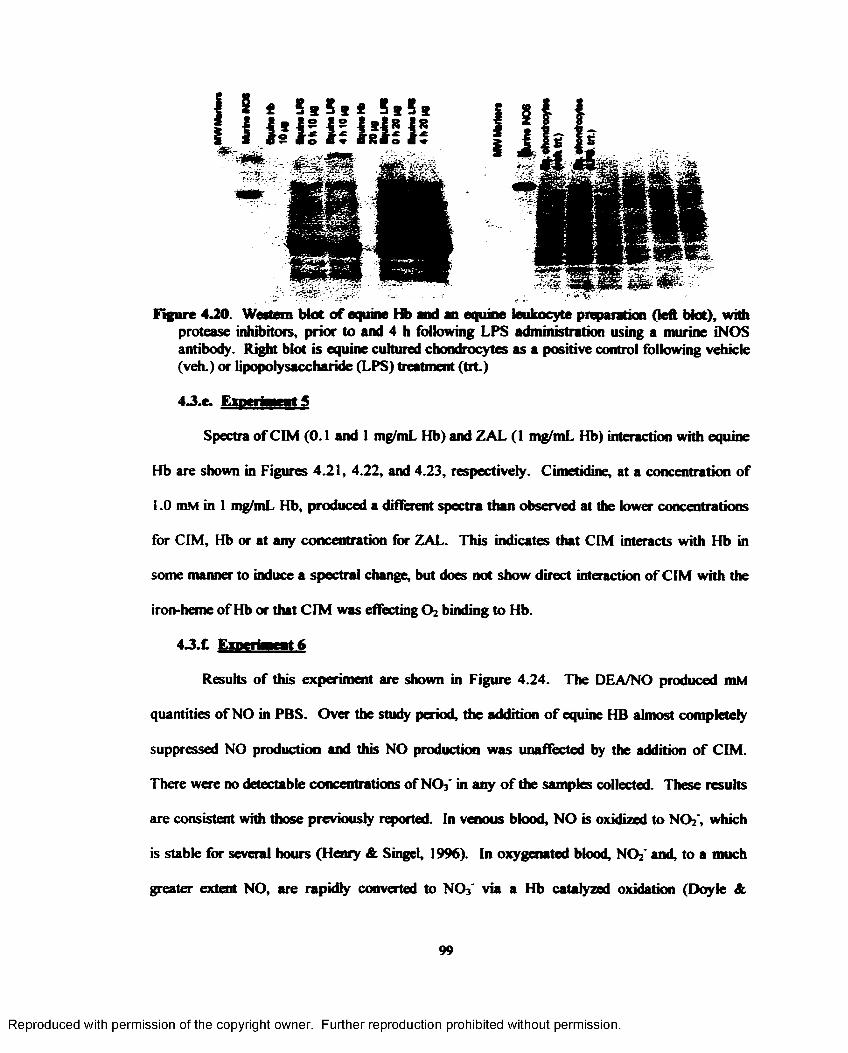
Figure 4.20. Western blot o f equine Hb and an equme leukocyte preparation (left blot), with protease inhibitors, prior to and 4 h following LPS administration using a murine iNOS antibody. Right blot is equine cultured chondrocytes as a positive control following vehicle (veh.) or lipopoly saccharide (LPS) treatment (trt.)
4J.e. Experiment S
Spectra of CIM (0.1 and 1 mg/mL Hb) and ZAL (1 mg/mL Hb) interaction with equine
Hb are shown in Figures 4.21, 4.22, and 4.23, respectively. Cimetidine, at a concentration of
1.0 mM in 1 mg/mL Hb, produced a different spectra than observed at the lower concentrations
for CIM, Hb or at any concentration for ZAL. This indicates that CIM interacts with Hb in
some manner to induce a spectral change, but does not show direct interaction of CIM with the
iron-heme of Hb or that CIM was effecting 0 2 binding to Hb.
43.C EmrrhnrnJ It
Results of this experiment are shown in Figure 4.24. The DEA/NO produced mM
quantities of NO in PBS. Over the study period, the addition o f equine HB almost completely
suppressed NO production and this NO production was unaffected by the addition of CIM.
There were no detectable concentrations ofN O f in any o f the samples collected. These results
are consistent with those previously reported. In venous blood, N O is oxidized to NQf, which
is stable for several hours (Henry & S ingel, 1996). In oxygenated blood, NO2' and, to a much
greater extent NO , are rapidly converted to NO3' via a Hb catalyzed oxidation (Doyle &
99
Reproduced with permission of the copyright owner. Further reproduction prohibited without permission.
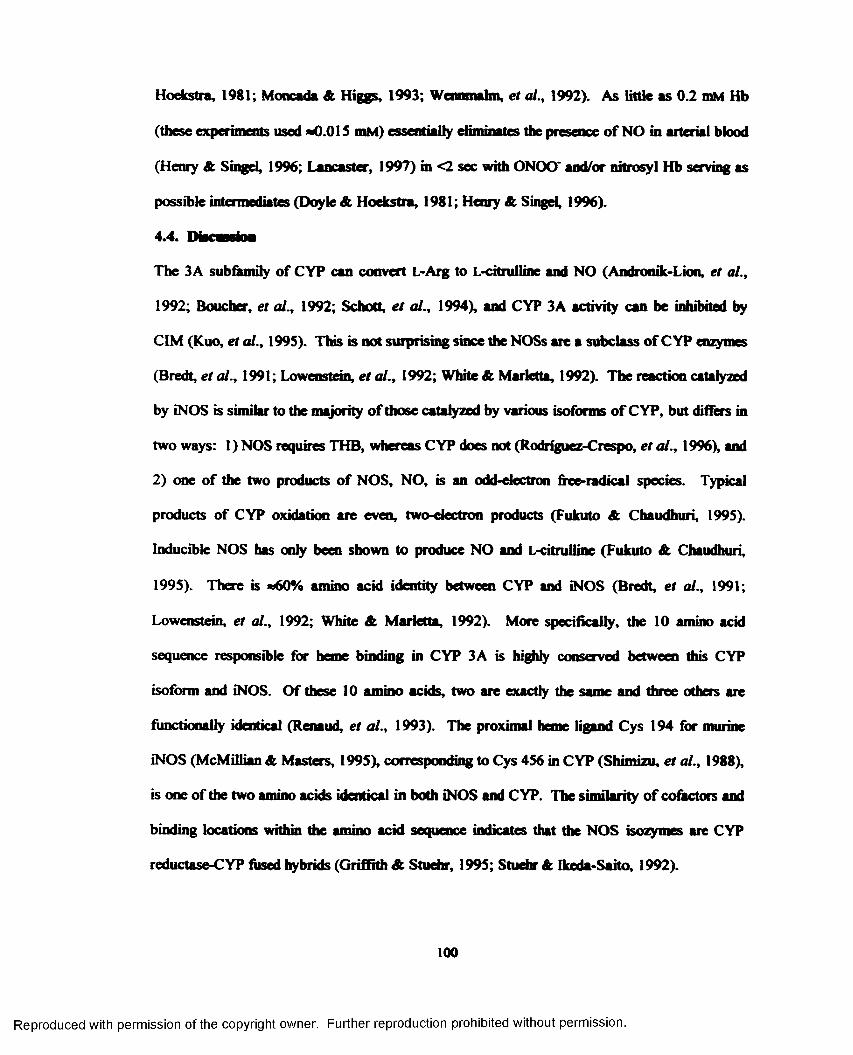
Hoekstra, 1981; Moncada A Higgs, 1993; Wenmnalm, et al., 1992). As little as 0.2 mM Hb
(these experiments used *0.013 mM) essentially eliminates the presence o f NO in arterial blood
(Henry A Singel, 1996; Lancaster, 1997) in <2 sec with ONOO' and/or nitrosyl Hb serving as
possible intermediates (Doyle A Hoekstra, 1981; Henry A Singel, 1996).
4.4. Dfanmston
The 3A subfamily of CYP can convert L-Arg to L-citrulline and NO (Andronik-Lion, et al.,
1992; Boucher, et al., 1992; Schott, et al., 1994), and CYP 3A activity can be inhibited by
CIM (Kuo, et al., 1993). This is not surprising since the NOSs are a subclass of CYP enzymes
(Bredt, et al., 1991; Lowenstein, et al., 1992; White A Marietta, 1992). The reaction catalyzed
by iNOS is similar to the majority o f those catalyzed by various isoforms o f CYP, but differs in
two ways: 1) NOS requires THB, whereas CYP does not (Rodriguez-Crespo, et al., 1996), and
2) one o f the two products o f NOS, NO, is an odd-electron free-radical species. Typical
products of CYP oxidation are even, two-electron products (Fukuto A Chaudhuri, 199S).
Inducible NOS has only been shown to produce NO and L-citrulline (Fukuto A Chaudhuri,
1993). There is *60% amino acid identity between CYP and iNOS (Bredt, et al., 1991;
Lowenstein, et al., 1992; White A Marietta, 1992). More specifically, the 10 amino acid
sequence responsible for heme binding in CYP 3A is highly conserved between this CYP
isoform and iNOS. Of these 10 amino acids, two are exactly the same and three others are
functionally identical (Renaud, et al., 1993). The proximal heme ligand Cys 194 for murine
iNOS (McMOlian A Masters, 1993), corresponding to Cys 436 in CYP (Shimizu, et al., 1988),
is one of the two amino acids identical in both iNOS and CYP. The similarity o f cofactors and
binding locations within the amino acid sequence indicates that the NOS isozymes are CYP
reductase-CYP fused hybrids (Griffith A Stuehr, 1993; Stuehr A Ikeda-Saito, 1992).
100
Reproduced with permission of the copyright owner. Further reproduction prohibited without permission.
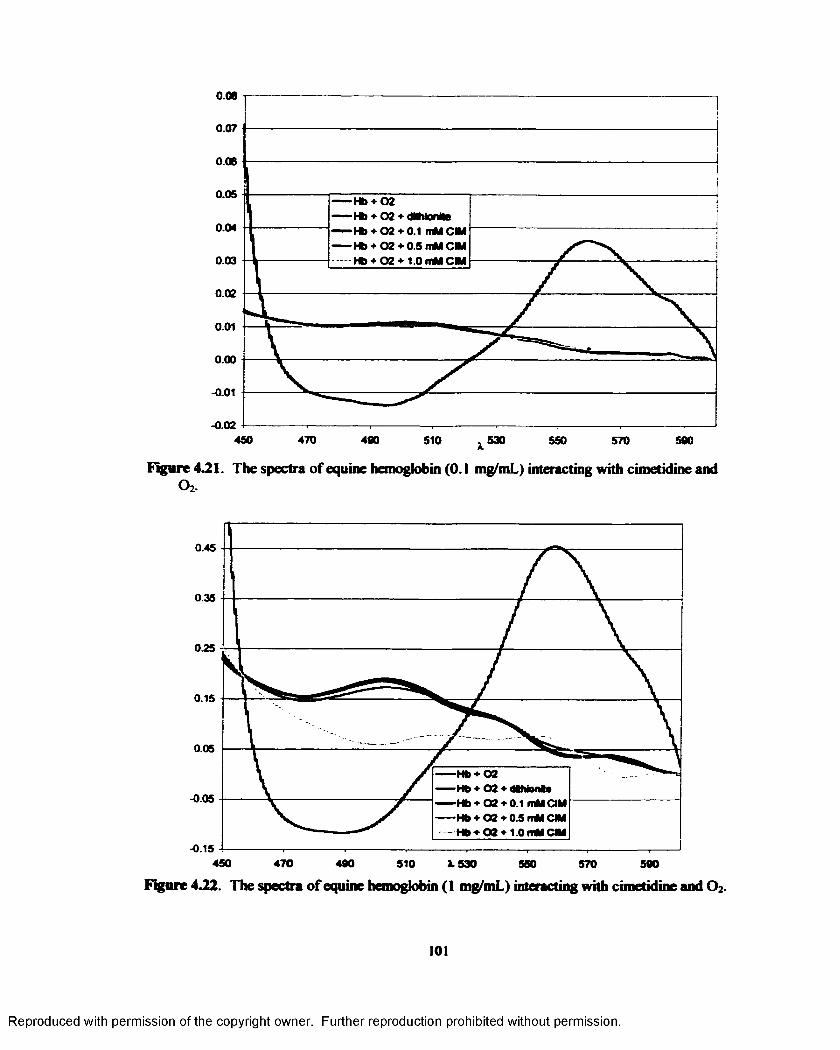
0 .0 6
0.07
0 .0 6
0 .0 5
0.04 CMCMCM0 .0 3
0.02
0.01
0.00
- 0.01
- 0.024 5 0 4 7 0 4 9 0 53051 0 55 0 5 7 0 59 0
Figure 4.21. The spectra of equine hemoglobin (0.1 mg/mL) interacting with cimetidine ando 2.
0 .4 5
0 .35
0 .15
0.05
—Hb*02—Hb «■ 02 ♦ (Uhfon**—Hb + 02 + 0.1 mMCM —Hb ♦ 02 ♦ 0.5 mM CM —Hb + 02* I.OnMCM
-0 .05
-0 .154 5 0 4 7 0 4 9 0 510 5 5 0 5 7 0 5 9 0
Figure 4.22. The spectra of equine hemoglobin (1 mg/mL) interacting with cimetidine and 0 2.
101
Reproduced with permission of the copyright owner. Further reproduction prohibited without permission.
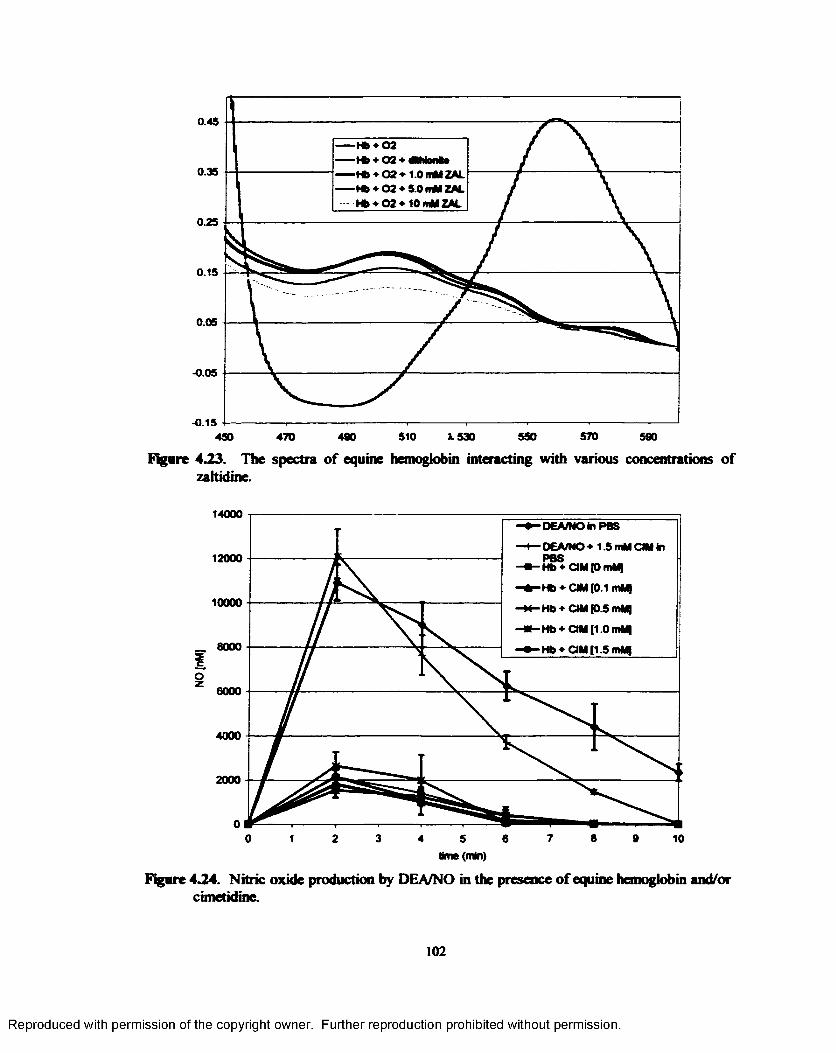
0 .4 5
H b ♦ 0 2 H b ♦ 0 2 ♦ d M o n to— H b ♦ 0 2 ♦ 1 .0 mM ZAL H b ♦ 0 2 ♦ 5 .0 mM ZAL
H b ♦ 0 2 ♦ 10 mM ZAL
0 .3 5
0 .1 5
0 .0 5
-0 .0 5
-0 .1 55 1 0 5 5 0 5 7 04 7 0 4 8 0 X 5 3 0 5904 5 0
Figure 4.23. The spectra of equine hemoglobin interacting with various concentrations of zaltidine.
1 4 0 0 0
12000
10000
„ 8 0 0 0
C
OZ 6 0 0 0
4 0 0 0
2000
D E A /N O in P B S
D E A /N O * 1 .5 mM CIM in P B SH b ♦ CIM [0 mM)
H b ♦ CIM [0.1 mM)
H b * C IM f0 .5 m M ]
H b * O M [1 .0 mM|
H b * CIM [1 .5m M J
Figure 4J24. Nitric oxide production by DEA/NO in the presence of equine hemoglobin and/or cimetidine.
102
Reproduced with permission of the copyright owner. Further reproduction prohibited without permission.
The heme found in NOS, located in the NHz-tcrminal domain, is necessary for the
conversion of L-OHArg to NO and L-chrulline since L-OHArg appears to bind in the proximity
o f the heme and alters the spin state o f Fe upon binding. This results in Type I spectra and is
similar to the spectra obtained from CYP after binding of substrates and suggests that L-Arg is
altering the heme microenvironment o f NOS (Kerwin, et al., 1995). This was not seen with L-
Arg in the rat hepatic mkrosome preparation used in Experiment 1, but both HEX and AG did
produce this type of difference spectra in both rat and equine hepatic mkrosome preparations.
Aminoguanidine is probably interacting with CYP via the guanidine moiety common to both L-
Arg and AG. It is unclear if the binding sites far L-Arg and L-OHArg are the same (Pufahi &
Marietta, 1993), as has been suggested (Kerwin, et al., 199S). The Cys 184 residue in human
eNOS, Cys 415 in rat nNOS, and either Glu 371 or Cys 194 for murine iNOS appear to be the
proximal heme ligand for L-Arg binding in the various isozymes (Chen, et al., 1994; Crane, et
al., 1998; McMillian & Masters, 1995).
Cimetidine is a proven inhibitor o f CYP while ZAL is suspected o f this activity (Farup,
et al., 1988; Ioannoni, et al., 1986; Rendk, et al., 1984). Farup, et al. (1988) mention that this
effect is also observed after IV administration o f RAN, whkh contains a furan ring. Ranitidine
did not produce a Type II difference spectra in either the rat or equine hepatic mkrosome
experiments. The inhibition o f CYP is mediated through the heme containing protein binding to
structurally similar Hraotagonists as a 6 * axial ligand with Fe, with CIM having the lowest KD
(Rendk, et al., 1983). This binding results in a Type II difference spectrum (Lin & Lu, 1998;
Schenkman, et al., 1967) associated with the direct binding of CIM to the heme moiety. Ligand
formation is both non-competitive (Chang, et al., 1992; PeOconen & Puurunen, 1980) and
competitive, depending on substrate concentration (Chang, et al., 1992; Winzor, et al., 1986).
Both the cyano and imidazole groups o f CIM have been shown to bind to the heme-iron at the
103
Reproduced with permission of the copyright owner. Further reproduction prohibited without permission.
6 th axial position (Rendil, et al., 1983). This was reproduced using rat and equine hepatic
microsomes in Experiments 1 and 2 and is consistent with the results reported by Rendid, et al.
(1983; 1984). Classical Type II difference spectra were generated by CIM in rat and equine
hepatic microsomes at concentrations 2 0 .1 mM. The difference spectra observed in equine
hepatic microsomes resemble the spectral changes o f chemical oxidation reported by Hlavica, et
al. (1989). They used 100 pM KjFe(CN)6 to oxidize rat hepatic microsomes and produced this
unique spectra.
The Type II difference spectra o f HIS in the hepatic microsomes of both species was
produced through the interaction of the imidazole group binding as a 6 th axial ligand (Brandes,
et al., 1998). This interaction o f HIS with CYP isoforms is believed to also involve an
intracellular HIS receptor located on or near the nuclei and chromatin o f bepatocytes. These
HIS receptors appear to regulate the catalytic activity of CYP and also modulate the growth of
normal and neoplastic cells (Brandes, et al., 1998). This may be one mechanism to explain the
anti-tumor, anti-infective, and either pro- or anti-inflammatory properties of Hz-antagonists.
Cimetidine and other Hz-receptor antagonists have been shown to reduce the size of equine
melanomas (Goetz, et al., 1990a; Goetz, et al., 1990b; Jenkins, 1991), reduce the severity of
pulmonary cardiovascular effects in a porcine model (Byrne, et al., 1990), enhance resistance to
pneumonia in cattle and swine (Canning, 199S; Canning, et al., 199S), and reduce pain
associated with rheumatoid arthritis (Grabowsid, et al., 1996).
The interaction of CIM with the LEUK preparation in Experiment 3 did not result in
classical CYP Type I or n difference spectra. However, the spectra were similar to the
difference spectra of oxidized/unoxidized CYP (Hlavica, et al., 1989). This was apparent for
all of the compounds evaluated in Experiment 3 except HEX, which produced a difference
spectra resembling Type I. Inhibitors of nNOS have been shown to produce either Type I or II
104
Reproduced with permission of the copyright owner. Further reproduction prohibited without permission.
difference spectra using in vitro murine brain preparations (Abu-Soud, et al., 1994). The
results from Experiment 3 can possibly be explained based on the data from Experiment 4.
Equine iNOS in the molecular weight region of the 130 IcDa murine iNOS standard (monomer)
was not detected by Western blot analysis. Western blot analysis, however, did detect proteins
that had smaller molecular weights. Protection against iNOS protein degradation with protease
inhibitors did not alter this pattern. The difference spectra preparations (made in the absence of
protease inhibitors), could have resulted from the binding of the test compounds to fragments of
equine iNOS, such as those that were detected by the Western blots, thus resulting in atypical
difference spectra. The resulting difference spectra indicate that the test compounds were
possibly interacting with protein fragments, but did not produce classic Type I or II spectra as
was seen in the hepatic microsomal preparations.
It could also be hypothesized that the proteins detected in Experiment 4 were other
isoforms of NOS, such as equine eNOS. This isoform o f NOS has been shown to be up-
regulated during cirrhosis in parallel to increases in TNF-a and NOx' concentrations in rats
following bile duct ligation (Liu, et al., 1999). It is also possible that the proteins detected
using this murine iNOS antibody are a result of non-specific binding to the iNOS antibody.
Cimetidine does not interact with all heme-containing proteins. It has been shown, for
example, that it does not form a 6 ® axial ligand on heme-iron of mouse catalase (Baird, et al.,
1987). It was possible that one of the detected proteins in Experiment 4 was equine Hb, but
upon additional Western blot analysis, this was proven not to be the case. The results from
Experiment 6 indicate that at a concentration of 1.0 mM, CIM interacted via an unknown
mechanism to alter the absorbance spectrum of equine Hb. This alteration in the spectrum may
have been the result of binding to the heme-iron, but is not clear based on the current results.
105
Reproduced with permission of the copyright owner. Further reproduction prohibited without permission.
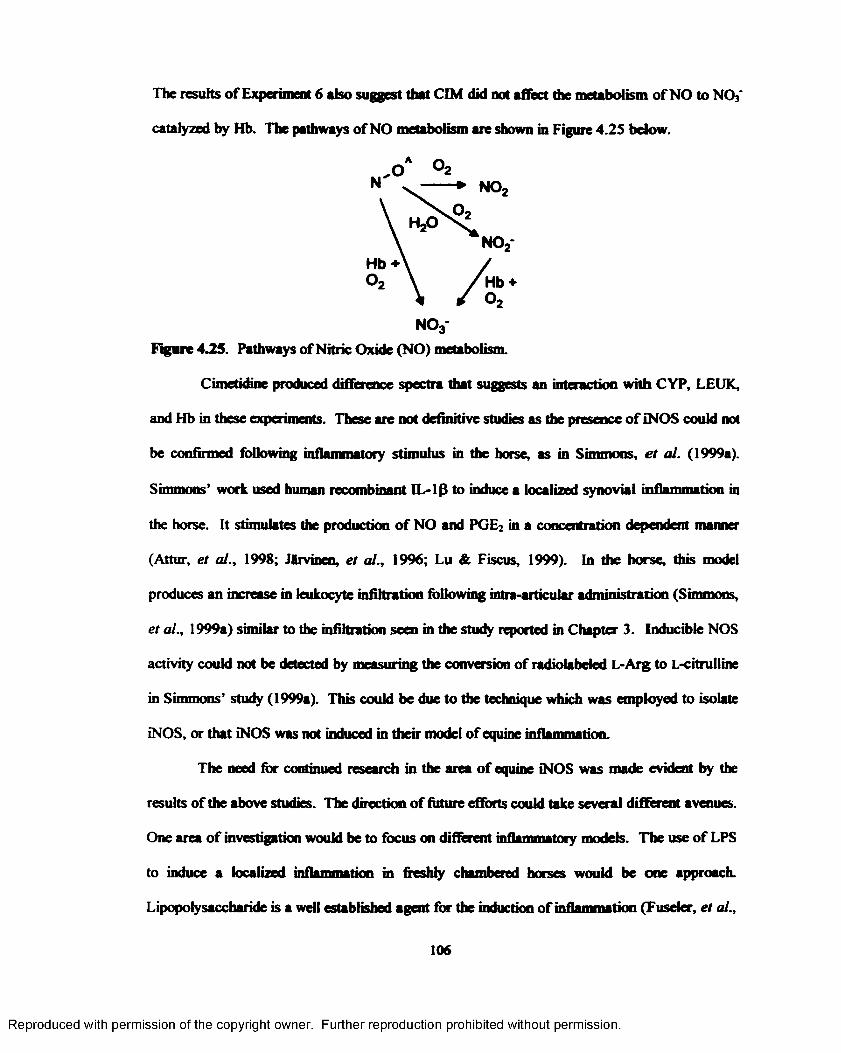
The results o f Experiment 6 also suggest that CIM did not affect die metabolism of NO to N 03~
catalyzed by Hb. The pathways of NO metabolism are shown in Figure 4.2S below.
NO.
Hb +
Figare 425. Pathways of Nitric Oxide (NO) metabolism.
Cimetidine produced difference spectra that suggests an interaction with CYP, LEUK,
and Hb in these experiments. These are not definitive studies as the presence o f iNOS could not
be confirmed following inflammatory stimulus in the horse, as in Simmons, et al. (1999a).
Simmons’ work used human recombinant IL -ip to induce a localized synovial inflammation in
the horse. It stimulates the production o f NO and PGE2 in a concentration dependent manner
(Attur, et al., 1998; Jlrvinen, et al., 1996; Lu & Fiscus, 1999). In the horse, this model
produces an increase in leukocyte infiltration following intra-articular administration (Simmons,
et al., 1999a) similar to the infiltration seen in the study reported in Chapter 3. Inducible NOS
activity could not be detected by measuring the conversion of radiolabeled L-Arg to L-citrulline
in Simmons’ study (1999a). This could be due to the technique which was employed to isolate
iNOS, or that iNOS was not induced in their model of equine inflammation.
The need for continued research in the area of equine iNOS was made evident by the
results of die above studies. The direction o f future efforts could take several different avenues.
One area o f investigation would be to focus on different inflammatory models. The use of LPS
to induce a localized inflammation in fleshly chambered horses would be one approach.
Lipopotysaccharide is a well established agent for the induction of inflammation (Fusder, et al.,
106
Reproduced with permission of the copyright owner. Further reproduction prohibited without permission.
1997) and of iNOS (Curran, et al., 1989; Fusder, et al., 1997; Pendino, et al., 1993). This
inflammatory agent may be better suited to iNOS induction in the horse than carrageenan.
However, LPS did not produce significant changes in plasma NO3' in the equine following a 35
ng/kg IV infusion o f LPS over a 30 min period. This model did produce significant decreases
in urinary NO3' at 4 and 24 h post-LPS (Bueno, et al., 1999).
Another approach would be to culture equine leukocytes and stimulate them with an
inflammatory agent, such as LPS or carrageenan. The advantage with these experiments would
be the possible decrease in degradation of proteins, which may have been an issue in the above
experiments. Isolation and purification of equine iNOS could be done in cultured leukocytes
following confirmation o f iNOS production via Western blot analysis. The isolated iNOS could
then be used for difference spectra analysis and enzyme kinetic studies.
It is unclear whether the NO3* detected in the TCF and plasma following carrageenan
administration was o f iNOS or CYP origin. It is possible that the concentration of the various
cytokines produced by the carrageenan model in vivo were sufficient to induce hepatic CYP
proteins to produce N O . In vitro experiments centered on the production of N O and/or N O f in
equine hepatocytes could thus prove useful. The expression o f equine iNOS and various CYP
isoforms in hepatocytes could be determined using Western blot analysis. Experiments
involving dexamethasone, which inhibits the de novo synthesis of iNOS (Di Rosa, et al., 1996;
Fukuto & Chaudhuri, 1995; Radomsld, et al., 1990; Radomski, et al., 1993) would also be
important This mechanism of inhibition is controlled by a specific ligand/receptor interaction
which occurs at therapeutic concentrations of dexamethasone and is highly correlated with its
anti-inflammatory efiect Dexamethasone is also a proven inducer of CYP, especially the 3A
isoform (MaureL, 1996). Dexamethasone may be useful in separating the contribution o f iNOS
107
Reproduced with permission of the copyright owner. Further reproduction prohibited without permission.
and CYP to NO production. Carrageenan or LPS could be used to simulate the inflammatory
disease state in these cultured cells.
108
Reproduced with permission of the copyright owner. Further reproduction prohibited without permission.
CHAPTER 5. SUMMARY CONCLUSIONS
It is clear from these studies, and others, that carrageenan stimulates the production of
NO (Ianaro, et al., 1994; Koga, et al., 1995; Salvemini, et al., 1995; Tracey, et al., 1995). The
above referenced reports also suggest that the increase in NO production can be attributed to
the infiltration o f leukocytes, mainly neutrophils and tissue macrophages, that subsequently
become activated at the inflammatory site, resulting in an increase in NO production. Adler,
et al., (1996) reported that activated macrophages are those in which iNOS has been induced
and production o f NO within the cell has increased. Cytokines can be formed as part of an
inflammatory response and start a pro-inflammatory cascade, which stimulates the production
of NO (Ianaro, et al., 1994). This production of NO could be due to induction of iNOS or
CYP proteins, but CYP isoforms are typically repressed as a result of inflammation, not
induced (Mauler, 1996). Curran and coworkers (1989) reported, using cultured rat
hepatocytes and Kupffer cells, that following the induction of inflammation (LPS), NOf/NOs'
production increases and protein synthesis decreases. This appears to be a synergistic
mechanism between hepatocytes and Kupffer cells, in that when Kupffer cells and hepatocytes
were cultured separately these changes were only observed in the Kupffer cells.
The NO produced in response to carrageenan is attributed mainly to neutrophils and
macrophages (Ianaro, et al., 1994; Koga, et al., 1995; Salvemini, et al., 1995; Tracey, et al.,
1995). In all of these studies, the production o f NO or the induction of iNOS mRNA reached
maximum levels at 12 h post stimulation. One study that employed immunohistochemical
staining for iNOS, showed that most of the activity was associated with tissue macrophages
(Salvemini, et al., 1995). In Trial 1, the increase in NO3' production paralleled the influx of
neutrophils into the chamber (Tables 3.2 & 3.3).
Inducible NOS contains both a CYP and a reductase domain within a single
polypeptide, thus having the properties o f both and allowing for electron transfer from
109
Reproduced with permission of the copyright owner. Further reproduction prohibited without permission.
NADPH to the heme-iron protein within one enzyme (Guengerich, 1996). The 3A subfamily
of CYP can convert L-Arg to L-citrulline and N O (Andronik-Lion, et al., 1992; Boucher, et al.,
1992; Schott, et al., 1994). It is not unexpected that CIM, which antagonizes CYP activity by
binding to the heme-iron containing catalytic site (Kuo, et al., 1995), could also inhibit the
activity of iNOS, an enzyme with a similar active site. Therefore, it was logical to expect that
NO derived NO3' concentrations in TCF and plasma could be reduced by CIM.
In the absence o f O2, NO dissolves in H2O and is very stable. In air it will react with
0 2 to form N 02. In H2O and plasma, NO is oxidized to NO2 , which is stable for several
hours. In whole blood, N 02' and, to a much greater extent NO, are rapidly converted to NO3'
via a Hb catalyzed oxidation (Doyle A Hoekstra, 1981; Moncada A Higgs, 1993; Wennmalm,
et al., 1992). As little as 0.2 mM Hb (4% of normal blood concentration) essentially
eliminates the presence of NO in arterial blood (Henry A SingeL, 1996; Lancaster, 1997) in <2
sec with ONOO* and/or nitrosyl Hb serving as a possible intermediates (Doyle A Hoekstra,
1981; Henry A SingeL, 1996).
Both CIM and AG treatment resulted in a failure o f N 03' concentrations to rise
significantly in plasma or test chamber between 4 and 12 h post-carrageenan instillation.
Additionally, the plasma concentrations were similar to TCF concentrations at each o f the
three time points, even though the values at 12 h were substantially lower than for either
chamber during NaCl treatment This supports the above interpretation that NO, measured as
NO3", equilibrates fairly rapidly between vascular and non-vascular compartments.
The presence o f membrane bound p recep to rs on leukocytes has been previously
reported (Tasaka, et al., 1992; Vannier, et al., 1991). It is possible that iNOS could be
coupled to membrane bound p recep to rs on leukocytes, similar to the mechanism by which
IL-6 synthesis and receptor expression is altered by HIS (Merdtey, et al., 1991; Vannier A
Dinarello, 1994) or in which HIS increases IL -lp mRNA levels (Vannier A Dinarello, 1993).
110
Reproduced with permission of the copyright owner. Further reproduction prohibited without permission.
If NO production were regulated by an Hrreceptor mechanism, then administration of HIS
would cause an increase in NO production or iNOS mRNA synthesis. Histamine regulates the
formation of many pro-inflammatory mediators (Auer, et al., 1991; Rezai, et al., 1990;
Vannier, et al., 1991), so it would not be surprising if it had a role in regulating NO production
(Kelm, et al., 1993; Mannaioni, et al., 1997).
There is no documented interaction of either L-Arg or AG with Hrreceptors. It is
possible, however, to hypothesize that since CIM binds to these receptors (Brimblecombe, et
al., 1978), similar guanidine-like compounds such as AG could also interact If so, then it
could also be possible for AG or CIM to be internalized through interaction with the receptor,
allowing for transport o f the compound across the membrane and into the cytosolic space,
where it could interact with iNOS.
It is possible that the lack o f a parallel reduction of TNF-a, IL-1, & IL-6 production
with N 0 3' prior to day 3 of the study was due to the regulation o f iNOS or CYP proteins. For
induction o f these enzymes, pro-inflammatory cytokines must first be produced. Once this
takes place and results in increased NO production, the resuiting increase in NO causes a
positive feedback to increase TNF-a, IL-1, & IL-6 production. Even with CIM and AG
pretreatment, the resulting decrease in NO production appears to be too late to decrease the
early cytokine response. However, it may assist in preventing the NO-induced up-regulation
of pro-inflammatory cytokine production.
The expected result of CIM treatment decreasing IL-1 and IL-6 production (Vannier
& Dinarello, 1993; Vannier & Dinarello, 1994) was not observed in the study reported in
Chapter 3. There was no significant difference between the AUCs of IL-1 or IL-6 in NaCl-N
TCF vs. CIM TCF. Also, CIM treatment did not affect values obtained for the inflamed TCF.
It is possible that this is a result o f the dosage regimen used in Trial 1. This could have
i l l
Reproduced with permission of the copyright owner. Further reproduction prohibited without permission.
resulted in sub-efficacious concentrations of CIM present in TCF and the inability o f CIM to
inhibit IL-1 and IL-6 production to a level that would be statistically significant.
Nitric oxide synthase is the first catalytically self-sufficient CYP to be described
(White & Marietta, 1992). It has been suggested that AG, a competitive antagonist o f iNOS,
acts through interaction of the guanidine N with the heme-iron of the porphyrin ring (Griffith
& Gross, 1996; Griffiths, et al., 1993; White & Marietta, 1992). This is probably not the case,
at least for CYP, since AG produced a Type I difference spectra in both rat and equine hepatic
microsomes. Type I difference spectra are the result o f alteration of heme absorption by
increasing the polarity o f the 6 th (axial) heme ligand without having direct interaction with the
heme (Schenkman, et al., 1973). The active she for the binding of CIM to CYP is also the
heme-iron moiety of the latter (Ioannoni, et al., 1986; Rendid, et al., 1984). The Cys 184
residue in human eNOS, Cys 415 in rat nNOS, and Cys 194 for murine iNOS appear to be the
proximal heme ligands for L-Arg binding in the various isozymes (Chen, et al., 1994;
McMillan & Masters, 1995). The guanidino N and the guanidino C of L-Arg must be in close
proximity to the heme-binding ligand (Griffith & Stuehr, 1995).
The heme found in NOS, located in the NHz-terminal domain, is necessary for the
conversion of L-OHArg to NO and L-chrulline since L-OHArg appears to bind in the
proximity of the heme and alters the spin state of Fe upon binding. This results in a Type I
spectra and is similar to the spectra obtained from CYP after binding of substrates and
suggests that L-Arg is altering the heme microenvironment o f NOS (Kerwin, et al., 1995).
This was not seen with L-Arg in the rat hepatic microsome preparation used in Experiment 1,
but HEX and AG did produce this type of spectra in both species of hepatic microsome
preparations. Aminoguanidine is probably interacting with CYP via the guanidine moiety
common to both L-Arg and AG. It is unclear if the binding sites for L-Arg and L-OHArg are
the same (Pufahl & Marietta, 1993), but this has been suggested (Kerwin, et al., 1995).
112
Reproduced with permission of the copyright owner. Further reproduction prohibited without permission.
Cimctidine is a proven inhibitor of CYP while ZAL is suspected of this activity
(Farup, et al., 1988; Ioannoni, et al., 1986; Rendil, et al., 1984). Farup, et al. (1988) mention
that this effect is also observed after IV administration of RAN. Ranitidine did not produce a
Type II difference spectra in either rat or equine hepatic microsome experiments. The
inhibition of CYP is mediated through the heme containing protein binding to structurally
similar H2-antagonists as a 6 th axial ligand with Fe (Rendil, et al., 1983). This binding results
in a Type II difference spectrum (Lin & Lu, 1998; Schenk man, et al., 1967) associated with
the direct binding of CIM to the heme moiety and the formation o f a ferrihemochrome
(Schenkman, et al., 1973). This was reproduced using rat and equine hepatic microsomes in
Experiments 1 and 2 of Chapter 4 and is consistent with results previously reported (Rendic, et
al., 1983; Rendid, et al., 1984).
The Type II difference spectra o f HIS in the hepatic microsomes o f both species is
produced through the interaction o f the imidazole group binding as a 6 * axial ligand (Brandes,
et al., 1998). This interaction o f HIS with CYP isoforms is believed to also involve an
intracellular HIS receptor located on or near the nuclei and chromatin of hepatocytes. These
HIS receptors appear to regulate the catalytic activity of CYP and also modulate the growth of
normal and neoplastic cells (Brandes, et al., 1998). This may be one mechanism to explain
the anti-tumor, anti-infective, and either pro- or anti-inflammatory properties of Hy-
antagonists. Cimetidine and other p re c e p to r antagonists have been shown to reduce the size
of equine melanomas (Goetz, et al., 1990a; Goetz, et al., 1990b; Jenkins, 1991), reduce the
severity o f pulmonary cardiovascular effects in a porcine model (Byrne, et al., 1990), enhance
resistance to pneumonia in cattle and swine (Canning, 199S; Canning, et al., 1995X and reduce
pain associated with rheumatoid arthritis (Grabowski, et al., 1996).
The interaction of CIM with the LEUK preparation in Experiment 3 did not result in
classical Type I or II difference spectra. It is very possible that this is due to the fact that
113
Reproduced with permission of the copyright owner. Further reproduction prohibited without permission.
iNOS, if it existed in the chamber leukocytes, was degraded and therefore lost its complete
tertiary structure. However, the spectrum produced by CIM with LEUK was similar to the
difference spectra o f oxidized/unoxidized CYP (Hlavica, et al., 1989). This was apparent for
all o f the compounds evaluated in Experiment 3 except for HEX, which yielded a difference
spectra resembling Type I. Inhibitors o f nNOS have been shown to produce either Type I or II
difference spectra using in vitro murine brain preparations (Abu-Soud, et al., 1994).
Equine iNOS in the molecular weight region o f the 130 kOa murine iNOS standard
(monomer) was not detected in the LEUK preparations by Western blot analysis. Western
blot analysis, however, did detect proteins that had smaller molecular weights. Protection
against iNOS protein degradation with protease inhibitors did not alter this pattern. This could
have been due to the fact that the protease inhibitors could not be added until * 2 h after
removal of the TCF. The difference spectra preparations (made in the absence of protease
inhibitors), could have resulted from the binding o f the test compounds to fragments of equine
iNOS, such as those that were detected by the Western blots, thus resulting in non-classical
difference spectra. The resulting difference spectra indicate that the test compounds interacted
with a chromogenic ferrihemochrome protein fragments), but did not produce classic Type I
or II spectra as was seen in hepatic microsomal preparations.
Cimetidine does not interact with all heme-containing proteins. It has been shown, for
example, that it does not form a 6* axial ligand on heme-iron of mouse catalase (Baird, et al.,
1987). It was possible that one of the detected proteins in Experiment 4 was equine Hb, but
Western blot analysis provided evidence that this was not the case. The results from
Experiment 6 indicate that at a concentration o f 1.0 mM, CIM interacted via an unknown
mechanism to alter the absorbance of equine Hb. This may have been through binding to the
heme-iron, but was not clear. At a Hb concentration of *0.001 mM, which is approximately
114
Reproduced with permission of the copyright owner. Further reproduction prohibited without permission.
that of the concentration in the LEUK preparation, CIM did not alter the binding spectra o f
Hb.
Cimetidine produced difference spectra that suggest it was interacting with CYP,
LEUK, and Hb (1.0 mM CIM) in these experiments. These are not definitive studies as the
presence o f iNOS could not be confirmed following inflammatory stimulus in the horse, as in
Simmons, et al. (1999a). In that study, Simmons and coworkers used human IL-lp to induce
an inflammatory response in equine synovial joints. The fluid removed from these joints
showed a moderate inflammatory response with increases in IL -ip and IL-6 . The activity o f
NOS was measured using the conversion of L-[uC]Arg to L-[uC]citrulline. There was no
significant difference in NOS activity between healthy and inflamed joints. The presence o f
equine iNOS could also not be determined in vitro, using cultured equine monocytes exposed
to LPS (Drs. Rustin Moore & David Horohov, personal communication). This is in contrast to
results reported in equine alveolar macrophages where both iNOS and COX-2 mRNA were
induced in vitro following exposure to endotoxin (Hammond, et al., 1999). The results also
suggest that CIM did not affect the metabolism of NO to NO3'. It may not be possible to
isolate intact iNOS from the type o f chamber used in these studies. It seems apparent that
stimulation of inflammation with carrageenan in these chambers results in degradation o f
iNOS, so that only small molecular weight fragments that bind with murine iNOS antibody
are recoverable. This is even the case with unstimuiated chambers, which probably reflects a
low grade inflammatory process resulting from the high frequency o f use o f the chambers in
these later studies. The ability o f CIM to reduce circulating NOT concentrations through
inhibition of NO generation by iNOS or CYP remains to be proven.
The need for future research in this area is evident. The scope o f these efforts could
take several different directions. The first step would be to determine if iNOS is present in
equine leukocytes. If it is, then efforts to purify and isolate it for enzyme inhibition studies
US
Reproduced with permission of the copyright owner. Further reproduction prohibited without permission.
would be warranted. If iNOS cannot be isolated from equine leukocytes in vitro, then it is
possible that a CYP isoform(s) was responsible for the N 03‘ observed following carrageenan
administration. Western blot analysis could be done with equine leukocytes using a
polyclonal or monoclonal antibody for CYP.
Another avenue o f investigation would be to focus on different inflammatory models.
The use o f LPS to induce a localized inflammation in freshly chambered horses would be one
approach. Lipopolysaccharide is a well established agent for the induction of inflammation
(Fuseler, et al., 1997) and of iNOS (Curran, et al., 1989; Fuseler, et al., 1997; Pendino, et al.,
1993). This inflammatory agent may be better suited to iNOS induction than carrageenan, but
it did not produce changes in plasma NO3' concentrations in the equine following a 30 min IV
infusion of a low dose o f 35 ng/kg LPS (Bueno, et al., 1999). This may contradict the
findings o f Hammond, et al., (1999) who detected iNOS mRNA following stimulation with
LPS in vitro. Another approach would be to culture equine leukocytes and stimulate them
with LPS. The advantage of this approach is that it could result in a decrease in extraneous
material that could be interfering with the Western blot analysis. Isolation and purification of
equine iNOS could be accomplished following confirmation o f its presence (Western blot).
The isolated iNOS could be used for difference spectra analysis and enzyme kinetic studies. It
should be noted, however, that iNOS was not detected in vitro using LPS stimulated equine
monocytes followed by immunohistochemical staining. This method used a murine iNOS
primary antibody, the same one used in the Western blots reported in Chapter 4, and an
avidin-biotin complex for detection (Dr. Rustin Moore, personal communication).
In order to show that CIM could directly alter iNOS activity, established models of
carrageenan and LPS induced inflammation in rodents would be used (Enna, et al., 1999) and
iNOS isolated. The isolated iNOS enzyme could then be used for difference spectra and
enzyme inhibition studies with CIM. The presence o f iNOS could also be confirmed using a
116
Reproduced with permission of the copyright owner. Further reproduction prohibited without permission.
commercial antibody for detection of murine iNOS. This would allow confirmation of the
theories expressed in this manuscript, but would not determine the exact mechanism o f CIM
reduction o f NO3* concentrations in the equine due to possible species differences in iNOS
expression and structure.
To determine if CYP has a role in the production of N 03' following an inflammatory
stimulus, use of cultured equine hepatocytes would be a useful technique. Based on the
experiments conducted to date, it was unclear whether the N 03‘ detected in the TCF and
plasma following carrageenan administration was of iNOS or CYP origin. It was possible that
the concentration o f the various cytokines produced in vivo were sufficient to induce hepatic
CYP proteins to produce NO. In vitro experiments centered on the production of NO and/or
N 03' in equine hepatocytes could thus prove useful. The expression of equine iNOS and
various CYP isoforms in hepatocytes could be determined using Western blot analysis.
Experiments involving dexamethasone, which inhibits the de novo synthesis of iNOS (Di
Rosa, et al., 1996; Fukuto & Chaudhuri, 1995; Radomski, et al., 1990; Radomski, et al., 1993)
would also be important. This mechanism of inhibition is controlled by a specific
ligand/receptor interaction which occurs at therapeutic concentrations of dexamethasone and
is highly correlated with its anti-inflammatory effect. Dexamethasone is also a proven inducer
of CYP, especially the 3A isoform (Maurel, 1996). Dexamethasone may be useful in
separating the contribution of iNOS and CYP to NO production. As mentioned above, various
inducers of inflammation could be used to simulate the inflammatory disease state in these
cultured cells.
In conclusion, CIM, an H2-receptor antagonist used to treat and prevent gastric
ulceration, is effective in reducing inflammation-generated NO3" concentrations. This could
occur via inhibition o f iN O S by the same mechanism o f heme-iron binding that CIM employs
to inhibit CYP mediated metabolism. It is also possible that the cytokines produced in this
117
Reproduced with permission of the copyright owner. Further reproduction prohibited without permission.
carrageenan model for inflammation induced CYP expression, resulting in an increase in N 03'
concentrations and that CIM inhibited CYP and not iNOS. The effect could also be attributed
to an interaction at Hrreceptors on leukocytes or macrophages. These finding bring focus to;
1) the potential effect of similar H2-receptor antagonists on inflammation related NO
production; 2 ) the possibility that other guanidine moiety containing substances may affect
NO production, and 3) the question o f whether CIM or other Hz-receptor antagonists inhibit
constitutive NOS isoforms and therefore affect physiologic processes other than inflammation.
118
Reproduced with permission of the copyright owner. Further reproduction prohibited without permission.
REFERENCES
Abu-Soud, H.M., Feldman, P.L., Clark, P., & Stuehr, D.J. (1994) Electron transfer in the nitric-oxide synthases characterization o f L-arginine analogs that block heme iron reduction. Journal o f Biological Chemistry, 269, 32318-32326.
Abu-Soud, H.M. & Stuehr, D.J. (1993) Nitric oxide synthases reveal a role for calmodulin in controlling electron transfer. Proceedings o f the National Academy o f Science, USA, 90, 10769-10772.
Adams, H.R. (199S) Prostaglandins, related factors, and cytokines. In Veterinary Pharmacology and Therapeutics, 7* edition; H.R. Adams, Editor; Iowa State University Press, Ames, Iowa; pp. 419-431.
Adler, H., Adler, B., Peveri, P., Werner, E.R., Wachter, H., Peterhans, E., & Jungi, T.W. (1996) Differential regulation of inducible nitric oxide synthase production in bovine and caprine macrophages. Journal o f Infectious Disease, 173, 971-978.
Adler, H., Freeh, B., Thfiny, M., Pfister, H., Peterhans, E., & Jungi, T.W. (1995) Inducible nitric oxide synthase in cattle Differential cytokine regulation of nitric oxide synthase in bovine and murine macrophages. Journal o f Immunology, 154, 4710-4718.
Aeberhard, E.E., Henderson, S.A., Arabolos, N.A., Griscavage, J.M., Castro, F.E., Barrett, C.T., & Ignarro, L.J. (1995) Nonsteroidal anti-inflammatory drugs inhibit expression o f the inducible nitric oxide synthase gene. Biochemical and Biophysical Research Communications, 208, 1053-1059.
Al-Haboubi, H.A. & Zeitlin, I.J. (1979) The actions o f cimetidine, mepyramine, indomethacin and aprotinin (Trasylol) on the inflammatory response in adjuvant rats. British Journal o f Pharmacology, 67, 446P-447P.
Al-Haboubi, H.A. & Zeitlin, I.J. (1982) The actions of cimetidine hydrochloride and mepyramine maleate in rat adjuvant arthritis. European Journal o f Pharmacology, 78, 175-185.
Al-Haboubi, H.A. & Zeitlin, I.J. (1983) Re-appraisal of the role of histamine in carrageenan- induced paw oedema. European Journal o f Pharmacology, 8 8 , 169-176.
Albina, J.E., Mills, C.D., Henry, W.L., & Caldwell, M.D. (1990) Temporal expression of different pathways of L-arginine metabolism in healing wounds. Journal o f Immunology, 144, 3877-3880.
Alonzi, T., Fattori, E., Lazzaro, D., Costa, P., Probert, L., Kollias, G., De Benedetti, F., Poli, V., & Ciliberto, G. (1998) Interleukin 6 is required for the development o f collagen- induced arthritis. Journal o f Experimental Medicine, 187,461-468.
119
Reproduced with permission of the copyright owner. Further reproduction prohibited without permission.
Alvares, A. P. & Pratt, W.B. (1990) Pathways o f drug metabolism. In Principles o f Drug Action: the Basis o f Pharmacology, 3“* Edition, W.B. Pratt & P. Taylor, Editors, Churchill Livingstone Inc., New York, New York, pp. 365-422.
Anderson, G.A., Stott, J.L., Gershwin, L.J., & Osbum, B.I. (1985) Subclinical and clinical bluetongue disease in cattle: clinical, pathological and pathogenic considerations. In Bluetongue and Related Or biviruses. T.L. Barber, M.M. Jochim, & B.I. Osbum, Editors; Alan R. Liss, Inc., New York; pp. 103-107.
Andronik-Lion, V., Boucher, J.L., Deiaforge, M., Henry, Y., & Mansuy, D. (1992) Formation of nitric oxide by cytochrome P450-catalyzed oxidation of aromatic amidoximes. Biochemical and Biophysical Research Communications, 185, 452-458.
Askew, S.C., Butler, A.R., Flitney, F.W., Kemp, G.D., & Megson, I.L. (1995) Chemical mechanisms underlying the vasodilator and platelet anti-aggregating properties of S- nitroso-;V-acetyl-D,L-penicillamine and S-nitrosoglutathione. Bioorganic & Medicinal Chemistry, 3, 1-9.
Attur, M.G., Patel, I.R., Patel, R.N., Abramson, S.B., & Amin, A.R. (1998) Autocrine production o f IL -ip by human osteoarthritis-affected cartilage and differential regulation o f endogenous nitric oxide, IL-6 , prostaglandin E2, and IL-8 . Proceedings o f the Association o f American Physicians, 110, 65-72.
Auer, D.E., Ng, J.C., Reilly, J.S., & Seawright, A.A. (1991) Assessment of histamine, bradykinin, prostaglandins Ei and E2 and carrageenin as vascular permeability agents in the horse. Journal o f Veterinary Pharmacology and Therapeutics, 14, 61-69.
Badger, A.M., Cook, M.N., Swift, B.A., Newman-Tarr, T.M., Gowen, M., & Lark, M. (1999) Inhibition o f interleukin-1-induced proteoglycan degradation and nitric oxide production in bovine articular cartilage/chondrocyte cultures by the natural product, hymenialdisine. Journal o f Pharmacology and Experimental Therapeutics, 290, 587- 593.
Baird, M.B., Sfeir, G.T., & Slade-Pacini, C.D. (1987) Lack of inhibition of mouse catalase activity by cimetidine: an argument against a relevant general effect of cimetidine upon heme metabolic pathways. Biochemical Pharmacology, 36,4366-4369.
Bauer, H., Jung, T., Tsikas, D., Stichtenoth, D.O., FrOlich, J.C., & Neumann, C. (1997) Nitric oxide inhibits the secretion of T-helper 1- and T-helper 2-associated cytokines in activated human T cells. Immunology, 90, 205-211.
Bavin, P.M.G., Post, A., &. Zarembo, J.E. (1984) Cimetidine. Analytical Profiles o f Drug Substances, 13, 127-182.
Beadle, R.E., Short, C.R., Corstvet, R.E., Pawlusiow, J., Nobles, D.D., McClure, J.R., Guthrie, A.J., & Clarke, C.R. (1989) Characterization of a soft-tissue infection model
120
Reproduced with permission of the copyright owner. Further reproduction prohibited without permission.
in the horse and its response to intravenous ccphapirin administration. Journal o f Veterinary Pharmacology and Therapeutics, 12, 73-86.
Beauparlant, P. & Hiscott, J. (1996) Biological and biochemical inhibitors of the NF-tcB/Rel proteins and cytokine synthesis. Cytokine & Growth Factor Reviews, 7,175-190.
Bergeron, Y., Ouellet, N., Deslauricrs, A.-M., Simard, M., Olivier, M., & Bergeron, M.G. (1998) Cytokine kinetics and other host factors in response to pneumococcal pulmonary infection in mice. Infection and Immunity, 66,912-922.
Beyak, M. & Vanner, S. (1995) Histamine Hi and H3 vasodilator mechanisms in the guinea pig ileum. Gastroenterology, 108, 712-718.
Bianchi, M., Ulrich, P., Bloom, O., Meistrell, M., Zimmerman, G.A., Schmidtmayerove, H., Bukrinsky, M., Donnelley, T., Bucala, R., Sherry, B., Manogue, K.R., Tortolani, A.J., Cerami, A., & Tracey, K..J. (1995) An inhibitor of macrophage arginine transport and nitric oxide production (CNI-1493) prevents acute inflammation and endotoxin lethality. Molecular Medicine, 1, 254-266.
Bieganski, T., Kusche, J., Lorenz, W., Hesterberg, R., Stahlknecht, C.D., & Feussner, K.-D. (1983) Distribution and properties o f human intestinal diamine oxidase and its relevance for the histamine catabolism. Biochimica et Biophysica Acta, 756, 196-203.
Black, J. (1993) Reflections on the analytical pharmacology of histamine Hz-receptor antagonists. Gastroenterology, 105, 963-968.
Boothe, D.M. (1995) The anaigesic-aniipyrctic-aniiinfiammaiory drugs. in Veterinary Pharmacology and Therapeutics, 7* edition; H.R. Adams Editor; Iowa State University Press, Ames, Iowa; pp. 432-449.
Boucher, J.-L., Genet, A., Vadon, S., Delaforge, M., Henry, Y., & Mansuy, D. (1992) Cytochrome P450 catalyzes the oxidation of AT-hydroxy-L-arginine by NADPH and 0 2 to nitric oxide and citrulline. Biochemical and Biophysical Research Communications, 187, 880-886.
Boughton-Smith, N.K. & Ghelani, A. (1995) Role of induced nitric oxide synthase and increased NO levels in zymosan peritonitis in the ra t Inflammation Research, 44, S149-S150.
Bowman, M.A., SimelL, O.G., Peck, A.B., Cornelius, J., Luchetta, R., Look, Z., Maclaren, N.K., & Atkinson, M.A. (1996) Pharmacokinetics of aminoguanidine administration and effects on the diabetes frequency in nonobese diabetic mice. Journal o f Pharmacology and Experimental Therapeutics, 279, 790-794.
Brandes, L.J., Queen, G.M., & LaBella, F.S. (1998) Potent interaction of histamine and polyamines at microsomal cytochrome P450, nuclei, and chromatin from rat hepatocytes. Journal o f Cellular Biochemistry, 69, 233-243.
121
Reproduced with permission of the copyright owner. Further reproduction prohibited without permission.
Bredt, D.S., Hwang, P.M., Glatt, C.E., Lowenstein, C., Reed, R.R., A Snyder, S.H. (1991) Cloned and expressed nitric oxide synthase structurally resembles cytochrome P-450 reductase. Nature, 351, 714-718.
Bredt, D.S. & Snyder, S.H. (1990) Isolation of nitric oxide synthetase, a calmodulin-requiring enzyme. Proceedings o f the National Academy o f Science, USA, 87, 682-685.
Brimblecombe, R.W., Duncan, W.A.M., Durant, G.J., Emmett, J.C., Ganellin, C.R., Leslie, G.B., A Parsons, M.E. (1978) Characterization and development of cimetidine as a histamine H2-receptor antagonist Gastroenterology, 74, 339-347.
Brimblecombe, R.W., Farrington, H.E., Lavender, M.K., A Owen, D.A.A. (1977) Histamine H2-receptor antagonists and thermal injury in rats. Bums, 3, 8-13.
Brimblecombe, R.W., Leslie, G.B., A Walker, T.F. (1985) Toxicology of cimetidine. Human Toxicology, 4, 13-25.
Browner, M. (1996) X-ray crystal structure of human COX-2. In Proceedings o f new targets in inflammation: inhibitors o f COX-2 or adhesion molecules. William HarveyMedical Research Foundation; New Orleans, Louisiana, April 15-16.
Bueno, A.C., Seaborn, T.L., Comick-Seahom, J., Horohov, D.W., A Moore, R.M. (submitted) Plasma and urine nitric oxide concentrations in horses administered a low dose of endotoxin. American Journal o f Veterinary Research, w , pp-pp.
Byrne, K., Sielaff, T.D., Carey', P.D., Tatum, J.L., Blocher, C.R.., Yasquez, A., Hirsh, J.I., A Sugerman, H.J. (1990) Ranitidine compared to cimetidine in muitiagent pharmacological treatment of porcine Pseudomonas ARDS. Circulatory Shock, 30, 117-127.
Cacini, W., Keller, M.B., A Grand, V.R. (1982) Accumulation of cimetidine by kidney cortex slices. Journal o f Pharmacology and Experimental Therapeutics, 221, 342-346.
Campbell, W.B. A Halushka, P.V. (1996) Lipid-derived autacoids, eicosanoids and platelet- activating factor. In Goodman & G ilman’s The Pharmacological Basis o f Therapeutics, 9* edition; J.G. Hardman, L.E. Limbird, P.B. Molinoff, R.W. Ruddon, A A.G. Gilman, Editors; McGraw-Hill, New York; pp. 601-616.
Canning, P.C. (1995) Histamine receptor antagonists reduce the susceptibility of pigs to Actinobacillus pleuropneumoniae-'wduced respiratory disease. In Proceedings o f the Conference o f Research Workers in Animal Disease, abstract 216.
Canning, P.C., Hass further, R.L., A Knob lock, K.F. (1995) Histamine receptor antagonists enhance the resistance of immunosuppressed calves to bacterial pneumonia. Journal o f Leukocyte Biology, Supplement, 25.
122
Reproduced with permission of the copyright owner. Further reproduction prohibited without permission.
Capasso, F., Duim, C.J., Yamamoto, S., Deporter, D .A , Giroud, J.P., & Willoughby, D.A. (197S) Pharmacological mediators o f various immunological and non-immunological inflammatory reactions produced in the pleural cavity. Agents and Actions, S, 528- 533.
Carlson, T.J. & Billings, R.E. (1996) Role of nitric oxide in cytokine-mediated regulation o f cytochrome P-450. Molecular Pharmacology, 49, 796-801.
Casado, M., Diaz-Guerra, M.J.M., Bosci, L., & Martin-Sanz, P. (1997) Differential regulation of nitric oxide synthase mRNA expression by lipopolysaccharide and pro- inflammatory cytokines in fetal hepatocytes treated with cycloheximide. Biochemical Journal, 327, 819-823.
Cashman, J.R., Park, S.B., Yang, Z.-C., Washington, C.B., Gomez, D.Y., Giacomini, K.M., & Brett, C.M. (1993) Chemical, enzymatic, and human enantioselective 5-oxygenation of cimetidine. Drug Metabolism and Disposition, 21, S87-S97.
Cendan, J.C., Topping, D.L., Pruitt, J., Snowdy, S., Copeland, E.M., & Lind, S. (1996) Inflammatory mediators stimulate arginine transport and arginine-derived nitric oxide production in a murine breast cancer cell line. Journal o f Surgical Research, 60, 284- 288.
Chang, T., Levine, M., & Bellward, G.D. (1992) Selective inhibition of rat hepatic microsomal cytochrome P-450. 0 . Effect of the in vitro administration of cimetidine. Journal o f Pharmacology and Experimental Therapeutics, 260, 1450-1455.
Chartrain, N.A., Geller, D .A , Koty, P.P., Sitrin, N.F., Nussler, A.K., Hoffman, E.P., Billiar, T.R., Hutchinson, N.I., & Mudgett, J.A. (1994) Molecular cloning, structure, and chromosomal localization of the human inducible nitric oxide synthase gene. Journal o f Biological Chemistry, 269,6765-6772.
Chen, G., Wood, E.G., Wang, S.H., & Warner, T.D. (1999) Expression of cyclooxygenase-2 in rat vascular smooth muscle cells is unrelated to nuclear factor-icB activation. Life Sciences, 64, 1231-1242.
Chen, P.-F., Tsai, A.-L., & Wu, K.K. (1994) Cysteine 184 o f endothelial nitric oxide synthase is involved in heme coordination and catalytic activity. Journal o f Biological Chemistry, 269, 25062-25066.
Cheng, X., Wang, Y.X., & Pang, C.C.Y. (1996) Reversal by L- and D-enantiomers of A°-nitro- arginine of endotoxin-induced hypotension and vascular hyporesponsiveness. Journal o f Cardiovascular Pharmacology, 28, 75-81.
Chin-Dusting, J.P.F., Alexander, C.T., Arnold, P.J., Hodgson, W.C., Lux, AS., & Jennings, G.L.R. (1996) Effects of in vivo and in vitro L-arginine supplementation on healthy human vessels. Journal o f Cardiovascular Pharmacology, 28, 158-166.
123
Reproduced with permission of the copyright owner. Further reproduction prohibited without permission.
Cho, H.J, Xic, Q.-w., Calaycay, J., Mumford, R .A , Swiderek, K.M., Lee, T.D., & Nathan, C. (1992) Calmodulin is a subunit o f nitric oxide synthase from macrophages. Journal o f Experimental Medicine, 176, 599-604.
Clarke, C R. (1989) Tissue-chamber modeling systems - applications in veterinary medicine. Journal o f Veterinary Pharmacology and Therapeutics, 12, 349-368.
Clarke, C.R., Short, C.R., Bourne, D.W.A., & Usenik, E.A. (1989a) Subcutaneously implanted tissue chambers - a pharmacokinetic study. Journal o f Veterinary Pharmacology and Therapeutics, 12, 312-321.
Clarke, C.R., Short, C.R., Usenik, E.A., A Rawls, R. (1989b) Subcutaneously implanted tissue chambers: a pathophysiological study Research in Veterinary Science, 47, 195-202.
Closs, E.I., Basha, F.Z., Habermeier, A., & FOrstermann, U. (1997) Interference of L-arginine analogues with L-arginine transport mediated by the y* carrier HCAT-2B. Nitric Oxide: Biology and Chemistry, 1, 65-73.
Collett, A., Higgs, N.B., Sims, E., Rowland, M., & War hurst, G. (1999) Modulation of the permeability of H2 receptor antagonists cimetidine and ranitidine by p-glycoprotein in rat intestine and the human colonic cell line Caco-2. Journal o f Pharmacology and Experimental Therapeutics, 288, 171-178.
Corbett, J.A., Tilton, R.G., Chang, K., Hasan, K.S., Ido, Y., Wang, J.L., Sweetland, M.A., Lancaster, J.R., Williamson, J.R., & McDaniel, M.L. (1992) Aminoguanidine, a novel inhibitor of nitric oxide formation, prevents diabetic vascular dysfunction. Diabetes, 41, 552-556.
Cornelissen, B.P.M., Rijkenhuizen, A.B.M., van den Hoogen, B.M., Rutten, V.P.M.G., & Bameveld, A (1998) Experimental model of synovitis/capsulitis in the equine metacarpophalangeal joint. American Journal o f Veterinary Research, 59, 978-985.
Crane, B.R., Arvai, A.S., Ghosh, D.K., Wu, C., Getzoff, E.D., Stuehr, D.J., & Tainer, J.A. (1998) Structure of nitric oxide synthase oxygenase dimer with pterin and substrate. Science, 279, 2121-2126.
Crofford, L.J., Wilder, R.L., Ristimiki, A.P., Sano, H., Remmers, E.F., Epps, H.R., & Hla, T. (1994) Cyclooxygenase-1 and -2 expression in rheumatoid synovial tissues Effects of interleukin-13, pborbol ester, and corticosteroids. Journal o f Clinical Investigation, 93, 1095-1101.
Cross, S.A.M. (1977) Localization of histamine and histamine H2-receptor antagonists in the gastric mucosa. Histochemical Journal, 9, 619-644.
Cross, S.AM . (1978) The preferential localization of Hr receptor antagonists in the parietal cell. Agents and Actions, 8, 386-387.
124
Reproduced with permission of the copyright owner. Further reproduction prohibited without permission.
Culotta, E. A Koshland, D.E. (1992) NO news is good news. Science, 258, 1862-1865.
Curran, A.D. (19%) The role of nitric oxide in the development of asthma. International Archives o f Allergy and Immunology, 111, 1-4.
Curran, R.D., Billiar, T.R., Stuehr, D.J., Hofmann, K., A Simmons, R.L. (1989) Hepatocytes produce nitrogen oxides from L-arginine in response to inflammatory products of Kupffer cells. Journal o f Experimental Medicine, 170, 1769-1774.
Cuzzocrea, S., Zingarelli, B., Calapai, G., Nava, F., A Caputi, A.P. (1997) Zymosan-activated plasma induces paw oedema by nitric oxide and prostaglandin production. Life Sciences, 60, 215-220.
Cuzzocrea, S., Zingarelli, B., Hake, P., Salzman, A.L., A Szab6, C. (1998) Antiinflammatory effects of mercaptoethylguanidine, a combined inhibitor of nitric oxide synthase and peroxynitrite scavenger, in carrageenan-induced models of inflammation- Free Radical Biology & Medicine, 24, 450-459.
Daniel, W.W. (1990) Applied Nonparametric Statistics, 2nd edition; PWS-Kent Publishing Company, Boston, Massachusetts; pp. 262-277.
de Vera, M.E., Shapiro, R.A., Nussler, A.K., Mudgett, J.S., Simmons, R.L., Morris, S.M., Billiar, T.R., A Geller, D.A. (19%) Transcriptional regulation of human inducible nitric oxide synthase (NOS2) gene by cytokines: initial analysis of the human NOS2 promoter. Proceedings o f the National Academy o f Sciences, USA, 93, 1054-1059.
DeCamp, C.E., Riggs, C.M., Olivier, N.B., Hauptman, J.G., Hottinger, H.A., A Soutas-Little, R.W. (19%) Kinematic evaluation of gait in dogs with cranial cruciate ligament rupture. American Journal o f Veterinary Research, 57, 120-126.
DeWitt, D.L., Spencer, A., Matsumoto, M., A Smith, W. (19%) Dual prostaglandin biosynthetic pathways: biochemical and physiological implications for eicosanoidsignaling. In Proceedings o f new targets in inflammation: inhibitors o f COX-2 or adhesion molecules. William Harvey Medical Research Foundation; New Orleans, Louisiana; April 15-16.
Di Rosa, M., Giroud, J.P., A Willoughby, D.A. (1971) Studies of the mediators of the acute inflammatory response induced in rats in different sites by carrageenan and turpentine. Journal o f Pathology, 104, 15-29.
Di Rosa, M., Ialenti, A., lanaro, A., A Sautebin, L. (19%) Interaction between nitric oxide and cyclooxygenase pathways. Prostaglandins, Leukotrienes and Essential Fatty Acids, 54, 229-238.
Diaz-Guerra, M.J.M., Velasco, M., Martin-Sanz, P., A BoscA, L. (19%) Evidence for common mechanisms in the transcriptional control o f type II nitric oxide synthase in isolated
125
Reproduced with permission of the copyright owner. Further reproduction prohibited without permission.
hepatocytes requirement of NF-kB activation after stimulation with bacterial cell wall products and phorbol esters. Journal o f Biological Chemistry, 271, 30114-30120.
Doyle, M.P. & Hoekstra, J.W. (1981) Oxidation o f nitrogen oxides by bound dioxygen in hemoproteins. Journal o f Inorganic Biochemistry, 14, 331-358.
Durante, W., Liao, L., & Schafer, A.I. (1993) Differential regulation of L-arginine transport and inducible NOS in cultured vascular smooth muscle cells. American Journal o f Physiology, 268, HI 158-H1164.
Emau, P., Giri, S.N., Anderson, G.A., Stott, J.L., & Osbum, B.I. (1984) Function of prostaglandins, thromboxane A2, and histamine in hypersensitivity reaction to experimental bluetongue disease in calves. American Journal o f Veterinary Research, 45,1852-1857.
Enna, S.J., Williams, M., Ferkany, J.W., Kenakin, T., Porsolt, R.D., & Sullivan, J.P. (1999) Current Protocols in Pharmacology on CD-ROM, John Wiley & Sons, Inc., New York, New York.
Evans, C.H., Watkins, S.C., & Stefanovi£-Ra£ic, M. (1996) Nitric oxide and cartilage metabolism. Methods in Enzymology, 269, 75-88.
Everett, S.A., Dennis, M.F., Patel, K.B., Stratford, M.R.L., & Wardman, P. (1996) Oxidative denitrification of AT-hydroxy-L-arginine by superoxide radical anion. Biochemical Journal, 317, 17-21.
Ezeamuzie, C.I. & Umezurike, C.C. (1989) Effect of histamine H2-receptor antagonists on acute inflammatory o f the rat paw oedema. Journal o f Pharmacy and Pharmacology, 41, 261-265.
Farrell, A.J., Blake, D.R., Palmer, R.M., & Moncada, S. (1992) Increased concentrations of nitrite in synovial fluid and serum samples suggest increased nitric oxide synthesis in rheumatic disease. Annals o f the Rheumatic Diseases, 51, 1219-1222.
Farup, P.G. & Other Members o f the European Zahidine Study Group (1988) Zahidine: an effective but hepatotoxic H2-receptor antagonist Scandinavian Journal o f Gastroenterology, 23, 655-658.
Feelisch, M. & Stamler, J.S. (1996) Measurement of NO-related activities - which assay for which purpose. In Methods in Nitric Oxide Research. M. Feelisch & J.S. Stamler, Editors; John Wiley & Sons Ltd., West Sussex, England; pp. 303-307.
Feely, J., Wilkinson, G.R., & Wood, A J.J. (1981) Reduction o f liver blood flow and propranolol metabolism by cimetidine. New England Journal o f Medicine, 304, 692- 695.
126
Reproduced with permission of the copyright owner. Further reproduction prohibited without permission.
Feldman, P.L., Griffith, O.W., & Stuehr, D.J. (1993) The surprising life o f nitric oxide. Chemical A Engineering News, 71(51), 26-38.
Fernandes, J.C., Martel-Pelletier, J., Otterness, I.G., Lopez-Anaya, A., Mineau, F., Tardif, G., & Pelletier, J.-P. (1995) Effects o f tenidap on canine experimental osteoarthritis. Arthritis A Rheumatism, 38, 1290-1303.
Fletcher, D.S., Widmer, W.R., Luell, S., Christen, A., Orevillo, C., Shah, S., & Visco, D.(1998) Therapeutic administration o f a selective inhibitor of nitric oxide synthase does not ameliorate the chronic inflammation and tissue damage associated with adjuvant- induced arthritis in rats. Journal o f Pharmacology and Experimental Therapeutics, 284, 714-721.
Foote, E.F., Look, Z.M., Giles, P., Keane, W.F., & Halstenson, C.E. (1995) The pharmacokinetics of aminoguanidine in end-stage renal disease patients on hemodialysis. American Journal o f Kidney Disease, 25, 420-425.
Foster, A.P. & Cunningham, F.M. (1998) Histamine-induced adherence and migration of equine eosinophils. American Journal o f Veterinary Research, 59, 1153-1159.
Frey, C., Narayanan, K., McMillan, K., Spack, L., Gross, S.S., Masters, B.S., & Griffith, O.W. (1994) L-Thiocitrulline a stereospecific, heme-binding inhibitor of nitric-oxide synthases. Journal o f Biological Chemistry, 269, 26083-26091.
Fujii, H., Ichimori, K., Hoshiai, K., & Nakazawa, H. (1997) Nitric oxide inactivates NADPH oxidase in pig neutrophils by inhibiting its assembling process. Journal o f Biological Chemistry, 272, 32773-32778.
Fujimoto, Y., Tagano, S., Ogawa, K., Sakuma, S., & Fujita, T. (1998) Comparison of the effects o f nitric oxide and peroxynitrite on the 12-lipoxygenase and cyclooxygenase metabolism o f arachidonic acid in rabbit platelets. Prostaglandins, Leukotrienes and Essential Fatty Acids, 59, 95-100.
Fukuto, J.M. & Chaudhuri, G. (1995) Inhibition of constitutive and inducible nitric oxide synthase: potential selective inhibition. Annual Review o f Pharmacology andToxicology, 35, 165-194.
Fuseler, J.W., Conner, E.M., Davis, J.M., Wolf, R.E., & Grisham, M.B. (1997) Cytokine and nitric oxide production in the acute phase of bacterial cell wall-induced arthritis. Inflammation, 21, 113-131.
Gantz, I., Del Valle, J., Wang, L.-d., Tashiro, T., Munzert, G., Guo, Y.-J., Konda, Y., & Yamada, T. (1992) Molecular basis for the interaction of histamine with the histamine H2 receptor. Journal o f Biological Chemistry, 267, 20840-20843.
127
Reproduced with permission of the copyright owner. Further reproduction prohibited without permission.
Garavito, R.M., Picot, D., & Loll, P.J. (1995) The 3.1 A X-ray crystal structure of the integral membrane enzyme prostaglandin H2 synthase-1 . Advances in Prostaglandin, Thromboxane, and Leukotriene Research, 23, 99-103.
Geller, D.A., Nussier, A.K., Di Silvio, M., Lowenstein, C.J., Shapiro, R.A., Wang, S.C., Simmons, R.L., & Billiar, T.R. (1993) Cytokines, endotoxin, and glucocorticoids regulate the expression of inducible nitric oxide synthase in hepatocytes. Proceedings o f the National Academy afScience, USA, 90, 522-526.
Geng, Y., Blanco, F J ., Cornelisson, M., & Lotz, M. (1995) Regulation of cyciooxygenase expression in normal human articular chondrocytes. Journal o f Immunology, 155, 796-801.
Geng, Y. & Lotz, M. (1995) Increased intracellular Ca2* selectively suppresses IL-1-induced NO production by reducing iNOS mRNA stability. Journal o f Cell Biology, 129, 1651-1657.
Gibaldi, M. & Perrier, P. (1982) Pharmacokinetics, 2nd edition, Marcel Dekker, New York; pp. 445-449.
Gierse, J.K., Hauser, S.D., Creely, D.P., Koboldt, C., Rangwala, S.H., Isakson, P.C., & Seibert, K. (1995) Expression and selective inhibition o f the constitutive and inducible forms of human cyciooxygenase. Biochemical Journal, 305, 479-484.
Gifford, R.R.M. & Schmidtke, J.R. (1979) Cimetidine-induced augmentation of human lymphocyte blastogenesis: comparison with levamisole in mitogen stimulation.Surgical Forum, 30, 113-115.
Gifford, R.R.M. & Tilberg, A.F. (1987) Histamine type-2 receptor antagonist immune modulation II. Cimetidine and ranitidine increase interleukin-2 production. Surgery, 102, 242-247.
Goetz, T.E., Boulton, C.H., & Ogilvie, G.K. (1990a) Clinical management of progressive multifocal benign and malignant melanomas o f horses with oral cimetidine. In Proceedings o f the Thirty-fifth Annual Convention o f the American Association o f Equine Practitioners. M.G. Royer, Editor; American Association of Equine Practitioners, Boston, Massachusetts; pp. 431-438.
Goetz, T.E., Ogilvie, G.K., Keegan, K.G., & Johnson, P.J. (1990b) Cimetidine for treatment of melanomas in three horses. Journal o f the American Veterinary Medical Association, 196, 449-452.
Grabowski, P.S., England, A.J., Dylchuizen, R., Copland, M., Benjamin, N., Reid, D.M., & Ralston, S.H. (1996) Elevated nitric oxide production in rheumatoid arthritis detection using the fasting urinary nitratercreatinine ratio. Arthritis & Rheumatism, 39,643-647.
128
Reproduced with permission of the copyright owner. Further reproduction prohibited without permission.
Granger, D.N. ft Kubes, P. (1996) Nitric oxide as antiinflammatory agent Methods in Enzymology, 269,434-442.
Greenberg, S.S., Ouyang, J., Zhao, X., f t Giles, T.D. (1998) Human and rat neutrophils constitutively express neural nitric oxide synthase mRNA. Nitric Oxide: Biology & Chemistry, 2, 203-212.
Greenberg, S.S., Xie, J., Spitzer, J.J., Wang, J.-f., Lancaster, J., Grisham, M.B., Powers, D.R., f t Giles, T.D. (1995) Nitro containing L-arginine analogs interfere with assays for nitrate and nitrite. Life Sciences, 21, 1949-1961.
Greene, I. ft Hiatt, E.P. (1953) Behavior of the nitrate ion in the dog. American Journal o f Physiology, 176, 463-467.
Greene, I. ft Hiatt, E.P. (1954) Renal excretion of nitrate and its effect on excretion of sodium and chloride. American Journal o f Physiology, 180, 179-182.
Grennan, D.M., Rooney, P.J., Onge, R.A.SL, Brooks, P.M., Zeitlin, I.J., f t Dick, W.C. (1975) Histamine receptors in the synovial microcirculation. European Journal o f Clinical Investigation, 5, 75-82.
Griffith, G.W. ft Gross, S.S (1996) Inhibitors of nitric oxide synthases. In Methods in Nitric Oxide Research. M. Feelisch f t J.S. Stamler, Editors; John Wiley f t Sons Ltd., West Sussex, England; pp. 185-208.
Griffith, O.W. ft Stuehr, D.J. (1995) Nitric oxide synthases: properties and catalyticmechanisms. Annual Review o f Physiology, 57, 707-736.
Griffiths, M.J.D., Messent, M., Curzen, N.P., f t Evans, T.W. (1995) Aminoguanidine selectively decreases cyclic GMP levels produced by inducible nitric oxide synthase. American Journal o f Respiratory and Critical Care Medicine, 152, 1599-1604.
Griffiths, M.J.D., Messent, M., MacAllister, R.J., ft Evans, T.W. (1993) Aminoguanidine selectively inhibits inducible nitric oxide synthase. British Journal o f Pharmacology, 110,963-968.
Grisham, M.B., Johnson, G.G., & Lancaster, J.R. (1996) Quantitation of nitrate and nitrite in extracellular fluids. Methods in Enzymology, 268, 237-246.
Groeneveld, P.H.P., Kwappenberg, K.M.C., Langermans, J.A.M., Nibbering, P.H., f t Curtis, L. (1997) Relation between pro- and anti-inflammatory cytokines and the production of nitric oxide (NO) in severe sepsis. Cytokine, 9, 138-142.
Gross, S.S. f t Levi, R. (1992) Tetrahydrobiopterin synthesis an absolute requirement for cytokine-induced nitric oxide generation by vascular smooth muscle. Journal o f Biological Chemistry, 267, 25722-25729.
129
Reproduced with permission of the copyright owner. Further reproduction prohibited without permission.
Gross, S.S., Stuehr, D.J., Aisaka, K., Jaffe, E.A., Levi, R., & Griffith, O.W. (1990) Macrophage and endothelial cell nitric oxide synthesis: cell-type selective inhibition by A^-aminoarginine, A°-nitroarginine and A/°-methylarginine. Biochemical and Biophysical Research Communications, 170, 96-103.
Guengerich, F.P. (1996) The chemistry o f cytochrome P4S0 reactions. In Cytochromes P450 Metabolic and Toxicological Aspects. C. Ioannides, Editor; CRC Press, Inc., Boca Raton, Florida; pp. S5-74
Guthrie, A.J., Short, C.R., Swan, G.E., MQlders, M.S.G., Killeen, V.M., & Nurton, J.P. (1996) Characterization of a sterile soft-tissue inflammation model in thoroughbred horses. Journal o f Veterinary Pharmacology and Therapeutics, 19,44-49.
Guyton, A.C. & Hall, J.E. (1996) Textbook o f Medical Physiology, 9* edition, W.B. Saunders Company, Philadelphia, Pennsylvania.
Hahm, K.B., Lee, K.J., Choi, S.Y., Kim, J.H., Cho, S.W., Yim, H., Park, S.J., & Chung, M.H. (1997) Possibility of chemoprevention by the eradication of Helicobacter pylori: oxidative DNA damage and apoptosis in H. pylori infection. American Journal o f Gastroenterology, 92, 1853-1857.
Hammond, R.A., Hannon, R., Frean, S.P., Armstrong, S.J., Flower, R.J., & Bryant, C.E.(1999) Endotoxin induction of nitric oxide synthase and cyclooxygenase-2 in equine alveolar macrophages. American Journal o f Veterinary Research, 60, 426-431.
Hampl, V., Walters, C.L., & Archer, S.L. (1996) Determination of nitric oxide by the chemiluminescence reaction with ozone. In Methods in Nitric Oxide Research. M. Feelisch & J.S. Stamler, Editors: John Wiley & Sons Ltd., West Sussex. England: pp. 309-318.
Handy, R.L.C. & Moore, P.K. (1998) A comparison of the effects of L-NAME, 7-NI and L- NIL on carrageenan-induced hindpaw oedema and NOS activity. British Journal o f Pharmacology, 123, 1119-1126.
Hasan, K., Heesen, B.-J., Corbett, J.A., McDaniel, M.L., Chang, K., Allison, W., Wolfifenbuttel, B.H.R., Williamson, J.R., & Tilton, R.G. (1993) Inhibition of nitric oxide formation by guanidines. European Journal o f Pharmacology, 249, 101-106.
Hazinski, T.A., France, M., Kennedy, K.A., & Hansen, T.N. (1988) Cimetidine reduces hyperoxic lung injury in lambs. Journal o f Applied Physiology, 65, 1579-1585.
Hecker, M, Boese, M., Schini-Kerth, V.B., MQlsch, A., & Busse, R. (1995) Characterization of the stable L-arginine-derived relaxing factor released from cytokine-stimulated vascular smooth muscle cells as an A^-hydroxy-L-arginine-nitric oxide adduct. Proceedings o f the National Academy o f Science, 92,4671-4675.
130
Reproduced with permission of the copyright owner. Further reproduction prohibited without permission.
Henry, Y.A. & Singel, D.J. (1996) Metal-nitrosyl interactions in nitric oxide biology probed by electron paramagnetic resonance spectroscopy. In Methods in Nitric Oxide Research. M. Feelisch & J.S. Stamler, Editors; John Wiley & Sons L td, West Sussex, England; pp. 357-372.
Hevel, J.M., White, K.A., & Marietta, M.A. (1991) Purification of the inducible murine macrophage nitric oxide synthase identification as a flavoprotein. Journal o f Biological Chemistry, 266, 22789-22791.
Hibbs, J.B., Taintor, R.R., & Vavrin, Z. (1987) Macrophage cytotoxicity: role for L-arginine deiminase and imino nitrogen oxidation to nitrite. Science, 23S, 473-476.
Hibbs, J.B., Taintor, R.R., Vavrin, Z., & Rachlin, E.M. (1988) Nitric oxide: a cytotoxic activated macrophage effector molecule. Biochemical and Biophysical Research Communications, 157, 87-94.
Hierholzer, C., Harbrecht, B., Menezes, J.M., Kane, J., MacMicking, J., Nathan, C.F., Peitzman, A.B., Billiar, T.R., & Tweardy, D.J. (1998) Essential role of induced nitric oxide in the initiation o f the inflammatory response after hemorrhagic shock. Journal o f Experimented Medicine, 187, 917-928.
Higgins, A.J. & Lees, P. (1983) Phenylbutazone inhibition of prostaglandin Ea production in equine acute inflammatory exudate. Veterinary Record, 113,622-623.
Higgins, A.J. & Lees, P. (1984) Arachidonic acid metabolites in carrageenin-induced equine inflammatory exudate. Journal o f Veterinary Pharmacology and Therapeutics, 7, 65- 72.
Higgins, A.J., Lees, P., & Higgs, G.A (1984a) Detection of prostaglandin-like activity in equine inflammatory exudate - a preliminary report. Equine Veterinary Journal, 16, 71-73.
Higgins, A.J., Lees, P., & Sedgwick, A.D. (1987a) Actions of BW540C in an equine model of acute inflammation: a preliminary study. Veterinary Quarterly, 9,103-110.
Higgins, A.J., Lees, P., & Sedgwick, A.D. (1987b) Development of equine models of inflammation. Veterinary Record. 120, 517-522.
Higgins, A.J., Lees, P., & Wright, J.A. (1984b) Tissue-cage model for the collection o f inflammatory exudate in ponies. Research in Veterinary Science, 36, 284-289.
Hill, S.J., Ganellin, C.R., Timmerman, H., Schwartz, J.C., Shankiey, N.P., Young, J.M., Schunack, W., Levi, R., & Haas, H.L. (1997) International union of pharmacology. XIII. Classification of histamine receptors. Pharmacological Reviews, 49, 253-278.
Hilliquin, P., Borderie, D., Hernvann, A , Menkes, C.J., & Ekindjian, O.G. (1997) Nitric oxide as 5-nitrosoproteins in rheumatoid arthritis. Arthritis A Rheumatism, 40, 1512-1517.
131
Reproduced with permission of the copyright owner. Further reproduction prohibited without permission.
Hinckley, K.A., Fearn, S., Howard, B.R., A Henderson, I.W. (1996) Nitric oxide donors as treatment for grass induced acute laminitis in ponies. Equine Veterinary Journal, 28, 17-28.
Hirasawa, N., Ohuchi, K., Watanabe, M., A Tsurufuji, S. (1987) Mechanism of the inhibitory action of cyciooxygenase inhibitors on leukocyte infiltration: involvement ofendogenous histamine. European Journal o f Pharmacology, 144, 267-27S.
Hirasawa, N., Watanabe, M., Mue, S., Tsurufuji, S., & Ohuchi, K. (1991) Downward regulation of neutrophil infiltration by endogenous histamine without affecting vascular permeability responses in air-pouch-type carrageenin inflammation. Inflammation, 15, 117-126.
Hlavica, P., Kflnzel, U., & Achter, G. (1989) Some properties of an inhibitory cytochrome P- 450 metabolic-intermediate complex existing in a spin-state equilibrium. Biochemical Pharmacology, 38, 3037-3043.
Hoffman, J.M., Pietruszkiewicz, A.M., Habecker, C.N., Phillips, B.T., Bolhofer, W.A., Cragoe, E.J., Torchiana, M.L., Lumma, W.C., A Baldwin, J.J. (1983) Conformational requirements for histamine Hz-receptor inhibitors: a structure-activity study ofphenylene analogues related to cimetidine and tiotidine. Journal o f Medicinal Chemistry, 26, 140-144.
Holland, P.S., Ruoff, W.W., Brumbaugh, G.W., A Brown, S.A. (1997) Plasma pharmacokinetics of ranitidine HC1 in adult horses. Journal o f Veterinary Pharmacology and Therapeutics, 20, 145-152.
Horohov, D.W., Swiderski, C.E., Robinson, J.A., A Klei, T.R. (1997) Cytokine production in equine disease. In Cytokines in Veterinary Medicine. V.E.C.J. Schijns A M.C. Horzinek, Editors; CAB International, New York; pp. 167-176.
Hough, L.B., Nalwalk, J.W., Li, B.Y., Leurs, R., Menger, W.M.P.B., Timmerman, H., Carlile, M.E., Cioffi, C., A Wentland, M. (1997) Novel qualitative structure-activity relationships for the antinociceptive actions of H2 antagonists, H3 antagonists and derivatives. Journal o f Pharmacology and Experimental Therapeutics, 283, 1534- 1543.
Hsueh, W., Tan, X.-d., Qu, X.-w., Sun, X.-m., A Gonzalez-Crussi, F. (1997) Injurious and protective mechanisms in the gut interaction of PAF, phospholipase A2, eicosanoids, and nitric oxide synthase. Advances in Experimental Medicine and Biology, 407, 365- 369.
Huie, R.E. & Padmaja, S. (1993) The reaction of NO with superoxide. Free Radical Research Communications, 18, 195-199.
132
Reproduced with permission of the copyright owner. Further reproduction prohibited without permission.
Hunter, R.P., Canning, P.C., & Hassfurther, R. (1996) Plasma analysis and pharmacokinetics of zahidine, and Hrantagonist, in cattle alter intravenous, intramuscular, subcutaneous, and oral administration. Journal o f Veterinary Pharmacology and Therapeutics, 19, 326*328.
Ianaro, A., O’Donnell, C.A., Di Rosa, M., & Liew, F.Y. (1994) A nitric oxide synthase inhibitor reduces inflammation, down-regulates inflammatory cytokines and enhances interleukin-10 production in carrageenin-induced oedema in mice. Immunology, 82, 370-375.
Ianaro, A., Xu, D., O’Donnell, C.A., Di Rosa, M., & Liew, F.Y. (1995) Expression o f TGF-0 in attenuated Salmonella typhimurium: oral administration leads to the reduction of inflammation, IL-2 and IFN-y, but enhancement of IL-10, in carrageenin-induced oedema in mice. Immunology, 84, 8-15.
Imai, Y., Kolb, H., & Burkhart, V. (1993) Nitric oxide production from macrophages is regulated by arachidonic acid metabolites. Biochemical and Biophysical Research Communications, 197, 105-109.
Ioannoni, B., Mason, S.R., Reilly, P.E.B., & Winzor, D.J. (1986) Evidence for induction of hepatic microsomal cytochrome P-450 by cimetidine: binding and kinetic studies. Archives o f Biochemistry and Biophysics, 247,372-383.
Iuvone, T., Van Osselaer, N., D’Acquisto, F., Camuccio, R., & Herman, A.G. (1997) Differential effect of L-NAME and S-methyl-isothiourea on leukocyte emigration in carrageenin-soaked sponge implants in rat. British Journal o f Pharmacology, 121, 1637-1644.
Iyengar, R., Stuehr, D.J., & Marietta, M.A. (1987) Macrophage synthesis of nitrite, nitrate and jV-nitrosoamines: precursors and the role of respiratory burst. Proceedings o f the National Academy o f Science, USA, 84, 6369-6373.
Izzo, A.A., Costa, M., Mascolo, N., & Capasso, F. (1998) The role of histamine Hi, H2, and H3 receptors on enteric ascending synaptic transmission in the guinea pig ileum. Journal o f Pharmacology and Experimental Therapeutics, 287, 952-957.
Jarvinen, T.A.H., Moilanen, T., JBrvinen, T.L.N., & Moilanen, E. (1996) Endogenous nitric oxide and prostaglandin E2 do not regulate the synthesis of each other in interleukin-1 0 - stimulated rat articular cartilage. Inflammation, 20, 683-692.
Jenkins, W.L. (1991) Chemotherapeutic agents affecting host cellular functions: antineoplastics and immunomodulators. In Veterinary Applied Pharmacology & Therapeutics. 5* edition, G.C. Brander, D.M. Pugh, R.J. Bywater, & W.L. Jenkins, Editors; Bailliere Tindall, London; pp. 392-411.
Kaneta, S., Yanaguimoto, H., Kagaya, J., Ishizuki, S., & Fujihira, E. (1993) Effects of Hr- antihistamines in murine models o f immediate hypersensitivity and chronic
133
Reproduced with permission of the copyright owner. Further reproduction prohibited without permission.
inflammation. Research Communications in Chemical Pathology and Pharmacology, 79, 167-184.
Kelly, M.D., King, J., Cherian, M., Dwerryhouse, S.J., Finlay, I.G., Adams, W.J., King, D.W., Lubowski, D.Z., & Morris, D.L. (1999) Randomized trial o f preoperative cimetidine in patients with colorectal carcinoma with quantitative assessment of tumor-associated lymphocytes. Cancer, 85, 1658-1663.
Kelm, M. & Schrader, J. (1990) Control of coronary vascular tone by nitric oxide. Circulatory Research, 6 6 , 1561-1575.
Kelm, M., Feelisch, M., Krebber, T., Motz, W., & Strauer, B.E. (1993) Mechanisms o f histamine-induced coronary vasodilatation: Hi-receptor-mediated release ofendothelium-derived nitric oxide. Journal o f Vascular Research, 30, 132-138.
Kelm, M. & Yoshida, K. (1996) Metabolic fate o f nitric oxide and related N-oxides. In Methods in Nitric Oxide Research. M. Feelisch & J.S. Stamler, Editors; John Wiley & Sons Ltd., West Sussex, England; pp. 47-58.
Kerwin, J.R., Lancaster, J.R., & Feldman, P.L. (1995) Nitric oxide: a new paradigm for second messengers. Journal o f Medicinal Chemistry, 38, 4343-4362.
Khan, M.M., Keaney, K.M., Melmon, K.L., Clayberger, C., & Krensky, A.M. (1989) Histamine regulates the generation of human cytolytic T lymphocytes. Cellular Immunology, 121, 60-73.
Kitchen, D.L., Merritt, A.M., & Burrow, J.A. (1998) Histamine-induced gastric acid secretion in horses. American Journal o f Veterinary Research, 59, 1303-1306.
Knowles, R.G. & Salter, M. (1998) Measurement of NOS activity by conversion o f radiolabeled arginine to citrulline using ion-exchange separation. In Nitric Oxide Protocob. M.A. Thheradge, Editor; Humana Press, Totowa, New Jersey; pp. 67-73.
Knox, L.K., Stewart, A.G., Hayward, P.G., & Morrison, W.A. (1994) Nitric oxide synthase inhibitors improve skin flap survival in the ra t Microsurgery, 15, 708-711.
Koehler, L., Hass, R., DeWitt, D.L., Resch, K., & Goppelt-Struebe, M. (1990) Glucocorticoid- induced reduction o f prostanoid synthesis in TPA-differentiated U937 cells is mainly due to a reduced cyciooxygenase activity. Biochemical Pharmacology, 40, 1307- 1316.
Koga, K., Sata, T., Nanri, H., Sano, H., flceda, M., & Shigematsu, A. (1995) Role of nitric oxide during carrageenan-sensitized endotoxin shock in mice. Life Sciences, 57, 2309- 2316.
Kohn, F.R. & Kung, H.C. (1995) Role of endotoxin in acute inflammation induced by Gram- negative bacteria: specific inhibition of lipopolysaccharide-mediated responses with an
134
Reproduced with permission of the copyright owner. Further reproduction prohibited without permission.
amino-terminal fragment of bactericidal/permeability-increasing protein. Infection and Immunity, 63, 333-339.
Kubes, P., Suzuki, M., & Granger, D.N. (1991) Nitric oxide: an endogenous modulator of leukocyte adhesion. Proceedings o f the National Academy o f Sciences, USA, 8 8 , 4651-4655.
Kudo, S. & Kawano, K. (1999) Role o f interleukin-lp in the modulations o f cytochrome P450 and heme metabolism in rat liver. Journal o f Interferon and Cytokine Research, 19, 601-607.
Kuo, P.C., Abe, K.Y., & Dafoe, D.C. (1995) Cytochrome P450IUA activity and cytokine- mediated synthesis of nitric oxide. Surgery, 118, 310-317.
Kunz, D., Walker, G., Eberhardt, W., Mitsch, D., & Pfeilschifter, J. (1995) Interleukin 1(3- induced expression of nitric oxide synthase in rat renal mesangial cells is suppressed by cyclosporin A. Biochemical and Biophysical Research Communications, 216, 438- 446.
Lam, F.Y. & Ferrell, W.R. (1990) Mediators o f substance P-induced inflammation in the rat knee joint. Agents and Actions, 31, 298-307.
Lancaster, J.R. (1997) A tutorial on the diffusibility and reactivity of free nitric oxide. Nitric Oxide: Biology and Chemistry, 1, 18-30.
Langenbach, R., Morham, S.G., Tiano, H.F., Loftin, C.D., Ghanayem, B.I., Chulada, P.C., Mahler, J.F., Lee, C.A., Gculding, E.H., Kluckman, K.D., Kim, H.S., & Smithies, O. (1995) Prostaglandin synthase 1 gene disruption in mice reduces arachidonic acid- induced inflammation and indomethacin-induced gastric ulceration. Cell, 83, 483-492.
Laskin, J.D., Heck, D.E., & Laskin, D.L. (1994) Multifunctional role of nitric oxide in inflammation. Trends in Endocrinology and Metabolism, 5, 377-382.
Laszlo, F., Evans, S.M., & Whittle, B.J.R. (1995) Aminoguanidine inhibits both constitutive and inducible nitric oxide synthase isoforms in rat intestinal microvascular in vivo. European Journal o f Pharmacology, 272, 169-175.
Lawand, N.B., Willis, W.D., & Westlund, K.N. (1997) Blockade of joint inflammation and secondary hyperalgesia by L-NAME, a nitric oxide synthase inhibitor. NeuroReport, 8 , 895-899.
Lederer, J.A. & Czuprynski, C.J. (1995) Interleukin-1. In Cytokines in Animal Health and Disease. M J. Myers & M.P. Murtaugh, Editors; Marcel Dekker, Inc., New York; pp. 59-88.
Lee, J.-I. & Burckart, G.J. (1998) Nuclear factor kappa B: important transcription factor and therapeutic target. Journal o f Clinical Pharmacology, 38, 981-993.
135
Reproduced with permission of the copyright owner. Further reproduction prohibited without permission.
Lees, P. & Higgins, A.J. (1986) Effects of a phenylbutazone paste in ponies: model o f acute nonimmune inflammation. American Journal o f Veterinary Research, 47,23S9-2363.
Lesser, M.L., Braun, H.I., & Helson, L. (1980) Statistical methods for measuring and comparing treatment efficacies: applications to nude mice experimentation.Experimented Cell Biology, 48, 126*137.
Levine, M., Law, E.Y.W., Bandiera, S.M., Chang, T.K.H., & Bellward, G.D. (1998) In vivo cimetidine inhibits hepatic CYP2C6 and CYP2C11 but not CYP1A1 in adult male rats. Journal o f Pharmacology and Experimented Therapeutics, 284, 493-499.
Lewis, D.F.V. (1996) Substrate-binding spectra. In Cytochromes P450 Structure, Function and Mechanism. Taylor & Francis, Bristol, Pennsylvania; pp. 14-19.
Lin, J.H. & Lu, A.Y.H. (1998) Inhibition and induction of cytochrome P4S0 and the clinical implications. Clinical Pharmacokinetics, 35, 361-390.
Linn, S.C., Morelli, P.J., Edry, I., Cottongim, S.E., Szabd, C., & Salzman, A.L. (1997) Transcriptional regulation of human inducible nitric oxide synthase gene in an intestinal epithelial cell line. American Journal o f Physiology, 35, G1499-G1508.
Liu, H., Song, D., & Lee, S.S. (1999) Increased nitric oxide synthase expression in aorta of cirrhotic rats. Life Sciences, 64, 1753-1759.
Loll, P.J., Picot, D., & Garavito, R.M. (1995) The structural basis of aspirin activity inferred from the crystal structure of inactivated prostaglandin H2 synthase. Nature Structural Biology, 2, 637-643.
Lowenstein, C.J., Alley, E.W., Raval, P., Snowman, A.M., Snyder, S.H., Russell, S.W., & Murphy, W.J. (1993) Macrophage nitric oxide synthase gene: two upstream regions mediate induction by interferon y and lipopolysaccharide. Proceedings o f the National Academy o f Science, USA, 90, 9730-9734.
Lowenstein, C.J., Glatt, C.S., Bredt, D.S., & Snyder, S.H. (1992) Cloned and expressed macrophage nitric oxide synthase contrasts with the brain enzyme. Proceedings o f the National Academy o f Science, USA, 89, 6711-6715.
Lu, L.F. & Fisc us, R.R. (1999) Interleukin- ip causes different levels of nitric oxide-mediated depression o f contractility in different positions of rat thoracic aorta. Life Sciences, 64, 1373-1381.
Malinski, T. & Czuchajowski, L. (1996) Nitric oxide measurement by electrochemical methods. In Methods in Nitric Oxide Research. M. Feelisch & J.S. Stamler, Editors; John Wiley & Sons Ltd., West Sussex, England; pp. 319-339.
136
Reproduced with permission of the copyright owner. Further reproduction prohibited without permission.
Mannaioni, P.F., Bello, M.G., Di Bello, M.G., Mirabella, C., Gai, P ., Schunack, W., A Mas ini, E. (1997) Interaction between histamine and nitric oxide in rat mast cells and in isolated guinea pig hearts. International Archives o f Allergy and Immunology, 113, 297-299.
Mannaioni, P.F., Fantozzi, R., Giaimella, E., A Mas ini, E. (1988) Pathophysiological significance of the distribution of histamine receptor sub-types: a propoUd dual role for histamine in inflammation and type I hypersensitivity reactions. Agents and Actions, 24, 26-34.
Marietta, M.A. (1993) Nitric oxide synthase structure and mechanism. Journal o f Biological Chemistry, 268, 12231-12234.
Marietta, M.A., Yoon, P.S., Iyengar, R., Leaf, C.D., A Wishnok, J.S. (1988) Macrophage oxidation of L-arginine to nitrite and nitrate: nitric oxide is an intermediate.Biochemistry, 27, 8706-8711.
Marotta, P., Sautebin, L., A Di Rosa, M. (1992) Modulation of the induction of nitric oxide synthase of eicosanoids in the murine macrophage cell line J774. British Journal o f Pharmacology, 107,640-641.
Marsden, P.A., Heng, H.H.Q., DufiL C.L., Shi, X.-M., Tsui, L.-C., A Hall, A.V. (1994) Localization of the human gene for inducible nitric oxide synthase (NOS2) to chromosome 17qll.2-ql2. Genomics, 19, 183-185.
Marsden, P.A., Heng, H.H.Q., Scherer, S.W., Stewart, R.J., Hall, A.V., Shi, X.M., Tsui, L.- C., A Schappert, K.T. (1993) Structure and chromosomal localization of the human constitutive endothelial nitric oxide synthase gene. Journal o f Biological Chemistry, 268, 17478-17488.
Martinez, C., Albet, C., Agundez, J.A.G., Herrero, E., Carrillo, J.A., M irquez, M., Benitez, J., & Ortiz, J.A. (1999) Comparative in vitro and in vivo inhibition o f cytochrome P450 CYP1A2, CYP2D6, and CYP3A by Hz-receptor antagonists. Clinical Pharmacology and Therapeutics, 65, 369-376.
Marzinzig, M., Nussier, A.K., Stadler, J., Marzinzig, E., Barthlen, W., Nussier, N.C., Berger, H.G., Morris, S.M., A BrQckner, U.B. (1997) Improved methods to measure end products of nitric oxide in biological fluids: nitrite, nitrate, and S-nitrosothiols. Nitric Oxide: Biology and Chemistry, 1, 177-189.
MaureL P. (1996) The CYP3 family. In Cytochromes P450 Metabolic and Toxicological Aspects. C. Ioannides, Editor; CRC Press, Inc., Boca Raton, Florida; pp. 241-270.
May, S.A. (1997) Cytokines in the pathogenesis of equine joint disease. In Cytokines in Veterinary Medicine. V.E.C.J. Schijns & M.C. Horzinek, Editors; CAB International, New York; pp. 191-199.
137
Reproduced with permission of the copyright owner. Further reproduction prohibited without permission.
May, S.A., Lees, P., Higgins, A J., & Sedgwick, A.D. (1987) Inflammation: a clinicalperspective. Veterinary Record, 120, 514-514.
McCall, T.B., Boughton-Smhh, N.K., Palmer, R.M.J., Whittle, & Moncada, S. (1989)Synthesis of nitric oxide from L-arginine by neutrophils release and interaction with superoxide anion. Biochemical Journal, 261, 293*296.
McKee, C.M., Lowenstein, C.J., Horton, M.R., Wu, J., Bao, C., Chin, BJC., Choi, A.M.K., & Noble, P.W. (1997) Hyaluronan fragments induce nitric-oxide synthase in murine macrophages through a nuclear factor xB-dependent mechanism. Journal o f Biological Chemistry, 272, 8013*8018.
McLeod, R.L., Aslanian, R., Del Prado, M., Duffy, R., Egan, R.W., Kreutner, W., McQuade, R., &. Hey, J.A. (1998) Sch S0971, an orally active histamine H3 receptor agonist, inhibits central neurogenic vascular inflammation and produces sedation in the guinea pig. Journal o f Pharmacology and Experimental Therapeutics, 287, 43-SO.
McMillan, K., Bredt, D.S., Hirsch, D.J., Snyder, S.H., Clark, J.E., & Masters, B.S.S. (1992) Cloned, expressed rat cerebellar nitric oxide synthase contains stoichiometric amounts o f heme, which binds carbon monoxide. Proceedings o f the National Academy o f Science, USA, 89, 11141-11145.
McMillan, K. & Masters, B.S.S. (1995) Prokaryotic expression of the heme* and flavin-binding domains o f rat neuronal nitric oxide synthase as distinct polypeptides: identification of the heme-binding proximal thiolate ligand as cysteine-415. Biochemistry, 34, 3686- 3693.
Meade, E.A., Smith, W.L., & DeWitt, D.L. (1993) Differential inhibition o f prostaglandin endoperoxide synthase (eye iooxygenase) isozymes by aspirin and other non-steroidal anti-inflammatory drugs. Journal o f Biological Chemistry, 268,6610-6614.
Meijer, F., Tak, C., van Haeringen, N.J., & Kijlstra, A. (1996) Interaction between nitric oxide and prostaglandin synthesis in the acute phase of allergic conjunctivitis. Prostaglandins, 52, 431-446.
Melchiorri, C., Meliconi, R., Frizziero, L., Silvestri, T., Pulsatelli, L., Mazzetti, I., Borzi, R.M., Uguccioni, M., & Facchini, A. (1998) Enhanced and coordinated in vivo expression of inflammatory cytokines and nitric oxide synthase by chondrocytes from patients with osteoarthritis. Arthritis & Rheumatism, 41,2165-2174.
Menzel, J.E. & Kolarz, G. (1997) Modulation o f nitric oxide synthase activity by ibuprofen. Inflammation, 21, 451-461.
Mer&ey, K., Falus, A., Taga, T., & Kishimoto, T. (1991) Histamine influences the expression o f the interleukin-6 receptor on human lymphoid, monocytoid and hepatoma cell lines. Agents and Actions, 33, 189-191.
138
Reproduced with permission of the copyright owner. Further reproduction prohibited without permission.
Michelakis, E.D. & Archer, S.L. (1998) The measurement o f NO in biological systems using chcmiluminescence. In Nitric Oxide Protocols. M.A. Titheradge, Editor; Humana Press, Totowa, New Jersey; pp. 111-127.
Mignon, M., Valkrt, T., Mayeur, S., & Boofils, S. (1980) Ranitidine and cimetidine in Zollinger-Ellison syndrome. British Journal o f Clinical Pharmacology, 10, 173-174.
Milano, S., Arcoleo, F., Dieli, M., D’Agostino, R., D’Agostino, P., De Nucci, G., & Cillari, E. (1995) Prostaglandin E2 regulates inducible nitric oxide synthase in the murine macrophage cell line J774. Prostaglandins, 49, 105-115.
Mirza, M.H., Oliver, J.L., Seahom, T.L., Hosgood, G., & Moore, R.M. (1999a) Detection and comparison o f nitric oxide in clinically normal horses and those with naturally acquired small intestinal strangulation obstruction. Canadian Journal o f Veterinary Research, 63, 230-240.
Mirza, M.H., Seaborn, T.L., Oliver, J.L., Hosgood, G., & Moore, R.M. (1999b) Detection and comparison o f nitric oxide in clinically normal horses and those with acquired strangulating large-colon volvulus. American Journal o f Veterinary Research, w , pp-pp.
Misko, T.P., Moore, W.M., Kasten, T.P., Nickols, G.A., Corbett, J.A., Tilton, R.G., McDaniel, M.L., Williamson, J.R., & Currie, M.G. (1993) Selective inhibition of the inducible nitric oxide synthase by aminoguanidine. European Journal o f Pharmacology, 233, 119-125.
Modolell, M., Eichmann, K., & Soler, G. (1997) Oxidation o f A^-hydroxyl-L-arginine to nitric oxide mediated by respiratory burst: an alternative pathway to NO synthesis. FEBS Letters, 401, 123-126.
Moncada, S. & Higgs, A. (1993) The L-arginine-nitric oxide pathway. New England Journal o f Medicine, 27, 2002-2012.
Moncada, S., Higgs, A., & Furchgott, R. (1997) XIV. International union of pharmacology nomenclature in nitric oxide research. Pharmacological Reviews, 49, 137-142.
Monshouwer, M., Witkamp, R.F., Nijmeijer, S.M., Van Amsterdam, J.G., & Van Miert, A.S.J.P.A.M. (1996) Suppression of cytochrome P450- and UDP glucuronosyl transferase-dependent enzyme activities by proinflammatory cytokines and possible role of nitric oxide in primary cultures of pig hepatocytes. Toxicology and Applied Pharmacology, 137, 237-244.
Moore, P.K., al-Swayeh, O.A., Chong, N.W.S., Evans, R.A., & Gibson, A. (1990) L-N°- nitroarginine (l-NOARG), a novel, L-arginine-reversible inhibitor of endothelium- dependent vasodilation in vitro. British Journal o f Pharmacology, 99, 408-412.
139
Reproduced with permission of the copyright owner. Further reproduction prohibited without permission.
M ot, S., Nagler, A., Barak, V., Handzel, Z.T., Geller-Bernstein, C., & Fabian, I. (1995) Histamine enhances granulocyte-macrophage colony-stimulating factor and interleukin- 6 production by human peripheral blood mononuclear ceils. Journal o f Leukocyte Biology, 58,445-450.
Morgan, E.T. (1997) Regulation o f cytochromes P4S0 during inflammation and infection. Drug Metabolism Reviews, 29, 1129-1188.
Morham, S.G., Langenbach, R., Loftin, C.D., Tiano, H.F., Vouloumanos, N., Jennette, J.C., Mahler, J.F., Kluckman, K.D., Ledford, A., Lee, C.A., & Smithies, O. (1995) Prostaglandin synthase 2 gene disruption causes severe renal pathology in the mouse. Cell, 83, 473-482.
Myers, M.J., Farrell, D.E., Evock-Clover, C.M., Cope, C.V., Henderson, M., & Steele, N.C. (1995) Effect of recombinant growth hormone an chromium picolinate on cytokine production and growth performance in swine. Pathobiology, 63, 283-287.
Myers, M.J., Farrell, D.E., Evock-Clover, C.M., McDonald, M.W., & Steele, N.C. (1997) Effect of growth hormone or chromium picolinate on swine metabolism and inflammatory cytokine production after endotoxin challenge exposure. American Journal o f Veterinary Research, 58, 594-600.
Myers, M.J. & Murtaugh, M.P. (1995) Biology of tumor necrosis factor. In Cytokines in Animal Health and Disease. M.J. Myers & M.P. Murtaugh, Editors; Marcel Dekker, Inc., New York; pp. 121-151.
Nakamoto, K., Wada, K., Kitano, M., Kishimoto, Y., Ashida, K., Kamisaki, Y, Kawasaki, H., & iron, T. (i99S) The roie of endogenous acid in the development of acute gastric ulcer induced by ischemia-reperfusion in the rat. Life Sciences, 62, PL63-PL69.
Nathan, C. (1992) Nitric oxide as a secretory product of mammalian cells. FASEB Journal, 6 , 3051-3064.
Nathan, C. & Xie, Q.-w. (1994) Nitric oxide synthases: roles, tolls, and controls. Cell, 78, 915-918.
Newman, S.P., Flower, R.J., & Croxtall, J.D. (1994) Dexamethasone suppression of IL-ip- induced cyclooxygenase 2 expression is not mediated by lipocortin-I in A549 cells. Biochemical and Biophysical Research Communications, 202, 931-939.
Nishio, M., Watanabe, Y., & Hidaka, H. (1998) HMN-1180, a small molecule inhibitor of neuronal nitric oxide synthase. Journal o f Pharmacology and Experimental Therapeutics, 287, 1063-1067.
Niwa, M., Kawai, Y., Nakamura, N., & Futaki, S. (1997) The structure o f the promoter region for rat inducible nitric oxide synthase gene. Life Sciences, 61, P45-P49.
140
Reproduced with permission of the copyright owner. Further reproduction prohibited without permission.
Noble, P.W., McKee, C.M., Cowman, M., St Shin, H.S. (1996) Hyaluronan fragments activate an NF-kB/I-kB<x autoregulatory loop in murine macrophages. Journal o f Experimental Medicine, 183,2373-2378.
Nussier, A.K., Billiar, T.R., Lie, Z.-Z., Sc. Morris, S.M. (1994) Coinduction o f nitric oxide synthase and argininosuccinate synthetase in a murine macrophage cell line. Journal o f Biological Chemistry, 269,1257-1261.
Ogden, B.E. St Hill, H.R. (1980) Histamine regulates lymphocyte mitogenic responses through activation of specific Hi and H2 histamine receptors. Immunology, 41, 107-114.
Oraura, S. St Sato, R. (1964) The carbon monoxide-binding pigment of liver microsomes. Q. solubilization, purification, and properties. Journal o f Biological Chemistry, 239, 2379-2385.
O’Neill, S.K., Dutta, S., St Triggle, C.R. (1993) Computerized data acquisition and analysis applied to cbemiluminescence detection o f nitric oxide in headspace gas. Journal o f Pharmacological and Taxicological Methods, 29, 217-221.
Ortiz de Montellano, P.R., Nishida, C., Rodriguez-Crespo, I., St Gerber, N. (1998) Nitric oxide synthase structure and electron transfer. Drug Metabolism and Disposition, 26, 1185- 1189.
Osborn, L. (1990) Leukocyte adhesion to endothelium in inflammation. Cell, 62, 3-6.
Owen, D.A.A., Poy, E., Woodward, D.F., St Daniel, D. (1980) Evaluation o f the role of histamine H r and Hrreceptors in cutaneous inflammation in the guinea-pig produced by histamine and mast cell degranulation. British Journal o f Pharmacology. 69, 615- 623. ' ~
Owens, J.G., Kamerling, S.G., Stanton, S.R., Keowen, M.L., & Prescott-Mathews, J.S. (1996) Effects o f pretreatment with ketoprofen and phenylbutazone on experimentally induced synovitis in horses. American Journal o f Veterinary Research, S7, 866-874.
Oyanagui, Y. St Sato, S. (1993) Histamine paw edema o f mice was increased and became H r antagonist sensitive by co-injection o f nitric oxide forming agents, but serotonin paw edema was decreased. Life Sciences, 52, 159-164.
Palmer, J.L. St Bertone, A.L. (1994) Joint structure, biochemistry and biochemical disequilibrium in synovitis and equine joint disease. Equine Veterinary Journal, 26, 263-277.
Pan, B.-F., Dutt, A., Sc Nelson, J.A. (1994) Enhanced transepithelial flux of cimetidine by Madin-Darby canine kidney cells overexpressing human p-glycoprotein. Journal o f Pharmacology and Experimental Therapeutics, 270, 1-7.
141
Reproduced with permission of the copyright owner. Further reproduction prohibited without permission.
Pelkonen, O. & Puurunen, J. (1980) The effect of cimetidine on in vitro and in vivo microsomal drug metabolism in the rat. Biochemical Pharmacology, 29, 3075-3080.
Pendino, K.J., Laskin, J.D., Shuler, R.L., Punjabi, C.J., & Laskin, D.L. (1993) Enhanced production of nitric oxide by rat alveolar macrophages after inhalation of a pulmonary irritant is associated with increased expression o f nitric oxide synthase. Journal o f Immunology, 151, 7196-7205.
Peng, H.-B., Libby, P., & Kiao, J.K. (1995) Induction and stabilization of IicBa by nitric oxide mediates inhibition ofNF-icB. Journal o f Biological Chemistry, 270, 14214-14219.
Persson, K., Colditz, I.G., Flapper, P., Franklin, N.A.F., & Seow, H-F. (1996) Cytokine- induced inflammation in the ovine teat and udder. Veterinary Immunology and Immunopathology, 53, 73-85.
Physicians’ Desk Reference (1998) Tagamet. Medical Economics Company, Inc., Montvale, NJ; pp. 2864-2867.
Picot, D., Loll, P.J., & Garavito, R.M. (1994) The X-ray crystal structure of the membrane protein prostaglandin H2 synthase- 1. Nature, 367, 243-249.
Pilbeam, D.J. & Kirkby, E.A. (1990) The physiology of nitrate uptake. In Nitrogen in Higher Plants. Y.P. AbroL, Editor; Research Studies Press, Ltd., Somerset, England; pp. 39- 64.
Piyapolrungroj, N., Li, C., Pisoni, R.L., & Fleisher, D. (1999) Cimetidine transport in brush- border membrane vesicles from rat small intestine. Journal o f Pharmacology and Experimental Therapeutics, 289, 346-353.
Pond, M J. & Nuki, G. (1973) Experimentally-induced osteoarthritis in the dog. Annals o f Rheumatic Disease, 32, 387-388.
Pou, S., Pou, W.S., Bredt, D.S., Snyder, S.H., & Rosen, G.M. (1992) Generation of superoxide by purified brain nitric oxide synthase. Journal o f Biological Chemistry, 267, 24173-24176.
Presta, A., Liu, J., Sessa, W.C., & Stuehr, D.J. (1997) Substrate binding and calmodulin binding to endothelial nitric oxide synthase coregulate its enzymatic activity. Nitric Oxide: Biology & Chemistry, 1, 74-87.
Pufahl, R.A. & Marietta, M.A. (1993) Oxidation of A^-hydroxy-L-arginine by nitric oxide synthase: evidence for the involvement of the heme in catalysis. Biochemical and Biophysical Research Communications, 193, 963-970.
Pufahl, R.A., Nanjappan, P.G., Woodard, R.W., & Marietta, M.A. (1992) Mechanistic probes of N-hydroxylation o f L-arginine by the inducible nitric oxide synthase from murine macrophages. Biochemistry, 31,6822-6828.
142
Reproduced with permission of the copyright owner. Further reproduction prohibited without permission.
Quaroni, L., Reglinski, J., Wolf, R., & Smith, W.E. (19%) Interaction o f nitrogen monoxide with cytochrome P-450 monitored by surface-enhanced resonance Raman scattering.Biochimica et Biophysica Acta, 12%, 5-8.
Renaud, J.-P., Boucher, J.-L., Vadon, S., Delaforge, M., & Mansuy, D. (1993) Particular ability of liver P430s3A to catalyze the oxidation of iV“-hydroxyarginine to citrulline and nitrogen oxides and occurrence in NO synthases of a sequence very similar to the heme-binding sequence in P4S0s. Biochemical and Biophysical Research Communications, 192, 53-60.
Rendic, S., Kajfei, F., & Ruf, H.-H. (1983) Characterization o f cimetidine, ranitidine, and related structures’ interaction with cytochrome P-450. Drug Metabolism and Disposition, 11, 137-142.
Rendic, S., Ruf, H.H., Weber, P., & Kajfei, F. (1984) Cimetidine and ranitidine: their interaction with human and pig liver microsomes and with purified cytochrome P-450. European Journal o f Drug Metabolism and Pharmacokinetics, 9, 195-200.
Renoux, M., Hillquin, P., Galoppin, L., Florentin, I., & Menkes, C.J. (19% ) Release of mast cell mediators and nitrites into knee joint fluid in osteoarthritis-comparison with articular chondrocalcinosis and rheumatoid arthritis. Osteoarthritis and Cartilage, 4, 175-179.
Rezai, A.R., Salazar-Gonzalez, J.F., Martinez-Marza, O., BramhalL, J., Afrasiabi, R, & Kermani-Arab, V. (1990) Histamine blocks interleukin 2 (IL-2) gene expression and regulates IL-2 receptor expression. Immunopharmacology and Jmmunotoxicology, 12, 345-362,
Richards, C.D., Scamurra, R.W., & Murtaugh, M.P. (1995) Interleukin-6 . In Cytokines in Animal Health and Disease. M.J. Myers & M.P. Murtaugh, Editors; Marcel Dekker, Inc., New York; pp. 153-182.
Ridger, V.C., Pettipher, E.R., Bryant, C.E., & Brain, S.D., (1997) Effect o f the inducible nitric oxide synthase inhibitors aminoguanidine and L-A^-(l-iminoethyl)lysine on zymosan- induced plasma extravasation in rat skin. Journal o f Immunology, 159, 383-390.
Rodriguez-Crespo, I., Gerber, N.C., & de Montellano, P.R.O. (19%) Endothelial nitric-oxide synthase expression in Escherichia coli, spectroscopic characterization, and role of tetrahy drob iopterin in dimer formation. Journal o f Biological Chemistry, 271, 11462- 11467.
R6denas, J., Mitjavila, M.R., & Carbonell, T. (1998) Nitric oxide inhibits superoxide production by inflammatory polymorphonuclear leukocytes. American Journal o f Physiology, 274, C827-C830.
143
Reproduced with permission of the copyright owner. Further reproduction prohibited without permission.
Rozniecki, J.J., Letoumeau, R., Sugiuhzoglu, M., Spanos, C., Gorbach, J., & Theoharides, T.C. (1999) Differential effect of histamine 3 receptor-active agents on brain, but not peritoneal, mast cell activation. Journal o f Pharmacology and Experimental Therapeutics, 290, 1427-1435.
Rubbo, H., Radi, R., Trujillo, M., Telleri, R., Kalyanaraman, B., Barnes, S., Kirk, M., & Freeman, B.A. (1994) Nitric oxide regulation of superoxide and peroxynitrite- dependent lipid peroxidation formation o f novel nitrogen-containing oxidized lipid derivatives. Journal o f Biological Chemistry, 269, 26066-26075.
Rubin, G.J. (1996) Endogenous and exogenous nitric oxide donors. Compendium on Continuing Education for the Practicing Veterinarian, 18, 639-678.
Salvemini, D. (1997) Regulation of cyclooxygenase enzymes by nitric oxide. Cellular and Molecular Life Sciences, S3, 576-582.
Salvemini, D., Manning, P.T., Zweifel, B.S., Seibert, K., Connor, J., Currie, M.G., Needleman, P., & Masferrer, J.L. (1995) Dual inhibition of nitric oxide and prostaglandin production contributes to the antiinflammatory properties o f nitric oxide synthase inhibitors. Journal o f Clinical Investigation, 96,301-308.
Salvemini, D. & Masferrer, J.L. (1996) Interactions of nitric oxide with cyclooxygenase: in vitro, ex vivo, and in vivo studies. Methods in Enzymology, 269, 12-25.
Salvemini, D., Misko, T.P., Masferrer, J.L., Seibert, K., Currie, M.G., & Needleman, P. (1993) Nitric oxide activates cyclooxygenase enzymes. Proceedings o f the National Academy o f Science, USA, 90, 7240-7244.
Salvemini, D., Wang, Z.-Q., Bourdon, D.M., Stem, M.K., Currie, M.G., & Manning, P.T. (1996a) Evidence of peroxynitrite involvement in the carrageenan-induced rat paw edema. European Journal o f Pharmacology, 303, 217-220.
Salvemini, D., Wang, Z.-Q., Wyatt, P.S., Bourdon, D.M., Marino, M.H., Manning, P.T., & Currie, M.G. (1996b) Nitric oxide: a key mediator in the early and late phase of carrageenan-induced rat paw inflammation. British Journal o f Pharmacology, 118, 829-838.
Salzman, A.L., Denenberg, A.G., Ueta, I., O’Conner, M, Linn, S.C, & Szabo, C. (1996) Induction and activity of nitric oxide synthase in cultured human intestinal epithelial monolayers. American Journal o f Physiology, 270, G565-G573.
Sams, R.A., Gerken, D.F., Dyke, T.M., Reed, S.M., & Ashcraft, S.M. (1997) Pharmacokinetics of intravenous and intragastric cimetidine in horses I. Effects of intravenous cimetidine on pharmacokinetics o f intravenous phenylbutazone. Journal o f Veterinary Pharmacology and Therapeutics, 20, 355-361.
144
Reproduced with permission of the copyright owner. Further reproduction prohibited without permission.
Sano, H., Hla, T., Maier, Crofford, L.J., Case, J.P., Maciag, T., & Wilder, R.L.(1992) In vivo cyclooxygenase expression in synovial tissues of patients with rheumatoid arthritis and osteoarthritis and rats with adjuvant and streptococcal cell wall arthritis. Journal o f Clinical Investigation, 89, 97-108.
Schenkman, J.B., Cinti, D.L., Moldeus, P.W., & Orrenius, S. (1973) Newer aspects of substrate binding to cytochrome P-450. Drug Metabolism & Disposition, 1, 111-120.
Schenkman, J.B., Reminer, H., & Estabrook, R.W. (1967) Spectral studies of drug interaction with hepatic microsomal cytochrome. Molecular Pharmacology, 3, 113-123.
Schmidt, H.H.H.W. & Kebn, M. (1998) Determination of nitrite and nitrate by the Griess reaction. In Methods in Nitric Oxide Research. M. Feelisch & J.S. Stamler, Editors; John Wiley & Sons Ltd., West Sussex, England; pp. 491-497.
Schmidt, K. & Mayer, B. (1998) Determination of NO with a Clark-type electrode. In Nitric Oxide Protocols. M.A. Titheradge, Editor; Humana Press, Totowa, New Jersey; pp. 101-109.
Schneider, N.R. & Yeary, R.A. (1975) Nitrite and nitrate pharmacokinetics in the dog, sheep, and pony. American Journal o f Veterinary Research, 36, 941-947.
Schook, L.B., Lockwood, J.F., Yang, S.-D., & Myers, M.J. (1992) Dimethylnitrosamine (DMN)-induced IL -ip, TNF-a, and IL-6 inflammatory cytokine expression. Toxicology and Applied Pharmacology, 116, 110-116.
Schott, C.A., Bogen, C.M., Vetrovsky, P., Berton, C.C., & Stoclet, J.C. (1994) Exogenous N°- hydroxy-L-arginine causes nitrite production in vascular smooth muscle cells in the absence o f nitric oxide synthase activity. FEBS Letters, 341, 203-107.
Schroder, H. & Schr&r, K. (1990) Inhibitors of cytochrome P-450 reduce cyclic GMP stimulation by glyceryl trinitrate in LLC-PKi kidney epithelial cells. Naunyn- Schmiedeberg’s Archives o f Pharmacology, 342, 616-618.
Schwacha, M.G., Sarny, T.S.A., Catania, R.A., & Chaudry, I.H. (1998) Thermal injury alters macrophage responses to prostaglandin E2: contribution to the enhancement ofinducible nitric oxide synthase activity. Journal o f Leukocyte Biology, 64, 740-746.
Sedgwick, A.D., Lees, P., & Higgins, A.J. (1986) Lysosomal enzyme release in equine non- immune acute inflammatory exudate. Equine Veterinary Journal, 18,68-70.
Sewer, M.B., Koop, D.R., & Morgan, E.T. (1996) Endotoxemia in rats is associated with induction of the P4504A subfamily and suppression of several other forms of cytochrome P450. Drug Metabolism and Disposition, 24, 401-407.
145
Reproduced with permission of the copyright owner. Further reproduction prohibited without permission.
Sewer, M.B. & Morgan, E.T. (1997) Nitric oxide-independent suppression o f P4S0 2C11 expression by interleukin-If) and endotoxin in primary rat hepatocytes. Biochemical Pharmacology, 54, 729-737.
Sewer, M.B. & Morgan, E.T. (1998) Down-regulatkm of the expression o f three major rat liver cytochrome P450s by endotoxin in vivo occurs independently of nitric oxide production. Journal o f Pharmacology and Experimental Therapeutics, 287, 352-358.
Sherman, M.P., Aeberhard, E.E., Wong, V.Z., Griscavage, J.M., & Ignarro, L.J. (1993) Pyrrolidine dhhiocarbamate inhibits induction of nitric oxide synthase activity in rat alveolar macrophages. Biochemical and Biophysical Research Communications, 191, 1301-1308.
Shibata, M., Hoon, D., Okun, E., & Morton, D. (1992) Modulation of histamine type II receptors on CD8+ T cells by interleukin-2 and cimetidine. International Archives o f Allergy and Immunology, 97, 8-16.
Shimizu, T., Hirano, K., Takahashi, M., Hatano, M., & Fujii-Kuriyamma, Y. (1988) Site- directed mutageneses of rat liver cytochrome P-4S0d: axial ligand and hemeincorporation. Biochemistry, 27, 4138-4141.
Short, C.R., Maines, M.D., & Davis, L.E. (1972) Preparation o f hepatic microsomal fraction for drug metabolism studies by rapid decompression homogenization. Proceedings o f the Society fo r Experimental Biology and Medicine, 140, 58-65.
Simmons, E.J., Bertone, A.L., Hardy, J., & Weisbrode, S.E. (1999a) Nitric oxide synthase activity in healthy and interleukin IB-exposed equine synovial membrane. American Journal o f Veterinary Research, 60, 714-716.
Simmons, E.J., Bertone, A.L., & Weisbrode, S.E. (1999b) Instability-induced osteoarthritis in the metacarpophalangeal joint o f horses. American Journal o f Veterinary Research, 60, 7-13.
Sirois, J. & Richards, J.S. (1993) Transcriptional regulation of the rat prostaglandin endoperoxide synthase 2 gene in granulosa cells evidence for the role of a c/s-acting C/EBPp promoter element. Journal o f Biological Chemistry, 268, 21931-21938.
Smyth, G.B., Duran, S., Ravis, W., & Clark, C.R. (1990) Pharmacokinetic studies of cimetidine hydrochloride in adult horses. Equine Veterinary Journal, 22, 48-50.
Southan, G.J. & Szab6 , C. (1996) Selective pharmacological inhibition o f distinct nitric oxide synthase isoforms. Biochemical Pharmacology, 51, 383-394.
Speeg, K.V., Patwardhan, R.V., Avant, G.R., Mitchell, M.C., & Schenker, S. (1982) Inhibition o f microsomal drug metabolism by histamine Hrreceptor antagonists studied in vivo and in vitro in rodents. Gastroenterology, 82, 89-96.
146
Reproduced with permission of the copyright owner. Further reproduction prohibited without permission.
Spink, J., Cohen, J., & Evans, T.J. (1995) The cytokine responsive vascular smooth muscle cell enhancer o f inducible nitric oxide synthases activation by nuclear factor-xB. Journal o f Biological Chemistry, 278, 29541-29547.
Stamler, J.S., Jaraki, O., Osborne, J., Simon, D.I., Keaney, J., Vita, J., Singel, D., Valeri, C.R., & Loscalzo, J. (1992a) Nitric oxide circulates in mammalian plasma primarily as an S- nitroso adduct o f serum albumin. Proceedings o f the National Academy o f Sciences, USA, 99, 7674-7677.
Stamler, J.S., Simon, D.I., Osborne, J.A., Mullins, M.E., Jaraki, O., Michel, T., Singel, D.J., & Loscalzo, J. (1992b) 5-Nhrosylatkm o f proteins with nitric oxide: synthesis andcharacterization of biologically active compounds. Proceedings o f the National Academy o f Sciences, USA, 99, 444-448.
Stflrkel, P., Sempoux, C., Van Den Berge, V., Stevens, M., De Saeger, C., Desager, J.P., & Horsmans, Y. (1999) CYP 3A proteins are expressed in human neutrophils and lymphocytes but are not induced by rifampicin. Life Sciences, 64,643-653.
Stiles, W.R., Nall, D.A., Davila, J.C., Brown, S.A., Wolf, A.M., & RuofF, W.W. (1990) Formulary o f the Texas A&M University Texas Veterinary Medical Center Veterinary Teaching Hospital, 2nd edition, Texas A&M University, College Station, Texas.
Strand, E., Martin, G.S., Crawford, M.P., Kamerling, S.G., & Burba, D.J. (1998) Intra- articular pressure, elastance and range of motion in healthy and injured racehorse metacarpophalangeal joints. Equine Veterinary Journal, 30, 520-527.
Stryer, L. (1995) Biochemistry, 4* edition; W.H. Freeman & Company, New York.
Stuehr, D.J. (1997) Structure-function aspects in the nitric oxide synthases. Annual Review o f Pharmacology and Toxicology, 37, 339-359.
Stuehr, D.J., Cho, H.J., Kwon, N.S., Weise, M.F., & Nathan, C.F. (1991a) Purification and characterization of cytokine-induced macrophage nitric oxide synthase: an FAD- and FMN-containing flavoprotein. Proceedings o f the National Academy o f Science, USA, 8 8 , 7773-7777.
Stuehr, D.J. & Dceda-Saito, M. (1992) Spectral characterization of brain and macrophage nitric oxide synthases cytochrome P-450-like hemeproteins that contain a flavin semiquinone radical. Journal o f Biological Chemistry, 267, 20547-20550.
Stuehr, D.J., Kwon, N.S., Nathan, C.F., Griffith, O.W., Feldman, P.L., & Wiseman, J. (1991b) AT-hydroxy-L-arginine is an intermediate in the biosynthesis of nitric oxide from L- arginine. Journal o f Biological Chemistry, 266, 6259-6263.
Stuehr, D.J. & Marietta, M.A. (1985) Mammalian nitrate biosynthesis: mouse macrophages produce nitrite and nitrate in response to Escherichia coli lipopotysaccharide. Proceedings o f the National Academy o f Science, USA, 92, 7738-7742.
147
Reproduced with permission of the copyright owner. Further reproduction prohibited without permission.
Stuehr, D.J. & Marietta, M.A. (1987) Synthesis of nitrite and nitrate in murine macrophage cell lines. Cancer Research, 47, 5590-5594.
Szabo, C. (1996) The pathophysiological role of peroxynitrite in shock, inflammation, and iscbemia-reperfusion injury. Shock, 6, 79-88.
Takada, K., Yamashita, K., Sakurai-Yamashita, Y., Shigematsu, K., Hamada, Y., Hioki, K., & Taniyama, K. (1998) Participation of nitric oxide in the mucosal injury of rat intestine induced by ischemia-reperfus ion. Journal o f Pharmacology and Experimental Therapeutics, 287, 403-407.
Takagi, N., Mihara, M., Moriya, Y., Nishimoto, N., Yoshizaki, K., Kishimoto, T., Takeda, Y., & Ohsugi, Y. (1998) Blockage of interleukin-6 receptor ameliorates joint disease in murine collagen-induced arthritis. Arthritis A Rheumatism, 41, 2117-2121.
Tanaka, H., Wada, T., Simazaki, S., Hanumadass, M., Reyes, H.M., & Matsuda, T. (1991) Effects of cimetidine on fluid requirement during resuscitation of third-degree burns. Journal o f Bum Care Rehabilitation, 12, 425-429.
Tasaka, K., Nakaya, N., & Code, C.F. (1992) Histamine leukocytosis. I. Effect of histamine on peripheral leukocyte counts. Methods and Findings in Experimental Clinical Pharmacology, 14, 667-675.
Tasaka, N., Mio, M., Shimazawa, M., & Nakaya, N. (1993) Histamine-induced production of interleukin-la from murine bone marrow stromal cells and its inhibition by H2 blockers. Molecular Pharmacology, 43, 365-371.
Taylor, D.C., Cresswell, P.R., & Bartlett, D.C. (1978) The metabolism and elimination of cimetidine, a histamine H2-receptor antagonist, in the rat, dog, and man. Drug Metabolism and Disposition, 6, 21-30.
Titheradge, M.A. (1998) The enzymatic measurement of nitrate and nitrite. In Nitric Oxide Protocols. M.A. Titheradge, Editor; Humana Press, Totowa, New Jersey; pp. 83-91.
Toda, N. (1987) Mechanism of histamine actions in human coronary arteries. Circulation Research, 61, 280-286.
Todhunter, R.J. & Lust, G. (1990) Pathophysiology of synovitis: clinical signs andexamination in horses. Compendium on Continuing Education fo r the Practicing Veterinarian, 12, 980-992.
Tracey, W.R., Nakane, M., Kuk, J., Budzik, G., Klinghofer, V., Harris, R., & Carter, G. (1995) The nitric oxide synthase inhibitor, L-V^-monomethylarginine, reduces carrageenan-induced pleurisy in the ra t Journal o f Pharmacology and Experimental Therapeutics, 273,1295-1299.
148
Reproduced with permission of the copyright owner. Further reproduction prohibited without permission.
Trachtman, H., Futterweit, S., Garg, P., Reddy, K., & Singhal, P.C. (1996a) Nitric oxide stimulates the activity of a 72-kDa neutral matrix metalloproteinase in cultured rat mesangial cells. Biochemical and Biophysical Research Communications, 218, 704- 708.
Trachtman, H., Futterweit, S., Greenwald, R., Moak, S., Singhal, P., Franki, N., & Amin, A.R. (1996b) Chemically modified tetracyclines inhibit inducible nitric oxide synthase expression and nitric oxide production in cultured rat mesangial cells. Biochemical and Biophysical Research Communications, 229, 243-248.
Trepicchio, W.L., Bozza, M., Pedneauh, G., &. Dorner, A.J. (1996) Recombinant human IL-11 attenuates the inflammatory response through down-regulation of proinflammatory cytokine release and nitric oxide production. Journal o f Immunology, 1S7, 3627-3634.
Tsuji, S., Kawano, S., Tsujii, M., Takei, Y., Tanaka, M., Sawaoka, H., Nagano, K., Fusamoto, H., & Kamada, T. (1996) Helicobacter pylori extract stimulates inflammatory nitric oxide production. Cancer Letters, 108, 19S-200.
Turnbull, A.V. & Rivier, C. (1996) Corticotropin-releasing factor, vasopressin, and prostaglandins mediate, and nitric oxide restrains, the hypothalamic-pituitary-adrenal response to acute local inflammation in the ra t Endocrinology, 137, 455-463.
van de Loo, F.A.J., Arntz, O.J., van Enckevort, F.H.J., van Lent, P.L.E.M., & van den Berg, W.B. (1998) Reduced cartilage proteoglycan loss during zymosan-induced gonarthritis in NOS2-deficient mice and in anti-interleukin-1-treated wild-type mice with unabated joint inflammation. Arthritis & Rheumatism, 41, 634-646.
van de Loo, F.A.J., Kuiper, S., van Enckevort, F.H.J., Arntz, O.J., & van den Berg, W.B. (1997) Interleukin-6 reduces cartilage destruction during experimental arthritis a study in interleukin-6-deficient mice. American Journal o f Pathology, 151, 177-191.
Vane, J.R. (1996) Mechanism of action of anti-inflammatory drugs. In Proceedings o f new targets in inflammation: inhibitors o f COX-2 or adhesion molecules. WilliamHarvey Medical Research Foundation; New Orleans, Louisiana; April 15-16.
Van Hoogmoed, L., Rakestraw, P.C., Snyder, J.R., & Harmon, F.A. (1998) Role o f nitric oxide contractile activity of the third compartment o f the stomach in llamas. American Journal o f Veterinary Research, 59, 1166-1169.
Vannier, E. & Dinarello, C.A. (1993) Histamine enhances interleukin (IL)-1-induced IL-1 gene expression and protein synthesis via H2 receptors in peripheral blood mononuclear cells comparison with IL-1 receptor antagonist. Journal o f Clinical Investigation, 92, 281- 287.
Vannier, E. & Dinarello, C.A. (1994) Histamine enhances interleukin (IL)-1-induced IL-6 gene expression and protein synthesis via H2 receptors in peripheral blood mononuclear cells. Journal o f Biological Chemistry, 269, 9952-9956.
149
Reproduced with permission of the copyright owner. Further reproduction prohibited without permission.
Vannier, E., Miller, L.C., & Dinarello, C.A. (1991) Histamine suppresses gene expression and synthesis of tumor necrosis factor a via histamine H2 receptors. Journal o f Experimental Medicine, 174, 281-284.
Vaziri, N.D., Ni, Z., Zhang, Y.P., Ruzics, E.P., Maleki, P., & Ding, Y. (1998) Depressed renal and vascular nitric oxide synthase expression in cyclosporine-induced hypertension. Kidney International, 54, 482-491.
Veihelmann, A., Brill, T., Blobner, M., Scheller, I., Mayer, B., Prdlls, M., Himpel, S., & Stadler, J. (1997) Inhibition o f nitric oxide synthesis improves detoxication in inflammatory liver dysfunction in vivo. American Journal o f Physiology, 273, G520- G536.
Wang, X., McGregor, C.G.A., & Miller, V.M. (1998) Induction and cDNA sequence of inducible nitric oxide synthase from canine aortic smooth muscle cells. American Journal o f Physiology, 275, HI 122-H1129.
Watanabe, M., Yagi, M., Omata, M., Hirasawa, N., Mue, S., Tsurufuji, S., & Ohuchi, K. (1991) Stimulation o f neutrophil adherence to vascular endothelial cells by histamine and thrombin and its inhibition by PAF antagonists and dexamethasone. British Journal o f Pharmacology, 102, 239-245.
Weisz, A., Oguchi, S., Cicatiello, L., & Esumi, H. (1994) Dual mechanism for the control of inducible-type NO synthase gene expression in macrophages during activation by interferon-y and bacterial lipopotysaccharide transcriptional and post-transcriptional regulation. Journal o f Biological Chemistry, 269, 8324-8333.
Wennmalm, A, Benthin, G., & Petersson, A.-S. (1992) Dependence of the metabolism of nitric oxide (NO) in healthy human whole blood on the oxygenation of its red cell haemoglobin. British Journal o f Pharmacology, 106, 507-508.
White, K.A. & Marietta, M.A. (1992) Nitric oxide synthase is a cytochrome P-450 type hemoprotein. Biochemistry, 31, 6627-6631.
White, W.B. & Ballow, M. (1985) Modulation of suppressor-cell activity by cimetidine in patients with common variable hypogammaglobulinemia. New England Journal o f Medicine, 312, 198-202.
Whittico, M.R., Yuan, G., & Giacomini, K.M. (1990) Cimetidine transport in isolated brush border membrane vesicles from bovine choroid plexus. Journal o f Pharmacology and Experimental Therapeutics, 255, 615-623.
Wilborn, J., DeWitt, D.L., & Peters-Golden, M. (1995) Expression and role of cyclooxygenase isoforms in alveolar and peritoneal macrophages. American Journal o f Physiology, 268, L295-L301.
150
Reproduced with permission of the copyright owner. Further reproduction prohibited without permission.
Williams, T.J. & Peck, M J. (1977) Role of prostaglandin-mediated vasodilatation in inflammation. Nature, 270, 530-532.
Wilson, K.T., Ramanujam, K.S., Mobley, H.L.T., Musselman, R.F., James, S.P., & Mehzer, S J. (1996) Helicobacter pylori stimulates inducible nitric oxide synthase expression and activity in a murine macrophage cell line. Gastroenterology, 111, 1524-1533.
Wink, D.A., Osawa, Y., Derbyshire, J.F., Jones, C.R., Eshenaur, S.C., & Nims, R.W. (1993) Inhibition of cytochromes P450 by nitric oxide and a nitric oxide-releasing agent Archives o f Biochemistry and Biophysics, 300, 115-123.
Winzor, D.J., Ioannoni, B., & Reilly, P.E.B. (1986) The nature of microsomal monooxygenase inhibition by cimetidine. Biochemical Pharmacology, 35,2157-2161.
Woodward, D.F., Pipkin, M.A., Raval, P., & Owen, D.A.A. (1982) Effect o f histamine Hi- and Hrreceptor antagonists, steroidal and non-steroidal anti-inflammatory agents on carrageenin-induced inflammation o f the guinea-pig ear. Archives o f International Pharmacodynamics, 257, 295-306.
Xie, Q.-w., Kashiwabara, Y., & Nathan, C. (1994) Role of transcription factor NF-xB/Rel in induction o f nitric oxide synthase. Journal o f Biological Chemistry, 269, 4705-4708.
Xie, Q.-w., Whisnant, R., & Nathan, C. (1993) Promoter o f the mouse gene encoding calcium- independent nitric oxide synthase confers indueibility by interferon y and bacterial lipopoly saccharide. Journal o f Experimental Medicine, 177, 1779-1784.
Xie, W., Chipman, J.G., Robertson, D.L., Erikson. R.L., & Simmons. D.L. (1991) Expression of a mitogen-responsive gene encoding prostaglandin synthase is regulated by mRNA splicing. Proceedings o f the National Academy o f Science USA, 88, 2692-2696.
Xie, W., Robertson, D.L., & Simmons, D.L. (1992) Mitogeninducible prostaglandin G/H synthase: a new target for nonsteroidal anti-inflammatory drugs. Drug Development and Research, 25, 249-265.
Yui, Y., Hattori, R., Kosuga, K., Eizawa, H., Hiki, K., & Kawai, C. (1991) Purification of nitric oxide synthase from rat macrophages. Journal o f Biological Chemistry, 266, 12544-12547.
Zeballos, G.A., Bernstein, R.D., Thompson, C.I., Forfia, P.R., Seyedi, N., Shen, W., Kaminski, P.M., Wolin, M.S., & Hintze, T.H. (1995) Pharmacodynamics of plasma nitrate/nitrite as an indication of nitric oxide formation in conscious dogs. Circulation, 91, 2982-2988.
Zhang, J. & Snyder, S.H. (1995) Nitric oxide in the nervous system. Annual Reviews in Pharmacology and Toxicology, 35, 213-233.
151
Reproduced with permission of the copyright owner. Further reproduction prohibited without permission.
Zingarelli, B., Cuzzocrea, S., Szab6, C., & Salzman, A.L. (1998) Mercaptoethylguanidine, a combined inhibitor of nitric oxide synthase and peroxynitrite scavenger, reduces trinitrobenzene sulfonic acid-induced colonic damage in rats. Journal o f Pharmacology and Experimental Therapeutics, 287, 1048-1055.
152
Reproduced with permission of the copyright owner. Further reproduction prohibited without permission.
VITA
Robert Paul Hunter, the son of Ray and Hazel Hunter, was born October 30, 1964, in
Phoenix, Arizona. He graduated from high school in 1983 from Lawrence D. Bell High School
in Hurst, Texas. His undergraduate education included one year at Texas Wesleyan College,
two summers at Tarrant County Junior College, and the remaining three years at Angelo State
University, where he received a bachelor o f science degree in Animal Science on May IS, 1987.
At Texas A&M University, under the guidance of his advisor Dr. Scott Anthony Brown, he
completed a master of science degree in Veterinary Physiology on August 11, 1989. Robert
was married on May 21, 1988, to Trisha Ann Turk. On April 4, 1989, their first son Mark
Andrew Hunter was born. On July 23, 1990, their second son Brandon Paul Hunter was bom.
After working at the Johnson Space Center, in the area of aerospace pharmacology, for two
years, Robert went to work for Pfizer Central Research. There he worked in the Animal Health
Drug Metabolism group until moving to Louisiana to obtain the degree of Doctor o f Philosophy
under the supervision o f Dr. Charles R. Short. Mr. Hunter is a member of the American
Society of Veterinary Physiologists & Pharmacologists, the European Association of Veterinary
Pharmacology and Toxicology, an Associate Fellow in the American Academy of Veterinary
Pharmacology and Therapeutics, and a student member of American Society for Pharmacology
and Experimental Therapeutics. He has been listed in International Who’s Who o f
Professionals, The National Dean’s List, and Who's Who in the South and Southwest.
153
Reproduced with permission of the copyright owner. Further reproduction prohibited without permission.
DOCTORAL E X A M IN A T IO N AND D IS S E R T A T IO N REPORT
Candidate: Robert Paul Hunter
Major Field: Veterinary Medical Sciences
Title of Dissertation: The Effects and Mechanism of Action of Cimetidine on Inducible Nitric Oxide Synthase Using an Equine Soft-Tissue Inflammation Model
Approved:
EXAMINING COMMITTEE:
Pate of Kxaeination:
M a r c h 1 , 2 0 0 0
CL&iAAsU?l
" r̂ 47V M ~'7y} .
---------------------------- 3T
Reproduced with permission of the copyright owner. Further reproduction prohibited without permission.