remote sensing - elib-dlr
TRANSCRIPT
remote sensing
Review
Remote Sensing for the Quantification of LandSurface Dynamics in Large River DeltaRegions—A Review
Claudia Kuenzer 1,2,*, Valentin Heimhuber 3 , Juliane Huth 1 and Stefan Dech 1,2
1 German Remote Sensing Data Center (DFD), German Areaspace Center (DLR), Muenchener Strasse 20,D-82234 Wessling, Germany
2 Institute for Geography and Geology, University of Wuerzburg, Am Hubland, D-97074 Wuerzburg, Germany3 Water Research Laboratory, School of Civil & Environmental Engineering, UNSW Sydney,
NSW 2052, Australia* Correspondence: [email protected]; Tel.: +49-08153-28-3280
Received: 23 July 2019; Accepted: 19 August 2019; Published: 22 August 2019�����������������
Abstract: River deltas and estuaries belong to the most significant coastal landforms on our planetand are usually very densely populated. Nearly 600 million people live in river deltas, benefitingfrom the large variety of locational advantages and rich resources. Deltas are highly dynamicand vulnerable environments that are exposed to a wide range of natural and man-made threats.Sustainable management of river deltas therefore requires a holistic assessment of historic and recentongoing changes and the dynamics in settlement sprawl, land cover and land use change, ecosystemdevelopment, as well as river and coastline geomorphology, all of which is difficult to achieve solelywith traditional land-based surveying techniques. This review paper presents the potential of EarthObservation for analyses and quantification of land surface dynamics in the large river deltas globally,emphasizing the different geo-information products that can be derived from medium resolution,high resolution and highest resolution optical, multispectral, thermal and SAR data. Over 200 journalpapers on remote sensing related studies for large river deltas and estuaries have been analyzed andcategorized into thematic fields such as river course morphology, coastline changes, erosion andaccretion processes, flood and inundation dynamics, regional land cover and land use dynamics,as well as the monitoring of compliance with respect to anthropogenic activity such as industryexpansion-related habitat destruction. Additionally, our own exemplary analyses are interwoven intothe review to visualize related delta work.
Keywords: river deltas; delta; coasts; estuaries; Earth observation; remote sensing; review; flooding;land use; subsidence; stakeholder
1. River Deltas: An Introduction
The coastal deltas of large rivers are not only the largest coastal landforms on our planet [1];they are also among the most densely populated places on earth [2]. Although they only account forabout 5% of the land surface, nearly 600 million delta inhabitants globally [3] benefit from a delta’slocational advantages, such as flat topography, fertile alluvial soils, access to freshwater and seawater,river and marine resources, eased waterway transportation, ice-free harbors and rich fauna and florabiodiversity in wetlands and marshes [2,4]. Hydrocarbon (oil and gas) and salt deposits in underground,compacted delta sediment layers are common [5,6], and the major deltas are often of strategic economicrelevance for a complete nation. Be it the oil-rich and densely settled Mississippi Delta area and itshinterland in the USA, the bustling Pearl or Yangtze river deltas in China, the agriculturally highlyproductive Nile (Egypt) and Mekong deltas (Cambodia/Vietnam), or the densely urbanized deltas of
Remote Sens. 2019, 11, 1985; doi:10.3390/rs11171985 www.mdpi.com/journal/remotesensing
Remote Sens. 2019, 11, 1985 2 of 42
the Ciliwung River (Jakarta, Indonesia), the Chao Pharya River (Bangkok, Thailand), or the SumidaRiver (Tokyo, Japan): a large part of many countries’ gross domestic product (GDP) is generated inthese important geographic regions [2,7]. For example, the Pearl River Delta covers only 0.5% ofChina’s territory and is home to only 4.5% of its population, but it contributes 10% to the country’sGDP, and the Yangtze Delta contributes 20% [2,3]. A detailed review of river delta advantages andassets can be found in Kuenzer and Renaud [2].
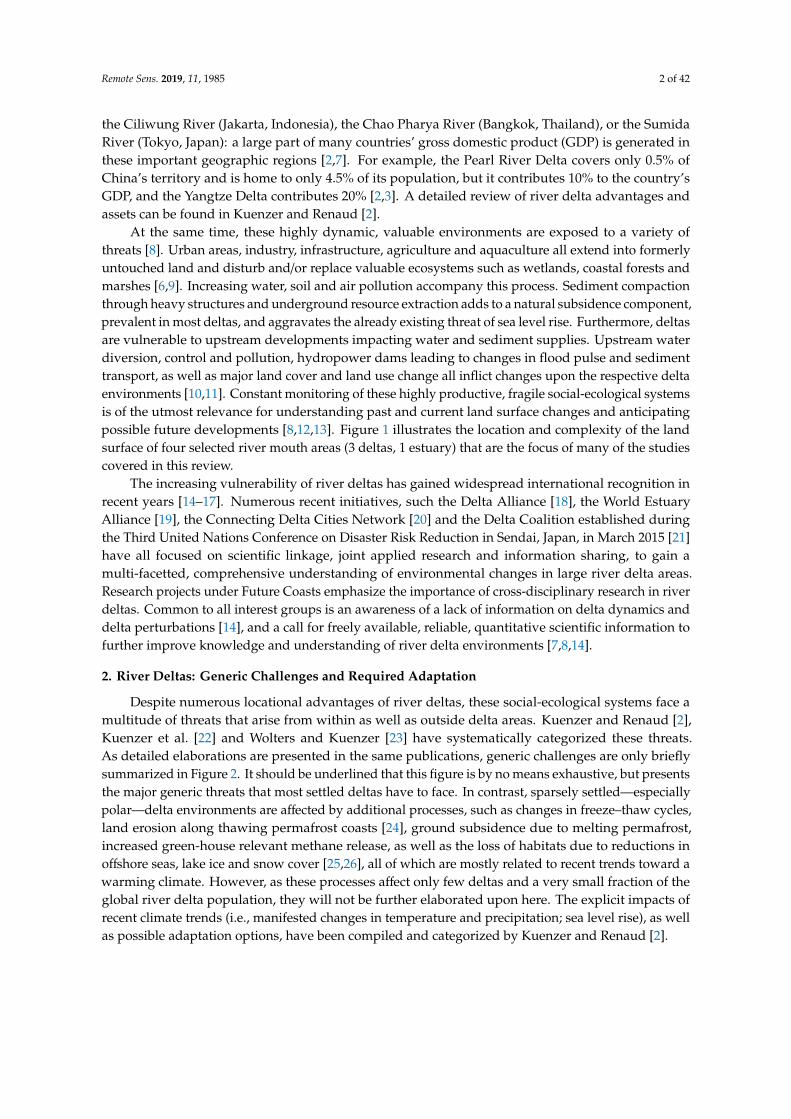
At the same time, these highly dynamic, valuable environments are exposed to a variety ofthreats [8]. Urban areas, industry, infrastructure, agriculture and aquaculture all extend into formerlyuntouched land and disturb and/or replace valuable ecosystems such as wetlands, coastal forests andmarshes [6,9]. Increasing water, soil and air pollution accompany this process. Sediment compactionthrough heavy structures and underground resource extraction adds to a natural subsidence component,prevalent in most deltas, and aggravates the already existing threat of sea level rise. Furthermore, deltasare vulnerable to upstream developments impacting water and sediment supplies. Upstream waterdiversion, control and pollution, hydropower dams leading to changes in flood pulse and sedimenttransport, as well as major land cover and land use change all inflict changes upon the respective deltaenvironments [10,11]. Constant monitoring of these highly productive, fragile social-ecological systemsis of the utmost relevance for understanding past and current land surface changes and anticipatingpossible future developments [8,12,13]. Figure 1 illustrates the location and complexity of the landsurface of four selected river mouth areas (3 deltas, 1 estuary) that are the focus of many of the studiescovered in this review.
The increasing vulnerability of river deltas has gained widespread international recognition inrecent years [14–17]. Numerous recent initiatives, such the Delta Alliance [18], the World EstuaryAlliance [19], the Connecting Delta Cities Network [20] and the Delta Coalition established duringthe Third United Nations Conference on Disaster Risk Reduction in Sendai, Japan, in March 2015 [21]have all focused on scientific linkage, joint applied research and information sharing, to gain amulti-facetted, comprehensive understanding of environmental changes in large river delta areas.Research projects under Future Coasts emphasize the importance of cross-disciplinary research in riverdeltas. Common to all interest groups is an awareness of a lack of information on delta dynamics anddelta perturbations [14], and a call for freely available, reliable, quantitative scientific information tofurther improve knowledge and understanding of river delta environments [7,8,14].
2. River Deltas: Generic Challenges and Required Adaptation
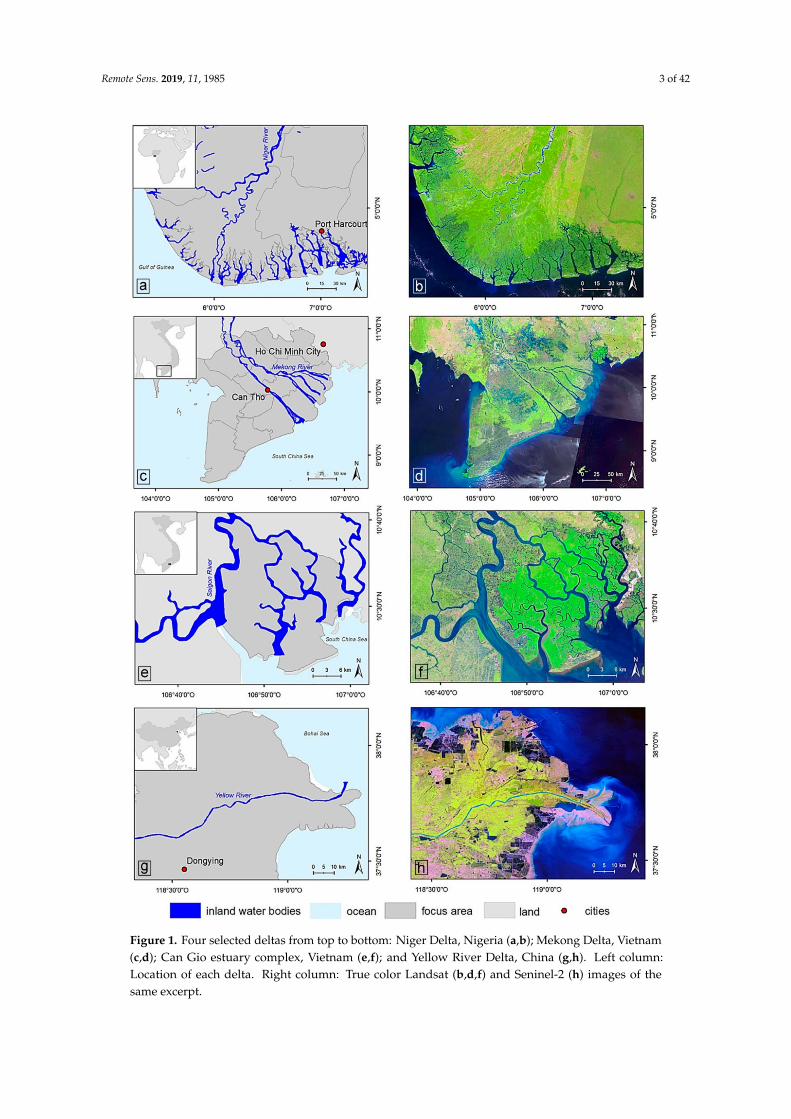
Despite numerous locational advantages of river deltas, these social-ecological systems face amultitude of threats that arise from within as well as outside delta areas. Kuenzer and Renaud [2],Kuenzer et al. [22] and Wolters and Kuenzer [23] have systematically categorized these threats.As detailed elaborations are presented in the same publications, generic challenges are only brieflysummarized in Figure 2. It should be underlined that this figure is by no means exhaustive, but presentsthe major generic threats that most settled deltas have to face. In contrast, sparsely settled—especiallypolar—delta environments are affected by additional processes, such as changes in freeze–thaw cycles,land erosion along thawing permafrost coasts [24], ground subsidence due to melting permafrost,increased green-house relevant methane release, as well as the loss of habitats due to reductions inoffshore seas, lake ice and snow cover [25,26], all of which are mostly related to recent trends toward awarming climate. However, as these processes affect only few deltas and a very small fraction of theglobal river delta population, they will not be further elaborated upon here. The explicit impacts ofrecent climate trends (i.e., manifested changes in temperature and precipitation; sea level rise), as wellas possible adaptation options, have been compiled and categorized by Kuenzer and Renaud [2].
Remote Sens. 2019, 11, 1985 3 of 42
Figure 1. Four selected deltas from top to bottom: Niger Delta, Nigeria (a,b); Mekong Delta, Vietnam(c,d); Can Gio estuary complex, Vietnam (e,f); and Yellow River Delta, China (g,h). Left column:Location of each delta. Right column: True color Landsat (b,d,f) and Seninel-2 (h) images of thesame excerpt.
Remote Sens. 2019, 11, 1985 4 of 42
Challenges which are common to all river deltas relate to the fact that river delta environments areinextricably connected to, and dependent on, any activities and changes in upstream areas. Upstreamwater diversion, flood pulse changes, water pollution, sediment retention, overall land use change,market changes and many other processes will all be felt in downstream deltas. This connectivityholds much potential for charged social-ecological and political conflict, especially in transboundaryriver basins, where possible upstream locations inflicting harm on a delta area are located in a countryother than that of the delta itself [10,11]. Further generic challenges for all delta environments are theirlocation on the coast, which goes along with increased exposure to ocean-borne threats such as sealevel rise, storm surges, tsunamis, oil spills or algal blooms. The Fourth Assessment Report of theIntergovernmental Panel on Climate Change (IPCC) [27] suggests a sea level rise of up to 95 cm by2100 for the high emission ‘business as usual’ scenario. The Fifth Assessment Report of the IPCC [28]suggests a global mean sea level rise of up to 82 cm as a result of recent and future water temperatureincreases and the melting of polar ice and glaciers. McCarthy et al. [29] underline associated effects,such as increased coastal inundation, higher storm surge flooding, landward intrusion of sea water andassociated salinization [30]. Asian megadeltas in particular are considered to be the most vulnerableto future global climate change [11]. Internal threats include industry-, urban-, agriculture- andaquaculture-related water, soil and air pollution, land subsidence driven by geologic processes andunderground extraction of resources such as hydrocarbons and also groundwater [7,31]. Other internalthreats are the loss of natural ecosystems such as coastal protection forests, wetlands and marshes,land use change-driven loss of biodiversity via monoculture expansion or habitat fragmentation, as wellas modification of the natural dynamic delta system via infrastructure and barrier developments.
Figure 2. Major external (red) and internal (blue) threats generic to most settled river delta areas.External: 1: sea level rise, 2: storm surges and tsunamis, 3: offshore oil spills, 4: allochthonoussea water pollution, 5: allochthonous air pollution, 6: upstream water diversion/related flood pulsechanges/sediment retention/water pollution, 7: upstream related floods, 8: droughts, 9: hydrocracyinterests, 10: in-migration, food security tele-connections, extensive tourism. Internal: 1: oils and gasspills and related pollution, 2: industry and urban related water and soil pollution, 3: agriculture- andaquaculture-related water and soil pollution, 4: autochthonous air pollution, 5: geologic/ compaction/
underground resource extraction related land subsidence, 6: coastal forest/wetland destruction, 7: plantdisease outbreaks, 8: monoculture expansion, 9: hydrocracy interests, 10: out-migration of the deltapopulation, 11: barriers and infrastructure development, 12: overfishing and wildlife collection.
Remote Sens. 2019, 11, 1985 5 of 42
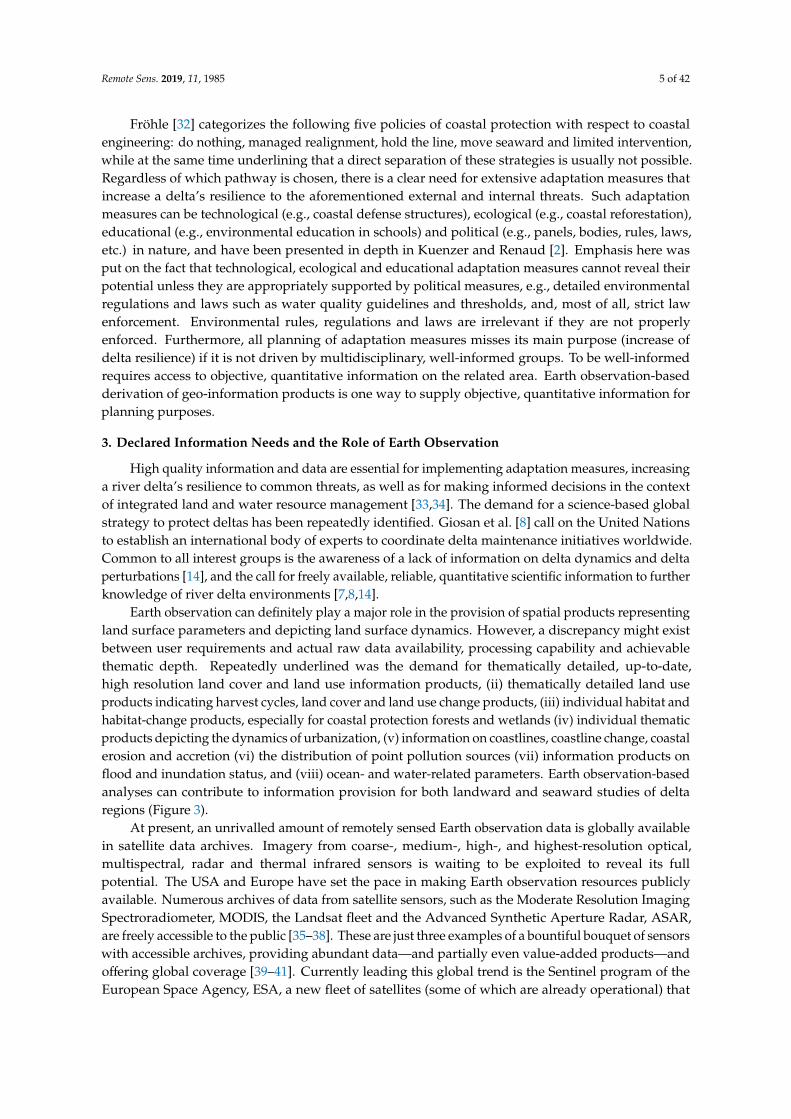
Fröhle [32] categorizes the following five policies of coastal protection with respect to coastalengineering: do nothing, managed realignment, hold the line, move seaward and limited intervention,while at the same time underlining that a direct separation of these strategies is usually not possible.Regardless of which pathway is chosen, there is a clear need for extensive adaptation measures thatincrease a delta’s resilience to the aforementioned external and internal threats. Such adaptationmeasures can be technological (e.g., coastal defense structures), ecological (e.g., coastal reforestation),educational (e.g., environmental education in schools) and political (e.g., panels, bodies, rules, laws,etc.) in nature, and have been presented in depth in Kuenzer and Renaud [2]. Emphasis here wasput on the fact that technological, ecological and educational adaptation measures cannot reveal theirpotential unless they are appropriately supported by political measures, e.g., detailed environmentalregulations and laws such as water quality guidelines and thresholds, and, most of all, strict lawenforcement. Environmental rules, regulations and laws are irrelevant if they are not properlyenforced. Furthermore, all planning of adaptation measures misses its main purpose (increase ofdelta resilience) if it is not driven by multidisciplinary, well-informed groups. To be well-informedrequires access to objective, quantitative information on the related area. Earth observation-basedderivation of geo-information products is one way to supply objective, quantitative information forplanning purposes.
3. Declared Information Needs and the Role of Earth Observation
High quality information and data are essential for implementing adaptation measures, increasinga river delta’s resilience to common threats, as well as for making informed decisions in the contextof integrated land and water resource management [33,34]. The demand for a science-based globalstrategy to protect deltas has been repeatedly identified. Giosan et al. [8] call on the United Nationsto establish an international body of experts to coordinate delta maintenance initiatives worldwide.Common to all interest groups is the awareness of a lack of information on delta dynamics and deltaperturbations [14], and the call for freely available, reliable, quantitative scientific information to furtherknowledge of river delta environments [7,8,14].
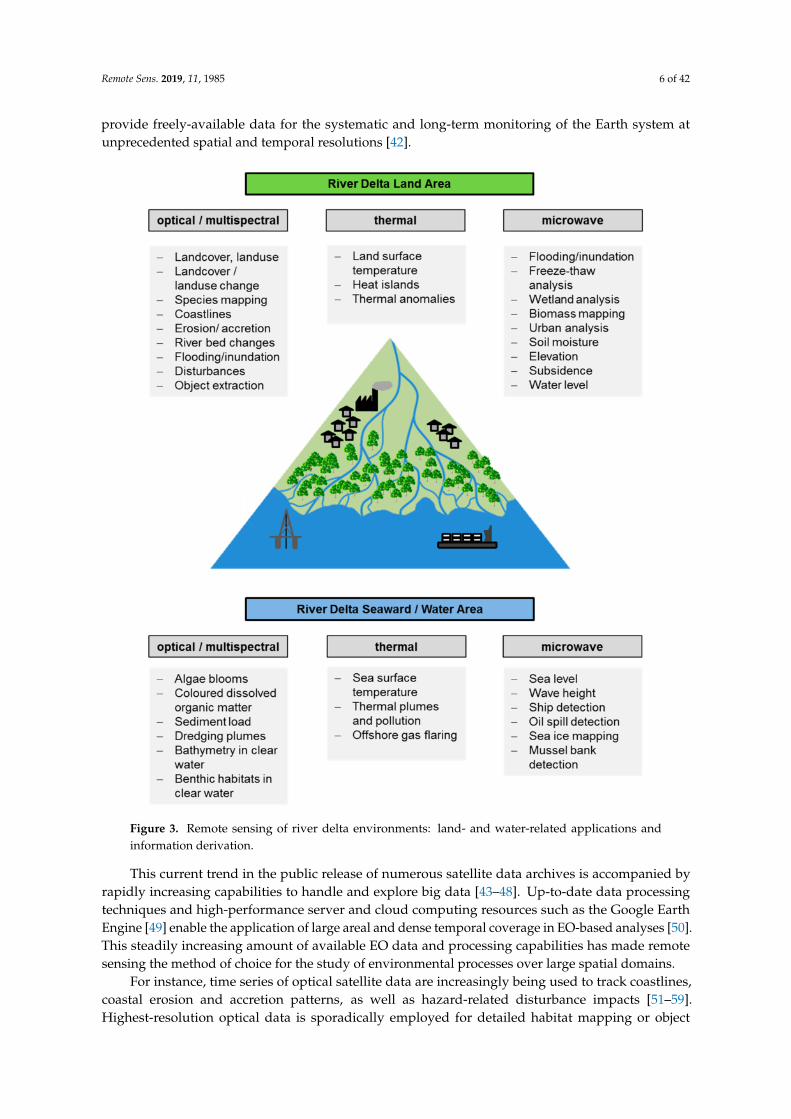
Earth observation can definitely play a major role in the provision of spatial products representingland surface parameters and depicting land surface dynamics. However, a discrepancy might existbetween user requirements and actual raw data availability, processing capability and achievablethematic depth. Repeatedly underlined was the demand for thematically detailed, up-to-date,high resolution land cover and land use information products, (ii) thematically detailed land useproducts indicating harvest cycles, land cover and land use change products, (iii) individual habitat andhabitat-change products, especially for coastal protection forests and wetlands (iv) individual thematicproducts depicting the dynamics of urbanization, (v) information on coastlines, coastline change, coastalerosion and accretion (vi) the distribution of point pollution sources (vii) information products onflood and inundation status, and (viii) ocean- and water-related parameters. Earth observation-basedanalyses can contribute to information provision for both landward and seaward studies of deltaregions (Figure 3).
At present, an unrivalled amount of remotely sensed Earth observation data is globally availablein satellite data archives. Imagery from coarse-, medium-, high-, and highest-resolution optical,multispectral, radar and thermal infrared sensors is waiting to be exploited to reveal its fullpotential. The USA and Europe have set the pace in making Earth observation resources publiclyavailable. Numerous archives of data from satellite sensors, such as the Moderate Resolution ImagingSpectroradiometer, MODIS, the Landsat fleet and the Advanced Synthetic Aperture Radar, ASAR,are freely accessible to the public [35–38]. These are just three examples of a bountiful bouquet of sensorswith accessible archives, providing abundant data—and partially even value-added products—andoffering global coverage [39–41]. Currently leading this global trend is the Sentinel program of theEuropean Space Agency, ESA, a new fleet of satellites (some of which are already operational) that
Remote Sens. 2019, 11, 1985 6 of 42
provide freely-available data for the systematic and long-term monitoring of the Earth system atunprecedented spatial and temporal resolutions [42].
Figure 3. Remote sensing of river delta environments: land- and water-related applications andinformation derivation.
This current trend in the public release of numerous satellite data archives is accompanied byrapidly increasing capabilities to handle and explore big data [43–48]. Up-to-date data processingtechniques and high-performance server and cloud computing resources such as the Google EarthEngine [49] enable the application of large areal and dense temporal coverage in EO-based analyses [50].This steadily increasing amount of available EO data and processing capabilities has made remotesensing the method of choice for the study of environmental processes over large spatial domains.
For instance, time series of optical satellite data are increasingly being used to track coastlines,coastal erosion and accretion patterns, as well as hazard-related disturbance impacts [51–59].Highest-resolution optical data is sporadically employed for detailed habitat mapping or object
Remote Sens. 2019, 11, 1985 7 of 42
extraction. Typical sensors employed include Landsat (MSS, TM, ETM+, DCM), SPOT and RapidEye,as well as Ikonos, QuickBird, and Worldview. In the thermal infrared domain, a few selected studies onland surface temperature (LST) retrieval in river delta areas, urban heat island, UHI, investigations [60]and thermal anomaly extraction have been published. Here, thermal Landsat data (60 m spatialresolution for TM and ETM+, 100 m spatial resolution for the new Landsat-8 DCM) are the preferredchoice. Radar and SAR data provide the basic information for application fields such as floodand inundation mapping, wetland characterization, urban mapping, elevation derivation and landsubsidence studies [61–65].
Earth observation methods and applications for studying oceanic processes are not consideredin this review, as there are already numerous publications available on this topic [66–99], and oceanparameters retrieval is a very specialized discipline within remote sensing. These publications areusually concerned with the detection and monitoring of algal blooms, the derivation and quantificationof colored dissolved organic matter, CDOM and the retrieval of sediment load information (suspendedparticulate matter, SPM), based on optical and multispectral data from sensors such as MODIS,the Medium Resolution Imaging Spectrometer, MERIS, the Sea-viewing Wide Field-of-view Sensor,SeaWiFS, and Landsat (MSS, TM, ETM+, DCM). In rare cases, also Advanced Very High ResolutionRadiometer, AVHRR, data, Système pour l’Observation de la Terre, SPOT, data, Chinese BrazilianEnvironmental Satellite, CBERS, data or highest-resolution data from sensors such as Ikonos, QuickBirdor WorldView are used for algal, CDOM and sediment plume analyses. The recent Sentinel-3 [100]mission enables near-daily global monitoring of important water, land and atmospheric parameters,and analyses thereof have now started [101–103]. Several chapters on the remote sensing of coastalwaters and on the mapping of submerged vegetation in benthic habitats can be found in [13].The monitoring of suspended sediment patterns and sediment concentrations in near coastal waters ofriver deltas based on different types of satellite remote sensing data, such as MODIS, MERIS, Spot,Landsat and ALOS-AVNIR-2, has been undertaken by Long and Pavelsky [104], Doxaran et al. [105],Zhang et al. [106], Doron et al. [107], Güttler et al. [108], Foidefond [109] and Loisel et al. [82], amongstmany others. Studies focusing on algal blooms and general chlorophyll distribution in river deltaareas have been undertaken by Keith [77], Wei et al. [110], Aurin and Dierssen [111], Le et al. [80,81],Gohin et al. [112], Shanmugam et al. [113] and Lavery et al. [79]. Sea surface temperature (SST)derivation and the detection of thermal plumes [114] are usually presented based on MODIS andLandsat data.
Radar and SAR data are mainly employed for wave height analyses and the detection of ships,oil spills and sea ice; the main workhorses for this are sensors such as ERS-1/2, ENVISAT ASAR andthe German TerraSAR-X, but other SAR sensors are also employed, as presented in Kuenzer et al. [46].Furthermore, altimetry mission data, from sensors such as the former TOPEX/Poseidon or follow-onmissions, such as Jason, or also ERS-2 and ENVISAT data, are exploited to derive global sea levelestimates [115–123]. A comprehensive overview of Earth observation satellite sensors and theircommon application fields, including ocean applications, and illustrated with an extensive set offigures and tables, has been presented by Kuenzer et al. [46].
For land-related Earth observation analyses of river delta areas, some coarse-resolution opticaland multispectral MODIS data, and mainly data of Landsat-type resolution (30 m and better), are thepreferred choice for characterizing land cover and land use. Many studies here have focused onmapping wetlands, mangroves or agriculture [124–139], as well as on extracting river courses. A reviewof typical remote sensing-based analyses undertaken in river delta environments is provided in thefollowing chapter.
Remote Sens. 2019, 11, 1985 8 of 42
4. The Potential of Earth Observation of River Delta Areas
4.1. The Potential of Earth Observation for Analysing Delta Morphology, River Course, Coastline Dynamics,and Accretion and Erosion Processes
With fairly constant sea levels and continuous sediment supply, deltas usually grow seawards—aprocess termed progradation or coastal accretion. Where sediment supply and sea level rise arebalanced—which happens only rarely—the delta aggrades upward, with the coastline remainingin place. Where sedimentation cannot keep up with sea level rise, the delta retreats landwards(retrogradation), and sediment accumulation mainly occurs offshore, where nearshore subaqueoussediments are covered with the material transported into the sea. Such deltas can eventually evolveinto an estuary [3]. In many river deltas globally, such as the Yangtze Delta, but also the ChaoPhraya, Colorado, Po and Nile deltas, the aggradation rates have very substantially decreased [140].Delta morphology and especially coastline dynamics and resulting erosion and accretion patterns arenot only impacted by relative sea level rise, basin land use change and upstream sediment retention,but also by downstream river course redirection and coastal protection activity (infrastructuremeasures). Here, Earth observation can play a crucial role in providing accurate information onthese processes [5,6,141]. Additional ancillary data, which is commonly needed for delta morphology,coastline and accretion and erosion analysis, includes tide tables or other tidal information (to ensurethat coastlines are mapped at comparable tide situations), as well as background information on thedrivers of morphodynamics, such as the reasons behind river redirection, substantial land use changein the delta or coastal harnessing infrastructure projects [55].
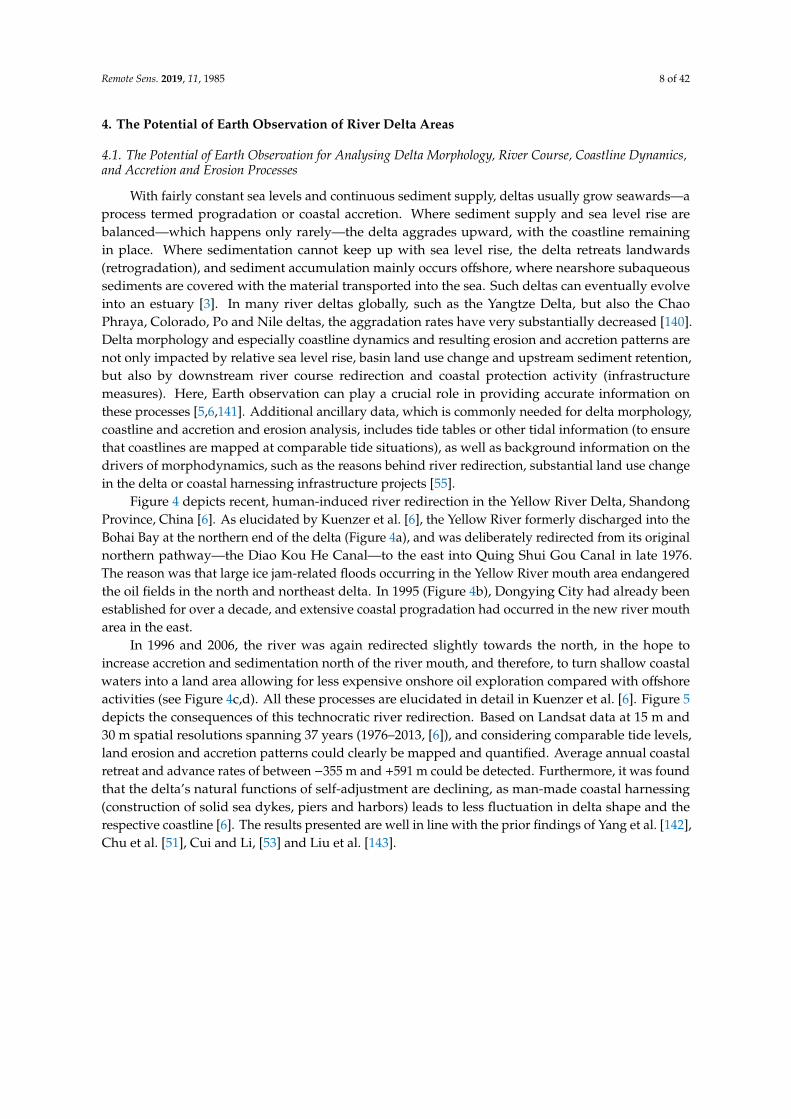
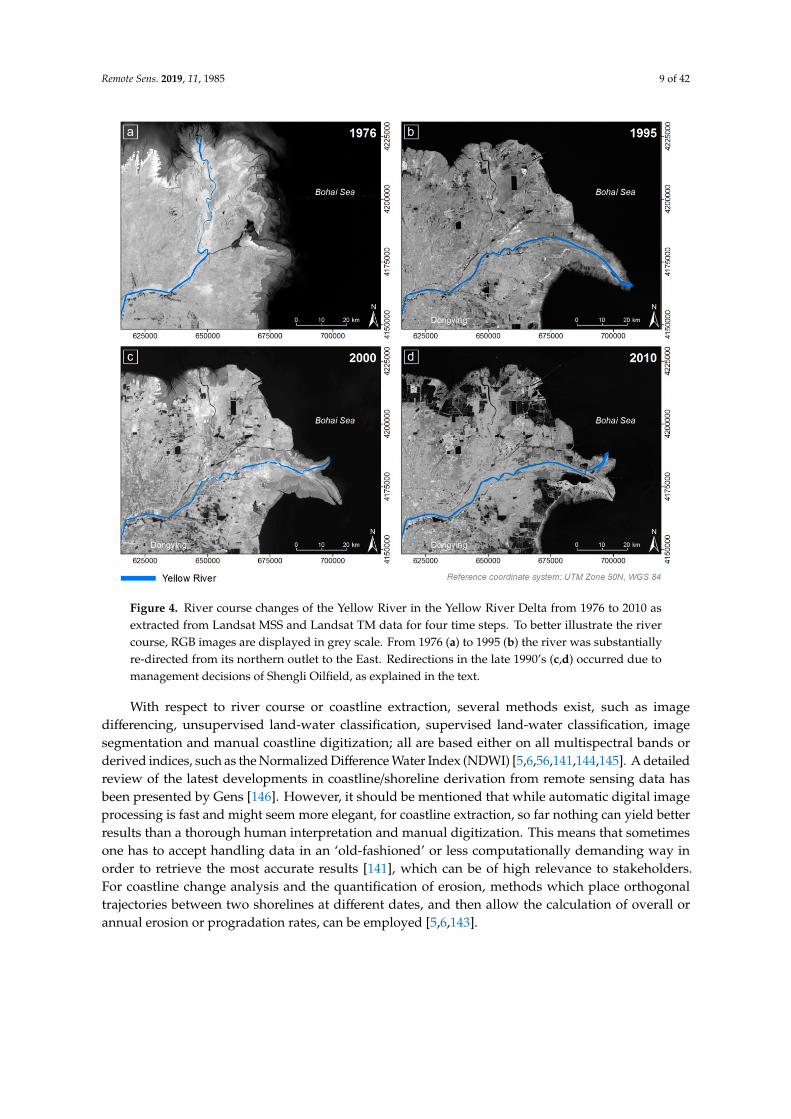
Figure 4 depicts recent, human-induced river redirection in the Yellow River Delta, ShandongProvince, China [6]. As elucidated by Kuenzer et al. [6], the Yellow River formerly discharged into theBohai Bay at the northern end of the delta (Figure 4a), and was deliberately redirected from its originalnorthern pathway—the Diao Kou He Canal—to the east into Quing Shui Gou Canal in late 1976.The reason was that large ice jam-related floods occurring in the Yellow River mouth area endangeredthe oil fields in the north and northeast delta. In 1995 (Figure 4b), Dongying City had already beenestablished for over a decade, and extensive coastal progradation had occurred in the new river moutharea in the east.
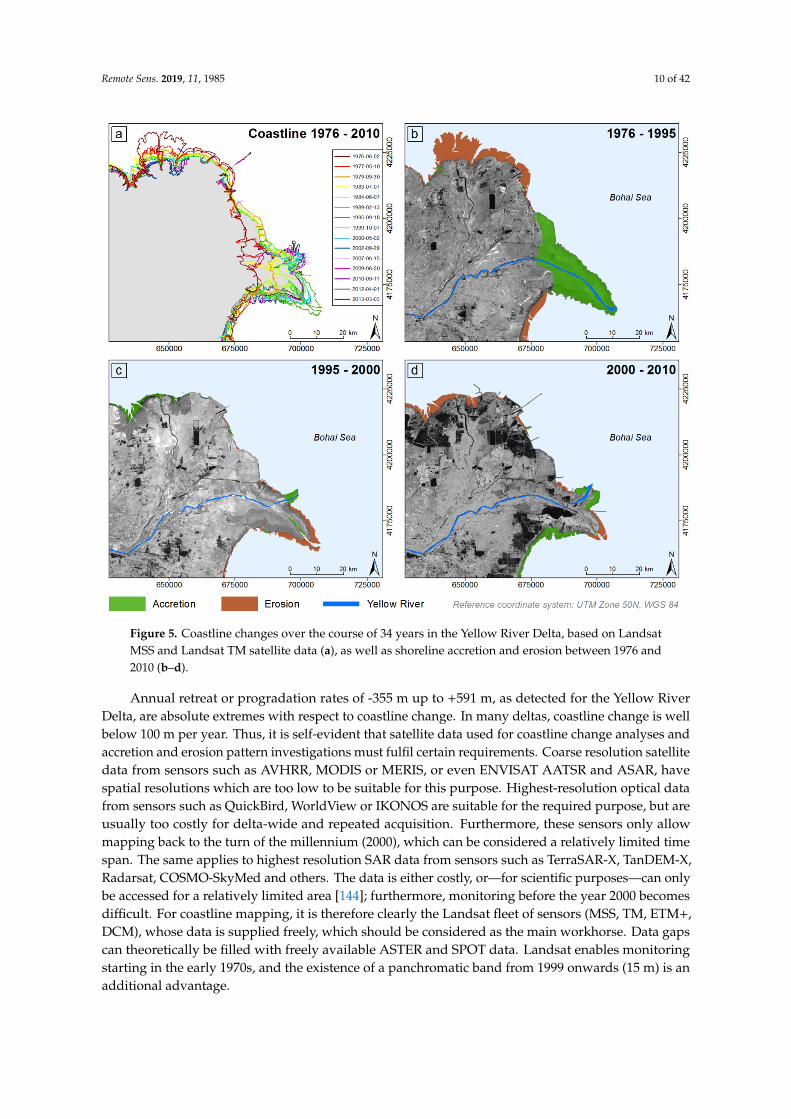
In 1996 and 2006, the river was again redirected slightly towards the north, in the hope toincrease accretion and sedimentation north of the river mouth, and therefore, to turn shallow coastalwaters into a land area allowing for less expensive onshore oil exploration compared with offshoreactivities (see Figure 4c,d). All these processes are elucidated in detail in Kuenzer et al. [6]. Figure 5depicts the consequences of this technocratic river redirection. Based on Landsat data at 15 m and30 m spatial resolutions spanning 37 years (1976–2013, [6]), and considering comparable tide levels,land erosion and accretion patterns could clearly be mapped and quantified. Average annual coastalretreat and advance rates of between −355 m and +591 m could be detected. Furthermore, it was foundthat the delta’s natural functions of self-adjustment are declining, as man-made coastal harnessing(construction of solid sea dykes, piers and harbors) leads to less fluctuation in delta shape and therespective coastline [6]. The results presented are well in line with the prior findings of Yang et al. [142],Chu et al. [51], Cui and Li, [53] and Liu et al. [143].
Remote Sens. 2019, 11, 1985 9 of 42
Figure 4. River course changes of the Yellow River in the Yellow River Delta from 1976 to 2010 asextracted from Landsat MSS and Landsat TM data for four time steps. To better illustrate the rivercourse, RGB images are displayed in grey scale. From 1976 (a) to 1995 (b) the river was substantiallyre-directed from its northern outlet to the East. Redirections in the late 1990’s (c,d) occurred due tomanagement decisions of Shengli Oilfield, as explained in the text.
With respect to river course or coastline extraction, several methods exist, such as imagedifferencing, unsupervised land-water classification, supervised land-water classification, imagesegmentation and manual coastline digitization; all are based either on all multispectral bands orderived indices, such as the Normalized Difference Water Index (NDWI) [5,6,56,141,144,145]. A detailedreview of the latest developments in coastline/shoreline derivation from remote sensing data hasbeen presented by Gens [146]. However, it should be mentioned that while automatic digital imageprocessing is fast and might seem more elegant, for coastline extraction, so far nothing can yield betterresults than a thorough human interpretation and manual digitization. This means that sometimesone has to accept handling data in an ‘old-fashioned’ or less computationally demanding way inorder to retrieve the most accurate results [141], which can be of high relevance to stakeholders.For coastline change analysis and the quantification of erosion, methods which place orthogonaltrajectories between two shorelines at different dates, and then allow the calculation of overall orannual erosion or progradation rates, can be employed [5,6,143].
Remote Sens. 2019, 11, 1985 10 of 42 Remote Sens. 2019, x, x FOR PEER REVIEW 10 of 43
Figure 5. Coastline changes over the course of 34 years in the Yellow River Delta, based on Landsat MSS and Landsat TM satellite data (a), as well as shoreline accretion and erosion between 1976 and 2010 (b–d).
Annual retreat or progradation rates of -355 m up to +591 m, as detected for the Yellow River Delta, are absolute extremes with respect to coastline change. In many deltas, coastline change is well below 100 m per year. Thus, it is self-evident that satellite data used for coastline change analyses and accretion and erosion pattern investigations must fulfil certain requirements. Coarse resolution satellite data from sensors such as AVHRR, MODIS or MERIS, or even ENVISAT AATSR and ASAR, have spatial resolutions which are too low to be suitable for this purpose. Highest-resolution optical data from sensors such as QuickBird, WorldView or IKONOS are suitable for the required purpose, but are usually too costly for delta-wide and repeated acquisition. Furthermore, these sensors only allow mapping back to the turn of the millennium (2000), which can be considered a relatively limited time span. The same applies to highest resolution SAR data from sensors such as TerraSAR-X, TanDEM-X, Radarsat, COSMO-SkyMed and others. The data is either costly, or—for scientific purposes—can only be accessed for a relatively limited area [144]; furthermore, monitoring before the year 2000 becomes difficult. For coastline mapping, it is therefore clearly the Landsat fleet of sensors (MSS, TM, ETM+, DCM), whose data is supplied freely, which should be considered as the main workhorse. Data gaps can theoretically be filled with freely available ASTER and SPOT data. Landsat enables monitoring starting in the early 1970s, and the existence of a panchromatic band from 1999 onwards (15 m) is an additional advantage.
Figure 5. Coastline changes over the course of 34 years in the Yellow River Delta, based on LandsatMSS and Landsat TM satellite data (a), as well as shoreline accretion and erosion between 1976 and2010 (b–d).
Annual retreat or progradation rates of -355 m up to +591 m, as detected for the Yellow RiverDelta, are absolute extremes with respect to coastline change. In many deltas, coastline change is wellbelow 100 m per year. Thus, it is self-evident that satellite data used for coastline change analyses andaccretion and erosion pattern investigations must fulfil certain requirements. Coarse resolution satellitedata from sensors such as AVHRR, MODIS or MERIS, or even ENVISAT AATSR and ASAR, havespatial resolutions which are too low to be suitable for this purpose. Highest-resolution optical datafrom sensors such as QuickBird, WorldView or IKONOS are suitable for the required purpose, but areusually too costly for delta-wide and repeated acquisition. Furthermore, these sensors only allowmapping back to the turn of the millennium (2000), which can be considered a relatively limited timespan. The same applies to highest resolution SAR data from sensors such as TerraSAR-X, TanDEM-X,Radarsat, COSMO-SkyMed and others. The data is either costly, or—for scientific purposes—can onlybe accessed for a relatively limited area [144]; furthermore, monitoring before the year 2000 becomesdifficult. For coastline mapping, it is therefore clearly the Landsat fleet of sensors (MSS, TM, ETM+,DCM), whose data is supplied freely, which should be considered as the main workhorse. Data gapscan theoretically be filled with freely available ASTER and SPOT data. Landsat enables monitoringstarting in the early 1970s, and the existence of a panchromatic band from 1999 onwards (15 m) is anadditional advantage.
Remote Sens. 2019, 11, 1985 11 of 42
Several recent studies have taken advantage of the full spatial (i.e., global) and temporal(i.e., multidecadal, 16-day revisit) resolution of Landsat imagery. Kuenzer et al. [5] illuminatedthe potential of long-term Landsat time series for coastline mapping for the coastal Niger Delta ofNigeria, Africa, revealing that between 1986–2002/2003, annual accretion rates were slightly higher thanerosion rates, whereas after 2003, erosion rates increased in all coastal Niger Delta states except one.Coastal changes of up to 65 m per year (or 1.75 km over a 27-year time span) could be detected. Next tosea level rise and coastal alongshore transport, as well as upstream developments (land cover change,hydropower dams), oil industry-related activities such as the dredging of canals and destruction ofmangrove forests might play a role [5]. Two recent studies quantified the annual changes (i.e., erosionand accretion) of sandy shorelines over the past three decades at the global scale [58,59], using theLandsat archive in conjunction with the Google Earth Engine platform [49]. The global satellite-derivedshoreline dynamics of Luijendijk et al. [59] can be explored via the “shorelinemonitor” website [147].For the Vietnamese Mekong Delta, the study found shoreline erosion rates of 25–30 m over the lastthree decades, which were attributed to sand mining in the river and delta channels and subsidencedue to groundwater extraction [59]. Mentaschi et al. [58] exemplify the results of their global mappingfor several river delta case studies, including the Indus Delta, which exhibited the largest shorelineretreat globally, i.e., about 40 km over the analysis period (1984–2015), driven by upstream dams anddiversions that support one of the World’s largest irrigation complexes.
Another recent study by Ezcurra et al. [148] performed shoreline mapping based on the fullLandsat archive to test how sediment trapping by hydroelectric dams affects the stability of thecoastlines of estuaries on the Mexican Pacific coast. They found that the estuaries of the two rivers thatwere dammed for hydroelectricity experienced rapid coastal recessions of between 7.9 and 21.5 ha peryear, in what should be an accreting coastline. Murray et al. [149] recently mapped the distribution andtrajectories of tidal flats, one of the most extensive coastal ecosystems, at the global scale, using Landsat(1986–2016) and the Google Earth Engine [49]. The global intertidal change maps cover the majority ofthe World’s deltas and can be explored through an online mapping interface [150]. The authors foundthat 16.02% of global intertidal areas have been lost over the analysis period, partially due to the sinkingof riverine deltas and reduced sediment delivery from major rivers. Bishop et al. [151] combined globaltide modelling with Landsat imagery to derive an intertidal elevation model (15,387 km2) with 25 mresolution for the entire of the Australian coastline. Their open source approach could easily be appliedto other deltaic areas around the World if accurate observations or hindcast predictions of tidal waterlevel elevations are available.
A large potential to continue these long-term archives lies in the recently launched EuropeanSentinel-1 SAR and Sentinel-2 multispectral sensor [42]. For in-depth details on sensor characteristics,time spans covered and data availability, see Kuenzer et al. [46]. Although not specifically appliedin delta regions, a few applications have tested the suitability of Sentinel-2 for mapping coastlineaccretion and erosion dynamics at higher spatial and temporal resolutions than what is possible withLandsat [152–154]. For instance, Vos et al. [154] compared the accuracy and suitability of Landsat(5, 7 and 8) with that of Sentinel-2 for mapping inter-annual and intra-annual shoreline dynamics.Using a sub-pixel resolution shoreline detection technique, they found no improvement in shorelineaccuracy for Sentinel-2 over Landsat 5, indicating that pixel size may not be the primary source oferror (rather than errors due to georeferencing accuracy and uncertainty caused by instantaneous andlocalized water levels) [154]. Even though these findings are in line with [152,153], additional studiesare required to test and exploit the full potential of Sentinel-1 and -2 for mapping and tracking deltaiccoastline dynamics.
4.2. The Earth Observation Potential for the Analysis of Flood and Inundation Dynamics in River Deltas
Stern [155] forecasts that due to the combined effect of rising sea levels and increasing populationdensities along the coast, hundreds of millions more people will likely be affected by flooding each year,increasing pressure for coastal protection, especially in large coastal cities. Furthermore, Stern [156]
Remote Sens. 2019, 11, 1985 12 of 42
predicts an increasing number of people who will be permanently displaced due to sea level rise,heavier or unpredictable floods or other processes. The majority of deltas are on course to drown [8].According to Syvitzki et al. [7], since the year 2000, about 80% of the 33 river deltas analyzed wereexposed to severe flooding, with over 260,000 km2 being frequently submerged. Areas at future risk offlooding are expected to grow by 50% [7,8]. But not only floods originating from the ocean side (SLR,storm surges, etc.) are a threat to delta areas. Many deltas experience severe flooding due to rainyseason flood pulse patterns of the main stem river, due to unexpected rainfall upstream or in the delta,or simply due to human-induced water diversion schemes. Deltas are thus located in a sandwichedposition, with excess water looming from the ocean side as well as from upstream locations or processeswithin the delta. Geospatial information derived from satellite Earth observation can support thevisualization of flood and inundation dynamics in deltas globally. This potential has been discussed indepth by Kuenzer et al. [12,22,156–159], as well as in the recent review study of Huang et al. [160].
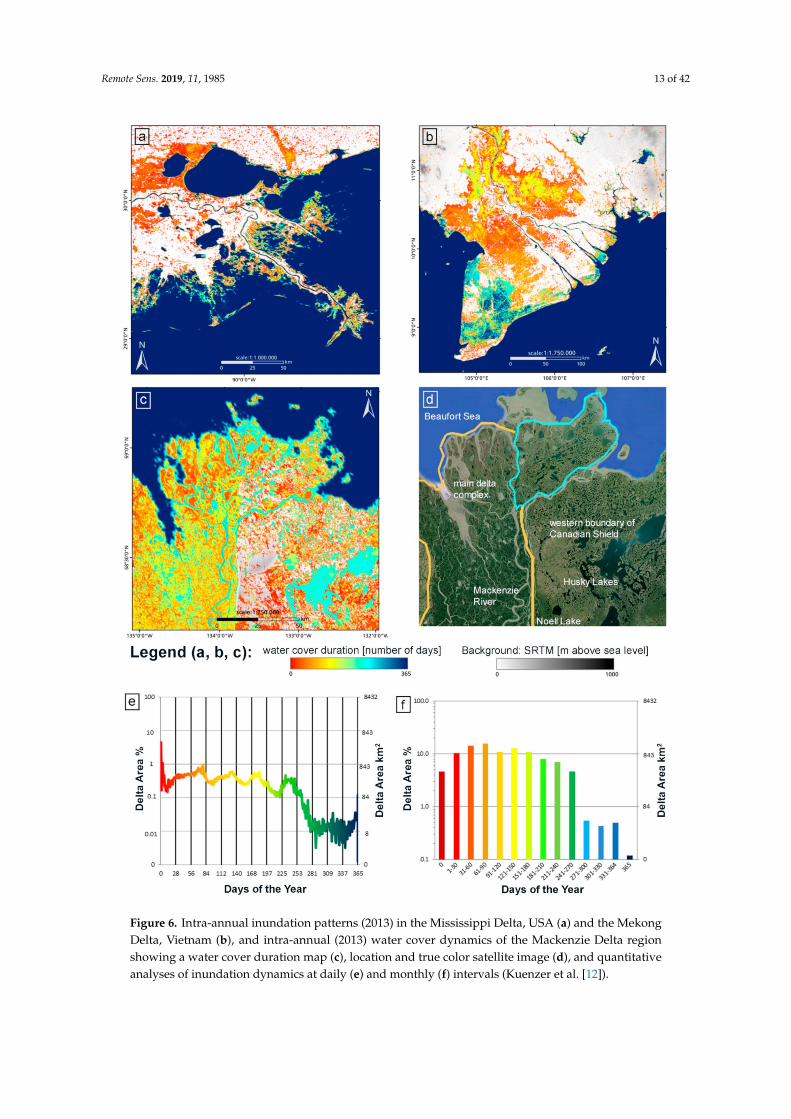
While numerous authors extract water areas based on SAR or optical/multispectral data fromjust single time steps or very few observations [159–163], and whereas flood and inundation mappingcovering complete delta areas is very rare [164], Kuenzer et al. [22,156,157] have performed studieson extensive time series of SAR and multispectral data for several river deltas globally. The largestchallenge for Earth observation-based derivation of flood and inundation dynamics lies in the weatherconditions, which usually prevail during rainy seasons or during weather with excess precipitation.Cloud cover often hampers optical and multispectral observations, which seemingly leaves SARdata (microwaves can penetrate clouds) as the only resort to map flood and inundation dynamics.However, Kuenzer et al. [12] have shown that with coarse spatial resolution but temporally-densetime series of MODIS data, covering each place on earth two times/day with sensors on the Terra andAqua platforms, it is possible to derive intra-annual dynamics. The method is presented in depth inKuenzer et al. [12]. Based on thresholding approaches using twice-daily 250 m resolution NIR banddata, it is possible to separate water from non-water and generate a daily water mask. Compositing alldaily data for one year then yields products depicting water cover duration (in days per year) for eachselected river delta. Figure 6 presents such data sets, revealing intra-annual inundation dynamics forthe Mississippi River Delta (Figure 6a) and the Mekong River Delta (Figure 6b), as well as a spatial andtemporal analysis of inundation dynamics in the polar Mackenzie Delta Region (Figure 6c–f). In thelatter, obvious differences between the eastern and the western parts of the delta are not a processingartefact, but occur because the eastern part of the delta region is located up to 230 m above mean sealevel, separated by a steep cliff from the western part. The eastern part is the westernmost fringe of theCanadian Shield, dominated by Quaternary glacial deposits and solid bedrock with embedded lakes,such as the Husky Lakes. The lakes are frozen for about half of the year, which is why they appear inshades of turquoise.
Remote Sens. 2019, 11, 1985 13 of 42
Figure 6. Intra-annual inundation patterns (2013) in the Mississippi Delta, USA (a) and the MekongDelta, Vietnam (b), and intra-annual (2013) water cover dynamics of the Mackenzie Delta regionshowing a water cover duration map (c), location and true color satellite image (d), and quantitativeanalyses of inundation dynamics at daily (e) and monthly (f) intervals (Kuenzer et al. [12]).
Remote Sens. 2019, 11, 1985 14 of 42
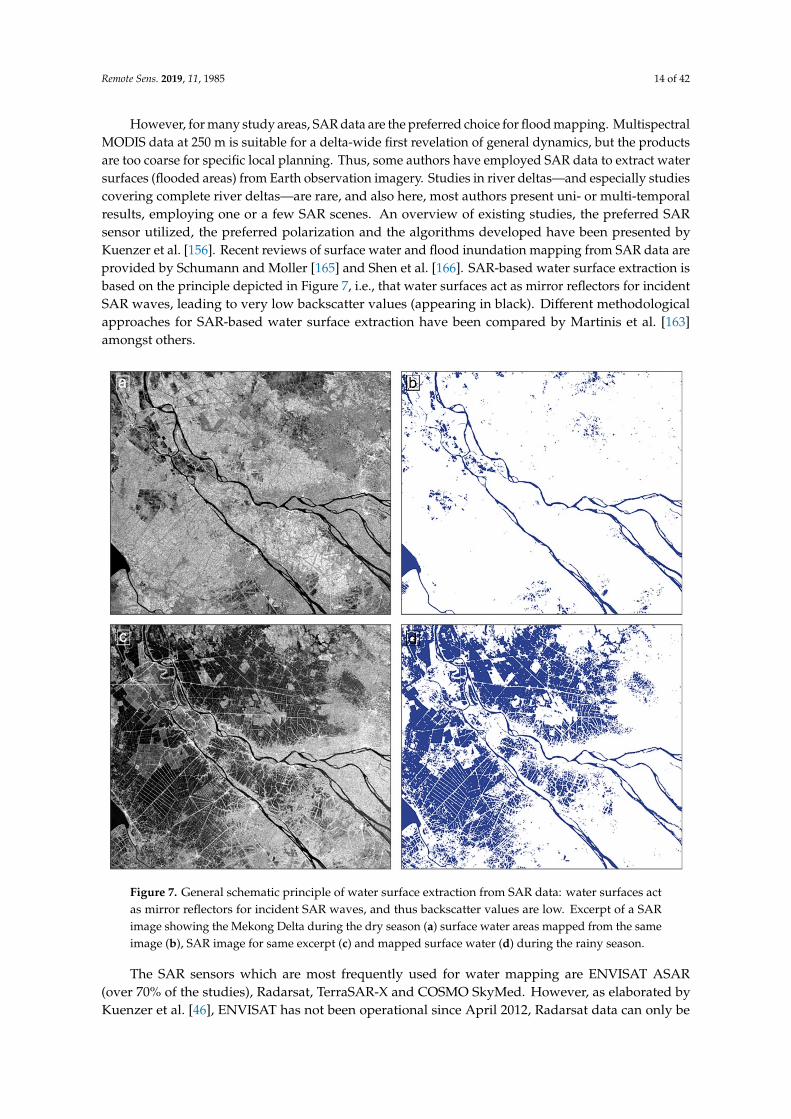
However, for many study areas, SAR data are the preferred choice for flood mapping. MultispectralMODIS data at 250 m is suitable for a delta-wide first revelation of general dynamics, but the productsare too coarse for specific local planning. Thus, some authors have employed SAR data to extract watersurfaces (flooded areas) from Earth observation imagery. Studies in river deltas—and especially studiescovering complete river deltas—are rare, and also here, most authors present uni- or multi-temporalresults, employing one or a few SAR scenes. An overview of existing studies, the preferred SARsensor utilized, the preferred polarization and the algorithms developed have been presented byKuenzer et al. [156]. Recent reviews of surface water and flood inundation mapping from SAR data areprovided by Schumann and Moller [165] and Shen et al. [166]. SAR-based water surface extraction isbased on the principle depicted in Figure 7, i.e., that water surfaces act as mirror reflectors for incidentSAR waves, leading to very low backscatter values (appearing in black). Different methodologicalapproaches for SAR-based water surface extraction have been compared by Martinis et al. [163]amongst others.
Figure 7. General schematic principle of water surface extraction from SAR data: water surfaces actas mirror reflectors for incident SAR waves, and thus backscatter values are low. Excerpt of a SARimage showing the Mekong Delta during the dry season (a) surface water areas mapped from the sameimage (b), SAR image for same excerpt (c) and mapped surface water (d) during the rainy season.
The SAR sensors which are most frequently used for water mapping are ENVISAT ASAR(over 70% of the studies), Radarsat, TerraSAR-X and COSMO SkyMed. However, as elaborated byKuenzer et al. [46], ENVISAT has not been operational since April 2012, Radarsat data can only be
Remote Sens. 2019, 11, 1985 15 of 42
acquired at high cost and TerraSAR-X data—for scientific purposes—is only available for relativelysmall case study areas. The potential of long ENVISAT ASAR-based time series analyses was, for thefirst time at that extent, presented by Kuenzer et al. [156]. Kuenzer et al [156] have furthermoredemonstrated that SAR-based inundation analyses can be well correlated with land use and dykingschemes in the Mekong Delta. Furthermore, Kuenzer et al. [157] analyzed the impact of different sensorspatial resolutions on patterns of inundation. ASAR WSM, TerraSAR-X ScanSAR and TerraSAR-XStripMap data were processed to reveal water coverage in the urban area of Can Tho. The resultsrevealed the spatial progression of floodwater over time, inundation frequency patterns, the disturbingeffect of corner reflecting buildings on water surface extraction and an increasing accuracy of watercover derivation with increasing spatial SAR sensor resolution, indicating that water-covered areas areunderestimated by more than half if coarser ENVISAT ASAR WSM data are used.
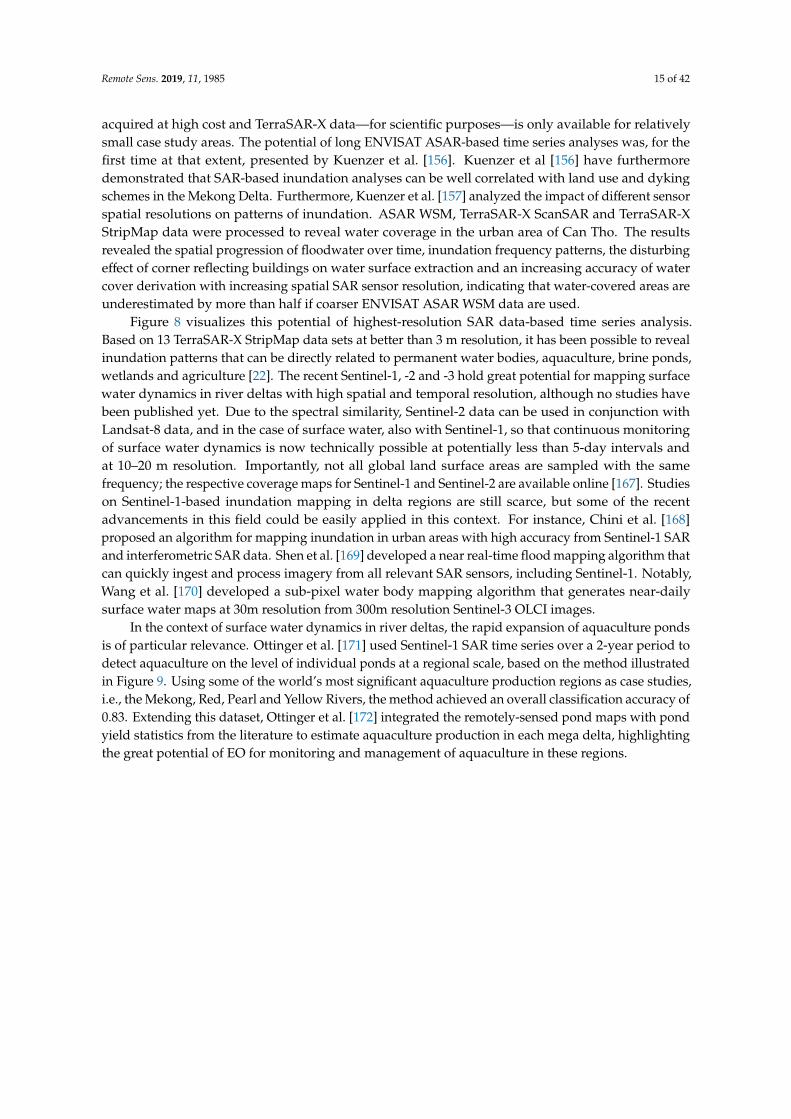
Figure 8 visualizes this potential of highest-resolution SAR data-based time series analysis.Based on 13 TerraSAR-X StripMap data sets at better than 3 m resolution, it has been possible to revealinundation patterns that can be directly related to permanent water bodies, aquaculture, brine ponds,wetlands and agriculture [22]. The recent Sentinel-1, -2 and -3 hold great potential for mapping surfacewater dynamics in river deltas with high spatial and temporal resolution, although no studies havebeen published yet. Due to the spectral similarity, Sentinel-2 data can be used in conjunction withLandsat-8 data, and in the case of surface water, also with Sentinel-1, so that continuous monitoringof surface water dynamics is now technically possible at potentially less than 5-day intervals andat 10–20 m resolution. Importantly, not all global land surface areas are sampled with the samefrequency; the respective coverage maps for Sentinel-1 and Sentinel-2 are available online [167]. Studieson Sentinel-1-based inundation mapping in delta regions are still scarce, but some of the recentadvancements in this field could be easily applied in this context. For instance, Chini et al. [168]proposed an algorithm for mapping inundation in urban areas with high accuracy from Sentinel-1 SARand interferometric SAR data. Shen et al. [169] developed a near real-time flood mapping algorithm thatcan quickly ingest and process imagery from all relevant SAR sensors, including Sentinel-1. Notably,Wang et al. [170] developed a sub-pixel water body mapping algorithm that generates near-dailysurface water maps at 30m resolution from 300m resolution Sentinel-3 OLCI images.
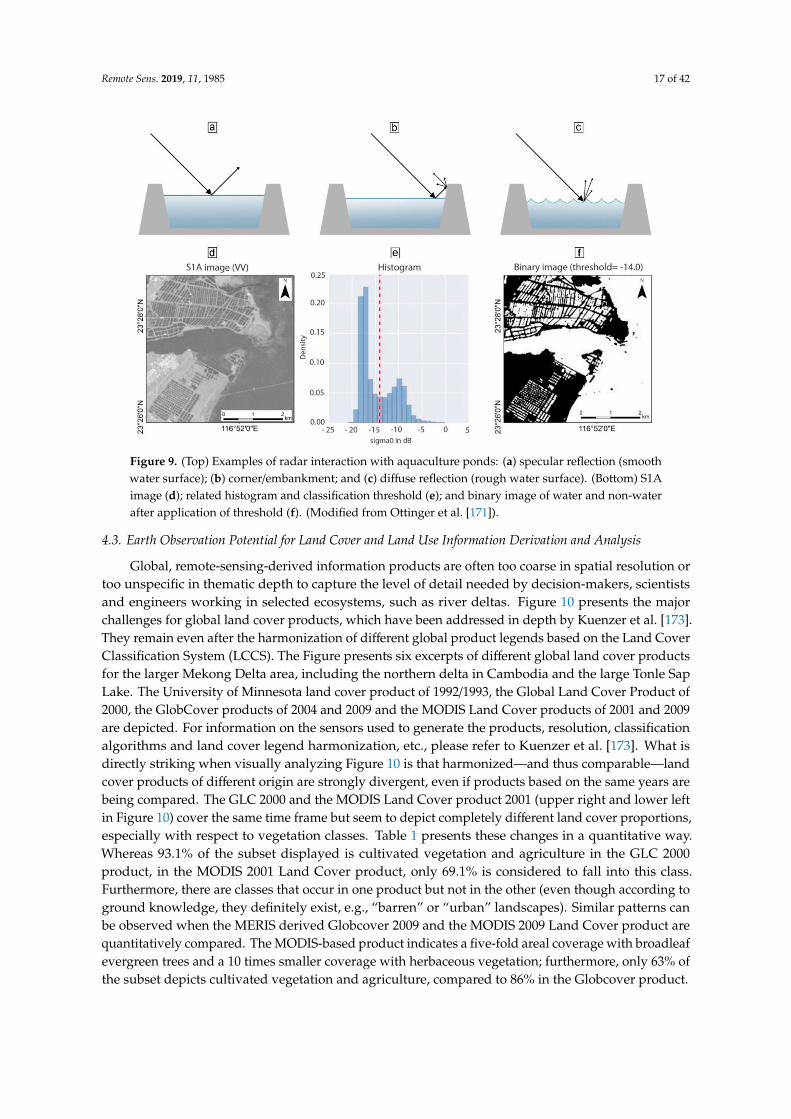
In the context of surface water dynamics in river deltas, the rapid expansion of aquaculture pondsis of particular relevance. Ottinger et al. [171] used Sentinel-1 SAR time series over a 2-year period todetect aquaculture on the level of individual ponds at a regional scale, based on the method illustratedin Figure 9. Using some of the world’s most significant aquaculture production regions as case studies,i.e., the Mekong, Red, Pearl and Yellow Rivers, the method achieved an overall classification accuracy of0.83. Extending this dataset, Ottinger et al. [172] integrated the remotely-sensed pond maps with pondyield statistics from the literature to estimate aquaculture production in each mega delta, highlightingthe great potential of EO for monitoring and management of aquaculture in these regions.
Remote Sens. 2019, 11, 1985 16 of 42
Figure 8. Inundation frequency patterns in the Yellow River Delta, as extracted from a time series of 13TerraSAR-X StripMap data sets (2.5 m) for 2013/14. Inundation frequency is the number of times a givenpixel was flagged as inundated in the time series. (Adapted with permission from Kuenzer et al. [22]).
Remote Sens. 2019, 11, 1985 17 of 42
Figure 9. (Top) Examples of radar interaction with aquaculture ponds: (a) specular reflection (smoothwater surface); (b) corner/embankment; and (c) diffuse reflection (rough water surface). (Bottom) S1Aimage (d); related histogram and classification threshold (e); and binary image of water and non-waterafter application of threshold (f). (Modified from Ottinger et al. [171]).
4.3. Earth Observation Potential for Land Cover and Land Use Information Derivation and Analysis
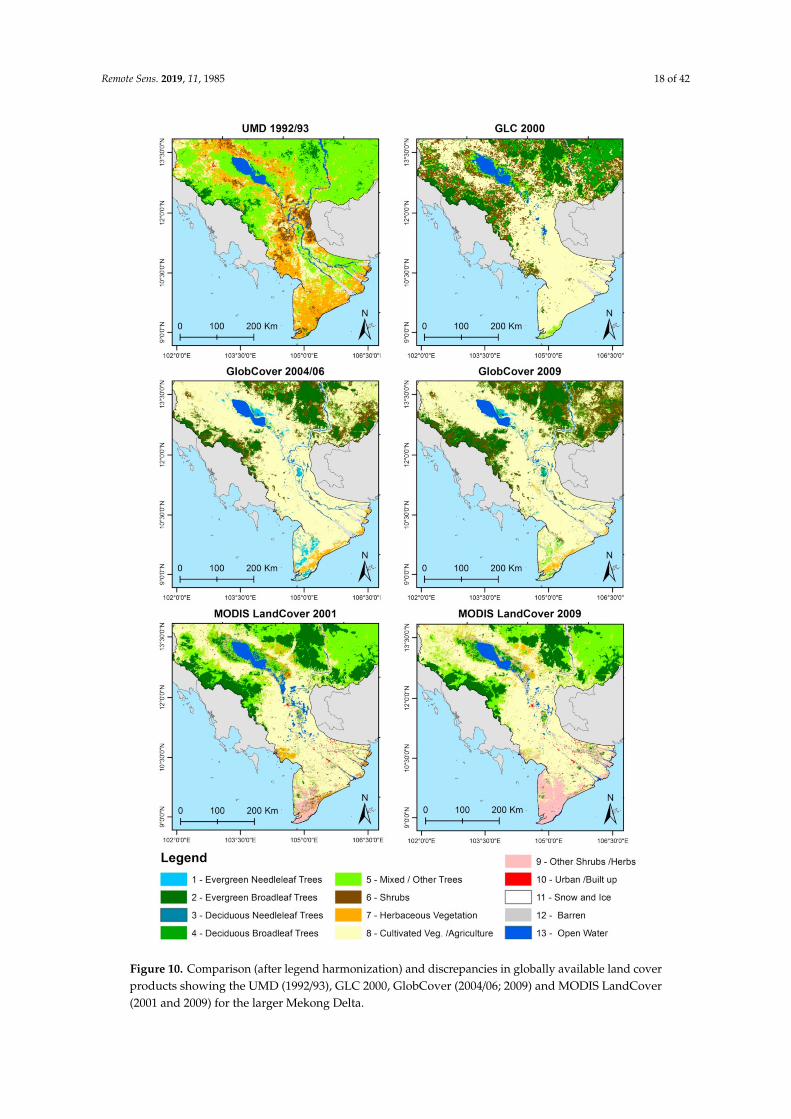
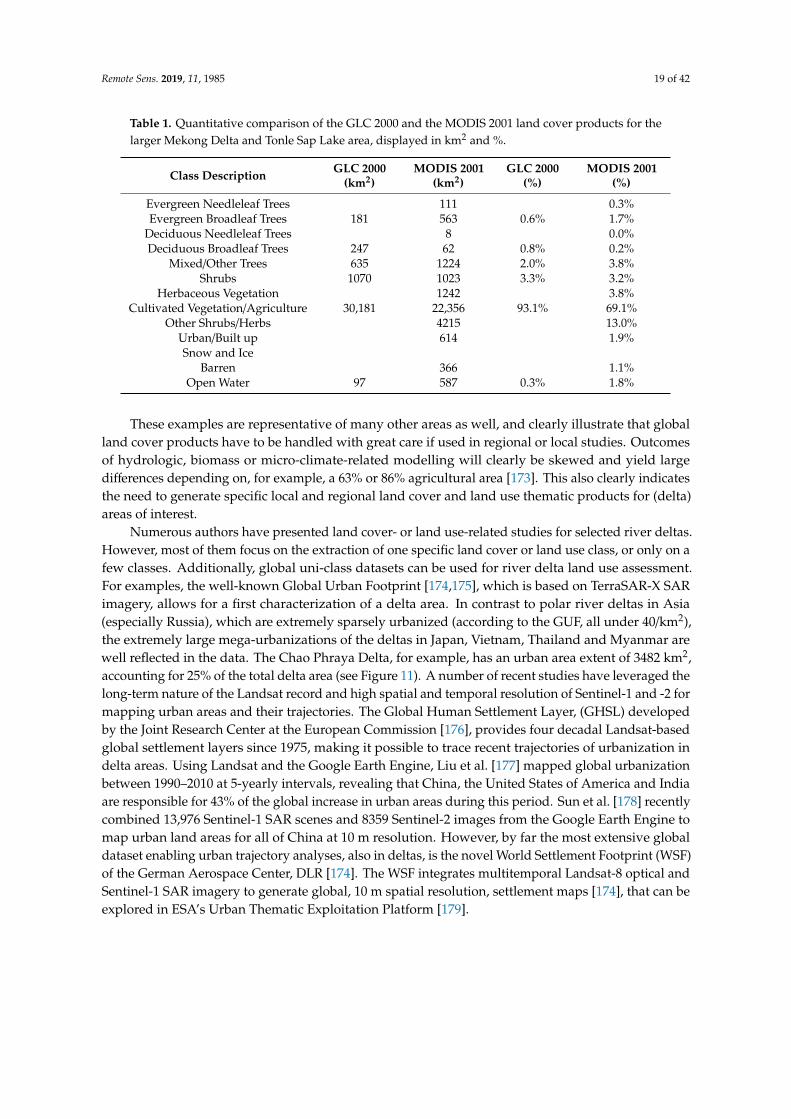
Global, remote-sensing-derived information products are often too coarse in spatial resolution ortoo unspecific in thematic depth to capture the level of detail needed by decision-makers, scientistsand engineers working in selected ecosystems, such as river deltas. Figure 10 presents the majorchallenges for global land cover products, which have been addressed in depth by Kuenzer et al. [173].They remain even after the harmonization of different global product legends based on the Land CoverClassification System (LCCS). The Figure presents six excerpts of different global land cover productsfor the larger Mekong Delta area, including the northern delta in Cambodia and the large Tonle SapLake. The University of Minnesota land cover product of 1992/1993, the Global Land Cover Product of2000, the GlobCover products of 2004 and 2009 and the MODIS Land Cover products of 2001 and 2009are depicted. For information on the sensors used to generate the products, resolution, classificationalgorithms and land cover legend harmonization, etc., please refer to Kuenzer et al. [173]. What isdirectly striking when visually analyzing Figure 10 is that harmonized—and thus comparable—landcover products of different origin are strongly divergent, even if products based on the same years arebeing compared. The GLC 2000 and the MODIS Land Cover product 2001 (upper right and lower leftin Figure 10) cover the same time frame but seem to depict completely different land cover proportions,especially with respect to vegetation classes. Table 1 presents these changes in a quantitative way.Whereas 93.1% of the subset displayed is cultivated vegetation and agriculture in the GLC 2000product, in the MODIS 2001 Land Cover product, only 69.1% is considered to fall into this class.Furthermore, there are classes that occur in one product but not in the other (even though according toground knowledge, they definitely exist, e.g., “barren” or “urban” landscapes). Similar patterns canbe observed when the MERIS derived Globcover 2009 and the MODIS 2009 Land Cover product arequantitatively compared. The MODIS-based product indicates a five-fold areal coverage with broadleafevergreen trees and a 10 times smaller coverage with herbaceous vegetation; furthermore, only 63% ofthe subset depicts cultivated vegetation and agriculture, compared to 86% in the Globcover product.
Remote Sens. 2019, 11, 1985 18 of 42
Figure 10. Comparison (after legend harmonization) and discrepancies in globally available land coverproducts showing the UMD (1992/93), GLC 2000, GlobCover (2004/06; 2009) and MODIS LandCover(2001 and 2009) for the larger Mekong Delta.
Remote Sens. 2019, 11, 1985 19 of 42
Table 1. Quantitative comparison of the GLC 2000 and the MODIS 2001 land cover products for thelarger Mekong Delta and Tonle Sap Lake area, displayed in km2 and %.
Class Description GLC 2000(km2)
MODIS 2001(km2)
GLC 2000(%)
MODIS 2001(%)
Evergreen Needleleaf Trees 111 0.3%Evergreen Broadleaf Trees 181 563 0.6% 1.7%
Deciduous Needleleaf Trees 8 0.0%Deciduous Broadleaf Trees 247 62 0.8% 0.2%
Mixed/Other Trees 635 1224 2.0% 3.8%Shrubs 1070 1023 3.3% 3.2%
Herbaceous Vegetation 1242 3.8%Cultivated Vegetation/Agriculture 30,181 22,356 93.1% 69.1%
Other Shrubs/Herbs 4215 13.0%Urban/Built up 614 1.9%Snow and Ice
Barren 366 1.1%Open Water 97 587 0.3% 1.8%
These examples are representative of many other areas as well, and clearly illustrate that globalland cover products have to be handled with great care if used in regional or local studies. Outcomesof hydrologic, biomass or micro-climate-related modelling will clearly be skewed and yield largedifferences depending on, for example, a 63% or 86% agricultural area [173]. This also clearly indicatesthe need to generate specific local and regional land cover and land use thematic products for (delta)areas of interest.
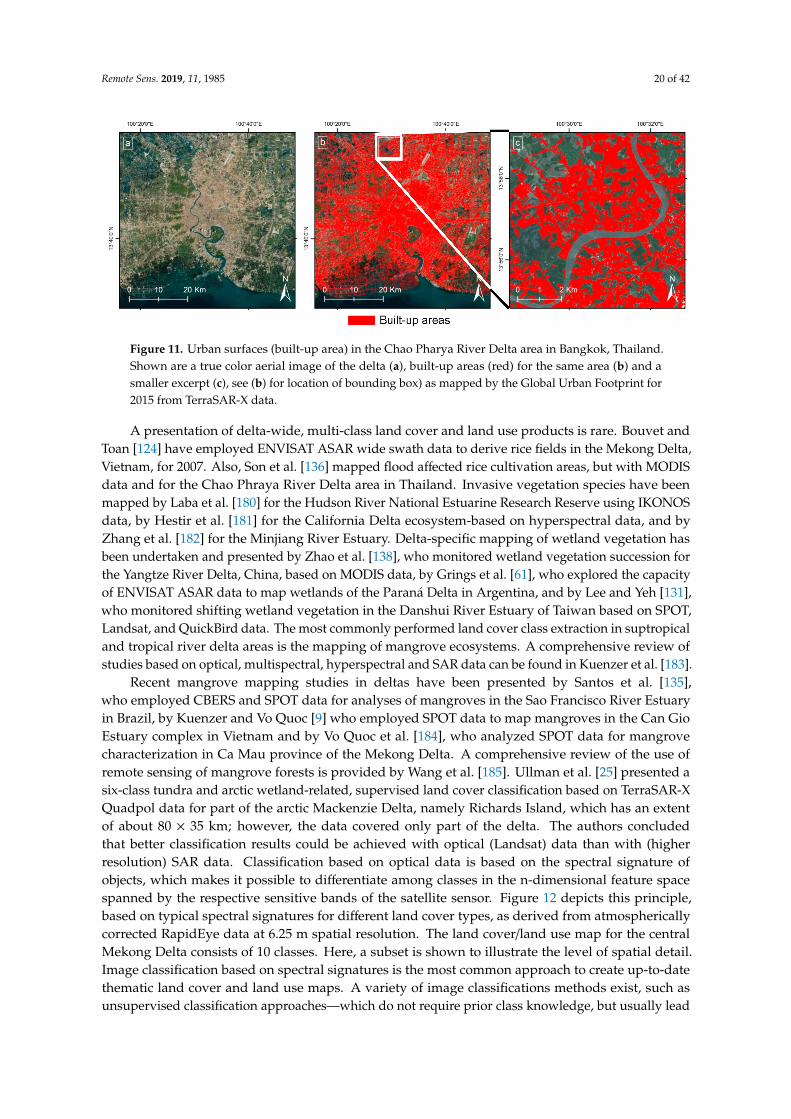
Numerous authors have presented land cover- or land use-related studies for selected river deltas.However, most of them focus on the extraction of one specific land cover or land use class, or only on afew classes. Additionally, global uni-class datasets can be used for river delta land use assessment.For examples, the well-known Global Urban Footprint [174,175], which is based on TerraSAR-X SARimagery, allows for a first characterization of a delta area. In contrast to polar river deltas in Asia(especially Russia), which are extremely sparsely urbanized (according to the GUF, all under 40/km2),the extremely large mega-urbanizations of the deltas in Japan, Vietnam, Thailand and Myanmar arewell reflected in the data. The Chao Phraya Delta, for example, has an urban area extent of 3482 km2,accounting for 25% of the total delta area (see Figure 11). A number of recent studies have leveraged thelong-term nature of the Landsat record and high spatial and temporal resolution of Sentinel-1 and -2 formapping urban areas and their trajectories. The Global Human Settlement Layer, (GHSL) developedby the Joint Research Center at the European Commission [176], provides four decadal Landsat-basedglobal settlement layers since 1975, making it possible to trace recent trajectories of urbanization indelta areas. Using Landsat and the Google Earth Engine, Liu et al. [177] mapped global urbanizationbetween 1990–2010 at 5-yearly intervals, revealing that China, the United States of America and Indiaare responsible for 43% of the global increase in urban areas during this period. Sun et al. [178] recentlycombined 13,976 Sentinel-1 SAR scenes and 8359 Sentinel-2 images from the Google Earth Engine tomap urban land areas for all of China at 10 m resolution. However, by far the most extensive globaldataset enabling urban trajectory analyses, also in deltas, is the novel World Settlement Footprint (WSF)of the German Aerospace Center, DLR [174]. The WSF integrates multitemporal Landsat-8 optical andSentinel-1 SAR imagery to generate global, 10 m spatial resolution, settlement maps [174], that can beexplored in ESA’s Urban Thematic Exploitation Platform [179].
Remote Sens. 2019, 11, 1985 20 of 42
Figure 11. Urban surfaces (built-up area) in the Chao Pharya River Delta area in Bangkok, Thailand.Shown are a true color aerial image of the delta (a), built-up areas (red) for the same area (b) and asmaller excerpt (c), see (b) for location of bounding box) as mapped by the Global Urban Footprint for2015 from TerraSAR-X data.
A presentation of delta-wide, multi-class land cover and land use products is rare. Bouvet andToan [124] have employed ENVISAT ASAR wide swath data to derive rice fields in the Mekong Delta,Vietnam, for 2007. Also, Son et al. [136] mapped flood affected rice cultivation areas, but with MODISdata and for the Chao Phraya River Delta area in Thailand. Invasive vegetation species have beenmapped by Laba et al. [180] for the Hudson River National Estuarine Research Reserve using IKONOSdata, by Hestir et al. [181] for the California Delta ecosystem-based on hyperspectral data, and byZhang et al. [182] for the Minjiang River Estuary. Delta-specific mapping of wetland vegetation hasbeen undertaken and presented by Zhao et al. [138], who monitored wetland vegetation succession forthe Yangtze River Delta, China, based on MODIS data, by Grings et al. [61], who explored the capacityof ENVISAT ASAR data to map wetlands of the Paraná Delta in Argentina, and by Lee and Yeh [131],who monitored shifting wetland vegetation in the Danshui River Estuary of Taiwan based on SPOT,Landsat, and QuickBird data. The most commonly performed land cover class extraction in suptropicaland tropical river delta areas is the mapping of mangrove ecosystems. A comprehensive review ofstudies based on optical, multispectral, hyperspectral and SAR data can be found in Kuenzer et al. [183].
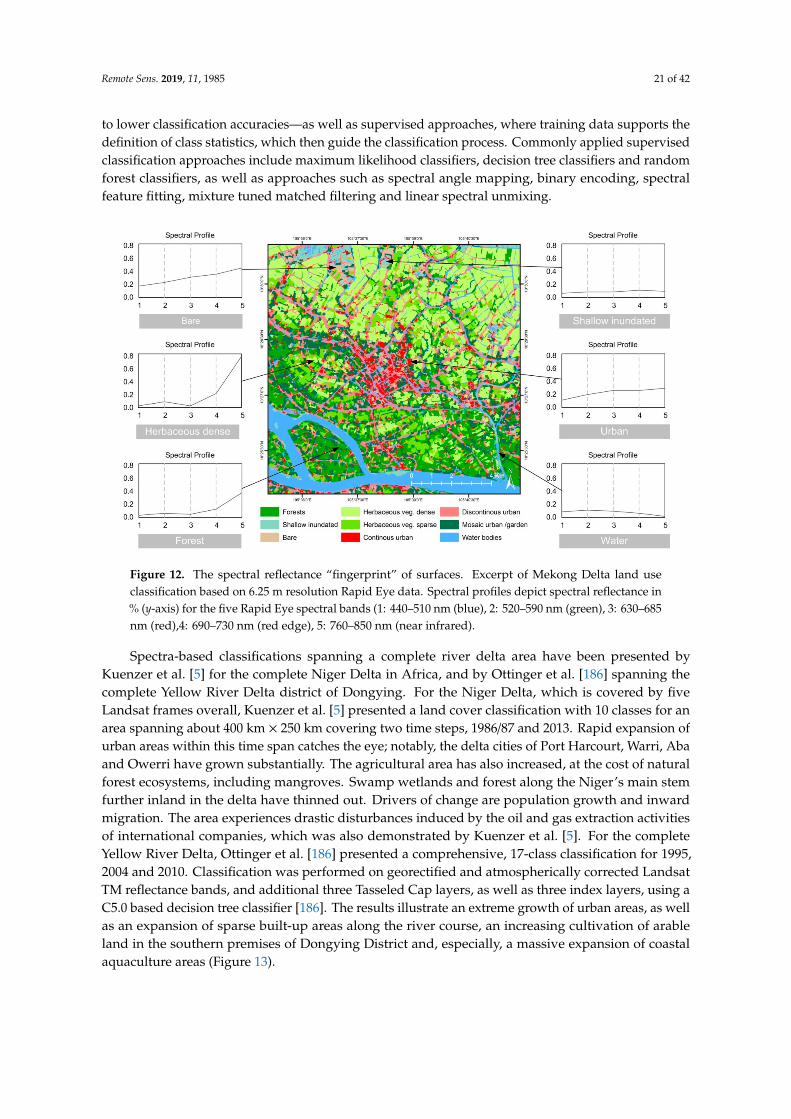
Recent mangrove mapping studies in deltas have been presented by Santos et al. [135],who employed CBERS and SPOT data for analyses of mangroves in the Sao Francisco River Estuaryin Brazil, by Kuenzer and Vo Quoc [9] who employed SPOT data to map mangroves in the Can GioEstuary complex in Vietnam and by Vo Quoc et al. [184], who analyzed SPOT data for mangrovecharacterization in Ca Mau province of the Mekong Delta. A comprehensive review of the use ofremote sensing of mangrove forests is provided by Wang et al. [185]. Ullman et al. [25] presented asix-class tundra and arctic wetland-related, supervised land cover classification based on TerraSAR-XQuadpol data for part of the arctic Mackenzie Delta, namely Richards Island, which has an extentof about 80 × 35 km; however, the data covered only part of the delta. The authors concludedthat better classification results could be achieved with optical (Landsat) data than with (higherresolution) SAR data. Classification based on optical data is based on the spectral signature ofobjects, which makes it possible to differentiate among classes in the n-dimensional feature spacespanned by the respective sensitive bands of the satellite sensor. Figure 12 depicts this principle,based on typical spectral signatures for different land cover types, as derived from atmosphericallycorrected RapidEye data at 6.25 m spatial resolution. The land cover/land use map for the centralMekong Delta consists of 10 classes. Here, a subset is shown to illustrate the level of spatial detail.Image classification based on spectral signatures is the most common approach to create up-to-datethematic land cover and land use maps. A variety of image classifications methods exist, such asunsupervised classification approaches—which do not require prior class knowledge, but usually lead
Remote Sens. 2019, 11, 1985 21 of 42
to lower classification accuracies—as well as supervised approaches, where training data supports thedefinition of class statistics, which then guide the classification process. Commonly applied supervisedclassification approaches include maximum likelihood classifiers, decision tree classifiers and randomforest classifiers, as well as approaches such as spectral angle mapping, binary encoding, spectralfeature fitting, mixture tuned matched filtering and linear spectral unmixing.
Figure 12. The spectral reflectance “fingerprint” of surfaces. Excerpt of Mekong Delta land useclassification based on 6.25 m resolution Rapid Eye data. Spectral profiles depict spectral reflectance in% (y-axis) for the five Rapid Eye spectral bands (1: 440–510 nm (blue), 2: 520–590 nm (green), 3: 630–685nm (red),4: 690–730 nm (red edge), 5: 760–850 nm (near infrared).
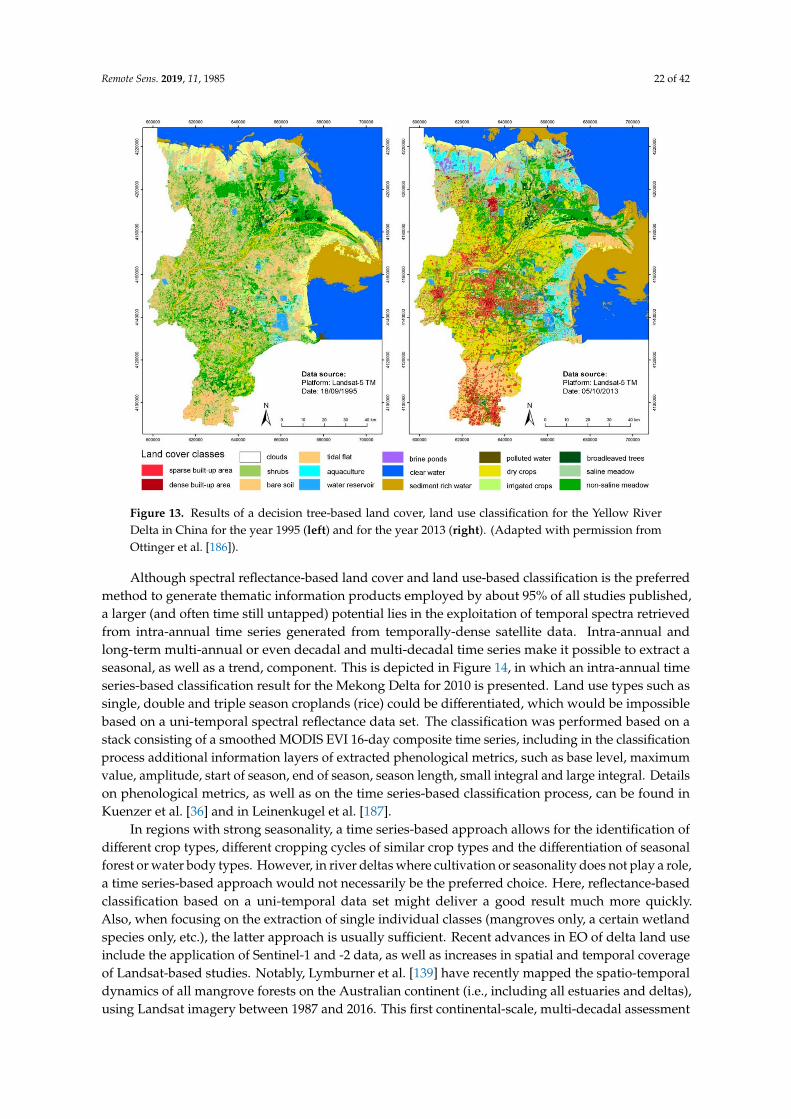
Spectra-based classifications spanning a complete river delta area have been presented byKuenzer et al. [5] for the complete Niger Delta in Africa, and by Ottinger et al. [186] spanning thecomplete Yellow River Delta district of Dongying. For the Niger Delta, which is covered by fiveLandsat frames overall, Kuenzer et al. [5] presented a land cover classification with 10 classes for anarea spanning about 400 km × 250 km covering two time steps, 1986/87 and 2013. Rapid expansion ofurban areas within this time span catches the eye; notably, the delta cities of Port Harcourt, Warri, Abaand Owerri have grown substantially. The agricultural area has also increased, at the cost of naturalforest ecosystems, including mangroves. Swamp wetlands and forest along the Niger’s main stemfurther inland in the delta have thinned out. Drivers of change are population growth and inwardmigration. The area experiences drastic disturbances induced by the oil and gas extraction activitiesof international companies, which was also demonstrated by Kuenzer et al. [5]. For the completeYellow River Delta, Ottinger et al. [186] presented a comprehensive, 17-class classification for 1995,2004 and 2010. Classification was performed on georectified and atmospherically corrected LandsatTM reflectance bands, and additional three Tasseled Cap layers, as well as three index layers, using aC5.0 based decision tree classifier [186]. The results illustrate an extreme growth of urban areas, as wellas an expansion of sparse built-up areas along the river course, an increasing cultivation of arableland in the southern premises of Dongying District and, especially, a massive expansion of coastalaquaculture areas (Figure 13).
Remote Sens. 2019, 11, 1985 22 of 42
Figure 13. Results of a decision tree-based land cover, land use classification for the Yellow RiverDelta in China for the year 1995 (left) and for the year 2013 (right). (Adapted with permission fromOttinger et al. [186]).
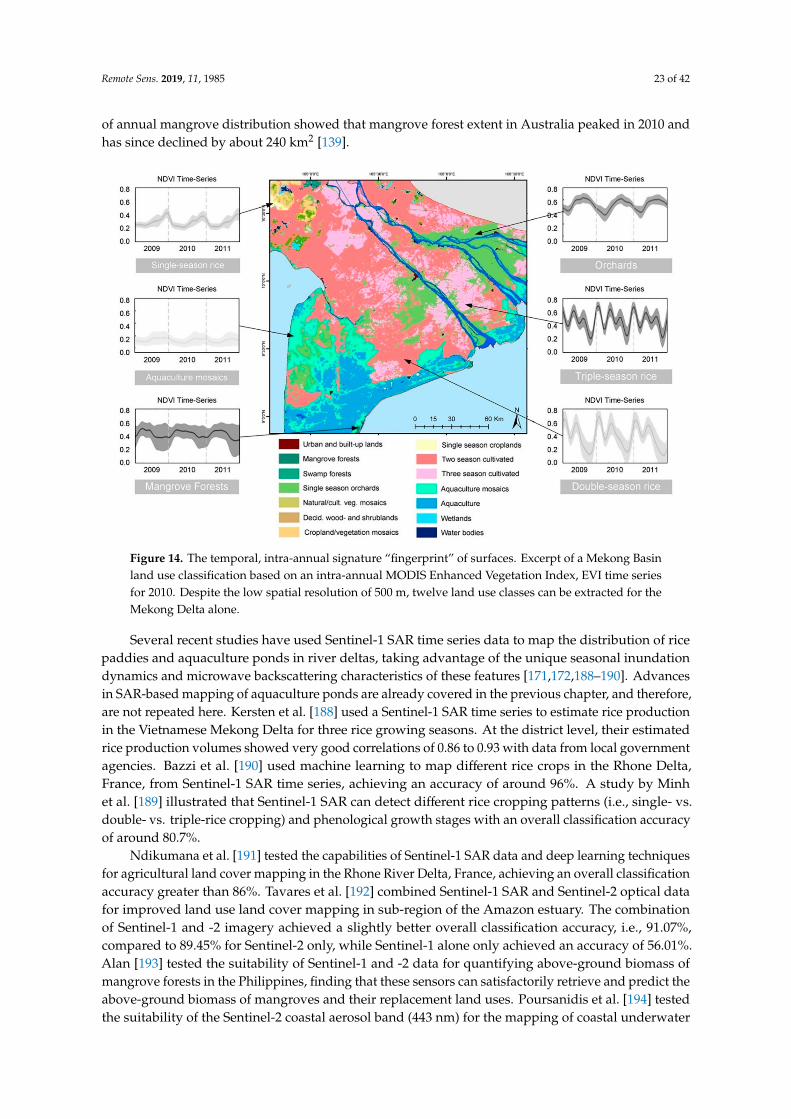
Although spectral reflectance-based land cover and land use-based classification is the preferredmethod to generate thematic information products employed by about 95% of all studies published,a larger (and often time still untapped) potential lies in the exploitation of temporal spectra retrievedfrom intra-annual time series generated from temporally-dense satellite data. Intra-annual andlong-term multi-annual or even decadal and multi-decadal time series make it possible to extract aseasonal, as well as a trend, component. This is depicted in Figure 14, in which an intra-annual timeseries-based classification result for the Mekong Delta for 2010 is presented. Land use types such assingle, double and triple season croplands (rice) could be differentiated, which would be impossiblebased on a uni-temporal spectral reflectance data set. The classification was performed based on astack consisting of a smoothed MODIS EVI 16-day composite time series, including in the classificationprocess additional information layers of extracted phenological metrics, such as base level, maximumvalue, amplitude, start of season, end of season, season length, small integral and large integral. Detailson phenological metrics, as well as on the time series-based classification process, can be found inKuenzer et al. [36] and in Leinenkugel et al. [187].
In regions with strong seasonality, a time series-based approach allows for the identification ofdifferent crop types, different cropping cycles of similar crop types and the differentiation of seasonalforest or water body types. However, in river deltas where cultivation or seasonality does not play a role,a time series-based approach would not necessarily be the preferred choice. Here, reflectance-basedclassification based on a uni-temporal data set might deliver a good result much more quickly.Also, when focusing on the extraction of single individual classes (mangroves only, a certain wetlandspecies only, etc.), the latter approach is usually sufficient. Recent advances in EO of delta land useinclude the application of Sentinel-1 and -2 data, as well as increases in spatial and temporal coverageof Landsat-based studies. Notably, Lymburner et al. [139] have recently mapped the spatio-temporaldynamics of all mangrove forests on the Australian continent (i.e., including all estuaries and deltas),using Landsat imagery between 1987 and 2016. This first continental-scale, multi-decadal assessment
Remote Sens. 2019, 11, 1985 23 of 42
of annual mangrove distribution showed that mangrove forest extent in Australia peaked in 2010 andhas since declined by about 240 km2 [139].
Figure 14. The temporal, intra-annual signature “fingerprint” of surfaces. Excerpt of a Mekong Basinland use classification based on an intra-annual MODIS Enhanced Vegetation Index, EVI time seriesfor 2010. Despite the low spatial resolution of 500 m, twelve land use classes can be extracted for theMekong Delta alone.
Several recent studies have used Sentinel-1 SAR time series data to map the distribution of ricepaddies and aquaculture ponds in river deltas, taking advantage of the unique seasonal inundationdynamics and microwave backscattering characteristics of these features [171,172,188–190]. Advancesin SAR-based mapping of aquaculture ponds are already covered in the previous chapter, and therefore,are not repeated here. Kersten et al. [188] used a Sentinel-1 SAR time series to estimate rice productionin the Vietnamese Mekong Delta for three rice growing seasons. At the district level, their estimatedrice production volumes showed very good correlations of 0.86 to 0.93 with data from local governmentagencies. Bazzi et al. [190] used machine learning to map different rice crops in the Rhone Delta,France, from Sentinel-1 SAR time series, achieving an accuracy of around 96%. A study by Minhet al. [189] illustrated that Sentinel-1 SAR can detect different rice cropping patterns (i.e., single- vs.double- vs. triple-rice cropping) and phenological growth stages with an overall classification accuracyof around 80.7%.
Ndikumana et al. [191] tested the capabilities of Sentinel-1 SAR data and deep learning techniquesfor agricultural land cover mapping in the Rhone River Delta, France, achieving an overall classificationaccuracy greater than 86%. Tavares et al. [192] combined Sentinel-1 SAR and Sentinel-2 optical datafor improved land use land cover mapping in sub-region of the Amazon estuary. The combinationof Sentinel-1 and -2 imagery achieved a slightly better overall classification accuracy, i.e., 91.07%,compared to 89.45% for Sentinel-2 only, while Sentinel-1 alone only achieved an accuracy of 56.01%.Alan [193] tested the suitability of Sentinel-1 and -2 data for quantifying above-ground biomass ofmangrove forests in the Philippines, finding that these sensors can satisfactorily retrieve and predict theabove-ground biomass of mangroves and their replacement land uses. Poursanidis et al. [194] testedthe suitability of the Sentinel-2 coastal aerosol band (443 nm) for the mapping of coastal underwater
Remote Sens. 2019, 11, 1985 24 of 42
habitats with high spatial variability (e.g., seagrass) and shallow water bathymetry, showing promisinginitial results. Notably, using a convolutional neural network, Feng et al. [195] fused multitemporalSentinel-1 SAR and Sentinel-2 optical imagery to map land cover in the Yellow River Delta NationalNature Reserve with an overall accuracy of 93.78%.
4.4. Earth Observation Potential for Monitoring Compliance with Environmental Regulations
Still a niche topic in Earth observation, but one of ever-increasing relevance, is the potential ofsatellite-based mapping for monitoring compliance with environmental regulations and the installationof related long-term monitoring and implementation schemes. As early as 2003, Hettling [196]addressed the topic of remote sensing satellites for verification in international law, and Peter [197],Kuriyama [198], and Purdy [199] also elaborated on the use of remote sensing to support the applicationof multilateral environmental agreements and the better regulatory compliance and enforcement ofenvironmental laws. A good overview of the function of remote sensing in support of environmentalpolicy has recently been presented by De Leeuw et al. [200]. Case study-related articles in this field oftenaddress ocean and water body related topics, such as water quality monitoring for a case study area inFinland, using remote sensing to support the EU Water Framework Directive [201]. SAR-based alertsystems to detect oil spills were introduced by Ferraro et al. [202] and Glasgow et al. [203], who reviewedreal-time remote monitoring of water quality, and Kourti et al. [204], who discussed the integration ofremote sensing into fisheries control. A few land-related studies have been published [205,206].
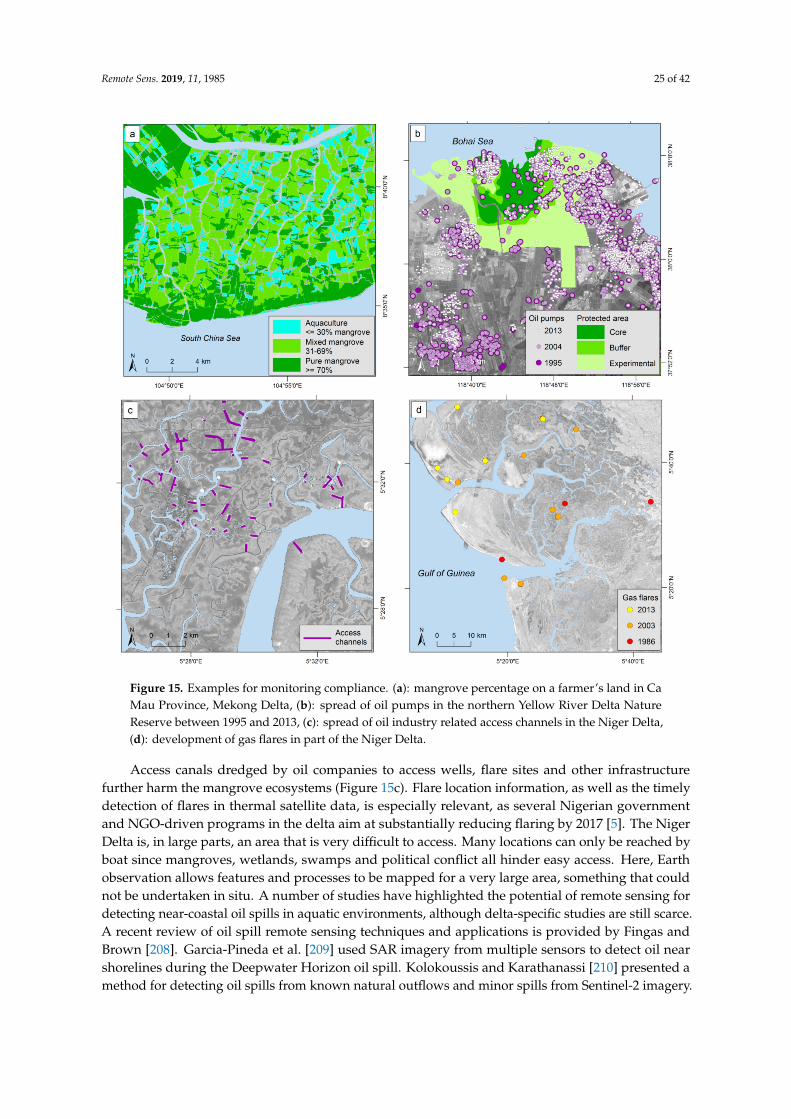
Kuenzer et al. [5,6] and Vo Quoc et al. [207] have demonstrated the potential of Earth observationfor monitoring compliance. In the Yellow River Delta, two nature reserves were established in the late1990s/early 2000s, and even declared Ramsar wetland sites in 2013. These reserves consist of a corezone, a buffer zone, and an experimental zone. In the core zones, no economic or human activity isallowed. Settlement, agriculture, aquaculture, reed harvesting, tree cutting, bird shooting, oil pumpinstallation, pipeline installation and new road construction are forbidden. In the buffer zone, only treecutting, bird shooting and oil pump installation are forbidden, and in the experimental zone, only treecutting and bird shooting are forbidden (see Kuenzer et al. [6]). However, despite the fact the oil pump(as well as gas pump) installation is forbidden in the core and the buffer zones of the two reserves,Kuenzer et al. [6] used highest resolution QuickBird, WorldView, SPOT, and Landsat data to provethat a rapid expansion of pumps has taken place even in these restricted zones over the past years(see also Figure 15b). Within both reserves, the number of oil pumps more than tripled from 1995 to2013, and it could be demonstrated that the less frequented northern reserve (depicted in Figure 15b)experienced a much larger increase in illegal pumps in the core and buffer zones than did the muchmore frequented eastern reserve, which is a magnet for tourists and where a visitor center was set upin recent years; this information was shared with local politicians and conservationists. The spatialinformation could guide stricter control and provide in-depth information on what is happeningwhen and where. However, in an area where 80% of the population profits from the oil industry,law enforcement is a major challenge. For the Niger Delta, Kuenzer et al. [5] proved the suitability ofLandsat thermal band data for detecting oil industry-related gas flaring activities. Currently, the onlysatellite sensors in orbit with sufficient spatial resolution for flare detection are Landsat-DCM (alsotermed Landsat 8), which was launched in February 2013, and Sentinel-2 a and b, available since 2015and 2017 respectively. Thermal anomaly extraction using a moving window approach revealed thatnowadays, most permanent flare locations exist east of the Niger main stem, especially in the areasouth of Port Harcourt, as well as along a stretch between the towns of Ahoada and Ihiala, and manyare located directly within the ecologically-valuable mangrove forests of the delta (see Figure 15d).
Remote Sens. 2019, 11, 1985 25 of 42
Figure 15. Examples for monitoring compliance. (a): mangrove percentage on a farmer’s land in CaMau Province, Mekong Delta, (b): spread of oil pumps in the northern Yellow River Delta NatureReserve between 1995 and 2013, (c): spread of oil industry related access channels in the Niger Delta,(d): development of gas flares in part of the Niger Delta.
Access canals dredged by oil companies to access wells, flare sites and other infrastructurefurther harm the mangrove ecosystems (Figure 15c). Flare location information, as well as the timelydetection of flares in thermal satellite data, is especially relevant, as several Nigerian governmentand NGO-driven programs in the delta aim at substantially reducing flaring by 2017 [5]. The NigerDelta is, in large parts, an area that is very difficult to access. Many locations can only be reached byboat since mangroves, wetlands, swamps and political conflict all hinder easy access. Here, Earthobservation allows features and processes to be mapped for a very large area, something that couldnot be undertaken in situ. A number of studies have highlighted the potential of remote sensing fordetecting near-coastal oil spills in aquatic environments, although delta-specific studies are still scarce.A recent review of oil spill remote sensing techniques and applications is provided by Fingas andBrown [208]. Garcia-Pineda et al. [209] used SAR imagery from multiple sensors to detect oil nearshorelines during the Deepwater Horizon oil spill. Kolokoussis and Karathanassi [210] presented amethod for detecting oil spills from known natural outflows and minor spills from Sentinel-2 imagery.
Remote Sens. 2019, 11, 1985 26 of 42
For Ca Mau Province in the Mekong Delta, where the dominant land use pattern is a mix ofaquaculture and remaining natural mangrove patches, Vo Quoc et al. [207] demonstrated that it ispossible to map mangrove density within cadastre segments to reveal whether a farmer’s land containsless than 30%, 30–70% or over 70% of mangroves. This is important information in a province wherelocal government regulations have delineated certain zones in which mangrove cover must remain atcertain percentage levels [207]. As depicted in Figure 15a, a mangrove cover map could be derivedfrom 10 m resolution SPOT data and 2.5 m resolution TerraSAR-X data using an object-orientedapproach (for methodological details see [207]). The IUCN, for example, requested such data in2013, and declared its intention to develop a “green shrimp” farming certificate for farmers whocomply with regulations not to decrease mangrove cover on their land below the required threshold.However, as De Leeuw et al. [200] correctly observed, many studies claim the potential to support thecreation of policies, but so far, there is hardly any evidence of Earth observation contributing to anactual policy. They report that “the remote sensing academic community only recently started to getinvolved in cross-disciplinary research”, and suggest that Earth observation and social sciences need tobe linked more closely to bridge the gap between the disciplines involved, and that a scientific debateon the available potential of Earth observation for the purposes of compliance monitoring needs to benurtured (De Leeuw et al. [200]).
4.5. Earth Observation Potential for Monitoring of River Delta Land Subsidence
Extensive human development is rapidly transforming deltas through increasing urbanization,flow and sediment flux modification and agricultural intensification [16]. As a common side effectof this development, many deltas in the world are experiencing dangerous rates of land-subsidence,sometimes exceeding current rates of eustatic sea level rise, creating a situation of high vulnerabilityfor ecosystems and humans alike [4]. Rapid subsidence in delta regions typically results from thecompaction of delta sediments, triggered either by the extraction of groundwater or hydrocarbonsfrom underlying sedimentary layers, or an increase in surface loading (i.e., construction of roads andcities) [4,7,211]. In addition, the trapping of sediments in upstream reservoirs and controlled routingof river flows across delta plains indirectly contribute to subsidence by limiting the deposition of newsediment [4,7,211]. Some prominent examples of river delta subsidence are the Chao Praya Delta(Thailand), which is sinking at a rate of 5–15cm per year, the Po Delta (Italy), which sank by about3–5 m over the course of the 20th century [8] and embanked areas in the Ganges-Brahmaputra Delta,which have lost about 1–1.5 m in elevation since the 1960s [212].
The main challenge for quantifying subsidence in large river deltas is the lack of suitable datasetswith sufficient spatial (i.e., covering the entire delta) and temporal (extending over multiyear periods)coverage, which is typically difficult and costly to generate with ground-based surveying techniques.As an alternative, Earth observation, in particular Interferometric Synthetic Aperture Radar (InSAR),provides a suitable source of data for quantifying land subsidence. InSAR is increasingly being usedto quantify the land subsidence resulting from groundwater extraction, tectonic activities, sedimentcompaction and mining and a range of applications are summarized in Wang et al. [213].
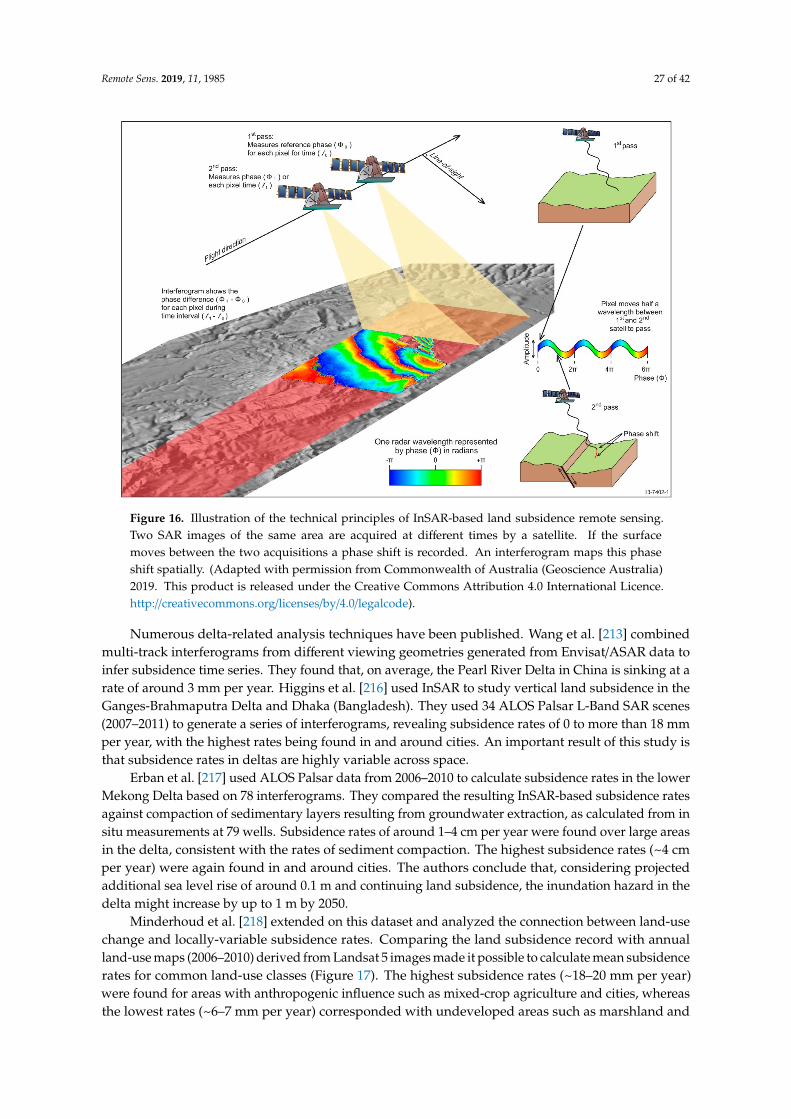
With InSAR, quantifying vertical movements of the land surface is achieved by differencingphase observations between pairs of complex-valued radar images obtained at different points intime, which results in a series of interferograms, from which elevation change rates can be inferred(Figure 16) [213,214]. Multi-image or multi-sensor InSAR analysis techniques make it possible to derivevertical surface changes at mm-level accuracy [215]. A review of recent advances in InSAR techniquesfor retrieval of surface displacement time-series is provided in Pepe & Calò [215].
Remote Sens. 2019, 11, 1985 27 of 42
Figure 16. Illustration of the technical principles of InSAR-based land subsidence remote sensing.Two SAR images of the same area are acquired at different times by a satellite. If the surfacemoves between the two acquisitions a phase shift is recorded. An interferogram maps this phaseshift spatially. (Adapted with permission from Commonwealth of Australia (Geoscience Australia)2019. This product is released under the Creative Commons Attribution 4.0 International Licence.http://creativecommons.org/licenses/by/4.0/legalcode).
Numerous delta-related analysis techniques have been published. Wang et al. [213] combinedmulti-track interferograms from different viewing geometries generated from Envisat/ASAR data toinfer subsidence time series. They found that, on average, the Pearl River Delta in China is sinking at arate of around 3 mm per year. Higgins et al. [216] used InSAR to study vertical land subsidence in theGanges-Brahmaputra Delta and Dhaka (Bangladesh). They used 34 ALOS Palsar L-Band SAR scenes(2007–2011) to generate a series of interferograms, revealing subsidence rates of 0 to more than 18 mmper year, with the highest rates being found in and around cities. An important result of this study isthat subsidence rates in deltas are highly variable across space.
Erban et al. [217] used ALOS Palsar data from 2006–2010 to calculate subsidence rates in the lowerMekong Delta based on 78 interferograms. They compared the resulting InSAR-based subsidence ratesagainst compaction of sedimentary layers resulting from groundwater extraction, as calculated from insitu measurements at 79 wells. Subsidence rates of around 1–4 cm per year were found over large areasin the delta, consistent with the rates of sediment compaction. The highest subsidence rates (~4 cmper year) were again found in and around cities. The authors conclude that, considering projectedadditional sea level rise of around 0.1 m and continuing land subsidence, the inundation hazard in thedelta might increase by up to 1 m by 2050.
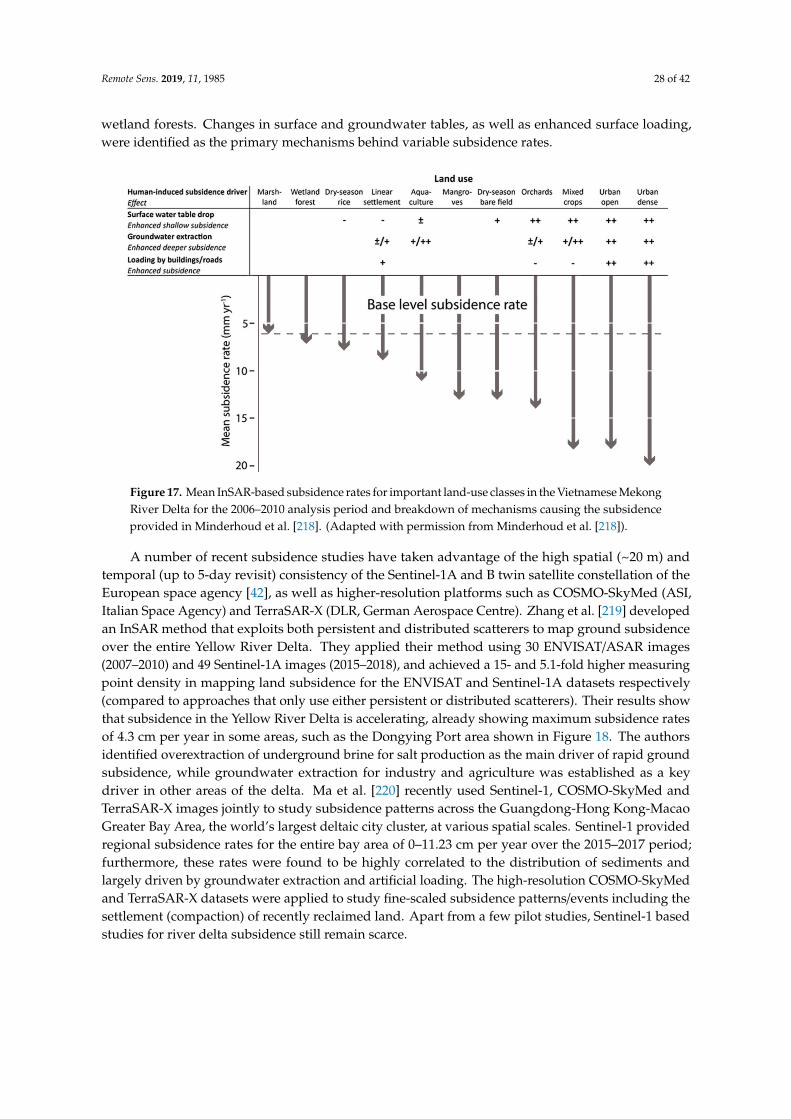
Minderhoud et al. [218] extended on this dataset and analyzed the connection between land-usechange and locally-variable subsidence rates. Comparing the land subsidence record with annualland-use maps (2006–2010) derived from Landsat 5 images made it possible to calculate mean subsidencerates for common land-use classes (Figure 17). The highest subsidence rates (~18–20 mm per year)were found for areas with anthropogenic influence such as mixed-crop agriculture and cities, whereasthe lowest rates (~6–7 mm per year) corresponded with undeveloped areas such as marshland and
Remote Sens. 2019, 11, 1985 28 of 42
wetland forests. Changes in surface and groundwater tables, as well as enhanced surface loading,were identified as the primary mechanisms behind variable subsidence rates.
Figure 17. Mean InSAR-based subsidence rates for important land-use classes in the Vietnamese MekongRiver Delta for the 2006–2010 analysis period and breakdown of mechanisms causing the subsidenceprovided in Minderhoud et al. [218]. (Adapted with permission from Minderhoud et al. [218]).
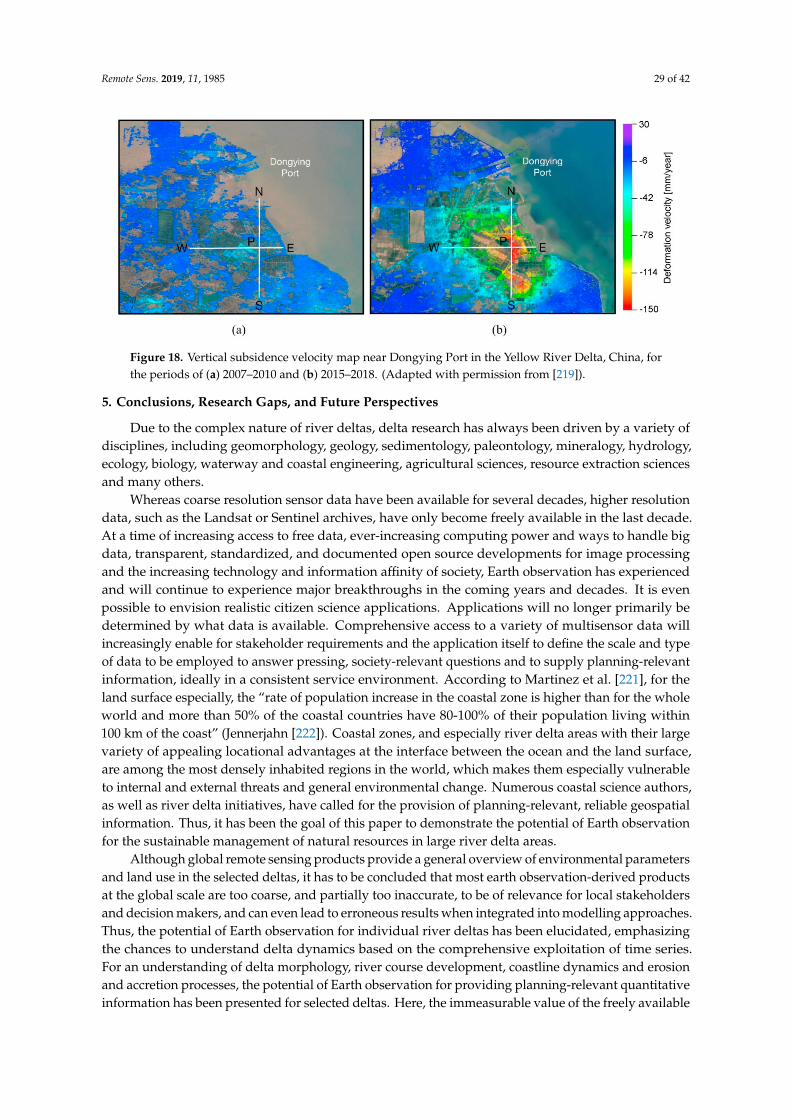
A number of recent subsidence studies have taken advantage of the high spatial (~20 m) andtemporal (up to 5-day revisit) consistency of the Sentinel-1A and B twin satellite constellation of theEuropean space agency [42], as well as higher-resolution platforms such as COSMO-SkyMed (ASI,Italian Space Agency) and TerraSAR-X (DLR, German Aerospace Centre). Zhang et al. [219] developedan InSAR method that exploits both persistent and distributed scatterers to map ground subsidenceover the entire Yellow River Delta. They applied their method using 30 ENVISAT/ASAR images(2007–2010) and 49 Sentinel-1A images (2015–2018), and achieved a 15- and 5.1-fold higher measuringpoint density in mapping land subsidence for the ENVISAT and Sentinel-1A datasets respectively(compared to approaches that only use either persistent or distributed scatterers). Their results showthat subsidence in the Yellow River Delta is accelerating, already showing maximum subsidence ratesof 4.3 cm per year in some areas, such as the Dongying Port area shown in Figure 18. The authorsidentified overextraction of underground brine for salt production as the main driver of rapid groundsubsidence, while groundwater extraction for industry and agriculture was established as a keydriver in other areas of the delta. Ma et al. [220] recently used Sentinel-1, COSMO-SkyMed andTerraSAR-X images jointly to study subsidence patterns across the Guangdong-Hong Kong-MacaoGreater Bay Area, the world’s largest deltaic city cluster, at various spatial scales. Sentinel-1 providedregional subsidence rates for the entire bay area of 0–11.23 cm per year over the 2015–2017 period;furthermore, these rates were found to be highly correlated to the distribution of sediments andlargely driven by groundwater extraction and artificial loading. The high-resolution COSMO-SkyMedand TerraSAR-X datasets were applied to study fine-scaled subsidence patterns/events including thesettlement (compaction) of recently reclaimed land. Apart from a few pilot studies, Sentinel-1 basedstudies for river delta subsidence still remain scarce.
Remote Sens. 2019, 11, 1985 29 of 42
Figure 18. Vertical subsidence velocity map near Dongying Port in the Yellow River Delta, China, forthe periods of (a) 2007–2010 and (b) 2015–2018. (Adapted with permission from [219]).
5. Conclusions, Research Gaps, and Future Perspectives
Due to the complex nature of river deltas, delta research has always been driven by a variety ofdisciplines, including geomorphology, geology, sedimentology, paleontology, mineralogy, hydrology,ecology, biology, waterway and coastal engineering, agricultural sciences, resource extraction sciencesand many others.
Whereas coarse resolution sensor data have been available for several decades, higher resolutiondata, such as the Landsat or Sentinel archives, have only become freely available in the last decade.At a time of increasing access to free data, ever-increasing computing power and ways to handle bigdata, transparent, standardized, and documented open source developments for image processingand the increasing technology and information affinity of society, Earth observation has experiencedand will continue to experience major breakthroughs in the coming years and decades. It is evenpossible to envision realistic citizen science applications. Applications will no longer primarily bedetermined by what data is available. Comprehensive access to a variety of multisensor data willincreasingly enable for stakeholder requirements and the application itself to define the scale and typeof data to be employed to answer pressing, society-relevant questions and to supply planning-relevantinformation, ideally in a consistent service environment. According to Martinez et al. [221], for theland surface especially, the “rate of population increase in the coastal zone is higher than for the wholeworld and more than 50% of the coastal countries have 80-100% of their population living within100 km of the coast” (Jennerjahn [222]). Coastal zones, and especially river delta areas with their largevariety of appealing locational advantages at the interface between the ocean and the land surface,are among the most densely inhabited regions in the world, which makes them especially vulnerableto internal and external threats and general environmental change. Numerous coastal science authors,as well as river delta initiatives, have called for the provision of planning-relevant, reliable geospatialinformation. Thus, it has been the goal of this paper to demonstrate the potential of Earth observationfor the sustainable management of natural resources in large river delta areas.
Although global remote sensing products provide a general overview of environmental parametersand land use in the selected deltas, it has to be concluded that most earth observation-derived productsat the global scale are too coarse, and partially too inaccurate, to be of relevance for local stakeholdersand decision makers, and can even lead to erroneous results when integrated into modelling approaches.Thus, the potential of Earth observation for individual river deltas has been elucidated, emphasizingthe chances to understand delta dynamics based on the comprehensive exploitation of time series.For an understanding of delta morphology, river course development, coastline dynamics and erosionand accretion processes, the potential of Earth observation for providing planning-relevant quantitativeinformation has been presented for selected deltas. Here, the immeasurable value of the freely available
Remote Sens. 2019, 11, 1985 30 of 42
Landsat archives, now covering a time span of over three decades, could be demonstrated. Novel andfreely available data of the Sentinel mission make it possible to extend and densify the Landsat-basedobservation time span. The potential of Earth observation for analyzing flood and inundation patternshas been laid out based on optical intra-annual MODIS time series as well as higher resolution SAR data.It has been shown that intra-annual, temporally-dense coarse resolution time series allow inundationcharacterization to be made of deltas globally, reflecting patterns of local geology, geomorphology andland use. Flood and inundation mapping derived from high-resolution SAR time series have made itpossible to provide detailed monitoring of flooding, the relation of inundation patterns to seasonalityof crops and diking patterns, as well as the derivation of permanently flooded aquaculture, which iscommon especially to the large river delta environments in Asia. The challenges and chances forderiving land cover and land use information were elucidated at the global scale by Kuenzer et al. [173],quantifying and underlining the large discrepancies in freely available global land cover products, evenfor identical years. A determination of specific regional-to-local land cover and land use was presentedfor selected deltas. Classification results based on the spectral reflectance signatures of uni-temporaldata sets, as well as on land cover and land use maps derived from intra-annual time series (temporalsignatures), were presented, and the advantages and disadvantages of both approaches discussed.The potential of Earth observation to provide information products enabling compliance monitoringhas been demonstrated using the examples of the revelation of oil pump distribution in the YellowRiver Delta, in some cases, within pristine protected Ramsar wetlands, where industrial activity isforbidden, and of mangrove logging and decreasing mangrove densities in Ca Mau Province of theMekong Delta, where specific percentages of mangrove cover on farmland are required. Furthermore,oil industry impacts manifested via gas flaring and mangrove destruction in the Niger Delta have beenquantified [5,6,207]. High spatial resolution remote sensing at the Landsat scale enables the detectionof illegal activities.
Overall, it has already been elucidated that freely available, coarse resolution data are only oflimited value for deriving delta information for local planning purposes, unless they are analyzedas temporally-dense, intra-annual time series. An example of a suitable application is the derivationof patterns of inundation dynamics or crop seasonality parameters (e.g., cycles of single, double andtriple rice crops), which could not be extracted from higher resolution data on a daily basis, which hasjust recently become possible through time series densification (i.e., by combining Landsat, Sentinel-1and Sentinel-2 data). For most river deltas, up-to-date geospatial information at a resolution of theLandsat/Sentinel scale or better is in demand. Here, great potential lies in synergetic analysis of thisdata, jointly with highest resolution data of sensors such as IKONOS, QuickBird and WolrdView.However, the latter sensors are not continuously tasked, and thus, do not usually cover complete deltaareas, besides not being currently available free of charge for large areas. The research gaps identifiedwith respect to the potential of Earth observation to aid in routinely analyzing large river delta areas aremainly information-product gaps. Long-term, continuous sensor lines and data that can be accessedwithout interruption are of highest relevance to enable the development of truly sustainable services.
With respect to SAR data, the following improvements and the development of so far still lackinggeospatial products should be encouraged for all major river deltas globally:
• Sentinel-1 holds large potential for flood mapping services in a fully operational context.Water cover information could be derived automatically for every acquired Sentinel-1 dataset. Automated derivation of snow and ice information might be an additional asset,especially for applications relating to polar deltas. Depending on the availability of theTerraSAR-X/Tandem-X-based WorldDEM at the highest resolution, the calculation of sea levelrise-related flood scenarios using a refined Manning roughness coefficient is strongly encouragedat a global scale for varying scenarios of 50, 100, 150 and 200 cm of sea level rise, possibly includinginformation on river delta subsidence rates. Furthermore, 3D information on areas within thedelta, e.g., sandbar heights, mangrove canopy heights, building heights, etc., is important forassessing the functionality of storm surge protection barriers or flood impacts, for example.
Remote Sens. 2019, 11, 1985 31 of 42
• River delta subsidence should be re-assessed in a standardized, well-documented approach basedon differential SAR interferometry, utilizing Sentinel-1 data for all river deltas globally. Localsubsidence phenomena can then be investigated with respect to cause (such as land compactionthrough urbanization or underground resource extraction) and relative to sea level rise modelling.
With respect to optical and multispectral data analysis, the following product improvements anddevelopment of so far still lacking geospatial products should be encouraged:
• High-quality land cover and land use maps at 30 to 10 m spatial resolution and higher are neededfor each major delta (as well as globally). These should be derived based on intra-annual time series,which will be possible to undertake once temporally-dense time series can be compiled basedon Landsat 5 TM, Landsat 8 DCM, as well as Sentinel-2 data, which can provide twice-per-weekcoverage. An intra-annual time series approach is needed to differentiate agricultural crops andother types of vegetation and land use, and to monitor usage intensity and land use changeover time
• Flood and inundation mapping, as well as inland water quality assessments of colored dissolvedorganic matter and sediment load, will also become possible based on such high resolution opticaland multispectral data, if such data can be provided in a temporally-dense manner, such as withtwice-per-week coverage. This will then not only make it possible to monitor coastal watersand large inland lakes, but will even enable the derivation of water quality statuses in large,near-shore (inland) aquaculture areas, as well as in small lakes, pools and delta/estuary riverbranches and canals.
• Another field offering the possibility of new applications and services is Earth observation-basedgeo-health analysis. While remote sensing-based rapid mapping for disaster relief is alreadywell established, Earth observation still has to reveal its full potential in the field of geo-health.Studies based on coarse resolution data to very roughly delineate areas of malaria, dengue orschistosomiasis risk have been published, but the availability of an intra-annual time series withup to 5 or 10 m spatial resolution would offer more chances to develop seasonal health riskindicators and warning systems for selected densely-populated deltas of interest.
• Highest-resolution data from sensors such as IKONOS, QuickBird, WorldView or even Skyboxand the Planet Doves and similar sensors could, if made freely available, open up a completelynew field in Earth observation: “inventorying and accounting”. Inventorying refers to actuallycounting relevant objects in river deltas that cannot be explicitly extracted from data at the spatialresolution of Sentinel-2. This would enable the retrieval of information such as the number ofships anchored in harbors, the number of large industrial plants present in the delta, or the numberof oil-pumps within wetlands, to give only three examples. Multi-temporal studies in this contextcould yield highly quantitative indicators on a region’s socio-economic development, trends ofhazard exposure, and the general “shift of things” (rather than changes in land use). Here, novelremote sensing algorithms from the field of Artificial Intelligence, AI, using Graphical ProcessingUnit, GPU, computing power are currently on the advance. However, no large-scale studies havebeen published so far.
There is surely a large number of further river delta-related research and product gaps that couldbe addressed, but the ones mentioned here are expected to be the most crucial and intriguing withinthe next five years. Based on such improved decision support products indicating environmentalchange, the speed of change, change trends, threatened ecosystem services, exposure, vulnerability,resilience and many more can be derived. However, while pioneering fundamental research willalways be needed and must be encouraged and financially supported, at the same time, scientists inapplied research fields should not neglect the applicability and usability of their results. To supportdecision makers and stakeholders in formulating their needs and interests with respect to geospatialinformation products, it is also the responsibility of the Earth observation community to showcase andillustrate what is, what will be, and what might never be possible with remote sensing data.
Remote Sens. 2019, 11, 1985 32 of 42
Author Contributions: C.K. performed the literature review, designed the exemplary research examples and wrotethe majority of the manuscript. V.H. added additional literature and critical feedback into the manuscript andwrote the part on land subsidence. J.H. helped with the design of figures and critically reviewed the manuscript.S.D. guided the research over consecutive years of river delta related research at EOC of DLR.
Funding: This research received no external funding.
Conflicts of Interest: The authors declare no conflict of interest.
References
1. Evans, G. Deltas: The Fertile Dustbins of the Continents. Proc. Geol. Assoc. 2012, 123, 397–418. [CrossRef]2. Kuenzer, C.; Renaud, F. Climate Change and Environmental Change in River Deltas Globally. In The Mekong
Delta System—Interdisciplinary Analyses of a River Delta; Kuenzer, C., Renaud, F., Eds.; Springer: Dordrecht,The Netherlands, 2012; pp. 7–48. [CrossRef]
3. Anthony, E.J. Deltas. In Coastal Environments and Global Change; Masselink, G., Gehrels, R., Eds.; John Wiley& Sons: Chichester, UK, 2014.
4. Syvitski, J.P.M. Deltas at Risk. Sustain. Sci. 2008, 3, 23–32. [CrossRef]5. Kuenzer, C.; Van Beijma, S.; Gessner, U.; Dech, S. Land Surface Dynamics and Environmental Challenges of
the Niger Delta, Africa: Remote Sensing-Based Analyses Spanning Three Decades (1986–2013). Appl. Geogr.2014, 53, 354–368. [CrossRef]
6. Kuenzer, C.; Ottinger, M.; Liu, G.; Sun, B.; Baumhauer, R.; Dech, S. Earth Observation-Based Coastal ZoneMonitoring of the Yellow River Delta: Dynamics in China’s Second Largest Oil Producing Region over FourDecades. Appl. Geogr. 2014, 55, 92–107. [CrossRef]
7. Syvitski, J.P.M.; Kettner, A.J.; Overeem, I.; Hutton, E.W.H. Sinking Deltas Due to Human Activities. Nat. Geosci.2009, 2, 681–686. [CrossRef]
8. Giosan, L.; Syvitski, J.; Is, S.C.; Day, J. Protect the World’s Deltas. Nature 2014, 516, 31–33. [CrossRef][PubMed]
9. Kuenzer, C.; Tuan, V.Q. Assessing the Ecosystem Services Value of Can Gio Mangrove Biosphere Reserve:Combining Earth-Observation- and Household-Survey-Based Analyses. Appl. Geogr. 2013, 45, 167–184.[CrossRef]
10. Kuenzer, C.; Campbell, I.; Roch, M.; Leinenkugel, P.; Vo, T.; Dech, S. Understanding the Impacts ofHydropower Developments in the Context of Upstream–Downstream Relations in the Mekong River Basin.Sustain. Sci. 2013, 8, 565–584. [CrossRef]
11. Saito, Y.; Chaimanee, N.; Jarupongsakul, T.; Syvitski, J. Shrinking Megadeltas in Asia: Sea-Level Rise andSediment Reduction Impacts from Case Study of the Chao Phraya Delta. LOICZ Inprint 2007, 2007, 3–9.
12. Kuenzer, C.; Klein, I.; Ullmann, T.; Georgiou, E.; Baumhauer, R.; Dech, S. Remote Sensing of River DeltaInundation: Exploiting the Potential of Coarse Spatial Resolution, Temporally-Dense MODIS Time Series.Remote Sens. 2015, 7, 8516–8542. [CrossRef]
13. Yang, X. Remote Sensing and Geospatial Technologies for Coastal Ecosystem Assessment and Management; Springer:Berlin, Germany, 2009.
14. Foufoula-Georgiou, E.; Syvitski, J.; Paola, C.; Hoanh, C.T.; Tuong, P.; Vörösmarty, C.; Kremer, H.; Brondizio, E.;Saito, Y.; Twilley, R. International Year of Deltas 2013: A Proposal. EosTrans. Am. Geophys. Union 2011, 92,340–341. [CrossRef]
15. McFadden, L. Governing Coastal Spaces: The Case of Disappearing Science in Integrated Coastal ZoneManagement. Coast. Manag. 2007, 35, 429–443. [CrossRef]
16. Renaud, F.G.; Syvitski, J.P.M.; Sebesvari, Z.; Werners, S.E.; Kremer, H.; Kuenzer, C.; Ramesh, R.; Jeuken, A.;Friedrich, J. Tipping from the Holocene to the Anthropocene: How Threatened Are Major World Deltas?Curr. Opin. Environ. Sustain. 2013, 5, 644–654. [CrossRef]
17. Sebesvari, Z.; Renaud, F.; Haas, S.; Tessler, Z.; Kloos, J.; Szabo, S.; Vogt, N.; Tejedor, A.; Brondizio, E.;Kuenzer, C. Vulnerability Indicators for Deltaic Social-Ecological Systems: A Review. Sustain. Sci. 2016, 11,575–590. [CrossRef]
18. Delta Alliance. Available online: www.delta-alliance.org (accessed on 19 July 2019).19. World Estuarine Alliance. Available online: http://www.climatedeltaconference.org/networks/world-
estuarine-alliance (accessed on 19 July 2019).
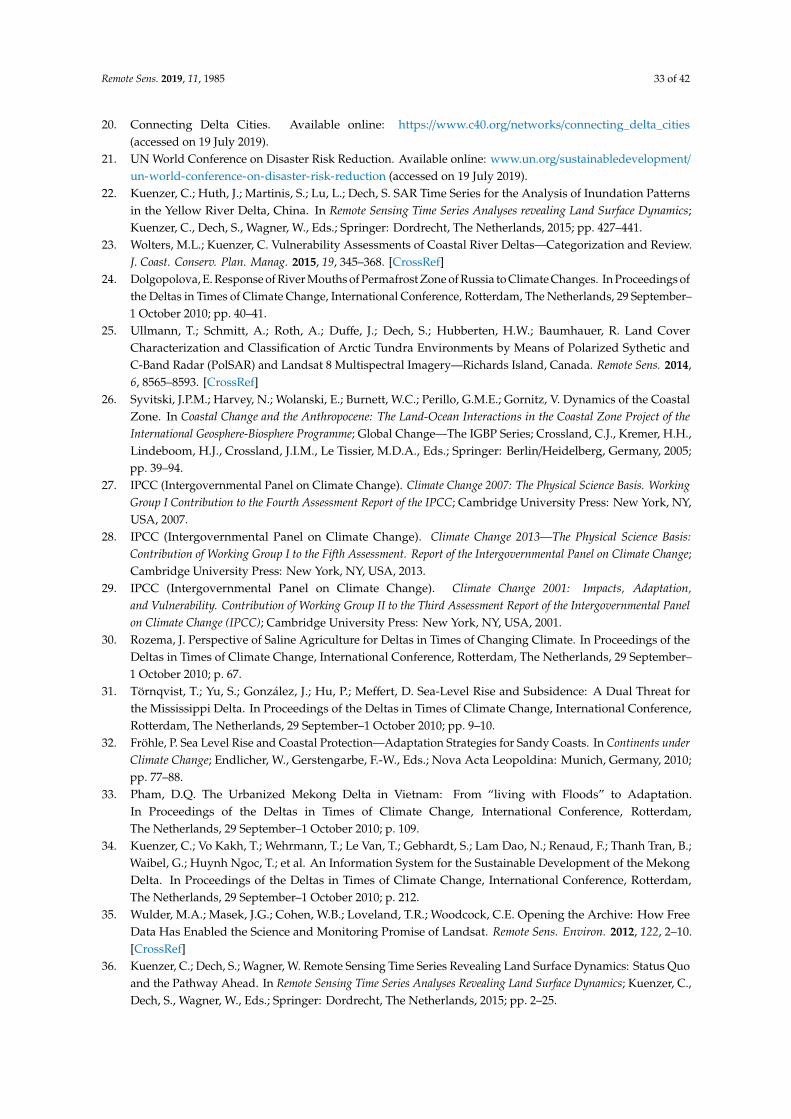
Remote Sens. 2019, 11, 1985 33 of 42
20. Connecting Delta Cities. Available online: https://www.c40.org/networks/connecting_delta_cities(accessed on 19 July 2019).
21. UN World Conference on Disaster Risk Reduction. Available online: www.un.org/sustainabledevelopment/un-world-conference-on-disaster-risk-reduction (accessed on 19 July 2019).
22. Kuenzer, C.; Huth, J.; Martinis, S.; Lu, L.; Dech, S. SAR Time Series for the Analysis of Inundation Patternsin the Yellow River Delta, China. In Remote Sensing Time Series Analyses revealing Land Surface Dynamics;Kuenzer, C., Dech, S., Wagner, W., Eds.; Springer: Dordrecht, The Netherlands, 2015; pp. 427–441.
23. Wolters, M.L.; Kuenzer, C. Vulnerability Assessments of Coastal River Deltas—Categorization and Review.J. Coast. Conserv. Plan. Manag. 2015, 19, 345–368. [CrossRef]
24. Dolgopolova, E. Response of River Mouths of Permafrost Zone of Russia to Climate Changes. In Proceedings ofthe Deltas in Times of Climate Change, International Conference, Rotterdam, The Netherlands, 29 September–1 October 2010; pp. 40–41.
25. Ullmann, T.; Schmitt, A.; Roth, A.; Duffe, J.; Dech, S.; Hubberten, H.W.; Baumhauer, R. Land CoverCharacterization and Classification of Arctic Tundra Environments by Means of Polarized Sythetic andC-Band Radar (PolSAR) and Landsat 8 Multispectral Imagery—Richards Island, Canada. Remote Sens. 2014,6, 8565–8593. [CrossRef]
26. Syvitski, J.P.M.; Harvey, N.; Wolanski, E.; Burnett, W.C.; Perillo, G.M.E.; Gornitz, V. Dynamics of the CoastalZone. In Coastal Change and the Anthropocene: The Land-Ocean Interactions in the Coastal Zone Project of theInternational Geosphere-Biosphere Programme; Global Change—The IGBP Series; Crossland, C.J., Kremer, H.H.,Lindeboom, H.J., Crossland, J.I.M., Le Tissier, M.D.A., Eds.; Springer: Berlin/Heidelberg, Germany, 2005;pp. 39–94.
27. IPCC (Intergovernmental Panel on Climate Change). Climate Change 2007: The Physical Science Basis. WorkingGroup I Contribution to the Fourth Assessment Report of the IPCC; Cambridge University Press: New York, NY,USA, 2007.
28. IPCC (Intergovernmental Panel on Climate Change). Climate Change 2013—The Physical Science Basis:Contribution of Working Group I to the Fifth Assessment. Report of the Intergovernmental Panel on Climate Change;Cambridge University Press: New York, NY, USA, 2013.
29. IPCC (Intergovernmental Panel on Climate Change). Climate Change 2001: Impacts, Adaptation,and Vulnerability. Contribution of Working Group II to the Third Assessment Report of the Intergovernmental Panelon Climate Change (IPCC); Cambridge University Press: New York, NY, USA, 2001.
30. Rozema, J. Perspective of Saline Agriculture for Deltas in Times of Changing Climate. In Proceedings of theDeltas in Times of Climate Change, International Conference, Rotterdam, The Netherlands, 29 September–1 October 2010; p. 67.
31. Törnqvist, T.; Yu, S.; González, J.; Hu, P.; Meffert, D. Sea-Level Rise and Subsidence: A Dual Threat forthe Mississippi Delta. In Proceedings of the Deltas in Times of Climate Change, International Conference,Rotterdam, The Netherlands, 29 September–1 October 2010; pp. 9–10.
32. Fröhle, P. Sea Level Rise and Coastal Protection—Adaptation Strategies for Sandy Coasts. In Continents underClimate Change; Endlicher, W., Gerstengarbe, F.-W., Eds.; Nova Acta Leopoldina: Munich, Germany, 2010;pp. 77–88.
33. Pham, D.Q. The Urbanized Mekong Delta in Vietnam: From “living with Floods” to Adaptation.In Proceedings of the Deltas in Times of Climate Change, International Conference, Rotterdam,The Netherlands, 29 September–1 October 2010; p. 109.
34. Kuenzer, C.; Vo Kakh, T.; Wehrmann, T.; Le Van, T.; Gebhardt, S.; Lam Dao, N.; Renaud, F.; Thanh Tran, B.;Waibel, G.; Huynh Ngoc, T.; et al. An Information System for the Sustainable Development of the MekongDelta. In Proceedings of the Deltas in Times of Climate Change, International Conference, Rotterdam,The Netherlands, 29 September–1 October 2010; p. 212.
35. Wulder, M.A.; Masek, J.G.; Cohen, W.B.; Loveland, T.R.; Woodcock, C.E. Opening the Archive: How FreeData Has Enabled the Science and Monitoring Promise of Landsat. Remote Sens. Environ. 2012, 122, 2–10.[CrossRef]
36. Kuenzer, C.; Dech, S.; Wagner, W. Remote Sensing Time Series Revealing Land Surface Dynamics: Status Quoand the Pathway Ahead. In Remote Sensing Time Series Analyses Revealing Land Surface Dynamics; Kuenzer, C.,Dech, S., Wagner, W., Eds.; Springer: Dordrecht, The Netherlands, 2015; pp. 2–25.
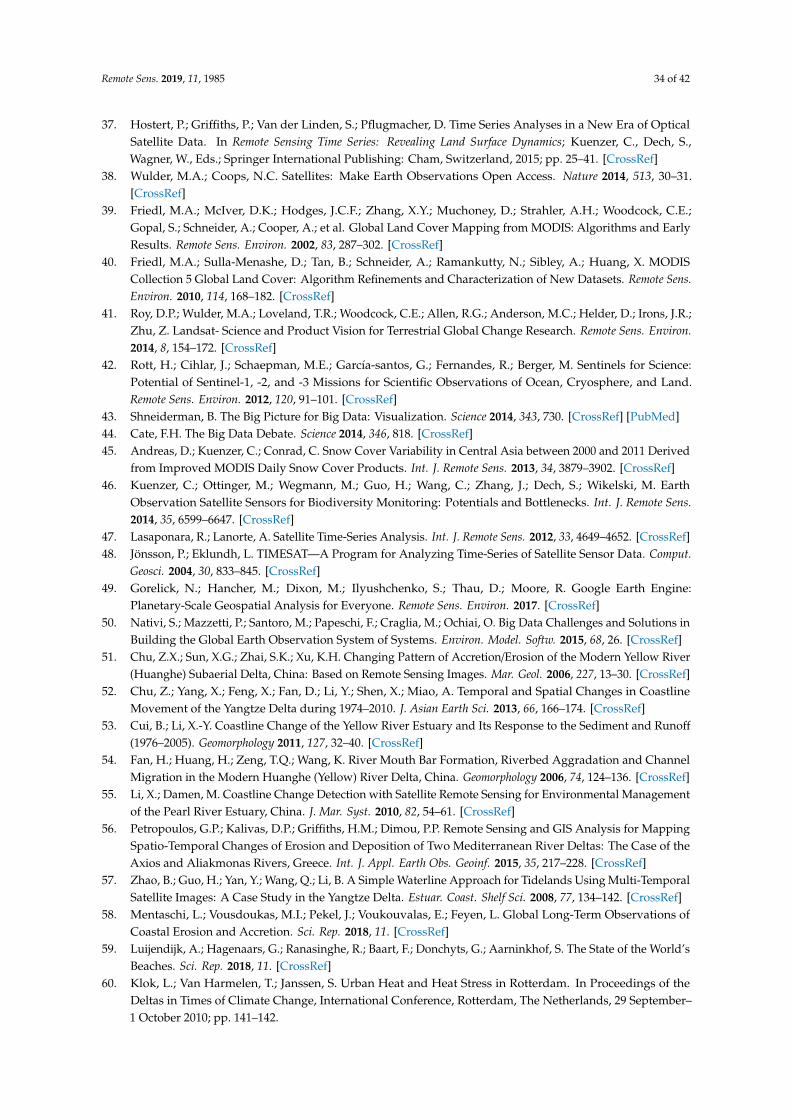
Remote Sens. 2019, 11, 1985 34 of 42
37. Hostert, P.; Griffiths, P.; Van der Linden, S.; Pflugmacher, D. Time Series Analyses in a New Era of OpticalSatellite Data. In Remote Sensing Time Series: Revealing Land Surface Dynamics; Kuenzer, C., Dech, S.,Wagner, W., Eds.; Springer International Publishing: Cham, Switzerland, 2015; pp. 25–41. [CrossRef]
38. Wulder, M.A.; Coops, N.C. Satellites: Make Earth Observations Open Access. Nature 2014, 513, 30–31.[CrossRef]
39. Friedl, M.A.; McIver, D.K.; Hodges, J.C.F.; Zhang, X.Y.; Muchoney, D.; Strahler, A.H.; Woodcock, C.E.;Gopal, S.; Schneider, A.; Cooper, A.; et al. Global Land Cover Mapping from MODIS: Algorithms and EarlyResults. Remote Sens. Environ. 2002, 83, 287–302. [CrossRef]
40. Friedl, M.A.; Sulla-Menashe, D.; Tan, B.; Schneider, A.; Ramankutty, N.; Sibley, A.; Huang, X. MODISCollection 5 Global Land Cover: Algorithm Refinements and Characterization of New Datasets. Remote Sens.Environ. 2010, 114, 168–182. [CrossRef]
41. Roy, D.P.; Wulder, M.A.; Loveland, T.R.; Woodcock, C.E.; Allen, R.G.; Anderson, M.C.; Helder, D.; Irons, J.R.;Zhu, Z. Landsat- Science and Product Vision for Terrestrial Global Change Research. Remote Sens. Environ.2014, 8, 154–172. [CrossRef]
42. Rott, H.; Cihlar, J.; Schaepman, M.E.; García-santos, G.; Fernandes, R.; Berger, M. Sentinels for Science:Potential of Sentinel-1, -2, and -3 Missions for Scientific Observations of Ocean, Cryosphere, and Land.Remote Sens. Environ. 2012, 120, 91–101. [CrossRef]
43. Shneiderman, B. The Big Picture for Big Data: Visualization. Science 2014, 343, 730. [CrossRef] [PubMed]44. Cate, F.H. The Big Data Debate. Science 2014, 346, 818. [CrossRef]45. Andreas, D.; Kuenzer, C.; Conrad, C. Snow Cover Variability in Central Asia between 2000 and 2011 Derived
from Improved MODIS Daily Snow Cover Products. Int. J. Remote Sens. 2013, 34, 3879–3902. [CrossRef]46. Kuenzer, C.; Ottinger, M.; Wegmann, M.; Guo, H.; Wang, C.; Zhang, J.; Dech, S.; Wikelski, M. Earth
Observation Satellite Sensors for Biodiversity Monitoring: Potentials and Bottlenecks. Int. J. Remote Sens.2014, 35, 6599–6647. [CrossRef]
47. Lasaponara, R.; Lanorte, A. Satellite Time-Series Analysis. Int. J. Remote Sens. 2012, 33, 4649–4652. [CrossRef]48. Jönsson, P.; Eklundh, L. TIMESAT—A Program for Analyzing Time-Series of Satellite Sensor Data. Comput.
Geosci. 2004, 30, 833–845. [CrossRef]49. Gorelick, N.; Hancher, M.; Dixon, M.; Ilyushchenko, S.; Thau, D.; Moore, R. Google Earth Engine:
Planetary-Scale Geospatial Analysis for Everyone. Remote Sens. Environ. 2017. [CrossRef]50. Nativi, S.; Mazzetti, P.; Santoro, M.; Papeschi, F.; Craglia, M.; Ochiai, O. Big Data Challenges and Solutions in
Building the Global Earth Observation System of Systems. Environ. Model. Softw. 2015, 68, 26. [CrossRef]51. Chu, Z.X.; Sun, X.G.; Zhai, S.K.; Xu, K.H. Changing Pattern of Accretion/Erosion of the Modern Yellow River
(Huanghe) Subaerial Delta, China: Based on Remote Sensing Images. Mar. Geol. 2006, 227, 13–30. [CrossRef]52. Chu, Z.; Yang, X.; Feng, X.; Fan, D.; Li, Y.; Shen, X.; Miao, A. Temporal and Spatial Changes in Coastline
Movement of the Yangtze Delta during 1974–2010. J. Asian Earth Sci. 2013, 66, 166–174. [CrossRef]53. Cui, B.; Li, X.-Y. Coastline Change of the Yellow River Estuary and Its Response to the Sediment and Runoff
(1976–2005). Geomorphology 2011, 127, 32–40. [CrossRef]54. Fan, H.; Huang, H.; Zeng, T.Q.; Wang, K. River Mouth Bar Formation, Riverbed Aggradation and Channel
Migration in the Modern Huanghe (Yellow) River Delta, China. Geomorphology 2006, 74, 124–136. [CrossRef]55. Li, X.; Damen, M. Coastline Change Detection with Satellite Remote Sensing for Environmental Management
of the Pearl River Estuary, China. J. Mar. Syst. 2010, 82, 54–61. [CrossRef]56. Petropoulos, G.P.; Kalivas, D.P.; Griffiths, H.M.; Dimou, P.P. Remote Sensing and GIS Analysis for Mapping
Spatio-Temporal Changes of Erosion and Deposition of Two Mediterranean River Deltas: The Case of theAxios and Aliakmonas Rivers, Greece. Int. J. Appl. Earth Obs. Geoinf. 2015, 35, 217–228. [CrossRef]
57. Zhao, B.; Guo, H.; Yan, Y.; Wang, Q.; Li, B. A Simple Waterline Approach for Tidelands Using Multi-TemporalSatellite Images: A Case Study in the Yangtze Delta. Estuar. Coast. Shelf Sci. 2008, 77, 134–142. [CrossRef]
58. Mentaschi, L.; Vousdoukas, M.I.; Pekel, J.; Voukouvalas, E.; Feyen, L. Global Long-Term Observations ofCoastal Erosion and Accretion. Sci. Rep. 2018, 11. [CrossRef]
59. Luijendijk, A.; Hagenaars, G.; Ranasinghe, R.; Baart, F.; Donchyts, G.; Aarninkhof, S. The State of the World’sBeaches. Sci. Rep. 2018, 11. [CrossRef]
60. Klok, L.; Van Harmelen, T.; Janssen, S. Urban Heat and Heat Stress in Rotterdam. In Proceedings of theDeltas in Times of Climate Change, International Conference, Rotterdam, The Netherlands, 29 September–1 October 2010; pp. 141–142.
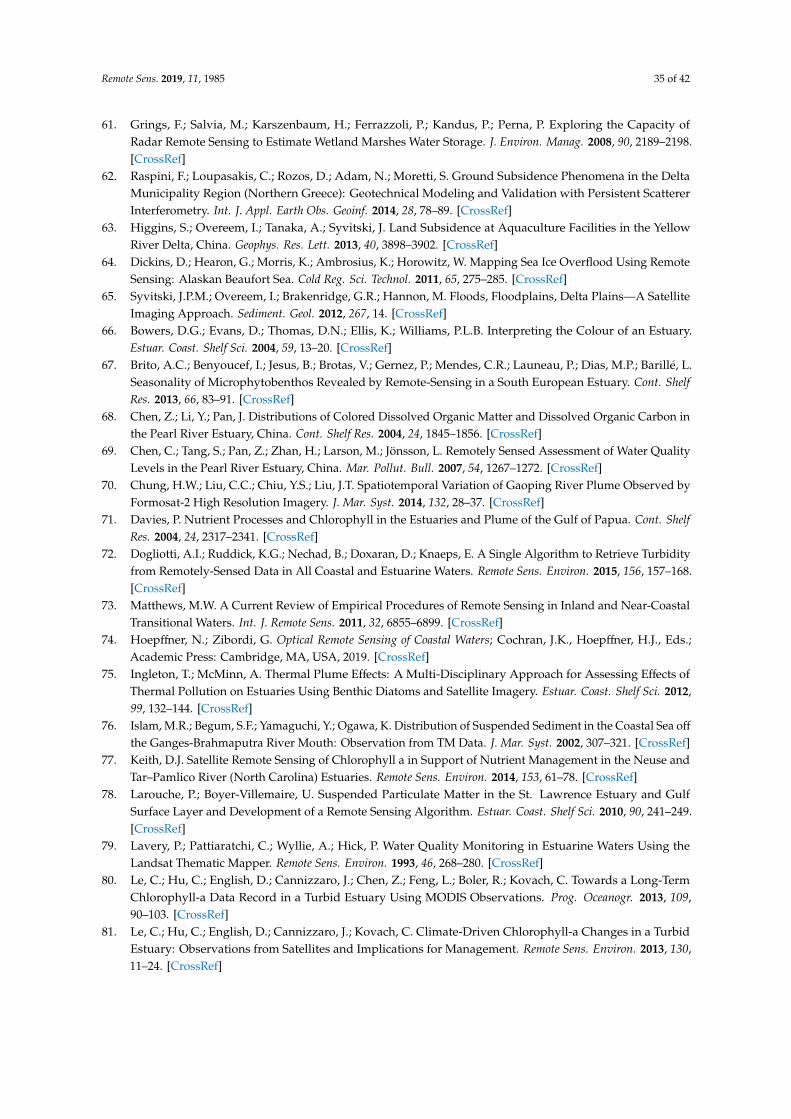
Remote Sens. 2019, 11, 1985 35 of 42
61. Grings, F.; Salvia, M.; Karszenbaum, H.; Ferrazzoli, P.; Kandus, P.; Perna, P. Exploring the Capacity ofRadar Remote Sensing to Estimate Wetland Marshes Water Storage. J. Environ. Manag. 2008, 90, 2189–2198.[CrossRef]
62. Raspini, F.; Loupasakis, C.; Rozos, D.; Adam, N.; Moretti, S. Ground Subsidence Phenomena in the DeltaMunicipality Region (Northern Greece): Geotechnical Modeling and Validation with Persistent ScattererInterferometry. Int. J. Appl. Earth Obs. Geoinf. 2014, 28, 78–89. [CrossRef]
63. Higgins, S.; Overeem, I.; Tanaka, A.; Syvitski, J. Land Subsidence at Aquaculture Facilities in the YellowRiver Delta, China. Geophys. Res. Lett. 2013, 40, 3898–3902. [CrossRef]
64. Dickins, D.; Hearon, G.; Morris, K.; Ambrosius, K.; Horowitz, W. Mapping Sea Ice Overflood Using RemoteSensing: Alaskan Beaufort Sea. Cold Reg. Sci. Technol. 2011, 65, 275–285. [CrossRef]
65. Syvitski, J.P.M.; Overeem, I.; Brakenridge, G.R.; Hannon, M. Floods, Floodplains, Delta Plains—A SatelliteImaging Approach. Sediment. Geol. 2012, 267, 14. [CrossRef]
66. Bowers, D.G.; Evans, D.; Thomas, D.N.; Ellis, K.; Williams, P.L.B. Interpreting the Colour of an Estuary.Estuar. Coast. Shelf Sci. 2004, 59, 13–20. [CrossRef]
67. Brito, A.C.; Benyoucef, I.; Jesus, B.; Brotas, V.; Gernez, P.; Mendes, C.R.; Launeau, P.; Dias, M.P.; Barillé, L.Seasonality of Microphytobenthos Revealed by Remote-Sensing in a South European Estuary. Cont. ShelfRes. 2013, 66, 83–91. [CrossRef]
68. Chen, Z.; Li, Y.; Pan, J. Distributions of Colored Dissolved Organic Matter and Dissolved Organic Carbon inthe Pearl River Estuary, China. Cont. Shelf Res. 2004, 24, 1845–1856. [CrossRef]
69. Chen, C.; Tang, S.; Pan, Z.; Zhan, H.; Larson, M.; Jönsson, L. Remotely Sensed Assessment of Water QualityLevels in the Pearl River Estuary, China. Mar. Pollut. Bull. 2007, 54, 1267–1272. [CrossRef]
70. Chung, H.W.; Liu, C.C.; Chiu, Y.S.; Liu, J.T. Spatiotemporal Variation of Gaoping River Plume Observed byFormosat-2 High Resolution Imagery. J. Mar. Syst. 2014, 132, 28–37. [CrossRef]
71. Davies, P. Nutrient Processes and Chlorophyll in the Estuaries and Plume of the Gulf of Papua. Cont. ShelfRes. 2004, 24, 2317–2341. [CrossRef]
72. Dogliotti, A.I.; Ruddick, K.G.; Nechad, B.; Doxaran, D.; Knaeps, E. A Single Algorithm to Retrieve Turbidityfrom Remotely-Sensed Data in All Coastal and Estuarine Waters. Remote Sens. Environ. 2015, 156, 157–168.[CrossRef]
73. Matthews, M.W. A Current Review of Empirical Procedures of Remote Sensing in Inland and Near-CoastalTransitional Waters. Int. J. Remote Sens. 2011, 32, 6855–6899. [CrossRef]
74. Hoepffner, N.; Zibordi, G. Optical Remote Sensing of Coastal Waters; Cochran, J.K., Hoepffner, H.J., Eds.;Academic Press: Cambridge, MA, USA, 2019. [CrossRef]
75. Ingleton, T.; McMinn, A. Thermal Plume Effects: A Multi-Disciplinary Approach for Assessing Effects ofThermal Pollution on Estuaries Using Benthic Diatoms and Satellite Imagery. Estuar. Coast. Shelf Sci. 2012,99, 132–144. [CrossRef]
76. Islam, M.R.; Begum, S.F.; Yamaguchi, Y.; Ogawa, K. Distribution of Suspended Sediment in the Coastal Sea off
the Ganges-Brahmaputra River Mouth: Observation from TM Data. J. Mar. Syst. 2002, 307–321. [CrossRef]77. Keith, D.J. Satellite Remote Sensing of Chlorophyll a in Support of Nutrient Management in the Neuse and
Tar–Pamlico River (North Carolina) Estuaries. Remote Sens. Environ. 2014, 153, 61–78. [CrossRef]78. Larouche, P.; Boyer-Villemaire, U. Suspended Particulate Matter in the St. Lawrence Estuary and Gulf
Surface Layer and Development of a Remote Sensing Algorithm. Estuar. Coast. Shelf Sci. 2010, 90, 241–249.[CrossRef]
79. Lavery, P.; Pattiaratchi, C.; Wyllie, A.; Hick, P. Water Quality Monitoring in Estuarine Waters Using theLandsat Thematic Mapper. Remote Sens. Environ. 1993, 46, 268–280. [CrossRef]
80. Le, C.; Hu, C.; English, D.; Cannizzaro, J.; Chen, Z.; Feng, L.; Boler, R.; Kovach, C. Towards a Long-TermChlorophyll-a Data Record in a Turbid Estuary Using MODIS Observations. Prog. Oceanogr. 2013, 109,90–103. [CrossRef]
81. Le, C.; Hu, C.; English, D.; Cannizzaro, J.; Kovach, C. Climate-Driven Chlorophyll-a Changes in a TurbidEstuary: Observations from Satellites and Implications for Management. Remote Sens. Environ. 2013, 130,11–24. [CrossRef]
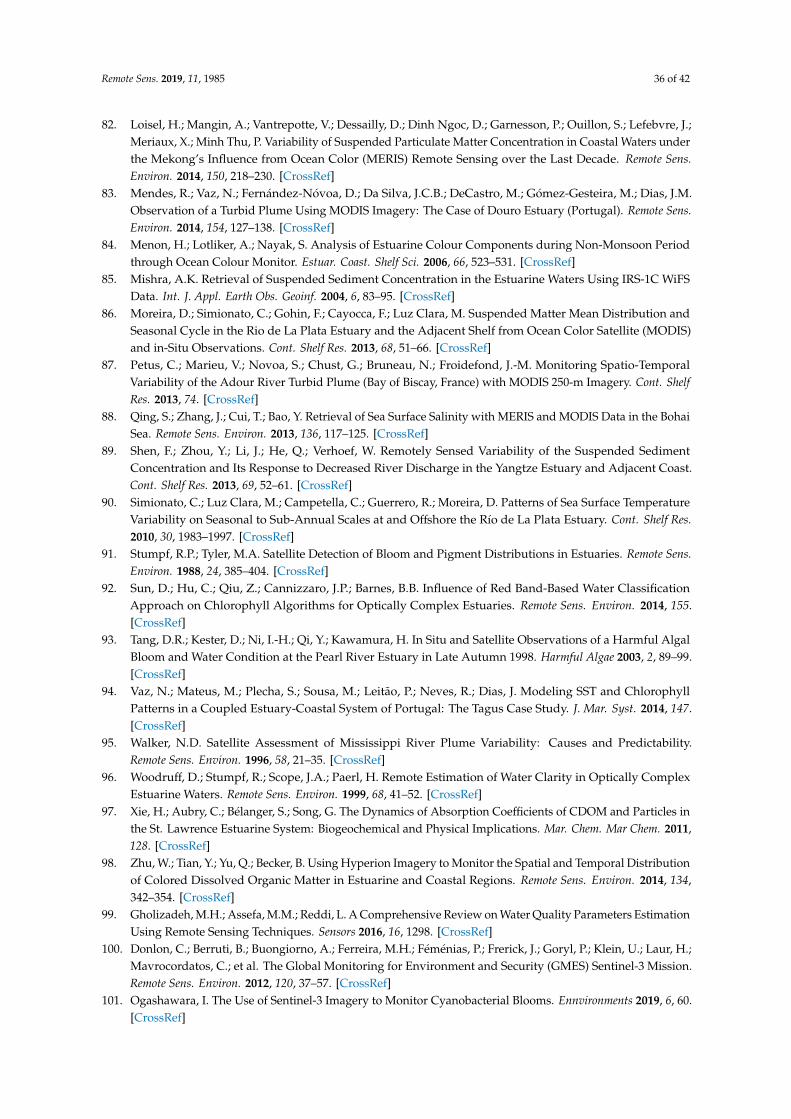
Remote Sens. 2019, 11, 1985 36 of 42
82. Loisel, H.; Mangin, A.; Vantrepotte, V.; Dessailly, D.; Dinh Ngoc, D.; Garnesson, P.; Ouillon, S.; Lefebvre, J.;Meriaux, X.; Minh Thu, P. Variability of Suspended Particulate Matter Concentration in Coastal Waters underthe Mekong’s Influence from Ocean Color (MERIS) Remote Sensing over the Last Decade. Remote Sens.Environ. 2014, 150, 218–230. [CrossRef]
83. Mendes, R.; Vaz, N.; Fernández-Nóvoa, D.; Da Silva, J.C.B.; DeCastro, M.; Gómez-Gesteira, M.; Dias, J.M.Observation of a Turbid Plume Using MODIS Imagery: The Case of Douro Estuary (Portugal). Remote Sens.Environ. 2014, 154, 127–138. [CrossRef]
84. Menon, H.; Lotliker, A.; Nayak, S. Analysis of Estuarine Colour Components during Non-Monsoon Periodthrough Ocean Colour Monitor. Estuar. Coast. Shelf Sci. 2006, 66, 523–531. [CrossRef]
85. Mishra, A.K. Retrieval of Suspended Sediment Concentration in the Estuarine Waters Using IRS-1C WiFSData. Int. J. Appl. Earth Obs. Geoinf. 2004, 6, 83–95. [CrossRef]
86. Moreira, D.; Simionato, C.; Gohin, F.; Cayocca, F.; Luz Clara, M. Suspended Matter Mean Distribution andSeasonal Cycle in the Rio de La Plata Estuary and the Adjacent Shelf from Ocean Color Satellite (MODIS)and in-Situ Observations. Cont. Shelf Res. 2013, 68, 51–66. [CrossRef]
87. Petus, C.; Marieu, V.; Novoa, S.; Chust, G.; Bruneau, N.; Froidefond, J.-M. Monitoring Spatio-TemporalVariability of the Adour River Turbid Plume (Bay of Biscay, France) with MODIS 250-m Imagery. Cont. ShelfRes. 2013, 74. [CrossRef]
88. Qing, S.; Zhang, J.; Cui, T.; Bao, Y. Retrieval of Sea Surface Salinity with MERIS and MODIS Data in the BohaiSea. Remote Sens. Environ. 2013, 136, 117–125. [CrossRef]
89. Shen, F.; Zhou, Y.; Li, J.; He, Q.; Verhoef, W. Remotely Sensed Variability of the Suspended SedimentConcentration and Its Response to Decreased River Discharge in the Yangtze Estuary and Adjacent Coast.Cont. Shelf Res. 2013, 69, 52–61. [CrossRef]
90. Simionato, C.; Luz Clara, M.; Campetella, C.; Guerrero, R.; Moreira, D. Patterns of Sea Surface TemperatureVariability on Seasonal to Sub-Annual Scales at and Offshore the Río de La Plata Estuary. Cont. Shelf Res.2010, 30, 1983–1997. [CrossRef]
91. Stumpf, R.P.; Tyler, M.A. Satellite Detection of Bloom and Pigment Distributions in Estuaries. Remote Sens.Environ. 1988, 24, 385–404. [CrossRef]
92. Sun, D.; Hu, C.; Qiu, Z.; Cannizzaro, J.P.; Barnes, B.B. Influence of Red Band-Based Water ClassificationApproach on Chlorophyll Algorithms for Optically Complex Estuaries. Remote Sens. Environ. 2014, 155.[CrossRef]
93. Tang, D.R.; Kester, D.; Ni, I.-H.; Qi, Y.; Kawamura, H. In Situ and Satellite Observations of a Harmful AlgalBloom and Water Condition at the Pearl River Estuary in Late Autumn 1998. Harmful Algae 2003, 2, 89–99.[CrossRef]
94. Vaz, N.; Mateus, M.; Plecha, S.; Sousa, M.; Leitão, P.; Neves, R.; Dias, J. Modeling SST and ChlorophyllPatterns in a Coupled Estuary-Coastal System of Portugal: The Tagus Case Study. J. Mar. Syst. 2014, 147.[CrossRef]
95. Walker, N.D. Satellite Assessment of Mississippi River Plume Variability: Causes and Predictability.Remote Sens. Environ. 1996, 58, 21–35. [CrossRef]
96. Woodruff, D.; Stumpf, R.; Scope, J.A.; Paerl, H. Remote Estimation of Water Clarity in Optically ComplexEstuarine Waters. Remote Sens. Environ. 1999, 68, 41–52. [CrossRef]
97. Xie, H.; Aubry, C.; Bélanger, S.; Song, G. The Dynamics of Absorption Coefficients of CDOM and Particles inthe St. Lawrence Estuarine System: Biogeochemical and Physical Implications. Mar. Chem. Mar Chem. 2011,128. [CrossRef]
98. Zhu, W.; Tian, Y.; Yu, Q.; Becker, B. Using Hyperion Imagery to Monitor the Spatial and Temporal Distributionof Colored Dissolved Organic Matter in Estuarine and Coastal Regions. Remote Sens. Environ. 2014, 134,342–354. [CrossRef]
99. Gholizadeh, M.H.; Assefa, M.M.; Reddi, L. A Comprehensive Review on Water Quality Parameters EstimationUsing Remote Sensing Techniques. Sensors 2016, 16, 1298. [CrossRef]
100. Donlon, C.; Berruti, B.; Buongiorno, A.; Ferreira, M.H.; Féménias, P.; Frerick, J.; Goryl, P.; Klein, U.; Laur, H.;Mavrocordatos, C.; et al. The Global Monitoring for Environment and Security (GMES) Sentinel-3 Mission.Remote Sens. Environ. 2012, 120, 37–57. [CrossRef]
101. Ogashawara, I. The Use of Sentinel-3 Imagery to Monitor Cyanobacterial Blooms. Ennvironments 2019, 6, 60.[CrossRef]
Remote Sens. 2019, 11, 1985 37 of 42
102. Wang, Q.; Atkinson, P.M. Spatio-Temporal Fusion for Daily Sentinel-2 Images. Remote Sens. Environ. 2018,204, 31–42. [CrossRef]
103. Dibarboure, G.; Pujol, M.I. Improving the Quality of Sentinel-3A Data with a Hybrid Mean Sea SurfaceModel, and Implications for Sentinel-3B and SWOT. Adv. Space Res. 2019. [CrossRef]
104. Long, C.M.; Pavelsky, T.M. Remote Sensing of Suspended Sediment Concentration and HydrologicConnectivity in a Complex Wetland Environment. Remote Sens. Environ. 2013, 129, 197–209. [CrossRef]
105. Doxaran, D.; Froidefond, J.-M.; Castaing, P.; Babin, M. Dynamics of the Turbidity Maximum Zone in aMacrotidal Estuary (the Gironde, France): Observations from Field and MODIS Satellite Data. Estuar. Coast.Shelf Sci. 2009, 81, 321–332. [CrossRef]
106. Zhang, M.; Dong, Q.; Cui, T.; Xue, C.; Zhang, S. Suspended Sediment Monitoring and Assessment for YellowRiver Estuary from Landsat TM and ETM+ Imagery. Remote Sens. Environ. 2014, 146, 136–147. [CrossRef]
107. Doron, M.; Bélanger, S.; Doxaran, D.; Babin, M. Spectral Variations in the Near-Infrared Ocean Reflectance.Remote Sens. Environ. 2011, 115, 1617–1631. [CrossRef]
108. Güttler, F.N.; Niculescu, S.; Gohin, F. Turbidity Retrieval and Monitoring of Danube Delta Waters UsingMulti-Sensor Optical Remote Sensing Data: An Integrated View from the Delta Plain Lakes to theWestern–northwestern Black Sea Coastal Zone. Remote Sens. Environ. 2013, 132, 86–101. [CrossRef]
109. Froidefond, J.-M.; Castaing, P.; Mirmand, M.; Ruch, P. Analysis of the Turbid Plume of the Gironde (France)Based on SPOT Radiometric Data. Remote Sens. Environ. 1991, 36, 149–163. [CrossRef]
110. Wei, G.; Tang, D.; Wang, S. Distribution of Chlorophyll and Harmful Algal Blooms (HABs): A Review onSpace Based Studies in the Coastal Environments of Chinese Marginal Seas. Adv. Space Res. 2008, 41, 12–19.[CrossRef]
111. Aurin, D.A.; Dierssen, H.M. Advantages and Limitations of Ocean Color Remote Sensing inCDOM-Dominated, Mineral-Rich Coastal and Estuarine Waters. Remote Sens. Environ. 2012, 125, 181–197.[CrossRef]
112. Gohin, F.; Saulquin, B.; Oger-Jeanneret, H.; Lozach, L.; Lampert, L.; Alain, L.; Riou, P.; Bruchon, F. Towardsa Better Assessment of the Ecological Status of Coastal Waters Using Satellite-Derived Chlorophyll-aConcentrations. Remote Sens. Environ. 2008, 112, 3329–3340. [CrossRef]
113. Shanmugam, P.; Ahn, Y.-H.; Ram, P.S. SeaWiFS Sensing of Hazardous Algal Blooms and Their UnderlyingMechanisms in Shelf-Slope Waters of the Northwest Pacific during Summer. Remote Sens. Environ. 2008, 112,3248–3270. [CrossRef]
114. Mustard, J.F.; Carney, M.A.; Sen, A. The Use of Satellite Data to Quantify Thermal Effluent Impacts. Estuar.Coast. Shelf Sci. 1999, 49, 509–524. [CrossRef]
115. He, L.; Li, G.; Li, K.; Shu, Y. Estimation of Regional Sea Level Change in the Pearl River Delta from TideGauge and Satellite Altimetry Data. Estuar. Coast. Shelf Sci. 2014, 141, 69–77. [CrossRef]
116. Kouraev, A.V.; Zakharova, E.A.; Samain, O.; Mognard, N.M.; Cazenave, A. Ob’River Discharge fromTOPEX/Poseidon Satellite Altimetry (1992–2002). Remote Sens. Environ. 2004, 93, 238–245. [CrossRef]
117. Kuo, C.Y. Determination and Characterization of the 20th Century Global Sea Level Rise; Geodetic Scienceand Surveying, Report. No. 478; Ohio State University: Columbus, OH, USA, 2006; Available online:http://hdl.handle.net/1811/78643 (accessed on 22 August 2019).
118. Laiz, I.; Gómez-Enri, J.; Tejedor, B.; Aboitiz, A.; Villares, P. Seasonal Sea Level Variations in the Gulf ofCadiz Continental Shelf from In-Situ Measurements and Satellite Altimetry. Cont. Shelf Res. 2013, 53, 77–88.[CrossRef]
119. Nerem, R.S.; Beckley, B.D.; Fasullo, J.T.; Hamlington, B.D.; Masters, D.; Mitchum, G.T. Climate-Change–drivenAccelerated Sea-Level Rise Detected in the Altimeter Era. Proc. Natl. Acad. Sci. USA 2018. [CrossRef][PubMed]
120. Lehner, S.; Schulz-Stellenfleth, J.; Niedermeier, A.; Horstmann, J.; Rosenthal, W.; In, B.L. Extreme WavesObserved by Synthetic Aperture Radar. In Ocean Wave Measurement and Analysis; Edge, B.L., Hemsley, J.M.,Eds.; American Society of Civil Engineers: Reston, VA, USA, 2002; pp. 125–134.
121. Lehner, S.; Hoja, D.; Schulz-Stellenfleth, J. Marine Parameters from Synergy of Optical and Radar SatelliteData. Adv. Space Res. 2002, 29, 23–32. [CrossRef]
122. Akbor, S.; Hossain, F.; Lee, H.; Shum, C.K. Inter-Comparison Study of Water Level Estimates Derived fromHydrodynamic–Hydrologic Model and Satellite Altimetry for a Complex Deltaic Environment. Remote Sens.Environ. 2011, 115. [CrossRef]
Remote Sens. 2019, 11, 1985 38 of 42
123. Trisirisatayawong, I.; Naeije, M.; Simons, W.; Fenoglio-Marc, L. Sea Level Change in the Gulf of Thailandfrom GPS-Corrected Tide Gauge Data and Multi-Satellite Altimetry. Glob. Planet. Chang. 2011, 76, 137–151.[CrossRef]
124. Bouvet, A.; Le Toan, T. ENVISAT/ASAR Wide-Swath Data for Timely Rice Fields Mapping in the MekongRiver Delta. Remote Sens. Environ. 2011, 115, 1090–1101. [CrossRef]
125. Brix, H.; Ye, S.; Laws, E.A.; Sun, D.; Li, G.; Ding, X.; Yuan, H.; Zhao, G.; Wang, J.; Pei, S. Large-ScaleManagement of Common Reed, Phragmites Australis, for Paper Production: A Case Study from the LiaoheDelta, China. Ecol. Eng. 2014, 73, 760–769. [CrossRef]
126. Dipson, P.T.; Chithra, S.V.; Amarnath, A.; Smitha, S.V.; Harindranathan Nair, M.V.; Shahin, A. Spatial Changesof Estuary in Ernakulam District, Southern India for Last Seven Decades, Using Multi-Temporal SatelliteData. J. Environ. Manag. 2014, 148, 134–142. [CrossRef] [PubMed]
127. Fromard, F.; Vega, C.; Proisy, C. Half a Century of Dynamic Coastal Change Affecting Mangrove Shorelinesof French Guiana. A Case Study Based on Remote Sensing Data Analyses and Field Surveys. Mar. Geol.2004, 208, 265–280. [CrossRef]
128. Gao, Z.; Zhang, L. Multi-Seasonal Spectral Characteristics Analysis of Coastal Salt Marsh Vegetation inShanghai, China. Estuar. Coast. Shelf Sci. 2006, 69, 217–224. [CrossRef]
129. Kaufmann, R.; Seto, K.C. Change Detection, Accuracy, and Bias in a Sequential Analysis of Landsat Imageryin the Pearl River Delta, China: Econometric Techniques. Agric. Ecosyst. Environ. 2001, 85, 95–105. [CrossRef]
130. Lagomasino, D.; Price, R.M.; Whitman, D.; Campbell, P.K.E.; Melesse, A. Estimating Major Ion and NutrientConcentrations in Mangrove Estuaries in Everglades National Park Using Leaf and Satellite Reflectance.Remote Sens. Environ. 2014, 154, 202–218. [CrossRef]
131. Lee, T.-M.; Yeh, H.-C. Applying Remote Sensing Techniques to Monitor Shifting Wetland Vegetation: A CaseStudy of Danshui River Estuary Mangrove Communities, Taiwan. Ecol. Eng. 2009, 35, 487–496. [CrossRef]
132. Lo, C.P. LANDSAT Images as a Tool in Regional Analysis: The Example of Chu Chiang (Pearl River) Delta inSouth China. Geoforum 1977, 8, 79–87. [CrossRef]
133. Nagler, P.L.; Glenn, E.P.; Huete, A.R. Assessment of Spectral Vegetation Indices for Riparian Vegetation inthe Colorado River Delta, Mexico. J. Arid Environ. 2001, 49, 91–110. [CrossRef]
134. Rakotomavo, A.; Fromard, F. Dynamics of Mangrove Forests in the Mangoky River Delta, Madagascar, underthe Influence of Natural and Human Factors. Ecol. Manag. 2010, 259, 1161–1169. [CrossRef]
135. Santos, L.; Reis Matos, H.; Schaeffer-Novelli, Y.; Cunha-Lignon, M.; Bitencourt, M.; Koedam, N.;Dahdouh-Guebas, F. Anthropogenic Activities on Mangrove Areas (São Francisco River Estuary, BrazilNortheast): A GIS-Based Analysis of CBERS and SPOT Images to Aid in Local Management. Ocean Coast.Manag. 2014, 89, 39–50. [CrossRef]
136. Son, N.T.; Chen, C.F.; Chen, C.R.; Chang, L.Y. Satellite-Based Investigation of Flood-Affected Rice CultivationAreas in Chao Phraya River Delta, Thailand. ISPRS J. Photogramm. Remote Sens. 2013, 86, 77–88. [CrossRef]
137. Ulrich, M.; Grosse, G.; Chabrillat, S.; Schirrmeister, L. Spectral Characterization of Periglacial Surfaces andGeomorphological Units in the Arctic Lena Delta Using Field Spectrometry and Remote Sensing. Remote Sens.Environ. 2009, 113, 1220–1235. [CrossRef]
138. Zhao, B.; Yan, Y.; Guo, H.; He, M.; Gu, Y.; Li, B. Monitoring Rapid Vegetation Succession in Estuarine WetlandUsing Time Series MODIS-Based Indicators: An Application in the Yangtze River Delta Area. Ecol. Indic.2009, 346–356. [CrossRef]
139. Lymburner, L.; Bunting, P.; Lucas, R.; Scarth, P.; Alam, I.; Phillips, C.; Ticehurst, C.; Held, A. Mappingthe Multi-Decadal Mangrove Dynamics of the Australian Coastline. Remote Sens. Environ. 2019, 111185.[CrossRef]
140. Syvitski, J.P.M.; Kettner, A.J.; Society, A. Sediment Flux in the Anthropocene. Philos. Trans. R. 2011, 369,957–975. [CrossRef]
141. Kummu, M.; Lu, X.X.; Rasphone, A.; Sarkkula, J.; Koponen, J. Riverbank Changes along the Mekong River:Remote Sensing Detection in the Vientiane–Nong Khai Area. Quat. Int. 2008, 186, 100–112. [CrossRef]
142. Yang, X.; Damen, M.C.J.; Van Zuidam, R.A. Satellite Remote Sensing and GIS for the Analysis of ChannelMigration Changes in the Active Yellow River Delta, China. Int. J. Appl. Earth Obs. Geoinf. 1999, 1, 146–157.[CrossRef]
143. Liu, Y.; Huang, H.; Qiu, Z.; Fan, J. Detecting Coastline Change from Satellite Images Based on Beach SlopeEstimation in a Tidal Flat. Int. J. Appl. Earth Obs. Geoinf. 2013, 23, 165–176. [CrossRef]
Remote Sens. 2019, 11, 1985 39 of 42
144. Yang, C.-S.; Ouchi, K. Analysis of Bar Morphology Using Multi-Temporal and Multi-Sensor Satellite Images:Example from the Han Estuary, Korea. Mar. Geol. 2013, 311–314, 17–31. [CrossRef]
145. Ghoneim, E.; Mashaly, J.; Gamble, D.; Halls, J.; AbuBakr, M. Nile Delta Exhibited a Spatial Reversal inthe Rates of Shoreline Retreat on the Rosetta Promontory Comparing Pre- and Post-Beach Protection.Geomorphology 2015, 228, 14. [CrossRef]
146. Gens, R. Remote Sensing of Coastlines: Detection, Extraction and Monitoring. Int. J. Remote Sens. 2010, 31,1819–1836. [CrossRef]
147. Shoreline Monitor. Available online: http://shorelinemonitor.deltares.nl (accessed on 19 July 2019).148. Ezcurra, E.; Barrios, E.; Ezcurra, P.; Ezcurra, A.; Vanderplank, S.; Vidal, O. A Natural Experiment Reveals the
Impact of Hydroelectric Dams on the Estuaries of Tropical Rivers. Sci. Adv. 2019, 5. [CrossRef] [PubMed]149. Murray, N.J.; Phinn, S.R.; DeWitt, M.; Ferrari, R.; Johnston, R.; Lyons, M.B.; Clinton, N.; Thau, D.; Fuller, R.A.
The Global Distribution and Trajectory of Tidal Flats. Nature 2019, 565, 222–225. [CrossRef] [PubMed]150. Global Intertidal Change. Available online: https://www.intertidal.app/ (accessed on 19 July 2019).151. Bishop-Taylor, R.; Sagar, S.; Lymburner, L.; Beaman, R.J. Between the Tides: Modelling the Elevation of
Australia’s Exposed Intertidal Zone at Continental Scale. Estuar. Coast. Shelf Sci. 2019, 223, 115–128.[CrossRef]
152. Pardo-Pascual, J.E.; Elena, S.; Almonacid-Caballer, J. Assessing the Accuracy of Automatically ExtractedShorelines on Microtidal Beaches from Landsat 7, Landsat 8 and Sentinel-2 Imagery. Remote Sens. 2018, 10,326. [CrossRef]
153. Hagenaars, G.; De Vries, S.; Luijendijk, A.P.; De Boer, W.P. On the Accuracy of Automated Shoreline DetectionDerived from Satellite Imagery: A Case Study of the Sand Motor Mega-Scale Nourishment. Coast. Eng. 2018,133, 113–125. [CrossRef]
154. Vos, K.; Harley, M.D.; Splinter, K.D.; Simmons, J.A.; Turner, I.L. Sub-Annual to Multi-Decadal ShorelineVariability from Publicly Available Satellite Imagery. Coast. Eng. 2019, 150, 160–174. [CrossRef]
155. Stern, N. The Economics of Climate Change: The Stern Review; Cambridge University Press: Cambridge, UK,2007. [CrossRef]
156. Kuenzer, C.; Guo, H.; Huth, J.; Leinenkugel, P.; Li, X.; Dech, S. Flood Mapping and Flood Dynamics of theMekong Delta: ENVISAT-ASAR-WSM Based Time Series Analyses. Remote Sens. 2013, 5, 687–715. [CrossRef]
157. Kuenzer, C.; Guo, H.; Schlegel, I.; Tuan, V.Q.; Li, X.; Dech, S. Varying Scale and Capability of EnvisatASAR-WSM, TerraSAR-X Scansar and TerraSAR-X Stripmap Data to Assess Urban Flood Situations: A CaseStudy of the Mekong Delta in Can Tho Province. Remote Sens. 2013, 5, 5122–5142. [CrossRef]
158. Huang, C.; Chen, Y.; Zhang, S.; Wu, J. Detecting, Extracting and Monitoring Surface Water from Space UsingOptical Sensors—A Review. Rev. Geophys. 2018, 1–28. [CrossRef]
159. Werle, D.; Martin, T.C.; Hasan, K. Flood and Coastal Zone Monitoring in Bangladesh with Radarsat ScanSAR:Technical Experience and Institutional Challenges. John Hopkins Dig. 2001, 21, 148–154.
160. Henry, J.-B.; Chastanet, P.; Fellah, K.; Desnos, Y.L. Envisat Multi-Polarized ASAR Data for Flood Mapping.Int. J. Remote Sens. 2006, 27, 1921–1929. [CrossRef]
161. Lian, L.; Jianfei, C. Spatial-Temporal Change Analysis of Water Area in Pearl River Delta Based on RemoteSensing Technology. Procedia Environ. Sci. 2011, 10, 2170–2175. [CrossRef]
162. Mason, D.C.; Speck, R.; Devereux, B.; Schumann, G.; Neal, J.; Bates, P.D. Flood Detection in Urban AreasUsing TerraSAR-X. IEEE Trans. Geosci. Remote Sens. 2010, 48, 882–894. [CrossRef]
163. Martinis, S.; Kuenzer, C.; Wendleder, A.; Huth, J.; Twele, A.; Roth, A.; Dech, S. Comparing Four OperationalSAR-Based Water and Flood Detection Approaches. Int. J. Remote Sens. 2015, 36, 3519–3543. [CrossRef]
164. Sakamoto, T.; Van Nguyen, N.; Kotera, A.; Ohno, H.; Ishitsuka, N.; Yokozawa, M. Detecting TemporalChanges in the Extent of Annual Flooding within the Cambodia and the Vietnamese Mekong Delta fromMODIS Time-Series Imagery. Remote Sens. Environ. 2007, 109, 295–313. [CrossRef]
165. Schumann, G.J.; Moller, D.K. Microwave Remote Sensing of Flood Inundation. Phys. Chem. Earth 2015,83–84, 84–95. [CrossRef]
166. Shen, X.; Wang, D.; Mao, K.; Anagnostou, E.; Hong, Y. Inundation Extent Mapping by Synthetic ApertureRadar: A Review. Remote Sens. 2019, 11, 879. [CrossRef]
167. Eodc Eomex+ Sentinel Coverage Maps. Available online: https://eomex.eodc.eu/cm#s2a_prd_msil1c(accessed on 19 July 2019).
Remote Sens. 2019, 11, 1985 40 of 42
168. Chini, M.; Pelich, R.; Pulvirenti, L.; Pierdicca, N.; Hostache, R.; Matgen, P. Sentinel-1 InSAR Coherence toDetect Floodwater in Urban Areas: Houston and Hurricane Harvey as A Test Case. Remote Sens. 2019, 11,107. [CrossRef]
169. Shen, X.; Anagnostou, E.N.; Allen, G.H.; Robert Brakenridge, G.; Kettner, A.J. Near-Real-Time Non-ObstructedFlood Inundation Mapping Using Synthetic Aperture Radar. Remote Sens. Environ. 2019, 221, 302–315.[CrossRef]
170. Wang, X.; Ling, F.; Yao, H.; Liu, Y.; Xu, S. Unsupervised Sub-Pixel Water Body Mapping with Sentinel-3 OLCIImage. Remote Sens. 2019, 11, 327. [CrossRef]
171. Ottinger, M.; Clauss, K.; Kuenzer, C. Large-Scale Assessment of Coastal Aquaculture Ponds with Sentinel-1Time Series Data. Remote Sens. 2017, 9, 440. [CrossRef]
172. Ottinger, M.; Clauss, K.; Kuenzer, C. Opportunities and Challenges for the Estimation of AquacultureProduction Based on Earth Observation Data. Remote Sens. 2018, 10, 1076. [CrossRef]
173. Kuenzer, C.; Leinenkugel, P.; Vollmuth, M.; Dech, S. Comparing Global Land-Cover Products—Implicationsfor Geoscience Applications: An Investigation for the Trans-Boundary Mekong Basin. Int. J. Remote Sens.2014, 35, 2752–2779. [CrossRef]
174. Esch, T.; Bachofer, F.; Heldens, W.; Hirner, A.; Marconcini, M.; Palacios-Lopez, D.; Roth, A.; üreyen, S.;Zeidler, J.; Dech, S.; et al. Where We Live-A Summary of the Achievements and Planned Evolution of theGlobal Urban Footprint. Remote Sens. 2018, 10, 895. [CrossRef]
175. Esch, T.; Heldens, W.; Hirner, A.; Keil, M.; Marconcini, M.; Roth, A.; Zeidler, J.; Dech, S.; Strano, E. BreakingNew Ground in Mapping Human Settlements from Space—The Global Urban Footprint. ISPRS J. Photogramm.Remote Sens. 2017, 134, 30–42. [CrossRef]
176. Pesaresi, M.; Ehrlich, D.; Ferri, S.; Florczyk, A.J.; Freire, S.; Halkia, M.; Julea, A.; Kemper, T.; Soille, P.; Syrris, V.Operating Procedure for the Production of the Global Human Settlement Layer from Landsat Data of the Epochs 1975,1990, 2000, and 2014; Publications Office of the European Union: Ispra, Italy, 2016. [CrossRef]
177. Liu, X.; Hu, G.; Chen, Y.; Li, X.; Xu, X.; Li, S.; Pei, F.; Wang, S. High-Resolution Multi-Temporal Mapping ofGlobal Urban Land Using Landsat Images Based on the Google Earth Engine Platform. Remote Sens. Environ.2018, 209, 227–239. [CrossRef]
178. Sun, Z.; Xu, R.; Du, W.; Wang, L.; Lu, D. High-Resolution Urban Land Mapping in China from Sentinel 1A/2Imagery Based on Google Earth Engine. Remote Sens. 2019, 11, 752. [CrossRef]
179. ESA Thematic Exploitation Platform—Urban. Available online: https://urban-tep.eu/#! (accessed on23 July 2019).
180. Laba, M.; Blair, B.; Downs, R.; Monger, B.; Philpot, W.; Smith, S.; Sullivan, P.; Baveye, P.C. Use of TexturalMeasurements to Map Invasive Wetland Plants in the Hudson River National Estuarine Research Reservewith IKONOS Satellite Imagery. Remote Sens. Environ. 2010, 114, 876–886. [CrossRef]
181. Hestir, E.L.; Khanna, S.; Andrew, M.E.; Santos, M.J.; Viers, J.H.; Greenberg, J.A.; Rajapakse, S.S.; Ustin, S.L.Identification of Invasive Vegetation Using Hyperspectral Remote Sensing in the California Delta Ecosystem.Remote Sens. Environ. 2008, 112, 4034–4047. [CrossRef]
182. Zhang, W.; Zeng, C.; Tong, C.; Zhang, Z.; Huang, J. Analysis of the Expanding Process of the SpartinaAlterniflora Salt Marsh in Shanyutan Estuary by Remote Sensing. Procedia Environ. Sci. 2011, 10, 2472–2477.[CrossRef]
183. Kuenzer, C.; Bluemel, A.; Gebhardt, S.; Vo, T.; Dech, S. Remote Sensing of Mangrove Ecosystems: A Review.Remote Sens. 2011, 3, 878–928. [CrossRef]
184. Vo, T.; Kuenzer, C.; Oppelt, N. How Remote Sensing Supports Mangrove Ecosystem Service Valuation:A Case Study in Ca Mau Province, Vietnam. Ecosyst. Serv. 2015, 14, 64–75.
185. Wang, L.; Jia, M.; Yin, D.; Tian, J. A Review of Remote Sensing for Mangrove Forests: 1956–2018. Remote SensEnviron. 2019, 231. [CrossRef]
186. Ottinger, M.; Kuenzer, C.; Liu, G.; Wang, S.; Dech, S. Monitoring Land Cover Dynamics in the Yellow RiverDelta from 1995 to 2010 Based on Landsat 5 TM. Appl. Geogr. 2013, 44, 53–68. [CrossRef]
187. Leinenkugel, P.; Kuenzer, C.; Oppelt, N.; Dech, S. Characterisation of Land Surface Phenology and LandCover Based on Moderate Resolution Satellite Data in Cloud Prone Areas—A Novel Product for the MekongBasin. Remote Sens. Environ. 2013, 136, 180–198. [CrossRef]
Remote Sens. 2019, 11, 1985 41 of 42
188. Clauss, K.; Ottinger, M.; Leinenkugel, P.; Kuenzer, C. Estimating Rice Production in the Mekong Delta,Vietnam, Utilizing Time Series of Sentinel-1 SAR Data. Int. J. Appl. Earth Obs. Geoinf. 2018, 73, 574–585.[CrossRef]
189. Minh, H.V.T.; Avtar, R.; Mohan, G.; Misra, P.; Kurasaki, M. Monitoring and Mapping of Rice CroppingPattern in Flooding Area in the Vietnamese Mekong Delta Using Sentinel-1A Data: A Case of An GiangProvince. ISPRS Int. J. Geo-Inf. 2019, 8, 211. [CrossRef]
190. Bazzi, H.; Baghdadi, N.; El Hajj, M.; Zribi, M.; Minh, D.H.T.; Ndikumana, E.; Courault, D.; Belhouchette, H.Mapping Paddy Rice Using Sentinel-1 SAR Time Series in Camargue, France. Remote Sens. 2019, 11, 887.[CrossRef]
191. Ndikumana, E.; Ho, D.; Minh, T.; Baghdadi, N.; Courault, D.; Hossard, L. Deep Recurrent Neural Networkfor Agricultural Classification Using Multitemporal SAR Sentinel-1 for Camargue, France. Remote Sens. 2018,10, 16. [CrossRef]
192. Tavares, P.A.; Ely, N.; Beltr, S.; Silva, U.; Cl, A. Integration of Sentinel-1 and Sentinel-2 for Classification andLULC Mapping in the Urban Area of Belém, Eastern Brazilian Amazon. Sensors 2019, 19, 1140. [CrossRef][PubMed]
193. Alan, J.; Castillo, A.; Apan, A.A.; Maraseni, T.N.; Salmo, S.G. Estimation and Mapping of Above-GroundBiomass of Mangrove Forests and Their Replacement Land Uses in the Philippines Using Sentinel Imagery.ISPRS J. Photogramm. Remote Sens. 2017, 134, 70–85. [CrossRef]
194. Poursanidis, D.; Traganos, D.; Reinartz, P.; Chrysoulakis, N. On the Use of Sentinel-2 for Coastal HabitatMapping and Satellite-Derived Bathymetry Estimation Using Downscaled Coastal Aerosol Band. Int. J. Appl.Earth Obs. Geoinf. 2019, 80, 58–70. [CrossRef]
195. Feng, Q.; Yang, J.; Zhu, D.; Liu, J.; Guo, H.; Bayartungalag, B.; Li, B. Integrating Multitemporal Sentinel-1/2Data for Coastal Land Cover Classification Using a Multibranch Convolutional Neural Network: A Case ofthe Yellow River Delta. Remote Sens. 2019, 11, 1006. [CrossRef]
196. Hettling, J.K. The Use of Remote Sensing Satellites for Verification in International Law. Space Policy 2003, 19,33–39. [CrossRef]
197. Peter, N. The Use of Remote Sensing to Support the Application of Multilateral Environmental Agreements.Space Policy 2004, 20, 189–195. [CrossRef]
198. Kuriyama, I. Supporting Multilateral Environmental Agreement with Satellite Earth Observation. Space Policy2005, 21, 151–160. [CrossRef]
199. Purdy, R. Using Earth Observation Technologies for Better Regulatory Compliance and Enforcement ofEnvironmental Laws. J. Environ. Law 2009, 22, 59–87. [CrossRef]
200. De Leeuw, J.; Georgiadou, P.Y.; Kerle, N.; De Gier, A.; Yoshio, I.; Jelle, F.; Smies, M.; Davaa, N. The Functionof Remote Sensing in Support of Environmental Policy. Remote Sens. 2010, 2, 1731–1750. [CrossRef]
201. Chen, Q.; Zhang, Y.; Hallikainen, M. Water Quality Monitoring Using Remote Sensing in Support of the EUWater Framework Directive (WFD): A Case Study in the Gulf of Finland. Environ. Monit. Assess. 2007, 124,157–166. [CrossRef] [PubMed]
202. Ferraro, G.; Baschek, B.; De Montpellier, G.; Njoten, O.; Perkovic, M.; Vespe, M. On the SAR Derived Alertin the Detection of Oil Spills According to the Analysis of the EGEMP. Mar. Pollut. Bull. 2009, 60, 91–102.[CrossRef] [PubMed]
203. Glasgow, H.B.; Burkholder, J.; Reed, R.E.; Lewitus, A.; Kleinman, J.E. Real-Time Remote Monitoring ofWater Quality: A Review of Current Applications, and Advancements in Sensor, Telemetry, and ComputingTechnologies. J. Exp. Mar. Biol. Ecol. 2004, 300, 409–448. [CrossRef]
204. Kourti, N.; Shepherd, I.; Greidanus, H.; Alvarez, M.; Aresu, E.; Bauna, T.; Chesworth, J.; Lemoine, G.;Schwartz, G. Integrating Remote Sensing in Fisheries Control. Fish. Manag. Ecol. 2005, 12, 295–307.[CrossRef]
205. Seto, K.C.; Fragkias, M. Mangrove Conversion and Aquaculture Development in Vietnam: A RemoteSensing-Based Approach for Evaluating the Ramsar Convention on Wetlands. Glob. Environ. Chang. 2007,17, 486–500. [CrossRef]
206. Rudorff, B.; Adami, M.; Risso, J.; Aguiar, D.; Pires, B.; Amaral, D.; Fabiani, L.; Cecarelli, I. Remote SensingImages to Detect Soy Plantations in the Amazon Biome—The Soy Moratorium Initiative. Sustainability 2012,4, 1074–1088. [CrossRef]
Remote Sens. 2019, 11, 1985 42 of 42
207. Vo Quoc, T.; Oppelt, N.; Leinenkugel, P.; Kuenzer, C. Remote Sensing in Mapping Mangrove Ecosystems—AnObject-Based Approach. Remote Sens. 2013, 5, 183–201. [CrossRef]
208. Fingas, M.; Brown, C. Review of Oil Spill Remote Sensing. Mar. Pollut. Bull. 2014, 83, 9–23. [CrossRef]209. Garcia-Pineda, O.; Holmes, J.; Rissing, M.; Jones, R.; Wobus, C.; Svejkovsky, J.; Hess, M. Detection of Oil
near Shorelines during the Deepwater Horizon Oil Spill Using Synthetic Aperture Radar (SAR). Remote Sens.2017, 9, 567. [CrossRef]
210. Kolokoussis, P.; Karathanassi, V. Oil Spill Detection and Mapping Using Sentinel 2 Imagery. J. Mar. Sci. Eng.2018, 6, 4. [CrossRef]
211. Anthony, E.J.; Brunier, G.; Besset, M.; Goichot, M. Linking Rapid Erosion of the Mekong River Delta toHuman Activities. Nat. Publ. Gr. 2015, 12. [CrossRef] [PubMed]
212. Auerbach, L.W.; Goodbred, S.L.; Mondal, D.R.; Wilson, C.A.; Ahmed, K.R.; Roy, K.; Steckler, M.S.; Small, C.;Gilligan, J.M.; Ackerly, B.A. Flood Risk of Natural and Embanked Landscapes on the Ganges-BrahmaputraTidal Delta Plain. Nat. Clim. Chang. 2015, 5, 153–157. [CrossRef]
213. Wang, H.; Wright, T.J.; Yu, Y.; Lin, H.; Jiang, L.; Li, C.; Qiu, G. InSAR Reveals Coastal Subsidence in the PearlRiver Delta, China. Remote Sens. 2012, 10, 1119–1128. [CrossRef]
214. Sansosti, E.; Casu, F.; Manzo, M.; Lanari, R. Space-borne Radar Interferometry Techniques for the Generationof Deformation Time Series: An Advanced Tool for Earth’s Surface Displacement Analysis. Geophys. Res.Lett. 2010, 37, 9. [CrossRef]
215. Pepe, A.; Calò, F. A Review of Interferometric Synthetic Aperture RADAR (InSAR) Multi-Track Approachesfor the Retrieval of Earth’s Surface Displacements. Appl. Sci. 2017, 7, 1264. [CrossRef]
216. Higgins, S.A.; Overeem, I.; Steckler, M.S.; Syvitski, J.P.M.; Seeber, L.; Akhter, S.H. InSARmeasurements ofCompaction and Subsidence in the Ganges-Brahmaputra Delta, Bangladesh Stephanie. J. Geophys. Res. EarthSurf. 2014, 119, 1768–1781. [CrossRef]
217. Erban, L.E.; Gorelick, S.M.; Zebker, H.A. Groundwater Extraction, Land Subsidence, and Sea-Level Rise inthe Mekong Delta, Vietnam. Environ. Res. Lett. 2014, 9. [CrossRef]
218. Minderhoud, P.S.J.; Coumou, L.; Erban, L.E.; Middelkoop, H.; Stouthamer, E.; Addink, E.A. The Relationbetween Land Use and Subsidence in the Vietnamese Mekong Delta. Sci. Total Environ. 2018, 634, 715–726.[CrossRef]
219. Zhang, B.; Wang, R.; Deng, Y.; Ma, P.; Lin, H.; Wang, J. Mapping the Yellow River Delta Land Subsidencewith Multitemporal SAR Interferometry by Exploiting Both Persistent and Distributed Scatterers. ISPRS J.Photogramm. Remote Sens. 2019, 148, 157–173. [CrossRef]
220. Ma, P.; Wang, W.; Zhang, B.; Wang, J.; Shi, G.; Huang, G.; Science, E.I.; Chinese, T.; Kong, H.; Kong, H.Remotely Sensing Large- and Small-Scale Ground Subsidence: A Case Study of the Guangdong—HongKong—Macao Greater Bay Area of China. Remote Sens. Environ. 2019, 232, 111282. [CrossRef]
221. Martínez, M.L.; Intralawan, A.; Vázquez, G.; Pérez-Maqueo, O.; Sutton, P.; Landgrave, R. The Coasts of OurWorld: Ecological, Economic and Social Importance. Ecol. Econ. 2007, 63, 254–272. [CrossRef]
222. Jennerjahn, T. Biogeochemical Response of Tropical Coastal Systems to Present and Past EnvironmentalChange. Earth-Sci. Rev. 2012, 114, 19–41. [CrossRef]
© 2019 by the authors. Licensee MDPI, Basel, Switzerland. This article is an open accessarticle distributed under the terms and conditions of the Creative Commons Attribution(CC BY) license (http://creativecommons.org/licenses/by/4.0/).