rationale and methods of the integrated biomarker and imaging study (ibis): combining invasive and...
TRANSCRIPT

Rationale and methods of the integrated biomarker and imaging study (IBIS):combining invasive and non-invasive imaging with biomarkers to detectsubclinical atherosclerosis and assess coronary lesion biology
Carlos A.G. Van Mieghem1, Nico Bruining1, Johannes A. Schaar2, Eugene McFadden1,Nico Mollet1, Filippo Cademartiri1, Frits Mastik2, Jurgen M.R. Ligthart1, Gaston A.Rodriguez Granillo1, Marco Valgimigli1, Georgios Sianos1, Willem J. van der Giessen1,Bianca Backx4, Marie-Angele M. Morel4, Gerrit-Anne Van Es4, Jonathon D. Sawyer3,June Kaplow3, Andrew Zalewski3, Anton F.W. van der Steen2, Pim de Feyter1 & PatrickW. Serruys1
1Erasmus Medical Center, Thoraxcenter, Rotterdam, the Netherlands; 2Interuniversity Cardiology Institute ofthe Netherlands, Utrecht the Netherlands; 3GlaxoSmithKline, Philadelphia, PA, USA; 4Cardialysis,Rottterdam, The Netherlands
Received 6 July 2004; accepted in revised form 21 December 2004
Key words: atherosclerosis, biomarkers, computed tomography, coronary artery disease, intravascularultrasound, palpography
Abstract
Death or myocardial infarction, the most serious clinical consequences of atherosclerosis, often result fromplaque rupture at non-flow limiting lesions. Current diagnostic imaging with coronary angiography onlydetects large plaques that already impinge on the lumen and cannot accurately identify those that have apropensity to cause unheralded events. Accurate evaluation of the composition or of the biomechanicalcharacteristics of plaques with invasive or non-invasive methods, alone or in conjunction with assessment ofcirculating biomarkers, could help identify high-risk patients, thus providing the rationale for aggressivetreatments in order to reduce future clinical events. The IBIS (Integrated Biomarker and Imaging Study)study is a prospective, single-center, non-randomized, observational study conducted in Rotterdam. Theaim of the IBIS study is to evaluate both invasive (quantitative coronary angiography, intravascularultrasound (IVUS) and palpography) and non-invasive (multislice spiral computed tomography) imagingtechniques to characterize non-flow limiting coronary lesions. In addition, multiple classical and novelbiomarkers will be measured and their levels correlated with the results of the different imaging techniques.A minimum of 85 patients up to a maximum of 120 patients will be included. This paper describes the studyprotocol and methodological solutions that have been devised for the purpose of comparisons amongseveral imaging modalities. It outlines the analyses that will be performed to compare invasive and non-invasive imaging techniques in conjunction with multiple biomarkers to characterize non-flow limitingsubclinical coronary lesions.
Abbreviations: EEM – external elastic membrane; HU – Hounsfield units; IVUS – intravascular ultrasound;
MSCT – multislice spiral computed tomography; PCI – percutaneous coronary intervention; QCU – Quantitative
Coronary Ultrasound; RF – radio frequency; ROI – region of interest; STEMI – ST elevation myocardial
infarction; US – ultrasound; VH – virtual histology
The International Journal of Cardiovascular Imaging (2005) 21: 425–441 � Springer 2005DOI 10.1007/s10554-004-7986-y

Background
Although coronary atherosclerosis is common,clinical events are relatively rare and not linearlyrelated to either the extent or severity of athero-sclerosis. The majority of acute coronary eventsarise from non-flow limiting lesions and are oftenthe first clinical manifestation of previously sub-clinical atherosclerosis [1–5]. These observations,among others, led to the concept of the vulnerableatherosclerotic plaque, a plaque that has a highprobability of causing a clinical event [6–8]. Themost common post-mortem histological featuresin such plaques are the presence of a thin fibrouscap, a lipid-rich core, and infiltration by inflam-matory cells [9–14]. Less common pathologicalsubstrates for fatal clinical events are plaque ero-sion, nodular calcification and intraplaquehemorrhage [9, 15].
Coronary angiography is the standard techniqueto define the presence and to assess the extent ofcoronary atherosclerosis; however, it can onlydetect plaques that impinge on the lumen. Giventhe diffuse nature of coronary atherosclerosis andthe phenomenon of arterial remodeling, an exten-sive amount of plaque can be present yet goundetected on angiography [16, 17]. To detectpotentially vulnerable plaque before it impinges onthe lumen, other diagnostic modalities are needed[18–20]. Furthermore, accurate evaluation of thecomposition or biomechanical characteristics ofsuch plaques could aid in the detection of high-risklesions.
Several circulating plasma biomarkers related toincreased inflammatory burden, platelet activationor endothelial activation correlate with the risk ofcardiovascular events both in patients who havepreviously had an acute coronary event and inapparently healthy individuals [21–28]. Despitethese epidemiological results, little data exist onthe relation between circulating biomarkers andlocal biomechanical or other structural character-istics of coronary plaques.
The aim of the IBIS study is to characterize nonflow limiting subclinical coronary lesions byinvasive and non-invasive imaging techniques inconjunction with multiple biomarkers.
Methods
Patients and study protocol
From March to November 2003 we enrolled 90patients in IBIS a prospective, single center, non-randomized, observational study. No formalsample size calculations have been performed.Follow-up will be completed in summer 2004.Patients 18 years of age or older were eligible forinclusion if (1) they presented with stable anginapectoris, documented silent ischaemia or an acutecoronary syndrome (unstable angina pectoris, nonST segment elevation or ST segment elevationmyocardial infarction) and (2) they underwentsuccessful percutaneous coronary intervention(PCI) of one or more lesions in the native coronarycirculation. Successful PCI was defined as attain-ment of residual diameter stenosis <20% (visualassessment), TIMI 3 flow and no residual dissec-tion. Exclusion criteria are listed in Table 1.Patients who met all the inclusion criteria andnone of the exclusion criteria were enrolled. Thestudy was performed in accordance with theprinciples set out in the Declaration of Helsinkiand was approved by the Medical Ethics Com-mittee of the Erasmus MC. All patients gavewritten informed consent.
A coronary artery, other than the vessel thatwas the target for PCI, was designated as ‘thestudy vessel’. In order of preference, the leftanterior descending artery (LAD), right coronaryartery (RCA) or circumflex artery (CX, includinglarge intermediate branches) were selected. Inaddition, interrogation of the PCI vessel could beundertaken at the discretion of the investigator.All invasive imaging procedures (coronary angi-ography, IVUS, and palpography) were performedimmediately after the PCI procedure or themorning following the PCI (where PCI was per-formed for STEMI). MSCT was preferably per-formed prior to invasive imaging; otherwise it wasdone within 21 days after PCl. Blood samples wereobtained, whenever possible, prior to PCI from thearterial sheath before administration of unfrac-tionated heparin. In order to correlate the differentimaging techniques, a region of interest (ROI) in
426

the study vessel was defined. This was based on theMSCT scan; a side branch was chosen as the distalboundary of the region of interest and a secondside branch, or the ostium of the vessel, as theproximal boundary. An example is provided inFigure 1.
Clinical follow-up visits were scheduled at 3 and6 months. At each visit, an ECG and blood sam-ples for biomarker analysis were obtained anddata collected on clinical events. At 6 months,repeat MSCT was performed, followed by repeatinvasive imaging procedures on the study vessel.Whenever clinically driven angiography was per-formed before the 3-month follow-up, patientswere asked to return for the previously scheduledangiogram at 6 months. When angiography wasperformed after 3 months follow-up, this angio-gram was considered as the final follow-upangiogram. All different invasive imaging tech-niques (angiography, IVUS, palpography) wererepeated at follow-up; when PCI of the ‘studyvessel’ was indicated at follow-up, the imaging
procedures were performed before intervention.Patients who failed to attend the follow-up visitswere contacted by phone or by letter or informa-tion was obtained through the general practi-tioner, the patient’s next of kin or referringcardiologist. The patient was considered lost tofollow-up if all these avenues were unsuccessful.
Coronary angiography
Conventional selective coronary angiography wasperformed with standard techniques. In order toobtain accurate and reproducible quantitativecoronary angiographic (QCA) measurements, eachangiogram was preceded by the intra-coronaryinjection of nitrates (1–3 mg isosorbide dinitrate)and the catheter tip was cleared of contrast. QCAanalysis was performed by the core laboratoryusing the Cardiovascular Angiography AnalysisSystem II algorithm (CAAS II), as previouslydescribed in detail [29].
Table 1. Exclusion criteria.
General and clinical criteria
a. Braunwald class IA, IIA, IIIA (Unstable angina caused by noncardiac illness)
b. Pregnant women or women of childbearing potential who do not use adequate contraception
c. Known allergies to aspirin, clopidogrel bisulfate (Plavix�), Ticlopidine (Ticlid�), heparin, stainless steel,
copper or a sensitivity to contrast media, which cannot be adequately premedicated
d. Life expectancy of less than one year or factors making clinical and/or angiographic follow-up difficult
e. Planned coronary bypass surgery or major non-cardiac surgery
f. Impaired renal function (creatinine >2 mg/dl or ‡150 lmol/L)
g. A history of bleeding diathesis or coagulopathy
h. Previous disabling stroke within the past year
Criteria related to invasive imaging
a. Severe 3-vessel coronary artery and/or left main disease with ‡50% stenosis
b. Minimal lumen diameter <2 mm in the segments to be analyzed within the study vessel
c. Diameter stenosis >70% or total occlusion of the study vessel
d. In case the study-vessel has been stented previously more than 1/3 (outside the length of the stent plus 5 mm
proximal and distal to the stent) of the study vessel should be available for examination
e. Ejection fraction ‡30%f. Moderate to severe tortuosity (moderate: 2 bends >75� or one bend >90�) of the proximal vessel in the segment(s)
to be analyzed
g. Known tendency to coronary vasospasm
Criteria related to non-invasive imaging
a. Heart rate >70 beats/min 1 h after administration of an oral beta-blocker
b. Contra-indication to iodinated contrast material (e.g. known allergy, serum creatinine ‡150 lmol/l, thyroid dis orders)
c. Inability to hold breath for 20 s
d. Irregular heart rate (e.g. atrial fibrillation or very frequent PVCs)
427

QCA: Definitions
The mean and minimal lumen diameters of theROI were measured in all individual suitableprojections. The average of these values for allavailable projections was calculated to provide anoverall mean and minimal luminal diameter for theROI diameter. A plaque was defined as luminalnarrowing that resulted in ‡20% diameter stenosiswithin the ROI with respect to the interpolatedreference diameter. The reproducibility for QCAhas previously been reported [30].
An additional qualitative analysis will be per-formed on the pre-intervention angiogram(s) toassess the presence and severity of atherosclerosis,based on angiography, in the study population inorder to allow comparison of the ‘tota1 plaqueburden’ on angiography with that on MSCT. Allsegments of the coronary tree were analyzed by anindependent experienced cardiologist. Each seg-ment was classified as normal (smooth or taperingborders), as atheromatous without an identifiable
plaque (<20% diameter stenosis visually), as ath-eromatous with a distinct but <50% stenosis, asatheromatous with a >50% stenosis but withoutocclusion or as occluded.
IVUS imaging
The IVUS catheter used was a commerciallyavailable mechanical sector scanner with a 30 or 40MHz transducer (UltracrossTM 2.9F 30 MHzcatheter or CVIS AtlantisTM SR Pro 2.5F 40 MHzcatheter, Boston Scientific Corporation, SantaClara, USA), connected to the GalaxyTM ultra-sound console from Boston Scientific. Using anautomated pullback device, the transducer waswithdrawn at a continuous speed of 0.5 mm/s.Cine runs before and during contrast injectionwere performed to define the position of the IVUScatheter before the pullback was started. IVUSdata were acquired after the intracoronaryadministration of isosorbide dinitrate and the datawere stored on S-VHS videotape. The videotapes
Figure 1. The region of interest (ROI) within the study vessel, in this example the LAD, as determined by MSCT (a) is appropriately
matched with the angiographic (b) and IVUS (c) image. This ROI is demarcated by clear distal (in this example the first diagonal
branch) and proximal (in this example the ostium of the Cx) anatomical landmarks. LAD ¼ left anterior descending artery;
Cx ¼ circumflex artery; diag ¼ diagonal branch.
428
were digitized on a computer system, transformedinto the DICOM medical image standard andstored on an IVUS Picture Archiving and Com-munications System (PACS).
Quantitative coronary ultrasound (QCU) analysis
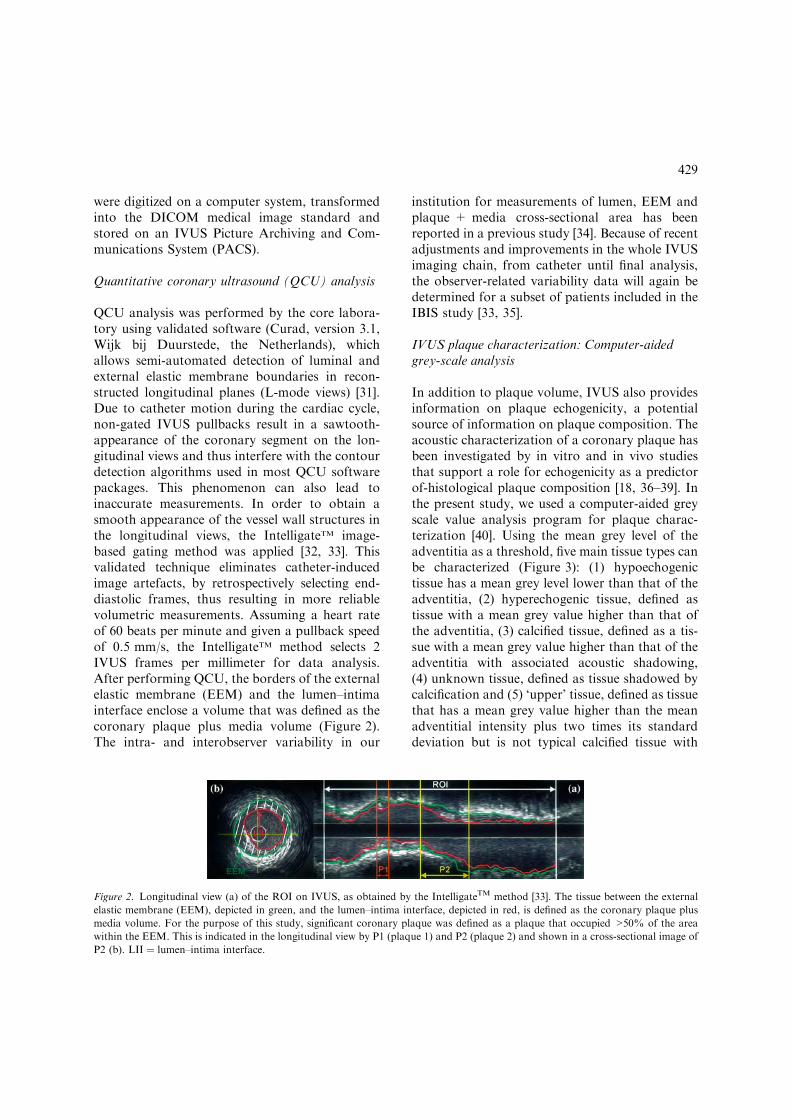
QCU analysis was performed by the core labora-tory using validated software (Curad, version 3.1,Wijk bij Duurstede, the Netherlands), whichallows semi-automated detection of luminal andexternal elastic membrane boundaries in recon-structed longitudinal planes (L-mode views) [31].Due to catheter motion during the cardiac cycle,non-gated IVUS pullbacks result in a sawtooth-appearance of the coronary segment on the lon-gitudinal views and thus interfere with the contourdetection algorithms used in most QCU softwarepackages. This phenomenon can also lead toinaccurate measurements. In order to obtain asmooth appearance of the vessel wall structures inthe longitudinal views, the IntelligateTM image-based gating method was applied [32, 33]. Thisvalidated technique eliminates catheter-inducedimage artefacts, by retrospectively selecting end-diastolic frames, thus resulting in more reliablevolumetric measurements. Assuming a heart rateof 60 beats per minute and given a pullback speedof 0.5 mm/s, the IntelligateTM method selects 2IVUS frames per millimeter for data analysis.After performing QCU, the borders of the externalelastic membrane (EEM) and the lumen–intimainterface enclose a volume that was defined as thecoronary plaque plus media volume (Figure 2).The intra- and interobserver variability in our
institution for measurements of lumen, EEM andplaque + media cross-sectional area has beenreported in a previous study [34]. Because of recentadjustments and improvements in the whole IVUSimaging chain, from catheter until final analysis,the observer-related variability data will again bedetermined for a subset of patients included in theIBIS study [33, 35].
IVUS plaque characterization: Computer-aidedgrey-scale analysis
In addition to plaque volume, IVUS also providesinformation on plaque echogenicity, a potentialsource of information on plaque composition. Theacoustic characterization of a coronary plaque hasbeen investigated by in vitro and in vivo studiesthat support a role for echogenicity as a predictorof-histological plaque composition [18, 36–39]. Inthe present study, we used a computer-aided greyscale value analysis program for plaque charac-terization [40]. Using the mean grey level of theadventitia as a threshold, five main tissue types canbe characterized (Figure 3): (1) hypoechogenictissue has a mean grey level lower than that of theadventitia, (2) hyperechogenic tissue, defined astissue with a mean grey value higher than that ofthe adventitia, (3) calcified tissue, defined as a tis-sue with a mean grey value higher than that of theadventitia with associated acoustic shadowing,(4) unknown tissue, defined as tissue shadowed bycalcification and (5) ‘upper’ tissue, defined as tissuethat has a mean grey value higher than the meanadventitial intensity plus two times its standarddeviation but is not typical calcified tissue with
Figure 2. Longitudinal view (a) of the ROI on IVUS, as obtained by the IntelligateTM method [33]. The tissue between the external
elastic membrane (EEM), depicted in green, and the lumen–intima interface, depicted in red, is defined as the coronary plaque plus
media volume. For the purpose of this study, significant coronary plaque was defined as a plaque that occupied >50% of the area
within the EEM. This is indicated in the longitudinal view by P1 (plaque 1) and P2 (plaque 2) and shown in a cross-sectional image of
P2 (b). LII ¼ lumen–intima interface.
429

acoustic shadowing. An example of a recordingillustrating some of the types of tissue described ispresented in Figure 4.
Plaque size and composition by IVUS: Definitions
For the purpose of the IBIS protocol, significantplaque was defined as the presence of echolucentmedia and echogenic plaque area that resulted in a‡50% reduction in the cross-sectional area cir-cumscribed by the external elastic membrane(EEM). Plaque composition was classified, asdefined previously, based on tissue echogenicity.Plaque within the ROI was considered calcified if itcontained calcium in at least two consecutive cross-sections (0.5 mm < calcified plaque < 1 mm)and was scored in a binary fashion.
Palpography
Intravascular palpography is a new parametricimaging technique based on lVUS that assesses thelocal mechanical properties of the vessel wall andplaque. The underlying principle is that softmaterial will deform more compared with hard
material when force is applied to the tissue. Thenaturally occurring pulsatile arterial pressureprovides the force. The relative deformability ofcoronary plaque components can be estimated bymeasuring the relative displacements of radiofre-quency (RF) signals, recorded during IVUSacquisition, at two different pressure levels [41].Post-processing of RF signals derives dataregarding deformation of the tissue and allows theconstruction of a ‘strain’ image in which ‘harder’(low strain) and ‘softer’ regions (high strain) canbe identified. The local strain is displayed color-coded from blue for 0% strain via red to yellow for2% strain as a complementary image to the IVUSechogram (Figure 5) [42]. The resolution of thestrain measurement in the radial direction is200 lm. In vitro and in vivo studies have validatedthe technique and found higher strain values infatty as compared to fibrous plaques [19, 41, 43]. Arecent in vitro study demonstrated the diagnosticpotential of palpography to identify thin capfibroatheromas [42].
All data in IBIS were acquired using a 20 MHzJovus Avanar F/X IVUS catheter (Volcano, Ran-cho Cordova, CA, USA), which was connected to
Figure 3. Panel a shows a histogram of the distribution of the grey level intensities of the pixels in the adventitia, which is located
outside the EEM contour, in all the cross-sections of the ROI. In order to obtain a reliable reference value, parts of the adventitia with
reduced intensity, due to acoustic shadowing, are excluded. When the distribution of the grey values in the histogram follows a normal
distribution, shown here as a red line, the ultrasound images can be reliably used for image based tissue characterization. An example
of a calcified plaque with acoustic shadowing of the adventitia is provided in panel b and c. The non-shadowed part of the adventitia is
colored white (panel c).
430

an In Vision Gold IVUS console. Recordings wereobtained at a pullback speed of 1 mm/s using amechanical pullback device (Trackback II, Vol-cano, Rancho Cordova, CA, USA). Simulta-
neously, the ECG and intraluminal pressure signalswere recorded. Acquisition was done with a custommade dedicated workstation connected to thedigital interface of the IVUS machine. Each
Figure 4. Examples of tissue types as defined by the computer-aided grey scale analysis program. Panels a, d and g show the
delineation of the lumen-intima (red), EEM (green) and adventitia (blue). Panels b, e and h are the corresponding cross sections and
depict the different tissue types in different colors: red structures are hypoechogenic; green spots are hyperechogenic. Panel h also
explains the principle of unknown tissue, colored yellow: tissue that cannot be characterized due to acoustic shadowing from calcium.
The histograms (c, f, i panels) are divided in three portions, each portion showing the main tissue type of the plaque. Panel c, the
majority of the plaque is located in the left portion of the histogram and is therefore hypoechogenic. Panel f, example of hypere-
chogenic plaque. Panel i, example of a mainly hypoechogenic plaque, with a rim of calcium.
Figure 5. a, the intravascular palpogram is superimposed on the IVUS image. This technique measures the deformation of the
underlying vessel wall and plaque in the radial direction. The resulting strain values are plotted as a color-coded contour at the lumen
vessel boundary. b is an example of a plaque with a low strain on the surface. c shows a plaque with high strain.
431

acquisition was stored on a separate DVD.Processing and analysis of the data was doneindependently by observers unaware of the resultsof the other techniques. The reproducibility ofthree-dimensional palpography at our institutionhas been recently reported [44].
Palpography: Definitions
The strain value that best discriminates a plaque atrisk of rupture has a threshold of 1.26% [42].Strain values were classified according to the ROCclassification (Rotterdam Classification) as lowstrain spots (ROC I: 0.0–<0.6%), moderate strainspots (ROC II: 0.6–<0.9%), medium strain spots(ROC III: 0.9–<1.2%), or high strain spots (ROCIV: >1.2%).
Multislice spiral computed tomography (MSCT)
Intravenous contrast injection with multislicecoronary tomography allows non-invasive visual-ization of coronary arteries including visualizationand evaluation of non-calcified and calcified pla-ques [45, 46]. Patients with resting heart rates >65beats/minute received a single oral dose of 100 mgmetoprolol (Selokeen�, AstraZeneca Pharmaceu-ticals, UK), 1 h prior to the MSCT scan. All scanswere performed using a true 16-row detectorMSCT scanner (Sensation 16, Straton) with agantry rotation time of 375 ms. Other scanparameters were: 16 · 0.75 detector collimation,table feed 3.0 mm/rotation, tube voltage 120 kV,tube current 500–600 mAs. A bolus of 140 mlIodixanol with an Iodine content of 320 mgI/ml(Visipaque 320, Amersham Health, UK) wasintravenously injected in an antecubital vein at4 ml/s. A bolus tracking technique was used tosynchronize the arrival of contrast material insidethe coronary arteries and the start of the scan: aROI was positioned inside the ascending aorta andthe mean density within the ROI was monitored atintervals of 1.25 ms after the start of the injection.The patient was instructed, via an automatedprerecorded message, to perform a breath holdwhen the mean density reached a predefinedthreshold (+100 HU), and the scan started 4 slater. All data were acquired during a single breath
hold of 20 s, and images were reconstructed usingretrospective ECG gating. An image reconstruc-tion algorithm was used, which uses data obtainedin half gantry rotation time resulting in a temporalresolution of up to 188 ms. To obtain motion-freeimages, standard reconstruction windows wereselected during the mid-to-end diastolic phase(350, 400, and 450 ms prior to the next R-wave),but additional image reconstruction windows wereexplored when deemed necessary. The dataset withleast motion-artefacts was selected and loaded intoan off-line workstation (Leonardo, Siemens,Forchheim, Germany). Then, a ROI in the studyvessel was selected on multiplanar reconstructed(MPR) images, using easily identified anatomiclandmarks (sidebranches or the ostium). Thereaf-ter, the dataset was loaded into a semi-automatedvessel-tracking software program and a centrallumen line was created throughout the ROI. Ten,twenty, or thirty cross-sectional MPR images(depending on the length of the ROI) werereconstructed orthogonal to this central lumenline, and used for image analysis. A cardiologistand a radiologist, unaware of the results of otherimaging modalities, independently evaluated thecross-sectional images. Disagreements wereresolved by consensus. The image quality of allcross-sectional images was classified as reliable,adequate, or unreliable. Images with unreliableimage quality were excluded from further analysis.
MSCT: Definitions
Reliable cross-sectional MSCT images were visu-ally evaluated for the presence of plaque; plaquewas further classified based on size – as small,medium, or large-and composition – non-calci-fied, calcified, or mixed. A plaque was defined as avisually apparent abnormal space-occupyinglesion, within the wall of the coronary artery thatwas clearly distinguishable both from the adjacentepicardal fat and from the coronary lumen. Themean Hounsfield unit (HU) of a plaque wasdefined as the average HU of the individual cross-sections with plaque. Plaque size was furtherclassified, based on their measured maximalthickness, as small (<1 mm), medium (1–2 mm),or large (>2 mm). Plaque was defined as calcified
432

if it contained high-density (>130 HU) compo-nents (Figure 6) Plaque tissue with both calcifiedand non-calcified components was classified asmixed. HU of non-calcified and calcified tissuecomponents were measured in all cross-sectionswith medium and large plaques by positioning aROI as far as possible from the lumen and adja-cent epicardial fat. The j-values in our institutionfor inter- and intra-observer agreement regardingplaque size, using the 16-row detector MSCTscanner, have been determined in a group of 78patients and are 72% and 74%, respectively.
Finally, the total plaque burden of the entirecoronary tree was assessed on MSCT. All coro-nary segments were assessed. Where not possible(vessel <2 mm, vessel segment distal to anapparent total occlusion, motion or other artefactrendering interpretation unreliable), this wasnoted. Plaque was defined as mentioned above andwas further classified as non-calcified, mixed, orcalcified. Where MSCT was performed after theintervention, evaluation of plaque burden in thestented segments was obviously not possible. Inthese patients, an independent observer assessedthe preinterventon coronary angiogram as follows:the segments that had been stented were scored, byimputation. The segment(s) that were the site ofthe culprit lesion were classified as having a large
plaque. In some patients, segments that werestented had no significant stenosis on angiography.This mainly reflected our practice of stenting from‘normal’ to ‘normal’ with drug-eluting-stents; inother situations, multiple stents were implanted tocover a dissection or to protect a compromisedside branch. These segments were considered asnon-assessable for the presence of plaque. Quali-tative assessment for calcium was performed, asdescribed above, in all stented segments.
IVUS Virtual Histology (IVUS-VH): An IBISsubstudy
IVUS VH is an intravascular ultrasound derivedtechnique that analyses the radio frequency com-ponent of the reflected ultrasound signal. Ascompared with standard IVUS, this imagingmodality has the potential for more detailedassessment of different plaque components. Inpreliminary in vitro studies, four plaque types(fibrous, fibrolipidic, lipid core and calcium) asdefined by histology could be correlated with aspecific spectrum of the radiofrequency signal [47,48]. The different plaque components are assignedcolour codes: fibrous, fibrolipidic, lipid core, andcalcified regions are labelled green, light green, redand white, respectively (Figure 7). This technique,
Figure 6. (a), using the same region of interest as in Figure 1, different plaque types can be identified on MSCT. (b), cross-section at
location 1, showing noncalcified plaque (23 HU). C, cross-section at location 2, showing calcified plaque (579 HU).
433

given its ability to identify lipid-rich plaques, couldbe of great value in identifying potentially vul-nerable plaque.
IVUS VH derives its data from the RF outputof a conventional IVUS console and is ECG-gatedfor accurate data analysis. Since validation of thetechnique so far only exists for a 30 MHz system,the same 30 MHz IVUS catheter, used for theacquisition of the IVUS data, was utilized. The RFand ECG signal were transferred from the BostonScientific console to a dedicated IVUS VH (Vol-cano) platform. The IVUS VH data were stored ona CD-ROM and sent to the Imaging Core Lab atCardialysis for offline analysis by one independentobserver.
IVUS Virtual Histology: Definitions and endpoints
In analogy with QCU, the tissue in between theEEM and lumen–intima interface was defined asthe coronary plaque plus media. Classification ofthe coronary plaque into its four componentswithin the ROI was assessed independently fromthe media. Since IVUS VH was not incorporatedat the start of the IBIS protocol, the results of thistechnique will only be reported as a substudy. Theprimary endpoints of this substudy are: (1) thevolumetric correlation with QCU, (2) the correla-tion of the different plaque components withclinical presentation and biomarkers. (3) the cor-relation between plaque composition and strainpattern observed on palpography. Furthermore,
the design of the IBIS study provides the means toaddress changes in plaque composition.
Biomarker and blood analysis
Cardiac enzymes (including troponin), hemoglobin,hematocrit, red blood cell (RBC) count,white bloodcell (WBC) count, platelet count, urea, creatinine,total cholesterol, HDL cholesterol (HDL-C) andtriglycerides were analyzed by the local laboratory.Plasma concentration of LDL cholesterol (LDL-C)was calculated by the use of the Friedewald formula[LDL-C ¼ total cholesterol minus HDL-C minus(triglycerides/5)].
Plasma and sera used for biomarker analysiswas centrifugally separated within 30 min of drawand stored at )70 �C. Analytes were measuredusing commercial ELISA kits from R&D Systemsexcept where noted. Plasma high sensitivity inter-leukin 6 (hs IL-6), tumor necrosis factor alpha(TNFa), serum high sensitivity C-reactive protein(hsCRP- Diagnostic Systems Laboratories), lipo-protein phospholipase A2 (LpPLA2- GSK), ultra-sensitive pregnancy associated plasma protein A(PAPP-A-Diagnostic Systems Laboratory), matrixmetalloproteinase 9 (MMP-9), soluble CD40L(sCD40L- Bender MedSystems) and monocytechemoattratact protein (MCP-1), were measuredin the Human Biomarker Centre, GlaxoSmithK-line, using protocols provided by the manufac-turer. Results from the standardized ELISA assayswere measured on a MRX Revelation microplate
Figure 7. Atheroma morphology by IVUS (a) and IVUS virtual histology (VH) (b). (a), Concentric plaque with soft ()) and fibrous
(+) components. (b), The same cross-section in IVUS VH shows that this plaque has a more heterogeneous composition: fibrous
(green), fibrolipidic (light green), lipid core (red) and calcified (white) components can be identified.
434

reader with 4.2 software. Plasma LpPLA2 activityassay measures the proportional release of aque-ous 3H acetate resulting from the enzymaticcleavage of the 3H acetyl-platelet activating factorsubstrate using methodology developed at Glaxo-SmithKline. All simple analyses were done inbatches representing the three time points (base-line, 3 and 6 months follow-up). Internally devel-oped matrix matched or kit provided controls wereincorporated to ensure consistency in the assayperformance.
NT pro BNP was measured in EDTA plasma byQuest Diagnostics using a two-site electroche-miluminescent assay. The lipoprotein subclassdistribution was analyzed by Liposciences Inc.using NMR based technology. The analysis pro-vided to us for the IBIS trial used the newest NMRLipoProfile II methodology.
In addition, serum batched by patient sets fromall baseline and follow-up visits, were measuredusing an analyte defined (closed format) proteinchip. Protein chips provide capability for the anal-ysis of between 10 and 157 different chemokines,cytokines and growth factors depending on the
platform. Our analyses to date include the Zy-omyxTM protein chip. The limits of quantificationfor the above analytes are as follows: 2.5 uIU/mLfor PAPP-A, 0.18 ng/ml for MMP-9, 0.0048 mg/lfor CRP, 6.31 pg/ml for MCP-l, 0.78 ng/ml forsCD40L, 0.057 pg/ml for IL-6, 0.88 pg/ml forTNF-a, and 3.92 nmols/min/ml for LpPLA2 activ-ity.
Off-line analysis of imaging techniques: Principlesand resolution of problems
No previous study has attempted to identify andcharacterize either coronary atherosclerosis orpotentially vulnerable coronary plaques with sucha wide range of invasive and non-invasive imagingtechniques (Figure 8) in conjunction with multipleanalyses of classic and novel biomarkers.
In the present study all imaging techniques wereanalyzed independently. The QCA and QCU wereperformed by an independent Core Lab (Cardial-ysis) using standard operating procedures andvalidated methodology. The IVUS based tissueechogenicity, palpography, and MSCT analyses
Figure 8. Integration of the different imaging modalities, used in IBIS, into one graph provides a more comprehensive view on
coronary atherosclerosis. Visualizing the same coronary artery segment, it becomes clear that the coronary angiogram grossly
underestimates the coronary plaque burden: a significant amount of plaque on IVUS (plaque/EEM ratio >50%) and MSCT (plaque
thickness >2 mm) produces only a mild lumen reduction on angiography. The palpogram provides additional information on the
plaque surface: in this patient two high strain areas (ROC 4) were identified. The ROI is shown in the x-axis (in this patient 22 mm).
The percent EEM-area reduction (on IVUS) and diameter reduction (on angiography) is depicted on the left y-axis. The right y-axis
visualizes the plaque thickness in mm (MSCT) and the ROC score (palpography). Distal and proximal indicate the distal and proximal
reference point in the coronary artery, with respect to the coronary ostium.
435

were performed independently by the researchgroups that developed or refined the techniques inour institution.
Ideally, we aimed to study a commonROI ‡ 30 mm long for all techniques. This waspossible for the majority of patients but specificdifficulties related to each technique requiredeither a redefinition of the original ROI, beforedatabase lock, or the use of a shorter ROI withinthe initially defined region, in some patients. Forall patients, the initial ROI was to be determinedon MSCT. However, in some cases the landmarkson MSCT were not identifiable on IVUS. Thisprimarily occurred in the RCA when the ostiumwas chosen as a landmark on MSCT but was notreliably identified on IVUS because the distal tipof the guiding catheter was within the coronaryartery. In a few cases, the ROI could not bedetermined on MSCT. This was mainly related touninterpretable images due to artefact related tohigh heart rates, irregular heart rates, or cardiacmotion (exclusively in the RCA). Finally, in somecases, MSCT was not performed.
Imaging techniques: Parameters measured atbaseline
IVUSMean plaque area in the ROI as defined by QCUwas used for comparisons among imaging tech-niques and for exploratory analyses on the relationbetween clinical and biological variables and theextent of subclinical atheroma in the ROI. To thisend, mean plaque area (MPA) was calculated asthe difference between mean total vessel area (ATV)and mean total lumen area (ATL). Total plaquevolume (TPV) was calculated as the sum of thedifferences between external elastic membrane(EEM) and lumen areas across all frames in the
region of interest [49] .The plaque variables wemeasured and their definitions are presented inTable 2. Calcified plaque was measured in the ROIbased on the presence or absence of calcium ineach 5 mm segment.
MSCTThe ROI was subdivided into 5 mm segments.Each 5 mm segment was classified as plaque freeor as containing a small, medium, or large plaque.Each plaque was classified as non-calcified, calci-fied, or mixed. Finally the longitudinal extent ofcalcium was expressed as an integer score based onthe presence or absence of calcium in each 5 mmsegment.
Comparison of QCU with MSCTBased on QCU-derived measurements of coronaryatheroma (i.e. plaque and media), the ability ofMSCT to detect coronary plaques resulting in‡50% EEM area reduction and to detect calcifi-cation was assessed. To ensure that the same pla-ques were assessed by the different techniques andto allow correlations, the ROI within the studyvessel was subdivided into 5 mm segments asoutlined above. The QCU and MSCT data werecompared in corresponding 5 mm segments in theROI.
Using these definitions, the ability of MSCT todetect plaque (binary classification; plaque presentor absent) was compared with that of IVUS (bin-ary classification, coronary plaque area ‡50% ofthe area enclosed by the EEM, yes/no). The effectof the presence or absence of calcium detected onIVUS on the specificity and sensitivity of MSCTplaque detection was also assessed, using a binaryclassification: calcium present/absent on MSCT orIVUS within the 5 mm segments.
Table 2. IVUS coronary plaque measurements.
Volumetric variables (mm3)
Absolute plaque volume (mm3)
Total plaque volume (TPV) =P
(EEMCSA ) LUMENCSA)
Relative (percent) plaque volume (%)
Relative plaque volume (RPV) =
PðEEMCSA�LUMENCSAÞ
EEMCSA�100
Area variables (mm2)
Mean plaque area (MPA) = Mean total Vessel Area (ATV) ) Mean total Lumen Area (ATL)
436

QCAThe overall mean and minimal lumen diameters ofthe ROI were measured. The number of plaques,defined as luminal narrowing that resulted in‡20% diameter stenosis within the ROI, was alsoassessed.
Tissue echogenicityThe major variables measured using the tissueechogenicity program were absolute hypo-echo-genic and hyper-echogenic plaque volume (mm3).Other variables measured, defined in the methodssection, were upper volume and unknown volume(mm3). These variables were also assessed forcontiguous 5 mm segments within ROI.
PalpographyThe number of ROC III and IV scores was mea-sured in the ROI and in individual 10 mm seg-ments of the ROI (ROC 3/4 density).
SafetyThe occurrence of Major Adverse Cardiac andCerebral Events (MACCE) was assessed after theprocedure, at discharge, and at 3 and 6 months, aswere the individual components: death, MI,revascularization by PCI or CABG, hospitaliza-tion for ischaemia and/or anginal symptoms, andstroke. They were classified, where possible, asrelated to the ‘study vessel’, the PCI vessel, or anon-PCI/non-study-vessel. The definition of myo-cardial infarction was identical to that defined inthe ACC/ESC joint document on the redefinitionof myocardial infarction [50]. Major bleeding andvascular complications were also prospectivelyrecorded using standard definitions [51].
StatisticsFor the comparison between and within tech-niques for each patient, for each analysis tech-nique, and each time point, the same ROI, selectedby the Core Lab, will be studied. Comparisonsbetween techniques and within techniques (base-line vs. follow-up) will be performed with use ofeither two-by-two tables (sensitivity, specificity)for qualitative outcomes or linear regressionanalysis (regression coefficient, scatter plots) forquantitative outcomes. For the analysis on a per
patient level, including biomarkers, clinicalparameters, and imaging technique results, thedata will be summarized by vessel (ROI) and for5 mm increments of the ROI. For each 5 mmincrement in each technique it was judged whetheror not plaque could be detected. On the vessellevel, plaque was defined as plaque in any of the5 mm increments of the ROI. Circulating bio-markers will be correlated with imaging endpointsusing the univariate Pearson correlation coeffi-cients. We will also use Box and Whisker plots tocompare biomarker distributions in predefinedsubgroups of the study population (diabetic status,anginal status, etc). Statistical analyses will beperformed with use of SAS version 8.
Discussion
Coronary atherosclerosis remains one of the majorcauses of mortality and morbidity in the WesternHemisphere. Advances in medical research haveresulted in the introduction of new pharmacolog-ical agents that have significantly contributed toour ability to decrease the risk of clinical eventsrelated to atherosclerosis. Furthermore, the disci-pline of interventional cardiology has evolvedfrom an experimental technology that was anoption in highly selected patients to a disciplinethat complements and may soon largely replacecoronary artery bypass surgery.
In parallel, advances in our understanding of themechanisms underlying atherosclerosis haveclearly demonstrated that clinical events are notnecessarily related to the severity of luminal nar-rowing in large epicardial coronary arteries. Thepotential contribution of a low-grade inflamma-tion, infectious agents, genetic factors, and otherputative mechanisms to the occurrence of athero-sclerosis-related clinical events is the subject ofintense investigation.
Finally, the recognition that death or myocar-dial infarction is often related to plaque rupture atthe site of non-flow limiting subclinical athero-sclerosis has evolved into the concept of the vul-nerable atherosclerotic plaque. Post-mortemstudies have shown that plaque rupture at the siteof thin-cap fibroatheromas is the most common
437

mechanism that leads to death from atheroscle-rosis. However, it has also been clearly shown thatsuch ruptures often remain clinically silent andcontribute to lesion progression. As atherosclero-sis is a diffuse process that involves many vascularbeds and several sites within the coronary vascu-lature, better identification of plaque composi-tional characteristics is needed. The quest toidentify reliable technique(s) to detect plaques thatare at high risk of causing future clinical events iscurrently the subject of intense research activity.Ideally, biomarkers in peripheral blood, singly orin combination, could be used to identify patientsat risk for new or recurrent clinical events such assudden death or acute myocardial infarction.Appropriate non-invasive or invasive techniquescould then be used to further refine riskstratification.
The aim of the IBIS study is to evaluate thefeasibility and safety of both invasive (quantitativecoronary angiography, intravascular ultrasoundwith tissue echogenicity and palpography) andnon-invasive (multislice spiral computed tomo-
graphy) imaging techniques to characterize non-flow limiting coronary lesions. The performance ofMSCT to identify and characterize coronary pla-que will be directly compared with that of IVUS,the current gold standard. Multiple classical andnovel biomarkers will be measured and their levelswill be correlated with the results of the differentimaging techniques. In addition, the potentialutility of novel techniques such as tissueechogenicity and palpography will be evaluated.
Beyond these specific goals, the longitudinalcharacter of the IBIS study will be utilized to as-sess the natural history of arterial remodeling(Figure 9). Serial studies, like IBIS, that measurechanges in vessel area at the same site over time arethe ideal way to assess the remodeling processsince they are not subjected to the limitations ofusing a reference site [52, 53]. A few IVUS studieswith serial long-term (‡12 months) follow-up inpatients with atherosclerotic coronary artery dis-ease have recently been reported [54, 55]. Theysubstantiate the earlier knowledge that changes inthe arterial lumen correlate more closely with the
Figure 9. Schematic outline of the remodeling process in coronary atherosclerosis, as assessed by IVUS. In theory nine remodeling
patterns can be defined, as depicted. Determinants of the coronary artery lumen diameter are the change in plaque size and the process
of vascular remodeling, which is the change in the size of an artery over time. The change in the vascular lumen is indicated in the figure
by the + (increase), ) (decrease) or = (unchanged) signs. By taking into account the, still to be determined, observer related variability
of the IVUS data in this study, as indicated by the (hypothetical) dotted lines, the natural history of the remodeling process can be
defined for the IBIS population. The shaded box in grey indicates a change of 5 mm2 along the x- and y-axis.
438

direction and magnitude of the remodeling processthan with plaque size.
Study limitations
We used two different IVUS catheters in thepresent study. During the first 3 months of patientinclusion IVUS imaging was done using a 40-MHZ
catheter; all subsequent baseline and all follow-upanalyses were done using the 30-MHZ system. Thisapproach was driven by the decision to includeIVUS VH as an additional imaging technique3 months after the start of the IBIS study. Ideally,the same IVUS catheter used at baseline shouldagain be selected for the follow-up procedure.However, since both IVUS catheters were oper-ated on the same display system (GalaxyTM con-sole, Boston scientific), this should not affect IVUSmeasurements [35].
Plaque assessment by MSCT was based on vi-sual evaluation. While automated programs withthe possibility of manual contour correction, suchas used for QCA and IVUS, are under develop-ment for MSCT imaging, none are currentlyavailable for use.
IVUS examinations performed with a 40-MHZ
IVUS catheter will not be used for evaluation byIVUS VH since validation only exists for the30-MHZ system.
Where the initial ROI on MSCT could not beused for correlation with the other imaging tech-niques due to a problem with the identification ofthe landmarks, a new ROI was defined on MCSTby the Core Lab in conjunction with an indepen-dent cardiologist, familiar with but not involved inthe analysis of the various techniques. WhereMSCT was not performed or could not be inter-preted, a ROI was defined on IVUS using proxi-mal and distal anatomic landmarks.
Acknowledgement
This study was supported by an unrestricted edu-cational grant from GlaxoSmithKline.
References
1. Ambrose JA, TannenbaumMA, Alexopoulos D, Hjemdahl-
Monsen CE, Leavy J, Weiss M, et al. Angiographic pro-
gression of coronary artery disease and the development of
myocardial infarction. J Am Coll Cardiol 1988; 12(1): 56–
62.
2. Haft JI, Haik BJ, Goldstein JE, Brodyn NE. Development
of significant coronary artery lesions in areas of minimal
disease. A common mechanism for coronary disease pro-
gression. Chest 1988; 94(4): 731–736.
3. Little WC, Constantinescu M, Applegate RJ, Kutcher MA,
Burrows MT, Kahl FR, et al. Can coronary angiography
predict the site of a subsequent myocardial infarction in
patients with mild-to-moderate coronary artery disease?
Circulation 1988; 78(5 Pt 1): 1157–1166.
4. Falk E, Shah PK, Fuster V. Coronary plaque disruption.
Circulation 1995; 92(3): 657–671.
5. Kullo IJ, Edwards WD, Schwartz RS. Vulnerable plaque:
pathobiology and clinical implications. Ann Intern Med
1998; 129(12) 1050–1060.
6. Naghavi M, Libby P, Falk E, et al. From vulnerable plaque
to vulnerable patient: a call for new definitions and risk
assessment strategies: Part II. Circulation 2003; 108(15):
1772–1778.
7. Naghavi M, Libby P, Falk E, Casscells SW, Litovsky S,
Rumberger J, et al. From vulnerable plaque to vulnerable
patient: a call for new definitions and risk assessment
strategies: Part I. Circulation 2003; 108(14): 1664–1672.
8. Schaar JA, Muller JE, Falk E, et al. Terminology for high-
risk and vulnerable coronary arterty plaques. Eur Heart J
2004; 25(12): 1077–1082.
9. Virmani R, Kolodgie FD, Burke AP, Farb A, Schwartz SM.
Lessons from sudden coronary death: a comprehensive
morphological classification scheme for atherosclerotic
lesions. Arterioscler Thromb Vasc Biol 2000; 20(5): 1262–
1275.
10. Ross R. Atherosclerosis is an inflammatory disease. Am
Heart J 1999; 138(5 Pt 2): S419–S420.
11. Kolodgie FD, Burke AP, Farb A, et al. The thin-cap
fibroatheroma: a type of vulnerable plaque: the major pre-
cursor lesion to acute coronary syndromes. Curr Opin
Cardiol 200l; 16(5): 285–292.
12. Libby P. Inflammation in atherosclerosis. Nature 2002;
420(6917): 868–874.
13. Libby P, Ridker PM, Maseri A. Inflammation and athero-
sclerosis. Circulation 2002; 105(9): 1135–2243.
14. Davies MJ. Stability and instability: two faces of coronary
atherosclerosis. The Paul Dudley White Lecture 1995. Cir-
culation 1996; 94(8): 2013–2020.
15. Kolodgie FD, Gold HK, Burke AP, et al. Intraplaque
hemorrhage and progression of coronary atheroma. N Engl
J Med 2003; 349(24): 2316–2325.
16. Glagov S, Weisenberg E, Zarins CK, Stankunavicius R,
Kolettis GJ. Compensatory enlargement of human athero-
sclerotic coronary arteries. N Engl J Med 1987; 316(22):
1371–1375.
439

17. Schoenhagen P, Ziada KM, Vince DG, Nislen SE, Tuzcu
EM. Arterial remodeling and coronary artery disease: the
concept of ‘‘dilated’’ versus ‘‘obstructive’’ coronary ath-
erosclerosis. J Am Coll Cardiol 2001; 38(2): 297–306.
18. Nissen SE, Yock P. Intravascular ultrasound: novel path-
ophysiological insights and current clinical applications.
Circulation 2001; 103(4): 604–616.
19. de Korte CL, Pasterkamp G, van der Steen AF, Woutman
HA, Born N. Characterization of plaque components with
intravascular ultrasound elastography in human femoral
and coronary arteries in vitro. Circulation 2000; 102(6):
617–623.
20. de Feyter PJ, Nieman K, van Ooijen P, Oudkerk M. Non-
invasive coronary artery imaging with electron beam com-
puted tomography and magnetic resonance imaging. Heart
2000; 84(4): 442–448.
21. Ross R. Atherosclerosis – an inflammatory disease. N Engl
J Med 1999; 340(2): 115–126.
22. Pearson TA, Mensah GA, Alexander RW, Anderson JL,
Cannon RO, III, Criqui M, et al. Markers of inflammation
and cardiovascular disease: application to clinical and
public health practice: A statement for healthcare profes-
sionals from the Centers for Disease Control and Prevention
and the American Heart Association. Circulation 2003;
107(3): 499–511.
23. Ridker PM, Rifai N, Rose L, Buring JE, Cook NR. Com-
parison of C-reactive protein and low-density lipoprotein
cholesterol levels in the prediction of first cardiovascular
events. N Engl J Med 2002; 347(20): 1557–1565.
24. Ridker PM. Clinical application of C-reactive protein for
cardiovascular disease detection and prevention. Circulation
2003; 107(3): 363–369.
25. Ridker PM, Hennekens CH, Roitman-Johnson B, Stampfer
MJ, Allen J. Plasma concentration of soluble intercellular
adhesion molecule 1 and risks of future myocardial infarc-
tion in apparently healthy men. Lancet 1998; 351 (9096):
88–92.
26. Biasucci LM, Vitelli A, Liuzzo G, et al. Elevated levels of
interleukin-6 in unstable angina. Circulation 1996; 94(5):
874–877.
27. Cesari M, Penninx BW, Newman AB, et al. Inflammatory
markers and onset of cardiovascular events: results from the
Health ABC study. Circulation 2003; 108(19): 2317–2322.
28. Bayes-Genis A, Conover CA, Overgaard MT, et al. Preg-
nancy-associated plasma protein A as a marker of acute
coronary syndromes. N Engl J Med 2001; 345(14): 1022–
1029.
29. de Feyter PJ, Serruys PW, Davies MJ, Richardson P,
Lubsen J, Oliver MF. Quantitative coronary angiography to
measure progression and regression of coronary athero-
sclerosis. Value, limitations, and implications for clinical
trials. Circulation 1991; 84(1): 412–423.
30. Reiber JHC, Van Der Zwet PM, et al. Accuracy and pre-
cision of quantitative digital coronary arteriography;
observer-, as well as short- and medium-term variabilities.
In: Quantitative coronary angiography in clinical practice.
Serruys PW, Foley DP and de Feyter PJ, editors. Dordr-
echt: Kluwer Academic Publishers; 1994: 7–26.
31. Hamers R, Bruining N, Knook M, Sabate M, Roelandt
JRTC. A novel approach to quantitative analysis of Intra-
vascular Ultrasound Images. Computers Cardiol 2001; 28:
589–592.
32. Bruining N, von Birgelen C, de Feyter PJ, et al. ECG-gated
versus nongated three-dimensional intracoronary ultra-
sound analysis: implications for volumetric measurements.
Cathet Cardiovasc Diagn 1998; 43(3): 254–260.
33. De Winter SA, Hamers R, Degertekin M, et al. Retro-
spective image-based gating of intracoronary ultrasound
images for improved quantitative analysis: the intelligate
method. Catheter Cardiovasc Interv 2004; 61(1): 84–94.
34. von Birgelen C, de Vrey EA, Mintz GS, et al. ECG-gated
three-dimensional intravascular ultrasound: feasibility and
reproducibility of the automated analysis of coronary lumen
and atherosclerotic plaque dimensions in humans. Circula-
tion 1997; 96(9): 2944–2952.
35. Bruining N, Hamers R, Teo TJ, de Feijter PJ, Serruys PW,
Roelandt JR. Adjustment method for mechanical Boston
scientific corporation 30 MHz intravascular ultrasound
catheters connected to a Clearview console. Mechanical
30 MHz IVUS catheter adjustment. Int J Cardiovasc
Imaging 2004; 20(2): 83–91.
36. Nishimura RA, Edwards WD, Warnes CA, et al. Intra-
vascular ultrasound imaging: in vitro validation and path-
ologic correlation. J Am Coll Cardiol 1990; 16(1): 145–154.
37. Prati F, Arbustini E, Labellarte A, et al. Correlation
between high frequency intravascular ultrasound and his-
tomorphology in human coronary arteries. Heart 2001;
85(5): 567–570.
38. Okimoto T, Imazu M, Hayashi Y, Fujiwara H, Ueda H,
Kohno N. Atherosclerotic plaque characterization by
quantitative analysis using intravascular ultrasound: corre-
lation with histological and immunohistochemical findings.
Circ J 2002; 66(2): 173–177.
39. Schartl M, Bocksch W, Koschyk DH, et al. Use of intra-
vascular ultrasound to compare effects of different strategies
of lipid-lowering therapy on plaque volume and composi-
tion in patients with coronary artery disease. Circulation
2001; 104(4): 387–392.
40. de Winter SA, Heller I, Hamers R, et al. Computer assisted
three-dimensional plaque characterization in ultracoronary
ultrasound studies. Comput Cardiol 2003; 30: 73–76.
41. de Korte CL, Sierevogel MJ, Mastik F, et al. Identification
of atherosclerotic plaque components with intravascular
ultrasound elastography in vivo: a Yucatan pig study. Cir-
culation 2002; 105(14): 1627–1630.
42. Schaar JA, de Korte CL, Mastik F, et al. Characterizing
vulnerable plaque features with intravascular elastography.
Circulation 2003; 108(21): 2636–2641.
43. de Korte CL, Carlier SG, Mastik F, et al. Morphological
and mechanical information of coronary arteries obtained
with intravascular elastography; feasibility study in vivo.
Eur Heart J 2002; 23(5): 405–413.
440
44. Schaar JA, Mastik F, Regar E, de Korte CL, van der Steen
AFW, Serruys PW. Reproducibility of three-dimensional
palpography. Eur Heart J 2003; suppl.: 2203.
45. Schroeder S, Kopp AF, Baumbach A, et al. Noninvasive
detection and evaluation of atherosclerotic coronary pla-
ques with multislice computed tomography. J Am Coll
Cardiol 2001; 37(5): 1430–1435.
46. Nieman K, Cademartiri F, Lemos PA, Raaijmakers R,
Pattynama PM, de Feyter PJ. Reliable noninvasive coro-
nary angiography with fast submillimeter multislice spiral
computed tomography. Circulation 2002; 106(16): 2051–
2054.
47. Nair A, Kuban BD, Tuzcu EM, Schoenhagen P, Nissen SE,
Vince DG. Coronary plaque classification with intravascu-
lar ultrasound radiofrequency data analysis. Circulation
2002; 106(17): 2200–2206.
48. Moore MP, Spencer T, Salter DM, et al. Characterization
of coronary atherosclerotic morphology by spectral analysis
of radiofrequency signal: in vitro intravascular ultrasound
study with histological and radiological validation. Heart
1998; 79(5): 459–467.
49. Nissen SE, Tuzcu EM, Schoenhagen P, et al. Effect of
intensive compared with moderate lipid-lowering therapy
on progression of coronary atherosclerosis: a randomized
controlled trial. JAMA 2004; 291(9): 1071–1080.
50. Alpert JS, Thygesen K, Antman E, Bassand JP. Myocardial
infarction redefined–a consensus document of The Joint
European Society of Cardiology/American College of Car-
diology Committee for the redefinition of myocardial
infarction. J Am Coll Cardiol 2000; 36(3): 959–969.
51. Serruys PW, Emanuelsson H, van der Giessen W, et al.
Heparin-coated Palmaz-Schatz stents in human coronary
arteries. Early outcome of the Benestent-II Pilot Study.
Circulation 1996; 93(3): 412–422.
52. Mintz GS, Nissen SE, Anderson WD, et al. American
College of Cardiology Clinical Expert Consensus Document
on standards for acquisition, measurement and reporting of
intravascular ultrasound studies (IVUS). A report of the
American College of Cardiology Task Force on Clinical
Expert Consensus Documents. J Am Coll Cardiol 2001;
37(5): 1478–1492.
53. Ward MR, Pasterkamp G, Yeung AC, Borst C. Arterial
remodeling. Mechanisms and clinical implications. Circu-
lation 2000; 102(10): 1186–1191.
54. von Birgelen C, Hartmann M, Mintz GS, Baumgart D,
Schmermund A, Erbel R. Relation between progression and
regression of atherosclerotic left main coronary artery dis-
ease and serum cholesterol levels as assessed with serial
long-term (‡12 months) follow-up intravascular ultrasound.
Circulation 2003; 108(22): 2757–2762.
55. von Birgelen C, Hartmann M, Mintz GS, et al. Spectrum of
remodeling behavior observed with serial long-term
(‡12 months) follow-up intravascular ultrasound studies in
left main coronary arteries. Am J Cardiol 2004; 93(9):
1107–1113.
Address for correspondence: Prof. P.W. Serruys, MD, PhD,
Erasmus MC Rotterdam, Thoraxcenter Bd 404, Dr Mole-
waterplein 40, 3015 GD Rotterdam, The Netherlands
Tel.: +31-10-4635260; Fax: +31-10-4369154
E-mail: [email protected]
441