non-invasive mapping of lipids in plant tissue using magnetic resonance imaging
TRANSCRIPT
BookID 157986_ChapID 24_Proof# 1 - 17/06/2009
Chapter 24
Non-invasive Mapping of Lipids in Plant Tissue Using Magnetic Resonance Imaging
Thomas Neuberger, Hardy Rolletschek, Andrew Webb, and Ljudmilla Borisjuk
Summary
Plant oil has become an important component in the search for a replacement for non-renewable energy sources, as well as being used for a wide range of industrial purposes, all in addition to its vital importance for human diet. Detailed knowledge of the lipid distribution in plants is fundamental for the under-standing of local regulatory networks covering storage metabolism, and for the development of new approaches for plant breeding and transgenic research. We here review a measurement protocol or “tool” based on magnetic resonance imaging (MRI), which allows the non-invasive detection and quantitative visualization of lipid in living plant tissue. The method provides quantitative lipid maps with a resolution close to the cellular level and can be used on a wide range of plants and is applicable at the level of individual tissues, organs, or entire plants during ontogeny. Lipid imaging is designed for both biotechnology and basic science and can be combined with histological, biochemical, and gene expression analysis. Here we present the method as practiced in our group, and discuss unique advantages and limitations of the lipid-imaging tool. Seeds of barley and rapeseed were used as a model for visualization of local oil accumulation at the organ- and tissue-specific scale.
Key words: Magnetic resonance imaging, Plant lipid, Oil storage, Seed development
Visualization has become a very popular topic in plant science, exemplified by the article “Seeing is understanding” (1). Knowledge concerning lipid accumulation in vivo, i.e., in the living plant, is necessary in order to understand and manipulate such accumu-lation. Despite a domestication history of tens of thousands of years, the quantitative spatial distribution of lipid storage in crop plants has only been visually assessable recently. The acquisition of
1. Introduction
1
2
3
4
5
6
78910111213141516171819
20
21
22232425262728
Donald Armstrong (ed.), Lipidomics, Methods in Molecular Biology, vol. 579, Doi 10.1007/978-1-60761-322-0_24, © Humana Press, a part of Springer Science + Business Media, LLC 2009
485

486 Neuberger et al.
BookID 157986_ChapID 24_Proof# 1 - 17/06/2009 BookID 157986_ChapID 24_Proof# 1 - 17/06/2009
quantitative data on the lipid distribution within plant organs, and especially seeds, has traditionally relied largely on assays carried out after tissue dissection and extraction. Currently available non-destructive techniques typically allow either quantification or visualization of lipids (2–6), but not both. Recent progress has been based on techniques such as mass spectrometry (7), non-invasive magic-angle spinning 13C nuclear magnetic resonance (NMR) spectroscopy (8) and 1H NMR spectroscopy (9). All enable a detailed quantitative description of lipid composition, but are not appropriate for imaging. In similar vein, chemical imaging and other current lipid visualization methods are not reliable in terms of quantification in living seeds. For example, techniques such as fluorescence correlation spectroscopy imaging and multi-photon excitation have the potential for accurate in vivo measurements of lipids and numerous other compounds. However, they suffer from interference from photodamage, light scattering, and other characteristics of living plant tissues. Third-harmonic generation microscopy, for example, allows the visualization (10) and measurement of lipids in biological liquids (11). Unfortunately, the poor penetration of optical signals into and out of internal tissue layers represents a major problem, especially with respect to developing crop seeds.
Non-destructive magnetic resonance (MR)-based approaches potentially enable both structural and quantitative investigations (8, 12, 13). In this article, a non-destructive magnetic resonance imaging (MRI) method is described for spatially resolved quan-titative analysis of lipid storage in living plant seeds. Two models were chosen. The first model was developing grains of barley (Hordeum vulgare, monocot species). Its sophisticated lipid compartmentalization and extremely low lipid content (about 2% of dry weight) present a particular technical challenge. The second model was the developing rapeseed (Brassica napus, dicot species). Rapeseed accumulates about 45% oil and represents one of the most important oil plants.
MR imaging and spectroscopy are routinely used as powerful techniques in medicine and animal research, and have recently become popular in experimental botany as well (14–16). Selective imaging of lipid distribution is relatively simple, relying on the slightly different resonance frequencies of water and lipid, and is performed using frequency-selective radiofrequency pulses. MRI allows the study of plants in a non-destructive and quantitative mode which opens up new perspectives for in vivo analysis. The major advantages are as follows:1. The non-invasive nature of the method, i.e. no requirement
for tissue preparation.2. The spatial resolution of lipid mapping is sufficiently high to
distinguish local lipid content at the tissue level. Even with short
1.1. Advantages and Disadvantages of MRI
29
303132333435363738394041424344454647484950515253545556575859606162
6364656667686970717273
7475
Non-invasive Mapping of Lipids in Plant Tissue 487
BookID 157986_ChapID 24_Proof# 1 - 17/06/2009
measurement times of about 1 h (necessary since the size and form of a growing plant organs/tissues can change rapidly) reasonable spatial resolutions can be achieved. Moreover, mapping can be performed using moderate magnetic field strengths which are available in many laboratories.
3. The lack of any RF penetration or scattering effects (unlike optical techniques) means that variable sizes and pigmentations of seed samples cause no problems
4. The simultaneous monitoring of anatomy and lipid depo-sition offers the possibility to relate lipid accumulation to the developmental changes of individual seeds. Following lipid mapping, seeds can be treated by any desired method (biochemical, histological, molecular analysis) or can be allowed to grow further.
5. Lipid mapping can be performed on different types of seeds independent of anatomical differences or lipid content. A careful calibration procedure enables quantitative information to be obtained. Lipid mapping can be applied to remarkably different types of plant tissues (seed, stem, root, and others), which differ widely in lipid content.The major limitation of the method is that detailed infor-
mation on the chemical composition of the lipids is not easily obtained using MRI or magnetic resonance spectroscopy (8, 12). This is due to the inherent line width of the lipid signal in living seeds (depending on the magnetic field strength and the seed composition the line width could be of hundreds of Hertz) and the low concentrations of different single fatty acids. However, efforts are ongoing to try to mitigate this effect, and it may well be possible in the future to achieve the necessary spectral resolution for specific detection of single fatty acids.
1. All experiments were conducted on a Bruker 500-MHz Avance system (Bruker Biospin, Rheinstetten, Germany) or a Bruker 750-MHz Avance system. Both systems have a magnet with a clear bore of 89-mm diameter.
2. The gradient sets had a maximum strength of 660 mT/m in the case of the Avance 500 and 1,000 mT/m in the case of the Avance 750. The inner diameter, and therefore the usable space, was 40 mm in both cases.
3. Various commercially available and custom-built radiofre-quency resonators were used in this study. Examples include a commercial 5-mm birdcage resonator (Bruker) used for
2. Materials
2.1. Equipment
76
77787980
818283
848586878889
90919293949596979899100101102103104105
106
107108109110
111112113114
115116117
488 Neuberger et al.
BookID 157986_ChapID 24_Proof# 1 - 17/06/2009 BookID 157986_ChapID 24_Proof# 1 - 17/06/2009
barley imaging and a custom-built four turn solenoid coil for rape seed imaging.
4. Chromatograph Agilent 6890 (Waldbronn, Germany) fitted with a capillary DB-23 column (30 m × 0.25 mm; 0.25-mm coating thickness; J&W Scientific, Agilent, USA).
5. PALM Laser Microbeam instrument (Bernried, Germany) for dissection of very small samples if needed.
6. Basic lab equipment (centrifuge, pipettes, etc.).
1. Fatty acid mixture (Sigma, Germany) containing methyl esters of arachidate, linoleate, linolenate, oleate, palmitate, and stearate; used for identification and calibration of individual fatty acids.
2. Chemicals used for fatty acid extraction: hexane, isopro-panol, butylated hydroxytoluene, triheptadecanoate (internal standard), potassium sulphate, methanol, sodium methoxide, NaCl, HCl, acetonitrile, distilled water.
MRI measurements were conducted on intact seeds, part of plants or entire plants at distinct developmental stages without any tissue preparation. If used for conventional metabolite analysis and calibration, samples were snap-frozen in liquid nitrogen immediately after the MRI experiment and stored at −80°C.
Total fatty acids were analysed as their corresponding fatty acid methyl esters (FAMEs) by gas chromatography (13). FAMEs were prepared by direct transmethylation with methanol contain-ing 2% (v/v) dimethoxypropane and 2.75% (v/v) sulphuric acid. After 1 h at 80°C, 0.2 ml of 5 M NaCl was added and FAMEs were extracted with 2 ml of hexane. The organic phase was dried with Na2SO4 and evaporated to dryness under nitrogen. FAMEs were dissolved in acetonitrile. The analysis of the FAMEs was performed with a gas chromatograph fitted with a capillary column (DB-23). Helium was used as carrier gas (1 ml/min). The temperature gradient was 150°C for 1 min, 150–200°C at 8 K/min, 200–250°C at 25 K/min and 250°C for 6 min. The total amount of lipids was calculated as sum of all detected FAMEs.
As an example on how the lipid concentration in seeds can be determined with MRI, the work conducted on barley spikes is described in the following sections.
2.2. Reagents
3. Methods
3.1. Sample Preparation and Processing
3.2. Determination of Total Esterified Fatty Acids
3.3. Lipid Determination by MRI
118
119
120121122
123124
125
126127128129
130131132133
134
135136137138139140
141142143144145146147148149150151152153154
155156157
Non-invasive Mapping of Lipids in Plant Tissue 489
BookID 157986_ChapID 24_Proof# 1 - 17/06/2009
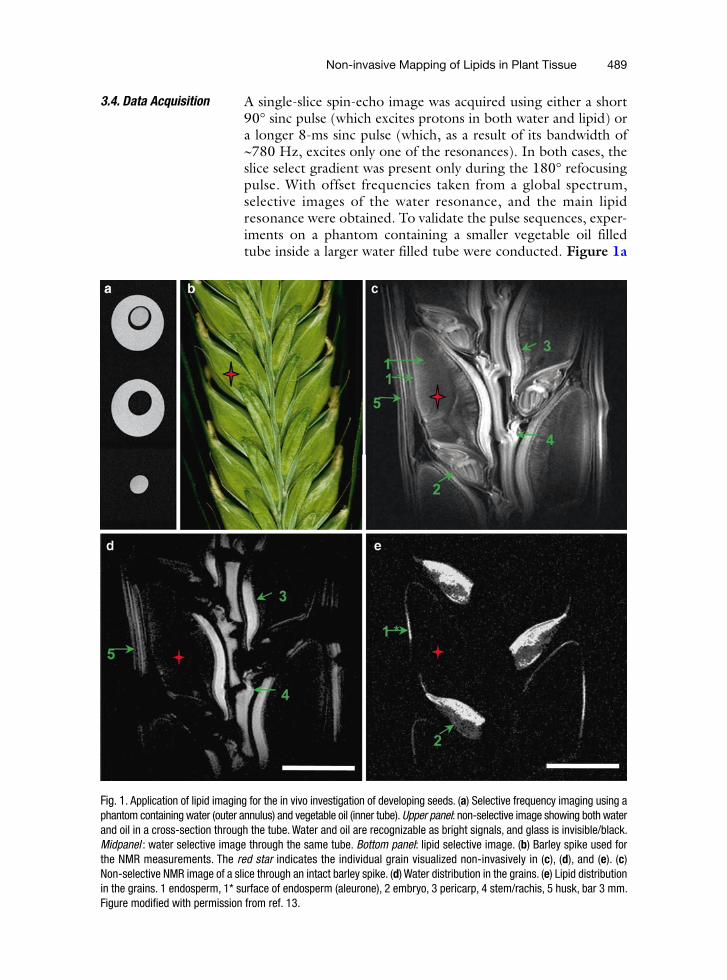
A single-slice spin-echo image was acquired using either a short 90° sinc pulse (which excites protons in both water and lipid) or a longer 8-ms sinc pulse (which, as a result of its bandwidth of ~780 Hz, excites only one of the resonances). In both cases, the slice select gradient was present only during the 180° refocusing pulse. With offset frequencies taken from a global spectrum, selective images of the water resonance, and the main lipid resonance were obtained. To validate the pulse sequences, exper-iments on a phantom containing a smaller vegetable oil filled tube inside a larger water filled tube were conducted. Figure 1a
3.4. Data Acquisition
Fig. 1. Application of lipid imaging for the in vivo investigation of developing seeds. (a) Selective frequency imaging using a phantom containing water (outer annulus) and vegetable oil (inner tube). Upper panel: non-selective image showing both water and oil in a cross-section through the tube. Water and oil are recognizable as bright signals, and glass is invisible/black. Midpanel : water selective image through the same tube. Bottom panel: lipid selective image. (b) Barley spike used for the NMR measurements. The red star indicates the individual grain visualized non-invasively in (c), (d), and (e). (c) Non-selective NMR image of a slice through an intact barley spike. (d) Water distribution in the grains. (e) Lipid distribution in the grains. 1 endosperm, 1* surface of endosperm (aleurone), 2 embryo, 3 pericarp, 4 stem/rachis, 5 husk, bar 3 mm. Figure modified with permission from ref. 13.
158
159160161162163164165166167
490 Neuberger et al.
BookID 157986_ChapID 24_Proof# 1 - 17/06/2009 BookID 157986_ChapID 24_Proof# 1 - 17/06/2009
shows a cross-section through the tubes: a non-selective image (upper panel) and two selective images (mid and bottom panel). The non-selective image visualized both water and oil. The selective images distinguish between water and oil, producing separate images from each.
The same protocol was applied to living barley grains attached to the spike (Fig. 1b). The structural representation of the tissue pattern (non-selective image; Fig. 1c) and the distribution of water (Fig. 1d) and lipid (Fig. 1e) were visualized within the longitudinal section through the spike. When the lipid-specific pulse sequence was used, the lipid signal was detected only in the embryo and the surface of the endosperm (Fig. 1e). By contrast, the highest water signal was found in the stem/rachis, the husk, and the crease region of the grain (Fig. 1d).
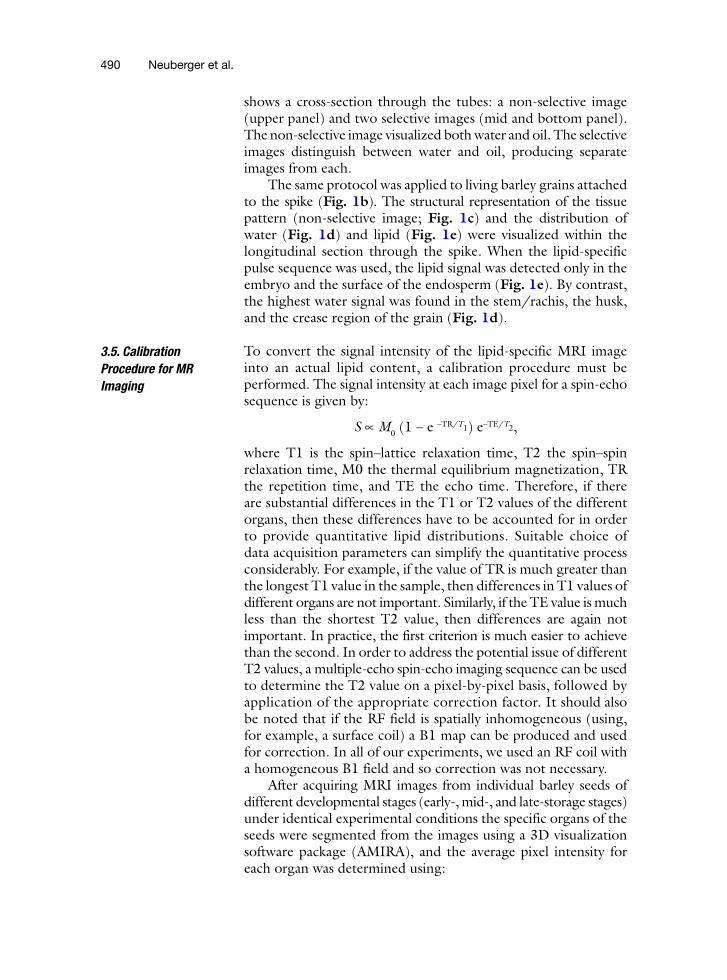
To convert the signal intensity of the lipid-specific MRI image into an actual lipid content, a calibration procedure must be performed. The signal intensity at each image pixel for a spin-echo sequence is given by:
S ∝ M0 (1 – e –TR/T1) e–TE/T2,
where T1 is the spin–lattice relaxation time, T2 the spin–spin relaxation time, M0 the thermal equilibrium magnetization, TR the repetition time, and TE the echo time. Therefore, if there are substantial differences in the T1 or T2 values of the different organs, then these differences have to be accounted for in order to provide quantitative lipid distributions. Suitable choice of data acquisition parameters can simplify the quantitative process considerably. For example, if the value of TR is much greater than the longest T1 value in the sample, then differences in T1 values of different organs are not important. Similarly, if the TE value is much less than the shortest T2 value, then differences are again not important. In practice, the first criterion is much easier to achieve than the second. In order to address the potential issue of different T2 values, a multiple-echo spin-echo imaging sequence can be used to determine the T2 value on a pixel-by-pixel basis, followed by application of the appropriate correction factor. It should also be noted that if the RF field is spatially inhomogeneous (using, for example, a surface coil) a B1 map can be produced and used for correction. In all of our experiments, we used an RF coil with a homogeneous B1 field and so correction was not necessary.
After acquiring MRI images from individual barley seeds of different developmental stages (early-, mid-, and late-storage stages) under identical experimental conditions the specific organs of the seeds were segmented from the images using a 3D visualization software package (AMIRA), and the average pixel intensity for each organ was determined using:
3.5. Calibration Procedure for MR Imaging
168
169170171172173174175176177178179180181
182183184185
186
187188189190191192193194195196197198199200201202203204205206207208209210211212
Non-invasive Mapping of Lipids in Plant Tissue 491
BookID 157986_ChapID 24_Proof# 1 - 17/06/2009
( )pixelSignalorgan
pixelavgSig .organ
pixel avgNoise VoxelVolume NAorgan
∑=
× × ×∑
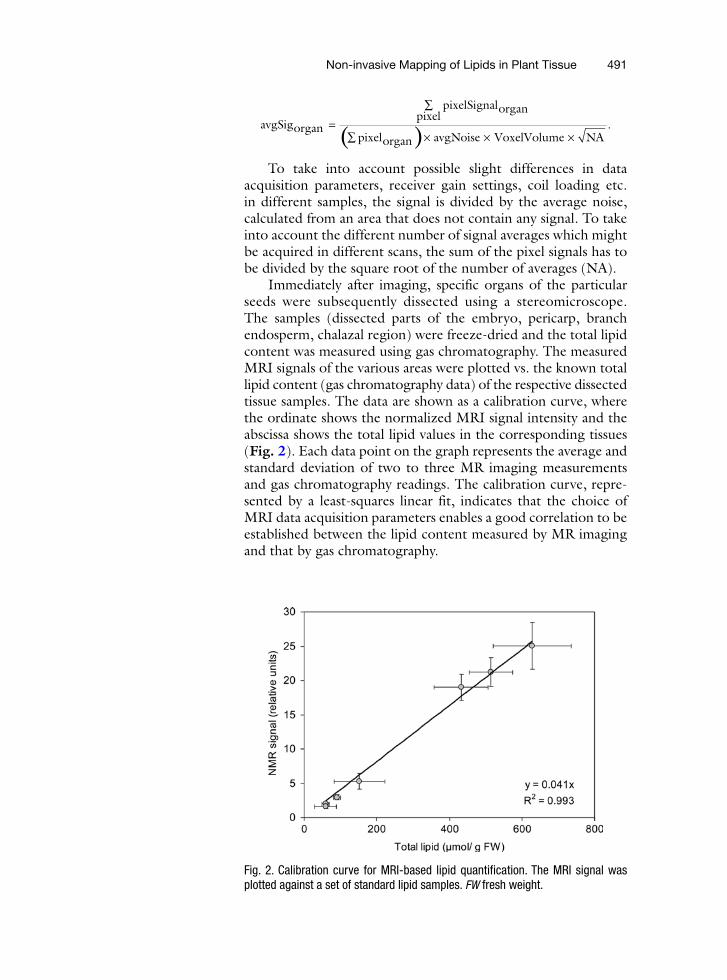
To take into account possible slight differences in data acquisition parameters, receiver gain settings, coil loading etc. in different samples, the signal is divided by the average noise, calculated from an area that does not contain any signal. To take into account the different number of signal averages which might be acquired in different scans, the sum of the pixel signals has to be divided by the square root of the number of averages (NA).
Immediately after imaging, specific organs of the particular seeds were subsequently dissected using a stereomicroscope. The samples (dissected parts of the embryo, pericarp, branch endosperm, chalazal region) were freeze-dried and the total lipid content was measured using gas chromatography. The measured MRI signals of the various areas were plotted vs. the known total lipid content (gas chromatography data) of the respective dissected tissue samples. The data are shown as a calibration curve, where the ordinate shows the normalized MRI signal intensity and the abscissa shows the total lipid values in the corresponding tissues (Fig. 2). Each data point on the graph represents the average and standard deviation of two to three MR imaging measurements and gas chromatography readings. The calibration curve, repre-sented by a least-squares linear fit, indicates that the choice of MRI data acquisition parameters enables a good correlation to be established between the lipid content measured by MR imaging and that by gas chromatography.
Fig. 2. Calibration curve for MRI-based lipid quantification. The MRI signal was plotted against a set of standard lipid samples. FW fresh weight.
213
214215216217218219220221222223224225226227228229230231232233234235236237
492 Neuberger et al.
BookID 157986_ChapID 24_Proof# 1 - 17/06/2009 BookID 157986_ChapID 24_Proof# 1 - 17/06/2009
Finally, it should be noted that for some samples, with a very short T2 value, care has to be taken in calculating the actual spatial resolution, i.e., pixel size of the image. The resolution in the phase encoding direction is given by the image field-of-view divided by the number of data points acquired. In the frequency encoding direction, there is an additional contribution to the spatial resolution (∆xT2) given by:
∆ =γT2
2
1,x
G Tp
where G is the value of the frequency encoding gradient. It is important, therefore, to use strong gradients in order to mini-mize the additional broadening factor.
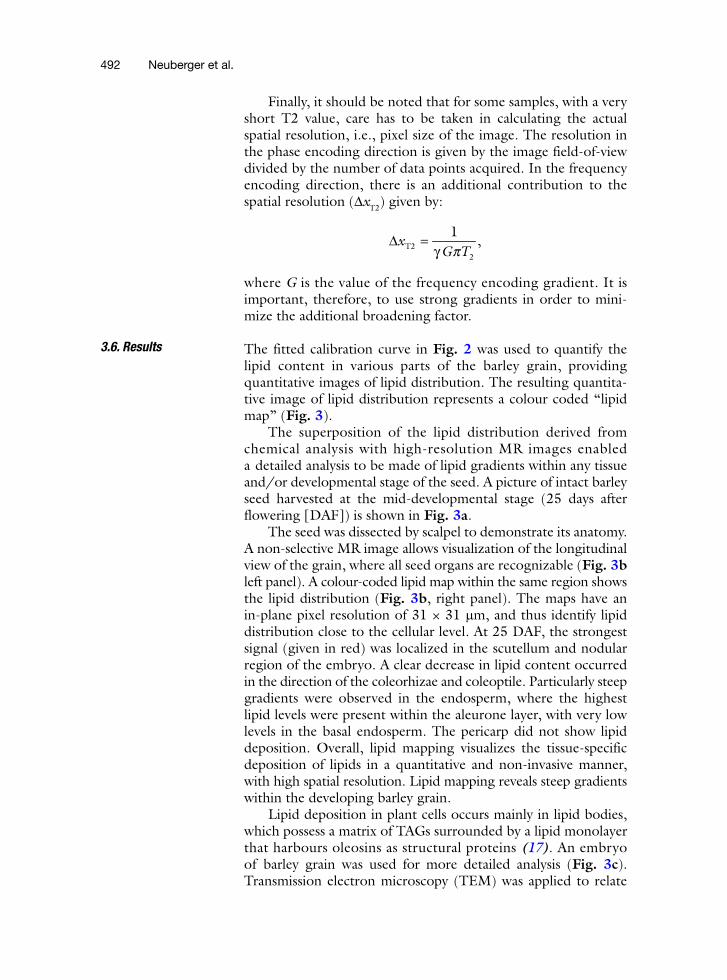
The fitted calibration curve in Fig. 2 was used to quantify the lipid content in various parts of the barley grain, providing quantitative images of lipid distribution. The resulting quantita-tive image of lipid distribution represents a colour coded “lipid map” (Fig. 3).
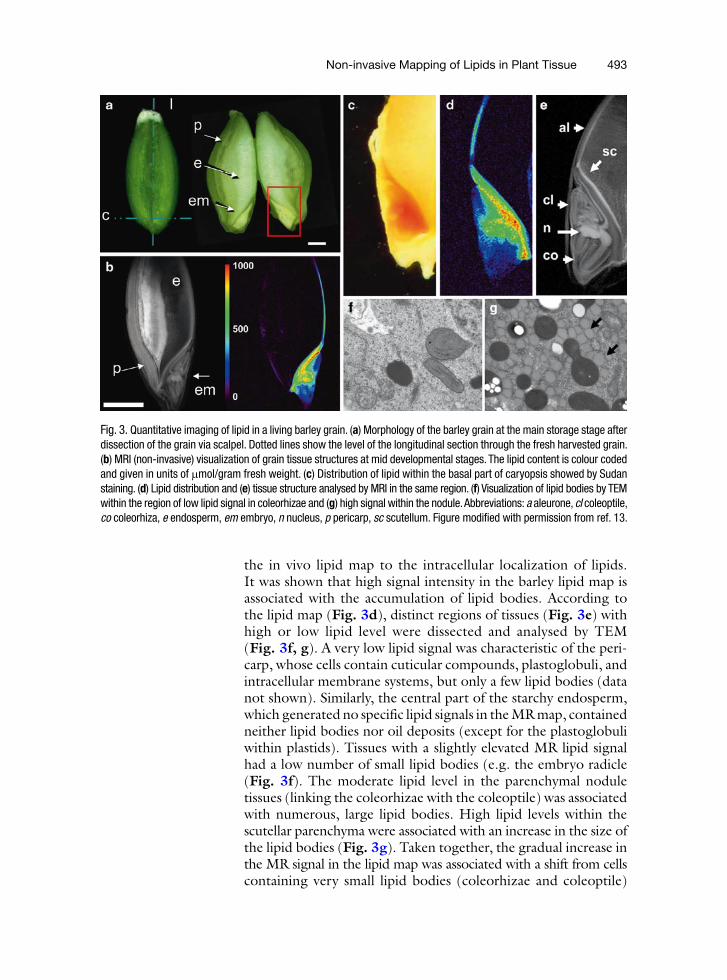
The superposition of the lipid distribution derived from chemical analysis with high-resolution MR images enabled a detailed analysis to be made of lipid gradients within any tissue and/or developmental stage of the seed. A picture of intact barley seed harvested at the mid-developmental stage (25 days after flowering [DAF]) is shown in Fig. 3a.
The seed was dissected by scalpel to demonstrate its anatomy. A non-selective MR image allows visualization of the longitudinal view of the grain, where all seed organs are recognizable (Fig. 3b left panel). A colour-coded lipid map within the same region shows the lipid distribution (Fig. 3b, right panel). The maps have an in-plane pixel resolution of 31 × 31 mm, and thus identify lipid distribution close to the cellular level. At 25 DAF, the strongest signal (given in red) was localized in the scutellum and nodular region of the embryo. A clear decrease in lipid content occurred in the direction of the coleorhizae and coleoptile. Particularly steep gradients were observed in the endosperm, where the highest lipid levels were present within the aleurone layer, with very low levels in the basal endosperm. The pericarp did not show lipid deposition. Overall, lipid mapping visualizes the tissue-specific deposition of lipids in a quantitative and non-invasive manner, with high spatial resolution. Lipid mapping reveals steep gradients within the developing barley grain.
Lipid deposition in plant cells occurs mainly in lipid bodies, which possess a matrix of TAGs surrounded by a lipid monolayer that harbours oleosins as structural proteins (17). An embryo of barley grain was used for more detailed analysis (Fig. 3c). Transmission electron microscopy (TEM) was applied to relate
3.6. Results
238
239240241242243244
245
246247248
249250251252253254255256257258259260261262263264265266267268269270271272273274275276277278279280281
Non-invasive Mapping of Lipids in Plant Tissue 493
BookID 157986_ChapID 24_Proof# 1 - 17/06/2009
Fig. 3. Quantitative imaging of lipid in a living barley grain. (a) Morphology of the barley grain at the main storage stage after dissection of the grain via scalpel. Dotted lines show the level of the longitudinal section through the fresh harvested grain. (b) MRI (non-invasive) visualization of grain tissue structures at mid developmental stages. The lipid content is colour coded and given in units of mmol/gram fresh weight. (c) Distribution of lipid within the basal part of caryopsis showed by Sudan staining. (d) Lipid distribution and (e) tissue structure analysed by MRI in the same region. (f) Visualization of lipid bodies by TEM within the region of low lipid signal in coleorhizae and (g) high signal within the nodule. Abbreviations: a aleurone, cl coleoptile, co coleorhiza, e endosperm, em embryo, n nucleus, p pericarp, sc scutellum. Figure modified with permission from ref. 13.
the in vivo lipid map to the intracellular localization of lipids. It was shown that high signal intensity in the barley lipid map is associated with the accumulation of lipid bodies. According to the lipid map (Fig. 3d), distinct regions of tissues (Fig. 3e) with high or low lipid level were dissected and analysed by TEM (Fig. 3f, g). A very low lipid signal was characteristic of the peri-carp, whose cells contain cuticular compounds, plastoglobuli, and intracellular membrane systems, but only a few lipid bodies (data not shown). Similarly, the central part of the starchy endosperm, which generated no specific lipid signals in the MR map, contained neither lipid bodies nor oil deposits (except for the plastoglobuli within plastids). Tissues with a slightly elevated MR lipid signal had a low number of small lipid bodies (e.g. the embryo radicle (Fig. 3f). The moderate lipid level in the parenchymal nodule tissues (linking the coleorhizae with the coleoptile) was associated with numerous, large lipid bodies. High lipid levels within the scutellar parenchyma were associated with an increase in the size of the lipid bodies (Fig. 3g). Taken together, the gradual increase in the MR signal in the lipid map was associated with a shift from cells containing very small lipid bodies (coleorhizae and coleoptile)
282
283284285286287288289290291292293294295296297298299300301
494 Neuberger et al.
BookID 157986_ChapID 24_Proof# 1 - 17/06/2009 BookID 157986_ChapID 24_Proof# 1 - 17/06/2009
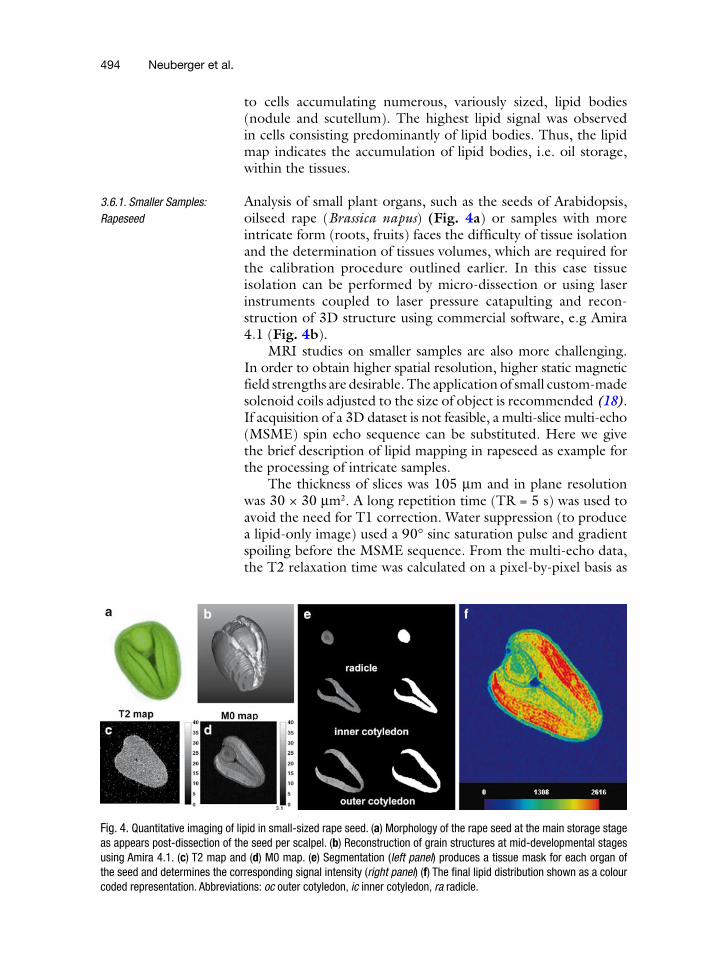
to cells accumulating numerous, variously sized, lipid bodies (nodule and scutellum). The highest lipid signal was observed in cells consisting predominantly of lipid bodies. Thus, the lipid map indicates the accumulation of lipid bodies, i.e. oil storage, within the tissues.
Analysis of small plant organs, such as the seeds of Arabidopsis, oilseed rape (Brassica napus) (Fig. 4a) or samples with more intricate form (roots, fruits) faces the difficulty of tissue isolation and the determination of tissues volumes, which are required for the calibration procedure outlined earlier. In this case tissue isolation can be performed by micro-dissection or using laser instruments coupled to laser pressure catapulting and recon-struction of 3D structure using commercial software, e.g Amira 4.1 (Fig. 4b).
MRI studies on smaller samples are also more challenging. In order to obtain higher spatial resolution, higher static magnetic field strengths are desirable. The application of small custom-made solenoid coils adjusted to the size of object is recommended (18). If acquisition of a 3D dataset is not feasible, a multi-slice multi-echo (MSME) spin echo sequence can be substituted. Here we give the brief description of lipid mapping in rapeseed as example for the processing of intricate samples.
The thickness of slices was 105 mm and in plane resolution was 30 × 30 mm2. A long repetition time (TR = 5 s) was used to avoid the need for T1 correction. Water suppression (to produce a lipid-only image) used a 90° sinc saturation pulse and gradient spoiling before the MSME sequence. From the multi-echo data, the T2 relaxation time was calculated on a pixel-by-pixel basis as
3.6.1. Smaller Samples: Rapeseed
Fig. 4. Quantitative imaging of lipid in small-sized rape seed. (a) Morphology of the rape seed at the main storage stage as appears post-dissection of the seed per scalpel. (b) Reconstruction of grain structures at mid-developmental stages using Amira 4.1. (c) T2 map and (d) M0 map. (e) Segmentation (left panel) produces a tissue mask for each organ of the seed and determines the corresponding signal intensity (right panel) (f) The final lipid distribution shown as a colour coded representation. Abbreviations: oc outer cotyledon, ic inner cotyledon, ra radicle.
302
303304305306
307308309310311312313314315316317318319320321322323324325326327328329
Non-invasive Mapping of Lipids in Plant Tissue 495
BookID 157986_ChapID 24_Proof# 1 - 17/06/2009
shown in the T2 map in Fig. 4c. An average T2 of 21.3 ± 5.3 ms was calculated from the whole seed. A T2 correction was applied and an example of a resulting net magnetization (M0) map is shown in Fig. 4d. The M0 map represents the actual spin density distribution of the lipids in the seed. A B1 map showed that the homogeneity of the coil was sufficiently high so as not to require a B1 field correction.
Figure 4e shows on the right the mask and on the left the overlay of the mask with the M0 map of the three segmented organs that were cut out and processed as described before to get an average lipid concentration with the gas chromatography method. Figure 4b shows the masks of the whole seed as a 3D model. Having measured the average lipid concentration in the organs the final quantitative lipid distribution in the seed could be calculated (Fig. 4f). Compared to the gas chromatography method, which only gives an average lipid concentration, the MRI-based method shows a detailed quantitative lipid distribu-tion on a pixel-by-pixel basis throughout the seed. Lipid gradients inside specific organs are now visible.
We are grateful to P. Jakob and U. Wobus for support and critical discussion, G. Melkus, A. Purea, and V. C. Behr for help with the MRI. I. Feussner and C. Göbel are acknowledged for help with gas chromatography. Our special thanks to T. Rutten for elec-tron microscopy, U. Tiemann and K. Lipfert for artwork and A. Stegmann for excellent technical assistance. We are grateful for funding by the Deutsche Forschungsgemeinschaft (Project number RO 2411/2–1/2–2 and BO 1917/2–1), and the Federal Ministry of Education and Research (BMBF; GABI SEED II grant). Andrew G. Webb and Thomas Neuberger acknowledge support of the Alexander von Humboldt Stiftung, Wolfgang Paul Preis.
Acknowledgments
References
1. Breithaupt H. (2006) Seeing is understanding. EMBO; Rep. 7: 467–470.
2. Kano H, Ishida N, Kobayashi T, Koizuml M. (1990) 1H-NMR imaging analysis of changes of free water distribution in barley and soybean seeds during maturation. Jpn. J. Crop Sci.; 59: 503–509.
3. Pope JM, Jonas D, Walker RR. (1993) Applica-tions of NMR micro-imaging to the study of water, lipid, and carbohydrate distribution in grape berries. Protoplasma; 173: 357–363.
4. Baeten V, Aparicio R. (2000) Edible oils and fats authentication by Fourier transform Raman spectrometry. Biotechnol. Agron. Soc. Environ.; 4: 196–203.
5. Baranska M, Schulz H, Reitzenstein S, Uhlemann U, Strehle MA, Kruger H, Quilitzsch R, Foley W, Popp J. (2005) Vibra-tional spectroscopic studies to acquire a quality control method o f Eucalyptus essential oils. Biopolymers; 78: 237–248.
330
331332333334335336337338339340341342343344345346347348
349
350351352353354355356357358359360361
362
363364365366367368369370371372
496 Neuberger et al.
BookID 157986_ChapID 24_Proof# 1 - 17/06/2009
6. Borisjuk L, Nguyen TH, Neuberger T, Rutten T, Tschiersch H, Claus B, Feussner I, Webb AG, Jakob P, Weber H, Wobus U. and Rolletschek H. (2005) Gradients of lipid storage, photosynthesis and plastid differentia-tion in developing soybean seeds. New Phytol.; 167: 761–776.
7. Adlof, R.O. (2003) Advances in Lipid Method-ology – Five. Bridgwater, Somerset: The Oily Press.
8. Ratcliffe RG, Shachar-Hill Y. (2001) Probing plant metabolism with NMR. Annu. Rev. Plant Physiol. Plant Mol. Biol.; 52: 499–526.
9. Knothe G, Kenar JA. (2004) Determination of the fatty acid profile by 1H-NMR spectroscopy. Eur. J. Lipid Sci. Technol.; 106: 88–96.
10. Débarre D, Supatto W, Pena AM, Fabre A, Tordjmann T, Combettes L, Schanne-Klein MC, Beaurepaire E. (2006) Imaging lipid bodies in cells and tissues using third-harmonic genera-tion microscopy. Nat. Methods; 3: 47–53.
11. Débarre D, Beaurepaire E. (2007) Quantita-tive characterization of biological liquids for third-harmonic generation microscopy. Bio-phys. J.; 92: 603–612.
12. Köckenberger W, DePanfilis C, Santoro D, Dahiva P, Rawsthorne S. (2004) High resolution
NMR microscopy of plants and fungi. J. Microsc.; 214: 182–189.
13. Neuberger T, Sreenivasulu N, Rokitta M, Rolletschek H, Göbel C, Rutten T, Radchuk V, Feussner I, Wobus U, Jakob P, Webb A, Borisjuk L. (2008) Quantitative imaging of oil storage in developing crop seeds. Plant Biotechnol. J.; 6: 31–45
14. Ishida N, Koizumi M, Kano H. (2000) The NMR microscope: a unique and prom-ising tool for plant science. Ann. Bot.; 86: 259–278.
15. Van der Weerd L, Claessens MAE, Ruttink T, Vergeldt FJ, Schaafsma TJ, Van As H. (2001) Quantitative NMR microscopy of osmotic stress responses in maize and pearl millet. J. Exp. Bot.; 52: 2333–2343.
16. Van As H. (2007) Intact plant MRI for the study of water relations, membrane, perme-ability, cell-to-cell and long distance water transport. J. Exp. Bot.; 58: 743–756
17. Huang AHC. (1992) Oil bodies and oleosins in seeds. Annu. Rev. Plant Physiol. Mol. Biol.; 43: 177–200.
18 Webb AG. (1997) Radiofrequency microcoils in magnetic resonance. Prog. NMR Spectrosc.; 31: 1–42.
373374375376377378379380381382383384385386387388389390391392393394395396397398399400