current progress in non-invasive imaging of beta cell mass of the endocrine pancreas
TRANSCRIPT
Current Medicinal Chemistry, 2006, 13, 2761-2773 2761
0929-8673/06 $50.00+.00 © 2006 Bentham Science Publishers Ltd.
Current Progress in Non-Invasive Imaging of Beta Cell Mass of the Endocrine Pancreas
Fabiola Souza1, Matthew Freeby1, Kristi Hultman2, Norman Simpson3, Alan Herron4, Piotr Witkowsky5, Eric Liu 6, Antonella Maffei7 and Paul E. Harris*,1
1Department of Medicine, Columbia University Medical Center, New York, NY 10032, USA
2Department of Applied Physics and Applied Mathematics, Columbia University, New York, NY 10032, USA
3Department of Radiology, Columbia University Medical Center, New York, NY 10032, USA
4Comparative Medicine and Pathology, Baylor College of Medicine, Houston, TX 77030, USA
5Department of Surgery, Columbia University Medical Center, New York, NY, 10032, USA
6Diabetes Branch, NIDDK, National Institutes of Health, Bethesda, MD 20854, USA
7Institute of Genetics and Biophysics "Adriano Buzzati-Traverso", CNR, Naples, 80131, Italy
Abstract: The increasing incidence of diabetes requires a better understanding of the pathogenesis of the clinical disease.
Studies in prevention and treatment have been hampered by the single end-point of diagnosis of diabetes and hyperglyce-
mia. The common pathology in both type 1 and type 2 diabetes is insufficient beta-cell mass to meet the metabolic de-
mand. Unfortunately, current diagnostic methods rely on metabolic responses that do not accurately reflect true beta-cell
mass. Recent advances in beta-cell imaging have utilized multiple modalities in experimental and clinical settings. While
no “gold-standard” exists to measure beta-cell mass, modalities such as single photon emission computed tomography,
optical and fluorescent imaging, magnetic resonance imaging, and positron emission tomography have been used with
mixed success. Many of the methods are limited by the inability to translate to the clinical setting, poor discrimination be-
tween the exocrine and endocrine pancreas, or a poor measurement of beta-cell mass. However, promising new “neuro-
functional imaging” approaches have emerged as improved measures of beta-cell mass. We review the current under-
standing of the pathogenesis and evaluation of diabetes, as well as experimental approaches to assessing beta-cell mass.
Keywords: Non-invasive beta cell imaging, diabetes, islet transplantation, pancreas.
I. INTRODUCTION
Advances in imaging technology and molecular imaging chemistry allow for the collection of quantitative information from small and deep organs that until recently was impossi-ble. In the field of diabetes medicine, the ability to non-invasively estimate the mass of insulin producing beta-cells within the Islets of Langerhans will most likely have great impact on the diagnosis and treatment of this common and burdensome disease. Diabetes results from an absolute or relative decline in pancreatic beta cell mass (BCM) leading to insufficient insulin secretion and hyperglycemia. In type 1 diabetes (T1DM), hyperglycemia occurs when the beta cells are selectively destroyed by an autoimmune process. In type 2 diabetes (T2DM), intercurrent metabolic stress results in insulin resistance and increased insulin demand. Hypergly-cemia occurs, presumably when declining BCM can no longer compensate for the increased need for insulin. Meas-urement of insulin secretory capacity is currently used as a surrogate measure of BCM. Unfortunately, serum insulin concentrations provide only an imprecise reflection of BCM. Because the pancreas is a heterogeneous “hard-to-biopsy” organ, there is no currently available reliable measure of
*Address correspondence to this author at the Department of Medicine,
Columbia University Medical Center, New York, NY, 10032, USA; E-mail: [email protected]
BCM and thus it is currently not possible to distinguish reliably between anatomical versus functional defects of insulin secretion.
In this article we outline several key characteristics of diabetes, including the anatomy and pathophysiology, illus-trating why development of imaging technology is an impor-tant priority if we are to better understand and treat the dis-ease. Afterward, we review recent progress in the imaging field, the development of suitable reagents and interpretation of these measurements that show promise to allow the as-sessment of beta cell mass to assist management and diagno-sis of type 1 and type 2 diabetes.
II. BURDEN OF DIABETES
According to the World Health Association (WHO), the current rates of diabetes are at epidemic levels. In 1985, an estimated 30 million people worldwide had diabetes, and that number continues to climb. The number was up to 135 million by 1995, and by 2005 it was estimated at 217 mil-lion. By 2030, the WHO predicts that at least 366 million people will be affected [1]. The increasing prevalence of T2DM will fuel most of this growth. Fortunately T1DM is relatively rare, accounting for only about 10 % of the total number of cases of diabetes diagnosed per year. Unfortu-nately, both forms of diabetes cause illness and premature death; the overall age-adjusted death rate for persons with
2762 Current Medicinal Chemistry, 2006, Vol. 13, No. 23 Souza et al.
diabetes is twice that of persons without diabetes [2]. The disease is a major cause of heart disease, kidney failure, limb amputation and blindness [3], and accounts for approxi-mately 5-10% of the total healthcare budget in many coun-tries [1]. The American Diabetes Association has estimated the total cost of diabetes in the United States in 2002 was approximately $132 billion. Costs could rise as high as $192 billion by 2020 [1]. Although improved glycemic control reduces micro- and macrovascular complications [3], the overall risk remains elevated. Therefore improvements in understanding and treatment would improve the lives of dia-betic patients and reduce the ballooning costs associated with the disease. The ability to non invasively image the pancreas and directly measure the beta cell mass within will probably play an important role in managing and eliminating the pub-lic health burden of this disease.
III. ANATOMY OF THE PANCREAS AND ISLETS OF LANGERHANS
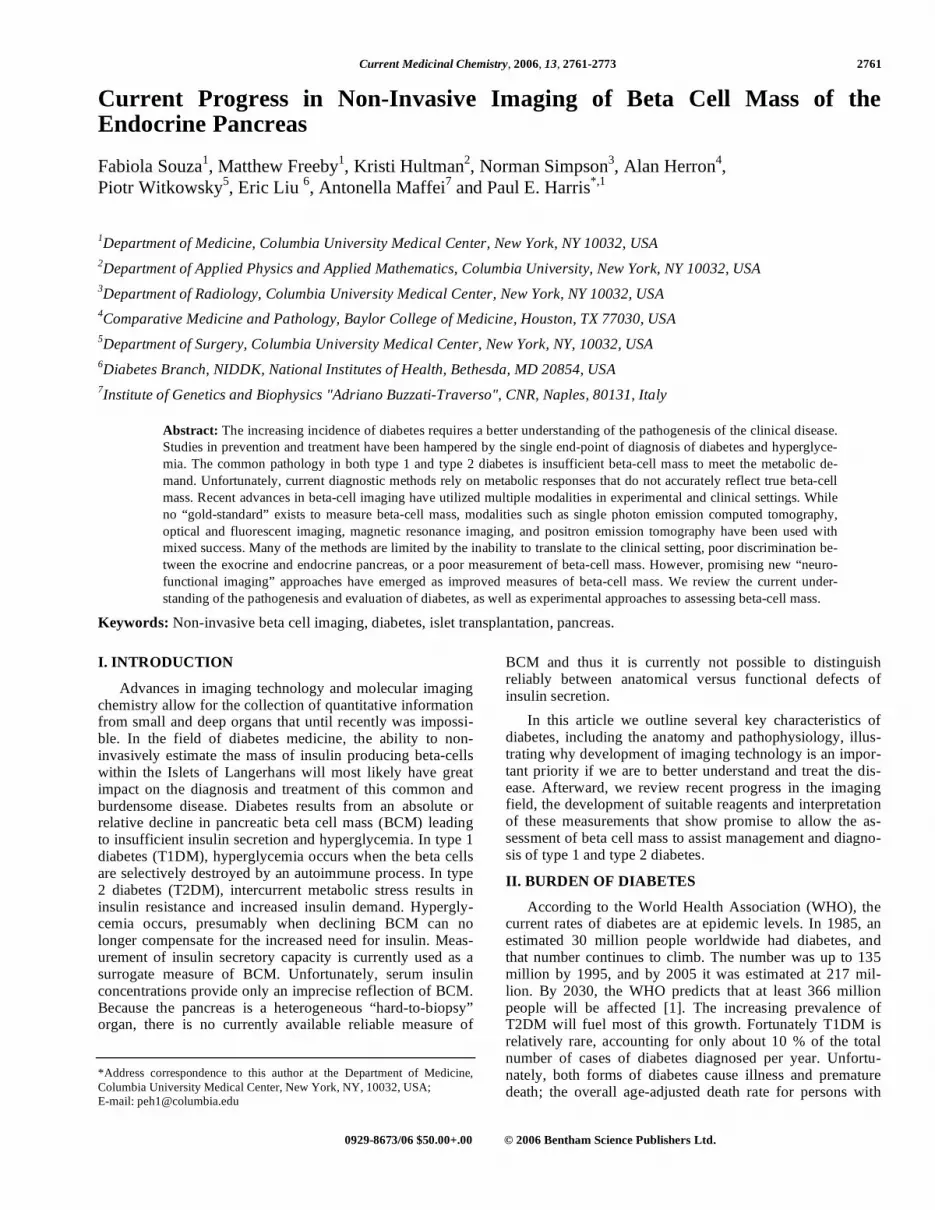
The pancreas is a small elongated pinkish organ nestled deeply in an area between the duodenum, stomach and spleen. From a radiologists point of view, the pancreas can be visualized by MRI using signal sequences that emphasize the fat content of the pancreas (Fig. 1). It is covered with a thin capsule, some of which extends inward into septa, sepa-rating the pancreas into lobules. Most of the pancreas is composed of pancreatic exocrine cells and their associated ducts whose function is devoted to producing digestive en-zymes. Pancreatic exocrine cells are arranged in grape-like clusters. Within the exocrine cells there are membrane-bound secretory granules containing the digestive enzymes. With the appropriate stimulus, the granule contents are se-creted into the lumen of the clusters and these secretions
Fig. (1). A coronal "fat weighted" image of the rat abdomen taken
with a Philips 1.5 Tesla MR scanner showing the location of pan-
creas and adjacent organs. The sedated rat was taped in a prone
position and centered in a knee coil. A T2 weighted FLAIR scan
sequence was used, with a TE of 100 ms and a TR of 6000 ms.
Shown are the pancreas, void of the stomach, spleen and omentum
of the bowel.
flow into progressively larger ducts, which eventually form the main pancreatic duct which drains directly into the small intestine.
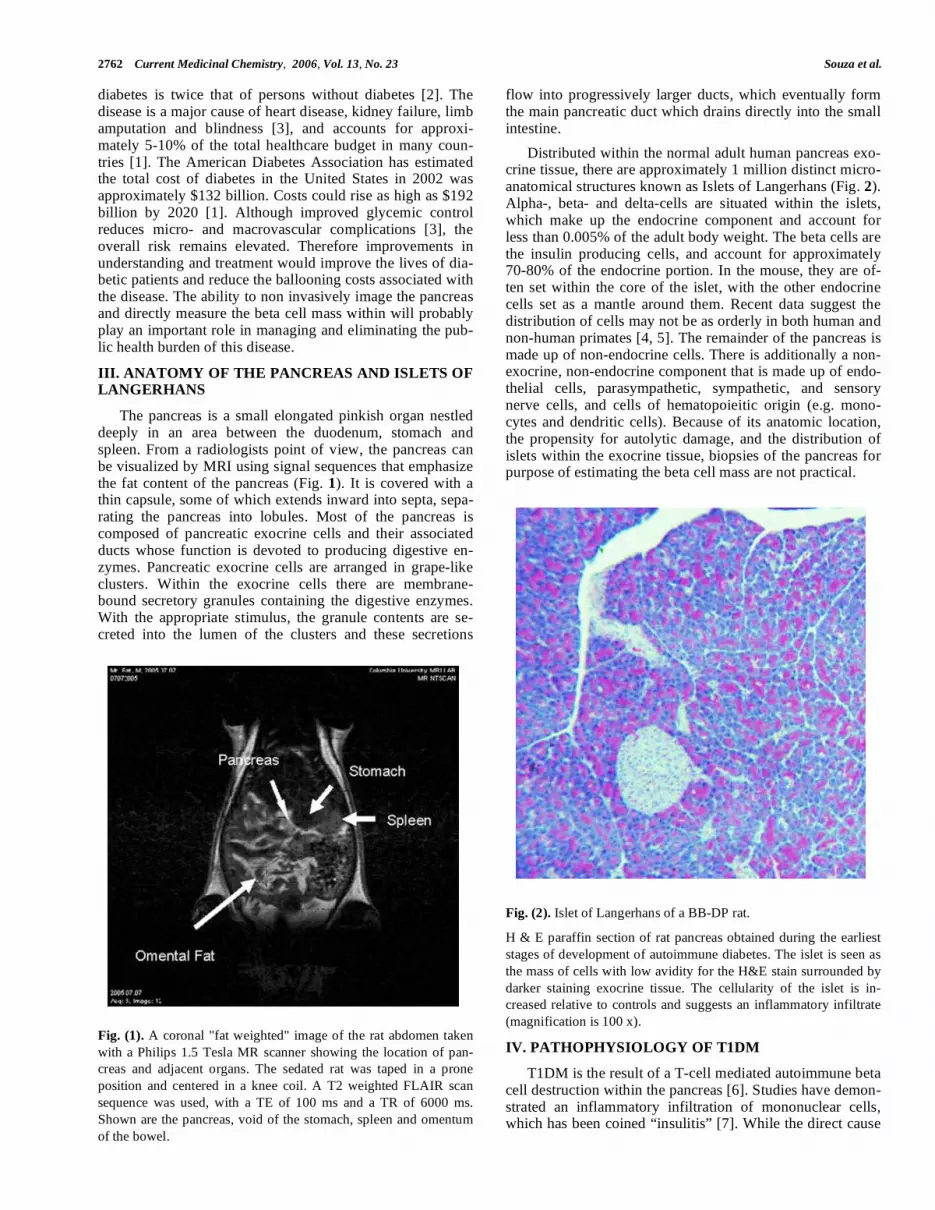
Distributed within the normal adult human pancreas exo-crine tissue, there are approximately 1 million distinct micro-anatomical structures known as Islets of Langerhans (Fig. 2). Alpha-, beta- and delta-cells are situated within the islets, which make up the endocrine component and account for less than 0.005% of the adult body weight. The beta cells are the insulin producing cells, and account for approximately 70-80% of the endocrine portion. In the mouse, they are of-ten set within the core of the islet, with the other endocrine cells set as a mantle around them. Recent data suggest the distribution of cells may not be as orderly in both human and non-human primates [4, 5]. The remainder of the pancreas is made up of non-endocrine cells. There is additionally a non-exocrine, non-endocrine component that is made up of endo-thelial cells, parasympathetic, sympathetic, and sensory nerve cells, and cells of hematopoieitic origin (e.g. mono-cytes and dendritic cells). Because of its anatomic location, the propensity for autolytic damage, and the distribution of islets within the exocrine tissue, biopsies of the pancreas for purpose of estimating the beta cell mass are not practical.
Fig. (2). Islet of Langerhans of a BB-DP rat.
H & E paraffin section of rat pancreas obtained during the earliest
stages of development of autoimmune diabetes. The islet is seen as
the mass of cells with low avidity for the H&E stain surrounded by
darker staining exocrine tissue. The cellularity of the islet is in-
creased relative to controls and suggests an inflammatory infiltrate
(magnification is 100 x).
IV. PATHOPHYSIOLOGY OF T1DM
T1DM is the result of a T-cell mediated autoimmune beta cell destruction within the pancreas [6]. Studies have demon-strated an inflammatory infiltration of mononuclear cells, which has been coined “insulitis” [7]. While the direct cause

Imaging -Cells In Situ Current Medicinal Chemistry, 2006, Vol. 13, No. 23 2763
of T1DM is known (viz. autoreactive T cells), much remains unknown regarding the distal genetic and environmental factors which influence the risk for disease, and the natural history of the disease as it progresses.
Viral illness has been linked as a causative or triggering environmental factor in T1DM. Multiple viral pathogens have been implicated including mumps, rubella, coxsackievi-rus B4, retrovirus, rotavirus, cytomegalovirus, and Epstein-Barr viruses [8]. In addition to multiple case reports linking viral illness and T1DM, epidemiological studies have sug-gested T1DM may be a communicable disease. In a popula-tion of 15 to 34-year olds, annual variation in diagnosis was higher during winter months [9]. Children with congenital rubella develop T1DM at very high rates, which are usually preceded by islet cell autoantibodies [10]. Coxsackie B4 virus has been studied extensively: a landmark study in 1979 demonstrated that a virus isolated from the pancreas of a child who died at presentation was able to cause diabetic activity in various mouse strains. Coxsackievirus B4 infec-tion may induce beta cell destruction by neoantigen produc-tion, initiating an autoimmune reaction [11]. It has been shown that GAD65 and coxsackievirus antigen share a simi-lar sequence.
There exist several regions in the human genome that have been associated with T1DM. One of them, the HLA (human leukocyte antigen) region contains several genes involved in triggering immunity and T cell destruction of "sick" tissue. There are at least two genes in the HLA region that carry the lion’s share of the risk for diabetes people in-herit from their parents. Different alleles of these genes can place a person at risk, or protect them from developing T1DM. One set of genes in the HLA region that plays an important role in diabetes is called DQ. Two haplotypes (DQB1*0302-A1*0301, DRB1*04 and DQB1*0201-A1*0501 DRB1*03) confer the strongest predisposition, whereas the DQB1*0602 and DQB1*0603 alleles provide protection from T1DM. While people inherit HLA genes from each parent and it is the combination of these two forms of the genes that determine a person's overall risk. The penetrance of the HLA risk factors is less than fifty percent (i.e. less than 1 out of 2 identical twin siblings of patients with T1DM will get T1DM themselves). The specific HLA regions accounts for about one-half of the genetic suscepti-bility through various protective and predisposing haplo-types. Other loci have smaller effects than the HLA, and include the insulin variable number of tandem repeats, PTPN22, and CTLA-4 [12].
Current molecular genetic diagnostic methods offer HLA typing as means to identify people at risk for the develop-ment of T1DM. Similarly, because T1DM is an autoimmune disease, there are specific antibodies in peripheral blood of some individuals with T1DM that can assist in identifying individuals at risk for T1DM [12]. Anti-insulin and islet cell antibodies have been used as protein disease markers for T1DM. The prodromal phase of T1DM is often character-ized by the appearance of one or more autoantibodies to glu-tamic acid decarboxylase (GAD65), insulinoma-associated antigen-2 (IA-2), insulin (IAA) or islet cells (ICA) [13]. In the Diabetes Prevention Trial (DPT-1), the antibodies were used to assess risk of developing diabetes in 1st-degree rela-tives of type 1 diabetics. Individuals with two or more
autoantibodies had a 68% 5-year risk and those with three were closer to 100% risk of developing diabetes in 5 years [14]. Antibodies provide a good assessment for those rela-tives at risk, yet 85-90% of T1DM cases are diagnosed with-out a family history [15]. However, in the non diabetic popu-lation, the presence of anti islet antibodies can be as high as 5 in every 100 individuals. Thus both HLA typing and autoantibodies have shortcomings as reliable prognostic methods. In addition, autoantibodies levels do not seem to change with interventions affecting the natural history of disease [6].
Ultimately, T1DM progresses to near complete loss of insulin secretory capacity with requirements of exogenous insulin for survival. The newly diagnosed T1DM pancreas is diminished in size as compared to age-matched controls [16]. Specifically, there is a loss of beta cells. At clinical onset, a large proportion of the beta cells have disappeared, though not all these cells are equally affected [17]. Addition-ally, islet cell changes may occur over longer periods of time than previously thought and the sequence of immune de-struction remains a mystery. Pancreatic analyses of subjects with recent-onset T1DM demonstrate an infiltration of islets by T and B lymphocytes, monocytes/macrophages, and natu-ral killer cells [18]. Recently, studies have also suggested that there may be significant residual pancreatic insulin se-cretory capacity at diagnosis. These studies are based on indirect evidence and need clarification [19]. Undoubtedly, direct measurements of residual BCM, and function would better explain the natural course of T1DM and provide in-sights into treatment.
V. PATHOPHYSIOLOGY OF T2DM
Whereas the onset of T1DM is directly reflected in pri-mary beta cell failure, T2DM consists of multiple metabolic abnormalities leading to hyperglycemia. These abnormalities include increased hepatic glucose production, impaired insu-lin secretion, and resistance to insulin in multiple tissues [20]. Although T2DM is characterized by the final pheno-typic expression of hyperglycemia, it is determined by a het-erogeneous group of genetic [21], pathologic [22], environ-mental [23, 24] and metabolic [25] abnormalities.
Genetics play a strong role in T2DM; this theory was illustrated in a twin pair study in which one twin was already known to have T2DM [21]. In assessing the other twin, the study demonstrated that 91% developed T2DM. The 9% of twins who did not develop T2DM had mild glucose intoler-ance with an abnormal insulin response to oral glucose. Ad-ditionally, various ethnic groups are at higher risk for T2DM, including African-Americans [26], Mexican-Americans [27] and Pima Indians in New Mexico [28]. In-heritance of T2DM does not localize to one gene and there are multiple other factors involved including diet, exercise, and obesity. Additionally, genetically similar groups have demonstrated differences in T2DM. Statistics published in 1976 revealed a 4% occurrence of T2DM in rural Japan [23]. Contrary to this study, 21% of Japanese-American immi-grants were found in 1987 to develop T2DM [24]. Most likely, western lifestyle modifications including diet and exercise played a role in these differences. Undoubtedly, obesity plays a major role in the pathogenesis of T2DM. The
2764 Current Medicinal Chemistry, 2006, Vol. 13, No. 23 Souza et al.
rates of impaired glucose tolerance and T2DM increase as body mass index increases [29].
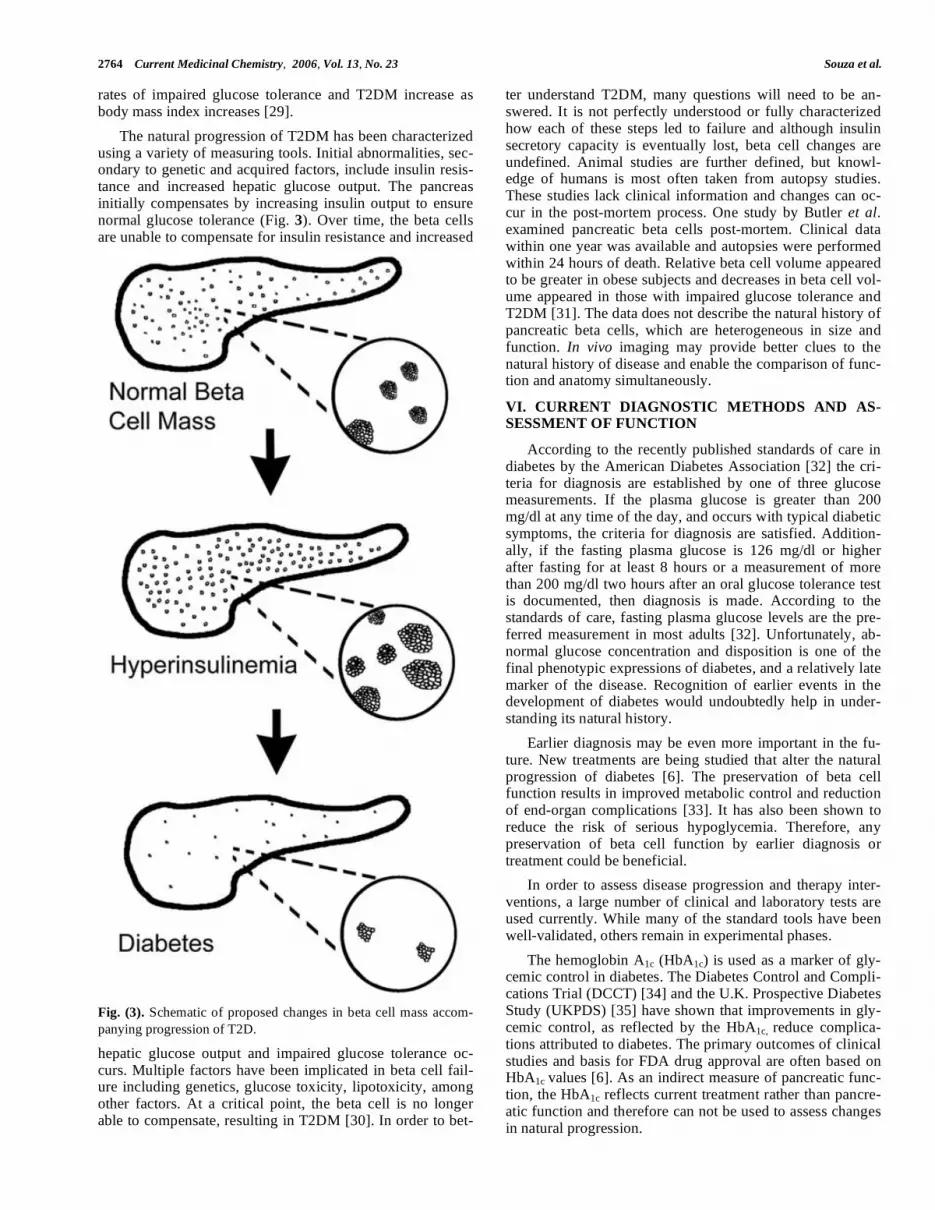
The natural progression of T2DM has been characterized using a variety of measuring tools. Initial abnormalities, sec-ondary to genetic and acquired factors, include insulin resis-tance and increased hepatic glucose output. The pancreas initially compensates by increasing insulin output to ensure normal glucose tolerance (Fig. 3). Over time, the beta cells are unable to compensate for insulin resistance and increased
Fig. (3). Schematic of proposed changes in beta cell mass accom-
panying progression of T2D.
hepatic glucose output and impaired glucose tolerance oc-curs. Multiple factors have been implicated in beta cell fail-ure including genetics, glucose toxicity, lipotoxicity, among other factors. At a critical point, the beta cell is no longer able to compensate, resulting in T2DM [30]. In order to bet-
ter understand T2DM, many questions will need to be an-swered. It is not perfectly understood or fully characterized how each of these steps led to failure and although insulin secretory capacity is eventually lost, beta cell changes are undefined. Animal studies are further defined, but knowl-edge of humans is most often taken from autopsy studies. These studies lack clinical information and changes can oc-cur in the post-mortem process. One study by Butler et al. examined pancreatic beta cells post-mortem. Clinical data within one year was available and autopsies were performed within 24 hours of death. Relative beta cell volume appeared to be greater in obese subjects and decreases in beta cell vol-ume appeared in those with impaired glucose tolerance and T2DM [31]. The data does not describe the natural history of pancreatic beta cells, which are heterogeneous in size and function. In vivo imaging may provide better clues to the natural history of disease and enable the comparison of func-tion and anatomy simultaneously.
VI. CURRENT DIAGNOSTIC METHODS AND AS-SESSMENT OF FUNCTION
According to the recently published standards of care in diabetes by the American Diabetes Association [32] the cri-teria for diagnosis are established by one of three glucose measurements. If the plasma glucose is greater than 200 mg/dl at any time of the day, and occurs with typical diabetic symptoms, the criteria for diagnosis are satisfied. Addition-ally, if the fasting plasma glucose is 126 mg/dl or higher after fasting for at least 8 hours or a measurement of more than 200 mg/dl two hours after an oral glucose tolerance test is documented, then diagnosis is made. According to the standards of care, fasting plasma glucose levels are the pre-ferred measurement in most adults [32]. Unfortunately, ab-normal glucose concentration and disposition is one of the final phenotypic expressions of diabetes, and a relatively late marker of the disease. Recognition of earlier events in the development of diabetes would undoubtedly help in under-standing its natural history.
Earlier diagnosis may be even more important in the fu-ture. New treatments are being studied that alter the natural progression of diabetes [6]. The preservation of beta cell function results in improved metabolic control and reduction of end-organ complications [33]. It has also been shown to reduce the risk of serious hypoglycemia. Therefore, any preservation of beta cell function by earlier diagnosis or treatment could be beneficial.
In order to assess disease progression and therapy inter-ventions, a large number of clinical and laboratory tests are used currently. While many of the standard tools have been well-validated, others remain in experimental phases.
The hemoglobin A1c (HbA1c) is used as a marker of gly-cemic control in diabetes. The Diabetes Control and Compli-cations Trial (DCCT) [34] and the U.K. Prospective Diabetes Study (UKPDS) [35] have shown that improvements in gly-cemic control, as reflected by the HbA1c, reduce complica-tions attributed to diabetes. The primary outcomes of clinical studies and basis for FDA drug approval are often based on HbA1c values [6]. As an indirect measure of pancreatic func-tion, the HbA1c reflects current treatment rather than pancre-atic function and therefore can not be used to assess changes in natural progression.
Imaging -Cells In Situ Current Medicinal Chemistry, 2006, Vol. 13, No. 23 2765
The insulin/glucose clamp technique has more direct measures of pancreatic and tissue function. In the euglyce-mic clamp a constant hyperinsulinemic infusion is delivered with varying levels of glucose infusion. Endogenous glucose production is suppressed and the rate of glucose delivery is equal to the glucose utilization. This method evaluates insu-lin resistance and can be used to assess the efficacy of vari-ous drugs [36]. Additionally, other measures can be per-formed including radiolabeled glucose infusion, indirect calorimetry, limb catheterization, and muscle biopsy [37]. The hyperglycemic clamp stimulates an endogenous insulin response and allows for evaluation of pancreatic response [36]. These techniques are validated and provide valuable information, but are labor intensive and provide functional information without direct characterization of the BCM, an important distinction because of the individual beta-cell’s ability to increase insulin production to meet metabolic needs. This is true for all current measurements. Autopsy studies are often unreliable and animal studies provide only part of the picture. The information provided by advance-ments in imaging in assessing the relation of BCM and pan-creatic function could become indispensable.
C-peptide is an important marker of beta cell function. According to an American Diabetes Association workshop report published in 2004 [6], c-peptide levels are the most appropriate measure of function in human clinical trials. En-dogenous insulin secretion is likely the most direct meas-urement of pancreatic function, though its accuracy is low as first pass metabolism in the liver is large and variable. Fur-ther, insulin assays are not accurate at the low levels typi-cally seen in diabetes [6] and are unable to differentiate en-dogenous from exogenous insulin [6]. Conversely, the c-peptide level is a well-validated means of quantifying insulin secretion. It is a byproduct of enzymatic cleavage of proinsu-lin to insulin, does not undergo hepatic clearance, and is not part of the human recombinant insulin injection used by pa-tients with diabetes. The half-life of c-peptide is approxi-mately 30 minutes, compared to 4 minutes for plasma insulin [38]. With a low variability and high reproducibility in measurements, it is a good marker of beta cell function.
VII. RESERVE CAPACITY AND THE CRITICAL BETA CELL MASS
There exists a reserve capacity of insulin production within the population of beta cells in the pancreas which severely limits the extrapolation of insulin secretion meas-urements to indexes of beta cell mass. Following a normal meal, not every beta cell appears to be recruited into an insu-lin secreting cell. This reserve capacity explains why much of beta cell loss is clinically silent until a certain threshold is reached.
The critical beta cell mass needed to avert diabetes de-pends upon the size of the individual, degree of insulin resis-tance, and intercurrent metabolic stress. The relationship between BCM and glucose homeostasis has been character-ized in many studies using several species and a number of different approaches to measuring beta cell function [39]. In the Göttingen minipig, fasting and postprandial plasma glu-cose concentrations are affected only when BCM is reduced to approximately 5 mg/kg body mass versus the normal value of 20 mg/kg [40]. The ~ 75% reduction of BCM result-
ing in fasting hyperglycemia is consistent with a previous study in which an ~ 60% reduction in BCM resulted in fast-ing hyperglycemia in minipigs [41, 42]. Similar studies in baboons have shown that a 50–60% reduction of BCM re-sults in deranged glucose homeostasis [43], whereas in both humans [16, 44, 45] and rodents [46, 47] different experi-mental approaches suggest that a 70–90% reduction of BCM may be required to produce fasting hyperglycemia. For ex-ample, beta cell mass was reduced by 42% in 13-week-old non-diabetic NOD mice, and by 73% in 18-week-old dia-betic NOD mice [39]. In BB-DP/WOR rats, pancreatic BCM was reduced by 75% on the first day of overt autoimmune diabetes [47]. Most likely, these minor differences in esti-mates of critical beta cell mass are due to species-specific differences, small sample sizes, and/or the likely variability in beta cell function at very low beta cell mass [42]. As men-tioned above, all the assessments of BCM illustrated were performed as terminal procedures and thus not suitable for clinical use.
VIII. CURRENT AND FUTURE THERAPIES - TYPE 1 DIABETES MELLITUS
A variety of experimental treatments have been devel-oped to treat T1DM including immuno- and stem cell ther-apy and islet transplantation. Insulin remains the mainstay of T1DM therapy. It is given in multiple forms including long- and short-acting as well as through continuous insulin deliv-ery systems. Clinical trial data demonstrate that insulin is not the cure. It lowers glucose levels, but does not prevent long-term complications including retinopathy, nephropathy, neu-ropathy, and cardiovascular disease.
Experimental therapies are in various stages of develop-ment, but promise the possibility of offering an eventual cure. Immunotherapy has been discussed as both a method of treatment and a potential prevention of disease. Therapies in immunotherapy are aimed at T-cell immune modulation, innate immune system modulation, and specific antigen vac-cination [48]. Islet transplantation is less experimental and used in limited clinical settings. It is a method by which is-lets from cadaveric donors are transferred to living recipi-ents. Currently, approximately 850,000 islets are needed to reach insulin independence [49]. Current techniques are lim-ited by two major obstacles – donor supply and chronic im-munosuppression [50]. Two to three separate pancreatic do-nors are needed to supply one recipient; patients take daily potent immunosuppression medications, with a resulting initial insulin independence rate of 80% at one year, 65% at two years, and 10% at five years [51]. It is unclear whether insulin dependence occurs because of auto- or alloimmune mediated beta cell destruction, medication-related changes, insulin secretory changes, or some other process. Further-more, evaluation of transplantation is often difficult due to the small mass of cells transplanted into the liver where monitoring for rejection can be difficult [49]. Overall no reliable end point exists for evaluating the efficacy of these interventions due to the shortcoming of insulin secretion measurements.
Other modalities include gene and embryonic stem cell therapy. Gene therapy could theoretically be used to increase the beta cell mass or to induce immune tolerance reducing apoptosis either by itself or in the setting of transplantation
2766 Current Medicinal Chemistry, 2006, Vol. 13, No. 23 Souza et al.
[52]. Stem cell therapy offers theoretical solutions in trans-plantation. Stem cells could be a viable solution to the short-age of donor organs as well as a solution to immune rejec-tion. At this time, much of the basic research remains and the current ethical questions of stem cells continue to be ad-dressed. Understanding the changes within beta cells and their absolute numbers could provide additional clues in transplants and allow for a more accurate description of natu-ral history and interventions.
IX. CURRENT AND FUTURE THERAPIES - TYPE 2 DIABETES MELLITUS
The treatment of T2DM is multi-faceted and includes pharmacologic and non-pharmacologic modalities. Non-pharmacologic therapy is recommended in all patients and can reverse some of the underlying abnormalities. Improve-ments in nutritional therapy, exercise, and weight loss are usually recommended and lifestyle modifications can pre-vent T2DM in those with impaired glucose tolerance [53]. Treatment of T2DM using oral hypoglycemic agents primar-ily targets the three basic underlying abnormalities: insulin resistance, excessive hepatic glucose output, and reduced pancreatic insulin secretion. Therapies include thiazolidin-ediones, metformin, alpha-glucosidase inhibitors, sulfony-lureas, and glinides. Injectable therapies include insulin in varying forms as well as two newly approved agents: pram-lintide and exendin-4. Aside from lifestyle modification, no treatment has proven effective in prevention of T2DM. Fur-ther research is needed to better understand the pathophysi-ology in order to provide treatments that will prevent disease progression. Non-invasive imaging may be one modality to improve research and compare in vivo pancreatic changes with insulin secretion.
X. BETA CELL IMAGING
Recent advances in relatively noninvasive imaging tech-niques such as Magnetic Resonance Imaging (MRI), Posi-tron Emission Tomography (PET), other nuclear imaging techniques, and optical absorption or fluorescence spectros-copy and imaging, make it likely that a clinical exam to monitor beta cell number, mass, function, or lymphocyte infiltration/inflammatory activity can soon be established. This could allow high-risk individuals to be monitored prior to onset of diabetes. Patients could also be monitored over the course of their disease to determine natural history and responses to therapy. Approaches to beta cell imaging in-clude the following modalities:
A. SPECT and Scintigraphy
In Single Photon Emission Computed Tomography (SPECT), gamma ray emissions are the source of informa-tion that a gamma camera collects to acquire 3-dimensional images, whereas scintigraphy normally acquires one dimen-sional images. These gamma rays are emitted from within the patient who has previously been injected with a radio-pharmaceutical or tracer [Vancouver Hospital and Health Sciences Centre's Medical Imaging Research Group's (MIRG's) SPECT Tutorial Web Site. http://www.physics. ubc.ca/~mirg/home/tutorial/intro.html]. There are multiple examples of SPECT or scintigraphy in pancreatic imaging.
Moore et al. used the beta-cell specific monoclonal anti-body IC2, modified with a radioisotope chelator to show
BCM by nuclear imaging. The BCM was evaluated in ex-cised pancreas of normal and streptozotocin (STZ) induced mice. The researchers were able to achieve good correlation between BCM, as measured by point-counting morphometry, and probe accumulation (r2 =0.936) [54]. Yet more work is needed according to the authors, as the exact location of the IC2 antigen on the beta cell surface remains unclear and the radioisotope must be switched to a more practical one with a shorter half life [54]. Recently, Moore et al. conjugated Cy5.5 fluorescent dye with annexin, a marker of apoptosis, and injected it intravenously in different diabetes models. Near-infrared optical imaging of excised pancreases demon-strated clusters of dying cells in diabetic animals, with dif-ferences seen compared to the normal control. The authors speculated that the marker could be used in optical imaging technology and allow real-time identification of apoptosis [55].
Hampe CS et al. evaluated a beta cell specific antibody (K14D10) and its Fab as potential beta cell imaging agents with Sweet’s screening assay and found that the cellular specificity was far below the estimated requisite values needed to overcome the very low beta cell mass in the pan-creas [56].
Dithizone, an agent which chelates zinc, has also been radiolabeled and tested for preferential uptake in the pan-creas. Zinc complexes with proinsulin in beta cells, therefore making it a possible targeting agent. In a rat model of islet transplantation to the testes, specific uptake of the radiolabel was demonstrated [57]. However, in the normal and strepto-zotocin-treated rat, both the exocrine pancreas and liver showed significant uptake. Therefore, in vivo imaging of islets may not be useful. Radioimmunoscintigraphy with anti-ganglioside monoclonal antibodies (mAbs) has been attempted but these studies have been less promising than those using antibodies agains other targets [58]. The mAbs are specific for gangliosides on the beta cell surface, and labeled with radioactive iodine. The labeled mAbs were an order higher in magnitude in beta cells than in acinar tissue, but there was no difference in measurements between normal and STZ-treated rats.
B. Optical Absorption and Fluorescence Imaging
Imaging of living cells and tissues by optical imaging has been well described. Fowler et al. [59] described the use of in vivo bioluminescence imaging (BLI) to evaluate islet mass and survival after transplantation. The authors transplanted luciferase-expressing mouse and/or human islets, via adeno-virus-mediated gene transfer, into the liver or beneath the renal capsule of nonobese diabetic, immunodeficient (NOD/SCID) mice. Using visible light emission from the luciferase signal, the islet cell mass is quantified by a cooled charge-coupled device (CCD) camera and photon-counting image analysis. Data published in 2005 [59] demonstrated that the imaging of islets was stable for more than 8 weeks after transplantation. The signal was about four times greater in the transplanted kidney than liver, accounting for depend-ence on light source imaging. In a similar study, Park et al. [60] injected the mouse insulin I promoter-firefly luciferase (MIP-luc) transgenic construct into pronuclei of fertilized oocytes. The authors were able to visualize luciferase activ-ity in the pancreas via BLI and demonstrate increased activ-
Imaging -Cells In Situ Current Medicinal Chemistry, 2006, Vol. 13, No. 23 2767
ity in high glucose concentrations and image strength corre-lation with islet number. MIP-luc islets were also visualized five days after transplantation in NOD-SCID mice. Simi-larly, Kaufman et al. [49] have used a transgenic (RIP-luc) mouse to non-invasively image as little as 50 transplanted islets per recipient in vivo.
Additionally, Hara et al. [61] have described imaging of beta cells and beta cell progenitors labeled with fluorescent proteins. They have used mouse insulin I promoter (MIP)-green (GFP) and red fluorescent protein (RFP) transgenic mice and noted uneven distribution of beta cells. The beta cells are aligned along the large blood vessels and along pancreatic and common bile ducts. Additionally, by crossing neuogenin3 (Ngn3)-GFP mice with the MIP-RFP model, -cell progenitors mixed with beta cells have been visualized in embryos. The methods described were performed in situ, and likely have a limited role for in vivo studies, as tissue depth penetration is limited. Yet, the use of BLI could be quite useful and provide information regarding pancreatic development and function in both the normal and diseased states for ex vivo models.
Two-photon excitation microscopy (TPEM) has also been evaluated, using two-photon excitation of fluorescence to image pancreatic islets. TPEM allows for a high resolution image of intact living tissue [62], which is seen at thicker slices than conventional confocal microscopy, its predeces-sor. Yet its visualization depth is still less than 1 mm. TPEM has also been used to measure and compare glucose-induced NAD(P)H auto-fluorescence response in islets and dispersed beta cells [63]. The results suggest that beta cell heterogene-ity is less in the intact islet than predicted with dispersed beta cells. Optical imaging has also been used to study calcium's role in insulin exocytosis [64] as well as to study glucokinase activity and mitochondrial redox states [49].
Recently, Chaillet RJ et al. developed a method of visual-izing beta cells that would be useful in the study of both beta cell physiology and the development of the endocrine cells of the pancreas. They were able to construct a modified insu-lin II (InsII) gene allele, InsIIEGFP, which expresses a proinsulin-EGFP (enhanced green fluorescent protein) fusion peptide that are processed in beta cells to insulin and EGFP-tagged c-peptide, which are stored together in cytoplasmic secretory vesicles. The large amount of vesicular EGFP-tagged c-peptide is evident as a characteristic robust and specific fluorescence pattern in the beta cells of InsIIEGFP mice resulting in the visualization of beta cells in vivo in the mouse [65].
A transgenic mouse generated by Park et al. would have great applications in the observation of BCM and function within normal or diseased animals. The beta cells of these mice express firefly (Photinus pyralis) luciferase (luc) which can be readily visualized in vivo using whole-body biolumi-nescent imaging [60].
Lastly Kausar N et al. have isolated peptides (RIP1 and RIP2) that bind to rat islets, and injected their phage clones into normal Sprague-Dawley rats to determine the phage localization. They observed that the phage clone is binding to the beta-cells within the islets, but found that the RIP1 phage does not target beta-cells in diabetic ZDF rats, sug-gesting that this peptide is recognizing a cell surface feature
on normal, fully functional beta-cells that is lost or obscured during disease progression. Despite the necessity of further studies, this peptide might be of utility for beta-cell–specific delivery of molecular cargo, possibly plasmids that contain specific therapeutic/protective genes, bioactive peptides or proteins, small molecules, or imaging agents [66].
C. Magnetic Resonance Imaging (MRI)
MRI is a promising noninvasive technique for islet cell imaging in vivo because it can target possible beta cell spe-cific components, using various mechanisms for contrast enhancement achieving high resolution [49]. However, im-aging of native and transplanted pancreatic islets has been unsuccessful thus far due to their small size, and scattered locations within the exocrine pancreas and liver (site of im-plantation) [67]. Mathis et al. were able to show MR images of microvasculature changes accompanying insulitis in mouse models of diabetes using monocrystalline iron oxide nanoparticles. This approach permits noninvasive visualiza-tion of inflammatory lesions in real time, and could help in early prediction of treatment success. The authors were able to demonstrate differences in imaging as early as three days after anti-CD3 therapy was given to NOD mice [68].
Lately, immunomagnetic iron beads have been used to label beta cells for in vitro and in vivo detection by MRI [69]. Ex vivo labeling of islets destined for transplantaiton was first reported by Jirak et al. [70] and later by others [67, 71, 72]. This technique could represent a useful route of monitoring islet transplants.
Moore et al. have performed multiple studies using MRI to further characterize the beta cell and the pancreas in ex-perimental diabetes. Initially, they utilized cross-linked su-perparamagnetic iron oxide nanoparticles derivatized with membrane translocation signal (CLIO-Tat) to label mice lymphocytes. After adoptive transfer of labeled cells into NOD/SCID recipients, ex vivo MRI images of mice pancre-ases were obtained. The study however failed to show the localization of the label within the pancreas and adjacent organs as well as its quantitation, limiting clinical applica-tion [73]. Also, Moore et al. labeled human islets with mag-netic nanoparticles, modified with near-infrared fluorescent Cy5.5 (MN-NIRF), and implanted them in the kidney cap-sule and liver of nude mice. MRI images of labeled islets demonstrated signal darkening, or areas of hypointense sig-naling. However, more study is needed, as the probe is not specific to the beta cell, limiting its use to transplant studies and also requires long culture times for labeling [71]. Addi-tionally, Saudek et al. were able to use immunomagnetic iron beads to perform MR imaging of rat islets transplanted into the liver of syngeneic and allogeneic rats. It is quite pos-sible these iron beads can be used as an alternative MR con-trast agent in the future and be combined with various anti-bodies [67, 72].
Magnetic imaging probes have also been used to label CD8+T-cells in NOD diabetic-prone mice. The CD8+T-cells are tracked in pancreatic inflammation by MRI visualization [74]. The method relies on antigen-specific labeling of auto-reactive T cells with a targeted probe. The probe was devel-oped on the knowledge of the islet antigen recognized by auto-reactive T cells, which is information that remains in-complete in mice and most nonexistent in humans [75-77].
2768 Current Medicinal Chemistry, 2006, Vol. 13, No. 23 Souza et al.
Markmann et al. used chemical shift MR imaging to demonstrate periportal steatosis in transplanted islets [78]. Islets were transplanted within the liver using the Edmonton protocol. MR imaging demonstrated steatosis in two of the four patients evaluated, notably in patients with residual graft function. It is postulated that high local levels of insulin can result in hepatic steatosis. The significance of these find-ings was unknown, but noted to be benign and likely re-versible. In order to evaluate ultrasound and MRI findings of the liver after intra-portal islet allo-transplantation, Shapiro et al. [79] investigated the correlation of radiologic findings with clinical and histological features and with graft function in 30 subjects. Six subjects showed fat steatosis in MRI im-ages, one of which was resolved after graft failure. The authors concluded that it is unlikely that steatosis represents an index of functional islet mass and speculate that the focal and patchy pattern of steatosis observed is caused by the paracrine action of insulin promoting the sterification of free fatty acids within hepatocytes.
It is seems that islet imaging, at least in later phases of transplantation, will shortly become a routine MRI procedure and significantly aid in the management of islet recipients. Although work remains in better understanding its use in both functional and anatomical evaluation, the procedure is quite promising.
D. Positron Emission Tomography (PET)
Positron emission tomography (PET) has been used in several studies to image the endocrine pancreas. Sweet et al. prepared a set of guideline to help researchers to identify com-pounds candidates to image the beta cell with high enough cellular specificity. Using a systematic screening they con-cluded that glibenclamide, tolbutamide, serotonin, L-DOPA, dopamin, nicotinamide, fluorodeoxyglucose, and fluorodithi-zone do not provide sufficient specificity for quantification with PET [80].
Schirrmacher R et al. were able to successfully incorpo-rate fluorine and 99mTc into glibenclamide derivatives keep-ing its insulin stimulating capacity as well as high affinity binding to human SUR1. In the human PET-study a constant but weak radioactive signal could be detected in the pancreas using a fluorine-labelled glibenclamide derivative. However, a reliable assessment and visualization of the pancreatic islet cell mass could not be obtained [81]. Previously, Schirrm-acher R also synthetized (S)-2-([11C]methoxy)-4-[3-methyl-1-(2-piperidine-1-yl-phenyl)- butyl-carbamoyl]-benzoic acid ([11C]methoxy-repaglinide), a 11C labeled SUR1 ligand and tested its affinity and biological activity in vitro in isolated rat islets. Further evaluations with [11C]methoxy-repaglinide are pendent to elucidate its use for scientific and clinical studies using quantitative PET, although the imaging of b-cell loss is problematic due to the fainting imaging signal with progressing disease [82].
Similarly, taking advantage of the bicarbonate and/or organic anion transporters expressed by pancreatic acinar cells, [11C] acetate has been used to visualize the exocrine pancreas [83-85].
A series of works by Mallaisse and Ladriere tested the pancreatic fate of different radioligand compounds. D-(3H)-Mannoheptulose uptake by rat islets through GLUT2 showed that radioactive content of the pancreatic tissue was lower in
STZ rats than in control animals [86]. [125I]iodine-labelled mouse monoclonal antibody directed against a -cell surface ganglioside uptake rendered no difference comparing iso-lated islets and acinar tissue showing not to be a promising tool for -cell imaging in vivo as it lacked a specific uptake into the endocrine pancreas [58]. Uptake of 6-deoxy-6-[125I]Iodo-D-Glucose by pieces of pancreas from normal versus streptozotocin-injected rats has been compared. Al-though islets and acinar tissue showed differential uptake of the radioligand, and beta depleted pancreata showed less uptake, the clinical utility of this approach is unclear because of the broad specificity of binding of the radio-ligand and high uptake in the liver where islets are transplanted [87]. Ladriere et al. showed also for tritiated glibenclamide that no significant difference in the paired ratio between the radioac-tive content of the pancreas and plasma could be found be-tween control and diabetic rats [88].
Pancreatic uptake of PET tracer [2-(14)C] alloxan has been studied in normal and streptozotocin-treated rodents. Preferential uptake of the radiotracer in normal versus the diabetic pancreas was demonstrated [89]. Alloxan, however, is a well known diabetogenic agent itself and thus the clini-cal utility of this approach remains unproven [90].
Likewise sulfonylurea receptor ligands [e.g. 3H-glibencl-amide] have been studied as possible imaging agents. But for a variety of reasons, including broad tissue distributions of receptor, lipophilicity of the ligand and high plasma binding, these ligands have yet to demonstrate specific uptake by the endocrine component of the pancreas. Dithizone and Sulfon-ylurea receptor ligands [e.g., 3H-glibenclamide] have been studied as possible imaging agents, but show broad tissue distributions of uptake counter indicating feasibility [57, 80, 88].
XI. NEUROFUNCTIONAL IMAGING
Despite different embryological origins, -cells of the endocrine pancreas and neurons share expression of a large number of gene products and display many functional simi-larities. Previous studies, at both protein and nucleic acid levels, have shown the underlying physiochemical basis for this functional similarity [91-94].
Thus it would seem that a “neurofunctional imaging” approach, first developed by the Wake Forest University group [95], may represent a promising general approach, for imaging in situ beta cells. In these first studies, Clark et al. performed PET scans on four adult male Balb/C mice, two adult rhesus monkeys (one male and one female), and one adult male human previously injected with fluorine-18 4-fluorobenzyltrozamicol, a radioligand that targets the pre-synaptic vesicular acetylcholine transporter (VAChT). The pancreatic uptake of FBT was excellent, reveling detailed PET images of the organ, but whether the parasympathetic innervation of islets correlates with insulin-producing beta cell innervation, mass, and/or function have yet to be proven [95].
Another neurofunctional imaging approach has used a PET radioligand called 18F-Fluoro-L-DOPA. Certain pan-creas ß-cells are able to take up L-DOPA, a transmitter pre-cursor, and contain the enzyme AADC, which is responsible for the conversion of 18F-fluoro-L-DOPA into 18F-fluoro-dopamine. 18F-Fluoro-L-DOPA is probably transported
Imaging -Cells In Situ Current Medicinal Chemistry, 2006, Vol. 13, No. 23 2769
across the cell membrane by an amino acid transporter. Then it is decarboxylated into 18F-fluoro-dopamine, which is stored in vesicles. While it is not clear whether 18F-fluoro-L-dihydroxyphenylalanine is able to image normal adult beta cells, the hyperinsulinism (HI) of infancy, a neuroendocrine disease secondary to either focal adenomatous hyperplasia or a diffuse abnormality of insulin secretion of the pancreas is clearly visible with this radioligand. Ribero et al. [96, 97] and later other groups [98] reported on the use of PET with 18F-fluoro-L-dihydroxyphenylalanine (18F-fluoro-L-DOPA) and to distinguish between focal and diffuse HI. When a focal uptake of 18F-fluoro-L-DOPA was detected, the im-munohistochemical data obtained at the surgical resection confirmed the diagnosis of focal HI. When a diffuse pattern of 18F-fluoro-L-DOPA was observed, histologic data exhib-ited a large dispersion of the pathologic ß-cells throughout the pancreas. The histologic findings match the PET results well and illustrate a pancreatic ß-cell colocalization of proin-sulin and AADC.
Using a functional genomics approach to study tissue-restricted transcripts in human islets, Maffei et al. [99] iden-tified a series of "neurofunctional" gene products in beta cells. One of these, VMAT2, vesicular monoamine trans-porter type 2, expressed by -cells and monoaminergic neu-rons of the CNS, but absent from the exocrine pancreas, liver, kidney and other abdominal organs proved particularly intriguing. Taking advantage that a specific VMAT2 ligand - DTBZ - was already in clinical use for positron emission tomography (PET) imaging of central nervous system disor-ders [100], these investigators performed a series of studies to determine the functional specificity of the specific VMAT2 ligand. The DTBZ radioligand probe revealed the presence of VMAT2 molecules in preparations of islets membranes able to bind [3H]DTBZ with the expected affin-ity (Kd = 2 nm) and with a sufficient number of sites (>105/cell) to suggest feasibility of imaging by PET [99]. Furthermore, as expected, there was little binding of [3H]DTBZ to membranes prepared from the exocrine por-tions of the pancreas. Previous studies had demonstrated that anti-VMAT2 Ab co-localized exclusively with anti-insulin Ab within the islets [101-104]. Together these finding sug-gested that quantitation of VMAT2 density in the pancreas using [11C]DTBZ and PET could be a method for non-invasive measurements of BCM and for visualization of the progression of diabetes.
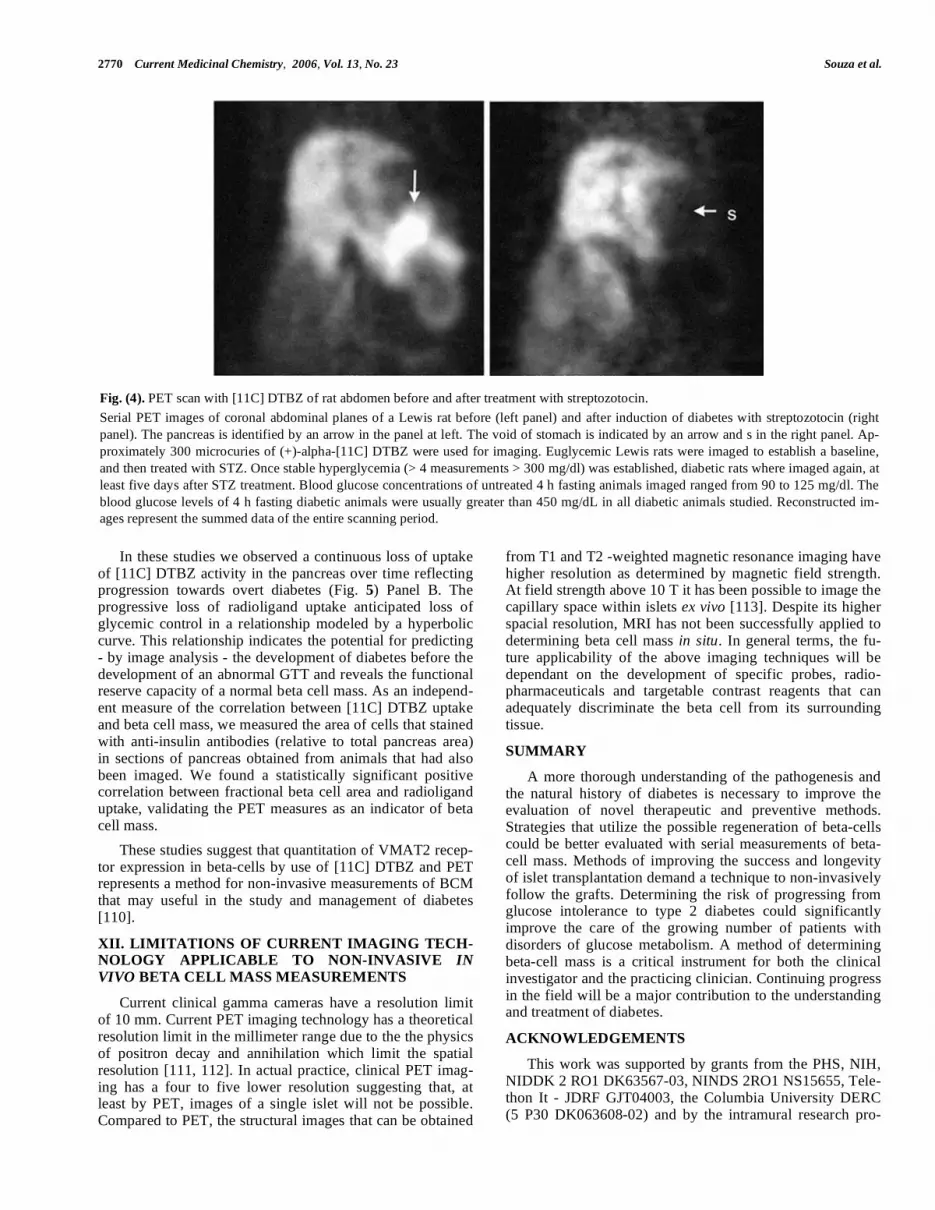
Since several previous studies had shown that DTBZ specifically targets VMAT2 [105-107] and that VMAT2 is strongly expressed in beta cells of the endocrine pancreas, we directly set out to determine whether [11C]DTBZ could discriminate euglycemic rats from rats with diabetes induced by streptozotocin (STZ). In these experiments we used strep-tozotocin (STZ). STZ is a beta cell toxin widely used to in-duce experimental diabetes in rodents [108]. Previous studies have shown that STZ enters beta-cells via the glucose trans-porter 2 and induces a series of intracellular changes, includ-ing formation of free radicals and liberation of nitric oxide, that results in dose dependent beta-cell death by necrosis [109]. The experimental protocol was as follows; male Lewis rats were imaged before STZ treatment, treated with STZ (50 mg/Kg x 1 dose), then reimaged with [11C]DTBZ after five days. An intraperitoneal glucose tolerance test (IPGTT) was also performed on the day of each PET scan.
On each day of the 5 day interval following STZ administra-tion, fasting whole blood glucose was measured in the early afternoon following a 4 hour fast. Using the software image reconstruction and analysis package supplied by the Mi-croPET instrument manufacturer (Concorde) we obtained quantitative measurements of [11C] DTBZ uptake in the pancreas region of interest. These measurements allowed us to estimate target abundance in the anatomical space occu-pied by the pancreas and, therefore – based on the specificity of DTBZ binding to beta cells – to estimate beta cell mass. PET imaging of the abdomen of the STZ-induced diabetic rats showed differences both in the pattern and density of DTBZ uptake in the area of the pancreas compared to the baseline studies in euglycemic animals (Fig. 4). In parallel experiments we showed that the amounts of insulin and VMAT2 mRNA and protein decreased following treatment with streptozotocin using the techniques of qRT-PCR and immunohistochemistry studies, respectively.
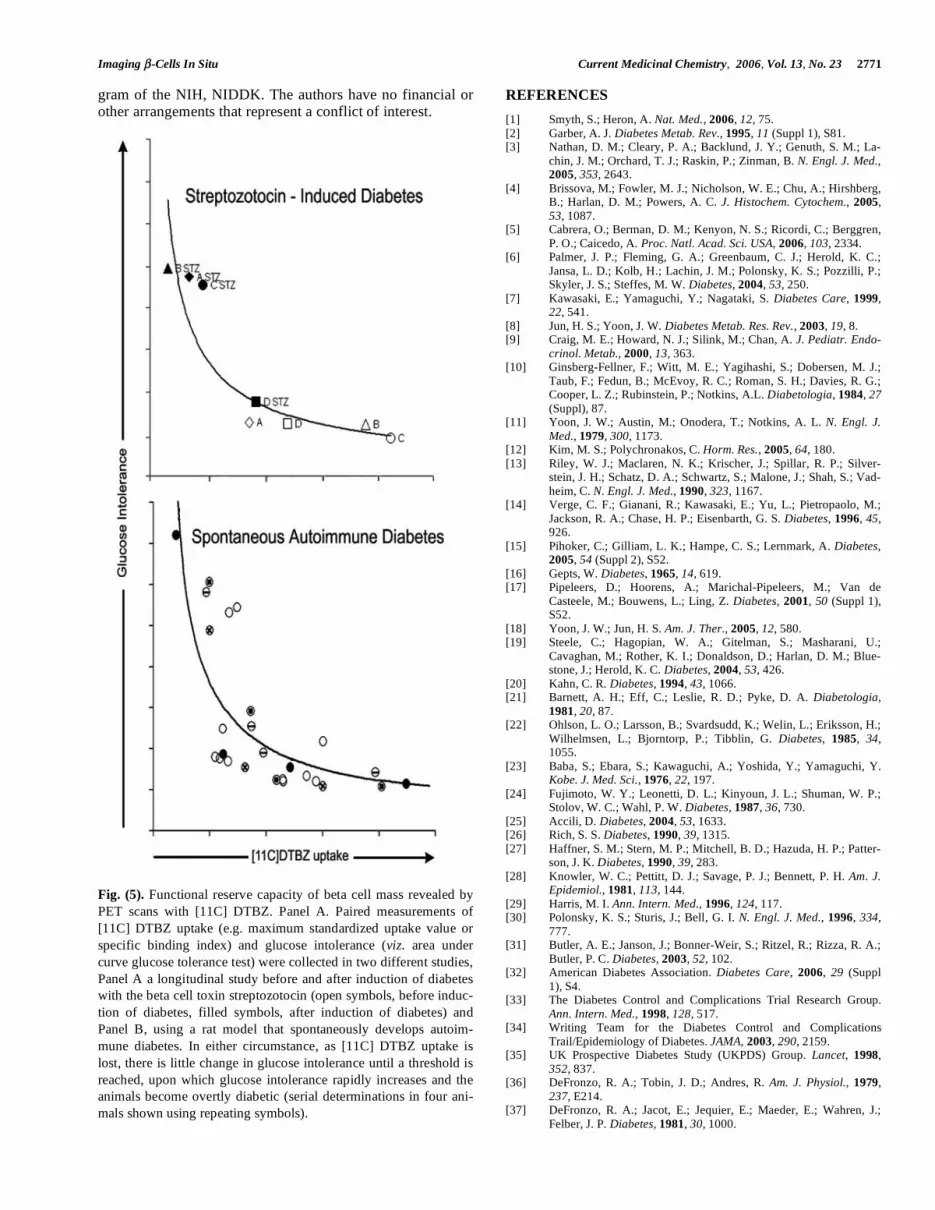
Streptozotocin, at the dose used in these studies, induces transient diabetes in 100 % of the population. By two weeks, the majority of animals develop stable hyperglycemia (BG > 300 mg/dL). Occasionally animals recover to show normal or nearly normal fasting BG levels. One such animal (animal D) is represented in (Fig. 5) Panel A, along with the other study animals, using the specific binding index of [11C] DTBZ in the pancreas relative to the kidney and fasting blood glucose levels as metrics of the effects of streptozocin-induced beta cell damage. Compared to animals that devel-oped stable diabetes after STZ treatment, the change in SBI following STZ in animal D was modest (22% versus 60 to 90% measured in animals A through C).
Having validated the PET method by demonstrating that reduced [11C] DTBZ uptake in the pancreas region of inter-est correlated with the presence of persistent hyperglycemia and loss of both VMAT2 and insulin immunoreactivity in the pancreas, we next determined whether PET measure-ments of pancreatic [11C]DTBZ uptake were sufficiently sensitive to track the presumably progressive decline in beta cell mass that characterizes the development of diabetes in the BB-DP rat model. In these studies we used age-matched (6 week old) male BioBreeding Diabetes Prone / Wor rats (BB-DP) from Biomedical Research Models, Inc. BB-DP rats from the Biomedical Research Models colony have an average age of onset of hyperglycemia at 10 weeks of age (range from 60 and 120 days), accompanied by hypoinsu-linemia, weight loss and ketonuria. The cumulative inci-dence of diabetes is greater than 93% in males. We per-formed a longitudinal study of diabetes progression in these animals using serial PET scans (3-4 per animal over a 7 week period starting at age x weeks), twice weekly intraperi-toneal glucose tolerance tests (IPGTT), and daily fasting whole blood glucose concentration measurements. The re-sults of this study are summarized in (Fig. 5) Panel B. Some animals were sacrificed at 6-7 weeks of age, at mid study just as they developed an abnormal glucose tolerance profile, but prior to the onset of persistent hyperglycemia; others were sacrificed and at end of the study following develop-ment of overt diabetes. In such instances, pancreas and islet tissue was obtained for qRT PCR measurements of VMAT2 and insulin transcript abundance, and for immunohistomor-phometry studies of the beta cells and islets.
2770 Current Medicinal Chemistry, 2006, Vol. 13, No. 23 Souza et al.
In these studies we observed a continuous loss of uptake of [11C] DTBZ activity in the pancreas over time reflecting progression towards overt diabetes (Fig. 5) Panel B. The progressive loss of radioligand uptake anticipated loss of glycemic control in a relationship modeled by a hyperbolic curve. This relationship indicates the potential for predicting - by image analysis - the development of diabetes before the development of an abnormal GTT and reveals the functional reserve capacity of a normal beta cell mass. As an independ-ent measure of the correlation between [11C] DTBZ uptake and beta cell mass, we measured the area of cells that stained with anti-insulin antibodies (relative to total pancreas area) in sections of pancreas obtained from animals that had also been imaged. We found a statistically significant positive correlation between fractional beta cell area and radioligand uptake, validating the PET measures as an indicator of beta cell mass.
These studies suggest that quantitation of VMAT2 recep-tor expression in beta-cells by use of [11C] DTBZ and PET represents a method for non-invasive measurements of BCM that may useful in the study and management of diabetes [110].
XII. LIMITATIONS OF CURRENT IMAGING TECH-NOLOGY APPLICABLE TO NON-INVASIVE IN
VIVO BETA CELL MASS MEASUREMENTS
Current clinical gamma cameras have a resolution limit of 10 mm. Current PET imaging technology has a theoretical resolution limit in the millimeter range due to the the physics of positron decay and annihilation which limit the spatial resolution [111, 112]. In actual practice, clinical PET imag-ing has a four to five lower resolution suggesting that, at least by PET, images of a single islet will not be possible. Compared to PET, the structural images that can be obtained
from T1 and T2 -weighted magnetic resonance imaging have higher resolution as determined by magnetic field strength. At field strength above 10 T it has been possible to image the capillary space within islets ex vivo [113]. Despite its higher spacial resolution, MRI has not been successfully applied to determining beta cell mass in situ. In general terms, the fu-ture applicability of the above imaging techniques will be dependant on the development of specific probes, radio-pharmaceuticals and targetable contrast reagents that can adequately discriminate the beta cell from its surrounding tissue.
SUMMARY
A more thorough understanding of the pathogenesis and the natural history of diabetes is necessary to improve the evaluation of novel therapeutic and preventive methods. Strategies that utilize the possible regeneration of beta-cells could be better evaluated with serial measurements of beta-cell mass. Methods of improving the success and longevity of islet transplantation demand a technique to non-invasively follow the grafts. Determining the risk of progressing from glucose intolerance to type 2 diabetes could significantly improve the care of the growing number of patients with disorders of glucose metabolism. A method of determining beta-cell mass is a critical instrument for both the clinical investigator and the practicing clinician. Continuing progress in the field will be a major contribution to the understanding and treatment of diabetes.
ACKNOWLEDGEMENTS
This work was supported by grants from the PHS, NIH, NIDDK 2 RO1 DK63567-03, NINDS 2RO1 NS15655, Tele-thon It - JDRF GJT04003, the Columbia University DERC (5 P30 DK063608-02) and by the intramural research pro-
Fig. (4). PET scan with [11C] DTBZ of rat abdomen before and after treatment with streptozotocin.
Serial PET images of coronal abdominal planes of a Lewis rat before (left panel) and after induction of diabetes with streptozotocin (right
panel). The pancreas is identified by an arrow in the panel at left. The void of stomach is indicated by an arrow and s in the right panel. Ap-
proximately 300 microcuries of (+)-alpha-[11C] DTBZ were used for imaging. Euglycemic Lewis rats were imaged to establish a baseline,
and then treated with STZ. Once stable hyperglycemia (> 4 measurements > 300 mg/dl) was established, diabetic rats where imaged again, at
least five days after STZ treatment. Blood glucose concentrations of untreated 4 h fasting animals imaged ranged from 90 to 125 mg/dl. The
blood glucose levels of 4 h fasting diabetic animals were usually greater than 450 mg/dL in all diabetic animals studied. Reconstructed im-
ages represent the summed data of the entire scanning period.
Imaging -Cells In Situ Current Medicinal Chemistry, 2006, Vol. 13, No. 23 2771
gram of the NIH, NIDDK. The authors have no financial or other arrangements that represent a conflict of interest.
Fig. (5). Functional reserve capacity of beta cell mass revealed by
PET scans with [11C] DTBZ. Panel A. Paired measurements of
[11C] DTBZ uptake (e.g. maximum standardized uptake value or
specific binding index) and glucose intolerance (viz. area under
curve glucose tolerance test) were collected in two different studies,
Panel A a longitudinal study before and after induction of diabetes
with the beta cell toxin streptozotocin (open symbols, before induc-
tion of diabetes, filled symbols, after induction of diabetes) and
Panel B, using a rat model that spontaneously develops autoim-
mune diabetes. In either circumstance, as [11C] DTBZ uptake is
lost, there is little change in glucose intolerance until a threshold is
reached, upon which glucose intolerance rapidly increases and the
animals become overtly diabetic (serial determinations in four ani-
mals shown using repeating symbols).
REFERENCES
[1] Smyth, S.; Heron, A. Nat. Med., 2006, 12, 75. [2] Garber, A. J. Diabetes Metab. Rev., 1995, 11 (Suppl 1), S81. [3] Nathan, D. M.; Cleary, P. A.; Backlund, J. Y.; Genuth, S. M.; La-
chin, J. M.; Orchard, T. J.; Raskin, P.; Zinman, B. N. Engl. J. Med., 2005, 353, 2643.
[4] Brissova, M.; Fowler, M. J.; Nicholson, W. E.; Chu, A.; Hirshberg, B.; Harlan, D. M.; Powers, A. C. J. Histochem. Cytochem., 2005, 53, 1087.
[5] Cabrera, O.; Berman, D. M.; Kenyon, N. S.; Ricordi, C.; Berggren, P. O.; Caicedo, A. Proc. Natl. Acad. Sci. USA, 2006, 103, 2334.
[6] Palmer, J. P.; Fleming, G. A.; Greenbaum, C. J.; Herold, K. C.; Jansa, L. D.; Kolb, H.; Lachin, J. M.; Polonsky, K. S.; Pozzilli, P.; Skyler, J. S.; Steffes, M. W. Diabetes, 2004, 53, 250.
[7] Kawasaki, E.; Yamaguchi, Y.; Nagataki, S. Diabetes Care, 1999, 22, 541.
[8] Jun, H. S.; Yoon, J. W. Diabetes Metab. Res. Rev., 2003, 19, 8. [9] Craig, M. E.; Howard, N. J.; Silink, M.; Chan, A. J. Pediatr. Endo-
crinol. Metab., 2000, 13, 363. [10] Ginsberg-Fellner, F.; Witt, M. E.; Yagihashi, S.; Dobersen, M. J.;
Taub, F.; Fedun, B.; McEvoy, R. C.; Roman, S. H.; Davies, R. G.; Cooper, L. Z.; Rubinstein, P.; Notkins, A.L. Diabetologia, 1984, 27
(Suppl), 87. [11] Yoon, J. W.; Austin, M.; Onodera, T.; Notkins, A. L. N. Engl. J.
Med., 1979, 300, 1173. [12] Kim, M. S.; Polychronakos, C. Horm. Res., 2005, 64, 180. [13] Riley, W. J.; Maclaren, N. K.; Krischer, J.; Spillar, R. P.; Silver-
stein, J. H.; Schatz, D. A.; Schwartz, S.; Malone, J.; Shah, S.; Vad-heim, C. N. Engl. J. Med., 1990, 323, 1167.
[14] Verge, C. F.; Gianani, R.; Kawasaki, E.; Yu, L.; Pietropaolo, M.; Jackson, R. A.; Chase, H. P.; Eisenbarth, G. S. Diabetes, 1996, 45, 926.
[15] Pihoker, C.; Gilliam, L. K.; Hampe, C. S.; Lernmark, A. Diabetes, 2005, 54 (Suppl 2), S52.
[16] Gepts, W. Diabetes, 1965, 14, 619. [17] Pipeleers, D.; Hoorens, A.; Marichal-Pipeleers, M.; Van de
Casteele, M.; Bouwens, L.; Ling, Z. Diabetes, 2001, 50 (Suppl 1), S52.
[18] Yoon, J. W.; Jun, H. S. Am. J. Ther., 2005, 12, 580. [19] Steele, C.; Hagopian, W. A.; Gitelman, S.; Masharani, U.;
Cavaghan, M.; Rother, K. I.; Donaldson, D.; Harlan, D. M.; Blue-stone, J.; Herold, K. C. Diabetes, 2004, 53, 426.
[20] Kahn, C. R. Diabetes, 1994, 43, 1066. [21] Barnett, A. H.; Eff, C.; Leslie, R. D.; Pyke, D. A. Diabetologia,
1981, 20, 87. [22] Ohlson, L. O.; Larsson, B.; Svardsudd, K.; Welin, L.; Eriksson, H.;
Wilhelmsen, L.; Bjorntorp, P.; Tibblin, G. Diabetes, 1985, 34, 1055.
[23] Baba, S.; Ebara, S.; Kawaguchi, A.; Yoshida, Y.; Yamaguchi, Y. Kobe. J. Med. Sci., 1976, 22, 197.
[24] Fujimoto, W. Y.; Leonetti, D. L.; Kinyoun, J. L.; Shuman, W. P.; Stolov, W. C.; Wahl, P. W. Diabetes, 1987, 36, 730.
[25] Accili, D. Diabetes, 2004, 53, 1633. [26] Rich, S. S. Diabetes, 1990, 39, 1315. [27] Haffner, S. M.; Stern, M. P.; Mitchell, B. D.; Hazuda, H. P.; Patter-
son, J. K. Diabetes, 1990, 39, 283. [28] Knowler, W. C.; Pettitt, D. J.; Savage, P. J.; Bennett, P. H. Am. J.
Epidemiol., 1981, 113, 144. [29] Harris, M. I. Ann. Intern. Med., 1996, 124, 117. [30] Polonsky, K. S.; Sturis, J.; Bell, G. I. N. Engl. J. Med., 1996, 334,
777. [31] Butler, A. E.; Janson, J.; Bonner-Weir, S.; Ritzel, R.; Rizza, R. A.;
Butler, P. C. Diabetes, 2003, 52, 102. [32] American Diabetes Association. Diabetes Care, 2006, 29 (Suppl
1), S4. [33] The Diabetes Control and Complications Trial Research Group.
Ann. Intern. Med., 1998, 128, 517. [34] Writing Team for the Diabetes Control and Complications
Trail/Epidemiology of Diabetes. JAMA, 2003, 290, 2159. [35] UK Prospective Diabetes Study (UKPDS) Group. Lancet, 1998,
352, 837. [36] DeFronzo, R. A.; Tobin, J. D.; Andres, R. Am. J. Physiol., 1979,
237, E214. [37] DeFronzo, R. A.; Jacot, E.; Jequier, E.; Maeder, E.; Wahren, J.;
Felber, J. P. Diabetes, 1981, 30, 1000.
2772 Current Medicinal Chemistry, 2006, Vol. 13, No. 23 Souza et al.
[38] Faber, O. K.; Hagen, C.; Binder, C.; Markussen, J.; Naithani, V. K.; Blix, P. M.; Kuzuya, H.; Horwitz, D. L.; Rubenstein, A. H.; Rossing, N. J. Clin. Invest., 1978, 62, 197.
[39] Sreenan, S.; Pick, A. J.; Levisetti, M.; Baldwin, A. C.; Pugh, W.; Polonsky, K. S. Diabetes, 1999, 48, 989.
[40] Larsen, M. O.; Gotfredsen, C. F.; Wilken, M.; Carr, R. D.; Porksen, N.; Rolin, B. Diabetologia, 2003, 46, 195.
[41] Kjems, L. L.; Kirby, B. M.; Welsh, E. M.; Veldhuis, J. D.; Straume, M.; McIntyre, S. S.; Yang, D.; Lefebvre, P.; Butler, P. C. Diabetes, 2001, 50, 2001.
[42] Larsen, M. O.; Rolin, B.; Wilken, M.; Carr, R. D.; Gotfredsen, C. F. Diabetes, 2003, 52, 118.
[43] McCulloch, D. K.; Koerker, D. J.; Kahn, S. E.; Bonner-Weir, S.; Palmer, J. P. Diabetes, 1991, 40, 673.
[44] Gepts, W.; Lecompte, P. M. Am. J. Med., 1981, 70, 105. [45] Saito, K.; Yaginuma, N.; Takahashi, T. Tohoku J. Exp. Med., 1979,
129, 273. [46] Bonner-Weir, S.; Trent, D. F.; Weir, G. C. J. Clin. Invest., 1983,
71, 1544. [47] Tominaga, M.; Maruyama, H.; Bolli, G.; Helderman, J. H.; Unger,
R. H. Endocrinology, 1986, 118, 886. [48] Eldor, R.; Cohen, I. R.; Raz, I. Int. Rev. Immunol., 2005, 24, 327. [49] Paty, B. W.; Bonner-Weir, S.; Laughlin, M. R.; McEwan, A. J.;
Shapiro, A. M. Transplantation, 2004, 77, 1133. [50] Rother, K. I.; Harlan, D. M. J. Clin. Invest., 2004, 114, 877. [51] Ryan, E. A.; Paty, B. W.; Senior, P. A.; Bigam, D.; Alfadhli, E.;
Kneteman, N. M.; Lakey, J. R.; Shapiro, A. M. Diabetes, 2005, 54, 2060.
[52] Giannoukakis, N.; Trucco, M. Am. J. Ther., 2005, 12, 512. [53] Tuomilehto, J.; Lindstrom, J.; Eriksson, J. G.; Valle, T. T.; Ha-
malainen, H.; Ilanne-Parikka, P.; Keinanen-Kiukaanniemi, S.; La-akso, M.; Louheranta, A.; Rastas, M.; Salminen, V.; Uusitupa, M. N. Engl. J. Med., 2001, 344, 1343.
[54] Moore, A.; Bonner-Weir, S.; Weissleder, R. Diabetes, 2001, 50, 2231.
[55] Medarova, Z.; Bonner-Weir, S.; Lipes, M.; Moore, A. Diabetes, 2005, 54, 1780.
[56] Hampe, C. S.; Wallen, A. R.; Schlosser, M.; Ziegler, M.; Sweet, I. R. Exp. Clin. Endocrinol. Diabetes, 2005, 113, 381.
[57] Garnuszek, P.; Licinska, I.; Mrozek, A.; Wardawa, A.; Fiedor, P. S.; Mazurek, A. P. Nucl. Med. Rev. Cent. East Eur., 2000, 3, 61.
[58] Ladriere, L.; Malaisse-Lagae, F.; Alejandro, R.; Malaisse, W. J. Cell Biochem. Funct., 2001, 19, 107.
[59] Fowler, M.; Virostko, J.; Chen, Z.; Poffenberger, G.; Radhika, A.; Brissova, M.; Shiota, M.; Nicholson, W. E.; Shi, Y.; Hirshberg, B.; Harlan, D. M.; Jansen, E. D.; Powers, A. C. Transplantation, 2005, 79, 768.
[60] Park, S. Y.; Wang, X.; Chen, Z.; Powers, A. C.; Magnuson, M. A.; Head, W. S.; Piston, D. W.; Bell, G. I. Genesis, 2005, 43, 80.
[61] Hara, M.; Dizon, R. F.; Glick, B. S.; Lee, C. S.; Kaestner, K. H.; Piston, D. W.; Bindokas, V. P. Am. J. Physiol. Endocrinol. Metab., 2005.
[62] Piston, D. W. PLoS. Biol., 2005, 3, e207. [63] Bennett, B. D.; Jetton, T. L.; Ying, G.; Magnuson, M. A.; Piston,
D. W. J. Biol. Chem., 1996, 271, 3647. [64] Pedley, K. C. Digestion, 1997, 58 (Suppl 2), 62. [65] Ben-Yehudah, A.; Reinhart, B.; Navara, C.; Kotzuk, J.; Witchel, S.;
Schatten, G.; Chaillet, J. R. Genesis, 2005, 43, 166. [66] Samli, K. N.; McGuire, M. J.; Newgard, C. B.; Johnston, S. A.;
Brown, K. C. Diabetes, 2005, 54, 2103. [67] Kriz, J.; Jirak, D.; Girman, P.; Berkova, Z.; Zacharovova, K.; Hon-
sova, E.; Lodererova, A.; Hajek, M.; Saudek, F. Transplantation, 2005, 80, 1596.
[68] Turvey, S. E.; Swart, E.; Denis, M. C.; Mahmood, U.; Benoist, C.; Weissleder, R.; Mathis, D. J. Clin. Invest., 2005, 115, 2454.
[69] Dodd, S. J.; Williams, M.; Suhan, J. P.; Williams, D. S.; Koretsky, A. P.; Ho, C. Biophys. J., 1999, 76, 103.
[70] Jirak, D.; Kriz, J.; Herynek, V.; Andersson, B.; Girman, P.; Burian, M.; Saudek, F.; Hajek, M. Magn. Reson. Med., 2004, 52, 1228.
[71] Evgenov, N. V.; Medarova, Z.; Dai, G.; Bonner-Weir, S.; Moore, A. Nat. Med., 2006, 12, 144.
[72] Koblas, T.; Girman, P.; Berkova, Z.; Jirak, D.; Kriz, J.; Dovolilova, E.; Zacharovova, K.; Hajek, M.; Saudek, F. Transplant. Proc., 2005, 37, 3493.
[73] Moore, A.; Sun, P. Z.; Cory, D.; Hogemann, D.; Weissleder, R.; Lipes, M. A. Magn. Reson. Med., 2002, 47, 751.
[74] Moore, A.; Grimm, J.; Han, B.; Santamaria, P. Diabetes, 2004, 53, 1459.
[75] Tree, T. I.; Peakman, M. Endocrinol. Metab. Clin. North Am., 2004, 33, 113.
[76] Panagiotopoulos, C.; Trudeau, J. D.; Tan, R. Curr. Diab. Rep., 2004, 4, 87.
[77] Lieberman, S. M.; DiLorenzo, T. P. Tissue Antigens, 2003, 62, 359. [78] Markmann, J. F.; Rosen, M.; Siegelman, E. S.; Soulen, M. C.;
Deng, S.; Barker, C. F.; Naji, A. Diabetes, 2003, 52, 1591. [79] Bhargava, R.; Senior, P. A.; Ackerman, T. E.; Ryan, E. A.; Paty, B.
W.; Lakey, J. R.; Shapiro, A. M. Diabetes, 2004, 53, 1311. [80] Sweet, I. R.; Cook, D. L.; Lernmark, A.; Greenbaum, C. J.; Wallen,
A. R.; Marcum, E. S.; Stekhova, S. A.; Krohn, K. A. Biochem. Bio-
phys. Res. Commun., 2004, 314, 976. [81] Schneider, S.; Feilen, P. J.; Schreckenberger, M.; Schwanstecher,
M.; Schwanstecher, C.; Buchholz, H. G.; Thews, O.; Oberholzer, K.; Korobeynikov, A.; Bauman, A.; Comagic, S.; Piel, M.; Schirrmacher, E.; Shiue, C. Y.; Alavi, A. A.; Bartenstein, P.; Rosch, F.; Weber, M. M.; Klein, H. H.; Schirrmacher, R. Exp. Clin.
Endocrinol. Diabetes, 2005, 113, 388. [82] Wangler, B.; Beck, C.; Shiue, C. Y.; Schneider, S.; Schwanstecher,
C.; Schwanstecher, M.; Feilen, P. J.; Alavi, A.; Rosch, F.; Schirrmacher, R. Bioorg. Med. Chem. Lett., 2004, 14, 5205.
[83] Shreve, P. D.; Gross, M. D. J. Nucl. Med., 1997, 38, 1305. [84] Seltzer, M. A.; Jahan, S. A.; Sparks, R.; Stout, D. B.; Satyamurthy,
N.; Dahlbom, M.; Phelps, M. E.; Barrio, J. R. J. Nucl. Med., 2004, 45, 1233.
[85] Rasmussen, I.; Sorensen, J.; Langstrom, B.; Haglund, U. Scand. J. Surg., 2004, 93, 191.
[86] Malaisse, W. J.; Doherty, M.; Kadiata, M. M.; Ladriere, L.; Malais-se-Lagae, F. Cell Biochem. Funct., 2001, 19, 171.
[87] Malaisse, W. J.; Ladriere, L.; Sener, A. Endocrine, 2000, 13, 89. [88] Ladriere, L.; Malaisse-Lagae, F.; Malaisse, W. J. Endocrine, 2000,
13, 133. [89] Malaisse, W. J.; Doherty, M.; Ladriere, L.; Malaisse-Lagae, F. Int.
J. Mol. Med., 2001, 7, 311. [90] Elsner, M.; Tiedge, M.; Guldbakke, B.; Munday, R.; Lenzen, S.
Diabetologia, 2002, 45, 1542. [91] Atouf, F.; Czernichow, P.; Scharfmann, R. J. Biol. Chem., 1997,
272, 1929. [92] Bernal-Mizrachi, E.; Cras-Meneur, C.; Ohsugi, M.; Permutt, M. A.
Diabetes Metab. Res. Rev., 2003, 19, 32. [93] Scharfmann, R.; Czernichow, P. Diabetes Metab., 1996, 22, 223. [94] Abderrahmani, A.; Niederhauser, G.; Plaisance, V.; Haefliger, J.
A.; Regazzi, R.; Waeber, G. FEBS Lett., 2004, 565, 133. [95] Clark, P. B.; Gage, H. D.; Brown-Proctor, C.; Buchheimer, N.;
Calles-Escandon, J.; Mach, R. H.; Morton, K. A. Eur. J. Nucl. Med.
Mol. Imaging, 2003, 31, 258. [96] Ribeiro, M. J.; De Lonlay, P.; Delzescaux, T.; Boddaert, N.;
Jaubert, F.; Bourgeois, S.; Dolle, F.; Nihoul-Fekete, C.; Syrota, A.; Brunelle, F. J. Nucl. Med., 2005, 46, 560.
[97] de Lonlay, P.; Simon-Carre, A.; Ribeiro, M. J.; Boddaert, N.; Giur-gea, I.; Laborde, K.; Bellanne-Chantelot, C.; Verkarre, V.; Polak, M.; Rahier, J.; Syrota, A.; Seidenwurm, D.; Nihoul-Fekete, C.; Robert, J. J.; Brunelle, F.; Jaubert, F. J. Clin. Endocrinol. Metab., 2006.
[98] Otonkoski, T.; Nanto-Salonen, K.; Seppanen, M.; Veijola, R.; Huopio, H.; Hussain, K.; Tapanainen, P.; Eskola, O.; Parkkola, R.; Ekstrom, K.; Guiot, Y.; Rahier, J.; Laakso, M.; Rintala, R.; Nuutila, P.; Minn, H. Diabetes, 2006, 55, 13.
[99] Maffei, A.; Liu, Z.; Witkowski, P.; Moschella, F.; Del Pozzo, G.; Liu, E.; Herold, K.; Winchester, R. J.; Hardy, M. A.; Harris, P. E. Endocrinology, 2004, 145, 4513.
[100] Vander Borght, T. M.; Kilbourn, M. R.; Koeppe, R. A.; DaSilva, J. N.; Carey, J. E.; Kuhl, D. E.; Frey, K. A. J. Nucl. Med., 1995, 36, 2252.
[101] Weihe, E.; Eiden, L. E. FASEB. J., 2000, 14, 2435. [102] Weihe, E.; Schafer, M. K.; Erickson, J. D.; Eiden, L. E. J. Mol.
Neurosci., 1994, 5, 149. [103] Anlauf, M.; Eissele, R.; Schafer, M. K.; Eiden, L. E.; Arnold, R.;
Pauser, U.; Kloppel, G.; Weihe, E. J. Histochem. Cytochem., 2003, 51, 1027.
[104] Mei, Q.; Mundinger, T. O.; Lernmark, A.; Taborsky, G. J., Jr. Diabetes, 2002, 51, 2997.
[105] Scherman, D.; Henry, J. P. Biochem. Pharmacol., 1980, 29, 1883. [106] Scherman, D.; Henry, J. P. Mol. Pharmacol., 1983, 23, 431.

Imaging -Cells In Situ Current Medicinal Chemistry, 2006, Vol. 13, No. 23 2773
[107] Scherman, D.; Jaudon, P.; Henry, J. P. Proc. Natl. Acad. Sci. USA,
1983, 80, 584. [108] Wilson, G. L.; Leiter, E. H. Curr. Top. Microbiol. Immunol., 1990,
156, 27. [109] Szkudelski, T. Physiol. Res., 2001, 50, 537.
[110] Souza, F.; Simpson, N.; Raffo, A.; Saxena, C.; Maffei, A.; Hardy, M.; Kilbourn, M.; Goland, R.; Leibel, R.; Mann, J. J.; Van Heer-tum, R.; Harris, P. E. J. Clin. Invest., 2006, 116, 1506.
[111] Budinger, T. F. Semin. Nucl. Med., 1998, 28, 247. [112] Chatziioannou, A. F. Proc. Am. Thorac. Soc., 2005, 2, 533. [113] Simpson, N. E.; Grant, S. C.; Gustavsson, L.; Peltonen, V. M.;
Blackband, S. J.; Constantinidis, I. Biomaterials, 2006, 27, 2577.
Received: April 14, 2006 Revised: June 21, 2006 Accepted: June 22, 2006