the fourth ibis/isgri soft gamma-ray survey catalog
TRANSCRIPT

THE SECOND IBIS/ISGRI SOFT GAMMA-RAY SURVEY CATALOG1
A. J. Bird,2E. J. Barlow,
2L. Bassani,
3A. Bazzano,
4G. Belanger,
5, 6A. Bodaghee,
7F. Capitanio,
2, 4
A. J. Dean,2M. Fiocchi,
4A. B. Hill,
2F. Lebrun,
5,6A. Malizia,
3J. M. Mas-Hesse,
8M. Molina,
2
L. Moran,2M. Renaud,
5, 6V. Sguera,
2S. E. Shaw,
2,7J. B. Stephen,
3R. Terrier,
5, 6P. Ubertini,
4
R. Walter,7D. R. Willis,
2,7and C. Winkler
9
Received 2005 July 5; accepted 2005 September 8
ABSTRACT
In this paper we report the second soft gamma-ray source catalog obtained with the IBIS/ISGRI gamma-ray imageron board the INTEGRAL satellite. The scientific data set is based on more than 10 Ms of high-quality observationsperformed during the first 2 years of Core Program and public IBIS/ISGRI observations, and covers �50% of thewhole sky. The main aim of the first survey was to scan systematically, for the first time at energies above 20 keV, thewhole Galactic plane to achieve a limiting sensitivity of�1 mcrab in the central radian. The target of the second yearof the INTEGRALmission lifetime was to expand as much as possible our knowledge of the soft gamma-ray sky, withthe same limiting sensitivity, to at least 50% of the whole sky, mainly by including a substantial coverage of extra-galactic fields. This catalog comprises more than 200 high-energy sources detected in the energy range 20–100 keV,including new transients not active during the first year of operation, faint persistent objects revealed with longerexposure time, and several Galactic and extragalactic sources in sky regions not observed in the first survey. Themeanposition error for all the sources detectedwith significance above 10 � is�4000, enough to identifymost of themwith aknown X-ray counterpart and to unveil the nature of most of the strongly absorbed ones, even though they are verydifficult to detect in X-rays.
Subject headinggs: Galaxy: general — gamma rays: observations — surveys
Online material: color figures, machine-readable table
1. INTRODUCTION
One of the key investigations of the INTEGRAL ObservatoryCore Program has been the soft gamma-ray Galactic plane scans(hereafter GPSs), successfully exploited during the first year ofthe mission lifetime to a depth of �1 mcrab in the central radian(Bird et al. 2004). The unprecedented sensitivity achieved in thegamma-ray domain over a �900 deg2 field of view (FOV) wasconfirmed by the ‘‘first survey results’’ (Ubertini et al. 2006).The discovery of a soft gamma-ray sky populated withmore than120 sources was a stimulus for the INTEGRAL scientific com-munity (1) to perform deeper exposures in the Galactic plane re-gion formerly covered with insufficient sensitivity, in particularregions out of the central radian, and (2) to continue the strategyto perform several ‘‘widely scattered’’ high-latitude observationsdedicated to specific scientific objects, although providing thebonus of wide off-the-plane coverage (Winkler et al. 2004). TheESA/INTEGRAL scientific policy tomake all scientific data avail-able to the public 1 year after the observation has allowed us
to include high-quality observations accounting for in excess of�10 Ms exposure time in this iteration of the survey analysis.
2. THE IBIS ‘‘ALL SKY’’ SURVEY
In this paper we provide the second IBIS/ISGRI soft gamma-ray survey catalog, comprisingmore than 200 high-energy sources.As for the first catalog, the aim is to provide a prompt release ofinformation to the community. The instrumental details and sen-sitivity can be found in Lebrun et al. (2003) and Ubertini et al.(2003), while the observation strategy and its technical implemen-tation are summarized in Bird et al. (2004). The data are collectedwith the low-energy array, ISGRI (INTEGRAL Soft Gamma-RayImager; Lebrun et al. 2003), consisting of a pixilated 128 ;128 CdTe solid-state detector that views the sky through a codedaperture mask. IBIS/ISGRI generates images of the sky with a120 (FWHM) resolution and typical source location of better than10 over a �19
�(FWHM) field of view in the energy range 15–
1000 keV. This ‘‘all sky’’ catalog uses mosaic image data fromthe first 2 years ofCore Programobservations, including theGPSs,Galactic center deep exposures (GCDEs), and pointed obser-vations from the first year of public data. The source fluxes areintegrated over two energy bands (20–40 and 40–100 keV), andthe limiting sensitivity for this survey is around 1 mcrab for thedeepest exposures. While the first catalog provided coverage ofthe Galactic plane only, this new catalog includes sources de-rived from a significantly larger data set, with much better skycoverage. The data set used in this catalog ensures that 50% ofthe sky is now observed with an exposure of at least 10 ks (seeFig. 1).
3. DATA ANALYSIS AND CATALOG CONSTRUCTION
3.1. Input Data Set and Pipeline Processing
The survey input data set consists of all data available at the endof 2004 September, from revolutions (orbits) 46–209 inclusive,
1 Based on observations with INTEGRAL, an ESA project with instrumentsand science data center funded by ESA member states (especially the PI countries:Denmark, France, Germany, Italy, Switzerland, Spain), Czech Republic, andPoland, and with the participation of Russia and the USA.
2 School of Physics and Astronomy, University of Southampton, South-ampton SO17 1BJ, UK.
3 IASF/ INAF, Bologna, Italy.4 IASF/ INAF, Rome, Italy.5 CEA-Saclay, DAPNIA/Service d’Astrophysique, F91191 Gif-sur-Yvette
Cedex, France.6 Federation de recherche APC, College de France 11, place Marcelin
Berthelot, F75231 Paris, France.7 Geneva Observatory, INTEGRAL Science Data Centre, Chemin d’Ecogia
16, 1291 Versoix, Switzerland.8 Centro deAstrobiologıa (CSIC-INTA), E28850 Torrejon deArdoz,Madrid,
Spain.9 ESA-ESTEC, Research and Scientific Support Department, Keplerlaan 1,
2201 AZ Noordwijk, Netherlands.
A
765
The Astrophysical Journal, 636:765–776, 2006 January 10
# 2006. The American Astronomical Society. All rights reserved. Printed in U.S.A.

covering the time period from the completion of the perfor-mance and verification phase in 2003 February to the end of2004 June.
INTEGRAL IBIS data is organized in short pointings (sciencewindows) of�2000 s. Pipeline processing was carried out usingthe standard OSA 4.1 software up to the production of sky im-ages for individual science windows. Ten adjacent energy bands(15–20, 20–30, 30–40, 40–60, 60–80, 80–100, 100–150, 150–300, 300–500, and 500–1000 keV)were used to allow later flex-ibility in data analysis.
Construction of an input catalog is a key part of the use ofOSA imaging software. The optimal input catalog should con-tain all sources that may be visible in individual science windows,and hence will require cleaning from images, with very accuratepositions. The final input catalog used in the image processingwas a list of�400 excesses produced primarily by a preliminaryprocessing of the data set using OSA 4.0 and an input catalogbased on the first IBIS/ ISGRI survey. The following constitutedthe final input cleaning catalog:
1. All sources listed in the first IBIS/ ISGRI catalog.2. All other INTEGRAL gamma-ray (IGR) sources detected
and published up to the start of processing.3. All excesses above a significance limit of 4.5 � detected in
preliminary OSA 4.0 mosaics.4. A list of additional transient sources obtained by searching
preliminary OSA 4.0 science window images.
3.2. Science Window Selection
It was observed that some science window pointing imageswere of poor quality and therefore would have resulted in de-graded image quality if added into the final mosaics, so thesewere removed prior to mosaic construction. The criterion used toremove these poorer quality imageswas the overall image rms sta-tistic. A histogramof image rms (Fig. 2) shows a broad populationof ‘‘good’’ images, but also a number of outliers. Inspection ofthese anomalous sciencewindows indicated that theywere almostalways associated with areas of high background (at the begin-ning or end of an orbit, or following solar flares) or the presenceof a bright source near the edge of the IBIS partially coded FOV.Since the final image rms is a clear function of the energy band,the allowed rms range was determined independently for eachenergy band, ultimately requiring the rejection of �5% of thescience windows. In addition, any science windows acquired in‘‘staring’’ mode were removed due to their adverse effect on finalmosaic quality.
3.3. Mosaicking
The selected science windows were mosaicked using a pro-prietary tool optimized to create all-sky galactic maps based onseveral thousand input science windows.Mosaics were produced for the whole data set for each of the
narrow energy bands indicated in x 3.1, and additionally for thefollowing broad bands: 20–40, 30–60, 20–60, 20–80, and 20–100 keV. The 20–40 and 30–60 keV bands were intended asprimary search bands as the highest image quality is seen in thisregime. However, previous investigation indicated that broaderbands such as 20–100 keVare better suited for searches for extra-galactic objects. Each mosaic covered the whole-sky area with anequal-area projection with a pixel size of 0N06 (3A6) at the centerof the mosaic.Additional mosaics were made for each revolution (in the 20–
40 keV band) and for each GCDE period (in the 20–100 keVband) covered by the data set.
3.4. Source Searching and Location
Each of the mosaics was searched using the SExtractor 2.3.2software (Bertin & Arnouts 1996). In practice, the AITOFF pro-jection used for all-sky images introduces heavy distortion to thepoint-spread function (PSF) of sources with jbj> 60�, so addi-tional maps were made using polar (ARC) projections to enablemore effective searching, and location, of sources in the Galacticpolar regions. The source positions measured by SExtractor rep-resent the centroid of the source calculated by taking the first-order moments of the source profile (referred to by SExtractor asthe barycenter method).Source detectability is limited at the faintest levels by back-
ground noise and can be improved by the application of a linearfiltering of the data. In addition, source confusion in crowdedfields can be minimized by the application of a bandpass filter.To this end, the mexhat bandpass filter is used in the SExtractorsoftware. The convolution of the filter with the mosaic alters thesource significances; hence SExtractor uses the source positionsidentified from the filtered mosaic to extract the source signifi-cances from the original mosaic. Figure 3 demonstrates the ef-ficiency of the bandpass filter in separating sources in closeproximity, in this case 1E 1145.1�6141 and 2E 1145.5�6155,
Fig. 1.—Exposure map for the second catalog observations. Contour levelsare at 10, 100 and 1000 ks. [See the electronic edition of the Journal for acolor version of this figure.]
Fig. 2.—Image rms as function of time (each point represents one sci-ence window) for the 40–60 keV science-window images. The decaying rmsat INTEGRAL Julian Date IJDð Þ � 1410 shows the recovery of the instrumentsafter the massive solar flare of 2003 October 28. The dashed lines represent theacceptance limits applied during science window filtering.
BIRD ET AL.766 Vol. 636
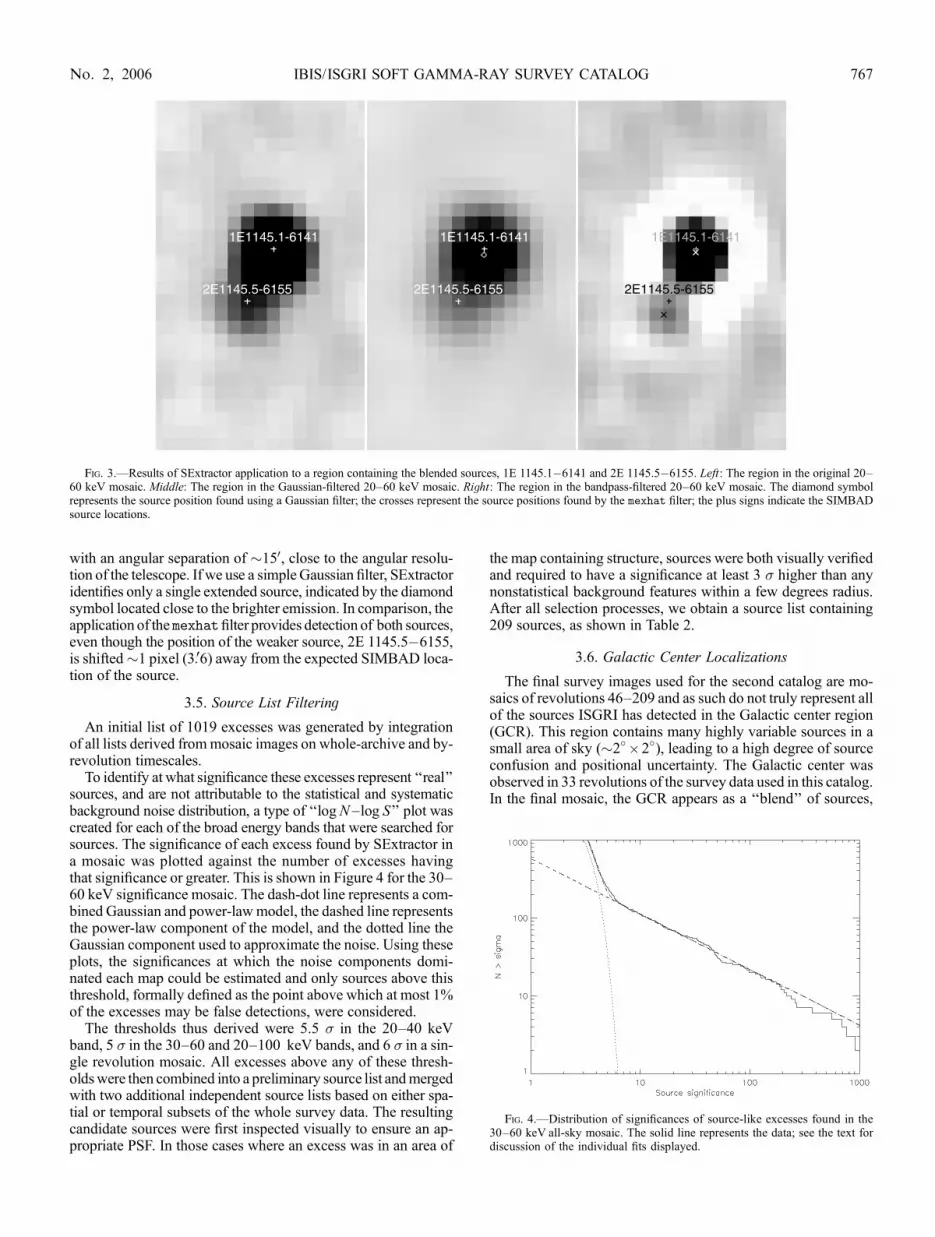
with an angular separation of �150, close to the angular resolu-tion of the telescope. If we use a simpleGaussian filter, SExtractoridentifies only a single extended source, indicated by the diamondsymbol located close to the brighter emission. In comparison, theapplication of themexhatfilter provides detection of both sources,even though the position of the weaker source, 2E 1145.5�6155,is shifted�1 pixel (3A6) away from the expected SIMBAD loca-tion of the source.
3.5. Source List Filtering
An initial list of 1019 excesses was generated by integrationof all lists derived frommosaic images on whole-archive and by-revolution timescales.
To identify at what significance these excesses represent ‘‘real’’sources, and are not attributable to the statistical and systematicbackground noise distribution, a type of ‘‘logN log S’’ plot wascreated for each of the broad energy bands that were searched forsources. The significance of each excess found by SExtractor ina mosaic was plotted against the number of excesses havingthat significance or greater. This is shown in Figure 4 for the 30–60 keV significance mosaic. The dash-dot line represents a com-bined Gaussian and power-lawmodel, the dashed line representsthe power-law component of the model, and the dotted line theGaussian component used to approximate the noise. Using theseplots, the significances at which the noise components domi-nated each map could be estimated and only sources above thisthreshold, formally defined as the point above which at most 1%of the excesses may be false detections, were considered.
The thresholds thus derived were 5.5 � in the 20–40 keVband, 5 � in the 30–60 and 20–100 keV bands, and 6 � in a sin-gle revolution mosaic. All excesses above any of these thresh-oldswere then combined into a preliminary source list andmergedwith two additional independent source lists based on either spa-tial or temporal subsets of the whole survey data. The resultingcandidate sources were first inspected visually to ensure an ap-propriate PSF. In those cases where an excess was in an area of
the map containing structure, sources were both visually verifiedand required to have a significance at least 3 � higher than anynonstatistical background features within a few degrees radius.After all selection processes, we obtain a source list containing209 sources, as shown in Table 2.
3.6. Galactic Center Localizations
The final survey images used for the second catalog are mo-saics of revolutions 46–209 and as such do not truly represent allof the sources ISGRI has detected in the Galactic center region(GCR). This region contains many highly variable sources in asmall area of sky (�2� ; 2�), leading to a high degree of sourceconfusion and positional uncertainty. The Galactic center wasobserved in 33 revolutions of the survey data used in this catalog.In the final mosaic, the GCR appears as a ‘‘blend’’ of sources,
Fig. 3.—Results of SExtractor application to a region containing the blended sources, 1E 1145.1�6141 and 2E 1145.5�6155. Left: The region in the original 20–60 keV mosaic. Middle: The region in the Gaussian-filtered 20–60 keV mosaic. Right: The region in the bandpass-filtered 20–60 keV mosaic. The diamond symbolrepresents the source position found using a Gaussian filter; the crosses represent the source positions found by the mexhat filter; the plus signs indicate the SIMBADsource locations.
Fig. 4.—Distribution of significances of source-like excesses found in the30–60 keV all-sky mosaic. The solid line represents the data; see the text fordiscussion of the individual fits displayed.
IBIS/ISGRI SOFT GAMMA-RAY SURVEY CATALOG 767No. 2, 2006

impossible to resolve into its constituents. However, the GCRsources are seen to vary in brightness from revolution to revo-lution (Fig. 5). By exploiting their highly variable nature, mostsources could be deblended by analyzing the individual revolu-tion (�3 day) mosaics. For example, SLX 1744�299 was pres-ent in all but 9 of the 33 revolutions, while SAX J1747.0�2853appeared only in revolution 175.
Belanger et al. (2004) reports the positions of six sources lo-cated in the 2� ; 2� region surrounding the Galactic center, asseen with ISGRI during 2003 April /May and determined from20–40 and 40–100 keV mosaics of 850 ks total effective expo-sure, using a simultaneous PSF fit of sources in the GCR. This,combinedwith themore isolated sources seen in our ownmosaics,represents our best prior knowledge of the hard X-ray emitters inthe Galactic center.
To deblend this region, each revolution mosaic (in the 20–40 keV band) covering the Galactic center region was visually
inspected in turn, noting the coordinates of excesses in the GCRin each revolution. By combining the positions obtained in thisway, 10 distinct sources could be identified, including all sixsources detected by Belanger et al. (2004). See Table 1 for theGCR source list.The centroids of these positions (determined from the individ-
ual revolutions) were compared with the coordinates of the sixsources quoted by Belanger et al. (2004). Our coordinates werefound to be consistent for five sources, the exception being KS1741�293. This source is particularly bright and well defined inrevolution 53, and therefore the coordinates were derived fromthis image (the position in Belanger et al. is quoted as being 2A31from the nominal position for this source, while our position hasan offset of 1A34). This method was also used for two of the re-maining sources (not detected by Belanger et al.): IGR J17475�2822 (well defined in revolutions 119 and 120); and SAX J1747.0�2853 (only seen in revolution 175). Finally, 1E 1724.8�2853and 1E 1742.9�2849 could not be sufficiently deblended, so co-ordinates from existing catalogs were used.
3.7. Flux Extraction
Time-averaged fluxes were extracted by generating a lightcurve for each source, taking into account all science windows inwhich the source was within the field of view. Aweighted meanwas generated for each light curve, which provides a flux estimatethat is, in principle, identical to that obtained in the mosaics, butwhich is found in practice to bemore robust against distortions ofthe mosaic and small losses seen in the mosaicking algorithm.Light curves, and hence fluxes, were generated in the 20–40
and 40–100 keVenergy bands; these allow an approximate assess-ment of the spectral characteristics of each source to be made.Fluxes and further analysis of those sources emitting at higher
energies will be provided in an additional catalog (A. Bazzanoet al. 2006, in preparation).
4. DATA QUALITY
4.1. Positions
The astrometric coordinates of the source positions were ex-tracted from the mosaics by the barycentring routines built into
Fig. 5.—Top: The final mosaic for the Galactic center, showing the confusednature of the region. Center: Map for revolution 53. Bottom: Map for revolu-tion 183. All maps show flux in the 20–40 keV band. See Table 1 for sourceidentifications.
TABLE 1
Sources Extracted from Galactic Center Region
by Spatial and Temporal Deblending
ID Source Name
R.A. (J2000.0)
(deg)
Decl. (J2000.0)
(deg) Nreva
A........ IE 1740.7-2942b,c 265.988 �29.745 21
B........ KS 1741-2931b,d 266.220 �29.340 19
C........ 1A 1742-294b,c 266.520 �29.510 18
D........ IGR J17456-2901b,d,e 266.410 �29.020 9
E ........ 1E 1742.8-2853f 266.498 �28.917 13
F ........ 1E 1742.9-2849f 266.570 �28.814 7
G........ 1E 1743.1-2843b,c 266.590 �28.670 4
H........ IGR J17475-2822g 266.820 �28.445 6
I ......... SAX J1747.0-2853h 266.805 �28.837 1
J ......... SLX 1744-299b,c 266.860 �30.020 29
a Number of revolutions in which source is detectable.b Presented in Belanger et al. (2004).c Centroid of positions from individual revolutions that are consistent with
Belanger et al. (2004).d Position taken from one revolution (revolution number) = 53.e Coincident with Sgr A�, but not unambiguously identified.f Could not be deblended, SIMBAD coordinates used.g Position taken from one revolution (revolution number) = (119, 120).h Position taken from one revolution (revolution number) = 175.
BIRD ET AL.768 Vol. 636

SExtractor 2.3.2. Of the 209 sources listed in the second IBIS/ISGRI catalog, 179 have well-defined positions obtained in dif-ferentwavebands according to the SIMBAD/NEDdatabase.Mea-suring the angular distance between the measured positions andthose provided by the SIMBAD database gives an indication ofthe source position errors. The mean position error of all sourcesdetected at a 10 � level or higher is �0A7. However, the point-source location error of IBIS is highly dependent upon the sig-nificance of the source detected (Gros et al. 2003).
By binning together sources of similar significance and calcu-lating the mean source position error we can see how the sourcepositioning accuracy varies with significance; this is shown inFigure 6. The data is fit by a power-law model with a constantoffset:
�x ¼ 11:6S�1:36 þ 0:51; ð1Þ
where �x is the error in the source position (in arc minutes) and Sis the source significance. This indicates that for the most sig-nificant detections we do not, on average, obtain a source loca-tion better than 0A51. For sources that have a significance of�5 �we have a mean accuracy of <20.
Gros et al. (2003) gives the range of the 90% confidence levelerror radius as 30–2000, with an error better than 10 for � > 30, andthey note that these results are derived from fields with few de-tected sources and may not be accurate in crowded fields. Thesource location accuracy of the source positions in the secondIBIS/ISGRI catalog is better than predicted by Gros et al. (2003)with an error better than 0A7 for � > 10.
4.2. Source Fluxes
The majority of the soft gamma-ray sources detected by IBISare intrinsically variable. Furthermore, the transient sources alsoexhibit outburst or flaring activity due to their binary nature cou-pled with accretion-driven processes. For this reason, since thefluxes quoted are an average over 2 yr of observations, we cannotexpect a strong agreement between the fluxes of the two cata-logs. Moreover, we have made a substantial improvement in ourunderstanding of the instrument and the software used to extractthe scientific data in order to better take account of the systematiceffects present. The fluxes derived in the first catalog used an ear-lier version of the OSA imaging software, which has been up-graded in many areas, and specifically in terms of the off-axis
response corrections available in OSA 4.0 onwards. For surveydata, where we combine multiple pointings at various off-axisangles, this is critical, and the lack of off-axis corrections inOSA3would have created a systematic underestimate of the fluxesin the first catalog. Use of the light-curve extraction method alsoremoves any flux losses during the mosaicking process, whichwe estimate at �4%–6% for the mosaics used in the first catalogcompilation.
5. DISCUSSION
Wehave derived an ‘‘unbiased’’ catalog of 209 sources (Table 2)observed in a systematic analysis of the IBIS/ISGRI Core Programand public data spanning nearly 2 yr of operation. Figures 7, 8,and 9 show significance maps in the 30–60 keVenergy band for30
�sections of the Galactic plane.
The last year has seen a substantial improvement in our under-standing of the instrument and software, and hence our detectionof sources. Improvements to the off-axis responses, and betterflux extraction tools have allowed us to produce more reliableflux estimates, albeit for time-averaged fluxes that are only in-dicative of brightness for the highly variable sources that dom-inate the high-energy sky.
Figure 10 illustrates a simple breakdown of the 209 sourcespresented in this catalog by source type, and how this breakdowncompares to the first catalog. The source list remains dominatedby Galactic accreting binaries: a total of 113 objects, representedby 38 high-mass and 67 low-mass X-ray binaries (HMXBs andLMXBs, respectively), but also a small population of cataclys-mic variables (CVs). In most cases, the compact object is aneutron star (79 confirmed cases; 32 in HMXBs, 47 in LMXBs),but the sample also contains four confirmed black holes (one inan HMXB and three in LMXBs) and six LMXB black hole can-didates (BHCs). There are an additional four tentative associationsas BHCs, based simply on the spectral and temporal character-istics of the sources. Also worthy of note is our detection of IGRJ1745.6�2901, shown to be coincident with supermassive blackhole candidate Sgr A� (Belanger et al. 2004). TheGalactic samplealso includes four isolated pulsars (one of which is an anomalousX-ray pulsar [AXP]), four supernova remnants (of which twoare associated with AXPs), and two associations with molecularclouds.
As a direct consequence of the wider and deeper sky coverage(see Fig. 1), there has been a five-fold increase in active galacticnucleus (AGN) detections over the first catalog. The improvedsky coverage has provided us with a first real look at the extra-galactic sky with IBIS, detecting 33 extragalactic sources (closeto�20% of the entire catalog), of which there are two clusters ofgalaxies, 22 Seyfert galaxies, three blazars, and six more sourceswhose classifications are unconfirmed but are coincident withAGNs. Further analysis of this samplewill be presented inBassaniet al. (2005)
Compared to the first IBIS/ ISGRI catalog, the number of de-tections without a firm classification has doubled, but this repre-sents a similar proportion of the total number of sources (�25%)as in the first. Of the unclassified sources, 39 are of an unknownnature, while the remaining 17 have unconfirmed, so-calledtentative classifications. Approximately one-quarter of the sourcescataloged as unclassified in the first catalog have now beenclassified�three HMXBs, one LMXB, one CV, and two AGNs,with many more tentative associations. The majority (�80%)of the remaining and new unclassified sources are INTEGRALdiscoveries.
IGR sources represent detections that are either entirely newor those with no obvious counterpart or association in the hard
Fig. 6.—Binnedmean source position error of sources as a function of sourcesignificance. Each bin contains 10 sources. The dashed line indicates the modelshown in eq. (1).
IBIS/ISGRI SOFT GAMMA-RAY SURVEY CATALOG 769No. 2, 2006

TABLE 2
Second IBIS/ ISGRI Catalog
NameaR.A.
(deg)
Decl.
(deg)
Error b
(arcmin) F20–40c F40–100
c Significanced Exposuree Typef References
V709 Casy ........................... 7.252 59.317 1.3 4.1 � 0.5 <2.9 6.9� 79 CV 1
RX J0053.8�7226y............. 13.531 �72.426 1.2 3.3 � 0.4 <2.3 7.6� 106 HMXB, XP, T, Be 2, 3
� Casy.................................. 14.126 60.702 1.1 5.2 � 0.5 <2.9 8.8� 77 HMXB, Be 2, 3
SMC X-1y ........................... 19.324 �73.444 0.5 39.6 � 0.4 9.2 � 0.8 86.7� 106 HMXB, XP 2
1A 0114+650 ...................... 19.511 65.288 0.7 10.3 � 0.5 5.3 � 1.0 17.5� 78 HMXB, XP 2
QSO B0241+62y ................. 41.184 62.510 1.4 3.7 � 0.7 5.8 � 1.2 6.4�� 51 AGN, Sy1.2 4
X Perg.................................. 58.842 31.036 0.9 50.1 � 4.8 51.0 � 7.5 11.2�� 2 HMXB, XP, Be 2, 3
LMC X-4hy.......................... 83.221 �66.365 0.6 50.3 � 1.5 12.0 � 2.5 33.5� 23 HMXB, XP 2
Crab..................................... 83.628 22.020 0.5 1000.0 1000.0 1691.0�� 97 PWN, PSR 5
MCG+08�11�011y ............ 88.745 46.454 1.4 6.1 � 1.0 <5.5 6.2� 23 AGN, Sy1.5 4
4U 0614+091 ...................... 94.270 9.145 0.6 24.7 � 0.8 22.8 � 1.4 29.5�� 46 LMXB, B, A 6
IGR J07506�1547y ............ 117.647 �15.788 1.7 2.2 � 0.6 4.2 � 1.1 5.3�� 64 ?
IGR J07565�4139y ............ 119.123 �41.642 1.3 1.0 � 0.2 <0.8 6.8� 949 ?
IGR J07597�3842y ............ 119.930 �38.730 0.9 2.3 � 0.2 1.9 � 0.3 11.4�� 774 AGN? 7
ESO 209�12y ..................... 120.483 �49.738 0.9 1.4 � 0.2 1.8 � 0.3 11.3�� 939 AGN, Sy1.5 4
Vela pulsar .......................... 128.816 �45.184 0.5 6.9 � 0.1 8.2 � 0.2 64.8�� 1450 PWN, PSR 5
4U 0836�429 ..................... 129.338 �42.893 0.5 36.6 � 0.1 31.1 � 0.2 240.9�� 1400 LMXB, T, B 6
FRL 1146y........................... 129.633 �36.008 1.2 1.3 � 0.2 0.9 � 0.3 7.9� 881 AGN, Sy1 4
Vela X-1 .............................. 135.512 �40.557 0.5 216.9 � 0.1 48.1 � 0.2 1440.1� 1220 HMXB, XP 2
IGR J09026�4812y ............ 135.638 �48.196 1.1 0.9 � 0.1 0.9 � 0.2 8.5� 1350 ?
4U0919�54y ....................... 140.050 �55.187 0.7 3.6 � 0.2 2.6 � 0.4 16.1�� 602 LMXB 6
EXMS B0918�549Ei, jy ...... 140.022 �55.143 0.9 . . . . . . 12.0� 602 ?, T
MCG�05�23�016y ........... 146.869 �30.930 1.0 10.2 � 1.4 8.4 � 2.0 9.9�� 27 AGN, Sy1i 4
GRO J1008�57ky ............... 152.396 �58.294 0.9 <1.3 <2.2 11.6 130 HMXB, XP, Be, T 2, 3
IGR J10404�4625y ............ 160.095 �46.416 1.5 2.9 � 0.7 5.9 � 1.1 5.7�� 102 AGN? 8
IGR J11114�6723y ............. 167.854 �67.392 1.7 1.7 � 0.4 2.3 � 0.7 5.1�� 199 ?
Cen X-3............................... 170.300 �60.638 0.5 27.4 � 0.4 3.6 � 0.6 71.9� 209 HMXB, XP 2
1E 1145.1�6141l,m............. 176.866 �61.957 0.5 30.1 � 0.3 17.5 � 0.5 83.4�� 269 HMXB, XP 2
2E 1145.5�6155ny .............. 177.016 �62.199 0.7 7.9 � 0.3 4.6 � 0.5 17.5� 274 HMXB, XP, Be, T 2, 3
NGC 4151y ......................... 182.640 39.401 0.5 32.7 � 0.6 40.0 � 1.0 42.4�� 56 AGN, Sy1.5 4
4C 04.42y ............................ 185.606 4.239 1.4 1.4 � 0.4 3.9 � 0.6 6.5�� 213 AGN, QSO 4
NGC 4388y ......................... 186.446 12.637 0.6 15.4 � 0.9 16.7 � 1.4 21.0�� 62 AGN, Sy1h 4
GX 301�2 .......................... 186.653 �62.776 0.5 112.8 � 0.3 14.4 � 0.4 401.1� 406 HMXB, XP, T 2
3C 273y ............................... 187.293 2.027 0.6 7.5 � 0.3 8.5 � 0.5 28.2�� 279 AGN, QSO 4
IGR J12349�6433y ............ 188.709 �64.570 0.7 4.5 � 0.3 2.8 � 0.4 16.8� 437 Symb 9
NGC 4507y ......................... 188.912 �39.903 0.7 10.7 � 0.7 12.2 � 1.1 17.5�� 63 AGN, Sy1h 4
LEDA 170194y ................... 189.796 �16.182 1.2 2.6 � 0.5 5.6 � 0.9 7.6�� 111 AGN? 8
NGC 4593y ......................... 189.927 �5.353 0.7 4.1 � 0.3 4.0 � 0.5 16.2�� 349 AGN, Sy1 4
4U 1246�588y .................... 192.351 �59.091 1.1 2.0 � 0.3 2.0 � 0.4 8.3�� 436 HMXB, T 2
3C 279y ............................... 194.038 �5.781 1.2 1.9 � 0.3 2.2 � 0.5 7.5�� 326 Blazar 4
1H 1254�690y .................... 194.361 �69.305 1.2 2.5 � 0.3 <1.4 7.7� 369 LMXB, B, D 6
Coma Clustery ..................... 194.880 27.961 1.3 1.9 � 0.3 <1.5 7� 251 Cluster 5
IGR J13020�6359y ............ 195.541 �63.925 1.1 2.1 � 0.2 1.3 � 0.4 8.4� 501 ?
NGC 4945y ......................... 196.362 �49.476 0.5 11.4 � 0.4 18.5 � 0.7 38.2�� 226 AGN, Sy2 10
Cen A.................................. 201.364 �43.021 0.5 49.7 � 0.4 63.8 � 0.8 129.2�� 112 AGN, Sy2 11
4U 1323�62y ...................... 201.650 �62.126 0.7 3.8 � 0.2 2.4 � 0.4 16.9� 535 LMXB, B, D 6
4U 1344�60y ...................... 206.872 �60.604 0.7 3.9 � 0.2 4.7 � 0.4 19.9�� 526 AGN? 8
IC 4329Ay ........................... 207.348 �30.323 1.1 10.0 � 1.1 8.1 � 1.8 8.6�� 29 AGN, Sy1.2 4
Circinus galaxy ................... 213.274 �65.343 0.5 14.0 � 0.2 11.5 � 0.4 62.3� 487 AGN, Sy1h 4
IGR J14492�5535y ............ 222.305 �55.579 1.5 1.5 � 0.2 <1.2 5.7� 520 ?
PSR B1509�58 .................. 228.466 �59.147 0.5 8.6 � 0.2 11.0 � 0.4 44.4�� 509 PSR 12
Cir X-1o .............................. 230.178 �57.174 0.5 15.6 � 0.2 <1.2 59.6� 512 LMXB, T, B, A 6
IGR J15359�5750y ............ 233.965 �57.832 1.3 1.2 � 0.2 2.0 � 0.4 7.0�� 505 ?
4U 1538�522 ..................... 235.600 �52.378 0.5 22.6 � 0.2 3.0 � 0.4 91.9� 553 HMXB, XP 2
4U 1543�624y .................... 236.947 �62.577 0.9 2.9 � 0.3 <1.4 10.8� 386 LMXB 6
IGR J15479�4529.............. 237.033 �45.484 0.6 5.4 � 0.2 2.4 � 0.4 20.9� 544 CV 13, 14
XTE J1550�564................. 237.746 �56.482 0.5 115.1 � 0.2 176.5 � 0.4 628.1�� 525 LMXB, T, BH 6, 15
4U 1608�522 ..................... 243.175 �52.434 0.5 14.8 � 0.2 11.9 � 0.3 68.4�� 648 LMXB, T, B, A 6
IGR J16167�4957.............. 244.139 �49.985 1.0 2.1 � 0.2 <1.0 9.3� 682 ?
IGR J16194�2810y ............ 244.858 �28.160 1.5 2.2 � 0.3 <1.5 6.0� 349 ? 16
AX J161929�4945p ........... 244.865 �49.727 0.9 2.2 � 0.2 1.9 � 0.3 10.5�� 690 HMXB, NS? 17
Sco X-1 ............................... 244.988 �15.648 0.5 716.9 � 0.6 16.3 � 0.9 1060.0� 110 LMXB, Z 6
IGR J16207�5129.............. 245.195 �51.504 0.8 3.3 � 0.2 2.4 � 0.3 14.9�� 676 ?
4U 1624�490 ..................... 247.012 �49.204 0.7 4.2 � 0.2 <1.0 18.7� 715 LMXB, D 6
770

TABLE 2—Continued
NameaR.A.
(deg)
Decl.
(deg)
Error b
(arcmin) F20–40c F40–100
c Significanced Exposuree Typef References
IGR J16318�4848.............. 247.942 �48.824 0.5 29.3 � 0.2 14.4 � 0.3 129.1� 724 HMXB, T 18
AX J1631.9�4752.............. 248.006 �47.870 0.5 17.1 � 0.2 6.6 � 0.3 78.3� 737 HMXB, T, XP 19, 20
4U 1626�67 ....................... 248.098 �67.456 0.6 16.1 � 0.5 <2.3 31.0� 181 LMXB, XP 6
4U 1630�47 ....................... 248.517 �47.398 0.5 63.5 � 0.2 44.9 � 0.3 290.5�� 742 LMXB, T, U, D, BHC 6
IGR J16358�4726.............. 248.970 �47.421 0.7 4.3 � 0.2 2.4 � 0.3 19.7� 747 LMXB?, T 21
IGR J16377�6423qy ........... 249.420 �64.382 1.6 2.2 � 0.4 <1.8 5.6� 235 Cluster? 22, 16
AX J163904�4642r............ 249.763 �46.693 0.6 6.9 � 0.2 <1.0 32.9� 760 HMXB?, T, XP 23, 24, 25
4U 1636�536 ..................... 250.222 �53.755 0.5 24.2 � 0.2 13.4 � 0.4 106.5� 641 LMXB, B, A 6
IGR J16418�4532.............. 250.440 �45.532 0.6 5.2 � 0.2 1.3 � 0.3 23.0� 784 ?
GX 340+0 ........................... 251.447 �45.612 0.5 34.9 � 0.2 2.1 � 0.3 158.7� 794 LMXB, Z 6
IGR J16479�4514.............. 252.004 �45.207 0.7 3.9 � 0.2 2.7 � 0.3 18.2� 805 HMXB? 26
IGR J16482�3036y ............ 252.040 �30.593 1.1 1.6 � 0.2 1.6 � 0.3 8.4�� 857 AGN? 8, 16
IGR J16493�4348s............. 252.381 �43.835 0.8 2.7 � 0.2 2.2 � 0.3 13.3�� 847 XB? 27
IGR J16500�3307y ............ 252.505 �33.116 1.2 1.7 � 0.2 <0.9 7.8� 966 ? 16
ESO 138�1ty....................... 252.938 �59.213 1.3 1.9 � 0.3 1.6 � 0.4 6.7�� 402 AGN, Sy2 4
IGR J16558�5203.............. 254.012 �52.052 1.0 1.4 � 0.2 2.5 � 0.4 9.1�� 660 ?
AX J1700.2�4220.............. 255.073 �42.396 1.2 1.4 � 0.2 1.3 � 0.3 7.6�� 946 ?
OAO 1657�415 ................. 255.206 �41.661 0.5 85.1 � 0.2 45.8 � 0.3 402.6� 980 HMXB, XP 2
GX 339�4 .......................... 255.708 �48.791 0.5 22.7 � 0.2 28.2 � 0.3 126.1�� 710 LMXB, T, U, BH 6, 28
4U 1700�377 ..................... 255.988 �37.849 0.5 207.3 � 0.2 124.6 � 0.3 1110.2�� 1180 HMXB 2
GX 349+2 ........................... 256.448 �36.419 0.5 46.0 � 0.2 1.6 � 0.3 241.5� 1220 LMXB, Z 6
4U 1702�429 ..................... 256.566 �43.055 0.5 14.9 � 0.2 9.3 � 0.3 71.1� 921 LMXB, B, A 6
IGR J17088�4008y ............ 257.208 �40.142 0.9 1.1 � 0.2 2.2 � 0.3 10.3�� 1110 AXP 6
4U 1705�440 ..................... 257.226 �44.107 0.5 27.3 � 0.2 16.4 � 0.3 124.4� 863 LMXB, B, A 6
4U 1705�32 ....................... 257.237 �32.317 0.7 2.9 � 0.2 3.0 � 0.3 19.3�� 1290 LMXB, B 29
IGR J17091�3624.............. 257.278 �36.415 0.5 10.0 � 0.2 13.2 � 0.3 71.5�� 1260 BHC? 30
XTE J1709�267uy .............. 257.389 �26.655 0.7 1.0 � 0.2 <0.8 18.4 1140 LMXB, B, T 6
XTE J1710�281................. 257.550 �28.140 0.6 3.0 � 0.2 4.1 � 0.3 22.0�� 1210 LMXB, T, B 6
Oph Clusterv ....................... 258.109 �23.363 0.6 4.9 � 0.2 1.7 � 0.3 25.6� 1020 Cluster 31
4U 1708�40y ...................... 258.139 �40.850 1.3 1.2 � 0.2 <0.8 6.9� 1060 LMXB, B 6
SAX J1712.6�3739............ 258.146 �37.655 0.6 5.2 � 0.2 4.5 � 0.3 31.0�� 1250 LMXB, T, B 6
V2400 Oph ......................... 258.170 �24.267 0.7 3.5 � 0.2 2.1 � 0.3 19.4� 1070 CV 1
XTE J1716�389y................ 258.941 �38.835 1.1 1.6 � 0.2 1.0 � 0.3 8.8� 1200 ? 16
NGC 6300........................... 259.213 �62.823 1.0 4.3 � 0.4 3.7 � 0.7 10.1�� 200 AGN, Sy2 4
IGR J17195�4100.............. 259.931 �41.032 0.8 2.3 � 0.2 2.2 � 0.3 13.9�� 1060 ?
XTE J1720�318................. 259.976 �31.749 0.5 6.1 � 0.2 8.1 � 0.2 49.4�� 1410 LMXB, T, BHC 32
IGR J17200�3116.............. 260.022 �31.290 0.7 3.0 � 0.2 2.3 � 0.2 19.4�� 1430 ?, T
IGR J17204�3554wy .......... 260.104 �35.900 0.8 1.5 � 0.2 2.1 � 0.2 13.1�� 1360 Mol cloud? 33
EXO 1722�363x ................ 261.288 �36.277 0.5 8.9 � 0.2 3.2 � 0.2 51.8� 1360 HMXB, XP 2
IGR J17254�3257.............. 261.350 �32.968 0.7 2.7 � 0.2 3.0 � 0.2 19.9�� 1450 ?
GRS 1724�30 .................... 261.884 �30.812 0.5 18.2 � 0.2 16.0 � 0.2 125.6�� 1470 LMXB, G, B, A 6
IGR J17285�2922y ............ 262.172 �29.382 1.2 0.7 � 0.2 1.4 � 0.2 7.3�� 1470 BHC?, T 34
IGR J17303�0601.............. 262.593 �6.016 0.9 3.7 � 0.3 2.1 � 0.5 11.6� 282 LMXB?, CV? 35, 36
GX 9+9 ............................... 262.927 �16.974 0.5 12.9 � 0.2 1.6 � 0.3 53.8� 722 LMXB, A 6
GX 354�0 .......................... 262.988 �33.830 0.5 44.1 � 0.2 16.8 � 0.2 264.1� 1460 LMXB, B, A 6
GX 1+4 ............................... 263.004 �24.752 0.5 42.5 � 0.2 31.0 � 0.2 259.2�� 1330 LMXB, XP 6
4U 1730�335y .................... 263.354 �33.390 0.8 2.4 � 0.2 <0.7 15.0� 1470 LMXB, G, RB, T 6
GRS 1734�294 .................. 264.381 �29.136 0.6 5.4 � 0.1 3.9 � 0.2 33.5�� 1510 AGN, Sy1 4
SLX 1735�269................... 264.567 �26.995 0.5 9.3 � 0.2 7.5 � 0.2 61.6�� 1460 LMXB, B 6
4U 1735�444 ..................... 264.744 �44.451 0.5 29.6 � 0.2 1.3 � 0.3 132.3� 767 LMXB, B, A 6
XTE J17391�3021y............ 264.818 �30.347 1.1 1.3 � 0.1 0.9 � 0.2 8.5�� 1510 HMXB, NS, Be?, T 2, 37, 3
XTE J1739�285yy .............. 264.961 �28.496 1.1 <0.4 <0.7 8.4 1500 LMXB? 38
SLX 1737�282................... 265.191 �28.280 0.6 3.2 � 0.1 3.3 � 0.2 23.8�� 1490 LMXB, B 6, 39
2E 1739.1�1210y................ 265.463 �12.196 1.1 2.2 � 0.2 1.8 � 0.4 8.8�� 526 AGN, Sy1 40
XTE J1743�363y................ 265.751 �36.381 0.8 2.5 � 0.2 1.9 � 0.2 14.6�� 1340 ?, T
1E 1740.7�2942z ............... 265.988 �29.745 0.5 26.7 � 0.1 34.0 � 0.2 222.0�� 1510 LMXB, BHC 6, 41, 42
IGR J17445�2747y ............ 266.132 �27.783 1.5 0.9 � 0.1 0.8 � 0.2 6.0� 1480 ?
KS 1741�293aa .................. 266.220 �29.340 0.5 8.8 � 0.1 7.8 � 0.2 62.3�� 1510 LMXB, T, B 6
IGR J17456�2901bb,ccy ...... 266.410 �29.020 0.6 5.0 � 0.1 2.7 � 0.2 30.9� 1500 ? 43
1E 1742.8�2853ccy............. 266.498 �28.917 0.6 5.4 � 0.1 3.7 � 0.2 31.8� 1500 LMXB 6
1A 1742�294y .................... 266.520 �29.510 0.5 14.1 � 0.1 7.9 � 0.2 85.7� 1510 LMXB, B 6
IGR J17464�3213.............. 266.567 �32.232 0.5 66.5 � 0.2 40.5 � 0.2 405.1� 1490 LMXB, T, BHC 6, 44
1E 1742.9�2849ccy............. 266.570 �28.814 0.6 5.4 � 0.1 2.8 � 0.2 31.6� 1500 LMXB 6
1E 1743.1�2843dd.............. 266.590 �28.670 0.8 3.8 � 0.1 1.6 � 0.2 13.5� 1500 LMXB 6
SAX J1747.0�2853ddy ....... 266.805 �28.837 1.1 1.4 � 0.1 <0.7 8.8� 1500 LMXB, B, T 6
771

TABLE 2—Continued
NameaR.A.
(deg)
Decl.
(deg)
Error b
(arcmin) F20–40c F40–100
c Significanced Exposuree Typef References
IGR J17475�2822.............. 266.820 �28.445 0.7 2.1 � 0.1 1.9 � 0.2 15.1�� 1490 Mol cloud? 45
SLX 1744�299................... 266.860 �30.020 0.5 8.8 � 0.1 5.7 � 0.2 56.5� 1500 LMXB, B 6
GX 3+1 ............................... 266.989 �26.562 0.5 13.5 � 0.2 0.8 � 0.2 84.7� 1440 LMXB, B, A 6
1A 1744�361y .................... 267.057 �36.133 1.2 1.0 � 0.2 1.3 � 0.2 7.7�� 1340 LMXB, T 6
IGR J17488�3253.............. 267.206 �32.914 0.7 2.3 � 0.2 3.3 � 0.2 19.4�� 1460 ?
4U 1745�203 ..................... 267.217 �20.386 0.7 2.1 � 0.2 3.2 � 0.3 16.1�� 1070 LMXB, T, G 6
4U 1746�370 ..................... 267.557 �37.047 0.6 4.7 � 0.2 1.9 � 0.3 25.5� 1270 LMXB, G, B, A 6
GRS 1747�312y ................. 267.637 �31.296 1.1 1.1 � 0.2 1.1 � 0.2 8.4�� 1480 LMXB, G, T 6
IGR J17513�2011y............. 267.822 �20.188 0.8 2.0 � 0.2 2.5 � 0.3 13.4�� 1060 ? 16
IGR J17544�2619y ............ 268.605 �26.342 1.3 1.1 � 0.2 <0.7 6.7� 1410 HMXB?, T 46, 47, 16
IGR J17597�2201.............. 269.939 �22.033 0.5 8.4 � 0.2 7.8 � 0.3 52.2�� 1190 LMXB, B, D 48, 37
GX 5-1 ................................ 270.287 �25.079 0.5 55.3 � 0.2 3.2 � 0.2 318.9� 1340 LMXB, Z 6
GRS 1758�258 .................. 270.303 �25.749 0.5 39.5 � 0.2 48.1 � 0.2 291.9�� 1350 LMXB, U, BHC 6, 49
GX 9+1 ............................... 270.388 �20.524 0.5 17.6 � 0.2 0.9 � 0.3 93.0� 1080 LMXB, A 6
IGR J18027�1455.............. 270.690 �14.922 0.7 3.0 � 0.2 3.3 � 0.3 15.5�� 766 AGN, Sy1 35
SAX J1802.7�201ee ........... 270.692 �20.294 0.6 5.8 � 0.2 2.5 � 0.3 30.5� 1070 HMXB, T, XP 50, 51
IGR J18048�1455y ............ 271.211 �14.914 1.0 1.7 � 0.2 2.0 � 0.3 9.3�� 774 ?
XTE J1807�294................. 271.748 �29.410 0.6 3.1 � 0.2 3.1 � 0.2 21.6�� 1340 LMXB, T, XP 52
SGR 1806�20 .................... 272.156 �20.423 0.6 3.4 � 0.2 4.7 � 0.3 23.7�� 1060 SGR 53
IGR J18135�1751eey .......... 273.363 �17.849 1.1 1.6 � 0.2 1.2 � 0.3 8.2�� 916 ? 54
GX 13+1 ............................. 273.618 �17.146 0.5 17.5 � 0.2 5.0 � 0.3 84.5� 880 LMXB, B, A 6
M 1812�12......................... 273.779 �12.102 0.5 25.7 � 0.2 25.5 � 0.3 137.7�� 735 LMXB, B 6
GX 17+2 ............................. 274.007 �14.040 0.5 58.4 � 0.2 3.2 � 0.3 263.9� 781 LMXB, B, Z 6
SAX J1818.6�1703y .......... 274.671 �17.055 1.4 1.2 � 0.2 1.2 � 0.3 6.5�� 869 ?, T
IGR J18193�2542y ............ 274.820 �25.703 1.5 0.8 � 0.2 1.1 � 0.3 5.7�� 1130 ?
AX J1820.5�1434.............. 275.133 �14.572 0.6 5.1 � 0.2 3.3 � 0.3 23.4� 794 HMXB, XP, Be 2, 3
IGR J18214�1318y ............ 275.340 �13.308 0.9 2.1 � 0.2 2.0 � 0.3 10.8�� 773 ?
4U 1820�303 ..................... 275.928 �30.370 0.5 35.3 � 0.2 2.3 � 0.3 186.6� 1070 LMXB, G, B, A 6
4U 1822�000 ..................... 276.335 �0.032 1.0 2.4 � 0.2 <1.1 9.9� 641 LMXB 6
IGR J18256�1035y ............ 276.406 �10.587 1.5 1.2 � 0.2 <1.0 5.9� 762 ?
3A 1822�371 ..................... 276.462 �37.102 0.5 34.1 � 0.2 4.3 � 0.3 162.5� 895 LMXB, D 6
IGR J18259�0706y ............ 276.485 �7.106 1.4 1.2 � 0.2 1.0 � 0.3 6.2�� 743 ?
GS 1826�24 ....................... 277.367 �23.801 0.5 73.3 � 0.2 58.6 � 0.3 359.8�� 942 LMXB, B 6
IGR J18325�0756.............. 278.118 �7.940 0.7 3.9 � 0.2 2.2 � 0.3 18.2� 794 ?
SNR 021.5�00.9 ................ 278.395 �10.558 0.7 2.8 � 0.2 3.3 � 0.3 15.9�� 785 SNR, PWN 55
PKS 1830�211................... 278.405 �21.052 0.7 3.0 � 0.2 3.7 � 0.3 17.7�� 843 AGN, QSO 4
RX J1832�330 ................... 278.921 �32.989 0.5 11.6 � 0.2 9.9 � 0.3 58.6�� 823 LMXB, G, B, T 6
AX J1838.0�0655ff ............ 279.507 �6.904 0.8 2.1 � 0.2 3.1 � 0.3 14.1�� 835 ? 56
ESO 103�35y ..................... 279.578 �65.431 1.4 5.9 � 0.9 4.5 � 1.5 6.2�� 42 AGN, Sy1.9 4
Ser X-1................................ 279.992 5.031 0.5 10.1 � 0.2 <0.9 48.7� 861 LMXB, B 6
AX J1841.0�0535y............. 280.237 �5.602 1.5 1.0 � 0.2 1.1 � 0.3 6.0�� 861 HMXB, XP, Be? 57
Kes 73 ................................. 280.338 �4.949 0.7 2.0 � 0.2 3.8 � 0.3 15.1�� 875 SNR, AXP 58
IGR J18450�0435y ............ 281.243 �4.602 1.8 1.0 � 0.2 <0.9 5.0�� 907 ?
GS 1843+009...................... 281.418 0.875 0.6 4.3 � 0.2 3.2 � 0.3 22.9�� 970 HMXB, XP, Be, T 2, 3
AX J1846.4�0258.............. 281.622 �2.973 0.8 1.9 � 0.2 2.5 � 0.3 12.5�� 940 SNR, PWN, AXP 59
IGR J18483�0311.............. 282.064 �3.169 0.7 4.1 � 0.2 2.7 � 0.3 20.3� 945 ?
3A 1845�024y .................... 282.082 �2.424 1.3 1.3 � 0.2 0.9 � 0.3 6.7� 956 HMXB, XP, Be?, T 2, 3
IGR J18490�0000y ............ 282.267 �0.025 1.4 1.2 � 0.2 0.9 � 0.3 6.4�� 998 ?
4U 1850�087 ..................... 283.266 �8.706 0.6 4.6 � 0.2 3.8 � 0.3 23.2�� 804 LMXB, G, B 6
IGR J18539+0727y ............. 283.477 7.458 0.9 1.9 � 0.2 1.6 � 0.3 11.3�� 1000 BHC? 30
V1223 Sgr gg ....................... 283.755 �31.145 0.6 7.8 � 0.2 3.5 � 0.4 30.3� 512 CV 1
XTE J1855�026................. 283.877 �2.604 0.5 11.8 � 0.2 6.9 � 0.3 64.8� 969 HMXB, XP, T 2
2E 1853.7+1534y ................ 284.008 15.621 0.9 2.8 � 0.2 2.0 � 0.4 12.0�� 578 AGN? 8
XTE J1858+034hhy ............. 284.686 3.431 0.5 0.8 � 0.2 <0.8 49.8 1090 HXMB, XP, Be?, T 2, 3
XTE J1901+014.................. 285.397 1.439 0.6 3.4 � 0.2 3.0 � 0.3 21.6�� 1070 T, BHC? 60
4U 1901+03 ........................ 285.913 3.205 0.5 93.8 � 0.2 10.5 � 0.3 552.3� 1090 HMXB, T, XP 2, 61
XTE J1908+094y ................ 287.220 9.390 0.6 3.6 � 0.2 4.2 � 0.3 23.7�� 998 LMXB, T, BHC 62
4U 1907+097 ...................... 287.414 9.836 0.5 16.5 � 0.2 2.0 � 0.3 91.4� 980 HMXB, XP, T 2
4U 1909+07 ........................ 287.701 7.602 0.5 14.4 � 0.2 8.7 � 0.3 81.6� 1060 HMXB, XP 63
Aql X�1y ............................ 287.811 0.577 0.5 9.4 � 0.2 5.1 � 0.3 53.8� 1010 LMXB, B, A, T 6
SS 433................................. 287.957 4.974 0.5 14.5 � 0.2 7.3 � 0.3 89.0� 1090 HMXB 2
IGR J19140+0951ii ............. 288.525 9.872 0.5 9.5 � 0.2 5.7 � 0.3 54.7� 981 HMXB?, NS? 64, 65
GRS 1915+105 ................... 288.798 10.940 0.5 288.1 � 0.2 108.8 � 0.3 1591.0� 926 LMXB, T, BH 6, 66
4U 1916�053 ..................... 289.697 �5.243 0.5 9.3 � 0.2 3.9 � 0.3 42.1� 682 LMXB, B, D 6
IGR J19284+0107y ............. 292.098 1.119 1.3 1.2 � 0.2 <0.9 6.8� 857 ?
772

TABLE 2—Continued
NameaR.A.
(deg)
Decl.
(deg)
Error b
(arcmin) F20–40c F40–100
c Significanced Exposuree Type f References
IGR J19308+0530y ............. 292.692 5.502 1.4 0.8 � 0.2 1.5 � 0.3 6.6��� 949 ?
RX J1940.1�1025 .............. 295.066 �10.408 1.1 3.0 � 0.3 2.1 � 0.6 8.1� 267 CV 1
NGC 6814y ......................... 295.644 �10.332 1.0 3.1 � 0.3 3.9 � 0.6 9.9�� 248 AGN, Sy1.5 4
KS 1947+300...................... 297.396 30.210 0.5 38.4 � 0.6 23.9 � 1.0 55.6� 93 HMXB, T, XP 2, 67, 68
Cyg X-1 .............................. 299.592 35.194 0.5 812.9 � 0.6 944.3 � 1.0 1417.3�� 100 HMXB, BH, U 2
Cyg Ay ................................ 299.878 40.755 1.1 5.4 � 0.6 6.0 � 1.0 8.8�� 91 AGN, Sy1.9 4
EXO 2030+375................... 308.046 37.630 0.5 38.9 � 0.5 20.4 � 0.8 74.6� 147 HMXB, XP, Be, T 2, 3
Cyg X-3 .............................. 308.108 40.953 0.5 201.1 � 0.4 82.2 � 0.7 418.4� 151 HMXB 2
SAX J2103.5+4545 ............ 315.891 45.743 0.5 33.4 � 0.4 18.5 � 0.7 78.4� 166 HMXB, XP, Be, T 2, 3
IGR J21247+5058............... 321.151 50.980 0.7 5.7 � 0.4 8.1 � 0.7 16.3�� 143 AGN, Sy1? 35
IGR J21335+5105y ............. 323.375 51.092 1.2 2.9 � 0.4 <2.1 7.8�� 143 CV 1
1H 2140+433 ...................... 325.745 43.587 1.1 4.4 � 0.4 <2.2 8.8� 127 Dwarf nova, CV 1
Cyg X-2 .............................. 326.168 38.318 0.5 26.7 � 0.5 <2.7 43.9� 96 LMXB, B, Z 6
4U 2206+543 ...................... 331.974 54.514 0.6 12.8 � 0.5 9.2 � 0.8 24.6� 114 HMXB, NS, Be 2, 69, 3
Cas Ay ................................. 350.822 58.792 1.1 3.9 � 0.5 3.3 � 0.9 8.0�� 95 SNR 5
Note.—Table 2 is also available in machine-readable form in the electronic edition of the Astrophysical Journal.a Daggers indicate new detections since first catalog.b Position errors are expressed as radius of 1 � error circle.c Fluxes are expressed in units of mcrab; appropriate conversion factors are (20–40 keV) 10 mcrab = 7:57 ; 10�11 ergs cm�2 s�1 ¼ 1:71 ; 10�3 photons cm�2 s�1;
(40–100 keV) 10 mcrab ¼ 9:42 ; 10�11 ergs cm�2 s�1 ¼ 9:67 ; 10�4 photons cm�1 s�1.d Maximimum significance is quoted in either (�) 20–40 keV band, (��) 20–100 keV band, (���) 30–60 keV band, (no mark) significance in one revolution.e Exposure is the corrected on-source exposure in kiloseconds.f Source type classifications: A = atoll source (neutron star); AGN = active galactic nuclei; AXP = anomalous X-ray pulsar; B = burster (neutron star); Be = B-type
emission-line star; BH = black hole (confirmed mass evaluation); BHC = black hole candidate; Cluster = cluster of galaxies; CV = cataclysmic variable; D = dippingsource; G = globular cluster X-ray source; HMXB = high-mass X-ray binary; LMXB = low-mass X-ray binary; Mol cloud = molecular cloud; NS = neutron star;PSR = radio pulsar; PWN = pulsar wind nebula; QSO = quasar; SGR = soft gamma-ray repeater; SNR = supernova remnant; Sy = Seyfert galaxy; Symb = symbioticstar; T = transient source; U = ultrasoft source; XB = Galactic X-ray binary; XP = X-ray pulsar; Z = Z-type source (neutron star).
g 4U0352+30 in first IBIS/ ISGRI catalog (Cat1).h Values derived from staring observations during revolutions 50, 154, and 203.i Detected during revolution 139.j Cannot recover fluxes due to proximity to 4U0919�54.k Detected during revolution 203.l A1145.1�6141 in Cat1.m Position taken from 1E catalog, due to blending with 2E1145.5�6155.n Position taken from 1E catalog, due to blending with 2E1145.1�6141.o 4U1516�569 in Cat1.p IGR J16195�4945 in Cat1.q Triangulum Australis.r IGR J16393�4643 in Cat 1.s PSR J1649�4349 in Cat1.t Equally well associated with NGC 6221, also Sy2.u Detected during revolution 171.v EXMS B1709�232 in Cat1.w Tentative association with NGC6334.x IGRJ17254�3616 in Cat1.y Detected during revolution 120.z 1E1740.7�2943 in Cat1.aa M1741�293 in Cat1.bb Within 1A1 of Sgr A�.cc Fluxes unreliable due to blending in final mosaic; see x 3.6.dd Detected during revolution 175.ee IGR J18027�2016 in Cat1.ff HESS source (SNR/PWN?).gg 4U1849�31 in Cat1.hh Detected during revolution 189.ii IGR J19140+098 in Cat1.References.— (1) Downes et al. 2001; (2) Liu et al. 2000; (3) Raguzova & Popov 2005; (4) Veron-Cetty & Veron 2003; (5) Forman et al. 1978; (6) Liu et al.
2001; (7) Molina et al. 2004; (8) L. Bassani et al. 2006, in preparation; (9) Masetti et al. 2005; (10) Done et al. 1996; (11) Dermer & Gehrels 1995; (12) Laurent et al.1994; (13) Haberl et al. 2002; (14) Stephen et al. 2005; (15) Orosz et al. 2002; (16) Stephen 2005; (17) Sidoli et al. 2005; (18) Walter et al. 2003; (19) Rodriguezet al. 2003; (20) Lutovinov et al. 2005b; (21) Patel et al. 2004; (22) Ebeling et al. 2002; (23) Combi et al. 2004; (24) Malizia et al. 2004; (25) Walter et al. 2004a;(26) Walter et al. 2004b; (27) Grebenev et al. 2005; (28) Cowley et al. 1987; (29) in ’t Zand et al. 2005a; (30) Lutovinov & Revnivtsev 2003; (31) Arnaud et al.1987; (32) Rupen et al. 2003; (33) Sekimoto et al. 2000; (34) Barlow et al. 2005; (35) Masetti et al. 2004a; (36) Gaensicke et al. 2005; (37) Lutovinov et al. 2005a;(38) Harmon et al. 2004; (39) in ’t Zand et al. 2002; (40) Torres et al. 2004; (41) Sunyaev et al. 1991; (42) Mirabel et al. 1992; (43) Belanger et al. 2004;(44) Markwardt et al. 2003; (45) Revnivtsev et al. 2004; (46) Gonzalez Riestra et al. 2004; (47) Revnivtsev 2003; (48) Markwardt & Swank 2003b; (49) Rodriguezet al. 1992; (50) Augello et al. 2003; (51) Hill et al. 2005; (52) Markwardt & Swank 2003a; (53) Atteia et al. 1987; (54) Ubertini et al. 2005; (55) Davelaar et al.1986; (56) Malizia et al. 2005; (57) Bamba et al. 2001; (58) Vasisht & Gotthelf 1997; (59) Gotthelf & Vasisht 1998; (60) Remillard et al. 2002; (61) Galloway et al.2003; (62) Woods et al. 2002; (63) Levine et al. 2004; (64) in ’t Zand et al. 2005b; (65) Rodriguez et al. 2005; (66) Mirabel & Rodriguez 1994; (67) Swank &Morgan 2000; (68) Negueruela et al. 2000; (69) Masetti et al. 2004b.
773

X-ray and/or gamma-ray wavebands. There is a total of 56 IGRsources in the second catalog (double that of the first catalog), ofwhich 20% have been classified (see Fig. 11). This percentageincreases to �40% if the tentative classifications are included.Looking at the IGR sources broken down by source type, it isinteresting to note that nearly half of the cataloged CVs are IGRsources, while <5% of the cataloged LMXBs and HMXBs areINTEGRAL discoveries, although this number increases to nearly10% if the tentative associations are included.
A full understanding of the nature of the new sources, andtheir classifications in the already known classes of high-energyemitters is a challenging task and is triggering a strong follow-upprogram at all wavelengths.
The catalog by Macomb & Gehrels (1999) provides the pre-vious reference for sources detected above 50 keV by at least oneexperiment. It contains a general list of basic characteristics for309 sources and summary tables of different observations ofsources by object classification.Of the 309 sources, 183 have beendetected only for energies above 1MeVand 135 are unidentified(themajority of which are EGRET detected sources). The remain-ing 126 sources are categorized as 83 accreting sources, 22 Seyfertgalaxies, 14 gamma-ray blazars, seven gamma-ray pulsars, sixclusters or galaxies and three supernova remnants. By compari-son, this second IBIS/ISGRI catalog is reaching a similar level ofcoverage for Galactic sources, although interestingly the blazarpopulation is so far largely unseen, due to the relatively low en-ergy band of the IBIS/ISGRI observations.
The following sources, included in the first catalog, are nolonger listed: 1E 1742.5�2859 and 1E 1742.9�2929 have beenreplaced by other sources following a more in-depth analysis ofthe source contributions in the Galactic center region (see x 3.6);IGR J17460�3047 was found to be an artefact of the earlier im-aging process used in the first catalog.
5.1. Concluding Comments
The positions deriving from ISGRI are forming the basis foran active program of follow-up observations in other wavebands,mainly X-ray (XMM-Newton, Chandra X-Ray Observatory, andRossi X-Ray TimingExplorer), optical, IR, and radio.Of particular
Fig. 7.—Plots show 30–60 keV sky maps covering 30� sections of the Ga-lactic plane. [See the electronic edition of the Journal for a color version of thisfigure.]
Fig. 8.—Plots show 30–60 keV sky maps covering 30� sections of the Ga-lactic plane. [See the electronic edition of the Journal for a color version of thisfigure.]
Fig. 9.—Plots show 30–60 keV sky maps covering 30� sections of the Ga-lactic plane. [See the electronic edition of the Journal for a color version of thisfigure.]
BIRD ET AL.774 Vol. 636

interest are the recent correlations with the new population ofvery high-energy gamma-ray sources detected in the Milky Wayby the HESS consortium, and emitting in the 0.2–10 TeV range(Aharonian et al. 2005). At least two new IBIS sources are firmlyassociatedwith this new class of high-energy accelerator (Ubertiniet al. 2005; Malizia et al. 2005).
The IBIS survey team, including scientists from five differentinstitutes, will continue to refine the analysis techniques and ap-ply them to the ever-increasing IBIS data set. Further catalogs areexpected to be released at regular yearly intervals. Based on ourcurrent sky coverage, the observed source log N log S (Deanet al. 2005) and projected observation plans, we conservativelyestimate the final number of sources will be over 500. In par-ticular, in the coming months, we can expect the exposure in theextragalactic sky to improve significantly, allowing us to explorepreviously unexposed regions of the hard X-ray sky.
Finally, we also note that after the successful launch of theSwift satellite on 2004 November 20, ISGRI is no longer the soleinstrument capable of surveying the sky in the hard X-ray band.The Burst Alert Telescope (BAT) on board Swift (Gehrels et al.2004; Barthelmy et al 2004) is awide field of view (1.4 sr FWHM)coded mask instrument imaging in the 15–150 keV range. Al-though operating primarily as a gamma-ray burst detector, it alsoacts as an all-skymonitor in the hard X-ray band. Due to the widefield of view the background is comparatively much higher thanISGRI, but with the increased exposure to the sky and the largerdetector area (5240 cm2) it has a comparable performance as asurveying instrument.
However, the operating principles of the two instruments isvery different. INTEGRAL is involved in a scheduled observa-
tion plan biased on the Galactic plane as shown in Figure 1,whereas BAT is pointed randomly across the sky and so the dif-ferences in emphasis between the observation plans will causethe two instruments to complement each other well. Areas of lowGalactic latitude (especially the Galactic center) will be bettercovered with ISGRI, whereas the even coverage of the BATwillmean that areas of high Galactic latitude will be better coveredby that instrument. There is therefore excellent complementaritybetween the two instruments and the surveys theywill produce inthe coming years.
We acknowledge the following funding: Italian Space Agencyfinancial and programmatic support via contracts I /R/046/04;in UK via PPARC grant GR/2002/00446; in France, we thankCNES for support during ISGRI development and INTEGRALdata analysis. This research has made use of data obtained fromthe High Energy Astrophysics Science Archive Research Center(HEASARC) provided by NASA’s Goddard Space Flight Cen-ter; the SIMBAD database operated at CDS, Strasbourg, France;and the NASA/IPAC Extragalactic Database (NED) operatedby the Jet Propulsion Laboratory, California Institute of Tech-nology, under contract with the National Aeronautics and SpaceAdministration.
REFERENCES
Aharonian, F., et al. 2005, A&A, 435, L17Arnaud, K. A., et al. 1987, MNRAS, 227, 241Atteia, J.-L., et al. 1987, ApJ, 320, L105Augello, G., Iaria, R., Robba, N. R., Di Salvo, T., Burderi, L., Lavagetto, G., &Stella, L. 2003, ApJ, 596, L63
Bamba, A., et al. 2001, PASJ, 53, 1179Barlow, E. J., et al. 2005, A&A, 437, L27Barthelmy, S. D. 2004, Proc. SPIE, 5165, 175Bassani, L., et al. 2005, Astron. Tel., 537Belanger, G., et al. 2004, ApJ, 601, L163Bertin, E., & Arnouts, S. 1996, A&AS, 117, 393
Bird, A. J., et al. 2004, ApJ, 607, 33Combi, J. A., et al. 2004, A&A, 422, 1031Cowley, A. P., et al. 1987, AJ, 93, 195Davelaar, J., Smith, A., & Becker, R. H. 1986, ApJ, 300, L59Dean, A. J., et al. 2005, A&A, 443, 485Dermer, C. D., & Gehrels, N. 1995, ApJ, 447, 103Done, C., Madejski, G. M., & Smith, D. A. 1996, ApJ, 463, L63Downes, R. A., et al. 2001, PASP, 113, 764Ebeling, H., Mullis, C. R., & Tully, R. B. 2002, ApJ, 580, 774Forman, W., et al. 1978, ApJS, 38, 357Gaensicke, B. T., et al. 2005, Astron. Tel., 63, 1
Fig. 10.—Numbers of sources in the first and second IBIS/ISGRI catalogs,classified by type.
Fig. 11.—Classifications of IGR sources. Solid bars indicate numbers of IGRswith firm classifications (note that sources can be in more than one category).Hatched bars show tentative classifications.
IBIS/ISGRI SOFT GAMMA-RAY SURVEY CATALOG 775No. 2, 2006

Galloway, D. K., Remillard, R., & Morgan, E. 2003, IAU Circ., 8081, 2Gehrels, N., et al. 2004, ApJ, 611, 1005Gonzalez-Riestra, R., Oosterbroek, T., & Kuulkers, E., 2004, A&A, 420, 589Gotthelf, E. V., & Vasisht, G. 1998, NewA, 3, 293Grebenev, S. A., Bird, A. J., Molkov, S. V., Soldi, S., Kretschmar, P., Diehl, R.,Budz-Joergensen, C., & McBreen, B. 2005, Astron. Tel., 457, 1
Gros, A., Goldwurm, A., Cadolle-Bel, M., Goldoni, P., Rodriguez, J., Foschini, L.,Del Santo, M., & Blay, P. 2003, A&A, 411, L179
Haberl, F., Motch, C., & Zickgraf, F.-J., 2002, A&A, 387, 201Harmon, B. A., et al. 2004, ApJS, 154, 585Hill, A. B., et al., 2005, A&A, 439, 255in ’t Zand, J. J. M., Cornelisse, R., & Mendez, M. 2005a, A&A, 440, 287in ’t Zand, J. J. M., Jonker, P. G., & Nelemans, G. 2005b, A&A, submitted(astro-0505256)
in ’t Zand, J. J. M., et al. 2002, A&A, 389, 43Laurent, P., et al. 1994, A&A, 286, 838Lebrun, F., et al. 2003, A&A, 411, L141Levine, A. M., Rappaport, S., Remillard, R., & Savcheva, A. 2004, 617, 1284Liu, Q. Z., van Paradijs, J., & van der Heuvel, E. P. J. 2000, A&AS, 147, 25———. 2001, A&A, 368, 1021Lutovinov, A., & Revnivtsev, M. 2003, Astron. Lett., 29, 719Lutovinov, A., Revnivtsev, M., Molkov, S., & Sunyaev, R. 2005a, A&A, 430,997
Lutovinov, A., Rodriguez, J., Revnivtsev, M., & Shtykovskiy, P. 2005b, A&A,433, L41
Macomb, D. J., & Gehrels, N. 1999, ApJS, 120, 335Malizia, A., Bassani, L., Di Cocco, G., Stephen, J. B., Walter, R., Bodaghee, A.,& Bazzano, A. 2004, Astron. Tel., 27, 1
Malizia, A., et al. 2005, ApJ, 630, L157Markwardt, C. B., Smith, E., & Swank, J. H. 2003, IAU Circ., 8080, 2Markwardt, C. B., & Swank, J. H. 2003a, Astron. Tel., 156, 1———. 2003b, Astron. Tel., 133, 1Masetti, N., Bassani, L., Bird, A. J., & Bazzano, A. 2005, Astron. Tel., 528, 1Masetti, N., Palazzi, E., Bassani, L., Malizia, A., & Stephen, J. B. 2004a, A&A,426, 41
Masetti, N., et al. 2004b, A&A, 423, 311Mirabel, I. F., & Rodriguez, L. F. 1994, Nature, 371, 46Mirabel, I. F., Rodriguez, L. F., Cordier, B., Paul, J., & Lebrun, F. 1992, Nature,358, 215
Molina, M., Bassani, L., Malizia, A., Stephen, J. B., & Bazzano, A. 2004,Astron. Tel., 263, 1
Negueruela, I., Marco, A., Speziali, R., & Isreal, G. L. 2000, IAU Circ., 7541, 2Orosz, J. A., et al. 2002, ApJ, 568, 845Patel, S. K., et al. 2004, ApJ, 602, L45Raguzova, N. V., & Popov, S. B. 2005, preprint (astro-ph /0505275)Remillard, R. A., Smith, D. A., & Hurley, K. 2002, IAU Circ., 7880, 1Revnivtsev, M. 2003, Astron. Lett., 29, 644Revnivtsev, M., et al. 2004, A&A, 425, 49Rodriguez, J., Cabanac, C., Hannikainen, D. C., Beckmann, V., Shaw, S. E., &Schultz, J. 2005, A&A, 432, 253
Rodriguez, J., Tomsick, J. A., Foschini, L.,Walter, R., Goldwurm, A., Corbel, S.,& Kaaret, P. 2003, A&A, 407, 41
Rodriguez, L. F., Mirabel, I. F., & Marti, J. 1992, ApJ, 401, 15Rupen, M. P., Brocksopp, C., Mioduszewski, A. J., Dhawan, V., Sault, R.,Fender, R., & Corbel, S. 2003, IAU Circ., 8054, 2
Sekimoto, Y., Matsuzaki, K., Kamae, T., Tatematsu, K., Yamamoto, S., &Umemoto, T. 2000, PASJ, 52, 31
Sidoli, L., et al. 2005, A&A, 429, 47Stephen, J. B. 2005, A&A, in pressStephen, J. B., et al. 2005, A&A, 432, 49Sunyaev, R., et al. 1991, ApJ, 383, 49Swank, J., & Morgan, E. 2000, IAU Circ., 7531, 4Torres, M. A. P., et al. 2004, Astron. Tel., 264, 1Ubertini, P., et al. 2003, A&A, 411, L131———. 2005, ApJ, 629, L109———. 2006, Adv. Space Res., in pressVasisht, G., & Gotthelf, E. V. 1997, ApJ, 486, L29Veron-Cetty, M.-P., & Veron, P. 2003, A&A, 412, 399Walter, R., et al. 2004a, AAS/HEAD Meeting, 8, 1005———. 2003, A&A, 411, 427———. 2004b, in Fifth INTEGRALWorkshop, ed. B. Battrick (ESA-SP 522;Noordwijk: ESA), 417
Winkler, C., et al. 2004, in Proc. 5th INTEGRALWorkshop on the INTEGRALUniverse ESA, ed. V. Schonfelder et al. (SP-552: Noordwijk: ESA), 7
Woods, P., Kouveliotou, C., Finger, M. H., Gogus, E., Swank, J., Markwardt, C.,& Strohmayer, T. 2002, IAU Circ., 7856, 1
BIRD ET AL.776