prefrontal dysfunction in pediatric tourette's disorder as
TRANSCRIPT
Yamamuro et al. BMC Psychiatry (2015) 15:102 DOI 10.1186/s12888-015-0472-3
RESEARCH ARTICLE Open Access
Prefrontal dysfunction in pediatric Tourette’sdisorder as measured by near-infraredspectroscopyKazuhiko Yamamuro1, Toyosaku Ota1*, Junzo Iida2, Yoko Nakanishi1, Mitsuhiro Uratani3, Hiroki Matsuura4,Naoko Kishimoto1, Shohei Tanaka1, Hideki Negoro5 and Toshifumi Kishimoto1
Abstract
Background: Tourette’s disorder (TD) is a chronic childhood-onset disorder characterized by the presence of multiplemotor and vocal tics. Despite strong evidence that the pathophysiology of TD involves structural and functionaldisturbances of the basal ganglia and cortical frontal areas, in vivo imaging studies have produced conflicting results.Recent developments in near-infrared spectroscopy (NIRS) technology have enabled noninvasive assessment of brainfunction in people with psychiatric disorders.
Methods: We asked 10 individuals with pediatric TD and 10 healthy controls who were age- and sex- matched toperform the Stroop color-word task during NIRS. We used prefrontal probes and a 24-channel NIRS machine tomeasure the relative concentrations of oxyhemoglobin (oxy-Hb) every 0.1 s during the task.
Results: We found that oxy-Hb changes in the prefrontal cortex were significantly smaller in the TD group comparedwith the control group, especially in the left dorsolateral prefrontal cortex.
Conclusions: Our data suggest that individuals with pediatric TD have a reduced prefrontal hemodynamic response asmeasured by NIRS.
Keywords: Near-infrared spectroscopy, Tourette’s disorder, The Stroop Color-Word Task, Tics, Dorsolateral prefrontalcortex
BackgroundTourette’s disorder (TD) is a childhood neuropsychiatricdisorder characterized by persistent motor and vocaltics. The prevalence of TD is between 0.05% and 3%,and it is often comorbid with obsessive-compulsivedisorder (OCD), attention deficit/hyperactivity disorder(ADHD) and other social and behavioral disturbances(50% of individuals with TD also have ADHD, while 20–60% also have OCD) [1,2]. TD without any comorbidityoccurs in only about 10% of patients [3,4].Several biological hypotheses exist regarding the
underlying mechanisms of TD. As these generally centeraround abnormal dopaminergic function, typical antipsy-chotics, such as haloperidol and pimozide, are often
* Correspondence: [email protected] of Psychiatry, Nara Medical University School of Medicine, 840Shijyou-cho, Kashihara, Nara 634-8522, JapanFull list of author information is available at the end of the article
© 2015 Yamamuro et al.; licensee BioMed CenCommons Attribution License (http://creativecreproduction in any medium, provided the orDedication waiver (http://creativecommons.orunless otherwise stated.
prescribed to control tic symptoms [5]. Recent improve-ments in the efficacy and side effect profiles of atypicalantipsychotics (relative to classical antipsychotics) haveled to an increase in the clinical use of these drugs.Of the available antipsychotics, risperidone is mostcommonly recommended by experts [6,7]. Paliperidoneextended-release, which chemically is a major active me-tabolite of risperidone (9-hydroxyrisperidone), has beensuggested as an efficacious therapy with few side effectsin child and adolescent patients with TD [8].TD is thought to involve the frontal cortex and its con-
nections to subcortical regions, such as the basal ganglia,through frontal cortico-striatal-thalamo-cortical (CSTC)circuits [2,9,10]. Electrophysiological and histological evi-dence for reduced GABA-ergic tone in these cortical andsubcortical brain regions is indicative of reduced localinhibition of neural activity in these motor circuits [11,12].Specifically, children with TD exhibit reduced grey matter
tral. This is an Open Access article distributed under the terms of the Creativeommons.org/licenses/by/4.0), which permits unrestricted use, distribution, andiginal work is properly credited. The Creative Commons Public Domaing/publicdomain/zero/1.0/) applies to the data made available in this article,
Table 1 Participant characteristics
TD Control p-value
mean (SD) mean (SD)
Number [sex ratio: M:F] 10 [10:0] 10 [10:0] 1.00
Age (years) 9.20 (2.25) 9.50 (2.12) 0.76
Age of onset (years) 7.40 (1.84)
Duration of illness (months) 20.50 (8.24)
FIQ (WISC-III) 99.80 (15.32) 97.30 (9.90) 0.67
YGTSS 18.00 (6.75)
SCWC-1 26.80 (11.14) 42.70 (9.78) 0.003
SCWC-2 26.10 (10.21) 40.20 (8.77) 0.004
SCWC-3 27.20 (12.74) 37.70 (8.11) 0.027
TD, Tourette’s disorder; M, male; F, female; FIQ (WISC-III), Full scale IQ score onthe Wechsler Intelligence Scale for Children-Third Edition; YGTSS, Yale GlobalTic Severity Scale; SCWC-1, ‘Stroop color-word task number of correct answersfirst time’; SCWC-2, ‘Stroop color-word task number of correct answers secondtime’; SCWC-3, ‘Stroop color-word task number of correct answers third time’.
Yamamuro et al. BMC Psychiatry (2015) 15:102 Page 2 of 9
volumes in the basal ganglia [13] and increased grey mattervolumes in the dorsolateral prefrontal cortex (DLPFC) [14].This change in grey matter volume may be related to thecontinual need to suppress tics, leading to compensatoryneural plasticity within the prefrontal cortices. In a diffusiontensor imaging study by Xi et al. [15], the researchers foundthat children with TD exhibited increased parallel andmean diffusivity in the bilateral putamen, increased perpen-dicular diffusivity in the right thalamus, reduced anisotropyin the bilateral thalamus, decreased fractional anisotropy inthe left globus pallidus, and an increased diffusion coeffi-cient in the bilateral caudate nucleus. Studies of TD pa-tients using single photon emission computed tomography(SPECT) have indicated that these individuals have in-creased activity in the right frontal lobe [16] and reducedactivity in the left caudate and anterior cingulate gyruscompared with controls [17]. In addition, studies of TD pa-tients using positron emission tomography (PET) have re-ported localized decreases in functional activity in the basalganglia and thalamus and increased functional activity inthe lateral premotor and supplementary motor associationcortices, as well as in the midbrain [18]. Consistent withanatomical and imaging findings, functional magneticresonance imaging (fMRI) studies of TD patients havepointed to abnormalities in frontostriatal function [13,19].The above-mentioned studies, which used varying method-ologies, all reported that individuals with TD exhibit atyp-ical activity in the prefrontal cortex. Thus, it is possible thatTD patients have an abnormal prefrontal hemodynamicresponse.Multi-channel near- infrared spectroscopy (NIRS) enables
the noninvasive detection of neural activity near the surfaceof the brain using near-infrared light [20,21]. NIRS mea-sures alterations in oxygenated hemoglobin ([oxy-Hb]) anddeoxygenated hemoglobin ([deoxy-Hb]) concentrations inmicro-blood vessels on the brain surface. Local increases in[oxy-Hb] and decreases in [deoxy-Hb] are indicators ofcortical activity [21,22]. Furthermore, changes in [oxy-Hb]have been associated with changes in regional cerebralblood volume, using a combination of NIRS and PET mea-surements [23,24]. NIRS is a neuroimaging modality that isespecially suitable for psychiatric patients for the followingreasons [25]. First, because NIRS is relatively insensitive tomotion artifact, it can be used in experimental scenarios inwhich motion may occur, such as while assessing partici-pants who are prone to vocalization. Second, participantscan be examined in a natural sitting position, without anysurrounding distractions. Third, the cost is much lowerthan that of other neuroimaging modalities and the setup isvery easy. Fourth, the high temporal resolution of NIRS isuseful in characterizing the time course of prefrontal activ-ity in people with psychiatric disorders [26,27]. Fifth, Func-tional studies of pediatric patients using SPECT and PETare rare due to restrictions regarding the use of radioactive
materials in young individuals. Accordingly, NIRS has beenused to assess brain function in people with many types ofpsychiatric disorders, including schizophrenia, bipolar dis-order, post traumatic disorder, OCD, and ADHD [25-30].In this study, we used NIRS to investigate the prefrontal
hemodynamic response to the Stroop colour-word task inpediatric TD patients. Based on the findings of previousstudies that used other neuroimaging techniques to find ab-normal activity in the prefrontal cortex in patients with TD,we hypothesized that pediatric TD patients would have anincreased prefrontal hemodynamic response, as measuredby NIRS. To test this, we used a multi-channel NIRSmethod to examine changes in prefrontal cerebral bloodvolume during the Stroop color-word task in children withTD and age- and sex- matched controls.
MethodsParticipantsTen TD patients (10 males; mean age 9.20 years ± 2.25 yearsSD) were recruited from the outpatient clinic of the Depart-ment of Psychiatry at Nara Medical University, Japan.All patients were diagnosed with TD according to theDSM-IV-TR. A control group comprising 10 age- andsex- matched healthy individuals (10 males; mean age9.50 years ± 2.12 years SD) was recruited via local printadvertising (Table 1). All participants were right-handedand of Japanese descent. All caregivers of the participantsprovided written informed consent, and the participantsprovided verbal assent regarding their participation in thestudy. This study was approved by the Institutional ReviewBoard at the Nara Medical University.Patients were deemed eligible if they had received a
DSM-IV-TR diagnosis of TD, as described in the KiddieSchedule for Affective Disorders and Schizophrenia for
Yamamuro et al. BMC Psychiatry (2015) 15:102 Page 3 of 9
School-Age Children-Present and Lifetime version (K-SADS-PL) [31], and a medical history evaluation. Of the in-dividuals with TD, none had experienced a comorbid majordepressive disorder, schizophrenia, OCD, other anxiety dis-orders, or epilepsy. Five participants had comorbid ADHD(but had not received any previous medication for ADHD).Exclusion criteria included any neurological disorder, a
head injury, a serious medical condition, or a history of sub-stance abuse/dependence. Intellectual level was assessedusing the Wechsler Intelligence Scale for Children–ThirdEdition, and participants with full-scale IQ (FIQ) scoresbelow 70 were also excluded. Seven of the 10 TD pa-tients selected for the study were not medicated for thedisorder, whereas the remaining three participants werereceiving medication for TD symptoms (two, haloperidol;one, risperidone).
Assessment of TD symptomsThe Yale Global Tic Severity Scale (YGTSS) [32] is asemi-structured clinical interview designed to assesscurrent tic severity. This scale yields three summaryscores: total motor (0–25), total phonic (0–25), and totaltic (sum of motor and phonic) scores. The YGTSS alsocontains an impairment scale (0–50), which evaluatesthe global level of functional impairment arising fromtics.A higher YGTSS score is associated with higher tic
symptom severity.
The stroop color-word taskWe combined the traditional Stroop task with the wordreading task, incongruent color naming task, and thecolor naming task. However, we reconstructed theStroop task according to previously described methods[33]. The Stroop color-word task consisted of two pages.The items on the first page included the color wordsRED, GREEN, and BLUE printed in black ink. The itemson the second page included the words RED, GREEN,and BLUE printed in red, green, or blue ink, with thelimitation that the word meaning and ink color couldnot match. The items on both pages were randomlydistributed, except that no item within a column couldfollow itself.Before administering the task, the examiners instructed
the participants as follows: “This is to test how quickly youcan read aloud the words on the first page, and say thecolors of the words on the second page. After you haveread the words on the first page for 45 s, we will turn thepage immediately. Then you will say the colors of the wordson the second page for 45 s. We will repeat this processthree times.”The entire Stroop color-word task sequence consisted
of three cycles of 45 s spent reading the first page andthen 45 s spent reading the second page (the color-word
task). The task ended with 45 s spent reading the firstpage again, which we designated as the baseline task.We counted the number of correct answers in eachcycle, and gave them the following designations: ‘StroopColor-Word task number of correct answers first time’(SCWC-1), ‘…second time’ (SCWC-2), and ‘…third time’(SCWC-3).We chose to use a stroop color-word task simply
because activity in the inferior frontal gyrus is stronglyrelated to Stroop interference [34], and the same taskwas used in a previous NIRS study of individuals withpediatric OCD and ADHD [28,30]. Thus these methodsenabled us to directly compare our results with those ofprevious studies.
NIRS measurementsIncreased oxy-Hb and decreased deoxy-Hb, as measuredby NIRS, have been shown to reflect cortical activation. Inanimal studies, oxy-Hb has been found to be a highly sensi-tive indicator of regional cerebral blood flow because thedirection of change in deoxy-Hb is determined by the de-gree of change in venous blood oxygenation and volume[35]. Therefore, we decided to focus on changes in oxy-Hb.We measured oxy-Hb using a 24-channel NIRS machine(Hitachi ETG-4000, Hitachi Medical Corporation, Tokyo,Japan). We measured the absorption of two wavelengths ofnear-infrared light (760 and 840 nm). Oxy-Hb wascalculated as previously described [36]. The inter-probeintervals of the machine were 3.0 cm, and previousreports have established that the machine measures ata point 2–3 cm beneath the scalp, i.e., the surface ofthe cerebral cortex [37,38].The participants were asked adopt a natural sitting pos-
ition for NIRS measurement. The NIRS probes were placedon the scalp over the prefrontal brain regions. The probeswere arranged to measure relative changes in Hb concen-tration at 24 measurement points comprising an 8 × 8 cmsquare. The lowest probes were positioned along theFp1-Fp2 line according to the international 10/20system commonly used in electroencephalography.Correspondences between the probe positions and themeasurement points in the cerebral cortex were con-firmed by superimposing the probe positions onto athree-dimensionally reconstructed cerebral cortex of arepresentative participant in the control group, ob-tained via MRI (Figure 1). The absorption of near-infrared light was measured with a time resolution of0.1 s. The data were analyzed using the “integral mode”:the pre-task baseline was calculated as the mean acrossthe 10 s just before the task period, the post-task base-line was calculated as the mean across the 25 s immedi-ately after the task period, and we conducted linearfitting on the data between the two baselines. We usedmoving average methods to exclude short-term motion
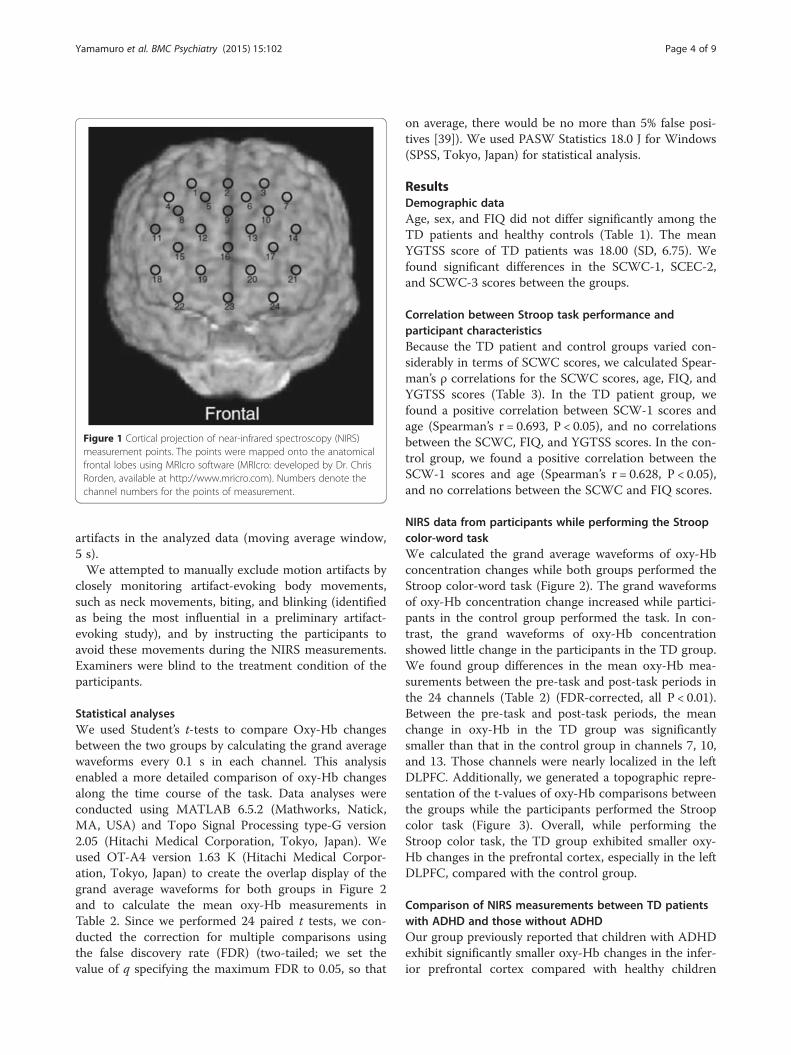
Figure 1 Cortical projection of near-infrared spectroscopy (NIRS)measurement points. The points were mapped onto the anatomicalfrontal lobes using MRIcro software (MRIcro: developed by Dr. ChrisRorden, available at http://www.mricro.com). Numbers denote thechannel numbers for the points of measurement.
Yamamuro et al. BMC Psychiatry (2015) 15:102 Page 4 of 9
artifacts in the analyzed data (moving average window,5 s).We attempted to manually exclude motion artifacts by
closely monitoring artifact-evoking body movements,such as neck movements, biting, and blinking (identifiedas being the most influential in a preliminary artifact-evoking study), and by instructing the participants toavoid these movements during the NIRS measurements.Examiners were blind to the treatment condition of theparticipants.
Statistical analysesWe used Student’s t-tests to compare Oxy-Hb changesbetween the two groups by calculating the grand averagewaveforms every 0.1 s in each channel. This analysisenabled a more detailed comparison of oxy-Hb changesalong the time course of the task. Data analyses wereconducted using MATLAB 6.5.2 (Mathworks, Natick,MA, USA) and Topo Signal Processing type-G version2.05 (Hitachi Medical Corporation, Tokyo, Japan). Weused OT-A4 version 1.63 K (Hitachi Medical Corpor-ation, Tokyo, Japan) to create the overlap display of thegrand average waveforms for both groups in Figure 2and to calculate the mean oxy-Hb measurements inTable 2. Since we performed 24 paired t tests, we con-ducted the correction for multiple comparisons usingthe false discovery rate (FDR) (two-tailed; we set thevalue of q specifying the maximum FDR to 0.05, so that
on average, there would be no more than 5% false posi-tives [39]). We used PASW Statistics 18.0 J for Windows(SPSS, Tokyo, Japan) for statistical analysis.
ResultsDemographic dataAge, sex, and FIQ did not differ significantly among theTD patients and healthy controls (Table 1). The meanYGTSS score of TD patients was 18.00 (SD, 6.75). Wefound significant differences in the SCWC-1, SCEC-2,and SCWC-3 scores between the groups.
Correlation between Stroop task performance andparticipant characteristicsBecause the TD patient and control groups varied con-siderably in terms of SCWC scores, we calculated Spear-man’s ρ correlations for the SCWC scores, age, FIQ, andYGTSS scores (Table 3). In the TD patient group, wefound a positive correlation between SCW-1 scores andage (Spearman’s r = 0.693, P < 0.05), and no correlationsbetween the SCWC, FIQ, and YGTSS scores. In the con-trol group, we found a positive correlation between theSCW-1 scores and age (Spearman’s r = 0.628, P < 0.05),and no correlations between the SCWC and FIQ scores.
NIRS data from participants while performing the Stroopcolor-word taskWe calculated the grand average waveforms of oxy-Hbconcentration changes while both groups performed theStroop color-word task (Figure 2). The grand waveformsof oxy-Hb concentration change increased while partici-pants in the control group performed the task. In con-trast, the grand waveforms of oxy-Hb concentrationshowed little change in the participants in the TD group.We found group differences in the mean oxy-Hb mea-surements between the pre-task and post-task periods inthe 24 channels (Table 2) (FDR-corrected, all P < 0.01).Between the pre-task and post-task periods, the meanchange in oxy-Hb in the TD group was significantlysmaller than that in the control group in channels 7, 10,and 13. Those channels were nearly localized in the leftDLPFC. Additionally, we generated a topographic repre-sentation of the t-values of oxy-Hb comparisons betweenthe groups while the participants performed the Stroopcolor task (Figure 3). Overall, while performing theStroop color task, the TD group exhibited smaller oxy-Hb changes in the prefrontal cortex, especially in the leftDLPFC, compared with the control group.
Comparison of NIRS measurements between TD patientswith ADHD and those without ADHDOur group previously reported that children with ADHDexhibit significantly smaller oxy-Hb changes in the infer-ior prefrontal cortex compared with healthy children
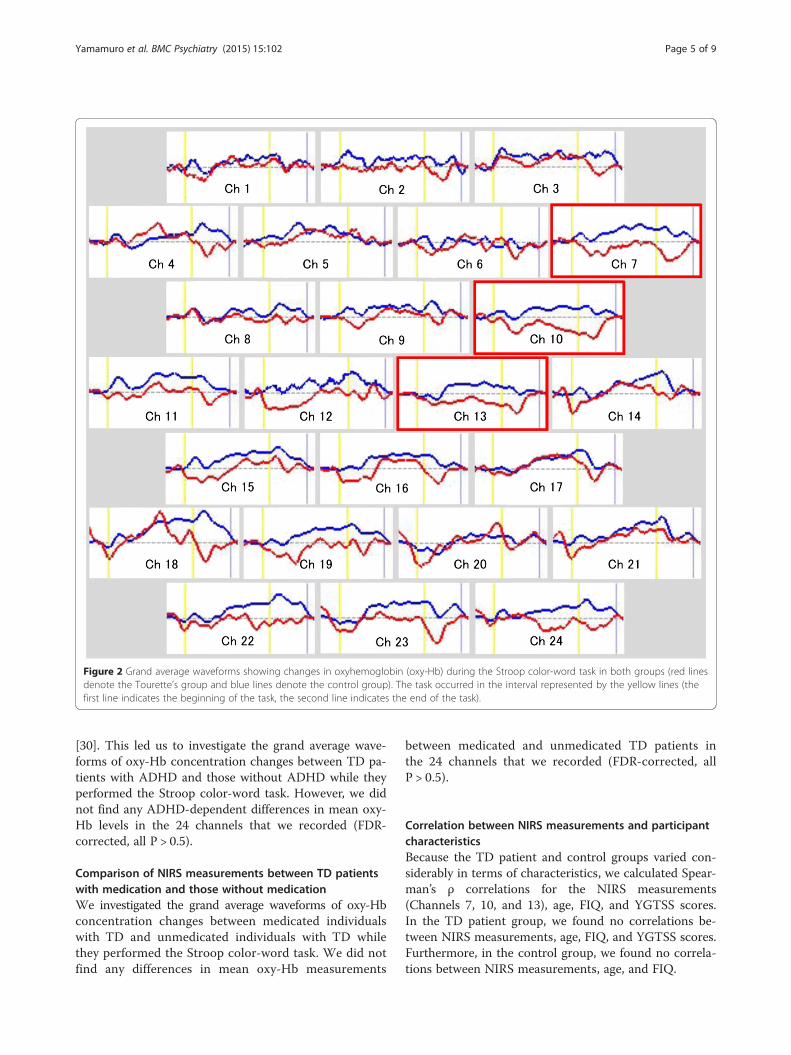
Figure 2 Grand average waveforms showing changes in oxyhemoglobin (oxy-Hb) during the Stroop color-word task in both groups (red linesdenote the Tourette’s group and blue lines denote the control group). The task occurred in the interval represented by the yellow lines (thefirst line indicates the beginning of the task, the second line indicates the end of the task).
Yamamuro et al. BMC Psychiatry (2015) 15:102 Page 5 of 9
[30]. This led us to investigate the grand average wave-forms of oxy-Hb concentration changes between TD pa-tients with ADHD and those without ADHD while theyperformed the Stroop color-word task. However, we didnot find any ADHD-dependent differences in mean oxy-Hb levels in the 24 channels that we recorded (FDR-corrected, all P > 0.5).
Comparison of NIRS measurements between TD patientswith medication and those without medicationWe investigated the grand average waveforms of oxy-Hbconcentration changes between medicated individualswith TD and unmedicated individuals with TD whilethey performed the Stroop color-word task. We did notfind any differences in mean oxy-Hb measurements
between medicated and unmedicated TD patients inthe 24 channels that we recorded (FDR-corrected, allP > 0.5).
Correlation between NIRS measurements and participantcharacteristicsBecause the TD patient and control groups varied con-siderably in terms of characteristics, we calculated Spear-man’s ρ correlations for the NIRS measurements(Channels 7, 10, and 13), age, FIQ, and YGTSS scores.In the TD patient group, we found no correlations be-tween NIRS measurements, age, FIQ, and YGTSS scores.Furthermore, in the control group, we found no correla-tions between NIRS measurements, age, and FIQ.
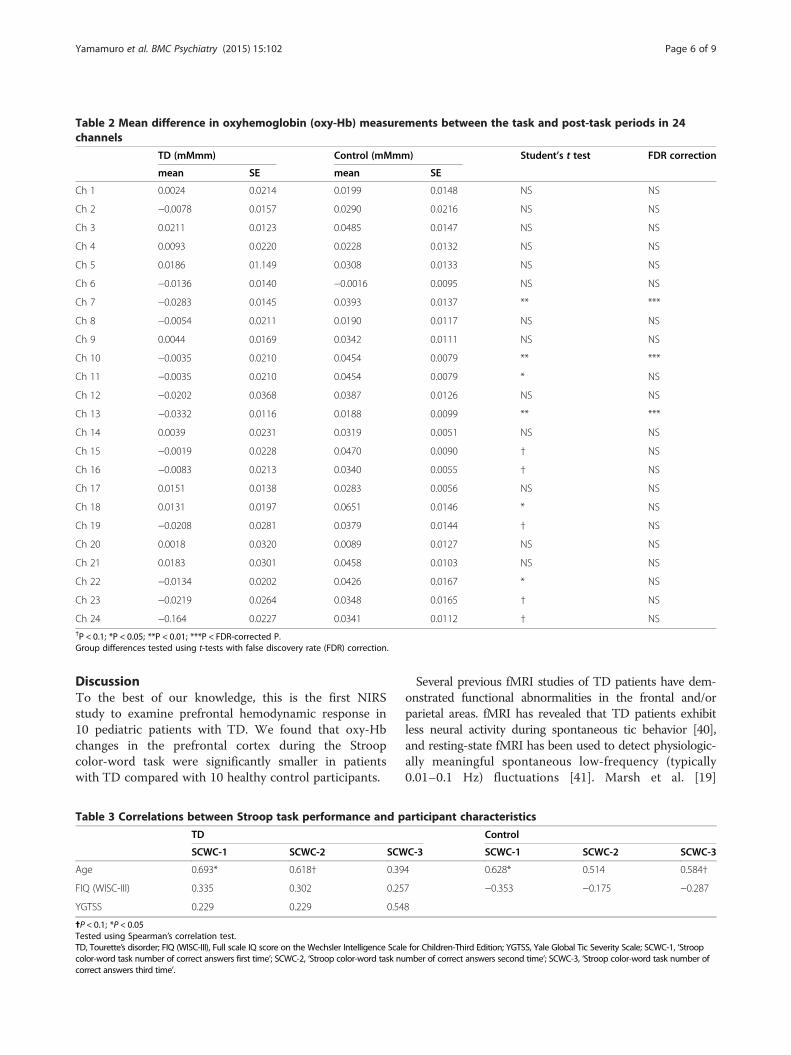
Table 2 Mean difference in oxyhemoglobin (oxy-Hb) measurements between the task and post-task periods in 24channels
TD (mMmm) Control (mMmm) Student’s t test FDR correction
mean SE mean SE
Ch 1 0.0024 0.0214 0.0199 0.0148 NS NS
Ch 2 −0.0078 0.0157 0.0290 0.0216 NS NS
Ch 3 0.0211 0.0123 0.0485 0.0147 NS NS
Ch 4 0.0093 0.0220 0.0228 0.0132 NS NS
Ch 5 0.0186 01.149 0.0308 0.0133 NS NS
Ch 6 −0.0136 0.0140 −0.0016 0.0095 NS NS
Ch 7 −0.0283 0.0145 0.0393 0.0137 ** ***
Ch 8 −0.0054 0.0211 0.0190 0.0117 NS NS
Ch 9 0.0044 0.0169 0.0342 0.0111 NS NS
Ch 10 −0.0035 0.0210 0.0454 0.0079 ** ***
Ch 11 −0.0035 0.0210 0.0454 0.0079 * NS
Ch 12 −0.0202 0.0368 0.0387 0.0126 NS NS
Ch 13 −0.0332 0.0116 0.0188 0.0099 ** ***
Ch 14 0.0039 0.0231 0.0319 0.0051 NS NS
Ch 15 −0.0019 0.0228 0.0470 0.0090 † NS
Ch 16 −0.0083 0.0213 0.0340 0.0055 † NS
Ch 17 0.0151 0.0138 0.0283 0.0056 NS NS
Ch 18 0.0131 0.0197 0.0651 0.0146 * NS
Ch 19 −0.0208 0.0281 0.0379 0.0144 † NS
Ch 20 0.0018 0.0320 0.0089 0.0127 NS NS
Ch 21 0.0183 0.0301 0.0458 0.0103 NS NS
Ch 22 −0.0134 0.0202 0.0426 0.0167 * NS
Ch 23 −0.0219 0.0264 0.0348 0.0165 † NS
Ch 24 −0.164 0.0227 0.0341 0.0112 † NS†P < 0.1; *P < 0.05; **P < 0.01; ***P < FDR-corrected P.Group differences tested using t-tests with false discovery rate (FDR) correction.
Yamamuro et al. BMC Psychiatry (2015) 15:102 Page 6 of 9
DiscussionTo the best of our knowledge, this is the first NIRSstudy to examine prefrontal hemodynamic response in10 pediatric patients with TD. We found that oxy-Hbchanges in the prefrontal cortex during the Stroopcolor-word task were significantly smaller in patientswith TD compared with 10 healthy control participants.
Table 3 Correlations between Stroop task performance and p
TD
SCWC-1 SCWC-2 SCW
Age 0.693* 0.618† 0.39
FIQ (WISC-III) 0.335 0.302 0.25
YGTSS 0.229 0.229 0.54
✝P < 0.1; *P < 0.05Tested using Spearman’s correlation test.TD, Tourette’s disorder; FIQ (WISC-III), Full scale IQ score on the Wechsler Intelligence Scalcolor-word task number of correct answers first time’; SCWC-2, ‘Stroop color-word task nucorrect answers third time’.
Several previous fMRI studies of TD patients have dem-onstrated functional abnormalities in the frontal and/orparietal areas. fMRI has revealed that TD patients exhibitless neural activity during spontaneous tic behavior [40],and resting-state fMRI has been used to detect physiologic-ally meaningful spontaneous low-frequency (typically0.01–0.1 Hz) fluctuations [41]. Marsh et al. [19]
articipant characteristics
Control
C-3 SCWC-1 SCWC-2 SCWC-3
4 0.628* 0.514 0.584†
7 −0.353 −0.175 −0.287
8
e for Children-Third Edition; YGTSS, Yale Global Tic Severity Scale; SCWC-1, ‘Stroopmber of correct answers second time’; SCWC-3, ‘Stroop color-word task number of
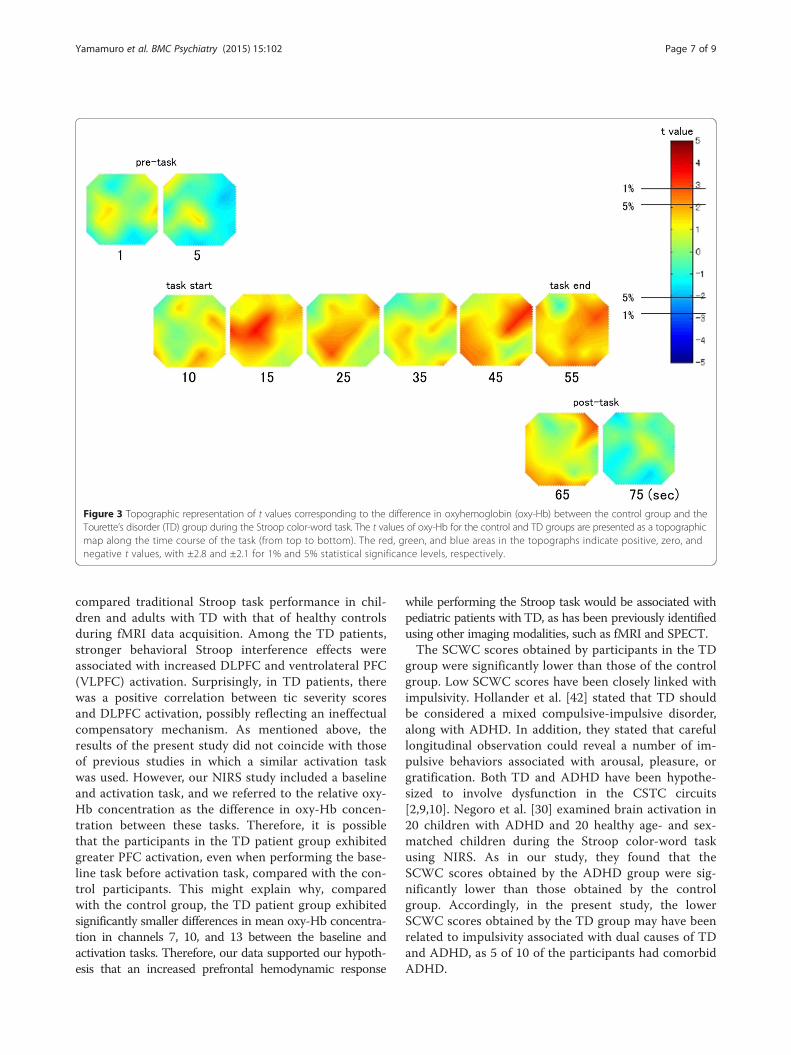
Figure 3 Topographic representation of t values corresponding to the difference in oxyhemoglobin (oxy-Hb) between the control group and theTourette’s disorder (TD) group during the Stroop color-word task. The t values of oxy-Hb for the control and TD groups are presented as a topographicmap along the time course of the task (from top to bottom). The red, green, and blue areas in the topographs indicate positive, zero, andnegative t values, with ±2.8 and ±2.1 for 1% and 5% statistical significance levels, respectively.
Yamamuro et al. BMC Psychiatry (2015) 15:102 Page 7 of 9
compared traditional Stroop task performance in chil-dren and adults with TD with that of healthy controlsduring fMRI data acquisition. Among the TD patients,stronger behavioral Stroop interference effects wereassociated with increased DLPFC and ventrolateral PFC(VLPFC) activation. Surprisingly, in TD patients, therewas a positive correlation between tic severity scoresand DLPFC activation, possibly reflecting an ineffectualcompensatory mechanism. As mentioned above, theresults of the present study did not coincide with thoseof previous studies in which a similar activation taskwas used. However, our NIRS study included a baselineand activation task, and we referred to the relative oxy-Hb concentration as the difference in oxy-Hb concen-tration between these tasks. Therefore, it is possiblethat the participants in the TD patient group exhibitedgreater PFC activation, even when performing the base-line task before activation task, compared with the con-trol participants. This might explain why, comparedwith the control group, the TD patient group exhibitedsignificantly smaller differences in mean oxy-Hb concentra-tion in channels 7, 10, and 13 between the baseline andactivation tasks. Therefore, our data supported our hypoth-esis that an increased prefrontal hemodynamic response
while performing the Stroop task would be associated withpediatric patients with TD, as has been previously identifiedusing other imaging modalities, such as fMRI and SPECT.The SCWC scores obtained by participants in the TD
group were significantly lower than those of the controlgroup. Low SCWC scores have been closely linked withimpulsivity. Hollander et al. [42] stated that TD shouldbe considered a mixed compulsive-impulsive disorder,along with ADHD. In addition, they stated that carefullongitudinal observation could reveal a number of im-pulsive behaviors associated with arousal, pleasure, orgratification. Both TD and ADHD have been hypothe-sized to involve dysfunction in the CSTC circuits[2,9,10]. Negoro et al. [30] examined brain activation in20 children with ADHD and 20 healthy age- and sex-matched children during the Stroop color-word taskusing NIRS. As in our study, they found that theSCWC scores obtained by the ADHD group were sig-nificantly lower than those obtained by the controlgroup. Accordingly, in the present study, the lowerSCWC scores obtained by the TD group may have beenrelated to impulsivity associated with dual causes of TDand ADHD, as 5 of 10 of the participants had comorbidADHD.
Yamamuro et al. BMC Psychiatry (2015) 15:102 Page 8 of 9
At channels 7, 10, and 13, the pediatric TD patientsexhibited significantly smaller changes in oxy-Hb com-pared with the healthy controls. These channels are lo-calized near the left DLPFC. Meanwhile, in the rightDLPFC, pediatric TD patients did not exhibit signifi-cantly smaller changes in oxy-Hb compared with thehealthy controls. Other functional and structural neuro-imaging studies have described abnormalities and dys-function in the left hemisphere. For instance, prior fMRIactivation studies comparing TD children with controlchildren reported that the left lateral frontal regionswere activated in individuals with TD during a rule-switching task [43] and a Stroop task [19]. Using MRI,Peterson et al. [14] reported that children with TD hadlarger left DLPFC volumes relative to control children.In a SPECT study, brain abnormalities in people withTD tended to be located in the left lateral temporal lobe[44]. Additionally, reduced uptake of ethyl cysteinatedimer in the left caudate, cingulum, and DLPFC hasbeen observed in this population. [45] These previouslydescribed lateral frontal regions are near the left DLPFC,which is implicated in our study. Previous findings re-garding the left lateral frontal cortex and DLPFC activa-tion in children with TD are consistent with our data.There are several potential limitations of the present
study. First, NIRS has certain disadvantages compared withother methodologies, namely, that NIRS enables the meas-urement of Hb concentration changes as relative valuesonly, not absolute values. To address this issue, we used aversion of the Stroop task wherein a baseline task was pre-sented to the participants first (the first page). Furthermore,we measured changes in Hb concentration between theactivation task and the baseline task. We also asked theparticipants to perform the task three times and used anaverage. This was done to reduce the influence of potentialaccidental changes and reduce participant fatigue. Thegrand average waveforms of changes in oxy-Hb concentra-tion in the TD group do not show a decrease in regionalcerebral flow during the activation task, although they doshow differences in blood flow between the baseline andactivation tasks. Second, the spatial resolution for detectinghemodynamic responses from the scalp surface using NIRSis lower than that for fMRI, SPECT, and PET. However,abnormal prefrontal hemodynamic responses in indi-viduals with pediatric TD are certainly detectible byNIRS. Third, our sample size was relatively small. Fu-ture studies should include a larger sample size. Fourth,our study included only male participants. Future stud-ies should also include female participants. Fifth, indi-viduals with comorbid ADHD were not excluded fromparticipation. However, as mentioned above, we did notfind any differences in mean oxy-Hb measurementsbetween TD patients with ADHD and those withoutADHD in the 24 channels (FDR-corrected, all P > 0.5).
Sixth, three participants were receiving medication duringthe present study. However, as mentioned above, we didnot find any differences in mean oxy-Hb measurementsbetween the medicated and unmedicated TD patients inthe 24 channels (FDR-corrected, all P > 0.5).
ConclusionTo the best of our knowledge, this is the first NIRS study toexamine prefrontal hemodynamic responses while healthyparticipants and those with pediatric TD performed theStroop task, as measured by NIRS. We found that changesin oxy-Hb concentration in the prefrontal cortex weresignificantly smaller in the TD group compared with thecontrol group. We also found that the SCWC scores of theTD group were significantly lower than those of the controlgroup. Our research indicates that pediatric TD patientsmight have prefrontal dysfunction and greater impulsivitycompared with control participants. The multi-channelNIRS system appears to be a very useful tool for assessingbrain function, as it enables non-invasive functional map-ping of the cerebral cortex and has much shorter measure-ment times (about 5 min) compared with other functionalbrain imaging methodologies.
Competing interestThe authors declare that they have no competing interests.
Authors’ contributionsKY was involved in the collection of the data and wrote the first draft of themanuscript. TO, YN, MU, HM, NK ST, HN, JI and TK supervised the entireproject, were critically involved in the design, and contributed to the editingof the final manuscript. All authors have read and approved the finalmanuscript.
AcknowledgmentsWe wish to thank the participants for their valuable involvement with thestudy. The authors would also like to thank the Hitachi Medical Corporationfor the ETG-4000 equipment and the skilled technical and methodicalsupport.
Author details1Department of Psychiatry, Nara Medical University School of Medicine, 840Shijyou-cho, Kashihara, Nara 634-8522, Japan. 2Faculty of Nursing, NaraMedical University School of Medicine, Kashihara, Nara, Japan. 3Departmentof Psychiatry, Nara Prefectural General Rehabilitation Center, Shiki, Nara,Japan. 4Department of Psychiatry, Tenri Hospital, Tenri, Nara, Japan.5Department of Education, Nara University of Education, Nara, Japan.
Received: 26 August 2014 Accepted: 17 April 2015
References1. Stokes A, Bawden HN, Camfield PR, Backman JE, Dooley JM. Peer problems
in Tourette's disorder. Pediatrics. 1991;87(6):936–42.2. Singer HS. Tourette's syndrome: from behaviour to biology. Lancet Neurol.
2005;4(3):149–59.3. Freeman RD, Fast DK, Burd L, Kerbeshian J, Robertson MM, Sandor P. An
international perspective on Tourette syndrome: selected findings from3,500 individuals in 22 countries. Dev Med Child Neurol. 2000;42(7):436–47.
4. Khalifa N, von Knorring AL. Tourette syndrome and other tic disorders in atotal population of children: clinical assessment and background. ActaPaediatr. 2005;94(11):1608–14.
5. Rampello L, Alvano A, Battaglia G, Bruno V, Raffaele R, Nicoletti F. Ticdisorders: from pathophysiology to treatment. J Neurol. 2006;253(1):1–15.
Yamamuro et al. BMC Psychiatry (2015) 15:102 Page 9 of 9
6. Roessner V, Plessen KJ, Rothenberger A, Ludolph AG, Rizzo R, Skov L, et al.European clinical guidelines for Tourette syndrome and other tic disorders.Part II: pharmacological treatment. Eur Child Adolesc Psychiatry.2011;20(4):173–96.
7. Scahill L, Erenberg G, Berlin Jr CM, Budman C, Coffey BJ, Jankovic J, et al.Contemporary assessment and pharmacotherapy of Tourette syndrome.NeuroRx : the journal of the American Society for ExperimentalNeuroTherapeutics. 2006;3(2):192–206.
8. Yamamuro K, Makinodan M, Ota T, Iida J, Kishimoto T. Paliperidoneextended release for the treatment of pediatric and adolescent patientswith Tourette's disorder. Ann Gen Psychiatry. 2014;13:13.
9. Mink JW. Neurobiology of basal ganglia circuits in Tourette syndrome: faultyinhibition of unwanted motor patterns? Adv Neurol. 2001;85:113–22.
10. Albin RL, Mink JW. Recent advances in Tourette syndrome research. TrendsNeurosci. 2006;29(3):175–82.
11. Kalanithi PS, Zheng W, Kataoka Y, DiFiglia M, Grantz H, Saper CB, et al.Altered parvalbumin-positive neuron distribution in basal ganglia ofindividuals with Tourette syndrome. Proc Natl Acad Sci U S A.2005;102(37):13307–12.
12. Leckman JF, Vaccarino FM, Kalanithi PS, Rothenberger A. Annotation:Tourette syndrome: a relentless drumbeat–driven by misguided brainoscillations. J Child Psychol Psychiatry. 2006;47(6):537–50.
13. Peterson BS, Thomas P, Kane MJ, Scahill L, Zhang H, Bronen R, et al. BasalGanglia volumes in patients with Gilles de la Tourette syndrome. Arch GenPsychiatry. 2003;60(4):415–24.
14. Peterson BS, Staib L, Scahill L, Zhang H, Anderson C, Leckman JF, et al.Regional brain and ventricular volumes in Tourette syndrome. Arch GenPsychiatry. 2001;58(5):427–40.
15. Li XL, Sun JH, Li F, Huang MJ, Li QQ, Wu QZ, et al. [Microstructuralabnormalities of basal ganglia and thalamus in children with first-episodeTourette's syndrome: a diffusion tensor imaging study]. Sichuan da xue xuebao Yi xue ban = Journal of Sichuan University Medical science edition.2010;41(2):284–7.
16. George MS, Trimble MR, Costa DC, Robertson MM, Ring HA, Ell PJ.Elevated frontal cerebral blood flow in Gilles de la Tourette syndrome: a99Tcm-HMPAO SPECT study. Psychiatry Res. 1992;45(3):143–51.
17. Klieger PS, Fett KA, Dimitsopulos T, Kurlan R. Asymmetry of basal gangliaperfusion in Tourette's syndrome shown by technetium-99 m-HMPAOSPECT. Journal of nuclear medicine : official publication, Society of NuclearMedicine. 1997;38(2):188–91.
18. Eidelberg D, Moeller JR, Antonini A, Kazumata K, Dhawan V, Budman C,et al. The metabolic anatomy of Tourette's syndrome. Neurology.1997;48(4):927–34.
19. Marsh R, Zhu H, Wang Z, Skudlarski P, Peterson BS. A developmental fMRIstudy of self-regulatory control in Tourette's syndrome. Am J Psychiatry.2007;164(6):955–66.
20. Boas DA, Dale AM, Franceschini MA. Diffuse optical imaging of brainactivation: approaches to optimizing image sensitivity, resolution, andaccuracy. Neuroimage. 2004;23 Suppl 1:S275–288.
21. Strangman G, Boas DA, Sutton JP. Non-invasive neuroimaging usingnear-infrared light. Biol Psychiatry. 2002;52(7):679–93.
22. Obrig H, Villringer A. Beyond the visible–imaging the human brain withlight. Journal of cerebral blood flow and metabolism : official journal ofthe International Society of Cerebral Blood Flow and Metabolism.2003;23(1):1–18.
23. Ohmae E, Ouchi Y, Oda M, Suzuki T, Nobesawa S, Kanno T, et al. Cerebralhemodynamics evaluation by near-infrared time-resolved spectroscopy:correlation with simultaneous positron emission tomography measurements.Neuroimage. 2006;29(3):697–705.
24. Villringer K, Minoshima S, Hock C, Obrig H, Ziegler S, Dirnagl U, et al.Assessment of local brain activation. A simultaneous PET and near-infraredspectroscopy study. Adv Exp Med Biol. 1997;413:149–53.
25. Matsuo K, Kato T, Taneichi K, Matsumoto A, Ohtani T, Hamamoto T, et al.Activation of the prefrontal cortex to trauma-related stimuli measured bynear-infrared spectroscopy in posttraumatic stress disorder due to terrorism.Psychophysiology. 2003;40(4):492–500.
26. Kameyama M, Fukuda M, Yamagishi Y, Sato T, Uehara T, Ito M, et al. Frontallobe function in bipolar disorder: a multichannel near-infrared spectroscopystudy. Neuroimage. 2006;29(1):172–84.
27. Suto T, Fukuda M, Ito M, Uehara T, Mikuni M. Multichannel near-infraredspectroscopy in depression and schizophrenia: cognitive brain activationstudy. Biol Psychiatry. 2004;55(5):501–11.
28. Ota T, Iida J, Sawada M, Suehiro Y, Yamamuro K, Matsuura H, et al. Reducedprefrontal hemodynamic response in pediatric obsessive-compulsive disorder asmeasured by near-infrared spectroscopy. Child Psychiatry Hum Dev.2013;44(2):265–77.
29. Okada K, Ota T, Iida J, Kishimoto N, Kishimoto T. Lower prefrontal activity inadults with obsessive-compulsive disorder as measured by near-infraredspectroscopy. Prog Neuropsychopharmacol Biol Psychiatry. 2013;43:7–13.
30. Negoro H, Sawada M, Iida J, Ota T, Tanaka S, Kishimoto T. Prefrontaldysfunction in attention-deficit/hyperactivity disorder as measured bynear-infrared spectroscopy. Child Psychiatry Hum Dev. 2010;41(2):193–203.
31. Kaufman J, Birmaher B, Brent D, Rao U, Flynn C, Moreci P, et al. Schedule forAffective Disorders and Schizophrenia for School-Age Children-Present andLifetime Version (K-SADS-PL): initial reliability and validity data. J Am AcadChild Adolesc Psychiatry. 1997;36(7):980–8.
32. Leckman JF, Riddle MA, Hardin MT, Ort SI, Swartz KL, Stevenson J, et al. TheYale Global Tic Severity Scale: initial testing of a clinician-rated scale of ticseverity. J Am Acad Child Adolesc Psychiatry. 1989;28(4):566–73.
33. Golden CJ. A group version of the Stroop Color and Word Test. J PersAssess. 1975;39(4):386–8.
34. Laird AR, McMillan KM, Lancaster JL, Kochunov P, Turkeltaub PE, Pardo JV,et al. A comparison of label-based review and ALE meta-analysis in theStroop task. Hum Brain Mapp. 2005;25(1):6–21.
35. Hoshi Y, Kobayashi N, Tamura M. Interpretation of near-infrared spectroscopysignals: a study with a newly developed perfused rat brain model. Journal ofapplied physiology (Bethesda, Md : 1985). 2001;90(5):1657–62.
36. Schweitzer JB, Faber TL, Grafton ST, Tune LE, Hoffman JM, Kilts CD.Alterations in the functional anatomy of working memory in adult attentiondeficit hyperactivity disorder. Am J Psychiatry. 2000;157(2):278–80.
37. Hock C, Villringer K, Muller-Spahn F, Wenzel R, Heekeren H, Schuh-Hofer S,et al. Decrease in parietal cerebral hemoglobin oxygenation during performanceof a verbal fluency task in patients with Alzheimer's disease monitored by meansof near-infrared spectroscopy (NIRS)–correlation with simultaneousrCBF-PET measurements. Brain Res. 1997;755(2):293–303.
38. Toronov V, Webb A, Choi JH, Wolf M, Michalos A, Gratton E, et al.Investigation of human brain hemodynamics by simultaneous near-infraredspectroscopy and functional magnetic resonance imaging. Med Phys.2001;28(4):521–7.
39. Singh AK, Dan I. Exploring the false discovery rate in multichannel NIRS.Neuroimage. 2006;33(2):542–9.
40. Wang Z, Maia TV, Marsh R, Colibazzi T, Gerber A, Peterson BS. The neuralcircuits that generate tics in Tourette's syndrome. Am J Psychiatry.2011;168(12):1326–37.
41. Biswal B, Yetkin FZ, Haughton VM, Hyde JS. Functional connectivity inthe motor cortex of resting human brain using echo-planar MRI. Magneticresonance in medicine : official journal of the Society of Magnetic Resonancein Medicine / Society of Magnetic Resonance in Medicine. 1995;34(4):537–41.
42. Hollander E, Kim S, Khanna S, Pallanti S. Obsessive-compulsive disorder andobsessive-compulsive spectrum disorders: diagnostic and dimensional issues.CNS Spectr. 2007;12(2 Suppl 3):5–13.
43. Baym CL, Corbett BA, Wright SB, Bunge SA. Neural correlates of tic severityand cognitive control in children with Tourette syndrome. Brain : a journalof neurology. 2008;131(Pt 1):165–79.
44. Chiu NT, Chang YC, Lee BF, Huang CC, Wang ST. Differences in 99mTc-HMPAObrain SPET perfusion imaging between Tourette's syndrome and chronic ticdisorder in children. Eur J Nucl Med. 2001;28(2):183–90.
45. Diler RS, Reyhanli M, Toros F, Kibar M, Avci A. Tc-99 m-ECD SPECT brainimaging in children with Tourette's syndrome. Yonsei Med J.2002;43(4):403–10.