glutamate system genes associated with ventral prefrontal and thalamic volume in pediatric...
TRANSCRIPT
Glutamate system genes associated with ventral prefrontal andthalamic volume in pediatric obsessive-compulsive disorder
Paul Daniel Arnolda, Frank P. MacMasterb, Gregory L. Hannac, Margaret A. Richterd, TriciaSicarde, Eliza Burroughsd, Yousha Mirzab, Phillip C. Easterb, Michelle Roseb, James LKennedye, and David R Rosenbergba Program in Genetics and Genomic Biology and Department of Psychiatry, Hospital for SickChildren, Toronto, ON, Canadab Wayne State University and the Children’s Hospital of Michigan, Detroit, MIc University of Michigan, Ann Arbor MId Anxiety Disorders Clinic, Centre for Addiction and Mental Health and University of Toronto,Toronto, ON, Canadae Neurogenetics Section, Centre for Addiction and Mental Health, University of Toronto, Toronto,ON, Canada
AbstractThis pilot study was undertaken to determine if there was a significant association between specificglutamate system genes and regional volumes of interest implicated in the pathogenesis of obsessive-compulsive disorder (OCD). Volumetric magnetic resonance imaging (MRI) and genotyping of 7polymorphisms in two genes, glutamate receptor, ionotropic, N-methyl-d-aspartate 2B (GRIN2B)and solute linked carrier, family 1, member 1 (SLC1A1) were conducted in 31 psychotropic-naïvepediatric OCD patients. The rs1805476 variant of GRIN2B was associated with left but not rightorbital frontal cortex (OFC) (p=0.04) and right but not left anterior cingulate cortex (ACC) volume(p=0.02). The SLC1A1 rs3056 variant was associated with increased total (p=0.01), left (p=0.02) andright (p=0.02) thalamic volume. These results suggest that GRIN2B and SLC1A1 may be associatedwith regional volumetric alterations in OFC, ACC, and thalamus in children with OCD.
KeywordsObsessive-compulsive disorder; genetic association; glutamate; orbitofrontal cortex; anteriorcingulate cortex; thalamus
INTRODUCTIONObsessive-compulsive disorder (OCD) is a debilitating neuropsychiatric condition affectingan estimated 1 to 3% of the population (Rasmussen & Eisen, 1994). The National ComorbiditySurvey Replication found a median age of onset in OCD of 19 years, with 21% of cases havingonset by age 10 (Kessler et al. 2005). Evidence from large controlled family studies of bothadult (Nestadt et al. 2000; Pauls et al. 1995), and pediatric probands (do Rosario-Campos etal. 2005; Hanna et al. 2005) suggest that OCD aggregates in families, particularly in familiesof early onset probands. In addition, twin studies indicate a high additive genetic contributionto dimensionally measured obsessive-compulsive symptoms, ranging from 27–47% in adultsto 45–65% in children (as reviewed in (van Grootheest et al. 2005)). Taken together, the familyand twin studies suggest a robust genetic contribution to the disorder.
NIH Public AccessAuthor ManuscriptBrain Imaging Behav. Author manuscript; available in PMC 2010 October 26.
Published in final edited form as:Brain Imaging Behav. 2009 March 1; 3(1): 64–76. doi:10.1007/s11682-008-9050-3.
NIH
-PA Author Manuscript
NIH
-PA Author Manuscript
NIH
-PA Author Manuscript
Candidate gene studies in OCD, largely focused on serotonin receptor and transporter genes,have been inconclusive. This has prompted a search for new candidate genes based on noveletiological hypotheses. One hypothesis points to altered glutamate neurotransmission in OCD(Carlsson, 2000; Pittenger et al. 2006; Rosenberg & Keshavan, 1998; Rosenberg et al. 2001).Glutamate is the primary excitatory neurotransmitter within cortico-striatal-thalamic circuits(CSTCs) implicated in OCD (Bronstein & Cummings, 2001). Evidence for altered glutamateactivity is accruing from multiple studies using proton magnetic resonance spectroscopy (1-HMRS), cerebral spinal fluid (CSF), animal models and application of medications that modulateglutamate. First, a 1H-MRS study found greater left striatal glutamatergic (Glx) concentrationsin psychotropic-naïve, non-depressed pediatric patients with OCD than in age and sex matchedhealthy controls (Rosenberg et al. 2000a). Left striatal Glx concentrations normalized after 12weeks of paroxetine therapy (Rosenberg et al. 2000a) but not with cognitive-behavioral therapy(Benazon et al. 2003). The decrease in left striatal Glx with SSRI treatment was positivelycorrelated with reduction in OCD symptom severity. Furthermore, greater Glx to creatine (Cr)ratios have been noted in orbital frontal white matter in OCD patients as compared to controls(Whiteside et al. 2006). In contrast, lower Glx concentrations were observed in the anteriorcingulate cortex of non-depressed children with OCD compared with healthy pediatric controls(Rosenberg et al. 2004). This indicates that changes in glutamate activity are regional withinthe CSTC. Second, CSF concentrations of glutamate were also noted to be elevated in OCDas compared to controls (Chakrabarty et al. 2005). Third, mouse models have indicatedalterations in regional glutamate activity that correlate with behavior analogous to obsessive-compulsive symptoms (Nordstrom & Burton, 2002; Welch et al. 2007). Finally, the applicationof novel glutamate modulating agents, such as riluzole, has shown promise in alleviating OCDsymptoms in a case report (Coric et al. 2003) and open label trials in adults (Coric et al.2005) and children (Grant et al. 2007). Therefore, converging lines of evidence fromneuroimaging, genetics, animal models and clinical trials suggest that a glutamatergicabnormality may play a critical role in the pathogenesis of OCD.
This evidence has led to the search for glutamate related genes that may be associated withOCD. We recently reported variants within two glutamate system genes to be associated withOCD. First, an association between OCD and variants of the glutamate subunit receptor geneGRIN2B (glutamate receptor, ionotropic, N-methy1-D-aspartate 2B), a gene encoding asubunit of the NMDA receptor was reported (Arnold et al. 2004). A positive associationbetween variants in the 3′-untranslated region (3′-UTR) of GRIN2B was identified in threeindependently ascertained samples consisting of a total of 255 small OCD families of bothadult and pediatric probands. In addition, rs1019385, a variant in the promoter region wasfound to be associated with OCD in the total sample (Arnold, 2007). This same variant wasalso associated with decreased anterior cingulate glutamatergic concentration (Glx) in apreliminary study of 18 psychotropic-naïve pediatric patients with OCD (Arnold et al. 2007).In a genome scan based on large multigenerational families with OCD ascertained throughpediatric probands, suggestive linkage was found in chromosome 9p24 (Hanna et al. 2002), afinding which was subsequently replicated (Willour et al. 2004). The 9p24 region contains theneuronal glutamate transporter gene SLC1A1 (solute linked carrier, family 1, member 1). Anassociation between SLC1A1 variation and OCD, particularly in males, was reportedsimultaneously in two independent samples using family-based association methods (Arnoldet al. 2006; Dickel et al. 2006) and more recently replicated in a third sample (Stewart et al.2007). Both GRIN2B and SLC1A1 are highly expressed within the fetal compared with theadult human brain, and in mature brain tissue these genes are highly expressed in brain regionsimplicated in the pathogenesis of OCD (Su et al. 2002). What remains unknown is the influencethese genetic variants have on the CSTC in OCD patients.
The findings of association with sequence variation in GRIN2B and SLC1A1 were based onthe phenotype of DSM-IV OCD diagnosis. However, OCD is a complex, etiologically
Arnold et al. Page 2
Brain Imaging Behav. Author manuscript; available in PMC 2010 October 26.
NIH
-PA Author Manuscript
NIH
-PA Author Manuscript
NIH
-PA Author Manuscript

heterogeneous genetic disorder that is believed to involve multiple interacting genetic andenvironmental factors. One approach to minimize this complexity is to study biologicallysalient intermediate phenotypes, quantitative traits that are correlated with the disorder inquestion but may be more closely linked to the action of genes compared with complexbehaviors (Gottesman & Gould, 2003; Meyer-Lindenberg & Weinberger, 2006; Turner et al.2006). Brain imaging profiles represent particularly promising intermediate phenotypes(Meyer-Lindenberg & Weinberger, 2006; Rosenberg & Hanna, 2000), as exemplified bystudies in healthy volunteers demonstrating large effect size for candidate gene variants onstructural (e.g. (Szeszko et al. 2005) and functional (Hanna et al. 2002; Hariri et al. 2005)neuroimaging measures. Neuroimaging findings of differences in cortico-striatal thalamiccircuits between OCD individuals and controls, therefore, may provide valuable intermediatephenotypes for identification of susceptibility genes.
Given the mounting evidence for glutamate involvement in OCD pathogenesis, we wereinterested in testing the GRIN2B and SLC1A1 polymorphisms we had previously identified infamily-based candidate gene studies of OCD for association with neuroimaging phenotypes.Here we focused on three brain regions previously implicated in both volumetric magneticresonance imaging (MRI) and 1-H MRS studies of OCD, including the orbital frontal cortex(OFC) (Szeszko et al. 1999, Whiteside et al. 2006), anterior cingulate cortex (Rosenberg andKeshavan, 1998; Szeszko et al. 2004, Rosenberg et al. 2004), and caudate (Rosenberg et al.1997, and Rosenberg et al. 2000a). We also examined a fourth region, the thalamus based onstrong evidence of volumetric differences in our own MRI studies of pediatric probandscompared with healthy controls (Gilbert et al. 2000; Smith et al. 2003; Mirza et al. 2006). Inthis pilot study, we report on our initial findings based on volumetric magnetic resonanceimaging (MRI) in pediatric psychotropic-naïve probands.
MATERIALS AND METHODS1. Subjects
The study group consisted of 31 (18 male, 13 female) medication-naïve children andadolescents with OCD, ranging from 7 to 18 years of age (mean = 11.8 years, s.d. = 3.1).Medication-naïve, pediatric subjects were selected to avoid confounding of MRI results dueto chronic illness and pharmacotherapy. None of the patients were receiving cognitive-behavioral therapy at the time of participation. Patients with a history of significant debilitatingmedical or neurologic conditions, major depressive disorder, bipolar disorder, psychosis,substance use or dependence, eating disorders, attention deficit hyperactivity disorder, IQ <80, pervasive developmental disorder, learning disorders or tic-related conditions wereexcluded. Written informed consent was obtained from all subjects. All patients wereadministered the Schedule for Affective Disorders and Schizophrenia – School-Age Children(Kaufman et al. 1997) and the Children’s Yale-Brown Obsessive Compulsive Scale(CYBOCS) (mean = 25.6, s.d. = 7.3) (Scahill et al. 1997). All patients with OCD had aCYBOCS score of at least 17 consistent with significant dysfunction. Other clinician-administered instruments included (mean ± S.D. in parentheses): Hamilton Anxiety RatingScale (HAM-A, (Hamilton, 1959)) (7.72 ± 4.71), Hamilton Depression Rating Scale (HAM-D; (Hamilton, 1967)) (7.93 ± 5.52), and the Yale Global Tic Severity Scale (YGTSS, Leckmanet al, 1989) (2.50 ± 6.73). In order to determine IQ, the following subscales of the WISC-III(Wechsler Intelligence Scale for Children-III, Wechsler 1991) are administered to all patients:Block Design, Vocabulary and Digit Span. If a child receives a score of less than 6 on any ofthese scales, the entire WISC-III is administered. An overall IQ of 80 was required forparticipation in this study.
Arnold et al. Page 3
Brain Imaging Behav. Author manuscript; available in PMC 2010 October 26.
NIH
-PA Author Manuscript
NIH
-PA Author Manuscript
NIH
-PA Author Manuscript
2. Procedures2.1. Imaging—Imaging data were collected at the Children’s Hospital of Michigan ImagingCenter using a Sigma 1.5-Tesla unit (Horizon LX software, General Electric Medical Systems,Milwaukee, WI). Scanning methods, image acquisition and analysis procedures used to obtainstructural magnetic resonance imaging (MRI) have been described in detail elsewhere(Benazon et al. 2003; Mirza et al. 2004; Rosenberg et al. 2000a; Rosenberg and Keshavan1998; Rosenberg et al. 1997; Rosenberg et al. 2000b; Rosenberg et al. 2004; Szeszko et al.2004). A 3-dimensional spoiled gradient echo pulse sequence obtained 124 1.5-mm-thickcontiguous coronal images. Parameters were: echo time=5 milliseconds, repetition time=25milliseconds, acquisition matrix=256 × 256 pixels, field of view=24 cm, and flip angle=40°.Well-trained and reliable operators, blinded to the subject’s group membership and otheridentifying information, measured regional brain volumes in the coronal plane using the MEDxprogram using a manual tracing technique. Briefly, region of interest definitions are outlinedbelow.
Orbital Frontal Cortex (OFC): The anterior boundary was the last appearance of the anteriorhorizontal ramus. The posterior boundary was the last appearance of the olfactory sulcus. Thelateral boundary was the anterior horizontal ramus or circular sulcus of insula. The medialboundary was the olfactory sulcus (Szeszko et al. 1999). Intraclass correlation coefficient (ICC)values were 0.98 for the right OFC and 0.92 for the left OFC.
Anterior Cingulate Cortex: The boundaries of the anterior cingulate gyrus were as follows:The anterior boundary of the cingulate was the tip of the cingulate sulcus and the posteriorborder the connection of the superior and precentral sulci. The superior boundary was thecingulate sulcus and the inferior border was the callosal sulcus (Rosenberg and Keshavan,1998; Szeszko et al. 1999). ICC values were 0.98 for the right ACC and 0.97 for the left ACC.
Caudate: For the anterior boundary, measurement of the caudate began when it was first visiblerostrally. The posterior boundary was the point at which the tail of the caudate was no longerclearly visible. Special care was taken to exclude cerebrospinal fluid medially and to excludethe nucleus accumbens ventrally. The internal capsule, the nucleus accumbens, and the globuspallidus separated the putamen from the caudate (Rosenberg et al. 1997; Szeszko et al. 1999).The ICC values for measurement of the caudate were 0.91 for the right caudate, and 0.90 forthe left caudate.
Thalamus: Right and left thalami were measured separately. The anterior boundary was thecoronal slice with the mamillary bodies and interventricular foramen present. The posteriorboundary was the coronal slice where the thalamus merged under the crux fornix. The internalcapsule was considered the lateral boundary and the third ventricle the medial boundary. Thesuperior boundary was the main body of the lateral ventricle and the inferior boundary was thehypothalamus (Gilbert et al. 2000). The ICC for right thalamus was 0.95 and 0.96 for leftthalamus.
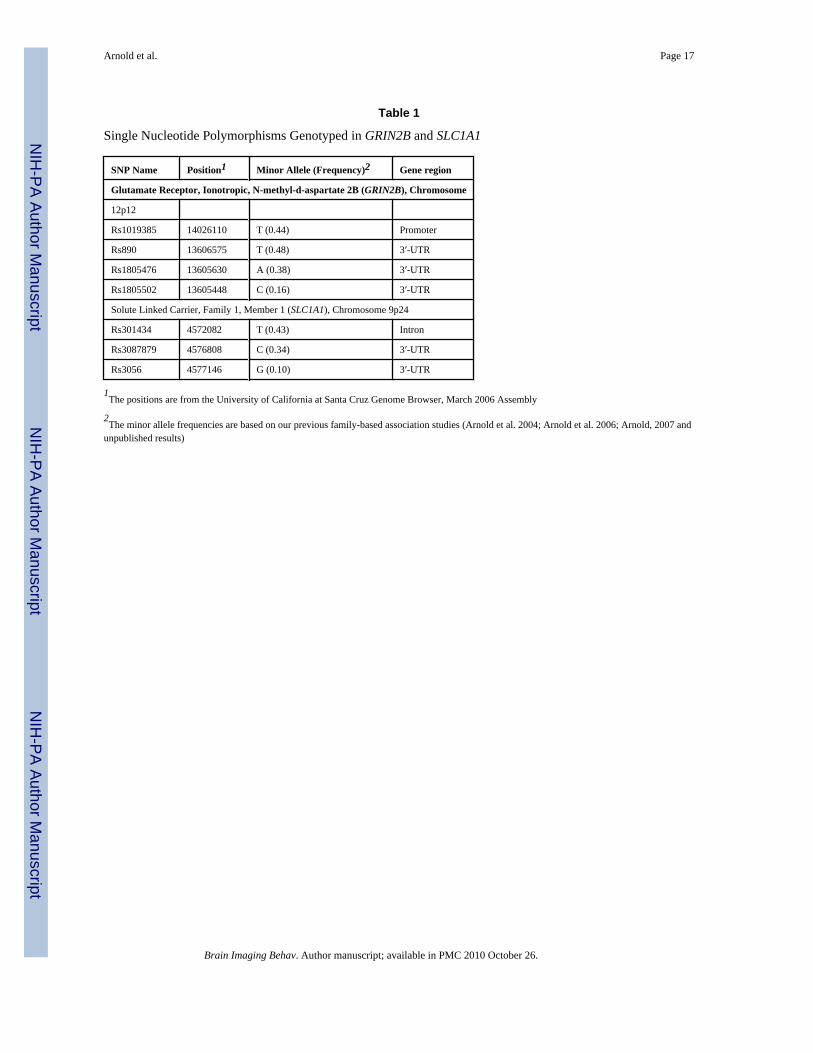
2.2. Genotyping—Genomic DNA was extracted from venous blood lymphocytes using anon-enzymatic, high salt method (Lahiri & Nurnberger, 1991). Four GRIN2B polymorphismswere selected for genotyping based on significant association findings in an ongoing Torontofamily-based association study: rs1019385 (Arnold, 2007), rs890, rs1805476 and rs1805502(Arnold et al. 2004). Similarly, three polymorphisms were selected for genotyping fromSLC1A1 based on significant association findings in the same Toronto sample: rs301434,rs3087879 (Arnold et al. 2006) and rs3056 (unpublished results).
Arnold et al. Page 4
Brain Imaging Behav. Author manuscript; available in PMC 2010 October 26.
NIH
-PA Author Manuscript
NIH
-PA Author Manuscript
NIH
-PA Author Manuscript
Information regarding SNPs including position and minor allele frequency is shown in Table1. Genotyping of GRIN2B polymorphisms was performed using Taqman® assays-by-designfrom Applied Biosystems Inc. (Foster City, CA), whereas genotyping of SLC1A1polymorphisms was performed using Applied Biosystems Inc. (Foster City, CA) assays-on-demand (ready-to-use TaqMan® probe-based SNP genotyping assays). For each reaction, 20nggenomic DNA was amplified as per manufacturer’s directions in a total volume of 10ul in anMJ Research thermocycler (Bio-Rad Laboratories, Hercules, CA).
The post-read allelic discrimination option was used for analysis of plates on the ABIPrism7000 Sequence Detection System (softwarev1.2.3). Genotypes were assigned automatically,following which visual inspection was performed for the purpose of confirmation and errorchecking. Probes and primer sequences are available by request. The genotyping methods usedwere identical to those used in our family-based association studies (Arnold et al. 2004, Arnoldet al. 2006, Arnold 2007).
3. Statistical AnalysisFor each variant, analyses were performed to test for differences in structural phenotypesincluding total volumes of the orbitofrontal cortex, anterior cingulate, caudate, and thalamus.Only total volume was initially analyzed, and the threshold for significance was set at p<.05.However, if a p value of <.10 was identified for a brain region, more detailed analysis wasperformed to determine laterality (left vs. right volumes). The number of tests was thereforeminimized in order to reduce Type I error due to multiple comparisons, but no formal statisticalcorrection was applied. Analysis was performed using Analysis of Covariance (ANCOVA)with age and total brain volumes as the covariates, since our prior published reports have foundage-related alterations in intracranial volume (ICV) in children and adolescents with OCD vs.healthy pediatric controls (Szeszko et al. 2004, 2008a). Effect sizes (d) for significant analyseswere calculated according to the guidelines outlined by Cohen (1988).
Given the small sample size and variable minor allele frequencies of the candidatepolymorphisms tested, in many cases one of the homozygote groups had a small number ofindividuals, below that usually recommended for ANOVA-based methods. Therefore, whenthere were less than five individuals in a genotype group for a given analysis these subjectswere grouped together with the heterozygote in the analysis. The approach of combininggenotype groups due to small sample size is consistent with other studies examiningintermediate phenotypes, (e.g. Papassotiropoulos et al. 2006; Szeszko et al. 2008b). Boxplotswere constructed and inspected to ensure normal distribution of outcome variables and checkfor the presence of extreme values. As an added precaution, Levene’s test was performed toevaluate the equality of error variances of independent variables between genotype groups.These checks were performed since normality and homogeneity of variance between groupsare assumptions underlying ANCOVA (Tabachnik & Fidell, 2001). Statistical analyses wereperformed using the Statistical Package for Social Sciences (SPSS) package, version 15.
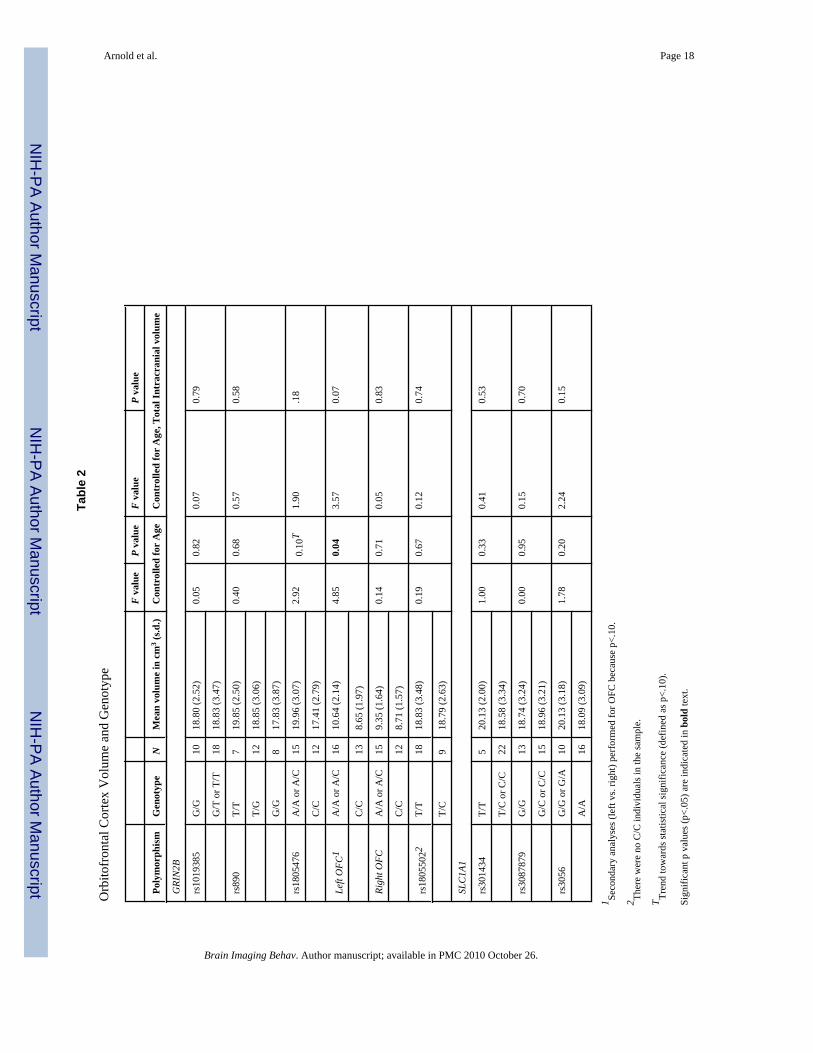
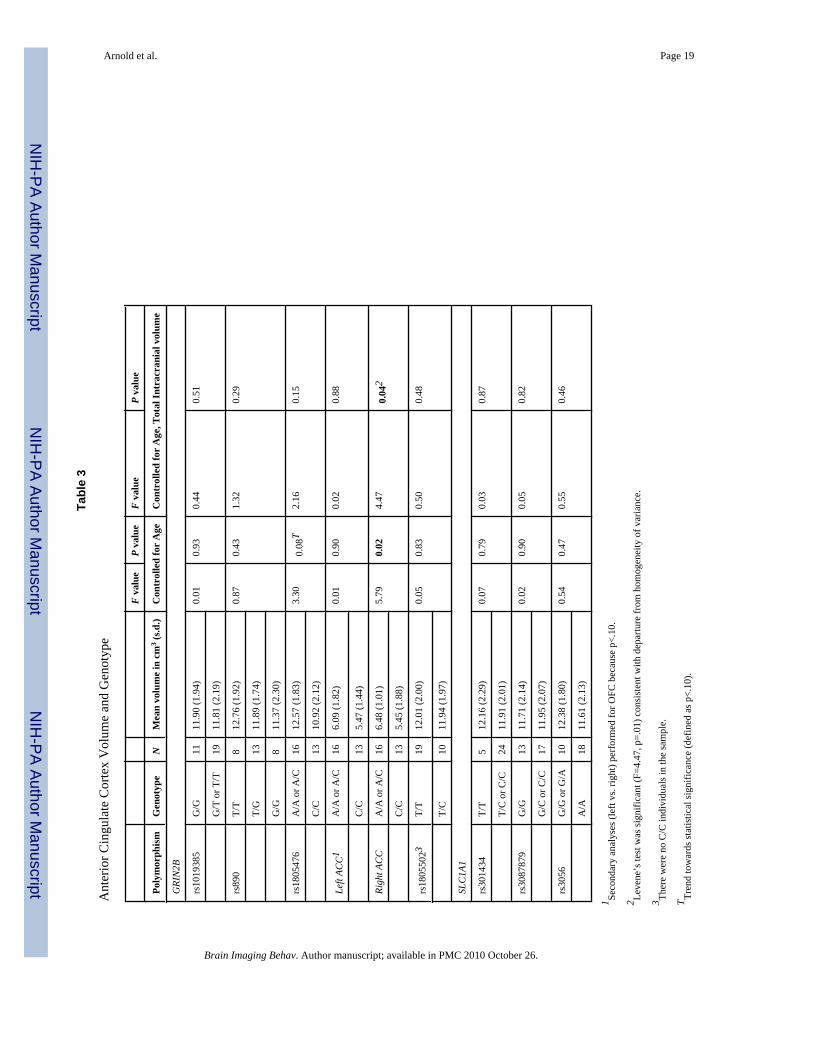
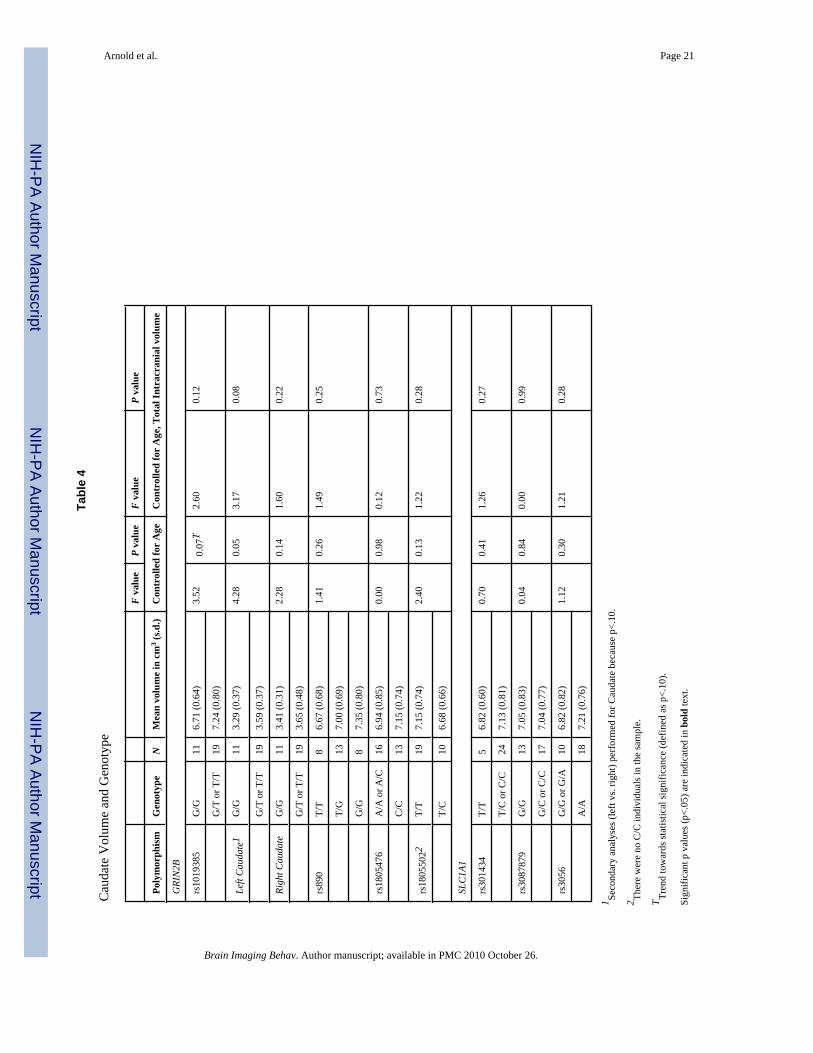
RESULTSData for genotype and regional brain volumes are presented in Tables 2 through 5 fororbitofrontal cortex, ACC, caudate, and thalamus. All results are covaried for age, and data areshown with and without covarying for total brain volume.
Orbitofrontal Cortex (OFC)As shown in Table 2, there was a trend towards an association between GRIN2B-rs1805476and OFC which did not reach statistical significance (F=2.92, p=.10). Separate analysis of leftand right OFC revealed a significant association between left OFC volume and rs1805476
Arnold et al. Page 5
Brain Imaging Behav. Author manuscript; available in PMC 2010 October 26.
NIH
-PA Author Manuscript
NIH
-PA Author Manuscript
NIH
-PA Author Manuscript

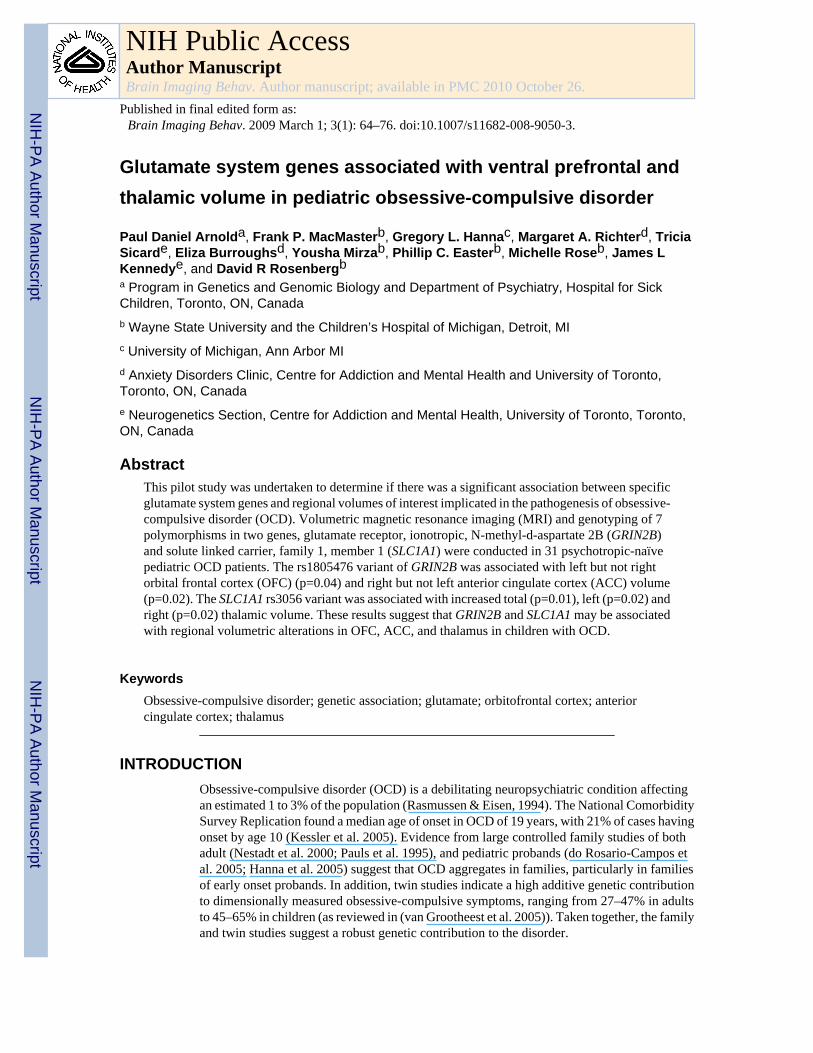
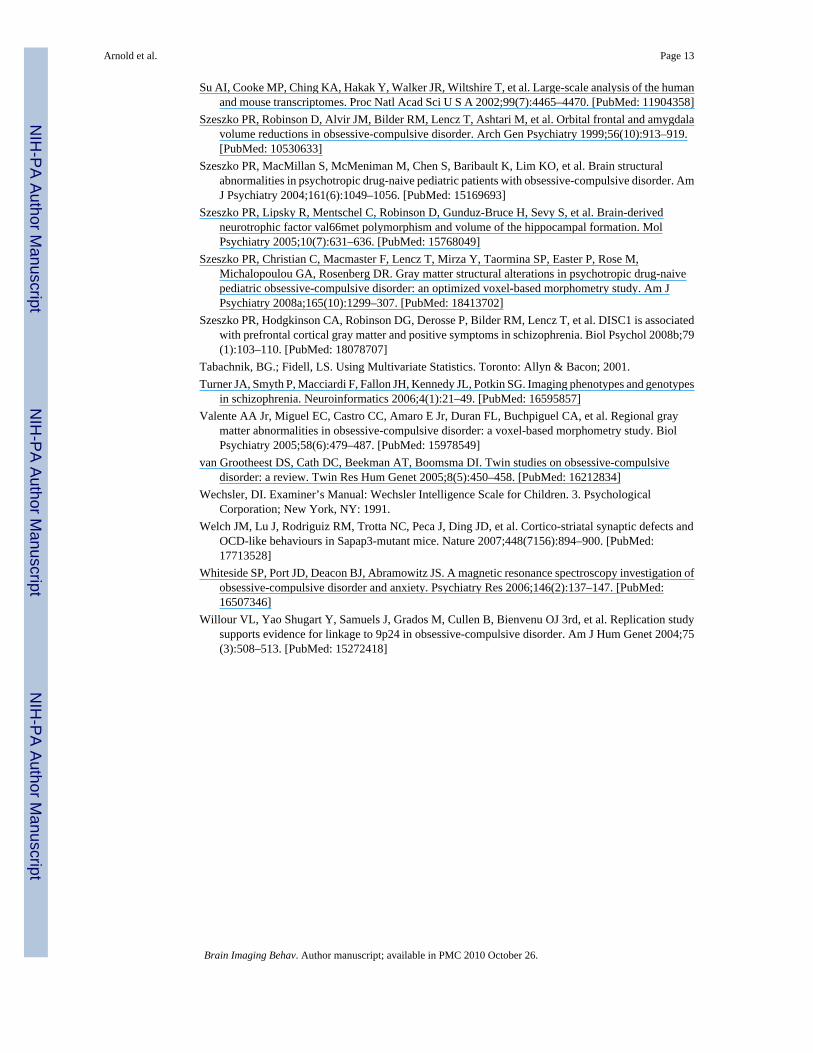
covaried by age (F=4.85, p=0.04), intracranial volume (F=4.57, p=0.04), but not when covariedfor both age and intracranial volume (F=3.57, p=0.07). Specifically, having one or two copiesof the A allele was associated with increased left OFC volume compared with the homozygoteCC genotype (see Figure 1). The effect size (d) of this association between GRIN2B-rs1805476and left OFC volume was 0.97. Results remained significant if outliers were removed. Therewas no significant association with right OFC volume (F=.14, p=.71). Genotype groups forrs1805476 did not differ with regard to OCD symptom severity (CYBOCS total, obsessionsor compulsions scores), anxiety, depression, or tic severity. There were no significantassociations between any of the other polymorphisms tested and OFC volume (Table 2).
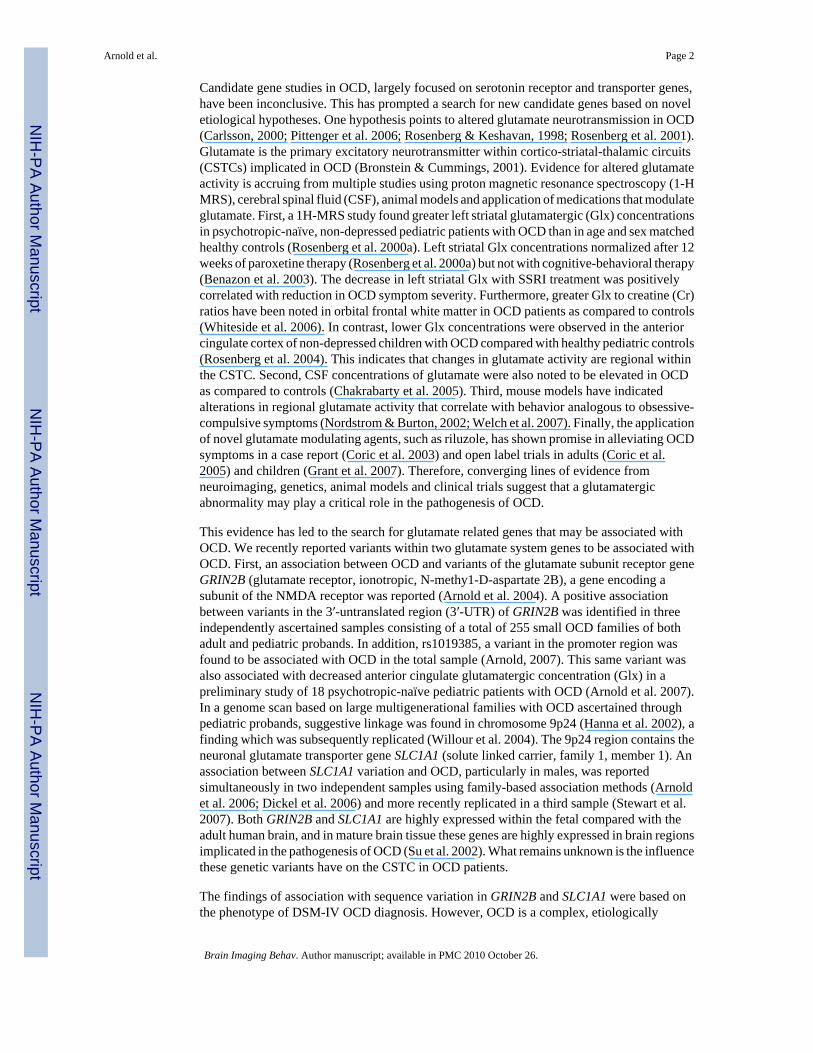
Anterior Cingulate Cortex (ACC)As shown in Table 3, there was a trend towards an association between GRIN2B-rs1805476and total ACC volume which did not reach statistical significance (F=3.30, p=0.08). Separateanalysis of left and right ACC resulted in a significant association between right ACC volumeand rs1805476 covaried by age (F=5.79, p=0.02), and by age and intracranial volume (F=4.47,p=0.04). Specifically, having one or two copies of the A allele was associated with increasedright ACC volume compared with the homozygote CC genotype (see Figure 2). The effect size(d) of this association between GRIN2B-rs1805476 and right ACC volume was 0.68. Resultsremained significant if outliers were removed. However, Levene’s test for homogeneity ofvariance was statistically significant for the analysis of right ACC volume and rs1805476genotype, indicating that the variance within the two genotype groups was significantlydifferent. There was no significant association between rs1805476 and left ACC volume(F=0.01, p=0.90) and no significant associations between any of the other polymorphismstested and ACC volume (Table 3).
CaudateThe GRIN2B-rs1019385 variant exhibited a non-significant trend towards association withcaudate volume (F=3.52, p=0.07), and follow-up analyses revealed a trend towards associationbetween this polymorphism and left (F=3.17, p=0.08 when both covariates included) but notright caudate volume. Caudate volume was not associated with any of the other polymorphismstested (Table 4).
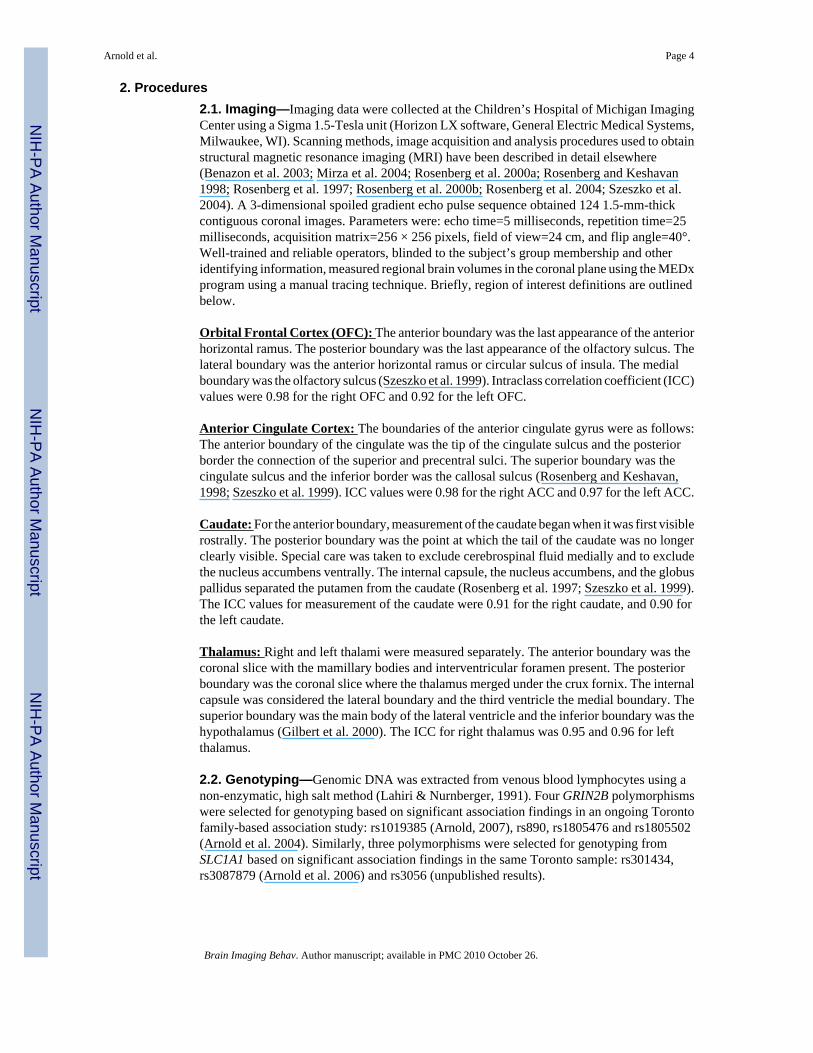
ThalamusNo significant differences were detected for thalamic volume based on GRIN2B genotype. ForSLC1A1, a single variant (rs3056) was found to be associated with thalamic volume aftercorrecting for age and total intracranial volume. Specifically, increased thalamic volume wassignificantly associated with the A/A genotype compared with carriers of the G allele (mostlyG/A with a single G/G individual) (F=7.25, p=0.01 covarying for both age and intracranialvolume). Figure 3 illustrates the differences in thalamic volume between SLC1A1 genotypegroups. The effect size (d) of this association between rs3056 in SLC1A1 and total thalamicvolume was 0.81. Results remained significant if outliers were removed. Secondary analysisbased on laterality revealed that both left (F=6.16, p=0.02) and right (F=6.18, p=0.02) thalamicvolume was significantly increased with the A/A genotype. Genotype groups for rs3056 didnot differ with regard to OCD symptom severity (CYBOCS total, obsessions or compulsionsscores), anxiety, depression, or tic severity. No significant associations were identified betweenthe SLC1A1 rs301434 and rs3087879 polymorphisms and thalamic volume (Table 5).
Given that three previous association studies of SLC1A1 in OCD found the strongest effectsin males (Arnold et al. 2006; Dickel et al. 2006; Stewart et al. 2007) we performed anexploratory analysis of the possible effects of gender on thalamic volume. A two-wayANCOVA was performed with gender and genotype as the two factors, age as the covariate,and thalamic volume (whole, right, or left) as the dependent variable. Analysis of whole and
Arnold et al. Page 6
Brain Imaging Behav. Author manuscript; available in PMC 2010 October 26.
NIH
-PA Author Manuscript
NIH
-PA Author Manuscript
NIH
-PA Author Manuscript

left thalamic volume revealed a non-significant trend for a gender effect on volume (p=0.09and p=0.07 respectively) with increased volume in females compared with males. However,there was no significant genotype by gender interaction and genotype main effects remainedsignificant.
DISCUSSIONIn this study, we found preliminary evidence that variants within glutamate system genes areassociated with volumetric differences in brain regions implicated in this disorder. Firstly, thers1805476 variant is located within the 3′-untranslated region of GRIN2B. Although we havenot found a significant association between this variant and OCD, we have previouslydemonstrated increased transmission of the C-C haplotype of rs1805476 and nearby rs1805502to OCD probands under the recessive model of inheritance (i.e. requiring two copies of the Callele) (Arnold et al. 2004; Arnold et al. 2007). In the current study, we identified an associationbetween this variant and OFC volume which was specific to the left OFC (F=4.85, p=0.04).Specifically, CC homozygotes had decreased left OFC volume compared with carriers of theA allele (AA or AC genotype). A number of MRI studies have shown decreased OFC volumein OCD patients compared with controls, using either region-of-interest or voxel-basedmorphometry (VBM) methods (Atmaca et al. 2007; Choi et al. 2004; Kang et al. 2004; Pujolet al. 2004; Szeszko et al. 1999; Szeszko et al. 2004). This includes one recent study oftreatment-naïve OCD adults in which bilateral reduction of OFC volume was reported (Atmacaet al. 2007). Another report implicated decreased left OFC volume (Kang et al. 2004), and thesame group has also reported more specifically that left anterior OFC volume was decreasedin OCD and that this volumetric decrease correlated with impaired organizational strategies(Choi et al. 2004). Based on these studies, our finding of decreased left OFC volume in CChomozygotes is biologically plausible in that the risk CC genotype is associated with decreasedOFC volume, identified by most structural neuroimaging studies as being associated with OCD.However, a smaller number of structural MRI studies have resulted in contradictory findings,including: increased grey matter in the left OFC of medication-naive OCD adults (Kim et al.2001), increased posterior OFC volume (Valente et al. 2005), and no volumetric difference forOFC (Riffkin et al. 2005). Interestingly, the location of rs1805476 in the 3′-untranslated region(3′-UTR) of GRIN2B suggests that this variant or a variant in tight linkage disequilibrium withit could influence translational control, possibly through altering a microRNA binding site(Bartel, 2004; John et al. 2004), and thereby affect the quantity of the NMDA 2B receptorsubunit that is produced (de Moor et al. 2005). There is a possible microRNA target site lyingbetween rs1805476 and rs1805502 (identified as binding human miRNA-224 usinghttp://www.microrna.org, (John et al. 2004)).
In addition to being associated with left OFC, the rs1805476 variant of GRIN2B was found tobe associated with the ACC. It is interesting to note that the association was with right ACCin contrast to the left-sided finding for OFC. In the current study the CC genotype of thers1805476 genotype previously associated with risk for OCD was associated with decreasedright ACC volume. The direction of the association differed from what we would havepredicted from three previous reports by our group which found increased anterior cingulatevolume (Rosenberg & Keshavan, 1998; Szeszko et al. 2004) or increased ACC total and rightgrey matter (Szeszko et al. 2008a) in pediatric psychotropic-naïve OCD patients comparedwith healthy controls. If the genetic association is replicated in larger sample sizes, one possibleexplanation for this discrepancy is that perturbation of ACC volume from normal is importantrather than the direction of change. Consistent with our findings of an association betweenACC volume and GRIN2B, we have elsewhere reported an association between rs1019385, avariant in the promoter region of GRIN2B and decreased anterior cingulate glutamatergicconcentration (Glx) in a preliminary study of 18 psychotropic-naïve pediatric patients with
Arnold et al. Page 7
Brain Imaging Behav. Author manuscript; available in PMC 2010 October 26.
NIH
-PA Author Manuscript
NIH
-PA Author Manuscript
NIH
-PA Author Manuscript
OCD (Arnold et al. 2007). Overall, our preliminary findings add to the growing literature onthe importance of the ACC for OCD pathogenesis.
Our third major finding was the association of an SLC1A1 variant and thalamic volume.Specifically, individuals with the A/A genotype of rs3056 were found to have increasedthalamic volume compared to carriers of the G allele. Recently, we reported the two markerC-G haplotype of the rs301434 and rs3087879 polymorphisms to be associated with OCD inour family-based sample (Arnold et al. 2006) and more recently we have found that the A alleleof rs3056 is part of a common, extended C-G-A haplotype of all three variants included in thisstudy (p=.0008, unpublished results). Interestingly, only the rs3056A allele appears to beassociated with thalamic volume, not the rs301434 or rs3087879 polymorphisms. Likers1805476, the location of rs3056 in the 3′-UTR suggests that this variant could have functionaleffects mediated by microRNA repression or other mechanisms of translational control (deMoor et al. 2005). There are two possible microRNA target sites lying less than 100 base pairsfrom rs3056 (human microRNA-96) and rs3087879 (human micro-RNA-132) respectively(identified using http://www.microrna.org). Sequencing of this region might identifyadditional variants that could influence microRNA binding.
Our group has previously reported that thalamic volume is increased in pediatric medication-naive OCD patients compared with controls, and that thalamic volume normalizes witheffective treatment with SSRI medication (Gilbert et al. 2000). This treatment effect appearsto be specific to medication, since thalamic volume did not normalize with cognitive-behavioral therapy (Rosenberg et al. 2000b). Two other studies of adult medication-naive OCDpatients also found increased thalamic volume compared with controls (Atmaca et al. 2007;Kim et al. 2001). Although no published studies have reported decreased thalamic volumecompared with controls, a single study of adults using VBM methods reported decreasedthalamic volume to be directly correlated with increased OCD symptom severity (Valente etal. 2005). Taken together, the neuroimaging evidence suggests an association betweenincreased thalamic volume and OCD. Therefore, the direction of our findings seems plausible;with the putative risk allele of the SLC1A1 rs3056 variant associated with the putative riskphenotype of increased thalamic volume.
Little is known regarding the functional consequences of the candidate variants examined inthe current study and their effects on glutamate activity. However, there is increasing evidencethat changes in glutamatergic neurotransmission can influence the density of dendritic spines(Alvarez and Sabatini 2007). Plasticity of dendritic spines is particularly important during earlydevelopment, but also continues in the adult brain. Therefore, one might speculate that changesin the expression of GRIN2B and SLC1A1 early in development influence dendritic plasticity.Alterations in dendritic spine density could be in turn reflected in volumetric differencesbetween individuals with OCD and normal controls. Should our findings be confirmed in largerstudies, further research would be needed to test this speculative model linking these DNAsequence variations to changes in dendritic spine density resulting in changes in regional brainvolumes.
This study had significant strengths, including its focus on medication-naïve, pediatric subjectsthat limited confounding of MRI results due to chronic illness and pharmacotherapy. The effectsizes for the associations identified were large (Cohen, 1988), ranging between 0.68 and 0.97,and similar to effect sizes for the serotonin transporter linked polymorphic region (5HTTLPR)and amygdala activation, the most studied association in the new field of imaging genetics(Munafo et al. 2008). However, as reviewed by Glahn et al (2007) there are a number oflimitations inherent to imaging genetics studies that are applicable to this project. First, therewas limited power to detect between-group differences due to the small sample size and needto focus on a restricted number of brain regions and SNPs. In our statistical analyses, we took
Arnold et al. Page 8
Brain Imaging Behav. Author manuscript; available in PMC 2010 October 26.
NIH
-PA Author Manuscript
NIH
-PA Author Manuscript
NIH
-PA Author Manuscript
precautions to counter possible errors resulting from the small sample size including checkingnormality of distribution and homogeneity of variance. However, this would certainly noteliminate the possibility of a false positive. There was also risk of Type I error due to multipletesting in this exploratory study, although we attempted to limit this by focusing on brainregions and SNPs selected based on strong a priori hypotheses. Overall, we acknowledge ourfindings should be interpreted with caution given the small sample size but feel that the effectswere of large enough magnitude, and the results of sufficient interest to warrant a preliminaryreport while we continue to collect a larger sample in order to confirm these findings. Second,reliability of MRI methods may be limited by the determination of regional volumes based onmanual tracing which may result in operator dependent error or bias. However, standardizationof methods and the high level of training of raters should mitigate such user effects. Third,future studies should include since diagnosis of tic disorder was an exclusionary criterion forthis study, the findings may not be generalizeable to children with significant tic comorbidity.
Finally, this study was limited by the lack of a healthy comparison group. Inclusion of a normalcontrol group would: 1) establish whether the regions of interest (ROI) are abnormal in thepatients, and 2) reveal whether the genetic effects on regional brain volumes are limited toindividuals with OCD or also relate to the normal range of brain structural variation seen inthe general pediatric population. With regard to volumetric differences between OCD childrenand controls, we feel confident that the ROIs studied would be abnormal in our patient groupsince they were selected a priori for examination of gene-ROI association based on multipleprevious studies (reviewed in Introduction) demonstrating robust differences between OCDpatients and controls. However, we have no evidence regarding the effects of our selectedcandidate genetic variants on brain structure in healthy children and adolescents. We speculatethat these variants influence regional brain volumes in normal individuals, but that this effectwill be greater in children with OCD, possibly due to co-occurring genetic and environmentalrisk factors which disrupt the same neurodevelopmental processes. This hypothesis isconsistent with previous imaging genetics studies which have found candidate gene effectswhich were present in both normal control and affected individuals but were more pronouncedin the latter (Szeszko et al. 2005; Szeszko et al. 2008b). Expanding the current research to testthese genetic effects in healthy controls is therefore a priority for future research, and we aretherefore applying for funding to conduct a larger imaging genetics study including bothpsychotropic-naïve OCD children and healthy age- and sex-matched controls.
In summary, three neuroimaging phenotypes – left OFC volume, right ACC volume, andthalamic volume – were associated with glutamate system variants previously identified in ourfamily-based studies as conferring risk to OCD. Associations with left OFC volume andthalamic volume were in the expected direction with the putative risk variant associated witha neuroimaging phenotype previously described in OCD, whereas the association with rightACC volume was in the opposite direction from what we would have predicted from earliervolumetric studies. This study is the first to our knowledge examining the relationship betweencandidate genetic polymorphisms and neuroimaging phenotypes in OCD. Given thatneuroimaging phenotypes may be closer to the action of genes than complex behavioralphenomena, it is hoped that further research in this area will shed light on the genetic basis ofthis neuropsychiatric disorder and lead to improved diagnosis and treatment.
AcknowledgmentsWe thank Ms. Tamara Arenovich of the Biostatistics Unit of the Centre for Addiction and Mental Health for statisticalsupport and consultation.
Support was provided by the Ontario Mental Health Foundation through a Type B grant (PDA, MAR, JLK), theCanadian Institutes for Health Research through an operating grant (MOP-38077) (PDA, EM, JLK, MAR) andFellowship to Dr. Arnold, the National Alliance on Research in Schizophrenia and Depression (Young Investigator
Arnold et al. Page 9
Brain Imaging Behav. Author manuscript; available in PMC 2010 October 26.
NIH
-PA Author Manuscript
NIH
-PA Author Manuscript
NIH
-PA Author Manuscript

Award, PDA), an Obsessive-Compulsive Foundation Research Award (PDA, MAR, JLK), Joe F. Young Sr.Psychiatric Research and Training Program, the Miriam Hamburger Endowed Chair of Child Psychiatry at Children’sHospital of Michigan and Wayne State University and the National Institute of Mental Health (R01MH59299,K24MH02037).
ReferencesAlvarez VA, Ridenour DA, Sabatini BL. Distinct structural and ionotropic roles of NMDA receptors in
controlling spine and synapse stability. J Neurosci 2007;11;27(28):7365–76.Arnold, PD. PhD dissertation. University of Toronto; Toronto: 2007. Glutamate genes in obsessive-
compulsive disorder including childhood onset cases and neuroimaging.Arnold, P.; Sicard, T.; Burroughs, E.; MacMaster, F.; Mirza, Y.; Taormina, P., et al. Glutamate system
genes in pediatric obsessive-compulsive disorder: an imaging genetics study using magnetic resonancespectroscopy. Paper presented at the World Congress of Psychiatric Genetics XV; New York, NY.2007.
Arnold PD, Rosenberg DR, Mundo E, Tharmalingam S, Kennedy JL, Richter MA. Association of aglutamate (NMDA) subunit receptor gene (GRIN2B) with obsessive-compulsive disorder: apreliminary study. Psychopharmacology (Berl) 2004;174(4):530–538. [PubMed: 15083261]
Arnold PD, Sicard T, Burroughs E, Richter MA, Kennedy JL. Glutamate transporter gene SLC1A1associated with obsessive-compulsive disorder. Arch Gen Psychiatry 2006;63(7):769–776. [PubMed:16818866]
Atmaca M, Yildirim H, Ozdemir H, Tezcan E, Poyraz AK. Volumetric MRI study of key brain regionsimplicated in obsessive-compulsive disorder. Prog Neuropsychopharmacol Biol Psychiatry 2007;31(1):46–52. [PubMed: 16859819]
Bartel DP. MicroRNAs: genomics, biogenesis, mechanism, and function. Cell 2004;116(2):281–297.[PubMed: 14744438]
Benazon NR, Moore GJ, Rosenberg DR. Neurochemical analyses in pediatric obsessive-compulsivedisorder in patients treated with cognitive-behavioral therapy. J Am Acad Child Adolesc Psychiatry2003;42(11):1279–1285. [PubMed: 14566164]
Bronstein, Y.; Cummings, J. Neurochemistry of frontal-subcortical circuits. In: Lichter, D.; Cummings,J., editors. Frontal-subcortical circuits in psychiatric and neurological disorders. New York: GuilfordPress; 2001. p. 59-91.
Carlsson M. On the role of cortical glutamate in obsessive-compulsive disorder in obsessive-compulsivedisorder and attention-deficit hyperactivity disorder, two hypothetically phenomenologicallyantithetical conditions. Acta Psychiatrica Scand 2000;102:410–413.
Chakrabarty K, Bhattacharyya S, Christopher R, Khanna S. Glutamatergic dysfunction in OCD.Neuropsychopharmacology 2005;30(9):1735–1740. [PubMed: 15841109]
Choi JS, Kang DH, Kim JJ, Ha TH, Lee JM, Youn T, et al. Left anterior subregion of orbitofrontal cortexvolume reduction and impaired organizational strategies in obsessive-compulsive disorder. JPsychiatr Res 2004;38(2):193–199. [PubMed: 14757334]
Cohen, J. Statistical power analysis for the behavioral sciences. 2. Hillsdale, NJ: Lawrence EarlbaumAssociates; 1988.
Coric V, Milanovic S, Wasylink S, Patel P, Malison R, Krystal JH. Beneficial effects of theantiglutamatergic agent riluzole in a patient diagnosed with obsessive-compulsive disorder and majordepressive disorder. Psychopharmacology (Berl) 2003;167(2):219–220. [PubMed: 12658528]
Coric V, Taskiran S, Pittenger C, Wasylink S, Mathalon DH, Valentine G, et al. Riluzole augmentationin treatment-resistant obsessive-compulsive disorder: an open-label trial. Biol Psychiatry 2005;58(5):424–428. [PubMed: 15993857]
de Moor CH, Meijer H, Lissenden S. Mechanisms of translational control by the 3′ UTR in developmentand differentiation. Semin Cell Dev Biol 2005;16(1):49–58. [PubMed: 15659339]
Dickel DE, Veenstra-VanderWeele J, Cox NJ, Wu X, Fischer DJ, Van Etten-Lee M, et al. Associationtesting of the positional and functional candidate gene SLC1A1/EAAC1 in early-onset obsessive-compulsive disorder. Arch Gen Psychiatry 2006;63(7):778–785. [PubMed: 16818867]
Arnold et al. Page 10
Brain Imaging Behav. Author manuscript; available in PMC 2010 October 26.
NIH
-PA Author Manuscript
NIH
-PA Author Manuscript
NIH
-PA Author Manuscript
do Rosario-Campos MC, Leckman JF, Curi M, Quatrano S, Katsovitch L, Miguel EC, et al. A familystudy of early-onset obsessive-compulsive disorder. Am J Med Genet B Neuropsychiatr Genet2005;136(1):92–97. [PubMed: 15892140]
Gilbert A, Moore G, Keshavan M, Paulson L, Narula V, MacMaster F, et al. Decrease in thalamic volumesof pediatric patients with obsessive-compulsive disorder who are taking paroxetine. Arch GenPsychiatry 2000;57:449–456. [PubMed: 10807485]
Glahn DC, Thompson PM, Blangero J. Neuroimaging endophenotypes: Strategies for finding genesinfluencing brain structure and function. Hum Brain Mapp 2007;28(6):488–501. [PubMed:17440953]
Gottesman II, Gould TD. The endophenotype concept in psychiatry: etymology and strategic intentions.Am J Psychiatry 2003;160(4):636–645. [PubMed: 12668349]
Grant P, Lougee L, Hirschtritt M, Swedo S. An open trial with riluzole, a glutamate antagonist, in childrenwith treatment-resistent obsessive-compulsive disorder. Journal of Child and AdolescentPsychopharmacology 2007;17:761–767. [PubMed: 18315448]
Hamilton M. The assessment of anxiety states by rating. Br J Med Psychol 1959;32(1):50–55. [PubMed:13638508]
Hamilton M. Development of a rating scale for primary depressive illness. Br J Soc Clin Psychol 1967;6(4):278–296. [PubMed: 6080235]
Hanna G, Himle J, Curtis G, Gillespie B. A family study of obsessive-compulsive disorder with pediatricprobands. Am J Med Genet B Neuropsychiatr Genet 2005;134(1):13–19. [PubMed: 15635694]
Hanna G, Veenstra-VanderWeele J, Cox N, Boehnke M, Himle J, Curtis G, et al. Genome-wide linkageanalysis of families with obsessive-compulsive disorder ascertained through pediatric probands. AmJ Med Genet 2002;114(5):541–552. [PubMed: 12116192]
Hariri AR, Drabant EM, Munoz KE, Kolachana BS, Mattay VS, Egan MF, et al. A susceptibility genefor affective disorders and the response of the human amygdala. Arch Gen Psychiatry 2005;62(2):146–152. [PubMed: 15699291]
John B, Enright AJ, Aravin A, Tuschl T, Sander C, Marks DS. Human MicroRNA targets. PLoS Biol2004;2(11):e363. [PubMed: 15502875]
Kang DH, Kim JJ, Choi JS, Kim YI, Kim CW, Youn T, et al. Volumetric investigation of the frontal-subcortical circuitry in patients with obsessive-compulsive disorder. J Neuropsychiatry Clin Neurosci2004;16(3):342–349. [PubMed: 15377742]
Kaufman J, Birmaher B, Brent D, Rao U, Flynn C, Moreci P, et al. Schedule for Affective Disorders andSchizophrenia for School-Age Children-Present and Lifetime Version (K-SADS-PL): initialreliability and validity data. J Am Acad Child Adolesc Psychiatry 1997;36(7):980–988. [PubMed:9204677]
Kessler RC, Berglund P, Demler O, Jin R, Merikangas KR, Walters EE. Lifetime prevalence and age-of-onset distributions of DSM-IV disorders in the National Comorbidity Survey Replication. ArchGen Psychiatry 2005;62(6):593–602. [PubMed: 15939837]
Kim JJ, Lee MC, Kim J, Kim IY, Kim SI, Han MH, et al. Grey matter abnormalities in obsessive-compulsive disorder: statistical parametric mapping of segmented magnetic resonance images. Br JPsychiatry 2001;179:330–334. [PubMed: 11581113]
Lahiri D, Nurnberger J. A rapid no-enzymatic method for the preparation of HMW DNA from blood forRFLP analysis. Nucl Acids Res 1991;19:5444. [PubMed: 1681511]
Leckman JF, Riddle MA, Hardin MT, Ort SI, Swartz KL, Stevenson J, et al. The Yale Global Tic SeverityScale: initial testing of a clinician-rated scale of tic severity. J Am Acad Child Adolesc Psychiatry1989;28(4):566–573. [PubMed: 2768151]
Meyer-Lindenberg A, Weinberger DR. Intermediate phenotypes and genetic mechanisms of psychiatricdisorders. Nat Rev Neurosci 2006;7(10):818–827. [PubMed: 16988657]
Mirza Y, Tang J, Russell A, Banerjee SP, Bhandari R, Ivey J, et al. Reduced anterior cingulate cortexglutamatergic concentrations in childhood major depression. J Am Acad Child Adolesc Psychiatry2004;43(3):341–348. [PubMed: 15076268]
Mirza Y, O’Neill J, Smith EA, Russell A, Smith JM, Banerjee SP, et al. Increased medial thalamiccreatine-phosphocreatine found by proton magnetic resonance spectroscopy in children with
Arnold et al. Page 11
Brain Imaging Behav. Author manuscript; available in PMC 2010 October 26.
NIH
-PA Author Manuscript
NIH
-PA Author Manuscript
NIH
-PA Author Manuscript
obsessive-compulsive disorder versus major depression and healthy controls. J Child Neurol 2006;21(2):106–111. [PubMed: 16566872]
Munafo MR, Brown SM, Hariri AR. Serotonin transporter (5-HTTLPR) genotype and amygdalaactivation: a meta-analysis. Biol Psychiatry 2008;63(9):852–857. [PubMed: 17949693]
Nestadt G, Samuels J, Riddle M, Bienvenu J, Liang KY, Labuda M, et al. A family study of obsessive-compulsive disorder. Arch Gen Psychiatry 2000;57:358–363. [PubMed: 10768697]
Nordstrom EJ, Burton FH. A transgenic model of comorbid Tourette’s syndrome and obsessive-compulsive disorder circuitry. Mol Psychiatry 2002;7(6):617–625. [PubMed: 12140785]
Papassotiropoulos A, Stephan DA, Huentelman MJ, Hoerndli FJ, Craig DW, Pearson JV, et al. CommonKibra alleles are associated with human memory performance. Science 2006;314(5798):475–478.[PubMed: 17053149]
Pauls D, Alsobrook J, Goodman W, Rasmussen S, Leckman J. A family study of obsessive-compulsivedisorder. Am J Psychiatry 1995;152:76–84. [PubMed: 7802125]
Pittenger C, Krystal JH, Coric V. Glutamate-modulating drugs as novel pharmacotherapeutic agents inthe treatment of obsessive-compulsive disorder. NeuroRx 2006;3(1):69–81. [PubMed: 16490414]
Pujol J, Soriano-Mas C, Alonso P, Cardoner N, Menchon JM, Deus J, et al. Mapping structural brainalterations in obsessive-compulsive disorder. Arch Gen Psychiatry 2004;61(7):720–730. [PubMed:15237084]
Rasmussen SA, Eisen JL. The epidemiology and differential diagnosis of obsessive compulsive disorder.J Clin Psychiatry 1994;55(Suppl):5–10. discussion 11–14. [PubMed: 7961532]
Riffkin J, Yucel M, Maruff P, Wood SJ, Soulsby B, Olver J, et al. A manual and automated MRI studyof anterior cingulate and orbito-frontal cortices, and caudate nucleus in obsessive-compulsivedisorder: comparison with healthy controls and patients with schizophrenia. Psychiatry Res 2005;138(2):99–113. [PubMed: 15766634]
Rosenberg DR, Keshavan MS, O’Hearn KM, Dick EL, Bagwell WW, Seymour AB, et al. Frontostriatalmeasurement in treatment-naive children with obsessive-compulsive disorder. Arch Gen Psychiatry1997;54(9):824–830. [PubMed: 9294373]
Rosenberg DR, Keshavan M. Toward a neurodevelopmental model of obsessive-compulsive disorder.Biol Psychiatry 1998;43:623–640. [PubMed: 9582996]
Rosenberg DR, Hanna GL. Genetic and imaging strategies in obsessive-compulsive disorder: potentialimplications for treatment development. Biol Psychiatry 2000;48(12):1210–1222. [PubMed:11137061]
Rosenberg DR, MacMaster FP, Keshavan MS, Fitzgerald KD, Stewart CM, Moore GJ. Decrease incaudate glutamatergic concentrations in pediatric obsessive-compulsive disorder patients takingparoxetine. J Am Acad Child Adolesc Psychiatry 2000a;39(9):1096–1103. [PubMed: 10986805]
Rosenberg DR, Benazon NR, Gilbert A, Sullivan A, Moore GJ. Thalamic volume in pediatric obsessive-compulsive disorder patients before and after cognitive behavioral therapy. Biol Psychiatry 2000b;48(4):294–300. [PubMed: 10960160]
Rosenberg DR, MacMillan S, Moore G. Brain anatomy and chemistry may predict treatment responsein paediatric obsessive-compulsive disorder. International Journal of Neuropsychopharmacology2001;4:179–190. [PubMed: 11466168]
Rosenberg DR, Mirza Y, Russell A, Tang J, Smith JM, Banerjee SP, et al. Reduced anterior cingulateglutamatergic concentrations in childhood OCD and major depression versus healthy controls. J AmAcad Child Adolesc Psychiatry 2004;43(9):1146–1153. [PubMed: 15322418]
Scahill L, Riddle MA, McSwiggin-Hardin M, Ort SI, King RA, Goodman WK, et al. Children’s Yale-Brown Obsessive Compulsive Scale: reliability and validity. J Am Acad Child Adolesc Psychiatry1997;36(6):844–852. [PubMed: 9183141]
Smith EA, Russell A, Lorch E, Banerjee SP, Rose M, Ivey J, et al. Increased medial thalamic cholinefound in pediatric patients with obsessive-compulsive disorder versus major depression or healthycontrol subjects: a magnetic resonance spectroscopy study. Biol Psychiatry 2003;54(12):1399–1405.[PubMed: 14675804]
Stewart SE, Fagerness JA, Platko J, Smoller JW, Scharf JM, Illmann C, et al. Association of the SLC1A1glutamate transporter gene and obsessive-compulsive disorder. Am J Med Genet B NeuropsychiatrGenet 2007;144(8):1027–1033. [PubMed: 17894418]
Arnold et al. Page 12
Brain Imaging Behav. Author manuscript; available in PMC 2010 October 26.
NIH
-PA Author Manuscript
NIH
-PA Author Manuscript
NIH
-PA Author Manuscript
Su AI, Cooke MP, Ching KA, Hakak Y, Walker JR, Wiltshire T, et al. Large-scale analysis of the humanand mouse transcriptomes. Proc Natl Acad Sci U S A 2002;99(7):4465–4470. [PubMed: 11904358]
Szeszko PR, Robinson D, Alvir JM, Bilder RM, Lencz T, Ashtari M, et al. Orbital frontal and amygdalavolume reductions in obsessive-compulsive disorder. Arch Gen Psychiatry 1999;56(10):913–919.[PubMed: 10530633]
Szeszko PR, MacMillan S, McMeniman M, Chen S, Baribault K, Lim KO, et al. Brain structuralabnormalities in psychotropic drug-naive pediatric patients with obsessive-compulsive disorder. AmJ Psychiatry 2004;161(6):1049–1056. [PubMed: 15169693]
Szeszko PR, Lipsky R, Mentschel C, Robinson D, Gunduz-Bruce H, Sevy S, et al. Brain-derivedneurotrophic factor val66met polymorphism and volume of the hippocampal formation. MolPsychiatry 2005;10(7):631–636. [PubMed: 15768049]
Szeszko PR, Christian C, Macmaster F, Lencz T, Mirza Y, Taormina SP, Easter P, Rose M,Michalopoulou GA, Rosenberg DR. Gray matter structural alterations in psychotropic drug-naivepediatric obsessive-compulsive disorder: an optimized voxel-based morphometry study. Am JPsychiatry 2008a;165(10):1299–307. [PubMed: 18413702]
Szeszko PR, Hodgkinson CA, Robinson DG, Derosse P, Bilder RM, Lencz T, et al. DISC1 is associatedwith prefrontal cortical gray matter and positive symptoms in schizophrenia. Biol Psychol 2008b;79(1):103–110. [PubMed: 18078707]
Tabachnik, BG.; Fidell, LS. Using Multivariate Statistics. Toronto: Allyn & Bacon; 2001.Turner JA, Smyth P, Macciardi F, Fallon JH, Kennedy JL, Potkin SG. Imaging phenotypes and genotypes
in schizophrenia. Neuroinformatics 2006;4(1):21–49. [PubMed: 16595857]Valente AA Jr, Miguel EC, Castro CC, Amaro E Jr, Duran FL, Buchpiguel CA, et al. Regional gray
matter abnormalities in obsessive-compulsive disorder: a voxel-based morphometry study. BiolPsychiatry 2005;58(6):479–487. [PubMed: 15978549]
van Grootheest DS, Cath DC, Beekman AT, Boomsma DI. Twin studies on obsessive-compulsivedisorder: a review. Twin Res Hum Genet 2005;8(5):450–458. [PubMed: 16212834]
Wechsler, DI. Examiner’s Manual: Wechsler Intelligence Scale for Children. 3. PsychologicalCorporation; New York, NY: 1991.
Welch JM, Lu J, Rodriguiz RM, Trotta NC, Peca J, Ding JD, et al. Cortico-striatal synaptic defects andOCD-like behaviours in Sapap3-mutant mice. Nature 2007;448(7156):894–900. [PubMed:17713528]
Whiteside SP, Port JD, Deacon BJ, Abramowitz JS. A magnetic resonance spectroscopy investigation ofobsessive-compulsive disorder and anxiety. Psychiatry Res 2006;146(2):137–147. [PubMed:16507346]
Willour VL, Yao Shugart Y, Samuels J, Grados M, Cullen B, Bienvenu OJ 3rd, et al. Replication studysupports evidence for linkage to 9p24 in obsessive-compulsive disorder. Am J Hum Genet 2004;75(3):508–513. [PubMed: 15272418]
Arnold et al. Page 13
Brain Imaging Behav. Author manuscript; available in PMC 2010 October 26.
NIH
-PA Author Manuscript
NIH
-PA Author Manuscript
NIH
-PA Author Manuscript
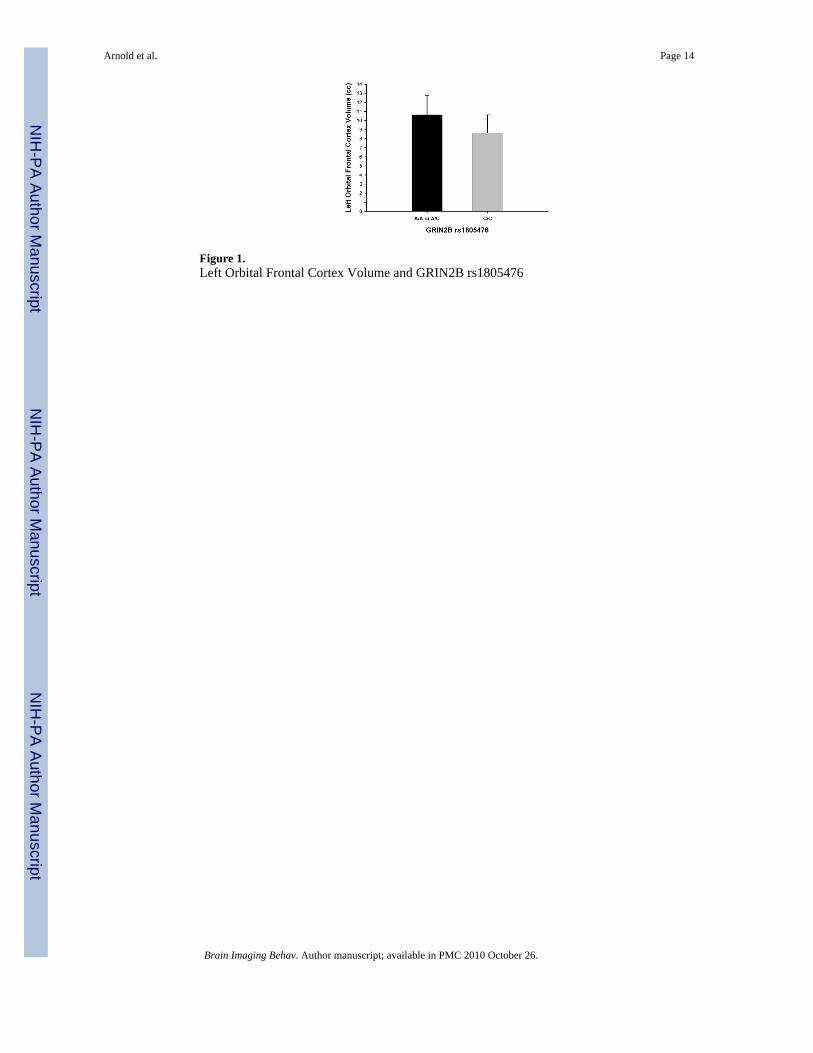
Figure 1.Left Orbital Frontal Cortex Volume and GRIN2B rs1805476
Arnold et al. Page 14
Brain Imaging Behav. Author manuscript; available in PMC 2010 October 26.
NIH
-PA Author Manuscript
NIH
-PA Author Manuscript
NIH
-PA Author Manuscript
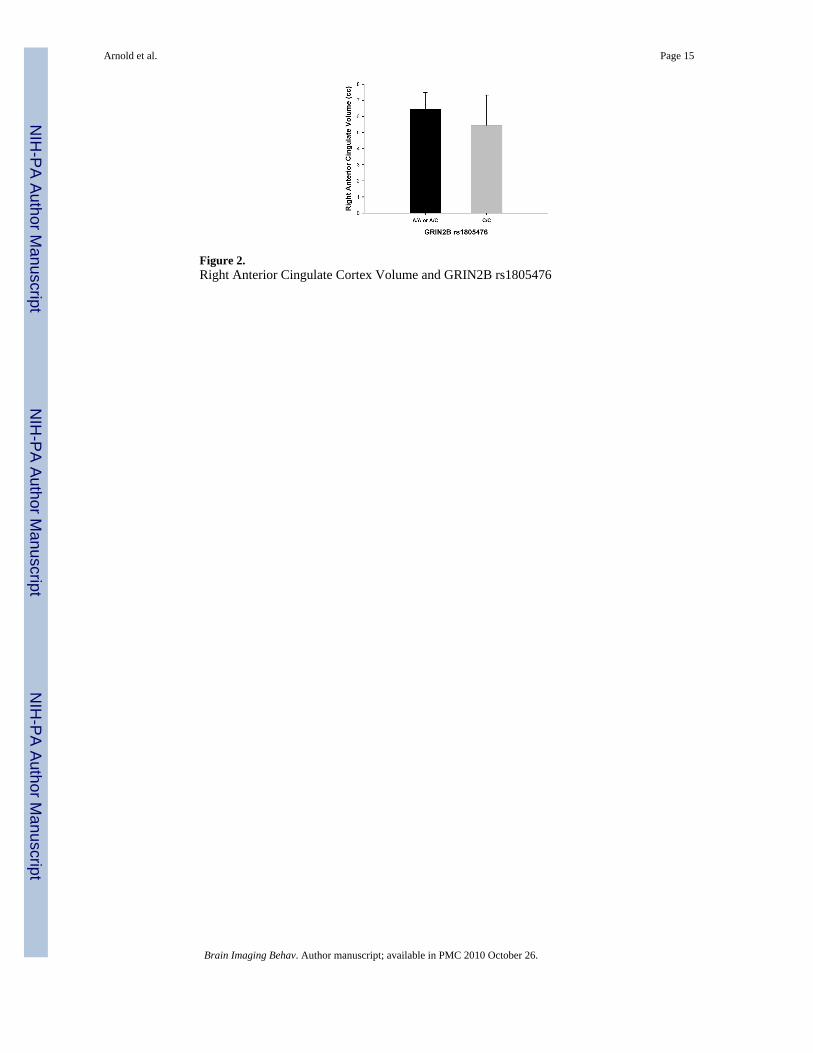
Figure 2.Right Anterior Cingulate Cortex Volume and GRIN2B rs1805476
Arnold et al. Page 15
Brain Imaging Behav. Author manuscript; available in PMC 2010 October 26.
NIH
-PA Author Manuscript
NIH
-PA Author Manuscript
NIH
-PA Author Manuscript
Figure 3.Total Thalamic Volume and SLC1A1 rs3056
Arnold et al. Page 16
Brain Imaging Behav. Author manuscript; available in PMC 2010 October 26.
NIH
-PA Author Manuscript
NIH
-PA Author Manuscript
NIH
-PA Author Manuscript
NIH
-PA Author Manuscript
NIH
-PA Author Manuscript
NIH
-PA Author Manuscript
Arnold et al. Page 17
Table 1
Single Nucleotide Polymorphisms Genotyped in GRIN2B and SLC1A1
SNP Name Position1 Minor Allele (Frequency)2 Gene region
Glutamate Receptor, Ionotropic, N-methyl-d-aspartate 2B (GRIN2B), Chromosome
12p12
Rs1019385 14026110 T (0.44) Promoter
Rs890 13606575 T (0.48) 3′-UTR
Rs1805476 13605630 A (0.38) 3′-UTR
Rs1805502 13605448 C (0.16) 3′-UTR
Solute Linked Carrier, Family 1, Member 1 (SLC1A1), Chromosome 9p24
Rs301434 4572082 T (0.43) Intron
Rs3087879 4576808 C (0.34) 3′-UTR
Rs3056 4577146 G (0.10) 3′-UTR
1The positions are from the University of California at Santa Cruz Genome Browser, March 2006 Assembly
2The minor allele frequencies are based on our previous family-based association studies (Arnold et al. 2004; Arnold et al. 2006; Arnold, 2007 and
unpublished results)
Brain Imaging Behav. Author manuscript; available in PMC 2010 October 26.
NIH
-PA Author Manuscript
NIH
-PA Author Manuscript
NIH
-PA Author Manuscript
Arnold et al. Page 18
Tabl
e 2
Orb
itofr
onta
l Cor
tex
Vol
ume
and
Gen
otyp
e
F va
lue
P va
lue
F va
lue
P va
lue
Poly
mor
phis
mG
enot
ype
NM
ean
volu
me
in c
m3 (
s.d.)
Con
trol
led
for
Age
Con
trol
led
for
Age
, Tot
al In
trac
rani
al v
olum
e
GRI
N2B
rs10
1938
5G
/G10
18.8
0 (2
.52)
0.05
0.82
0.07
0.79
G/T
or T
/T18
18.8
3 (3
.47)
rs89
0T/
T7
19.8
5 (2
.50)
0.40
0.68
0.57
0.58
T/G
1218
.85
(3.0
6)
G/G
817
.83
(3.8
7)
rs18
0547
6A
/A o
r A/C
1519
.96
(3.0
7)2.
920.
10T
1.90
.18
C/C
1217
.41
(2.7
9)
Left
OFC
1A
/A o
r A/C
1610
.64
(2.1
4)4.
850.
043.
570.
07
C/C
138.
65 (1
.97)
Righ
t OFC
A/A
or A
/C15
9.35
(1.6
4)0.
140.
710.
050.
83
C/C
128.
71 (1
.57)
rs18
0550
22T/
T18
18.8
3 (3
.48)
0.19
0.67
0.12
0.74
T/C
918
.79
(2.6
3)
SLC
1A1
rs30
1434
T/T
520
.13
(2.0
0)1.
000.
330.
410.
53
T/C
or C
/C22
18.5
8 (3
.34)
rs30
8787
9G
/G13
18.7
4 (3
.24)
0.00
0.95
0.15
0.70
G/C
or C
/C15
18.9
6 (3
.21)
rs30
56G
/G o
r G/A
1020
.13
(3.1
8)1.
780.
202.
240.
15
A/A
1618
.09
(3.0
9)
1 Seco
ndar
y an
alys
es (l
eft v
s. rig
ht) p
erfo
rmed
for O
FC b
ecau
se p
<.10
.
2 Ther
e w
ere
no C
/C in
divi
dual
s in
the
sam
ple.
T Tren
d to
war
ds st
atis
tical
sign
ifica
nce
(def
ined
as p
<.10
).
Sign
ifica
nt p
val
ues (
p<.0
5) a
re in
dica
ted
in b
old
text
.
Brain Imaging Behav. Author manuscript; available in PMC 2010 October 26.
NIH
-PA Author Manuscript
NIH
-PA Author Manuscript
NIH
-PA Author Manuscript
Arnold et al. Page 19
Tabl
e 3
Ant
erio
r Cin
gula
te C
orte
x V
olum
e an
d G
enot
ype
F va
lue
P va
lue
F va
lue
P va
lue
Poly
mor
phis
mG
enot
ype
NM
ean
volu
me
in c
m3 (
s.d.)
Con
trol
led
for
Age
Con
trol
led
for
Age
, Tot
al In
trac
rani
al v
olum
e
GRI
N2B
rs10
1938
5G
/G11
11.9
0 (1
.94)
0.01
0.93
0.44
0.51
G/T
or T
/T19
11.8
1 (2
.19)
rs89
0T/
T8
12.7
6 (1
.92)
0.87
0.43
1.32
0.29
T/G
1311
.89
(1.7
4)
G/G
811
.37
(2.3
0)
rs18
0547
6A
/A o
r A/C
1612
.57
(1.8
3)3.
300.
08T
2.16
0.15
C/C
1310
.92
(2.1
2)
Left
ACC
1A
/A o
r A/C
166.
09 (1
.82)
0.01
0.90
0.02
0.88
C/C
135.
47 (1
.44)
Righ
t AC
CA
/A o
r A/C
166.
48 (1
.01)
5.79
0.02
4.47
0.04
2
C/C
135.
45 (1
.88)
rs18
0550
23T/
T19
12.0
1 (2
.00)
0.05
0.83
0.50
0.48
T/C
1011
.94
(1.9
7)
SLC
1A1
rs30
1434
T/T
512
.16
(2.2
9)0.
070.
790.
030.
87
T/C
or C
/C24
11.9
1 (2
.01)
rs30
8787
9G
/G13
11.7
1 (2
.14)
0.02
0.90
0.05
0.82
G/C
or C
/C17
11.9
5 (2
.07)
rs30
56G
/G o
r G/A
1012
.38
(1.8
0)0.
540.
470.
550.
46
A/A
1811
.61
(2.1
3)
1 Seco
ndar
y an
alys
es (l
eft v
s. rig
ht) p
erfo
rmed
for O
FC b
ecau
se p
<.10
.
2 Leve
ne’s
test
was
sign
ifica
nt (F
=4.4
7, p
=.01
) con
sist
ent w
ith d
epar
ture
from
hom
ogen
eity
of v
aria
nce.
3 Ther
e w
ere
no C
/C in
divi
dual
s in
the
sam
ple.
T Tren
d to
war
ds st
atis
tical
sign
ifica
nce
(def
ined
as p
<.10
).
Brain Imaging Behav. Author manuscript; available in PMC 2010 October 26.

NIH
-PA Author Manuscript
NIH
-PA Author Manuscript
NIH
-PA Author Manuscript
Arnold et al. Page 20Si
gnifi
cant
p v
alue
s (p<
.05)
are
indi
cate
d in
bol
d te
xt.
Brain Imaging Behav. Author manuscript; available in PMC 2010 October 26.
NIH
-PA Author Manuscript
NIH
-PA Author Manuscript
NIH
-PA Author Manuscript
Arnold et al. Page 21
Tabl
e 4
Cau
date
Vol
ume
and
Gen
otyp
e
F va
lue
P va
lue
F va
lue
P va
lue
Poly
mor
phis
mG
enot
ype
NM
ean
volu
me
in c
m3 (
s.d.)
Con
trol
led
for
Age
Con
trol
led
for
Age
, Tot
al In
trac
rani
al v
olum
e
GRI
N2B
rs10
1938
5G
/G11
6.71
(0.6
4)3.
520.
07T
2.60
0.12
G/T
or T
/T19
7.24
(0.8
0)
Left
Cau
date
1G
/G11
3.29
(0.3
7)4.
280.
053.
170.
08
G/T
or T
/T19
3.59
(0.3
7)
Righ
t Cau
date
G/G
113.
41 (0
.31)
2.28
0.14
1.60
0.22
G/T
or T
/T19
3.65
(0.4
8)
rs89
0T/
T8
6.67
(0.6
8)1.
410.
261.
490.
25
T/G
137.
00 (0
.69)
G/G
87.
35 (0
.80)
rs18
0547
6A
/A o
r A/C
166.
94 (0
.85)
0.00
0.98
0.12
0.73
C/C
137.
15 (0
.74)
rs18
0550
22T/
T19
7.15
(0.7
4)2.
400.
131.
220.
28
T/C
106.
68 (0
.66)
SLC
1A1
rs30
1434
T/T
56.
82 (0
.60)
0.70
0.41
1.26
0.27
T/C
or C
/C24
7.13
(0.8
1)
rs30
8787
9G
/G13
7.05
(0.8
3)0.
040.
840.
000.
99
G/C
or C
/C17
7.04
(0.7
7)
rs30
56G
/G o
r G/A
106.
82 (0
.82)
1.12
0.30
1.21
0.28
A/A
187.
21 (0
.76)
1 Seco
ndar
y an
alys
es (l
eft v
s. rig
ht) p
erfo
rmed
for C
auda
te b
ecau
se p
<.10
.
2 Ther
e w
ere
no C
/C in
divi
dual
s in
the
sam
ple.
T Tren
d to
war
ds st
atis
tical
sign
ifica
nce
(def
ined
as p
<.10
).
Sign
ifica
nt p
val
ues (
p<.0
5) a
re in
dica
ted
in b
old
text
.
Brain Imaging Behav. Author manuscript; available in PMC 2010 October 26.

NIH
-PA Author Manuscript
NIH
-PA Author Manuscript
NIH
-PA Author Manuscript
Arnold et al. Page 22
Tabl
e 5
Thal
amus
Vol
ume
and
Gen
otyp
e
F va
lue
P va
lue
F va
lue
P va
lue
Poly
mor
phis
mG
enot
ype
NM
ean
volu
me
in c
m3 (
s.d.)
Con
trol
led
for
Age
Con
trol
led
for
Age
, Tot
al In
trac
rani
al v
olum
e
GRI
N2B
rs10
1938
5G
/G11
7.88
(1.8
3)0.
380.
540.
300.
59
G/T
or T
/T20
8.20
(1.6
8)
rs89
0T/
T8
7.94
(2.3
5)0.
490.
620.
480.
62
T/G
138.
16 (1
.58)
G/G
98.
30 (1
.40)
rs18
0547
6A
/A o
r A/C
168.
47 (2
.02)
0.01
0.94
0.00
0.98
C/C
147.
82 (1
.19)
rs18
0550
21T/
T20
8.28
(1.4
5)0.
950.
340.
760.
39
T/C
107.
87 (2
.21)
SLC
1A1
rs30
1434
T/T
57.
52 (0
.96)
0.90
0.35
0.83
0.37
T/C
or C
/C25
8.27
(1.8
1)
rs30
8787
9G
/G14
7.75
(1.4
7)0.
480.
490.
400.
53
G/C
or C
/C17
8.37
(1.8
9)
rs30
56G
/G o
r G/A
107.
33 (1
.40)
7.58
0.01
7.25
0.01
A/A
198.
62 (1
.76)
Left
thal
amus
2G
/G o
r G/A
103.
71 (0
.63)
6.40
0.02
6.16
0.02
A/A
194.
29 (0
.91)
Righ
t tha
lam
usG
/G o
r G/A
103.
69 (0
.92)
6.29
0.02
6.18
0.02
A/A
194.
33 (0
.88)
1 Ther
e w
ere
no C
/C in
divi
dual
s in
the
sam
ple.
2 Seco
ndar
y an
alys
is o
f lef
t and
righ
t tha
lam
us v
olum
es p
erfo
rmed
sinc
e to
tal t
hala
mus
vol
ume
sign
ifica
ntly
diff
eren
t bet
wee
n ge
noty
pe g
roup
s.
Sign
ifica
nt p
val
ues (
p<.0
5) a
re in
dica
ted
in b
old
text
Brain Imaging Behav. Author manuscript; available in PMC 2010 October 26.