predicted pressures in a hopper with a shallow inclination angle
TRANSCRIPT

1
Normal pressures and frictional tractions on shallow conical hopper walls after concentric filling: predictions and experiments
S. Ding a, b 1
, J.M. Rotter c, J.Y. Ooi
c , G. Enstad
d and D. Xu
b
a. Faculty of Engineering & Science, University of Agder, Grimstad and POSTEC of Tel-Tek, Porsgrunn,
Norway
b. School of Material Science & Engineering , University of Architecture and Technology, Yangta Road
13, 710055, Xian, China
c. Institute for Infrastructure and Environment, School of Engineering, University of Edinburgh,
Edinburgh, EH9 3JY, Scotland
d. Department of Process Technology, Telemark University College, Kjølnes Ring 38, 3914 Porsgrunn,
Norway
Abstract A silo with a shallow hopper is designed to achieve the required silo capacity when the
headroom available is limited, provided that the issue of segregation of stored particulate solids is not a
problem. Several analytical models have been proposed to try to predict the design loads for such shallow
silo hoppers to guarantee their structural integrity. In this study, a novel finite element analysis has been
conducted to explore the development of pressures and tractions on the wall of a full scale shallow hopper
when it is filled with sand. Simple meshes were used to represent the sand and the hopper wall. Coulomb
friction modelled the interaction between the sand and the wall. The process of progressive filling was
simulated by temporarily suspending and then re-activating appropriate parts of the mesh. The two
computational models of “switched-on filling” and “progressive-filling” were used to determine whether
1 Corresponding author; telephone: +47 35574004; email: [email protected]
brought to you by COREView metadata, citation and similar papers at core.ac.uk
provided by Agder University Research Archive
2
this simple treatment of the deposition process makes a significant difference to the predicted forces on the
hopper wall: it is evident that progressive filling produces some significant changes that lead to more
realism. Experiments were also conducted that measured local pressures on the shallow hopper wall under
axisymmetric filling with sand. Comparisons between the numerical predictions, the measurements and
existing algebraic models are presented. The results show clearly that wall friction is not fully developed
in a shallow hopper, and that one algebraic model captures the behaviour well. However, the results also
show that this problem is quite complicated and worthy of further study.
Keywords Particulate solids; hopper pressures; shallow hopper; FEM simulation; silo loads;
experimental verification.
1 Introduction
Silos are manufactured in several different forms, and used to store and discharge a great variety of
different particulate solids. Although the geometric form may appear to be quite simple: a vertical section
with either a steep or shallow hopper beneath it, both different solids and different silo geometries produce
significant complexity in both the pattern of solids flow and the pressures exerted on the hopper wall.
Depending on the inclination of the hopper to the vertical, the stored solid will discharge in either a mass
flow or a funnel flow mode. As described by Rotter (2001) and adopted into the European standard
EN 1991-4 (2006), funnel flow can also take a number of different forms. The funnel flow mode is most
likely to occur when the hopper slope has a low angle to the horizontal (Jenike, 1964, 1987; Drescher,
1992,1998; Rotter, 2001), which is termed shallow. Although a considerable research effort has addressed
the challenge of predicting the flow mode for a given solid and silo geometry, it remains very difficult to
predict the shape of the flow channel boundary between flowing and stationary solid (Rotter, 2001; Rotter
3
et al. 1998; Nedderman, 1992). Even under symmetrical conditions, such a prediction is needed to
determine the pattern of pressures that will occur during discharge, which can differ by a factor of 2 or
more depending on the flow pattern. The stresses developing in a conical hopper structure depend
significantly on the pattern of pressures on the hopper wall, and several potential modes of failure exist
(Rotter, 2001). A proper assessment of the structural integrity of the hopper may therefore depend on the
pattern of solids flow.
A silo may be designed to have a shallow hopper if the available headroom is only limited. This
arrangement achieves a high volumetric capacity without the total height of the silo being large. A
shallow hopper may also be chosen to avoid abrasive particulate solids sliding against the wall, since the
flow mode will normally be internal. However, a shallow hopper should not be used if segregation of the
stored solid may cause process problems.
Experimental silos are used to study discharge processes and pressures, so a hopper is normally
required as part of a silo in both experimental and theoretical research studies. Except in very slender silos,
the hopper supports the majority of the weight of stored solid (Rotter, 2001), so the loading on it is
important for structural integrity assessments. However, the pressures on the hopper wall change from the
condition after filling to that during discharge (Walker, 1966; Jenike et al., 1973; Walters, 1973; Enstad,
1975; Rotter, 1999, 2001; EN 1991-4, 2006) and this has a significant impact on the structural design of
the hopper (Teng and Rotter, 1991).
The process of filling material into a hopper involves both piling particles into a heap and flow
down the established surface (Zhong et al., 2001; Vanel et al. 2000; Khakher et al. 2001; Campbell, 2006).
Within the pile, the distribution of stresses is anisotropic in nature, and develops progressively (Bater and
Behringer, 1989; Ristow and Herrmann, 1995; Feise and Schwedes, 1998; Anad and Gu, 2000; Socolar et
al. 2002; Otto et al., 2003). This stress field transmits forces to the silo or hopper wall as filling progresses.
4
It has long been understood that the filling process has a significant effect on the flow pattern during
discharge (Wright, 1979; Rotter, 1999, 2001; Vanel et al. 2000; Zhong et al., 2001). At the onset of
discharge, the pattern of stresses in the solid changes and progressively evolves further during the process
of discharge. These changes are significantly influenced by the pattern of stresses developed during filling.
Thus, an accurate determination of the stress patterns in the granular material as a result of the filling
process is critically important. There is strong evidence that shows that the pressures exerted on a hopper
after filling are more critical to the structural integrity of the hopper than the discharge pressures (Rotter,
1986; Teng and Rotter, 1991; Zhong et al., 2001). This paper therefore consequently focuses on the loads
applied by the stored solid to the wall of a shallow hopper during the filling process.
Traditional attempts to predict the pressures exerted on the walls of silos began with the classical
algebraic analysis of Janssen (1895), which applies to material in the cylindrical section of a silo. This
analysis examines the vertical equilibrium of a slice of stored solid and derives the differential equation for
its state. To produce a useful solution, two assumptions are then made: a) the ratio of the average
horizontal pressure against the wall to the average vertical stress over a horizontal section is constant
throughout the silo height; the value of this constant depends on whether the material is freshly deposited
or discharging (Rotter, 2008), sometimes imagined to be in a Rankine active state or passive state
(Nedderman, 1992); and b) the wall friction is fully mobilised and remains constant throughout the whole
silo height, a condition which may be met if the wall is uniform and the hopper is steep (Rotter, 2001;
Ding et al., 2011). Different authors later derived the corresponding differential equation for a slice in a
linearly tapering channel, which could be either conical or wedged-shaped (Dabrowski, 1957; Walker,
1966; Walters, 1973; McLean and Arnold, 1976; Enstad, 1981, 1975). Most of these theories used the
slice treatment of Janssen, but they then made different assumptions concerning the evaluation of the ratio
of wall pressures to vertical pressures. In general, these theories appear to match experimental data
5
reasonably well for hoppers that are steep, since the solid slides down the wall as the material below it
compresses slightly, ensuring that the friction coefficient between the solid and the wall is fully developed.
However, in a shallow hopper, which is the subject of this study, Rotter (1999, 2001) proposed that the
above slice models, which all assumed full development of the wall friction, should be amended by using
an effective hopper wall friction coefficient (eff) because the solid is no longer sliding against the surface.
He produced a criterion to distinguish between "steep" and "shallow" hoppers, which gives a smooth
transition between the two cases. However, this theory still lacks satisfactory convincing verification at
the present time. This study investigates this concept.
The pressures imposed on the wall of a shallow hopper during and after filling are investigated
here to provide some evidence to either justify or disprove this effective wall friction coefficient proposal.
Since the classical theories are all based on treating the stored solid as a continuum, it is quite appropriate
to adopt that assumption, so a finite element analysis is used. Finite element modelling of granular solids
has been very widely and successfully used in the field of geomechanics, so its relevance is not in doubt.
It has also been used to determine the pressures on hopper walls (Haussler and Eibl, 1984; Ooi and Rotter,
1990, 1991; Meng et al., 1997; Rotter et al., 1998; Holst et al. 1999; Hjelmstad and Taciroglu, 2000;
Keiter and Rombach, 2001). In the present study, the development of pressures on the wall of a shallow
hopper was studied during the filling phase. A novel progressive filling computational technique was used,
implemented into the commercial software ABAQUS (2004), to predict both the normal pressures and the
frictional tractions on the hopper wall (Ding et al. 2011; Ding et al., 2003; Ding, 2004). The resulting
numerical predictions are compared with the analytical predictions of the classical theories for hopper wall
pressures using an adopted effective friction coefficient (eff). Experiments on sand in a small full-scale
hopper were carried out to measure local pressure magnitudes on the wall of a shallow hopper to test the
numerical predictions. Comparisons were then drawn between the predicted and measured pressures and
6
the mobilised friction.
2 Numerical modelling and predictions
The axisymmetric shallow conical hopper chosen for this study had been used in an experiment on
hopper flow and pressures. It was made of stainless steel plate, 6 mm in thickness. It had a 45 half angle,
was 1210 mm high with an upper diameter of 2520 mm and a 100 mm diameter outlet. The hopper aspect
ratio h/r was therefore 1.0, where h is the height from cone apex to the top and r is the maximum radius
and its maximum radius to thickness ratio was r/t = 210. The stored solid (dry sand) was filled into the
conical hopper from a fixed height on the hopper axis, piling up as an axisymmetric cone at the natural
repose angle under concentric filling (Fig. 1). The results of the experiment are described later.
2.1 Finite element formulation
The finite element package Abaqus (2004) was used to perform the finite element calculations. The
finite element model used a Lagrangian frame and was created to represent both the shallow hopper
structure and its stored sand. The hopper wall was represented as an axisymmetric shell using SAX2
elements (3-node quadratic element with 3 dof/node). The sand was represented by the continuum
axisymmetric element CAX8R (8-node bi-quadratic axisymmetric quadrilateral with reduced integration).
The hopper structure was constrained horizontally and vertically at the top edge and horizontally at the
bottom edge. The boundary of the stored sand was constrained vertically at the outlet, corresponding to a
closed outlet, but its other edges were free. Nonlinear convergence was achieved by the Newton-Raphson
algorithm. A default tolerance of 10-5 was used for both stress and deformation convergence. Further
details may be found elsewhere (Ding et al. 2011; Ding et al., 2003; Ding, 2004).
The hopper structure was assumed to be weightless, elastic and isotropic with a Young's modulus
of Ew = 2.0 x 10¹¹
Pa and a Poisson's ratio w = 0.30. The stored sand was modelled as an elasto-plastic
7
continuum, using associated flow and the Mohr-Coulomb failure criterion. Whilst this is a very simple
model for sand, it is believed to be adequate to capture the essential characteristics of the behaviour in the
present case. It is also justifiable because it can give an appropriate correlation with the classical theories
developed in the past. Other models, including Drucker-Prager and plasticity/creep were also explored by
no significant difference was found in the outcome of the present calculations, which have previously been
found to be insensitive to the choice of constitutive model (Ooi and Rotter, 1989).
The sand was subject only to gravity loading, with no external pressure applied to the upper
surface. The interaction between the wall and the stored solid was characterised by a stick-slip
representation with a single value for the fully developed wall friction coefficient using the Coulomb
friction model (Ooms and Roberts, 1985; Ooi and Rotter, 1991; Heege et al., 2003; Siavoshi et al., 2006;
Evesque and Adjemian, 2002; Qu et al., 2001; Schwedes, 2003). This stick-slip model is particularly
important in the present study because the stored solids may not slip against the hopper wall in a shallow
hopper even though shear forces are transmitted through the interface (Rotter, 2001; 2008).
The pressures applied by the solid to the hopper wall may depend on the process of filling. The
reason is that new material deposited at the surface is essentially stress-free, but it lands on a body of
material that is already stressed and consequently already deformed. If the entire body is assumed to be in
existence and stress free before loading is applied to simulate gravity, the residual stresses arising from the
progressive filling process are all omitted. The existing literature is unclear on whether these residual
stresses can make a significant difference to the hopper pressure pattern, or to the wall friction
development (slipping) or not. Two loading methods were therefore used in the present calculations:
“switched-on” filling, in which gravity is applied everywhere to an unstressed body, and “progressive”
filling, as outlined below.
The following method was used to simulate the filling process progressively (Ding et al., 2011;
8
Ding et al., 2003; Ding, 2004). The surface was assumed to be inclined at a single slope at the angle of
repose, which was taken as identical to the angle of internal friction. Symmetry was assumed down the
vertical axis in the hopper. The stored solid in one half was then partitioned into regions. In each
partitioned region, the mesh, stored solid weight and the contacting interactions between the stored solids
and wall were defined, but these were inactivated and suspended at the beginning of the analysis. They
were to be progressively reactivated during the analysis.
The region representing the sand (Feil! Fant ikke referansekilden.Fig. 1) was divided into eight
segments, each with an equal length of hopper wall contact, and bounded by lines parallel to the inclined
repose surface. These segments each had the same thickness and depth, but they had very different
volumes.
Fig. 1Layered segments used in the finite element representation
By reintroducing the suspended parts of the mesh and reactivating gravity on them in the natural
progression from the base to the top, concentric progressive filling was simulated. It was assumed that
each new layer was placed on the previous stressed layer without impact and without initial stress.
2.2 Choice of parameter values
The stored sand was modelled as an ideal elasto-plastic solid with the Mohr-Coulomb failure
criterion. The key parameters required for this model are Young’s modulus Em, Poisson's ratio m, the unit
weight of the sand (represented by its density ) and the angle of internal friction . The value of
Young's modulus Em = 155 kPa was taken from Hjelmstad and Taciroglu (2000). A much lower value
(55 kPa) was also used to provoke more significant deformations in the stored solids, but the reader will
9
see that this was not necessary. It may be noted, however, that measurements on sand (Green and
Fielding, 2007) have produced stress-dependent values that lie around 2000 to 4000 kPa at low stress
levels. This difference can account for some of the findings seen later in the paper. The value for
Poisson’s ratio m was derived from the conventional description of lateral pressure ratio k (Jaky, 1948) as:
k = 1– sin (1)
combined with the lateral pressure ratio from axisymmetric elasticity theory, Ooi and Rotter
(1991):
k = m / (1 – m) (2)
which gives
sin2
sin1
m
(3)
This relationship was also quoted by Qu et al. (2001). The values of properties were measured in
the laboratory and are listed in Table 1.
Table 1 Values of parameters chosen for the constitutive model
Density (kg/m3): 1370 Internal friction angle (degrees): 36
Elastic modulus Em (kPa): 155 Wall friction angle m (degrees): 21.8
Wall friction coefficient = 0.40
Poisson’s ratio m : 0.26 Mohr-Coulomb model parameters , c
(degrees, kPa ): 36.0, 0
The elastic modulus is an approximate value and is known to be stress-dependent, but the outcome
of these calculations does not appear to be sensitive to the chosen figure.
10
2.3 Loads on the hopper wall from “switched-on” and “progressive” filling
The pressures and frictional tractions applied by the stored solid to the hopper structure were all
obtained from the calculated stress state in the contact elements. This provides the clearest indication of
the forces acting between these two bodies.
The pressures on the hopper wall were calculated using both “switched-on” filling and
“progressive” filling. For switched-on filling, all eight segments were reactivated simultaneously and all
wall contacts were reintroduced together, but gravity was incremented to provide an appropriate load path.
At the end of gravity implementation, the contact forces between the stored solid and hopper wall were
interpreted as normal pressure and frictional traction on the hopper wall. The predicted distribution of
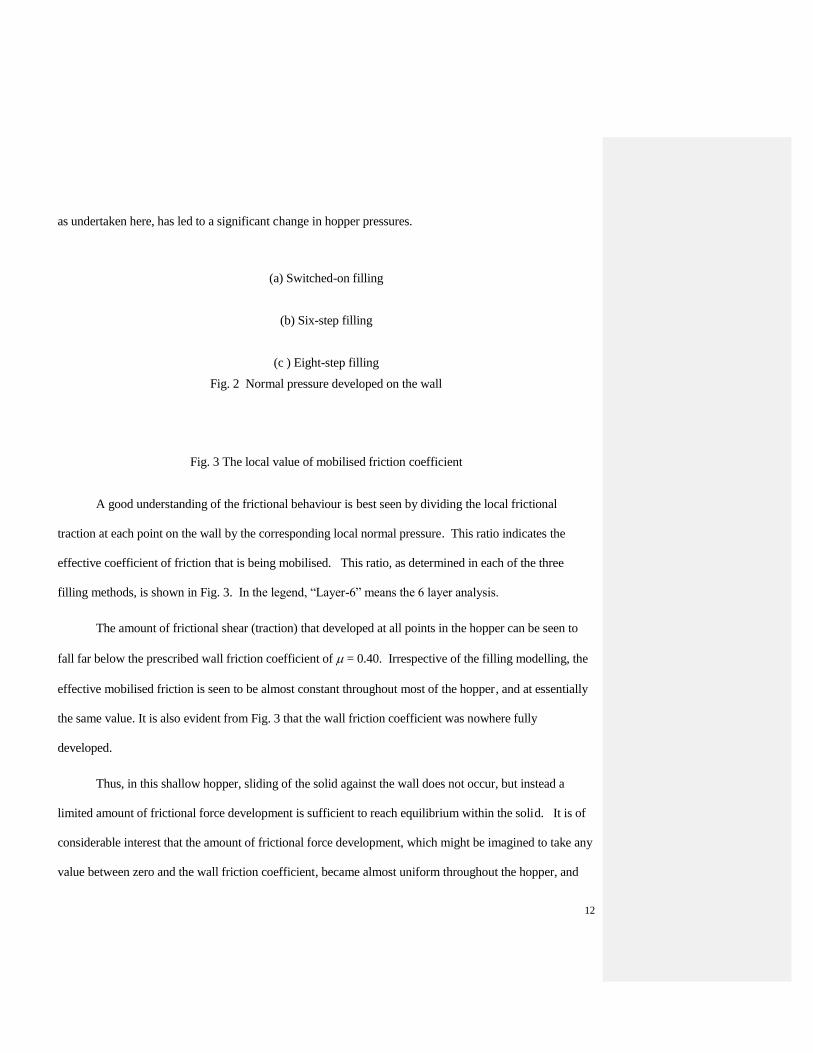
normal pressures is shown in Fig. 2(a).
Under progressive filling, both a six-step and an eight-step procedure were performed and the
results compared to determine whether this choice is critical. In the six-step procedure, producing 6 layers,
elements were reactivated from Segment 1 to Segment 8, but Segments 3 and 4 and Segments 5 and 6
were reactivated simultaneously. In the eight-step procedure, producing 8 layers, the elements in each
segment were reactivated one at a time in strict sequence. The normal pressure patterns on the hopper wall
are shown in Fig. 2, with switched-on filling in Fig. 2(a), the progressive development of pressures from
six-step progressive filling in Fig. 2(b) and from eight-step progressive filling in Fig. 2(c). The legends in
these figures are a little obscure, but it should be noted that pre_l6_4 indicates a 6 layer analysis and the
result after the fourth layer has been implemented.
The predictions of the development of pressures under progressive filling all show some local
numerical errors in their detail, but the overall pattern can be seen to be similar for all the predictions. The
form of all the pressure patterns corresponds well to the classical form of expected pressures in hoppers,
11
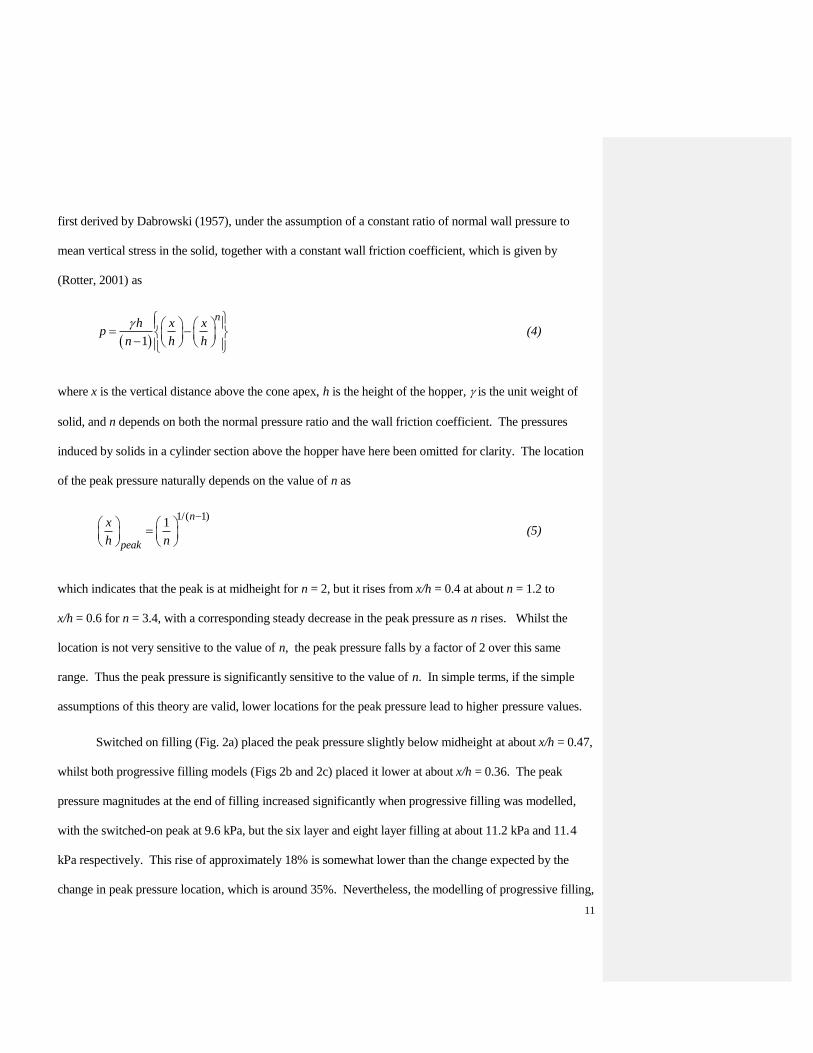
first derived by Dabrowski (1957), under the assumption of a constant ratio of normal wall pressure to
mean vertical stress in the solid, together with a constant wall friction coefficient, which is given by
(Rotter, 2001) as
1
nh x x
pn h h
(4)
where x is the vertical distance above the cone apex, h is the height of the hopper, is the unit weight of
solid, and n depends on both the normal pressure ratio and the wall friction coefficient. The pressures
induced by solids in a cylinder section above the hopper have here been omitted for clarity. The location
of the peak pressure naturally depends on the value of n as
1/( 1)1
n
peak
x
h n
(5)
which indicates that the peak is at midheight for n = 2, but it rises from x/h = 0.4 at about n = 1.2 to
x/h = 0.6 for n = 3.4, with a corresponding steady decrease in the peak pressure as n rises. Whilst the
location is not very sensitive to the value of n, the peak pressure falls by a factor of 2 over this same
range. Thus the peak pressure is significantly sensitive to the value of n. In simple terms, if the simple
assumptions of this theory are valid, lower locations for the peak pressure lead to higher pressure values.
Switched on filling (Fig. 2a) placed the peak pressure slightly below midheight at about x/h = 0.47,
whilst both progressive filling models (Figs 2b and 2c) placed it lower at about x/h = 0.36. The peak
pressure magnitudes at the end of filling increased significantly when progressive filling was modelled,
with the switched-on peak at 9.6 kPa, but the six layer and eight layer filling at about 11.2 kPa and 11.4
kPa respectively. This rise of approximately 18% is somewhat lower than the change expected by the
change in peak pressure location, which is around 35%. Nevertheless, the modelling of progressive filling,
12
as undertaken here, has led to a significant change in hopper pressures.
(a) Switched-on filling
(b) Six-step filling
(c ) Eight-step filling
Fig. 2 Normal pressure developed on the wall
Fig. 3 The local value of mobilised friction coefficient
A good understanding of the frictional behaviour is best seen by dividing the local frictional
traction at each point on the wall by the corresponding local normal pressure. This ratio indicates the
effective coefficient of friction that is being mobilised. This ratio, as determined in each of the three
filling methods, is shown in Fig. 3. In the legend, “Layer-6” means the 6 layer analysis.
The amount of frictional shear (traction) that developed at all points in the hopper can be seen to
fall far below the prescribed wall friction coefficient of = 0.40. Irrespective of the filling modelling, the
effective mobilised friction is seen to be almost constant throughout most of the hopper, and at essentially
the same value. It is also evident from Fig. 3 that the wall friction coefficient was nowhere fully
developed.
Thus, in this shallow hopper, sliding of the solid against the wall does not occur, but instead a
limited amount of frictional force development is sufficient to reach equilibrium within the solid. It is of
considerable interest that the amount of frictional force development, which might be imagined to take any
value between zero and the wall friction coefficient, became almost uniform throughout the hopper, and
13
reached a very similar value in all three models at around 0.31 to 0.33. Thus the concept of a single
“mobilised friction coefficient” throughout a hopper, proposed by Rotter (1999, 2001) for shallow
hoppers, appears to be significantly borne out by these calculations.
There are slight deviations from this simple single value. When the filling process was modelled
as switched-on, a local high value of friction coefficient, nearly rising to the prescribed value of = 0.40,
is predicted near the top of the hopper. By contrast, both progressive filling calculations show the opposite
tendency, with declining friction development near the surface. This latter is to be expected by the very
small deformations experienced by the last deposited material, because it is only deformed under its own
weight and not compressed further by any surcharge above it. It is possible that these findings depend
somewhat on the model that is used for the wall friction, but an understanding of the mechanics suggests
that these findings are likely to be reasonably robust.
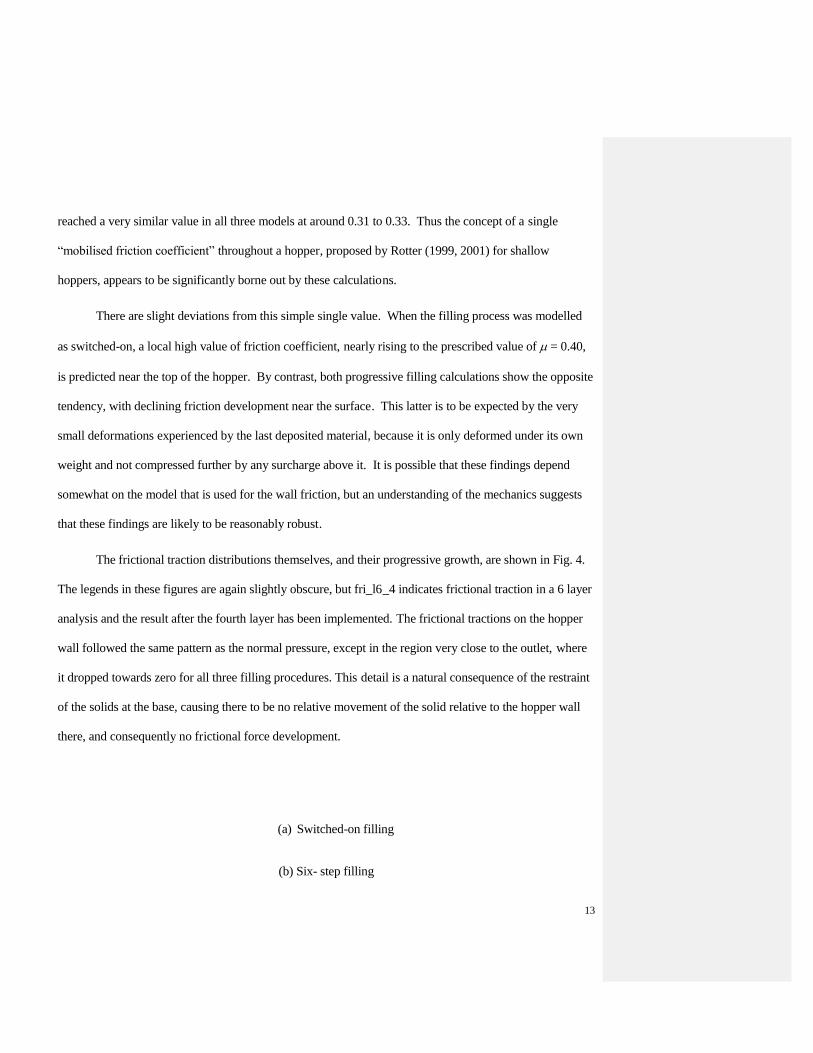
The frictional traction distributions themselves, and their progressive growth, are shown in Fig. 4.
The legends in these figures are again slightly obscure, but fri_l6_4 indicates frictional traction in a 6 layer
analysis and the result after the fourth layer has been implemented. The frictional tractions on the hopper
wall followed the same pattern as the normal pressure, except in the region very close to the outlet, where
it dropped towards zero for all three filling procedures. This detail is a natural consequence of the restraint
of the solids at the base, causing there to be no relative movement of the solid relative to the hopper wall
there, and consequently no frictional force development.
(a) Switched-on filling
(b) Six- step filling
14
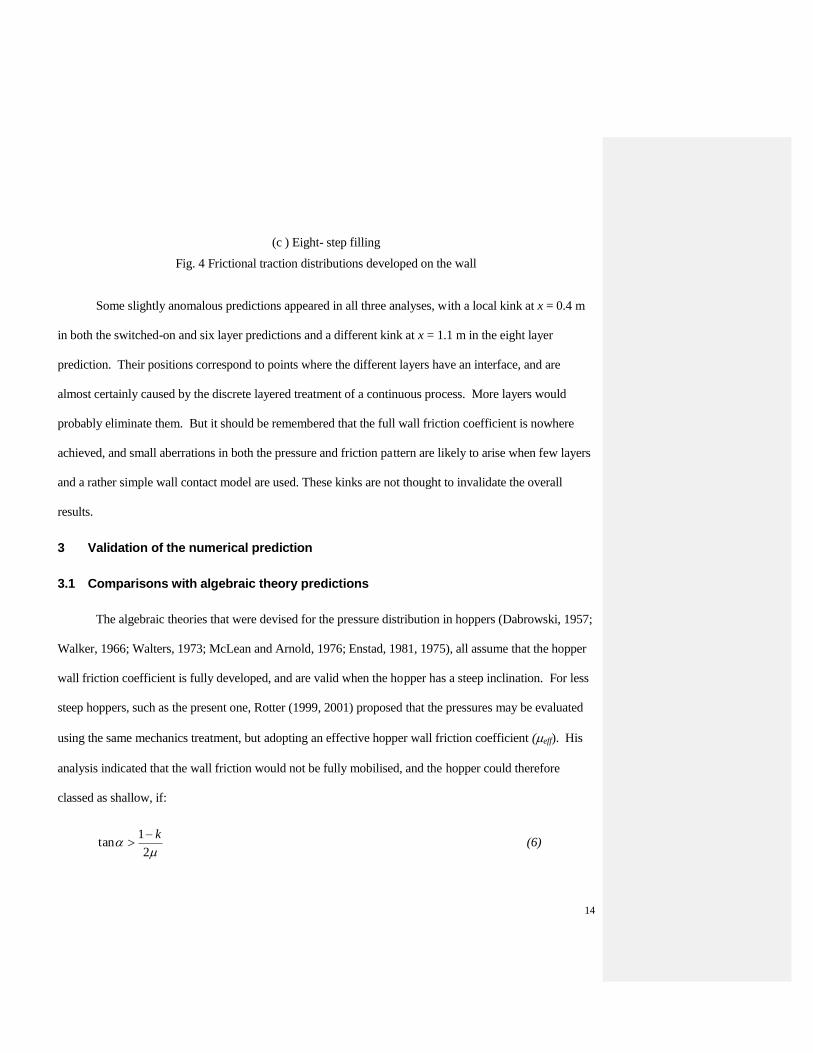
(c ) Eight- step filling
Fig. 4 Frictional traction distributions developed on the wall
Some slightly anomalous predictions appeared in all three analyses, with a local kink at x = 0.4 m
in both the switched-on and six layer predictions and a different kink at x = 1.1 m in the eight layer
prediction. Their positions correspond to points where the different layers have an interface, and are
almost certainly caused by the discrete layered treatment of a continuous process. More layers would
probably eliminate them. But it should be remembered that the full wall friction coefficient is nowhere
achieved, and small aberrations in both the pressure and friction pattern are likely to arise when few layers
and a rather simple wall contact model are used. These kinks are not thought to invalidate the overall
results.
3 Validation of the numerical prediction
3.1 Comparisons with algebraic theory predictions
The algebraic theories that were devised for the pressure distribution in hoppers (Dabrowski, 1957;
Walker, 1966; Walters, 1973; McLean and Arnold, 1976; Enstad, 1981, 1975), all assume that the hopper
wall friction coefficient is fully developed, and are valid when the hopper has a steep inclination. For less
steep hoppers, such as the present one, Rotter (1999, 2001) proposed that the pressures may be evaluated
using the same mechanics treatment, but adopting an effective hopper wall friction coefficient (eff). His
analysis indicated that the wall friction would not be fully mobilised, and the hopper could therefore
classed as shallow, if:
2
1tan
k (6)
15
where is the hopper apex half angle, k the lateral pressure ratio in a vertical walled section and is the
hopper wall friction coefficient. He proposed that the “effective hopper wall friction coefficient” (eff ) for
imperfect mobilisation of the wall friction would be:
tan2
1 keff
(7)
where the value of k is often quoted as being between 0.3 and 0.4 for many solids (Jenike, 1964; Walker,
1966; Koenen, 1895). However, it may be better represented by the treatment of Jaky (1948) (Eq. 1), or its
slight adjustment to account for differences between the shear in a silo and its absence in a testing cell,
implemented in EN 1991-4 (2006) to:
k = 1.1(1– sin) (8)
When finite element calculations are undertaken, k is no longer a primary parameter, but must be
derived from the adopted Poisson’s ratio, as given by Eq. 2. For comparison purposes, Eq. 2 was used
here, leading to k = 0.35. Adopting this value, with the hopper half angle of = 45, Eq. 6 predicts that
the hopper is shallow, and the effective mobilised friction coefficient predicted by Eq. 7 is found to be
eff = 0.325. This value is in remarkable agreement with the finite element predictions shown in Fig. 4
Adopting this effective hopper wall friction coefficient (eff = 0.325), comparisons of the wall
pressure distributions on this shallow hopper were next made between the algebraic formulas devised by
different authors and the finite element predictions. The results are shown in Fig. 5
Fig. 5 Alternative predicted pressures on the shallow hopper wall
It is evident that the different theories suggest quite different pressure values and distributions, and
none agree particularly well with the finite element analyses from either progressive or switched-on filling.
16
However, of these algebraic models, Rotter’s theory (2001), which has been adopted directly into the
Eurocode EN 1991-4 (2006) seems to be the closest, and lies between those for switched-on and
progressive filling. Further validation must come from the results of experiments.
3.2 Experimental validation
3.2.1 Experimental arrangement and measurements
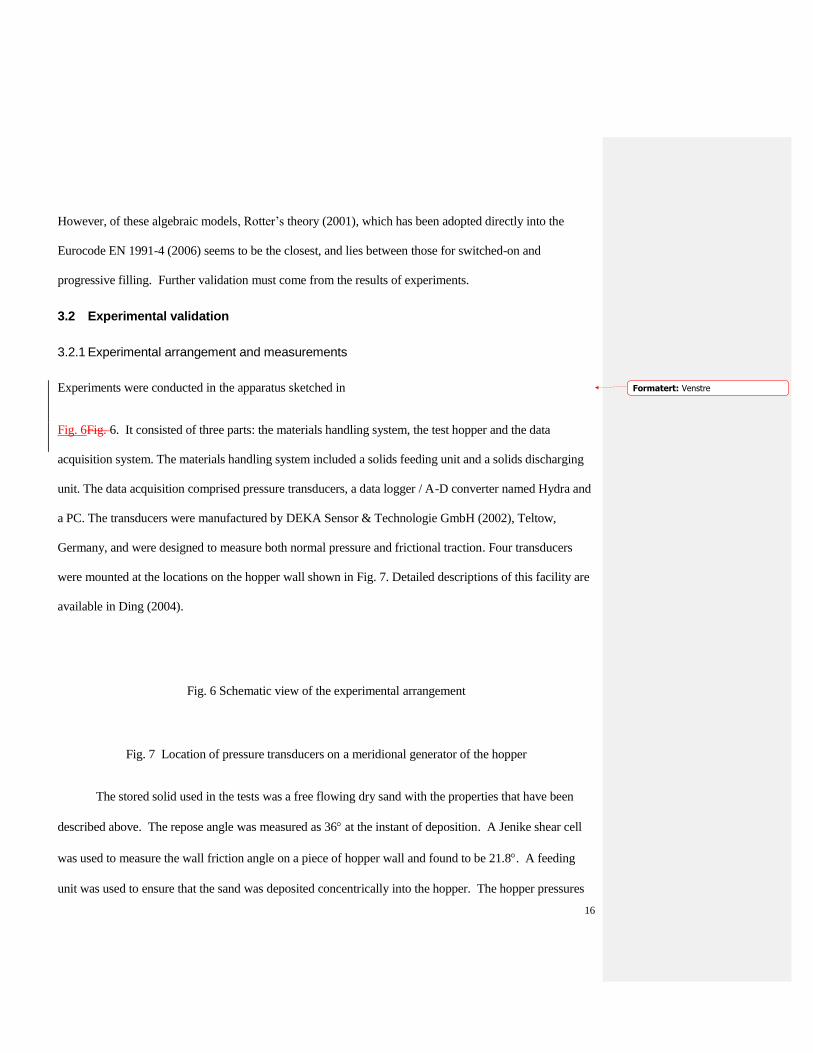
Experiments were conducted in the apparatus sketched in
Fig. 6Fig. 6. It consisted of three parts: the materials handling system, the test hopper and the data
acquisition system. The materials handling system included a solids feeding unit and a solids discharging
unit. The data acquisition comprised pressure transducers, a data logger / A-D converter named Hydra and
a PC. The transducers were manufactured by DEKA Sensor & Technologie GmbH (2002), Teltow,
Germany, and were designed to measure both normal pressure and frictional traction. Four transducers
were mounted at the locations on the hopper wall shown in Fig. 7. Detailed descriptions of this facility are
available in Ding (2004).
Fig. 6 Schematic view of the experimental arrangement
Fig. 7 Location of pressure transducers on a meridional generator of the hopper
The stored solid used in the tests was a free flowing dry sand with the properties that have been
described above. The repose angle was measured as 36 at the instant of deposition. A Jenike shear cell
was used to measure the wall friction angle on a piece of hopper wall and found to be 21.8. A feeding
unit was used to ensure that the sand was deposited concentrically into the hopper. The hopper pressures
Formatert: Venstre
17
were therefore also assumed to be very close to axisymmetric, so it was believed that measurements on a
single meridional generator would be sufficient to describe the full wall pressure distribution (Ding, 2004).
Three repetitions of the same experiment were carried out, and the pressures on the four
transducers M1 to M4 were measured throughout the filling process. The measured pressures at the end of
each of the three tests are shown in Table 2, together with the mean value and the coefficient of variation
derived from the three tests. The coefficient of variation illustrates the fact that the small pressures
towards the solid surface are much more variable than those in the main body of the hopper (Fig. 7).
Moreover, the repeated tests illustrate the fact that it is not really justifiable to quote more than two
significant figures when reporting hopper pressures, even from the same apparatus with the same
materials.
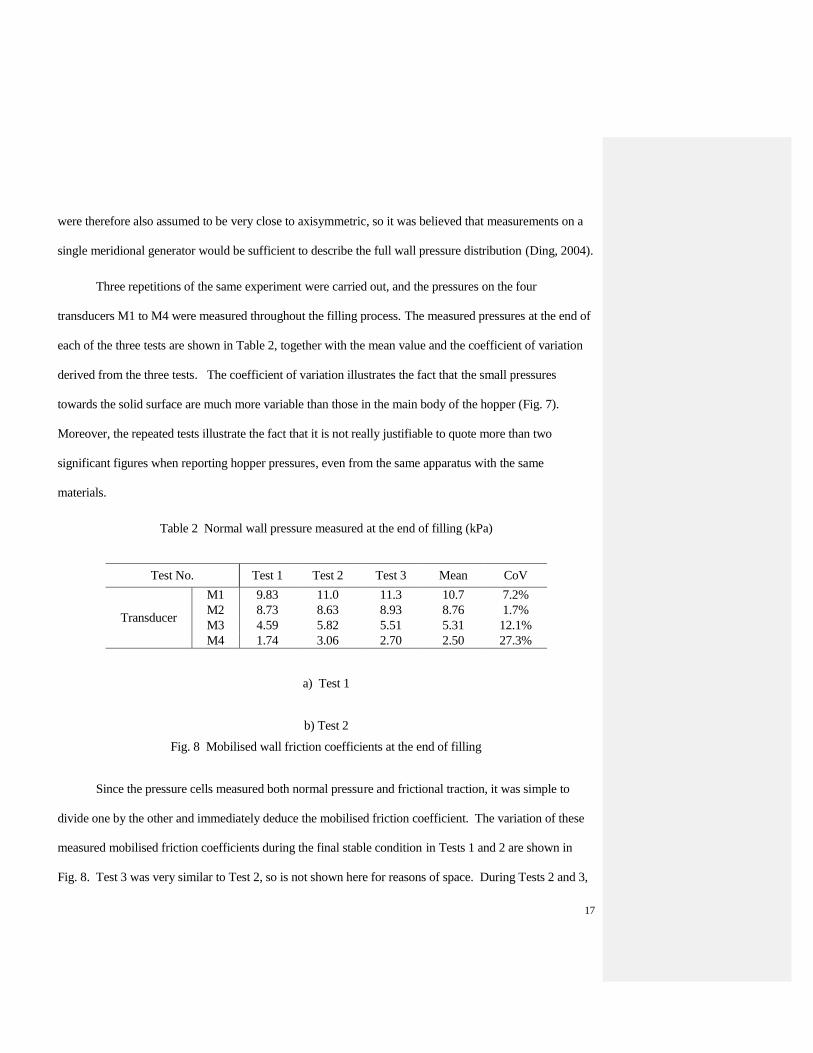
Table 2 Normal wall pressure measured at the end of filling (kPa)
Test No. Test 1 Test 2 Test 3 Mean CoV
Transducer
M1 9.83 11.0 11.3 10.7 7.2%
M2 8.73 8.63 8.93 8.76 1.7%
M3 4.59 5.82 5.51 5.31 12.1%
M4 1.74 3.06 2.70 2.50 27.3%
a) Test 1
b) Test 2
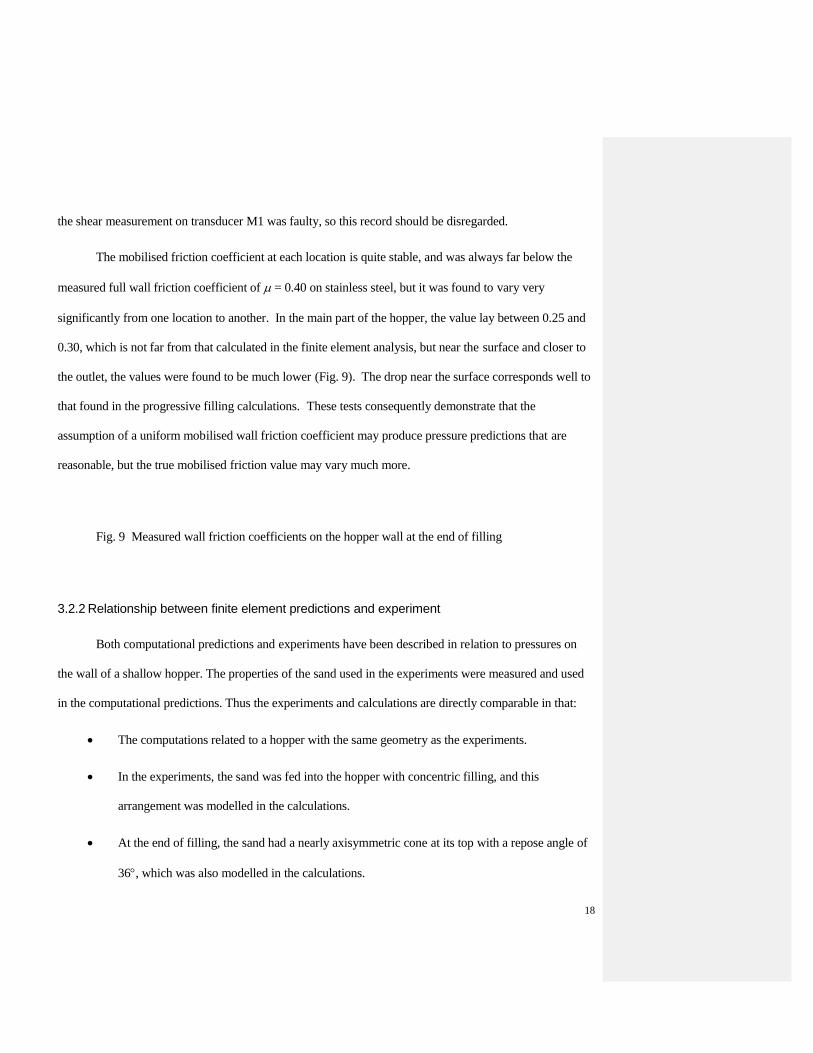
Fig. 8 Mobilised wall friction coefficients at the end of filling
Since the pressure cells measured both normal pressure and frictional traction, it was simple to
divide one by the other and immediately deduce the mobilised friction coefficient. The variation of these
measured mobilised friction coefficients during the final stable condition in Tests 1 and 2 are shown in
Fig. 8. Test 3 was very similar to Test 2, so is not shown here for reasons of space. During Tests 2 and 3,
18
the shear measurement on transducer M1 was faulty, so this record should be disregarded.
The mobilised friction coefficient at each location is quite stable, and was always far below the
measured full wall friction coefficient of = 0.40 on stainless steel, but it was found to vary very
significantly from one location to another. In the main part of the hopper, the value lay between 0.25 and
0.30, which is not far from that calculated in the finite element analysis, but near the surface and closer to
the outlet, the values were found to be much lower (Fig. 9). The drop near the surface corresponds well to
that found in the progressive filling calculations. These tests consequently demonstrate that the
assumption of a uniform mobilised wall friction coefficient may produce pressure predictions that are
reasonable, but the true mobilised friction value may vary much more.
Fig. 9 Measured wall friction coefficients on the hopper wall at the end of filling
3.2.2 Relationship between finite element predictions and experiment
Both computational predictions and experiments have been described in relation to pressures on
the wall of a shallow hopper. The properties of the sand used in the experiments were measured and used
in the computational predictions. Thus the experiments and calculations are directly comparable in that:
The computations related to a hopper with the same geometry as the experiments.
In the experiments, the sand was fed into the hopper with concentric filling, and this
arrangement was modelled in the calculations.
At the end of filling, the sand had a nearly axisymmetric cone at its top with a repose angle of
36, which was also modelled in the calculations.
19
The critical properties of the sand used in the finite element calculations (density, internal
friction angle and wall friction angle) were measured for the sand used in the tests.
These calculations should therefore relate well to the experimental observations if the finite
element model provides a good representation of the experiments.
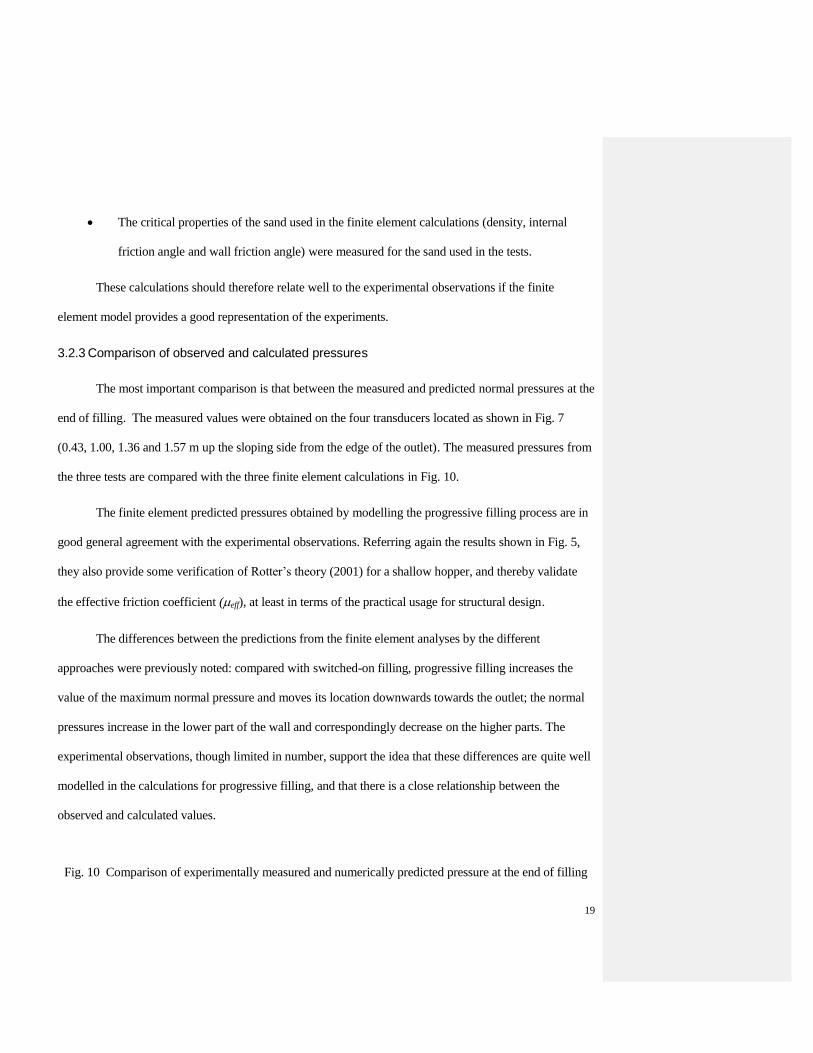
3.2.3 Comparison of observed and calculated pressures
The most important comparison is that between the measured and predicted normal pressures at the
end of filling. The measured values were obtained on the four transducers located as shown in Fig. 7
(0.43, 1.00, 1.36 and 1.57 m up the sloping side from the edge of the outlet). The measured pressures from
the three tests are compared with the three finite element calculations in Fig. 10.
The finite element predicted pressures obtained by modelling the progressive filling process are in
good general agreement with the experimental observations. Referring again the results shown in Fig. 5,
they also provide some verification of Rotter’s theory (2001) for a shallow hopper, and thereby validate
the effective friction coefficient (eff), at least in terms of the practical usage for structural design.
The differences between the predictions from the finite element analyses by the different
approaches were previously noted: compared with switched-on filling, progressive filling increases the
value of the maximum normal pressure and moves its location downwards towards the outlet; the normal
pressures increase in the lower part of the wall and correspondingly decrease on the higher parts. The
experimental observations, though limited in number, support the idea that these differences are quite well
modelled in the calculations for progressive filling, and that there is a close relationship between the
observed and calculated values.
Fig. 10 Comparison of experimentally measured and numerically predicted pressure at the end of filling
20
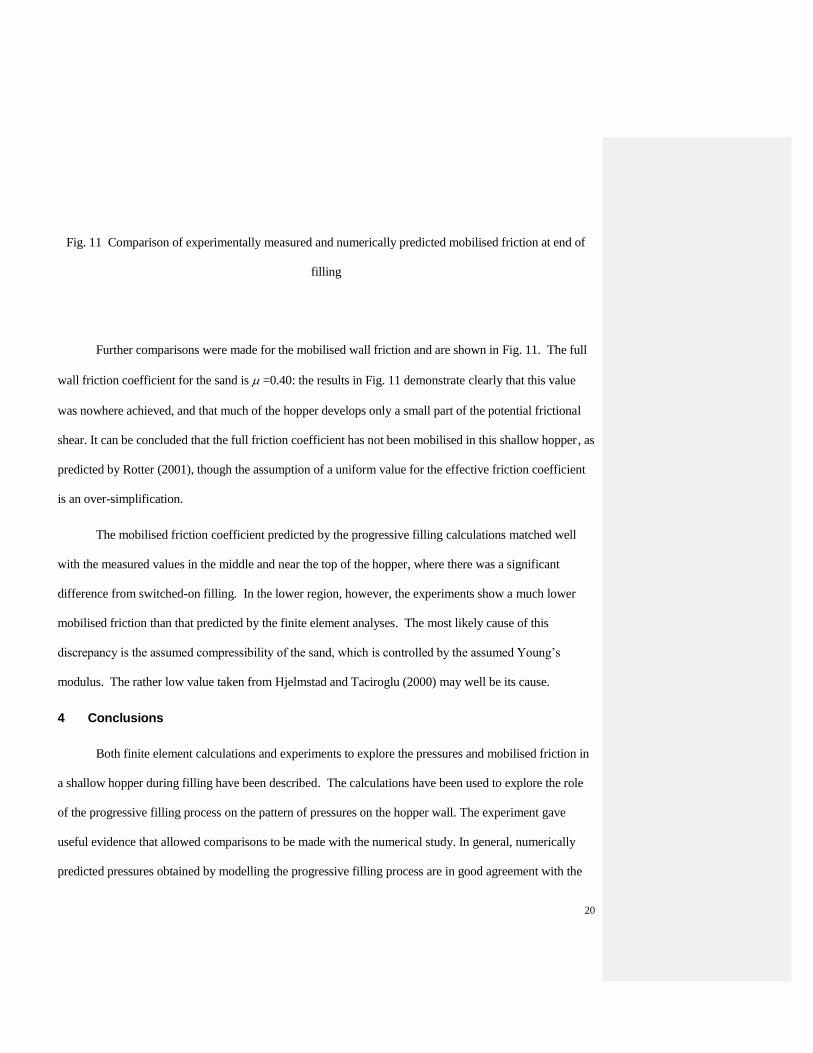
Fig. 11 Comparison of experimentally measured and numerically predicted mobilised friction at end of
filling
Further comparisons were made for the mobilised wall friction and are shown in Fig. 11. The full
wall friction coefficient for the sand is =0.40: the results in Fig. 11 demonstrate clearly that this value
was nowhere achieved, and that much of the hopper develops only a small part of the potential frictional
shear. It can be concluded that the full friction coefficient has not been mobilised in this shallow hopper , as
predicted by Rotter (2001), though the assumption of a uniform value for the effective friction coefficient
is an over-simplification.
The mobilised friction coefficient predicted by the progressive filling calculations matched well
with the measured values in the middle and near the top of the hopper, where there was a significant
difference from switched-on filling. In the lower region, however, the experiments show a much lower
mobilised friction than that predicted by the finite element analyses. The most likely cause of this
discrepancy is the assumed compressibility of the sand, which is controlled by the assumed Young’s
modulus. The rather low value taken from Hjelmstad and Taciroglu (2000) may well be its cause.
4 Conclusions
Both finite element calculations and experiments to explore the pressures and mobilised friction in
a shallow hopper during filling have been described. The calculations have been used to explore the role
of the progressive filling process on the pattern of pressures on the hopper wall. The experiment gave
useful evidence that allowed comparisons to be made with the numerical study. In general, numerically
predicted pressures obtained by modelling the progressive filling process are in good agreement with the
21
experimental observations. It is evident therefore that modelling progressive filling has improved the finite
element prediction over the more traditional and simpler switched-on gravity filling.
These comparisons also showed that Rotter’s proposal and formulas (1999, 2001) for
discriminating between steep and shallow hoppers, and for predicting the normal wall pressure magnitude
and distribution in a shallow hopper using an effective wall friction coefficient eff, provides a better match
with both the experiments and numerical predictions than the other algebraic treatments.
The finite element calculations showed that the wall friction is nowhere fully mobilised in a
shallow hopper. The predicted mobilised friction found in the calculations for both switched-on and
progressive filling are in good agreement with each other, and in reasonable agreement with the algebraic
prediction of Rotter’s proposal and formula for the effective friction coefficient (eff).
Discrepancies remain between the different assessed values of mobilised wall frictional coefficient,
both in pattern and magnitude. First, when the filling process is modelled using switched-on gravity, a
zone near the top of the hopper is predicted to have a higher mobilised friction: this is not matched by
either the progressive filling calculations or the experiments, and the cause is a clear error in mechanics.
Secondly, the experiments show rather low values for the mobilised friction in the lower parts of the
hopper wall which are worthy of further investigation, but are accountable when it is recognised that the
sand may have been treated as too compressible in the numerical model.
The relatively close agreement on normal pressures between the experiments and the calculations
using progressive filling amply justify the further use of finite element calculations to explore a wider
range of features of hopper pressures.
5 References
Abaqus, 2004. Manuals, Hibbitt, Kalrlsson and Sorenson, Inc, Rhode Island

22
Anand, L., Gu, C., 2000. Granular materials: Constitutive equations and strain localization, Journal of
the mechanics and physics of solid 48, 1701-1733.
Baxter, G.M., Behringer, R.P., Pattern formation in flowing sand, Physical Review Letters, 62 (24)
2825-2828.
Campbell, S., 1989. Granular material flows - An overview, Powder Technology 162 (3) (2006) 208-
229
Cates, M.E., Wittmer, J.P., 1998. Stress Propagation in Sand, Physics A, 249, 276-284.
Dabrowski, A., 1957. Parcie Materialow Sypkich w Leju (Pressures from bulk solids in hoppers),
Archiwum Inzynierii Ladowej, Warsawa, 325-328.
DEKA, 2002. Specification of pressure transducers used in silos, Tel-Tek., Porsgrunn, Norway:
Beschreibung der Montage der Transducer und der Kalibriervorrichtung, DEKA Sensor & Technologie
GmbH Teltow, Germany
Ding, S., 2004. Investigations of flow and pressure in silos during filling and discharging in presence of
inserts, Ph.D. thesis, Institute for Infrastructure and Environment, The University of Edinburgh.
Ding, S., Enstad, G.G., Silva, S.R., 2003, Development of load on a hopper in process of filling with
granular material, Particulate Science and Technology 3 259-270.
Ding, S., Rotter, J.M., Ooi, J.Y., Enstad, G.G., 2011. Development of normal pressure and frictional
traction along the walls of a steep conical hopper during filling, Thin-Walled Structures 49. 1246-1250.
Drescher, A., 1998. Some aspects of flow of granular materials in hoppers, Philosophical Transactions
of the Royal Society of London: Series A-Mathemat, 356.1747 () 2649-2666.
Drescher, A., 1992. On the criteria for mass-flow in hoppers, Powder Technology 73(3) 251-260.
EN 1991-4, 2006. Actions in Silos and Tanks, Eurocode 1 Part 4, CEN, Brussels
Enstad, G.G., 1975. On the Theory of Arching in Mass Flow Hoppers, Chemical Engineering Science,
23
30 1273 – 1283.
Enstad, G.G., 1981. A Novel Theory on the Arching and Doming in Mass Flow Hoppers, Dr. techn,
Thesis Norwegian Institute of Technology, Bergen, Norway.
Feise, F., Schwedes, J., 1998. Constitutive laws for granular materials, in: Brown, C. J., Nielsen J.
(Eds), Silos: Fundamentals of Theory, Behaviour and Design, E & FN SPON Press, London, P. 529-
538.
Green, R. and Fielding, D., 2007. Uniaxial tests on the key properties of granular solids, MEng Theses,
Institute for Infrastructure and Environment, School of Engineering, University of Edinburgh.
Holst, J.M.F.G., Ooi, J,Y., Rotter, J.M., 1999. Numerical Modeling of Silo Filling: I: Continuum
Analyses, Journal of Engineering Mechanics-ASCE, 125(1): P. 94-103.
Haussler, U., Eibl, J., 1984. Numerical Investigation of Discharging Silos, Journal of Engineering
Mechanics, 110(6) 957-971.
Heege, P.A., Onate, E., 1995. Numerical modeling and simulation of friction contact using a
generalized Coulomb Law, Engineering Computations 12 641-656.
Hjelmstad, K D., Taciroglu, E., 2000. Analysis and implementation of resilient modulus models for
granular solids, Journal of Engineering Mechanics, ASCE, 126, (8), Aug., 821-830.
Jaky, J., 1948. Pressures in Silos, Proceedings, 2nd International Conference on Soil Mechanics and
Foundation Engineering, Rotterdam, June 21-30, 1, 103-107.
Janssen, J., 1895. Verssuche uber Getreidedruck in Silozellen, Zeitschrift des Verein Deutscher
Ingenieure 39(35), 1045 1049.
Jenike, A.W., 1964. Storage and Flow of Solids, Bulletin No 123 of the Utah Engineering Experiment
Station, Vol. 53, No. 26, November, University of Utah, Salt Lake City, Utah, 197 pp.
Jenike, A.W., Johanson, J.R. and Carson, J.W., 1973. Bin Loads - Parts 2, 3 and 4: Concepts, Mass

24
Flow Bins, Funnel Flow Bins, Jnl of Engg for Industry, Trans. ASME, 95B (1) 1-5, 6-12, 13-16.
Jenike, A.W., 1987. A theory of flow of particulate solids in converging and diverging channels based
on a conical yield function, Powder Technology, 50(3) 229-236.
Keiter T.W.R., Rombach, G.A., 2001. Numerical aspects of FE simulation of granular flow in silos,
Journal of Engineering Mechanics, 127(10) Oct. 1044-1050.
Khakhar, D.V., Orpe, A.V., Ottino, J.M., 2001. Surface flow of granular material: model and
experiments in heap formation, J. Fluid Mech. 44, 1255-264.
Koenen, M., 1895. Berechnung des Seitenund Bodendrucks in Silos (Calculation of Side and Floor
Pressure in Silo Walls), Zentralblatt der Bauverwaltung 16 446-449.
McLean, A.G. and Arnold, P.C., 1976. Prediction of Cylinder Flow Pressures in Mass-Flow Bins Using
Minimum Strain Energy, Trans. of ASME, Journal of Engineering for Industry Nov. 1370-1374.
Meng, Q., J.C. Jofriet and S.C. Negi. 1997. Finite element analysis of bulk solids flow - 1. Development
of model based on secant constitutive relationship. J. Agric. Eng. Res., 67(2):141-150.
Nedderman, R.M., 1992. Statics and Kinematics of Granular Materials, Cambridge University Press,.
Ooi, J.Y., Rotter, J.M., 1990. Wall Pressures in Squat Steel Silos from Simple Finite-Element Analysis,
Computers & Structures, 37(4) P. 361-374.
Ooi, J.Y. and Rotter, J.M., 1989. Elastic and Plastic Predictions of the Storing Pressures in Conical
Hoppers, Transactions of Mechanical Engineering, Institution of Engineers, Australia, Vol. ME14,
No.3, pp 165-169.
Ooi, J.Y., Rotter, J.M., 1991. Elastic Predictions of Pressures in Conical Silo Hoppers, Engineering
Structures, 13 (1), 2-12.
Ooms, M., Roberts, A.W., 1985. Significant influence on wall friction in the gravity flow of bulk solids,
Bulk Solids Handling 5, Dec. 1271-1277.
25
Otto, M., Bouchaud, J. P., Claudin, P., Socolar, J.E.S., 2003. Anisotropy in granular Media: classical
elasticity and directed-force chain network, Physical Review E, 67031302.1-031302.24.
Evesque, P. and Adjemian, F., 2002. Stress fluctuation and macroscopic stick-up in granular materials,
The European Physical Journal E, 252-259.
Qu, Q., Negi, S.C., Jofriet, J.C., 2001. Storage of Cohesive material in Silos, Part 2: Parametric Study,
Powder Handling Processing, 13(1), Jan/March 27-30.
Ristow, G.H., Herrmann, H.J., 1995. Forces on the walls and stagnation zones in a Hopper filled with
granular material, Physica A 213 474-481.
Rotter, J.M., 1986. On the Significance of Switch Pressures at the Transition in Elevated Steel Bins,
Proc., Second Intl Conf. on Bulk Matls Storage, Handling and Transptn, Institution of Engineers,
Australia, Wollongong, 82-88.
Rotter, J.M., 1998. Challenges for the future in numerical simulation, in: Brown, C.J., Nielsen, J. (Eds):
Silos: Fundamentals of Theory, Behaviour and Design, E & FN Spon, London 584-604.
Rotter, J.M., 1999. Flow and pressures in silo structural integrity assessments, Proc., International
Symposium: Reliable Flow of Particulate Solids III, Porsgrunn, Norway, Aug pp 281-289.
Rotter, J.M., 2001. Guide for the Economic Design of Circular Metal Silos, Spon Press, London and
New York.
Rotter, J.M., 2008. Silo and hopper design for strength, Chapter 3 in Bulk Solids Handling- Equipment
Selection and Operation, Ed D. McGlinchey, Blackwell, Oxford, pp 99-134.
Rotter, J.M., Holst, J.M.F.G, Ooi, J.Y., Sanad, A..M, 1998. Silo Pressure Predictions using Discrete-
Element and Finite-Element Analyses, Philosophical Transactions of the Royal Society of London:
Series A-Mathematical and Physical Sciences, 356: 2685-2712.
Schwedes, J., 2003. Review on testers for measuring flow properties of bulk solids, Granular matter
26
5.1-43.
Siavoshi, S., Orpe, A.V., Kudrolli A., 2006. Friction of a slider on a granular layer: Non-monotonic
thickness dependence and effect of boundary conditions, Phys. Rev. E 73, 010301.
Socolar, J.E., Shaeffer, D.G., Claupin, P., 2002. Directed force chain networks and stress response in
static granular materials, The European Physical Journal E 7, P353-370.
Teng, J.G., Rotter, J.M., 1991. The Strength of Welded Steel Silo Hoppers under Filling and Flow
Pressures, Journal of Structural Engineering, ASCE, 117 (9) 2567-2583.
Vanel, L., Claudin, P., Bouchaud, J.P., Cates, M.E., Clement E., Wittmer, J. P., 2000. Stresses in silos:
Comparison between theoretical models and new experiments, Physical Review Letters 84(7), 1439-
1442
Walker, M., 1966. An Approximate Theory for Pressures and Arching in Hoppers, Chemical
Engineering Science 21, 975-997.
Walters, J.K., 1973. A Theoretical Analysis of Stress in Silos with Vertical Walls, Chemical
Engineering Science 28(3), p. 779-89.
Wright, A.W.S., 1979. Silos- model and field studies, PhD thesis, University of Manchester, 480pp.
Zhong, Z., Ooi, J.Y., Rotter, J.M., 2001. The sensitivity of silo flow and wall stresses to filling method,
Engineering Structure 23, P. 756-767.