effects of hopper dredging and sediment dispersion, chesapeake bay
TRANSCRIPT

I
J
Effects of Hopper Dredging and Sediment Dispersion, Chesapeake Bay MAYNARD NICHOLS, ROBERT J. DIAZ, and LINDA C. SCHAFFNER Virginia Institute of Marine Science
~ College of William and Mary Gloucester Point, Virginia 23062, U.S.A
ABSTRACT / Hopper dredging operations release suspended sediment into the environment by agitation of the bed and by discharge of overflow slurries. Monitoring of turbidity and
suspended sediment concentrations in central Chesapeake Bay revealed two plumes: (1) an upper plume produced by overflow discharge and (2) a near-bottom plume produced by draghead agitation and rapid settling from the upper plume. The upper plume dispersed over 5.7 km2 extending 5,200 meters form the discharge point. Redeposited sediment accumulated on channel flanks covering an area of 6.4 km2 and reached a thickness of 19 cm. Altogether dredging
Introduction
The environmental effects of dredging and disposal are persistent issue in Chesapeake Bay. The bay, which is North America's largest estuary, is a frequent testing ground between the needs of the environment and commerce. It contains marine resources of high ecological value including productive fish spawning grounds and shellfish beds. It produces some $86 million in commercial fisheries annually including 22 million pounds of oysters, 59 million pounds of blue crabs, and 462 million pounds of finfish (US. EPA 1983). These resources however, are in a serious decline.
Shipping is required to maintain the economic viability of ports like Norfolk and Baltimore. They receive about 6,200 ships annually bearing 103 million short tons of cargo wQrth an estimated $27,467 million (Hampton Roads Maritime Association 1985). Dredging is needed to create deeper channels for large, more efficient, deep draft ships like bulk cargo carriers in order to improve port economy. Therefore, decisions must be made to improve the benefits of commerce while providing the best possible protection of marine reSOUf'ces. Information available now is inadequate to fully resolve this issue. Of the large number of studies that detail dredging effects, most deal with disposal. Few have focused on the dredging site itself.
Environ Geol Water Sci Vol. 15, No.1, 31-43
redistributed into the environment an estimated 100,000 tons of sediment or 12 percent of the total material removed.
Near-field concentrations of suspended sediment, less than 300 m from the dredge, reach 840 to 7,200 mg/L or 50 to 400 times the normal background level. Far-field concentrations (>300 m) are enriched 5 to 8 times background concentrations and perSist 34 to 50 percent of the time during a dredging cycle (1.5 to 2.0 h). The overflow discharge plume evolves through three dispersion phases: (1) convective descent, (2) dynamic collapse, and (3) long-term passive diffusion (Clark and others 1971). The bulk of the material descends rapidly to the bottom during the convective descent phase, whereas the cloud that remains in suspension is dispersed partly by internal waves. Although suspended sediment concentrations in the water column exceed certain water quality standards, benthic communities survived the perturbation with little effect.
Two major dredging projects are underway in Chesapeake Bay: (1) deepening the approach channels to Hampton Roads and Norfolk from 13.7 to 16.8 m (45 to 55 ft), and (2) deepening the main shipping channel between Baltimore and the sea from 12.8 to 15.2 m (42 to 50 ft). Dredging of the Baltimore channel, which handles more than 2,500 ships annually, proceeds for 90 km along segments of the bay (Fig. 1). Altogether an estimated 39.5 m3 X 106 (52 yds3 x 106, (ca. 16 megatons) of sediment will be dredged over a 3.5-year period at an estimated cost of $251 million (U.S. Army Corps of Engineers 1981). Dredging activities use nearby open-water disposal areas in the central Bay (Fig. 1) whereas contaminated material from Baltimore harbor is placed behind dikes forming an artificial island, Hart-Miller Island. These activities are part of a long series of projects that have lowered the channels in increments over the last 100 years (Nichols 1986, Schubel and Wise 1979). The future trend of larger ships and port expansion during the next 25 years will require dredging more than 213 m3 x 106 (280 yds3 x 106, (ca. 106 megatons) of sediment from the Chesapeake Bay region (Gross and Cronin 1979; Nichols 1983).
Objectives
This study aimed to determine if hopper dredging
© 1990 Springer-Verlag New York Inc.

32 M. Nichols et al.
SITE LOCATION Chesapeake Bay
39°
00'
l8° 00
71° 00'
l'1' 00'
lSO 00'
37° 00'
Figure 1. Location of the Baltimore shipping channel, disposal sites (hachured) and study site at Rappahannock Shoals in central Chesapeake Bay.
operations cause an unacceptable impact on marine resources in central Chesapeake Bay. Although many short- and long-term impacts can be produced, this study focused on two major environmental concerns: (1) the generation of turbidity and resultant degradation of water quality, and (2) the redeposition of dredge-induced suspended sediment on benthic populations.
Background
The consequences of turbidity and sedimentation produced by dredging have been observed mainly at disposal sites. Little is known about the dispersion of suspended sediment and the impact of sediment accumulation around dredge sites, especially dispersion of sediment discharged by hopper overflow. A notable exception is the investigation of Sustar and others (1976) in San Francisco Bay. They showed that hopper dredging can disturb and resuspend enormous quantities of sediment and the rate of dispersion depends
on the degree and duration of water-sediment interactions. The information, however, is site specific. The present study extends Sustar's work by)nvestigating a very large size hopper having rapi<:l discharge into ambient water where salinity ranges 13 to 21 percent.
In the Chesapeake region short-term turbidity effects and biotic impacts have been examined by different scientists and organizations through field experiments and monitoring. For example: by the Virginia Institute of Marine ScieRce (1967) and Harrison and others (1964) on Rappahannock Shoals; Biggs (1968) and Cronin and others (1970) in the upper bay; the State of Maryland (1976) near Kent Island, in the upper bay; Gross and others (1976) near the Chesapeake and Delaware Canal; Cronin and others (1976) in the Patapsco River mouth; Nichols and Thompson (1978) and Diaz and Boesch (1977) in the upper James River; Johnson and others (1980) and Priest (1981) in the Elizabeth River; and Nichols and Diaz (1989) in lower Chesapeake Bay. Intercomparison of data is difficult because techniques and parameters differ with each investigation and results are mainly site specific. In general however, turbidity is confined to a 4-5-km2
area around the discharge sites and quickly returns to a background level within about two hours. Additionally, disposal markedly reduces benthic populations, but they recolonize and reestablish within months to a . year and a half depending on the type of communities. These results are in general agreement with other studies of the national Dredged Material Research Program sponsored by the Corps of Engineers, for example Stern and Strickler (1978) and Burks and Engler (1978). One notable study in the Chesapeake region (Priest 1981) not only describes a turbidity plume produced by hydraulic cutterhead dredging, but uses the results to provide input and verification data for a plume model (Kuo and others 1985). This approach offers a means of predicting sediment dispersion from different sites and operation data. In brief, knowledge in the Chesapeake region provides a useful first-order understanding of the range of environmental effects, but environmental risks of dredging cannot be predicted with certainty because quantitative field data are lacking.
Rationale and Approach
Since dredging disturbs and resuspends bottom sediment, a basic task is to define the causal mechanism; that is, the discharge characteristics of the dredge, subsequent dispersion in ambient water and deposition adjacent to the channel. In this study, we consider the effects of hopper dredge activity. A
•
hopper dredge is a self-propelled ship equipped with a large bin, or bins, to temporarily store dredged material while transporting it to a disposal site. Bottom sediment is hydraulically lifted from the channel floor by suction through a draghead and dragarm and pumped by high power centrifugal pumps and dumped into the hopper bin. During late stages of hopper filling, the near-surface sediment slurry is pumped past overflow to maximize the load of high<;lensity aggregated solids in lower parts of the hopper.
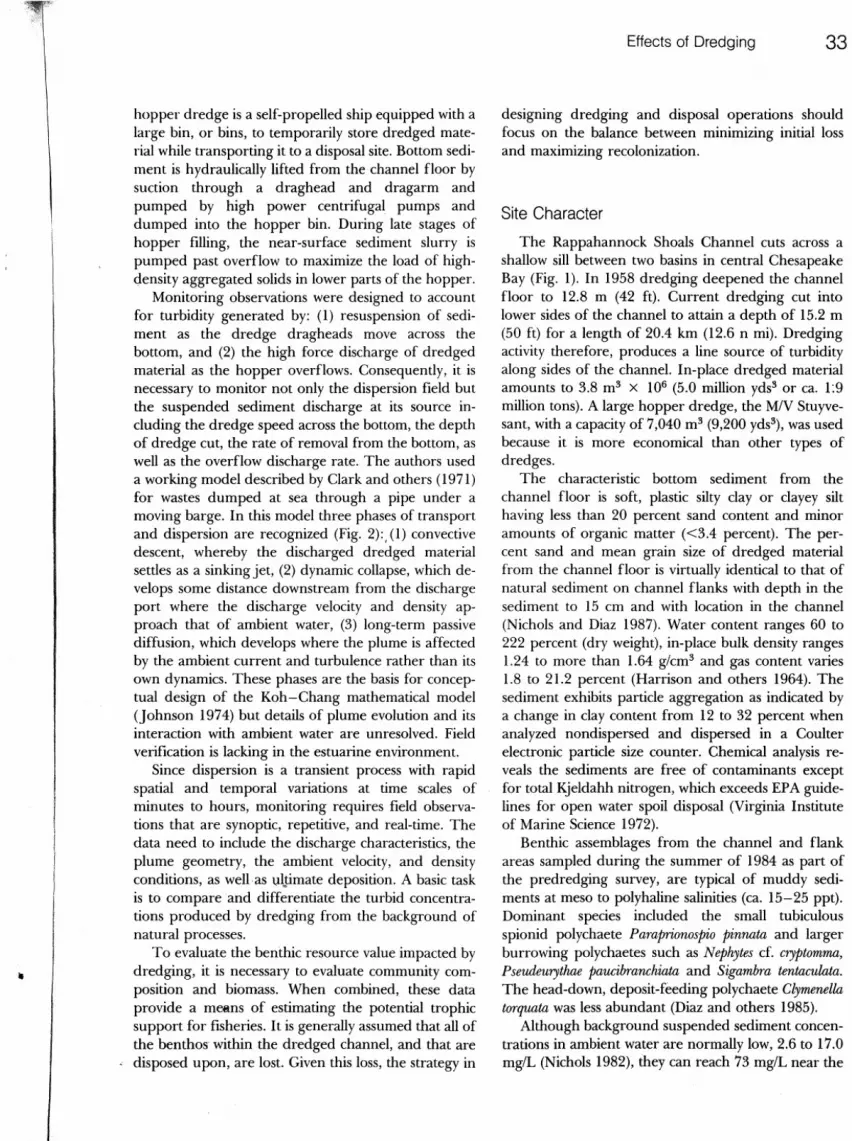
Monitoring observations were designed to account for turbidity generated by: (1) resuspension of sediment as the dredge dragheads move across the bottom, and (2) the high force discharge of dredged material as the hopper overflows. Consequently, it is necessary to monitor not only the dispersion field but the suspended sediment discharge at its source including the dredge speed across the bottom, the depth of dredge cut, the rate of removal from the bottom, as well as the overflow discharge rate. The authors used a working model described by Clark and others (1971) for wastes dumped at sea through a pipe under a moving barge. In this model three phases of transport and dispersion are recognized (Fig. 2):, (1) convective descent, whereby the discharged dredged material settles as a sinking jet, (2) dynamic collapse, which develops some distance downstream from the discharge port where the discharge velocity and density approach that of ambient water, (3) long-term passive diffusion, which develops where the plume is affected by the ambient current and turbulence rather than its own dynamics. These phases are the basis for conceptual design of the Koh-Chang mathematical model (Johnson 1974) but details of plume evolution and its interaction with ambient water are unresolved. Field verification is lacking in the estuarine environment.
Since dispersion is a transient process with rapid spatial and temporal variations at time scales of minutes to hours, monitoring requires field observations that are synoptic, repetitive, and real-time. The data need to include the discharge characteristics, the plume geometry, the ambient velocity, and density conditions, as well as ulJ:imate deposition. A basic task is to compare and differentiate the turbid concentrations produced by dredging from the background of natural processes.
To evaluate the benthic resource value impacted by dredging, it is necessary to evaluate community composition and biomass. When combined, these data provide a mellns of estimating the potential trophic support for fisheries. It is generally assumed that all of the benthos' within the dredged channel, and that are disposed upon, are lost. Given this loss, the strategy in
Effects of Dredging 33
designing dredging and disposal operations should focus on the balance between minimizing initial loss and maximizing recolonization.
Site Character
The Rappahannock Shoals Channel cuts across a shallow sill between two basins in central Chesapeake Bay (Fig. 1). In 1958 dredging deepened the channel floor to 12.8 m (42 ft). Current dredging cut into lower sides of the channel to attain a depth of 15.2 m (50 ft) for a length of 20.4 km (12.6 n mi). Dredging activity therefore, produces a line source of turbidity along sides of the channel. In-place dredged material amounts to 3.8 m3 X 106 (5.0 million yds3 or ca. 1:9 million tons). A large hopper dredge, the MN Stuyvesant, with a capacity of 7,040 m3 (9,200 yds3), was used because it is more economical than other types of dredges.
The characteristic bottom sediment from the channel floor is soft, plastic silty clay or clayey silt having less than 20 percent sand content and minor amounts of organic matter «3.4 percent). The percent sand and mean grain size of dredged material from the channel floor is virtually identical to that of natural sediment on channel flanks with depth in the sediment to 15 cm and with location in the channel (Nichols and Diaz 1987). Water content ranges 60 to 222 percent (dry weight), in-place bulk density ranges 1.24 to more than 1.64 g/cm3 and gas content varies 1.8 to 21.2 percent (Harrison and others 1964). The sediment exhibits particle aggregation as indicated by a change in clay content from 12 to 32 percent when analyzed nondispersed and dispersed in a Coulter electronic particle size counter. Chemical analysis reveals the sediments are free of contaminants except for total Kjeldahh nitrogen, which exceeds EPA guidelines for open water spoil disposal (Virginia Institute of Marine Science 1972).
Benthic assemblages from the channel and flank areas sampled during the summer of 1984 as part of the predredging survey, are typical of muddy sediments at meso to polyhaline salinities (ca. 15-25 ppt). Dominant species included the small tubiculous spionid polychaete Paraprionospio pinnata and larger burrowing polychaetes such as Nephytes cf. cryptomma, Pseudeurythae paucibranchiata and Sigambra tentaculata. The head-down, deposit-feeding polychaete Clymenella torquata was less abundant (Diaz and others 1985).
Although background suspended sediment concentrations in ambient water are normally low, 2.6 to 17.0 mglL (Nichols 1982), they can reach 73 mglL near the
34 M. Nichols et al.
t-----C%~~~i~¥E ---l.,.---- DYNAMIC COLLAPSE ----- -I PASSIVE ..... DIFFUSION
I
Figure 2. Conceptual model of plume dispersion and sequence of transport phases for hopper overflow discharge. Cross sections are shown at two plume phases. Modified from Clark and others (1971) and Brandsma and Divoky (1976).
bottom during fast tidal currents. Tidal currents are semidiurnal and normally reach 0.4 mls (0.8 knots). With superimposed flow of wind drift, meteorological forcing or storage flow, and spring tide range, currents can increase to 0.7 mls (1.5 knots). Mean salinity of near-bottom water is 16.5 ppt, and differences between near-bottom and surface water average 4.5 ppt (Nichols 1982). In summary, waters are partly stratified and hydrodynamic conditions for suspended sediment dispersion are relatively good.
Methods
Four different monitoring procedures were used to observe turbidity generation, suspended sediment dispersion and resultant deposition on the bed as well as the impacts on marine biota: (I) sampling the hopper overflow at 5-minute intervals and recording dredge operation data, (2) sampling the plume of turbid water from fixed anchor stations as the dredge passed, (3) tracking through the plume from a vessel immediately after the dredge passed, and (4) observing redeposition of "new" sediment thickness and sampling benthic populations after dredging. Most monitoring however, was directed to water column perturbations. Observations were scheduled to coincide with the cycle of dredging and disposal (90 to 120 minutes duration). Temporal observations and ship tracks were run to a background turbidity level «17 mg/L). Additionally, ambient current speed and direction was measured with Endeco meters on a taut mooring at 2.4 and 9.1 m depths. Altogether, six dredge cycles were observed during a 12-hour period of nearly one tidal cycle. Benthic sampling proceeded 14 days after dredging was completed.
For rapid in situ measurements of plume structure and geometry, optical transmittance and acoustic mea-
surements were made by towing sensors concurrently from a tracking vessel. Turbidity was measured at middepth (7 m) with a Partech transmissometer having white light twin gap path lengths of 6.4 and 12.5 mm. The unit was calibrated in the laboratory by a linear regression between percent transmittance and known concentrations of suspended sediment derived from the channel site. Acoustic measurements were performed with a multifrequency acoustic tracking system, Datasonics model DFS-2100 at 27 and 300 kHz frequencies. This was augmented at fixed stations by Raytheon survey fathometers DE-719 of 200 kHz frequency. Tracks and stations were positioned by Loran C supp,lemented by a del Norte navigation system. Hopper overflow was sampled near the overflow weir with a scoop sampler. During plume tracking water samples were pumped from three depths in the water column at fixed stations and analyzed in the lab for salinity and total suspended solids. Salinity was run on a Beckman Induction Salinometer (RS-IO), whereas sediment samples were processed gravimetrically by vacuum filtration (APHA 1981) using Gelman filters of 0.45 fLm pore size.
A surface profile imaging camera system (SPI) was used to determine in situ thickness of deposited sediment and biological features as well as sediment structure, textural, and compositional variations. The SPI system employs a modified Benthos model 3731 sediment profile camera capable of photographing sediment layers up to 40 cm thick, and Benthos models 371 and 372 camera and flash for photographing the sediment surface. An I2S image processor coupled to a Prime 850 minicomputer was used to analyze the SPI images. Quantitative benthic samples were collected with a 0.06 m2 spade box core to a depth of IS cm. Samples were seived to 0.5 mm, preserved in 10 percent formalin, and sorted to species in the laboratory.

Wet weight biomass was obtained prior to specimens being placed in 70 percent ethanol. Procedural details of field and laboratory processing are provided in Nichols and Diaz (1987).
Observations and Monitoring Results
Dredge operations produced two primary turbidity plumes: (1) a near-bottom plume produced by agitation, cutting, and turbulence of the draghead as it sucks and moves through the sediment, and (2) an upper plume in near-surface and middepth water produced by discharge of turbid hopper overflow. Generation of the near-bottom plume is difficult to define optically and acoustically because of high nearfield turbulence and bubbles. However, suspended sediment concentrations of near-bottom water samples within 20 m of the draghead reached 7,200 mg/L when the dredge passed. Bed disturbance and resultant sediment resuspension is likely a complex interaction between dredge operations, including draghead operating efficiency, the sediment characteristics and ambient hydrodynamic conditions including bottom currents. Table 1 summarizes relevant dredge operation data.
Overflow discharge consists of bottom water, mud, debris, and scattered benthic biota. Concentrations from the overflow weir ranged 75,000 to 286,000 mg/L and averaged 169,200 mg/L, a value that exceeds background concentrations by more than 8,000-fold. The material is discharged as a horizontal jet from a 0.67-m diameter pipe located 4.5 to 5.3 m below the water surface at an average rate of about 17 m3/min. The zone of flow establishment extends an estimated 4.0 m from the discharge point. Overflow discharge characteristics are summarized in Table 2. Of note, the density of the discharge water, which comes from deeper parts of the channel, in addition to the slurry density, is markedly greater than ambient water in the upper 7.0 m of the water column.
Formation of the upper overflow plume is affected by rapid initial mixing near the discharge port. This is most evident in the ,great reduction of suspended solids concentration. The concentrations of material discharged by the hopper range 75,000 to 286,000 mg/L, whereas ambient water concentrations from samples less than 300 m behind the dredge at middepth (7.0 m) range 120 to 840 mg/L, a reduction by
. three orders of magnitude. Initial mixing is facilitated by the high density gradient between the ambient water and horizontal jet discharge, or excess density, of the plume, tl.p. This is supported by the high densi-
Effects of Dredging 35
Table 1. Dredge operation data for the MN Stuyvesant during the monitoring period May 14, 1987, Rappahannock Shoals Channel.
Parameter
Cut depth, m Cut width of two dragheads, m Cut length, m Dredge speed through cut, mlmin Pump Capacity of two Pumps, m8/min Overflow Discharge Rate, m8/sec Overflow Discharge Depth, m
Range
0.6-2.4 10.9-15.2
75-114 337-635 4.3-8.2 4.5-5.3
Average
1.55 14.5
3,230 104 440
7.4 4.9
metric Froude numbers, 1.1 to 1.7, an indication of instability with concomitant turbulence and eddies. The tl.p is large, 0.096 g/cm3.
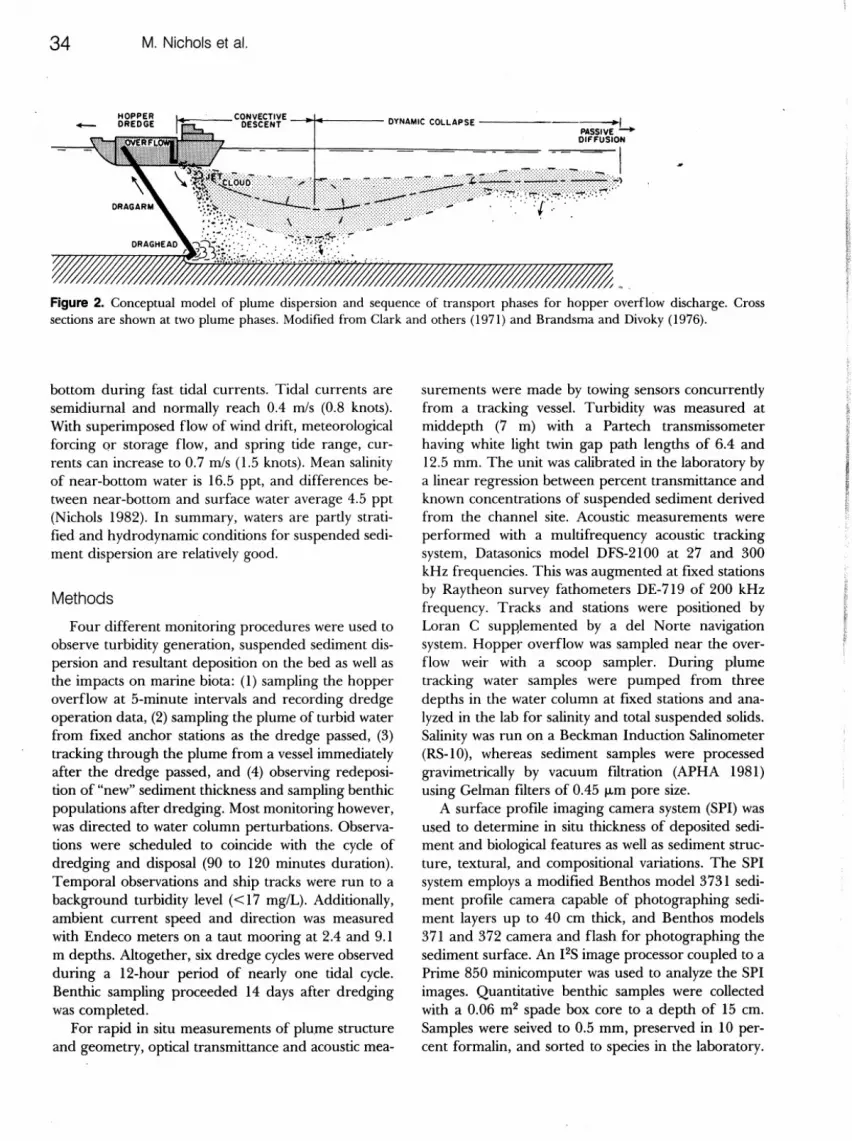
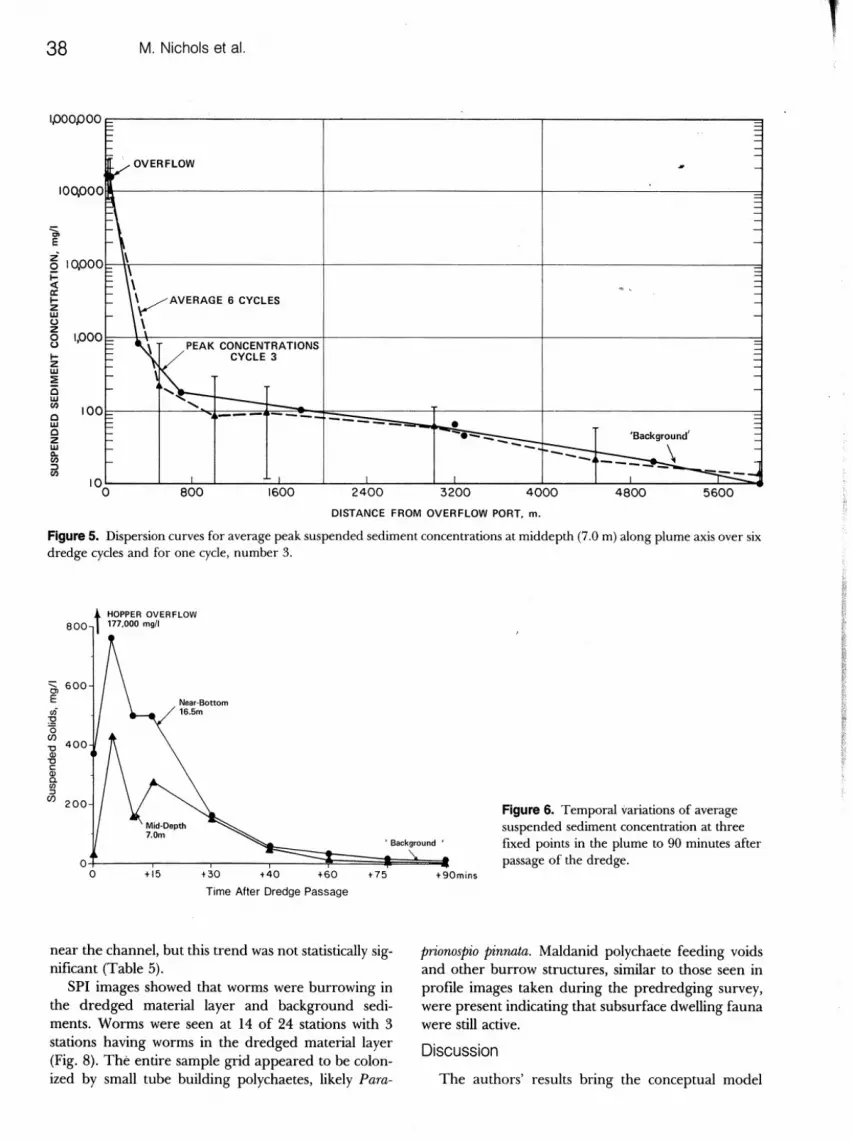
The middepth geometry of the upper plume, which is reconstructed from transmissometer transects, is shown in plan view in Figure 3. The basic pattern defined by high values (> 10 percent) reflects the dredge track and two dimensional line source of the hopper overflow along the dredge path. The outer boundary of the plume, designated by 3 percent of meter reading values, extends farther to the southwest than the northeast, a trend imposed by the early ebb current shear. Additionally, the plume width increases with time, as the plume ages and disperses, while the transects were made. Therefore, the nearfield zone is relatively narrow (ca. 140 m) 7 minutes after the dredge passed transect D, whereas it is wide (> 1,100 m) 63 minutes after the dredge passed transect E. Figures 4a and 4b display the surface shape of the plume, the near-field discharge and initial mixing (Fig. 4a) as well as the plume axis 300 to 1,200 m downstream (Fig. 4b). The cross-transect profiles 700 m behind the dredge at 7.0-m depth are nearly Gaussian reflecting horizontal diffusion. With increasing distance from the dredge, peak concentrations along the plume axis diminish exponentially (Fig. 5). Dispersion curves for middepth (7.0 m) display a marked reduction in suspended load within 300 m of the overflow discharge (Fig. 5). Background concentrations (17 mg/L) are attained at a distance of 5,200 meters from the discharge point. Altogether the plume covered an area of about 5.7 km2 and it contained approximately 470 tons of sediment (dry wt) or 10 percent of the overflow discharge load. Less than 1 percent drifts beyond the channel environs.
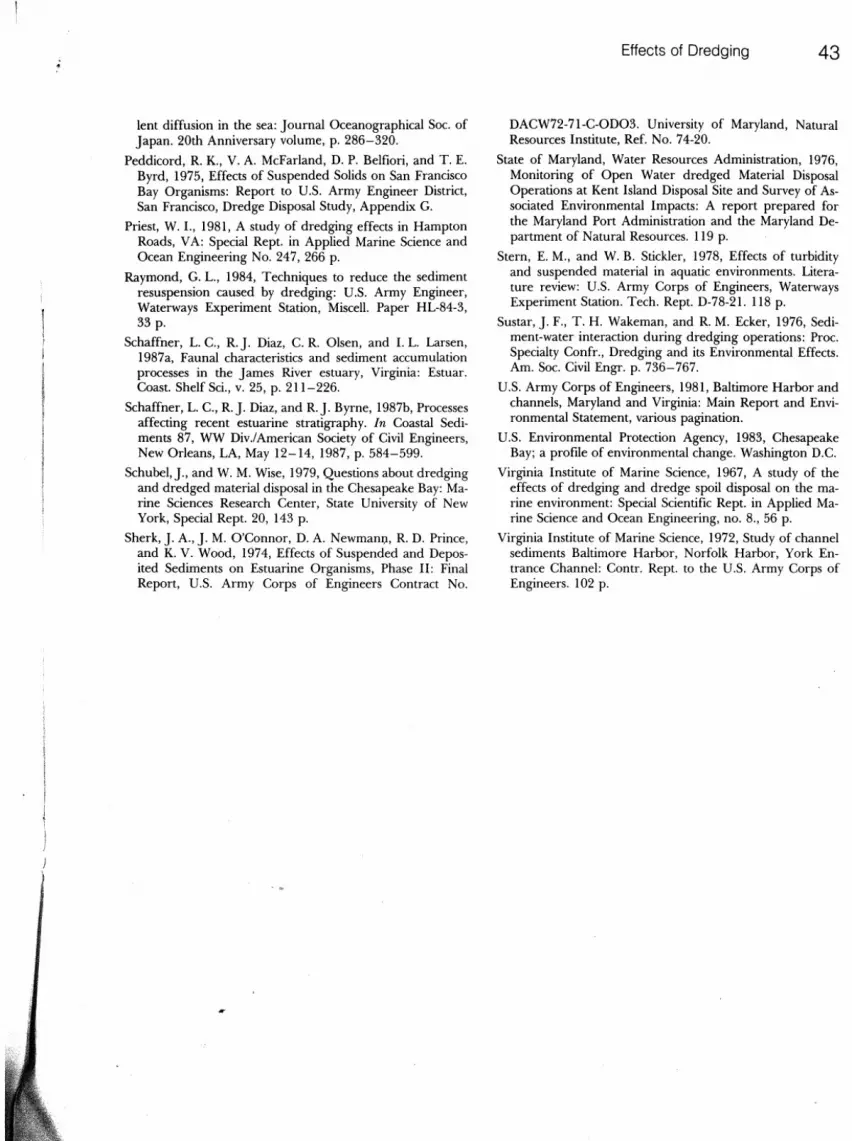
With time suspended sediment concentrations at fixed points in the plume decrease· to more than 1/20th of peak concentrations in 1 hour (Fig. 6). The horizontal plume variance is described by a c 2 time
36 M. Nichols et al.
Table 2. Characteristics of hopper overflow discharge for the MN Stuyvesant during the monitoring period May 14, 1987, Rappahannock Shoals Channel.
Parameter
Slurry sediment concentrations, mg/L Slurry bulk density, g/cm3
Slurry water density, g/cm3
Slurry discharge rate, m3/sec tons/h
Slurry discharge velocity, mlsec Ambient water density, upper layer Ambient sediment concentrations,
"background, upper layer," mg/L
E /\ i \
SEDIMENT PLUME Depth 7.0m
500m
,------"'---c-S'LC .---'L ~'-----.J'L-'I
\ \
\ \
\ \
//C
N
t /
/ /
Figure 3. Turbid plume produced by the MIV Stuyvesant, dredge cycle 3, May 14, 1987. Based on transmissometer tows (dashed) at 7.0 m depth 7 to 62 minutes after dredge passage. Isopleths represent percent of meter reading with 3 percent designated as the plume boundary.
dependence, which contrasts to t- 3 described by Okubo (1962) for dye diffusion. Peak concentrations, therefore, are reduced to a greater extent than a conservative substance. The middepth plume cannot be explained by dilution and horizontal diffusion alone. Downward movement must be taken into account.
Evidence for downward movement comes from the temporal variations of concentration with depth. As shown in Figure 6, the near-bottom concentrations exceed the middepth concentration by about twofold 15
Range
75,000-286,000 1.047-1.177
1.0141-1.0154 4.3-8.2
2,616-4,989 6.1-11.7
1.008-1.0150
7.0-14.1
Average
169,200 1.105 1.0151 7.4
4,512 10.6
1.009
10.9
minutes after discharge. This implies that the main mass of overflow material discharged at middepth, reached the bottom quickly. Settling rates are about 10 mmls. For this to occur within 15 minutes by normal Stokes settling, large sediment particles, about 300 J.1m mean diameter, would be required. In contrast, the particles in their dispersed state measure only 6.0 to 7.3 J.1m mean diameter. Consequently, the rapid downward movement of material from middepth must take place by convective settling, which is enhanced by particle aggregation, as well as by high suspended sediment concentrations and high density of the discharge slurry relative to ambient water.
Further evidence for downward movement is revealed by the, 300-kHz acoustic records. Figure 7 A shows the fresh discharge of suspended dredged material from the hopper overflow about 200 to 300 m, or 2 to 3 minutes, behind the dredge. Of note is the continuous dark scattering zone throughout most of the water column over the channel. With time and distance (ca. 50 m) from the channel, the plume separates into upper and lower plumes with an interfingering relationship of sharp vertical extensions between the plumes. This is indicative of material sinking from the upper plume and corresponding accumulation in the lower plume during dynamic collapse.
The end product of downward movement is evident in deposition of fine sediment (6.5 to 7.3 J.1m mean size) adjacent to the channel that is revealed by SPI images of dredged material layers overlying natural bottom sediments (Fig. 9). Thickness of the dredged material varies from 0.5 to 19.8 em with diminished thickness farther from the channel (Table 3). Thin layers, 2.6- to 6.6-cm thick, extend an estimated 800 to 1,180 m from the channel axis. The total volume of material deposited adjacent to the monitored channel section (ca 6.4 km2) is estimated at 294,000 m3 or about 100,000 tons assuming a dry weight density of 0.34 tons/m3• The total amount of
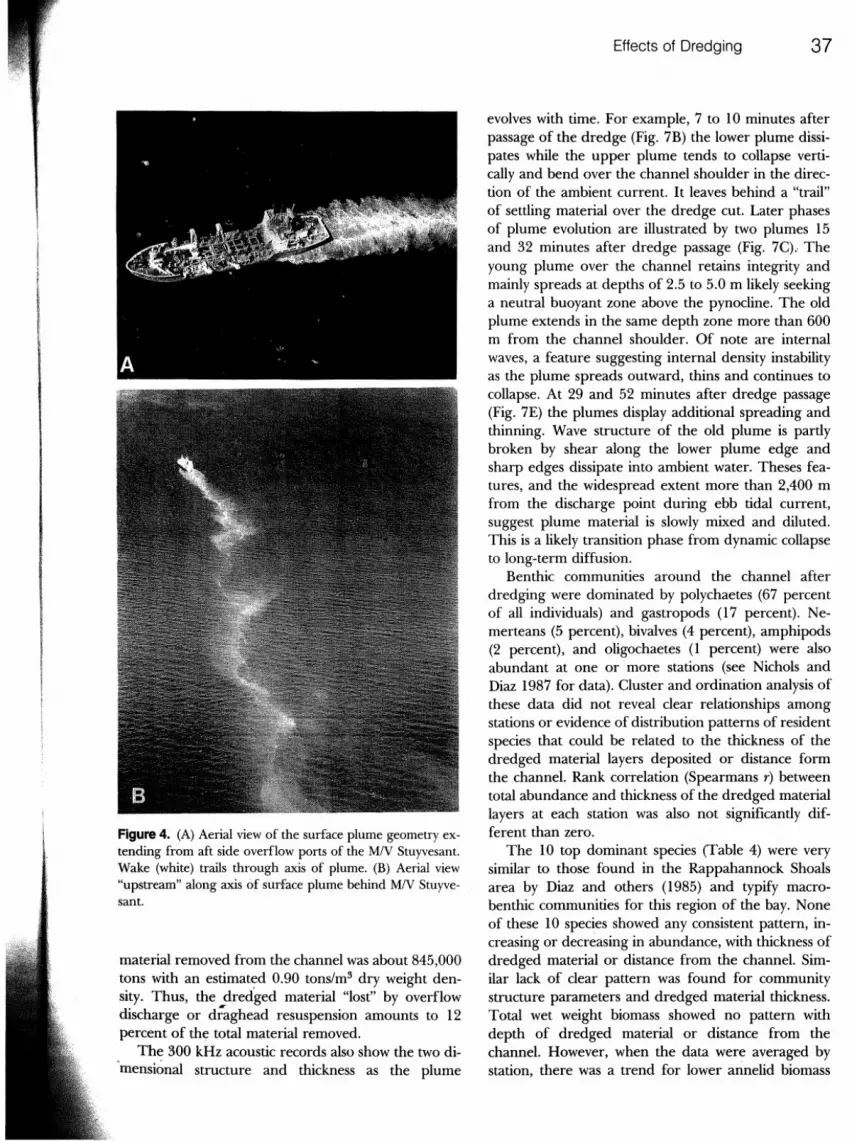
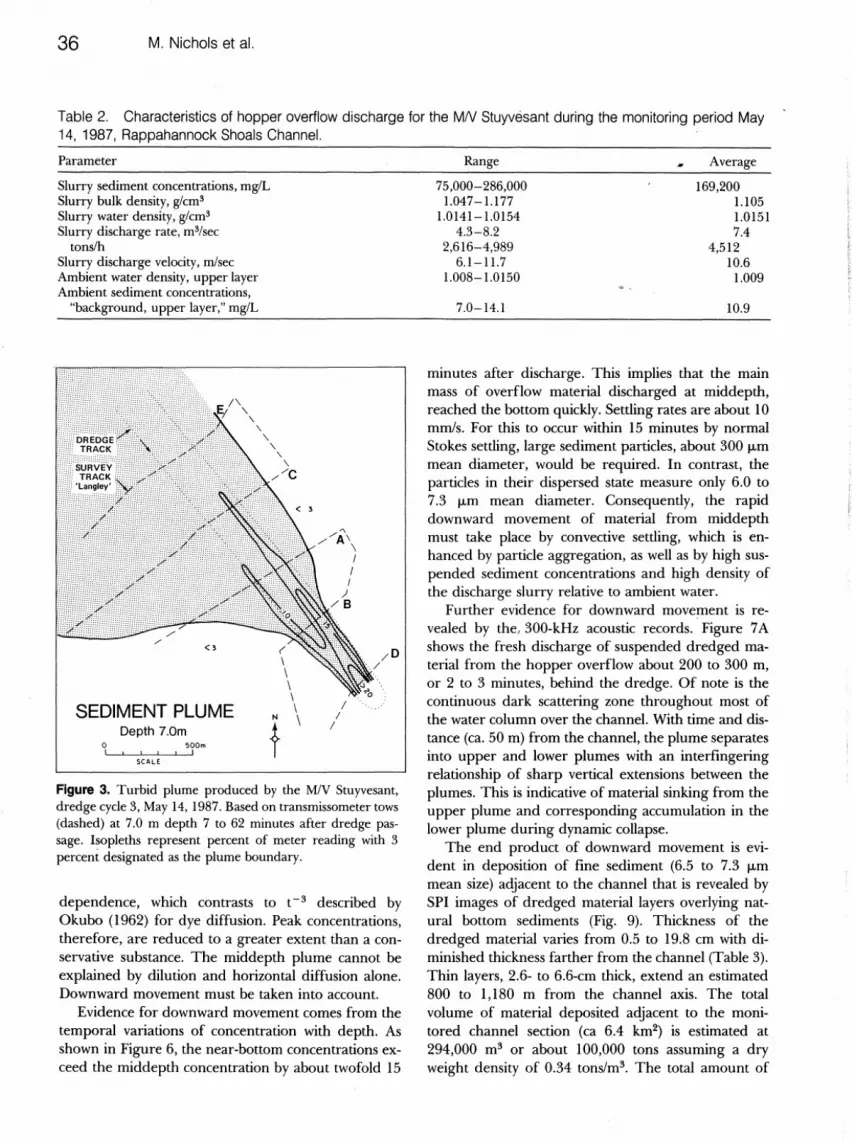
Figure 4. (A) Aerial view of the surface plume geometry extending from aft side overflow ports of the MN Stuyvesant. Wake (white) trails through axis of plume. (B) Aerial view "upstream" along axis of surface plume behind MN Stuyvesant.
material removed from the channel was about 845,000 tons with an estimated 0.90 tons/m3 dry weight density. Thus, the dredged material "lost" by overflow discharge or d;"aghead resuspension amounts to 12 percent of th~ total material removed.
The 300 kHz acoustic records also show the two di'mensional structure and thickness as the plume
Effects of Dredging 37
evolves with time. For example, 7 to 10 minutes after passage of the dredge (Fig. 7B) the lower plume dissipates while the upper plume tends to collapse vertically and bend over the channel shoulder in the direction of the ambient current. It leaves behind a "trail" of settling material over the dredge cut. Later phases of plume evolution are illustrated by two plumes 15 and 32 minutes after dredge passage (Fig. 7C)o' The young plume over the channel retains integrity and mainly spreads at depths of 2.5 to 5.0 m likely seeking a neutral buoyant zone above the pynocline. The old plume extends in the same depth zone more than 600 m from the channel shoulder. Of note are internal waves, a feature suggesting internal density instability as the plume spreads outward, thins and continues to collapse. At 29 and 52 minutes after dredge passage (Fig. 7E) the plumes display additional spreading and thinning. Wave structure of the old plume is partly broken by shear along the lower plume edge and sharp edges dissipate into ambient water. Theses features, and the widespread extent more than 2,400 m from the discharge point during ebb tidal current, suggest plume material is slowly mixed and diluted. This is a likely transition phase from dynamic collapse to long-term diffusion.
Benthic communities around the channel after dredging were dominated by polychaetes (67 percent of all individuals) and gastropods (17 percent). Nemerteans (5 percent), bivalves (4 percent), amphipods (2 percent), and oligochaetes (1 percent) were also abundant at one or more stations (see Nichols and Diaz 1987 for data). Cluster and ordination analysis of these data did not reveal clear relationships among stations or evidence of distribution patterns of resident species that could be related to the thickness of the dredged material layers deposited or distance form the channel. Rank correlation (Spearmans r) between total abundance and thickness of the dredged material layers at each station was also not significantly different than zero.
The 10 top dominant species (Table 4) were very similar to those found in the Rappahannock Shoals area by Diaz and others (1985) and typify macrobenthic communities for this region of the bay. None of these 10 species showed any consistent pattern, increasing or decreasing in abundance, with thickness of dredged material or distance from the channel. Similar lack of clear pattern was found for community structure parameters and dredged material thickness. Total wet weight biomass showed no pattern with depth of dredged material or distance from the channel. However, when the data were averaged by station, there was a trend for lower annelid biomass
38 M. Nichols et al.
1,000,000 c: = = --;../ OVERFLOW I -
100.000
~\ :: = ---
= c\ <!"> ~ = 'VAVERAGE 6 CYCLES
--
,- \ -"
;:: "K: CONCENTRATIONS ::
= CYCLE 3 = -I- -I-
...... '" t-----
...... r-f:: --- - '- :: - • f= ' , = -.--~ Background _ I- ---~~-I- - ----- --,
I I ---:-J
~ E Z 10.000 0 j:: <l: a: I-Z w (.) z
1,000 0 (.)
I-Z w :!E Ci w CI)
100 0 w 0 Z W Q" CI)
:::> CI)
800 1600 2400 3200 4000 4800 5600
DISTANCE FROM OVERFLOW PORT, m.
Figure 5. Dispersion curves for average peak suspended sediment concentrations at middepth (7.0 m) along plume axis over six dredge cycles and for one cycle, number 3.
t HOPPER OVERFLOW 800 177 ,000 mgtl
'i3, 600 E of
32 o (/) '0 400 OJ '0 c OJ Q. (J) :::J
(/) 200
Near-Bottom 16.5m
'Background •
Figure 6. Temporal variations of average suspended sediment concentration at three fixed points in the plume to 90 minutes after passage of the dredge.
+15 +30 +40 +60
Time After Dredge Passage
+ 75 t90mins
near the channel, but this trend was not statistically significant (Table 5).
SPI images showed that worms were burrowing in the dredged material layer and background sediments. Worms were seen at 14 of 24 stations with 3 stations having worms in the dredged material layer (Fig. 8). The entire sample grid appeared to be colonized by small tube building polychaetes, likely Para-
prionospio pinnata. Maldanid polychaete feeding voids and other burrow structures, similar to those seen in profile images taken during the predredging survey, were present indicating that subsurface dwelling fauna were still active.
Discussion
The authors' results bring the conceptual model
T !

,
c
o 1 I
2
• • 1 • 1
10 J I
" T
I. ,
0 I.
Table 3. Average thickness of dredged material layer with distance from the channel axis. Data from SPI imagery on three transects at 610-m intervals along Rappahannock Shoals channel.
Distance from Channel Axis, m
200 275 400 640
Average (ISD) Thickness, em Northeast Side
11.2 ± 3.5 13.2 ± 5.9 8.0 ± 1.0 6.7 ± 1.8
Average (ISD) Thickness, em Southwest Side
9,7 ± 1.3 7.6 ± 0.3 5.4 ± 1.1 2.6 ± 3.6
proposed by Clark and others (1971) and Koh-Chang (in Johnson 19'74) closer to reality. Although the model was developed for open ocean disposal, the data obtained substantiate the sequence of transport phases for dredged material overflow discharged into
Effects of Dredging 39
Figure 7. Acoustic records at 300 kHz frequency, May 14, 1987, Rappahannock Shoals. Depth and distance scale in meters, approximate. (A) Fresh discharge of dredged material about 3 minutes after dredge passage. This is a rapid sinking phase or convective descent (left) showing transition to upper and lower plumes represented by darktoned patches. Note sharp edges and interfingering as upper plume collapses. (B) A phase of dynamic collapse seven to ten minutes after dredge passage. Plume drifts to right in direction of ambient current. (C) A later phase of dynamic collapse, 15 to 32 minutes after dredge passage showing young plume (left) and old plume (right). Note internal waves. (D) A later phase of dynamic collapse, ca. 23 to 39 minutes after dredge passage showing young plume (left) and old plume (right) with distinct internal waves. (E) A likely transition phase between dynamic collapse and passive diffusion, 29 to 52 minutes after dredge passage showing spreading and thinning of the turbid layer at 2.5 to 5.0 m depths.
an estuary through a hopper pipe. Convective descent is indicated by initial growth of the dumped material cloud under conditions of high initial discharge velocity and great excess density of the discharge material that characterize a sinking jet. Additionally, the suspended load of the discharge decreases three orders of magnitude in less than three minutes, or within a zone about 300 m behind the dredge, with highest concentrations in bottom water. Acoustic records of the near-field zone reveal high back-scattering throughout most of the water column as a result of vertical motion (Fig. 7 A). Because concentrations are high and gradients steep with time and distance, greatest dispersion and deposition likely result from the convective descent phase.
Dynamic collapse is indicated by the exponential decrease of far-field suspended sediment concentrations at a distance of 300 to 4,000 m from the dis-

40 M. Nichols et al.
Table 4. Dominant benthic species around Rappahannock Shoals Channel, May 1987.
Average abundance/0.06 m2
Species
pa Paraprionospio pinnata G Cyclostremiscus pentagona P Psew1eurythoe paucibranchiata p Streblospio benedicti p Mediamastus ambiseta N Tubulanus pellucidus P Bhawania heteroseta G Anachis lafresnayi P N ephtys cf. cryptomma P Sigambra tentaculata
X SD
55.6 18.9 17.7 11.9 11.5 7.1 7.0 6.7 4.4 3.8
24.9 57.9 17.3 17.5 18.2 4.1 9.8 4.3 3.0 3.6
ap = polychaete, N = Nemertean, G = Gastropod.
Table 5. Average (±SD) wet weight biomass (g/0.06 m2) of benthos with distance from channel center line.
Distance from Total Channel Axis, m (N) community Polychaetes
200 4 3.1 :': 3.7 1.0 :': 0.7 275 4 5.2:': 4.6 2.2:': 0.6 400 4 3.5 :': l.l 2.5:': 0.6 640 4 3.9:': 2.3 2.1 :': 0.9
charge point (Fig. 5). The excess density of the plume water is less than 0.0013 g/cm3. Plume width increases markedly as horizontal spreading proceeds and the plume seeks neutral buoyancy. Internal waves displayed in the acoustic records, denote internal instability as the plume thins and collapses (Fig. 7C).
The authors' depth sampling intervals and instrumentation are insufficient to resolve precisely when the long-term passive dispersion phase begins; that is when the plume is affected more by ambient currents than by its own dynamics. Presumably, diffusive spreading exceeds dynamic spreading after the internal waves dissipate. A likely transition from dynamic collapse to passive diffusion is indicated in acoustic records by outward thinning and apparent upward drift of the residual plume layer in the upper quarter of the water column (Fig. 7E). Sharp edges of the plume dissipate into surrounding water by turbulent diffusion and the plume boundary extends downstream in the ebb current beyond 4,000 m from the dredge. Density gradients between plume and ambient water are negligible. Since particles remain in suspension longer than one hour, stokes settling of dispersed material is relatively slow, less than 0.0037 mm/s.
The dredging activity and discharge of dredge material into bay water constitutes an environmental per-
turbation. Its impact depends on the geographic extent, or "zone of influence," magnitude, and its frequency and duration. In the case studied, dredging removed about 0.6 km2 of the bay fld'br, dispersed suspended sediment through the' upper layer for more than 5.7 km2 and deposited a sediment layer covering 6.4 km2 of bay floor flanking the channel. Additionally, open water disposal covered about 10 km2 of the bay floor. The size of the perturbation is relatively small, less than 1 percent of the area of the central bay, and thus localized. However, the study site is also localized in a channel section 3.2 km long; or about 4 percent of the entire dredged channel in the bay between Baltimore and the sea, a length of 82 km. If 12 percent of the dredged material is released into suspension or deposited on channel flanks as found in the study site, then an estimated 2.0 to 5.0 million tons of sediment will be released into the environment throughout muddy reaches of the entire bay channel. This is equivalent to about 1 to 2.5 years of average sediment influx to the bay from the Susquehanna River.
Dredging produced suspended sediment concentrations having peak concentrations of 840 to 7,200 mg/L, values that exceed normal background concentrations 50- to 400-fold. However, they are of short duration, less than 3 minutes at a fixed point. During overflow discharge, a period of 40 to 60 minutes, concentrations average 81 mg/L in the upper water layer or about five times normal background. In nearbottom water they average 137 mg/L or eight times normal background throughout the entire dredge loading cycle, a period of 1.5 to 2.0 hours. These concentrations also exceed peak values reported after river flooding and storms, for example 55 mg/L at the Rappahannock River mouth during storm Agnes in 1972. And they exceed peak concentrations measured during spring tidal currents, for example 73 mg/L in the central bay bimonthly over three years. (Fig. 9). Hopper dredging enriched the water column with suspended sediment in the channel environs, 34 to 50 percent of the time during a dredging cycle. In this channel dredging proceeded four months and occurs once in 30 years. When compared to other types of dredging operations, the concentrations produced by hopper dredging exceed cutterhead and clamshell operations reported at other sites (Raymond 1984) by more than eight times (Fig. 9).
Although water quality standards of turbidity for recreation, aquatic life and shellfishing have not been established for Virginia, the limits in Maryland are set at 150 NTV or JTV units. Assuming one NTV or JTV unit is approximately equivalent to one sus-

Effects of Dredging 41
640m 262 a ..
275m 200m s
Figure 8. Sediment profile images form transect transverse to channel. Distance is in meters from channel axis. S is sediment water interface, notice worm tubes at 640 m; 0 is original or natural sediment water interface covered by dredged material; V is a biologically produced space in the sediment produced by deposit feeding polychaetes; W is a polychaete burrowing in the dredged material layer.
SUSPENDED SEDIMENT,mg/\ 10 100 1000 10000
Normol Bockgd. - I Extreme Bockgd.
i Hopper Ore dge overllow + dragheod
(this study) over I rw Clischcrg8
Culterhead or --Clamshell *
j operations
Figure 9. Comparison of suspended sediment concentrations range for different background conditions in central Chesapeake Bay and different types of dredging operation. Data from Raymond (1984).'
pended sediment concentration unit in mg/L, it is evident that hopper dredging exceeded the limits only in near-field zones, less than about 800 m behind the dredge, and mainly near the channel bottom less than 50 percent of tht! time.
Several factors may explain why macrobenthic assemblages in the vicinity of the channel were not obviously affected by deposition of dredged material: (1)
the dredged material was not contaminated by anthropogenic pollutants; (2) the grain size of the material was the same as natural background sediments; (3) the rate of deposition of new material on channel flanks was low, occurring over a period of several months; (4) the species characterizing this, and other similar areas of the bay are generally short-lived, exhibit flexible life history strategies and have relatively high motilities which enabled them to cope with the rate at which new sediment was supplied (Schaffner and others 1987a, b). The tolerance of fish and benthic invertebrates at the dredging site to the levels of suspended sediment concentrations observed through time generally exceeds that determined from laboratory experiments (Peddicord and others 1975; Sherk and others 1974). The authors' results for this naturally muddy area, which is characterized by a typically resilient estuarine infaunal assemblage, are in agreement with those of Stern and Stickler (1978) indicating that the ecological effects of suspended sediment and turbidity in the water column produced by dredging operations were

42 M. Nichols et al.
minimal and transient. Dredging operations did not cause irreversible ecological impacts, although they may have created aesthetically objectionable conditions.
Acknowledgments·
Monitoring observations were possible through close cooperation of Captain Richard Cutchin, Cory Van der Linder, and R. W. Champagne of the MIV Stuyvesant. Dr. John Brubaker provided acoustic expertise; Robert Gammisch supervised the field operations; George Thomas managed the data compilations. Figures were drafted by Kay Stubblefield and reproductions were done by William Jenkins. Jeff McKee, Robert Havis, and Robert Blama of the Corps·ofEngineers provided liaison. The study was accomplished under contract DACW-31-87-C-0024 from the Baltimore District, Corps of Engineers to the Virginia Institute of Marine Science. This is VIMS contribution no. 1557.
References Cited
American Public Health Association, 1981, Standard methods: 134 p.
Biggs, R. B., 1968, Environmental effects of overboard spoil disposal: Journal of the Sanitary Engineering Div., v. 94 p. 477-487.
Brandsma, M. B., and D.J. Divoky, 1976, Development of models for prediction of short-term fate of dredged material discharged in the estuarine environment: U.S. Army Corps of Engineers, Waterways Experiment Station, Contract Rept. D-76-5, 133 p.
Burks, S. A., and R. M. Engler, 1978, Water quality impacts of aquatic dredged material disposal: U.S. Army Waterways Experiment Station Environmental Laboratory. Tech. Rept. DS-78-4.
Clark, B. D., W. F. Rittall, D.J. Baumgartner, and .K. V. Byram, 1971, The barged ocean disposal of wastes, a review of current practice and methods of evaluation: Environmental Protection Agency, Pacific Northwest Water Laboratory. 120 p.
Cronin, L. E., R. B. Biggs, D. A. Flemer, G. T. Pfitzmeyer, F. Goodwin, Jr., W. L. Dovel, and D. E. Richie, Jr., 1970, Gross physical and biological effects of overboard spoil disposal in Upper Chesapeake Bay: Natural Resources Institute Special Report No.3, Chesapeake Biological Laboratory, University of Maryland. 66 p.
Cronin, W. B., M. G. Gross, W. R. Taylor, R. C. Whaley, W. C. Boicourt, and J. R. Schubel, 1976, Investigations of dredging operations, Brewerton Channel cut-off angle, Patapsco River mouth disposal site, 10 April 1976-26 May 1976: Chesapeake Bay Institute, The Johns Hopkins University, Final report to the State of Maryland and the U.S. Army Corps of Engineers, Baltimore District. 50 p.
Diaz, RJ., and D. F. Boesch, 1977, Impact of fluid mud
dredged material on benthic commumOes of the tidal James River, Virginia: U.S. Army Corps of Engineers, Waterways Experiment Station. Tech. Rept. D-78-21, 118 p.
Diaz, R. J., L. C. Schaffner, R. J. Byrne, and ~ A. Gammisch, 1985, Baltimore Harbor and channels aquatic benthos investigations: Final Rept. to Baltimore Dist., U.S. Army Corps of Engineers, Baltimore, MD. 255 p.
Gross, M. G., W. R. Taylor, R. C. Whaley, E. O. Hartwig, and W. B. Cronin, 1976, Environmental effects of dredging and dredged material disposal, approaches to Chesapeake and Delaware Canal, northern Chesapeake Bay: CheS4-peake Bay Institute unpublished report to Maryland Department of Natural Resources. 86 p.
Gross, M. G., and W. B. Cronin, 1979, Dredging and Disposal in Chesapeake Bay, 1975-2025. In H. D. Palmer, and M. G. Gross, eds., Ocean Dumping and Marine Pollution: Dowden, Hutchinson & Ross, Inc., Stroudsburg, Pennsylvania, p. 131-145.
Hampton Roads Maritime Association, 1985, The port of greater Hampton Roads, Annual, 1985.259 p.
Harrison, W., M. P. Lynch, and A. G. Altschaefel, 1964, Sediments of Lower Chesapeake Bay with emphasis on mass properties. J. Sed. Petrol. v. 34, p. 727-755.
Johnson, B. H., 1974, Investigation of mathematical models for the physical fate prediction of dredged material: U.S. Army Engineer, Waterways Experiment Station, Tech. Rept. D-74-1.
Johnson, R. E., G. F. Oertel, and G. T. F. Wong, 1980, Water quality monitoring of the deepening of the Southern Branch of the Elizabeth River, Chesapeake, Virginia: Old Dominion University Tech. Rept. 42, 102 p.
Kuo, A. Y., C. S., Welch, and R.J. Lukens, 1985, Dredge induced turbidity plume model: Journal of Waterway, Port, Coastal and Ocean Engineering, v. Ill, no. 3, p. 476-494.
Nichols, M., 1982, Metal inventory and fate of suspended sediment in Chesapeake Bay. VA Institute of Marine Science, Special Scientific Rept. 106, 97 p.
Nichols, M., 1983, What are the best guidelines for dredging and placement of dredged material? In Cronin, ed., Ten Critical Questions for Chesapeake Bay in Research and Related Matters: Chesapeake Research Consortium Pub. 113, p. 50-62.
Nichols, M., 1986, Man's physical effects on the Elizabeth River: A Case Study: Proc. Chesapeake Bay Research Conference, Williamsburg, VA, p. 166-178.
Nichols, M. R., R. Faas, and G. Thompson, 1978, Fluid mud dredged material: its physical nature and dispersal: U.S. Army Engineer, Waterways Experiment Station, Tech. Rept. D-78-40, 84 p.
Nichols, M., and R. Diaz, 1987, Plume monitoring of Rappahannock and York Spit channels, Baltimore Harbor and channels (Phase 1): Contr. Rept. to the U.S. Army Corps of Engineers, Baltimore District. 39 p.
Nichols, M., and R. Diaz, 1989, Plume monitoring of Rappahannock and York Spit channels, Baltimore Harbor and channels (Phase II). York Spit Channel: Contr. Rept. to the U.S. Army Corps of Engineers, Baltimore District, 33 p.
Okubo, A., 1962, A review of theoretical models for turbu-
lent diffusion in the sea: Journal Oceanographical Soc. of Japan. 20th Anniversary volume, p. 286-320.
Peddicord, R. K., V. A. McFarland, D. P. Belfiori, and T. E. Byrd, 1975, Effects of Suspended Solids on San Francisco Bay Organisms: Report to U.S. Army Engineer District, San Francisco, Dredge Disposal Study, Appendix G.
Priest, W. 1., 1981, A study of dredging effects in Hampton Roads, V A: Special Rept. in Applied Marine Science and Ocean Engineering No. 247, 266 p.
Raymond, G. L., 1984, Techniques to reduce the sediment resuspension caused by dredging: U.S. Army Engineer, Waterways Experiment Station, Miscell. Paper HL-84-3, 33 p.
Schaffner, L. C., R. J. Diaz, C. R. Olsen, and 1. L. Larsen, 1987a, Faunal characteristics and sediment accumulation processes in the James River estuary, Virginia: Estuar. Coast. Shelf Sci., v. 25, p. 211-226.
Schaffner, L. C., R.J. Diaz, and R.J. Byrne, 1987b, Processes affecting recent estuarine stratigraphy. In Coastal Sediments 87, WW Div.lAmerican Society of Civil Engineers, New Orleans, LA, May 12-14, 1987, p. 584-599.
Schubel,J., and W. M. Wise, 1979, Questions about dredging and dredged material disposal in the Chesapeake Bay: Marine Sciences Research Center, State University of New York, Special Rept. 20, 143 p.
Sherk, J. A., J. M. O'Connor, D. A. Newmano, R. D. Prince, and K. V. Wood, 1974, Effects of Suspended and Deposited Sediments on Estuarine Organisms, Phase II: Final Report, U.S. Army Corps of Engineers Contract No.
Effects of Dredging 43
DACW72-71-C-OD03. University of Maryland, Natural Resources Institute, Ref. No. 74-20.
State of Maryland, Water Resources Administration, 1976, Monitoring of Open Water dredged Material Disposal Operations at Kent Island Disposal Site and Survey of Associated Environmental Impacts: A report prepared for the Maryland Port Administration and the Maryland Department of Natural Resources. 119 p.
Stern, E. M., and W. B. Stickler, 1978, Effects of turbidity and suspended material in aquatic environments. Literature review: U.S. Army Corps of Engineers, Waterways Experiment Station. Tech. Rept. D-78-21. 118 p.
Sustar, J. F., T. H. Wakeman, and R. M. Ecker, 1976, Sediment-water interaction during dredging operations: Proc. Specialty Confr., Dredging and its Environmental Effects. Am. Soc. Civil Engr. p. 736-767.
U.S. Army Corps of Engineers, 1981, Baltimore Harbor and channels, Maryland and Virginia: Main Report and Environmental Statement, various pagination.
U.S. Environmental Protection Agency, 1983, Chesapeake Bay; a profile of environmental change. Washington D.C.
Virginia Institute of Marine Science, 1967, A study of the effects of dredging and dredge spoil disposal on the marine environment: Special Scientific Rept. in Applied Marine Science and Ocean Engineering, no. 8., 56 p.
Virginia Institute of Marine Science, 1972, Study of channel sediments Baltimore Harbor, Norfolk Harbor, York Entrance Channel: Contr. Rept. to the U.S. Army Corps of Engineers. 102 p.